Embed Size (px)
Citation preview

1
1
Paper Presented for 5th Annual Public Finance Consortium— “Politics and Administration in
Public Finance”
School of Public and Environmental Affairs
Indiana University, Bloomington
Do Top Business Leaders Make Good Governors?
A Regression Discontinuity Design
Can Chen, PhD
Associate Professor
Andrew Young School of Policy Studies
Georgia State University
Boyuan Zhao
PhD Candidate
Department of Public Policy and Administration
Florida International University
Please do not cite this paper without the authors’ permission.

2
2
INTRODUCTION
Recently, a growing number of politicians with prominent business backgrounds are
joining the battlefield of politics, running for key positions in offices. Donald Trump is the
most recent example of a U.S. president who has constructed his own successful business
empire before his political life. At state level, successful business figures have turned into
politics and won governorship in different states. For example, Rick Scott, the 45th governor
of Florida, was the owner of Hospital Corporation of America and a venture capitalist, and
Kevin Stitt, current governor of Oklahoma, was the founder, chairman and CEO of Gateway
Mortgage Group. These candidates have successful executive experience as business leaders,
while many of them have little or no experience in public offices prior to their governor
tenure. Their professional career path distinctively contrasts with “conventional” career
politicians who typically hold law degrees, start their career from legal affair positions, and
climb up the political ladder gradually.
State governors are key actors in the budgeting process of the states. Governors are
responsible for budget development and recommendation, in which promote their policy
preference. Besides, they have line-item veto power on the state budget. In many states, state
budget offices, which implements and oversees state government funds, directly reports to the
state governor. Other state budget offices are also impacted by gubernatorial leadership and
power, although they may be placed under other departments of the state (Thurmaier and
Willoughby 2001).
This article fills the literature gap by answering the question of whether a state governor

3
3
with prominent business experience (defined as “CEO governors” by Neumeier (2018))
causes the discrepancy of fiscal performance across the states. Since many unseen factors,
such as political context of the state, could simultaneously impact the voters’ preference of
candidate and the policy preference of the elected officials, endogeneity is an issue to the
research. To provide robust causal evidence, a regression discontinuity (RD) design approach
has been implemented, using the data of state governor elections and state fiscal reports of 50
U.S. states of years from 1960 to 2010. The major finding of this article is that a governor
with CEO experience causes worse fiscal performance of the state government, by having
lower real total surplus, lower real general surplus, and lower operating ratio.
This research contributes to the current literature of both public administration and public
finance. This study sheds lights on the leadership literature by providing evidence that the
private sector experience of individual public officials could impact organizational
performance, at least in the U.S. context. This research also contributes to the public finance
literature that personal characteristic of elected officials plays an important role in the
government financial performance at the state level.
The article is organized in the following structure. First, previous discussions on the
public officials’ business experience and governmental performance are reviewed. Second,
major theories that supports the positive and the negative influence of public officials’
business experience on fiscal performance are both introduced, and hypotheses are developed
based on them. Third, data and statistic methods are described, including how the major
independent variable of the research - the indicator of being a “CEO governor” is constructed.

4
4
Besides, the empirical method of regression discontinuity design is also introduced. The
fourth part of the article reports statistical results and findings. Last, major discussion,
conclusion, and future research recommendations are provided in the final section.
LITERATURE REVIEW
Empirical studies have analyzed the private sector experience of public leaders and its
influences on economic, fiscal, and public service aspects of governmental activities. Overall,
previous studies conclude that the business experience of public leaders is associated with
fiscal performance (e.g., Avellaneda 2012; Whalley 2013; Jochimsen and Thomasius 2013),
regional economic performance (e.g., Neumeier 2018; Szakonyi 2018), and the performance
of public service provision at various levels of government (e.g., Avellaneda 2016; Olvera
and Avellaneda 2019).
Fiscal Impact of Public Officials’ Business Experience
Empirical results have demonstrated that the business experiences of both the elected officials
and the appointed public managers are associated with governmental financial performance.
Using the election data and the financial performance data of 475 California cities for fiscal
years 1992-2008, Whalley (2013) explores the causal impact of appointed city treasures on
municipal financial performance. Comparing to the elected officials, the appointed city
treasurers typically have abundant business management experience. By conducting a
regression discontinuity design (RDD), Whalley finds that switching from elected treasurers
to appointed treasurers could improve city fiscal performance by saving their borrowing costs
for up to 31%. Using panel data for 22 OECD countries from 1970 to 2004, Mikosch and

5
5
Somogyi (2009) explore the association between occupational backgrounds of country
leaders and national budget deficit. They find that country government deficit is lower during
the incumbency of politicians with private sector management experience. Avellaneda (2012)
explores the relationship between Colombian mayors’ personal attributes and municipal
revenue generation capacity. By analyzing the data from Colombian municipalities from 1999
to 2005, the author finds that mayors with private sector experiences could expand municipal
revenue size by attracting more state and national grants to their cities. Jochimsen and
Thomasius (2013) explore the association between finance ministers’ professional
experiences and budget performance. By analyzing the data of German states from 1960 to
2009, they find that states tend to have a lower budget deficit when their finance ministers
have a business sector working experience, especially for the corporate finance industry.
However, a few studies find the business experience does not have a significant effect on the
financial performance of governments. For instance, Beach and Jones (2016) explore the
impact of the city council members’ business experiences on municipal economic and fiscal
performances. By conducting a RDD on the data of California city governments during the
fiscal year 2001-2011, they find that the presence of city council members with prominent
business experiences does not have a causal impact on city expenditures, revenues, and
economic performance. Elected officials with prominent business experiences also show
differential preferences on public spending categories. Using data of over 33,000 Russian
mayors and legislators from 2007 to 2016, Szakonyi (2020) finds that politicians with
prominent business experiences prefer expenditures that have immediate economic returns
and direct benefits to business corporations (e.g., road and transportation) rather than

6
6
expenditures on social programs (public health and education).
Economic Impact of Public Officials’ Business Experience
The business experience of politicians is also discovered to be related to the economic
outcomes of regions and countries. Gohlmann and Vaubel (2007) analyze the association
between the professional backgrounds of central bankers and the countries’ inflation levels
using the data of 391 central banker council members of European countries from 1973 to
1998. They argue that council members’ experience in private banking, private business, and
central banks are negatively associated with national inflation rates. Dreher et al. (2009)
analyze the association between the professional backgrounds of country political leaders and
market-liberalization reforms using panel data from 72 countries from 1970 to 2002. They
find that market-liberalization reforms, including reducing government size, increasing
access to sound money, and loosening regulation, are more likely to occur during the
incumbency of national leaders who are former entrepreneurs. Neumeier (2018) analyzes the
relationship between U.S. governors’ businessman background and state economic
development performance. Using panel data of 50 states from 1960 to 2011, Neumeier
conducts a quasi-experiment analysis (entropy balancing) and finds that the presence of a
state governor who has a prominent business experience could promote state economic
performance by increasing state income growth rates, increasing state private stock growth
rates, and lowering state unemployment rates. Szakonyi (2018) analyzes data of 2,703 firms
and over 12,000 sub-national politicians in Russia during 2004-2013 using an RDD. He finds
that having business leaders holding political offices causes an improvement in total revenues
7
7
and net profits of the firms that they have connections with.
The Government Performance Effects of Public Officials’ Business Experience
A growing number of empirical studies examine the effect of public leaders’ business
experience on the performance of public service delivery. Gilmour and Lewis (2006)
compare the performance scores of 234 federal programs in the fiscal year 2004 and find that
the programs managed by political appointees, who have more working experiences in the
private sector, have systematic lower performance scores in program management, strategic
planning, and program outcomes than those managed by career executives promoted from the
civil service systems.
For the non-U.S. contexts, Avellaneda (2016) explores the relationship between
Salvadorian government chiefs’ personal attributes and municipal performance using survey
and archival data from 135 mayors. The results indicate that a mayor’s private sector
experience is not correlated with municipal utility service delivery performance and revenue
generation performance. Instead, mayors’ public sector expertise, public service motivations,
and networking behaviors are the major predictors of public service performance. Jacqmin
and Lefebvre (2016) analyze the data of professional experience of higher education
ministers in 20 European countries from 2003 to 2010. They find that the private sector
experience of a national education minister leads to a higher average academic ranking of the
universities in that country. Recently, Olvera and Avellaneda (2019) find that the private
sector experiences of state governors in Mexico have mixed effects on state government
performance. By analyzing data of 32 Mexican states over 16 years, they discover that a

8
8
governor’s private sector experience is associated with a higher level of local public health
provision but with a lower level of elementary education performance.
Research Gap
Although abundant research has illustrated the relationship between public officials’ private
sector experiences and government performance, several gaps exist. First, there are no studies
that investigate the impact of public officials’ private sector experiences on government
financial performance at the state level or equivalent. Second, A couple of empirical studies
have examined the various effects of public officials’ private sector experience on
government economic, financial, and public service outcomes. Yet very few studies focus on
the top business leadership experience (presidents, vice presidents, CEOs). Third, it is
important to note that many previous empirical studies failed to address the endogeneity
problem of the election of public officials. Their empirical findings do not provide a
convincing causal evidence about the impact of public officials’ private sector experiences.
To fill these above gaps, this research employs a rigorous quasi-experimental research design
and attempts to explore the potential causal impact by American governors’ top business
leadership experiences on state government fiscal performance.
9
9
THEORETICAL BACKGROUND AND HYPOTHESES DEVELOPMENT
Theoretical Foundations: Upper Echelons Theory and Sector Imprinting Theory
Upper Echelons Theory
Upper echelons theory, proposed by Hambrick and Mason (1984), provides a theoretical
framework on how personal characteristics of leaders impact organizational outcomes and
how one could operationalize and measure leaders’ personal characteristics. Upper echelons
theory contends that the behaviors of chief executives are partly the consequences of personal
attributes. The theory assumes that people act under bounded rationality with cognitive
choices restrained by their personal backgrounds. Hence, the organizational outcome reflects
part of the personal values and cognitive basis of the powerful actors in the organization
(Hambrick and Finkelstein 1987). The two core parts of the theory are that (1) chief
executives act based on their personalized interpretations of the strategic situation, and (2)
these personalized interpretations are impacted by the executives’ experiences, values, and
personalities (Hambrick and Finkelstein 1987; Hambrick 2007). The first half of the theory
contends that top executives’ values, experiences, and personalities affect their information
filtering and distortion, through impacting their vision, perception, and interpretation of
messages. Through this process, the strategy and performance of the organization are
impacted by the personal background of the leaders (Hambrick and Mason, 1984; Hambrick,
2007). The second half of the theory explains how to measure personal backgrounds.
Contrary to using indexes (for example, Meier and O’Toole (2002) using salary level to
estimate the quality of public managers), upper echelons theory proposes using personal

10
10
characteristics to represent managers’ quality and individual differences. These characteristics
are age, career experiences, education, socioeconomic roots (gender, race, class, family
backgrounds, etc.), functional track, financial positions (stock ownership in the company),
and the degree of homogeneity of top leadership teams (Hambrick and Mason 1984). These
factors represent the differences in values, personalities, and expertise of leaders. For private
organizations, the strategic actions of a firm are the function of CEO characteristics,
including age, tenure, formal education, and prior career experience. These factors could be
further related to the performance of firms through impacting strategic choices, integrated
values, and social behaviors (e.g., Wang et al. 2016; Talke et al. 2010; Boone and Hendricks
2009; Chin et al. 2013).
For public leaders, their personal characteristics are also associated with organizational
performances and strategies. Professional experience is crucial to the success of public
leaders and organizations. Government agencies with leaders who have longer experience in
public agencies have demonstrated better fiscal and public service performance (Avellaneda
2012; Petrovsky and Avellaneda 2014; Olvera and Avellaneda 2019). Having more public
sector experiences brings public officials the necessary skills, political networks, and social
capital. All of these bring prosperity to organizations. Besides professional experience,
leaders’ age, gender, and education are found to influence various strategic actions of
government and organizational well-beings, including policy orientations (e.g., Wilkins 2007;
Avellaneda 2009; Meier and Funk 2017; Feeney and Camarena 2019), innovative and
collaborative behaviors (e.g., Damanpour and Schneider, 2009; Esteve et al. 2012),
risk-taking behaviors (e.g., Suzuki and Avellaneda 2018; Anessi-Pessina and Sicilia 2020)

11
11
and governmental performance in education (Meier et al. 2006; Avellaneda 2008), public
finance (e.g., Avellaneda 2009; 2016; Opstrup and Villadsen 2014), and municipal service
provision (e.g., Avellaneda 2016).
Sector imprinting theory
Upper echelons theory provides a theoretical framework of explaining the relationship
between leaders’ personal characteristics and organizational outcomes. However, by itself, it
is weak in illustrating the mechanisms of how personal characteristics taken into effect. As
Hambrick (2007) suggests, both the personal characteristics and the decision-making results
are visible and measurable, but the psychological and social process of how these
characteristics affect individual choices is vague and cryptic. In the research of private sector
management, imprinting theory provides an alternative to explaining how previous
experiences impact individual decision-making. The term “imprinting” originates from
biology (Immelmann 1975) and is later borrowed by business management scholars to
describe the specific heritage that an organization left for itself in its life cycle. It is further
developed to describe a process of how an organization, or an individual is impacted by the
environment it was in, and how these impacts sustain effective in its future behaviors
(Marquis and Tilcsik 2013). Imprinting appears at the individual level as the impact of how
mentors, peers, and previous experience in the crucial time of the career leave residuals to
individuals and guide their later behavior. The imprinting effect accompanies the individuals
during the whole professional career (e.g., McEvily et al. 2012). Imprinting could be received
from individuals, teams, organizations, and the environment. Imprinting affects the

12
12
individuals and organizations by impacting their strategy selection, vision articulation,
congenial learning, and capability building (Simsek et al. 2015).
The imprinting effect exists across different sectors. Public managers who have
prominent private experiences tend to inherit their preferences and strategies from their
private sector experiences (Boardman et al. 2010; Chen 2012). Unique to learning behavior
which is coherent and self-selective, imprinting occurs unconsciously in the “sensitive period”
(e.g. the founding period, the early stage of development, early career, or major success and
failure) of the life cycle, and impacts individuals’ behavior in the future career persistently
and unconsciously (Marquis and Tilcsik 2013). On one hand, success and failure in the
business world are the most important lessons that one has learned being a politician with
prominent business careers. These previous experiences are inherently rooted in their minds,
and influence their decision-making in public offices, both intentionally and unintentionally.
On the other hand, private sector experience constructs businessman politicians’ unique
perceptions on government affairs and the government itself (Chen 2012). Public agencies
have fundamental differences from private organizations in their environments, such as
political context, goal ambiguity, and legal constraints (Rainey and Bozeman 2000; Boyne
2002). The sector difference of professional experiences could therefore cause diverse
imprinting impacts to politicians with and without a business career. For example, the
perceptions of “what is a good government” or “what means better performance for
governments” may be different for politicians with or without business experience. Hence,
businessmen’s leadership activities may contrast with traditional politicians or career civil
servants, who have already developed their mindsets in public organizations (Chen 2012).

13
13
Hypothesis Development: Inferences on the Effect of Businessman Governors on State
Fiscal Performance
The differences in public and private sectors form and shape different characteristics of
career businesspeople and pure “career politicians”. Their differences in policy preferences,
political orientations, and management capacities emerge as the difference in policy
outcomes when they are incumbent as governors. While the impact of the businessman
governors on government fiscal performance is still not explicit, two distinct propositions are
formed following the existing literature.
The Case for CEO governors’ positive impact on state fiscal performance
First, CEO governors have a strong fiscal policy competence due to their extensive
private sector financial management knowledge and skills. Governments have been under the
pressure of pursuing efficiency and operate like business. In such case, experience from the
private sector is a necessity to advancing the performance of governments (Box 1999). In
similar political contexts, it could be expected that leaders’ expertise in financial management
is crucial to the fiscal performance of the government. Sector imprinting theory suggests that
public managers could utilize their skills and expertise from private sector when conducting
public sector jobs (Boardman et al. 2010). Governors with prominent business experience
may have better capacities and skills in financial management, since they have more exposure
to financial management of private sector. For example, Whalley (2013) finds that cities in
California who have appointed treasurers have lower cost of borrowing comparing with those
who have elected treasurers. In this example, expertise is the top priority in the selection of

14
14
appointed treasurer. Many modern financial management and financing tools, such as
performance budgeting, program budgeting debt issuing, contracting out, and
public-private-partnerships, which demands adequate financing knowledge of decision
makers, are originated from the private sector. Prominent business experience offers
businessman governors abundant knowledge and competence in monitoring state fiscal
performance. Their extensive private business experience may contribute to their better
competence in maintaining program efficiency, managing state financial resources, and
balancing budgets under budget constraints.
Second, CEO governors have a strong policy preference for enhancing government
efficiency and fiscal discipline. CEO governors may have stronger support of efficiency and
fiscal discipline of state government expenditures. The organizational incentive and
organizational context are fundamentally different between public and private organizations.
In the U.S. context, public organizations are publicly owned and financed, and regulated and
supervised by legislative entities (Rainey 1983). Providing public goods and services is the
main objective of public organizations. The effectiveness of government activities is often
evaluated by public interests instead of financial performance (Rainey et al. 1976). Even
though fiscal discipline has recently started to be recognized as one of the top priorities of
governments, it is still not the single goal of government activities. Comparatively, the
ultimate goal of private organizations is to gain economic returns and to thrive. Private sector
managers are sensitive to fiscal irresponsibility because such behavior could threaten the
survival of for-profit organizations. The contradictory values in the management context may
contribute to the CEO governors’ stronger preference of eliminating wastes and narrowing

15
15
budget deficits. The profit-orienting experience reinforces CEO governors’ perception of
efficiency, while such experience is rarely seen on politicians with minimal business
experience, who fostered their career in public and law sectors for the most part.
Third, CEO governors differ from career politicians not only regarding their policy
preferences for promoting efficiency and fiscal discipline, but also in their willingness to
implement initiatives and reforms to improve the fiscal stances of governments. CEO
governors are less sensitive to the political resistance to budget cuts. Ideally, the politicians’
policy positions are simply the reflections of voters’ preference and partisan ideology rather
than politicians’ personal preference. Elected officials would comply with partisan ideology
after they get elected (Downs 1957). This is often true when the elected official is originated
from traditional party elites (Dalton 1985; Galasso and Nannicini 2011). When the governors
are deeply rooted in the party, they are likely to stick with policy preferences that align to the
fundamental ideology of the party. When legislators oppose the standpoint of governors in
budgeting, traditional governors are less resistant to such political pressure. Comparatively,
businesspeople candidates, especially those without political experiences, are “strangers” in
front of party elites. They may refuse to comply with party elites or fundamental ideology of
the party and tend to execute their own plan. For example, Witko and Friedman (2008) find
that House members with some business backgrounds, especially those who have recently
transferred their career from business to politics, vote significantly different from traditional
career politicians without any business background. In the case of state budgeting, while state
legislators back up expenditures that benefits their own voters, businessman candidates are
less willing to compromise with those party elites, if those legislators are against budget cut

16
16
initiatives.
Based on the above discussions on the relationship between the governors’ business
experience and state fiscal performance, hypothesis 1 is made here:
• Hypothesis 1: All else being equal, governors’ previous top business leadership
experience has a positive effect on state fiscal performance.
The Case for CEO Governors’ Negative Impact on State Fiscal Performance
Public Choice Theory
The proposition that CEO governors may deteriorate state fiscal performance is based on two
arguments. The first argument is developed from the public choice theory. The public choice
theory argues that the major incentive of people making decisions is maximizing self-interest,
regardless of whether they nominally serve the public interest or not (Buchanan and Tullock
1962). First, governors with prominent background may appropriate public interests to
reimburse personal business returns. Politicians run for political offices when they perceive
what they could gain from the position exceeds their pay out (Osborne and Slivinski 1996).
Businesspeople have to invest overwhelming time and money to compete with career
politicians, who are in advantage of political skills and resources. Simultaneously,
businessmen need simultaneously keep their business career alive while campaigning and
being incumbent. An additional legislation career dilutes their time and resources from their
business world. Hence, participating election creates larger opportunity cost for businessman
candidates than career politicians (Fiorina 1994). Enhancing their own business earnings

17
17
could be an additional incentive for businessmen running for offices (Szakonyi 2018).
Second, governors with business background may manipulate public resource to
benefit special business interest groups or relevant private industries. Government regulations
impose additional cost to business transactions, which causes rent-seeking behaviors
(Krueger 1974). Businesspeople could influence policymaking towards their preferences by
either directly running for office or indirectly lobbying and financing other candidates. For
businessman politicians, running for office is worthwhile when the payoff level of running
for office is higher than the payoff level of indirectly influencing politics. In some transitional
countries, businessmen run for legislative positions more frequently when institutional
constraints are weaker, so that they have larger discretion of manipulating policy position to
extend business interests (Li et al. 2006; Gehlbach et al. 2010). Businessman may treat
running for office as a non-market strategy of improving profits of their associated industries,
because it may be a less costly alternative of rent seeking. By exerting political power,
businessman politicians’ associated industries could obtain better reputation, more loans from
bank, and more procurement from the government (Szakonyi 2018). Meanwhile, the
strategies that benefit the certain industry, like providing tax incentives to or loosen
regulation on their own industry may reduce the efficiency of government operation but
could hardly be discovered by average voters.
Publicness fit theory
The second argument proposing the negative impact of governors’ business experience
derives from the publicness fit theory. As the major executive leader of state governments, a

18
18
governor who has spent most of his or her career in private business is an “outsider”
comparing with a life-long professional politician. An “outsider” leader is a chief executive
who “brings a different leadership style, knowledge, skills, and perspective to a firm based on
his or her previous experience in other firms and industries” (Karaevli 2007). For executives
from outside organizations or industries, their cognitive frame and professional experience
are alien to the new position comparing with those from the same organization (Bailey and
Helfat 2003). While insiders are portrayed as being better fit to the organization, outsiders’
degree of fit varies across identities and may cause unprecedented influence on organizational
performance (Kesner and Sebora 1994).
The publicness fit theory argues that due to the uniqueness of public organizations (or in
other words, “publicness”), the managerial experiences of managers have different degrees of
matching with the features of public organizations. Private managers with skills and expertise
solely in private sector management may not be able to handle well the unique organizational
context of public organizations, such as public ownership, public funding or political control
on public organizations (Petrovsky et al. 2014). In private organizations, outsider chief
executives who have a poor “fit” of their expertise with their organizational context may
deteriorate organizational performance (Karaevli 2007). Similarly, new incoming public
managers who lack public experience in their expertises may also produce disruption to the
organizational performance (Petrovsky et al. 2014). “CEO Governors”, especially who
recently turned into political careers, may be deficient in necessary skills and knowledge of
managing governmental activities and maintaining political network. This could lead to poor
fiscal performance of governments.
19
19
Based on the above discussion, the second hypothesis on the impact of governors’
business leadership experience is made:
• Hypothesis 2: All else being equal, governors’ previous top business leadership
experience as CEO positively has a negative impact effect on state fiscal
performance.
RESEARCH DESIGN AND METHDOLOGY
Regression Discontinuity Design (RD)
The major empirical approach of this article is a regression discontinuity (RD) design. To
illustrate causal inference between the key independent variable and the dependent variable.
Among all the state gubernatorial elections within the period, the result of the final stage of
general election is the research focus. This research focuses on general elections in which one
candidate has business experience and the other does not. In other words, I focus on the cases
that the winner is a “businessman candidate” and the runner-up is not, or the runner-up is a
“businessman candidate” and the winner is not. If there are multiple candidates in the final
stage of the general election, only the candidates who are on the first and second position in
the final poll are studied. Then, the margin of percentage of popular vote between the
businessman candidate and the non-businessman candidate is calculated by the voting
percentage of businessman candidate subtracted by that of non-businessman candidate.
Obviously, if the businessman candidate wins the election, the value of this margin would be

20
20
positive. Otherwise, it would be negative. In those elections with extremely close results, it
could be argued that the final victory of the winning candidate is due to some randomness
rather than other homogeneous driven factor. In that case, the assignment of businessman
candidate as governor is random in the contests between businessman and non-businessman.
Thus, it could be possible to infer the causal relationship between governors’ businessman
experience and fiscal outcomes.
The estimation of the relationship between governors’ business experience and fiscal
outcome is based on the following equation:
The variable “𝐶𝐸𝑂𝐶𝑎𝑛𝑑𝑖𝑑𝑎𝑡𝑒𝑊𝑖𝑛𝑖𝑡 ” is the treatment variable. It takes value one if a
businessperson candidate won the gubernatorial election at state i and year t. Only governors
who are in office more than half of the year are counted as the governor of the specific year.
Besides, acting governors who succeeded the position due to the sudden resignation of
previous governors are not counted, since they do not have election opponent when they
swung in. The assignment variable “𝐶𝐸𝑂𝐶𝑎𝑛𝑑𝑖𝑑𝑎𝑡𝑒. 𝑉𝑜𝑡𝑒. 𝑀𝑎𝑟𝑔𝑖𝑛𝑖𝑡” is the difference between
the voting share of businessperson candidate and non-businessperson candidate. The variable
𝐶𝐸𝑂𝐶𝑎𝑛𝑑𝑖𝑑𝑎𝑡𝑒. 𝑉𝑜𝑡𝑒. 𝑀𝑎𝑟𝑔𝑖𝑛𝑖𝑡 enters the equation in the formation of function since the model
is a polynomial RD design and the regression model of multiple degrees of polynomial would
be tested. β1 is the causal impact from whether the incumbent governor is a businessperson.
When Business Governor equals to 1, the “discontinuity” occurs if there is a significant
𝑌𝑖𝑡+1 = 𝛽0
+ 𝜷𝟏
𝑪𝑬𝑶𝑪𝒂𝒏𝒅𝒊𝒅𝒂𝒕𝒆𝑾𝒊𝒏𝒊𝒕 + 𝛽2
[𝑓 · ሺ𝐶𝐸𝑂𝐶𝑎𝑛𝑑𝑖𝑑𝑎𝑡𝑒. 𝑉𝑜𝑡𝑒. 𝑀𝑎𝑟𝑔𝑖𝑛ሻ]𝑖𝑡
+
𝛽3
[𝐶𝐸𝑂𝐶𝑎𝑛𝑑𝑖𝑑𝑎𝑡𝑒𝑊𝑖𝑛𝑖𝑡 × 𝑓 · ሺ𝐶𝐸𝑂𝐶𝑎𝑛𝑑𝑖𝑑𝑎𝑡𝑒. 𝑉𝑜𝑡𝑒. 𝑀𝑎𝑟𝑔𝑖𝑛ሻ𝑖𝑡 ] + 𝛽4
𝑋𝑖𝑡 + 𝛾𝜃𝑖 + 𝜓𝜔𝑡 + 𝜀𝑖𝑡

21
21
impact from β1 to y, which is the regression of y on the margin of voting share, by moving the
regression curve upward or downward by β1 units. Besides, there is an interaction term
𝐶𝐸𝑂𝐶𝑎𝑛𝑑𝑖𝑑𝑎𝑡𝑒𝑊𝑖𝑛𝑖𝑡 × 𝑓 · ሺ𝐶𝐸𝑂𝐶𝑎𝑛𝑑𝑖𝑑𝑎𝑡𝑒. 𝑉𝑜𝑡𝑒. 𝑀𝑎𝑟𝑔𝑖𝑛ሻ𝑖𝑡. It allows the slope differs between
the cutoff point. The subscript i stands for the states, and the subscript t stands for the time.
X𝑖𝑡 is the state time-varying control variables (covariates). 𝜃𝑖 is state fixed effect. 𝜔𝑡 is
year fixed effect.
Outcome Variables—State Fiscal Performance
Researchers have developed a wide variety of indicators about government fiscal condition,
fiscal health, or fiscal performance. Yet, there is no consensus on the best measures of
government fiscal performance. Recently, a growing number of empirical studies tend to use
multiple indicators to measure fiscal performance based on the fiscal information extracted
from the government Comprehensive Annual Financial Reports (CAFRs) (e.g., Jimenze 2019,
2020; Yu et al. 2020; Wei et al. 2020). In this present study, the sample consists of the
period of 1960 to 2010. Because state CAFRs are not readily available prior to 2000, this
research focuses on a widely accepted measures of fiscal performance—budget solvency.
using alternative data sources from US Census of Bureau’s Annual Survey of State
Government Finance. Budget solvency is the degree to which the state will end the fiscal year
in surplus or deficit. It is a core fiscal performance measures adopted by many scholars
(Jimenze 2020; Yu et al. 2020; Bruce et al. 2020). Four indicators of budget solvency are
utilized. The first one is state total surplus (000s), which is measured as total revenues minus
total expenditures, scaled by state population. The second one is state general surplus (000s),

22
22
which is measured general revenue minus general expenditures, scaled by state population.
The third one is the ratio of total revenue to total expenditure, which is measured as total
revenues divided by total expenditures. The fourth one is the ratio of general revenues to
general expenditure, which is measured general revenues divided by general expenditures. It
should be noted that the larger values the four fiscal indicators, the better the fiscal
performance.
Treatment Assignment Variables—State Governors with CEO Experience
The treatment variable is a dummy variable indicating whether the governor is a “CEO
Governor”. The concept of “CEO Governor” is originated from research of Beach and Jones
(2016) and Neumeier (2018). In this research, “CEO Governors” are those politicians who
fall into at least one of the two categories. They either (1) have had experience of being
employed as major executive personnel prior their governor incumbency, including
presidents or members of executive boards (e.g. Ed Schafer, Governor of North Dakota from
1992 to 2000 and former president of Gold Seal Company in 1980s), vice presidents (e.g.
Deval Patrick, governor of Minnesota from 2007 to 2015 and former executive vice president
of Coca-Cola from 2001 to 2004), chief executive officers (e.g. Doug Ducey, incumbent
governor of Alabama from 2015 and former CEO of Cold Stone Creamery from 1995 to
2007), or any other types of high-ranking managerial positions of private firms (e.g. Jon
Corzine, Governor of New Jersey from 2006 to 2010 and the former CFO and senior partner
of Goldman Sachs in 1990s), or, (2) they have been creators or owners themselves of private
corporations or business prior to their governor incumbency, including but not limited to
23
23
counseling firms, manufacturing corporations, equipment dealers, retail business, trade
corporations, and catering and hotel business (e.g. Asa Hutchinson, incumbent governor of
Arkansas from 2015 and the founder and owner of a consulting firm, or, Sonny Perdue,
Governor of Georgia from 2003 to 2010 and the founder of an agricultural trading company).
Self-employed private jobs, like private attorneys, pharmacists, physicians, as well as purely
farmers or farm owners without any adjacent business, are excluded from the model (e.g.,
Jimmy Carter, Governor of Georgia from 1971 to 1975 and a farmer, or Howard Dean, the
governor of Vermont from 1992 to 2002 and a physician). The variable is coded “1” if the
governor of the year has that kind of “CEO” experience, otherwise coded “0” if the governor
does not. To fulfill the prerequisite of regression discontinuity design, the businessman
experience of governors’ election opponents is also coded in the same pattern. If the
runner-up of the general election has “CEO experience” according to this standard, a variable
of “opponents’ CEO experience” is coded “1”, otherwise “0”.
Control Variables
The control variables, including governors’ other individual characteristics, economic
condition, and political context. Governors’ individual characteristics are gender, age, race,
education, party affiliation, and whether the governor has any experience in political or
bureaucratic offices. The economic condition variables consist of state real income per capita
and unemployment rate. The political control variables include divided government
(measures whether the state’s upper and lower house are controlled by different parties),
share of Republicans in state house and senate, and citizen liberal ideology.

24
24
Data Sources
In this research, the unit of analysis is the state-year. The sample frame covers all 50 U.S.
state governments from year 1960 to 2010. The data of fiscal performance, economic
performance and states’ socioeconomic backgrounds are obtained from US Census Bureau,
US Bureau of Economic Analysis, and US Bureau of Labor Statistics. The data of governors’
personal backgrounds are from both archival data and self-collection. First, governors’
personal information other than business background are obtained from Book of the States,
published by the Council of State Governments (CSG), and the archives of National
Governors’ Association (NGA). These personal background information are name, age,
gender, race, political party, years of incumbency, and previous political experience. Second,
the business experience of governors is self-collected. The major source of governors’
business experience is archival data of the website of National Governor Association (NGA),
and is cross-checked by information gathered from encyclopedias covering ballot information
(e.g., Wikipedia, Ballotpedia, Vote-Smart), archival data of federal and state libraries, and
prominent mass media (e.g., CNN, Washington Post, New York Times, etc.). The
gubernatorial election data is from both the website of National Governor Association and the
article of Neumeier (2018).
25
25
EMPIRICAL FINDINGS
An Overview of State CEO Governors
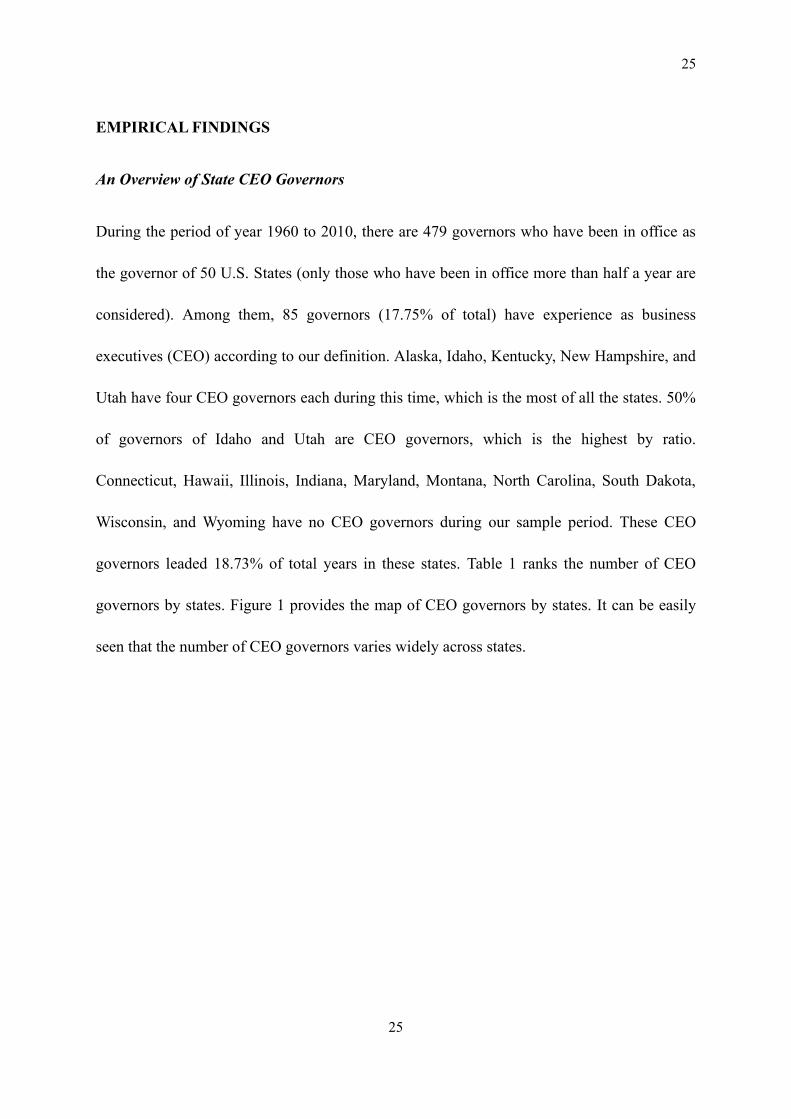
During the period of year 1960 to 2010, there are 479 governors who have been in office as
the governor of 50 U.S. States (only those who have been in office more than half a year are
considered). Among them, 85 governors (17.75% of total) have experience as business
executives (CEO) according to our definition. Alaska, Idaho, Kentucky, New Hampshire, and
Utah have four CEO governors each during this time, which is the most of all the states. 50%
of governors of Idaho and Utah are CEO governors, which is the highest by ratio.
Connecticut, Hawaii, Illinois, Indiana, Maryland, Montana, North Carolina, South Dakota,
Wisconsin, and Wyoming have no CEO governors during our sample period. These CEO
governors leaded 18.73% of total years in these states. Table 1 ranks the number of CEO
governors by states. Figure 1 provides the map of CEO governors by states. It can be easily
seen that the number of CEO governors varies widely across states.

26
26
Table 1 CEO Governors by States
State
CEO
Governors
Total
Governors
% of CEO
Governors State
CEO
Governors
Total
Governors
% of CEO
Governors
ID 4 8 50% SC 2 11 18%
UT 4 8 50% CA 1 7 14%
TN 4 9 44% IA 1 7 14%
AK 4 10 40% ME 1 8 13%
NH 4 11 36% NY 1 8 13%
KY 4 12 33% OH 1 8 13%
ND 3 8 38% WA 1 8 13%
OR 3 8 38% NV 1 9 11%
TX 3 9 33% MT 1 10 10%
WV 3 9 33% NE 1 10 10%
GA 3 10 30% MS 1 11 9%
PA 3 10 30% NM 1 11 9%
FL 3 11 27% KS 1 12 8%
CO 2 8 25% NJ 1 12 8%
LA 2 8 25% VA 1 13 8%
MI 2 8 25% CT 0 9 0%
AR 2 9 22% HI 0 7 0%
AL 2 10 20% IL 0 10 0%
DE 2 10 20% IN 0 10 0%
OK 2 10 20% MD 0 9 0%
VT 2 10 20% MO 0 10 0%
AZ 2 11 18% NC 0 9 0%
MA 2 11 18% SD 0 10 0%
MN 2 11 18% WI 0 11 0%
RI 2 11 18% WY 0 9 0%
Total 85 479 18% Total 85 479 18%

27
27
Figure 1 Map of CEO Governors by States

28
28
Assessing the Validity of RD Design
We check the validity of RD design before turning to the main results. First, Lee and
Lemieux (2010) propose to check the key assumption that individuals cannot manipulate the
treatment assignment variable or running (forcing) variable. Two graphical assessment of this
assumption is provided in Figures 1 and 2. Figure 1 presents a simple histogram representing
the distribution of margin of victory. There are many gubernatorial elections close to the
cutoff point (0). More importantly, the number of close elections resulting in a businessman
victory is approximately the same as the number of close elections resulting in a businessman
loss. Figure 2 plots a discontinuous density function around the cutoff following McCrary
(2008). It shows that the density just to the right of the cutoff is statistically indistinguishable.
The formal McCrary (2008) test also indicates that there is no evidence of discontinuity
around the threshold (p=0.2368) (See Appendix A)
Figure 2 Histogram of Margin of Victory (Businessperson Candidate Voting Share in a
Gubernatorial Election)
0
.01
.02
.03
.04
Den
sity
-50 0 50margin
Density
y/yb

29
29
Figure 3 McCrary Density Plot of Margin of Victory (Businessperson Candidate Voting
Share in a Gubernatorial Election)
A second key assumption for the RD design is the local balance of baseline covariates on
either side of the assignment threshold. If the RD design is valid, then there should not be
discontinuous jumps of covariates at the threshold (smooth around the cutoff). Following Lee
and Lemieux (2010), we replace the fiscal performance outcome variables in Equation (1)
with each of the pretreatment characteristics (covariates) to test this assumption. The findings
suggest that a high degree of local balance around the assignment threshold.
0
.01
.02
.03
.04
-40 -20 0 20 40margin
point estimate 95% C.I.
rddensity plot (p=2, q=3)

30
30
Table 2 Check the Balance of Covariates Around the Cutoff
Main RD Results: The Causal Impact of Electing a CEO Governor on State Fiscal
Performance
After confirming the validity of our regression discontinuity deign, we turn to the main
research question: does the election of a gubernatorial candidate with business CEO
experience impact fiscal performance? In the following sections, we offer two types of
evidence to present our empirical findings: simple graphical results and regression analysis.
Figure 4 presents a scatterplot with local polynomial fits around the threshold. Figure
4(A) depicts the plot for real total surplus per capita. This plot shows a downward
discontinuity just at the right side of the threshold (or cutoff) vertical line. Figure 4(B)
presents the plot for real general surplus per capita. It indicates a downward discontinuity just
at the right side of the threshold (or cutoff) vertical line. Figure 4(C) describes the plot for the

31
31
ratio of total expenditures divided by total revenues. Again, it shows a downward
discontinuity just at the right side of the threshold (or cutoff) vertical line. Finally, Figure 4(D)
presents the plot for federal share of state total government revenue. Consistent with previous
figures, it exhibits a decreased discontinuity just at the right side of the threshold (or cutoff)
vertical line. In sum, all these four figures point to the decreasing fiscal performance in states
with CEO governors compared with non-CEO governors.
Figure 4. Graphical RD Results (Binned Scatterplots): Causal Impact of Businessmen Victory
on State Fiscal Performance Outcomes (Local Polynomial Fits)
Panel (A) Panel (B)
Panel (C) Panel (D)
Notes: “Businessmen margin of victory” is on X-axis in all panels. The variable is the businessperson’s vote
-2-1
01
2
-40 -20 0 20 40 60
Sample average within bin Polynomial fit of order 4
Real Total Surplus Per Capita
-1-.
50
.51
-40 -20 0 20 40 60
Sample average within bin Polynomial fit of order 4
Real General Surplus Per Capita
.91
1.1
1.2
-40 -20 0 20 40 60
Sample average within bin Polynomial fit of order 4
Ratio of Total Revenue/Total Expenditure
.9.9
5
1
1.0
51.1
-40 -20 0 20 40 60
Sample average within bin Polynomial fit of order 4
Ratio of General Revenue/General Expenditure

32
32
share minus the competitor/opponent(non-businessmen) vote share. If businessmen margin of victory> 0, the
businessmen has won. If businessmen margin of victory< 0, the businessmen has lost. All panels are binned
scatterplots taking the binned average of different variables on the Y-axis.
Moving to the RD estimates, Table 3 reports RD coefficients and robust 95% confidence
intervals for the local polynomial approach. In RD nonparametric approaches, the choice of
bandwidths is important because these bandwidths define the weight assigned to each data
observations. Therefore, following Calonico et al. (2017), this study prefers to present the RD
estimates using mean square error (MSE) optimal bandwidths. Alternative optimal
bandwidths are used as robustness checks. The results in Table 3 suggest that CEO
experience negatively influences state fiscal performance variables. The RD coefficient,
based on MSE optimal bandwidths (β = -0.912***; 95 percent CI [1.289; -0.536]), implying
that real per capita total surplus in states with CEO governors is $912 dollars less compared
with those of non-CEO governors. When looking at the CEO experience on real per capita
general surplus, our result shows that states with CEO governors have a smaller amount of real
per capita general surplus ($538 dollar less). Consistently, based on MSE optimal bandwidths,
the RD estimate for CEO governors on the ratio of total revenue/expenditure is -0.101*** (95
percent CI [-0.172; -0.029]). This suggests that the ratio of total revenue/expenditure in states
with CEO governors is 10% less compared with those of non-CEO governors. Finally, the RD
estimate on the ratio of general revenue/expenditure is -0.062*** (95 percent CI [-[-0.111;
-0.014]). This suggests that the ratio of general revenue/expenditure in states with CEO
governors is 6.2% less compared with those of non-CEO governors.

33
33
Table 3 Local Polynomial RD Estimates (Without Covariates)
Real Total
Surplus Per
Capita
Real General
Surplus Per
Capita
Ratio of Total
Revenue/Expenditure
Ratio of General
Revenue/Expenditure
RD Coefficient -0.912*** -0.538*** -0.101*** -0.062***
Robust 95% CI [-1.289; -0.536] [-0.804; -0.271] [-0.172; -0.029] [-0.111; -0.014]
N 462 462 462 462
N-/N+ 91/161 97/140 91/216 97/114
h 8.214 6.640 8.359 6.706
Notes: RD estimates computed using local polynomial methods with triangular kernel function. Bias-corrected
robust estimators of standard errors developed by Calonico et al. (2014). N means total number of observations.
N-/N+ denotes effective number of observations at both sides of the threshold. h is the optimal bandwidth using
the mean square errors (MSE).
*p<0.1, **p<0.05, and ***p<0.01.
To check our results’ robustness to different model specifications, this research
incorporates a set of covariates into the RD models. It should be noted that the inclusion of
control variables, though not necessary for identification purposes, may help improve the
precision of our RD estimates (Imbens and Lemieux 2008). Therefore, Table 4 presents the RD
estimates with the inclusion of all covariates that might influence state fiscal performance. The
point estimates are slightly different following the inclusion of additional control variables, but
the results are qualitatively identical, giving us further confidence that we have identified a
robust negative relationship between CEO experience and state fiscal performnace.

34
34
Table 4 Local Polynomial RD Estimates (With Covariates Included)
Real Total Budget
Surplus/Deficit Per
Capita (2010 $)
Real General
Budget Surplus
Per Capita
(2010$)
Ratio of Total
Revenue/Expenditure
(%)
Ratio of General
Revenue/Expenditure
(%)
RD Coefficient -0.457*** -0.389*** -0.041*** -0.024***
Robust 95% CI [-0.701; -0.213] [-0.794; -0.09] [-0.087; -0.026] [-0.11; -0.031]
Covariates Yes Yes Yes Yes
N 462 462 462 462
N-/N+ 91/85 91/73 97/206 97/73
h 7.073 6.991 6.720 6.476
Notes: RD estimates computed using local polynomial methods with triangular kernel function. Bias-corrected
robust estimators of standard errors developed by Calonico et al. (2014). Covariates include gender, age, race,
education, party affiliation, political experience, real income per capita, unemployment rate, and divided
government, share of Republcains in state house and senate, and citizen liberal ideology. N means total number
of observations. N-/N+ denotes effective number of observations at both sides of the threshold. h is the optimal
bandwidth using the mean square errors (MSE).
*p<0.1, **p<0.05, and ***p<0.01.

35
35
Robustness Checks
In addition to the results reported in Tables 3 and 4, this study also performs a series of tests
to check the robustness of RD estimates. Figure 5 presents the alternative RD estimates based
on a local linear polynomial approach. The alternative RD estimates using Epanechnikov
kernel functions, Uniform kernel functions, and coverage error rate optimal bandwidth (CER)
remain unchanged. These results are available upon request.
Figure 5. Graphical RD Results (Binned Scatterplots): Causal Impact of Businessmen Victory
on State Fiscal Performance Outcomes (Local Linear Fits)
Panel (A) Panel (B)
-1.5
-1-.
50
.51
-40 -20 0 20 40 60
Sample average within bin Polynomial fit of order 1
Real Total Surplus Per Capita
-1-.
50
.5
-40 -20 0 20 40 60
Sample average within bin Polynomial fit of order 1
Real General Surplus Per Capita

36
36
Panel (C) Panel (D)
DISCUSSION AND CONCLUSION
This research analyzes the causal impact of governors’ CEO business experience on the fiscal
performance of American state governments. In doing so, this study brings together the
multiple theoretical insights from upper echelons theory, sector imprinting theory, public
choice theory and publicness fit theory. Our findings point to the negative effect of governors’
business experience on the state fiscal performance. These results are robust to alternative
model specifications and have important implications.
From the theoretical perspectives, two major reasons may be behind the causal
mechanism of CEO governors’ negative impact on state fiscal performance. First, CEO
governors may have better competence and skills in managing private business. However, as
suggested by the publicness fit theory, governments have distinct organizational contexts and
contrast in many extrinsic and intrinsic factors with private ones. Private sector experience
and skills may not perfectly match the complex public sector environment. Second, public
.91
1.1
1.2
-40 -20 0 20 40 60
Sample average within bin Polynomial fit of order 1
Ratio of Total Revenue/Expenditure
.95
1
1.0
51.1
-40 -20 0 20 40 60
Sample average within bin Polynomial fit of order 1
Ratio of General Revenue/Expenditure

37
37
choice theory argues that personal interest is the fundamental incentive of politicians’ choices.
In order to benefit their business interest, CEO governors may empower themselves from
governor’s authorities when they are incumbent. As Szakonyi (2020) suggests, many
businessman politicians run governments “for business” instead of “like business”, by
unevenly distributing public funding to business interests that they have connection with.
Since such manipulation of government resources is often out of supervision and
accountability, it may cause the deterioration of the fiscal performance.
This study makes three key contributions. First, to the best of our knowledge, the
relationship between the fiscal performance and businesspeople politicians in US politics has
not been empirically studied. This research fills this gap by investigating the association
between the incumbency of US state governors with a business CEO background - and a
state’s fiscal performance. Second, this research contributes to a growing branch of studies
that examining the influence of public officials’ personal characteristics on policymaking and
policy outcomes. This research illustrates that the systematic differences in politicians’
personal identities and professional backgrounds do matter for governmental performance, at
least in the U.S. context. Third, this study also makes a novel methodological contribution by
using an RD design to identify the causal impact of public leaders’ CEO experience on the
fiscal performance of public sector. To date, little research has utilized RDs in the public
management studies. Recent scholars have called for the use of rigorous causal inference in
the public management research (Dague and Lahey 2019; Alonso and Andrews 2020).

38
38
Sum Statistics
Variables N Mean SD Min Max
Total Budget Surplus ($1,000) 2500 2.61 0.66 -5.31 9.08
General Budget Surplus ($1,000) 2500 1.02 0.46 -1.27 3.07
Total Revenue/Total Expenditure % 2500 1.07 0.11 0.24 2.25
General Revenue/General Expenditure % 2500 1.02 0.06 0.76 1.37
Business CEO Governor 2500 0.12 0.33 0 1
Businessperson Margin % 462 5.20% 19% -48.94% 57.90%
Female 2500 0.05 0.21 0 1
Political Experience 2500 0.91 0.29 0 1
Age 2500 52.84 7.88 33 78
Year in Political Office 2500 4.01 2.58 1 16
Party Republican 2500 0.79 0.67 0 1
Education Business BA Degree 2500 0.19 0.43 0 1
Divided Govt 2500 0.51 0.50 0 1
Personal Income Growth % 2500 2.33 2.89 -13.84 39.30
Unemployment Rate % 2500 5.95 2.07 2.30 17.40
Gini Coefficient % 2500 52.29 6.02 40.97 70.88

39
39
REFERENCES
Alonso, José M., and Rhys Andrews. 2020. “Political Ideology and Social Services
Contracting: Evidence from a Regression Discontinuity Design.” Public Administration
Review. https://onlinelibrary.wiley.com/doi/full/10.1111/puar.13177
Anessi-Pessina, Eugenio, and Mariafrancesca Sicilia. 2020. “Do Top Managers’ Individual
Characteristics Affect Accounting Manipulation in the Public Sector?” Journal of Public
Administration Research and Theory 30(3):465–84. doi: 10.1093/jopart/muz038.
Avellaneda, C. N. 2008. “Municipal Performance: Does Mayoral Quality Matter?” Journal of
Public Administration Research and Theory 19(2):285–312. doi: 10.1093/jopart/mun001.
Avellaneda, Claudia N. 2009. “Mayoral Quality and Local Public Finance.” Public
Administration Review 69(3):469–86. doi: 10.1111/j.1540-6210.2009.01993.x.
Avellaneda, Claudia N. 2012. “Do Politics or Mayors’ Demographics Matter for Municipal
Revenue Expansion?” Public Management Review 14(8):1061–86. doi:
10.1080/14719037.2012.662442.
Avellaneda, Claudia N. 2016. “Government Performance and Chief Executives’ Intangible
Assets: Motives, Networking, and/or Capacity?” Public Management Review 18(6):918–
47. doi: 10.1080/14719037.2015.1051574.
Bailey, Elizabeth E., and Constance E. Helfat. 2003. “External Management Succession,
Human Capital, and Firm Performance: An Integrative Analysis.” Managerial and
Decision Economics 24(4):347–69. doi: 10.1002/mde.1119.
Beach, Brian, and Daniel B. Jones. 2016. “Business as Usual: Politicians with Business
Experience, Government Finances, and Policy Outcomes.” Journal of Economic
Behavior & Organization 131:292–307. doi: 10.1016/j.jebo.2016.09.010.
Boardman, Craig, Barry Bozeman, and Branco Ponomariov. 2010. “Private Sector Imprinting:
An Examination of the Impacts of Private Sector Job Experience on Public Manager’s
Work Attitudes.” Public Administration Review 70(1):50–59. doi:
10.1111/j.1540-6210.2009.02110.x.
Boone, Christophe, and Walter Hendriks. 2009. “Top Management Team Diversity and Firm
Performance: Moderators of Functional-Background and Locus-of-Control Diversity.”
Management Science 55(2):165–80. doi: 10.1287/mnsc.1080.0899.
Box, Richard C. 1999. “Running Government Like a Business: Implications for Public
Administration Theory and Practice.” The American Review of Public Administration
29(1):19–43. doi: 10.1177/02750749922064256.
Boyne, George A. 2002. “Public and Private Management: What’s the Difference?” Journal
of Management Studies 39(1):97–122. doi: 10.1111/1467-6486.00284.

40
40
Buchanan, James, and Gordon Tullock. 1962. The Calculus of Consent: Logical Foundations
of Constitutional Democracy. Ann Arbor, MI: University of Michigan Press.
Chen, Chung-An. 2012. “Sector Imprinting: Exploring Its Impacts on Managers’ Perceived
Formalized Personnel Rules, Perceived Red Tape, and Current Job Tenure.” The
American Review of Public Administration 42(3):320–40. doi:
10.1177/0275074011402492.
Chin, M. K., Donald C. Hambrick, and Linda K. Treviño. 2013. “Political Ideologies of
CEOs: The Influence of Executives’ Values on Corporate Social Responsibility.”
Administrative Science Quarterly 58(2):197–232. doi: 10.1177/0001839213486984.
Dague, Laura, and Joanna N. Lahey. 2019. “Causal inference methods: Lessons from applied
microeconomics." Journal of Public Administration Research and Theory 29, (3):
511-529.
Dalton, Russell J. 1985. “Political Parties and Political Representation: Party Supporters and
Party Elites in Nine Nations.” Comparative Political Studies 18(3):267–99. doi:
10.1177/0010414085018003001.
Damanpour, F., and M. Schneider. 2009. “Characteristics of Innovation and Innovation
Adoption in Public Organizations: Assessing the Role of Managers.” Journal of Public
Administration Research and Theory 19(3):495–522. doi: 10.1093/jopart/mun021.
Downs, Anthony. 1957. “An Economic Theory of Political Action in a Democracy.” Journal
of Political Economy 65(2):135–50. doi: 10.1086/257897.
Dreher, Axel, Michael J. Lamla, Sarah M. Lein, and Frank Somogyi. 2009. “The Impact of
Political Leaders’ Profession and Education on Reforms.” Journal of Comparative
Economics 37(1):169–93. doi: 10.1016/j.jce.2008.08.005.
Esteve, M., G. Boyne, V. Sierra, and T. Ysa. 2012. “Organizational Collaboration in the
Public Sector: Do Chief Executives Make a Difference?” Journal of Public
Administration Research and Theory 23(4):927–52. doi: 10.1093/jopart/mus035.
Feeney, Mary K., and Leonor Camarena. 2019. “Gender, Race, and Diversity Values Among
Local Government Leaders.” Review of Public Personnel Administration
0734371X1986500. doi: 10.1177/0734371X19865009.
Fiorina, Morris P. 1994. “Divided Government in the American States: A Byproduct of
Legislative Professionalism?” American Political Science Review 88(2):304–16. doi:
10.2307/2944705.
Galasso, Vincenzo, and Tommaso Nannicini. 2011. “Competing on Good Politicians.”
American Political Science Review 105(1):79–99. doi: 10.1017/S0003055410000535.

41
41
Gehlbach, Scott, Konstantin Sonin, and Ekaterina Zhuravskaya. 2010. “Businessman
Candidates.” American Journal of Political Science 54(3):718–36. doi:
10.1111/j.1540-5907.2010.00456.x.
Gilmour, John B., and David E. Lewis. 2006. “Political Appointees and the Competence of
Federal Program Management.” American Politics Research 34(1):22–50. doi:
10.1177/1532673X04271905.
Göhlmann, Silja, and Roland Vaubel. 2007. “The Educational and Occupational Background
of Central Bankers and Its Effect on Inflation: An Empirical Analysis.” European
Economic Review 51(4):925–41. doi: 10.1016/j.euroecorev.2006.05.001.
Hambrick, Donald C. 2007. “Upper Echelons Theory: An Update.” Academy of Management
Review 32(2):334–43. doi: 10.5465/amr.2007.24345254.
Hambrick, Donald C., and Sydney Finkelstein. 1987. “Managerial Discretion: A Bridge
between Polar Views of Organizational Outcomes.” Research in Organizational
Behavior 9:369–406.
Hambrick, Donald C., and Phyllis A. Mason. 1984. “Upper Echelons: The Organization as a
Reflection of Its Top Managers.” Academy of Management Review 9(2):193–206. doi:
10.5465/amr.1984.4277628.
Immelmann, Klaus. 1975. “Ecological Significance of Imprinting and Early Learning.”
Annual Review of Ecology and Systematics 6:15–37.
Jacqmin, Julien, and Mathieu Lefebvre. 2016. “Does Sector-Specific Experience Matter? The
Case of European Higher Education Ministers.” Research Policy 45(5):987–98. doi:
10.1016/j.respol.2016.01.018.
Jochimsen, Beate, and Sebastian Thomasius. 2014. “The Perfect Finance Minister: Whom to
Appoint as Finance Minister to Balance the Budget.” European Journal of Political
Economy 34:390–408. doi: 10.1016/j.ejpoleco.2013.11.002.
Karaevli, Ayse. 2007. “Performance Consequences of New CEO ‘Outsiderness’: Moderating
Effects of Pre- and Post-Succession Contexts.” Strategic Management Journal
28(7):681–706. doi: 10.1002/smj.589.
Kesner, Idalene F., and Terrence C. Sebora. 1994. “Executive Succession: Past, Present &
Future.” Journal of Management 20(2):327–72. doi: 10.1177/014920639402000204.
Krueger, Anne O. 1974. “The Political Economy of the Rent-Seeking Society.” The
American Economic Review 64(3):291–303.
Lewis, David E. 2007. “Testing Pendleton’s Premise: Do Political Appointees Make Worse
Bureaucrats?” The Journal of Politics 69(4):1073–88. doi:
10.1111/j.1468-2508.2007.00608.x.

42
42
Li, Hongbin, Lingsheng Meng, and Junsen Zhang. 2006. “Why Do Entrepreneurs Enter
Politics? Evidence from China.” Economic Inquiry 44(3):559–78. doi:
10.1093/ei/cbj031.
Marquis, Christopher, and András Tilcsik. 2013. “Imprinting: Toward a Multilevel Theory.”
Academy of Management Annals 7(1):195–245. doi: 10.5465/19416520.2013.766076.
McEvily, Bill, Jonathan Jaffee, and Marco Tortoriello. 2012. “Not All Bridging Ties Are
Equal: Network Imprinting and Firm Growth in the Nashville Legal Industry, 1933–
1978.” Organization Science 23(2):547–63. doi: 10.1287/orsc.1100.0633.
Meier, Kenneth J., and Kendall D. Funk. 2017. “Women and Public Administration in a
Comparative Perspective: The Case of Representation in Brazilian Local Governments.”
Administration & Society 49(1):121–42. doi: 10.1177/0095399715626201.
Meier, Kenneth J., and Laurence J. O’Toole. 2002. “Public Management and Organizational
Performance: The Effect of Managerial Quality.” Journal of Policy Analysis and
Management 21(4):629–43. doi: 10.1002/pam.10078.
Meier, Kenneth J., Laurence J. O’Toole, and Holly T. Goerdel. 2006. “Management Activity
and Program Performance: Gender as Management Capital.” Public Administration
Review 66(1):24–36. doi: 10.1111/j.1540-6210.2006.00553.x.
Mikosch, Heiner F., and Frank Somogyi. 2009. “Personality and Policy: The Impact of
Political Leaders’ Education and Profession on Public Finance.” KOF Swiss Economic
Institute.
Neumeier, Florian. 2018. “Do Businessmen Make Good Governors?” Economic Inquiry
56(4):2116–36. doi: 10.1111/ecin.12576.
Olvera, Johabed G., and Claudia N. Avellaneda. 2019. “Subnational Government
Performance: Testing Multiple Dimensions of Governors’ Experience.” Public
Administration Review 79(3):383–98. doi: 10.1111/puar.13035.
Opstrup, Niels, and Anders R. Villadsen. 2015. “The Right Mix? Gender Diversity in Top
Management Teams and Financial Performance.” Public Administration Review
75(2):291–301. doi: 10.1111/puar.12310.
Osborne, M. J., and A. Slivinski. 1996. “A Model of Political Competition with
Citizen-Candidates.” The Quarterly Journal of Economics 111(1):65–96. doi:
10.2307/2946658.
Petrovsky, N., O. James, and G. A. Boyne. 2014. “New Leaders’ Managerial Background and
the Performance of Public Organizations: The Theory of Publicness Fit.” Journal of
Public Administration Research and Theory 25(1):217–36. doi: 10.1093/jopart/muu008.

43
43
Petrovsky, Nicolai, and Claudia N. Avellaneda. 2014. “Mayoral Public Sector Work
Experience and Tax Collection Performance in Colombian Local Governments.”
International Public Management Journal 17(2):145–73. doi:
10.1080/10967494.2014.905406.
Rainey, H. G., and B. Bozeman. 2000. “Comparing Public and Private Organizations:
Empirical Research and the Power of the a Priori.” Journal of Public Administration
Research and Theory 10(2):447–70. doi: 10.1093/oxfordjournals.jpart.a024276.
Rainey, Hal G. 1983. “Public Agencies and Private Firms: Incentive Structures, Goals, and
Individual Roles.” Administration & Society 15(2):207–42. doi:
10.1177/009539978301500203.
Rainey, Hal G., Robert W. Backoff, and Charles H. Levine. 1976. “Comparing Public and
Private Organizations.” Public Administration Review 36(2):233. doi: 10.2307/975145.
Simsek, Zeki, Brian Curtis Fox, and Ciaran Heavey. 2015. “‘What’s Past Is Prologue’: A
Framework, Review, and Future Directions for Organizational Research on Imprinting.”
Journal of Management 41(1):288–317. doi: 10.1177/0149206314553276.
Suzuki, Kohei, and Claudia N. Avellaneda. 2018. “Women and Risk-Taking Behaviour in
Local Public Finance.” Public Management Review 20(12):1741–67. doi:
10.1080/14719037.2017.1412118.
Szakonyi, David. 2018. “Businesspeople in Elected Office: Identifying Private Benefits from
Firm-Level Returns.” American Political Science Review 112(2):322–38. doi:
10.1017/S0003055417000600.
Szakonyi, David. 2020. “Private Sector Policy Making: Business Background and Politicians’
Behavior in Office.” The Journal of Politics 000–000. doi: 10.1086/709297.
Talke, Katrin, Sören Salomo, and Katja Rost. 2010. “How Top Management Team Diversity
Affects Innovativeness and Performance via the Strategic Choice to Focus on Innovation
Fields.” Research Policy 39(7):907–18. doi: 10.1016/j.respol.2010.04.001.
Thurmaier, Kurt M., and Katherine G. Willoughby. 2001. Policy and Politics in State
Budgeting. Armonk, N.Y: M.E. Sharpe.
Wang, Gang, R. Michael Holmes, In-Sue Oh, and Weichun Zhu. 2016. “Do CEOs Matter to
Firm Strategic Actions and Firm Performance? A Meta-Analytic Investigation Based on
Upper Echelons Theory.” Personnel Psychology 69(4):775–862. doi:
10.1111/peps.12140.
Whalley, Alexander. 2013. “Elected versus Appointed Policy Makers: Evidence from City
Treasurers.” The Journal of Law and Economics 56(1):39–81. doi: 10.1086/668696.

44
44
Wilkins, V. M. 2006. “Exploring the Causal Story: Gender, Active Representation, and
Bureaucratic Priorities.” Journal of Public Administration Research and Theory
17(1):77–94. doi: 10.1093/jopart/muj012.
Witko, Christopher, and Sally Friedman. 2008. “Business Backgrounds and Congressional
Behavior.” Congress & the Presidency 35(1):71–86. doi: 10.1080/07343460809507652.