Embed Size (px)
Citation preview

Do the interests of labor union and public pension fund activists align with
other shareholders’? Evidence from the market for directors
Diane Del Guercio and Tracie Woidtke
July 29, 2013 Diane Del Guercio
Charles H. Lundquist College of Business 1208 University of Oregon Eugene, Oregon 97403-1208 e-mail: [email protected] 541-346-5179 Tracie Woidtke Department of Finance and Corporate Governance Center 425 Stokely Management Center The University of Tennessee Knoxville, TN 37996-0540 e-mail: [email protected] 865-974-1718 We would like to acknowledge the helpful comments of Henrik Cronqvist, Larry Dann, Torsten Jochem, Hai Tran, and audience members at Georgia State University, Hong Kong University of Science and Technology, Nanyang Technological University, National University of Singapore, Singapore Management University, University of Oregon brown bag, University of Tennessee brown bag, the early research session at Drexel University’s 4th Annual Academic Conference on Corporate Governance, the 2012 Financial Management Association meetings, and the 2012 Conference on Financial Economics and Accounting (USC). Woidtke would like to acknowledge support from The University of Tennessee’s Department of Finance and Corporate Governance Center. Del Guercio would like to acknowledge support from the Finance and Securities Analysis Center at the University of Oregon. We also benefitted from the excellent research assistance of Andrea Anthony, Brian Blank, Karen Craig, Steve Liu, Heejin Park, and Hai Tran.

Do the interests of labor union and public pension fund activists align with other shareholders’? Evidence from the market for directors
Abstract
Labor union pension funds and public pension funds are frequent sponsors of shareholder proposals and prominent advocates for corporate governance reforms. Some argue that their large shareholdings and lack of business ties make them ideal monitors of corporate management. Critics, however, maintain that their activism is either politically motivated or designed to advance the interests of union employees, rather than their fellow shareholders. We provide new evidence on this question by analyzing the labor market for directorships. Previous literature has found this market to be discriminating in rewarding directors who make decisions in the best interests of shareholders, and punishing directors who do not. We find that directors are significantly more likely to make the governance change requested in a shareholder proposal if 1) the proposal sponsor is a union pension fund and 2) the firm has a unionized workforce. We find that directors at unionized firms who comply with the requests of union pension fund sponsors are significantly more likely to lose seats at external public companies. In contrast, we find that directors who comply with the requests of public pension fund sponsors are rewarded with additional external board seats. We conclude that directors who comply with union pension fund requests at unionized firms damage their reputation as monitors, and that the interests of union fund activists that also represent the firms’ employee stakeholders are not aligned with those of other shareholders. In contrast, we do not find evidence to support the criticism that public pension fund activism is politically motivated or ‘labor-friendly’.

1
1. Introduction
Shareholder activism by labor union pension funds and public pension funds has increasingly
gained the attention of corporate boards of directors, policymakers, and academics alike. Two reasons
likely underlie this attention. First, is their economic importance given their sheer size and the fact that
they represent the retirement assets of millions of beneficiaries who rely on the prudent investment of
those assets for their future security and well-being.1 Second, union and public pension funds are by
far the most prolific institutional investors employing “low-cost” activism strategies, such as
sponsoring shareholder proposals and ‘just vote no’ campaigns.2 Renneboog and Szilagyi (2010)
report that these two investor types sponsored 38% of all Rule 14a-8 shareholder proposals in the 1996
to 2005 period, while Georgeson (2011) reports that they sponsored 40% of shareholder proposals in
the 2011 proxy season. Their activism has extended to lobbying Congress and the SEC for
controversial corporate reforms, most recently on the “Say-on-Pay” reform mandating shareholder
votes on executive compensation and on fundamental changes to the director nomination and election
process (“proxy access”).
The dominance of labor union pension funds and public pension funds among shareholder
activists has been highly controversial and has led to much speculation as to their true motives. Critics
argue that public pension fund activism is politically motivated, with pension officials more concerned
with generating private benefits and publicity for themselves, perhaps for a future political campaign
or consulting career, than with maximizing shareholder wealth (Romano, 1993, 2001; Woidtke, 2002).
Similarly, union pension funds are often accused of using the shareholder activist platform as leverage
toward gaining concessions from firms on behalf of their unionized employee members (Anabtawi and
Stout, 2007; Bainbridge, 2006). In fact, these arguments appeared in the official ruling by the United 1 According to the U.S. Census Bureau, the 100 largest public pension funds have $2.7 trillion in assets as of March 2011, including $896 billion in domestic equities. According to the Department of Labor, collectively bargained pension plans have $1.4 trillion in assets as of 2008 (Private Pension Plan Bulletin, 2010). 2 In contrast, hedge fund activism tends to employ costly tools, such as launching proxy contests and amassing large ownership stakes. See Brav, Jiang, and Kim (2010) for a survey of this literature. For a survey of research on the effects of “low-cost” activism, see Ferri (2012).

2
States Court of Appeals as one of the justifications to overturn the SEC’s “proxy access” Rule 14a-11
in July 2011. Specifically, the ruling criticized the SEC for not providing a serious evaluation of the
“costs that could be imposed upon companies from use of the rule by shareholders representing special
interests, particularly union and government pension funds.”3 Academics have also characterized both
labor union pension funds and public pension funds as sharing similar ‘labor-friendly’ interests (Kahan
and Rock, 2007; Cohn et al., 2012). In short, critics contend that shareholder activism by union and
public pension fund officials serve their own private interests rather than the interests of their fellow
shareholders.
An alternative view is that union and public pension funds are vocal shareholder advocates
because they are the only type of investor with the incentive to actively monitor corporate
management. Individual investors who own a small amount of stock have an incentive to free-ride on
the monitoring of others, and other institutional investor types such as banks, insurance companies, and
mutual funds avoid confrontations with corporate management in order to secure future business with
the firm. For example, a mutual fund manager who wants to be chosen to manage a company’s 401k
plan and collect the requisite fees for this service may avoid openly criticizing management (Davis and
Kim, 2007; Ashraf et al., 2012). Self-serving corporate managers are natural opponents to giving
shareholders more power, and therefore have an incentive to discredit shareholder activists and
publicly question their motives. Under this view, union and public pension funds are the only large
shareholders sufficiently independent of the influence of corporate management to properly monitor
them.
It is empirically difficult to establish which view of union and public pension fund activism is
more accurate because it is inherently difficult to infer an agent’s motivation. Attempts to do so in the
literature have resulted in mixed evidence. Because public pension funds have been prominent
3 Business Roundtable and Chamber of Commerce v. Securities & Exchange Commission, No. 10-1305 (D.C. Cir. July 22, 2011) page 15.

3
activists since the 1980s, their activity has been most widely studied. Studies surveyed by Black
(1997), Gillan and Starks (1998, 2007), Karpoff (2001), and Romano (2001) generally failed to find
measurable valuation effects on target firms or on activist portfolios, which some interpret as due to
poor activist incentives. Romano (1993) and Woidtke (2002) provide indirect evidence consistent with
political motivations of public pension fund activism. In contrast, Del Guercio, Seery, and Woidtke
(2008) find that activist targeting in the form of ‘just vote no’ campaigns is effective in compelling
boards to fire underperforming CEOs and improve operating performance, and that this also holds for
the sub-sample of firms targeted by public pension funds. Furthermore, Cunat et al (2012) using a
regression discontinuity methodology estimate that boards that implement governance shareholder
proposals increase value by 2.8%, and the effect is more positive for institutional proposal sponsors
(primarily labor union and public pension funds).
The evidence on union pension fund motives is also decidedly mixed. Renneboog and Szilagyi
(2010) and Ertimur, Ferri, and Muslu (2011) conclude that the targeting decisions of union pension
funds do not appear to be motivated by union employee interests. In particular, Ertimur, Ferri, and
Muslu (2011) find that union pension funds are not more likely to target unionized firms. In contrast,
Agrawal (2012) finds evidence that union pension funds tend to vote against directors primarily in
firms that employ their union members, especially during times of bargaining disputes. Further, he
finds that union workers benefit in that there are fewer future labor-management disputes at these
firms. He uses the announcement of the break-up of the AFL-CIO into two separate factions to test
whether the stock price reaction differs depending on whether the AFL-CIO still represents the
unionized employees at the firm after the breakup. He finds a stock price reaction of 0.5% at firms
whose directors previously faced vote opposition from AFL-CIO pension funds, but whose unionized
workers are no longer affiliated with AFL-CIO after the break-up. His results suggest that union
pension funds’ pressure on directors benefitted union employees at the expense of shareholders.
Finally, Cai and Walkling (2011) find that the stock price reaction is significantly negative at the
4
announcement of union pension fund-sponsored Say-on-Pay shareholder proposals and significantly
positive when these proposals are defeated with low vote support.
In this paper, we argue that tests common in the literature on the labor market for directors can
reveal new evidence on activist motives. Specifically, there is a growing body of empirical evidence
that directors are rewarded in the labor market for their services when taking actions consistent with
shareholders’ interests, and punished when taking actions inconsistent with shareholders’ interests.
Rewards and punishments are measured by the change in the number of public company directorships
a director accrues, as additional directorships provide additional director compensation, prestige, and
social standing (Fama, 1980; Grundfest, 1993; Dyck and Zingales, 2002). The previous literature
consistently shows that the labor market for directorships is discriminating, such that only directors
with shareholders’ best interests in mind tend to be invited to serve on additional boards (Gilson, 1990;
Kaplan and Rieshus, 1990; Coles and Hoi, 2003; Harford, 2003; Yermack, 2004; Srinivasan, 2005;
Fich and Shivdasani, 2007; Bereskin and Smith, 2011).
We rely on the consistent finding from the literature, that the labor market for directors
ultimately reveals which directors are truly acting in shareholders’ interests and which are not, to infer
the motivations of activist investor types. Directors acting in shareholders’ interests will comply with
legitimate activist demands and ignore any self-serving ones (requests that benefit the activist
shareholder at the expense of the firm’s other shareholders). Thus, we should observe that directors
complying with legitimate activist requests will gain directorships, while directors complying with
self-serving activist requests will suffer a loss. If we then observe that directors complying with the
requests of union and public pension fund activists tend to subsequently gain directorships, while
directors ignoring requests by these activists do not, we can infer that these activists’ incentives are
aligned with that of other shareholders at target firms.
To test this we use a sample of shareholder proposals that receive support from a majority of
votes cast. These proposals typically request that the board implement a governance change, such as

5
putting the poison pill to a shareholder vote, or de-staggering the board and switching to annual
elections for board seats. Because Rule 14a-8 shareholder proposals are legally non-binding, the board
of directors must decide whether to implement the proposal once the vote outcome is revealed. Thus,
we can observe whether the board ignores or complies with the activist’s request. While boards’
failure to implement shareholder proposals receiving a majority of vote support has been heavily
criticized by investor groups, such as the Council of Institutional Investors, state law requires that
directors alone have the fiduciary duty to use their judgment and potentially superior information to
decide which governance structures are in the best interests of all shareholders.
We examine a comprehensive sample of shareholder proposals that receive a majority of vote
support from 1996 to 2004. We find that even though majority vote proposals sponsored by union
funds receive significantly less vote support than those sponsored by other sponsor types, they enjoy a
significantly higher rate of compliance from directors than other sponsors (21.4% vs. 14.5%). We find
that the higher compliance rate for union fund targets is driven by the sub-sample of unionized firms,
especially those where the proposal sponsor also negotiates collective bargaining agreements on behalf
of the firm’s employees. Furthermore, directors at unionized firms who comply with requests of union
funds experience a greater loss in external board seats than directors of control firms, but they are less
likely to lose their majority vote proposal firm board seat than directors at other majority vote firms
targeted by union funds. The apparent punishment in the external labor market for directors of
unionized firms, paired with the a lack of punishment at the proposal firm for compliance with union
funds, is consistent with the view that directors make governance changes to avoid further pressure
from aggressive labor union pension funds. It also suggests that union fund activism when the union
also has a stakeholder interest is not in the best interest of other shareholders. This contrasts with our
findings for directors who comply with requests from other shareholder activist types. These directors
experience a positive abnormal change in external board seats relative to directors of matching control
firms, consistent with directors being rewarded for complying with other (non-union) shareholders.

6
These results are consistent with a growing literature that finds that employee stakeholder
interests are not aligned with shareholders (Faleye, Mehrotra, and Morck, 2006; Chen, Kacpercyk, and
Ortiz-Molina, 2012; Lee and Mas, 2012). These studies find that employees that use their power
achieved via unionization or a large ownership stake to advance employee’s agenda of increased
wages, benefits, and job security. We contribute to this literature by showing that employees can gain
additional power over management even without a meaningful ownership stake, as SEC Rule 14a-8
requires shareholders to have only minimal ownership to sponsor proposals.
Finally, we find no evidence that directors who comply with requests from public pension
funds are punished. Majority vote proposals sponsored by public pension funds receive vote support
similar to other sponsors, and directors comply with 26.1% of their requests. Moreover, directors who
comply with requests from public pension funds experience neither greater director turnover nor losses
in external board seats relative to directors of control firms. If anything, we find that directors are
rewarded for complying with, and punished for ignoring, a public pension fund sponsor. Overall, we
find that punishment for directors who comply with activist shareholder requests is unique to the
requests of union pension fund sponsors at firms with union stakeholders, suggesting that public
pension funds do not share their ‘labor-friendly’ interests.
The remainder of the paper is organized in the following manner. Section 2 develops the
hypotheses and describes the majority vote sample. Section 3 discusses the methodology and
empirical results, while Section 4 concludes.
2. Hypothesis development and empirical setting
2.1 The labor market for directors
Fama (1980) and Fama and Jensen (1983) first suggested that the labor market for directors can
align their incentives with shareholders. There is a substantial literature providing empirical support

7
for the ex post settling-up hypothesis, which predicts a link between director performance on the job
and future opportunities in the form of additional public company directorships (Kaplan and Reishus,
1990; Gilson, 1990; Brickley et al., 1999; and Yermack, 2004). Specifically, poor director
performance is punished via a devaluation of the director’s human capital, or, reputational damage.
Harford (2003), Coles and Hoi (2003), Srinivasan (2005), Fich and Shivdasani (2007), and Bereskin
and Smith (2011) find strong support for the hypothesis that the market for directors discriminately
punishes directors whose actions reveal themselves to be poor monitors, or, to be more aligned with
managers than shareholders. For example, Fich and Shivdasani (2007) find that outside directors at
firms sued for financial fraud (who presumably failed to monitor management) experience a fifty
percent reduction in external directorships in the three years following the lawsuit. The interpretation
is that directors observed to make poor decisions consequently either lose board appointments at other
firms at which they sit, or are subsequently invited as a new board member less frequently. A net loss
in directorships provides a disciplinary mechanism, as it will mean a loss of director compensation
and/or social standing (Grundfest, 1993; Dyck and Zingales, 2002), and thus improved ex-ante
incentives for directors.
A limitation of this approach in interpreting additional directorships as a reward is that we can
only observe the number of directorships accepted, and not the number of directorships offered (e.g.,
Kaplan and Reishus, 1990). In addition, it is also possible that CEOs control director selection and that
CEOs prefer directors who are willing to rubber stamp management decisions and not diligently
monitor. However, there has been no empirical support for this alternative hypothesis that ‘poor’
directors are rewarded with additional directorships. Instead, there is consistent empirical evidence in
a variety of settings that directors lose directorships if they make decisions that are not in shareholders’
interests. For example, this has been consistently shown in varied applications such as the revelation
of fraud (Srinivasan, 2005; Fich and Shivdasani, 2007), opting in favor of protection from takeovers
(Coles and Hoi, 2003), resisting a takeover bid despite poor performance (Harford, 2003), and

8
involvement in an option backdating scandal (Bereskin and Smith, 2011). Thus, our tests assume a
discriminating labor market for directors.
2.2 Empirical setting to observe director decision-making: Majority vote shareholder proposals
In the previous section, we summarized the substantial empirical support for the hypothesis that
the labor market for directors rewards those directors who make decisions in shareholders’ interests.
We propose to now take this as given, and let the change in directorships reveal which board decisions
are in shareholders’ interests.4 If boards comply with activist demands to the benefit of all
shareholders, we expect them to be rewarded with more external directorships. If instead they give in
to self-serving activist demands just to, say, silence their critics and avoid getting their name in the
press, we expect they will be punished in the director labor market. Alternatively, if boards ignore
activist demands to the benefit of all shareholders, we do not expect them to be punished in the director
labor market.
To test this, we need an observable event to determine whether or not directors comply with or
ignore the demands of union pension fund and public pension fund activists. We use a sample of non-
binding Rule 14a-8 shareholder proposals that receive a majority of vote support for several reasons.
First, shareholder proposals make a very specific request to the board, such as ‘de-stagger the board,’
so it is unambiguous what decision activists are asking the board to consider. Second, the timing and
outcome of the decision is known to market participants. If the board had already decided that the
request is beneficial to implement, then the proposal would not have appeared on the proxy statement
to be voted on by shareholders. Because the proposal is either implemented or not after the
shareholder vote, there is a direct link between the activist request and the board decision.
Furthermore, the vote outcome and subsequent board decision is easily verifiable and is indeed tracked
4 In section 2.4 we will, however, present some event study evidence that provides at least indirect confirmation that the change in directorships evidence is consistent with shareholder wealth effects.

9
by the Council of Institutional Investors (CII) and Institutional Shareholder Services (ISS), presumably
because it is of interest to investors. Importantly, relative to a sample of all shareholder proposals,
majority vote proposals have a meaningful probability of being implemented. Ertimur, Ferri, and
Stubben (2010) report that only 3.2% of proposals with votes below 50% were implemented by the
board, while 23.9% of proposals were implemented for vote outcomes between 50% and 60%.
A less obvious characteristic of majority vote shareholder proposals is important for the
validity of our study design. Namely, we assume that not all shareholder proposals that receive a
majority of vote support would increase value if implemented. Brownstein and Kirman (2004),
Bainbridge (2010), and Alexander and Honaker (2008) argue that shareholder proposals are non-
binding for good reason, and that the corporation should not be run by referendum. Directors alone
have a fiduciary duty under state law to exercise their business judgment and decide what governance
structure is value-maximizing for the firm. Shareholders, in contrast, can vote as altruistically or
selfishly as they please. Thus, on any given issue up for a vote, directors have a greater incentive to
make an informed decision relative to the typical diversified shareholder.
Brownstein and Kirman (2004) argue that in recent years, several forces have combined to
increase the frequency of majority vote proposals and to render them noisier signals of the true
intensity of shareholder preferences. Beginning in 2003, SEC regulations require mutual funds, which
collectively own about one-quarter of the equity of U.S. public companies, to disclose voting policies
describing their stance on issues that typically come up for a vote, as well as to disclose their
individual voting records.5 To efficiently comply with these requirements, many funds subsequently
either outsourced their voting to third-party proxy consultants, such as ISS, or developed issue-based
voting rules, such as ‘vote in favor of all shareholder proposals to de-stagger the board’.6 Brownstein
5 According to the 2011 Investment Company Factbook, investment companies own 27% of U.S equities in December 2010. 6 The Department of Labor, which oversees pension plans under ERISA, has long made clear that voting rights are considered pension assets, and as such, pension trustees have a fiduciary duty to vote in the best interests of beneficiaries. (See the DOL’s 1988 “Avon letter.”) Thus, institutional investor demand for third-party proxy services, such as that of ISS,

10
and Kirman argue that this has led to both “rote policy voting in lieu of case-by-case analysis (p. 45)”
and substantial influence of proxy consultants over vote outcomes. Consistent with this, Morgan et al
(2011) report that in the 2004 and 2005 proxy seasons, 100% of shareholder proposals on the topic of
de-staggering the board received an ISS recommendation to vote in favor, and these proposals received
average vote support of 90%.7 However, it is not clear that removing takeover defenses are in the best
interests of shareholders at every firm. For example, Cen et al. (2011) and Johnson et al. (2013) find
that takeover defenses are beneficial for firms with important long-term relationships with suppliers or
customers who would otherwise find relationship-specific investment unattractive. The fact that ISS
recommendations are somewhat predictable implies that proposal sponsors can easily game the system;
majority vote support is practically guaranteed with carefully chosen proposal topics in firms with high
institutional ownership, independent of its merits at that particular company. Under this view, a
proposal that receives support of a majority of the votes cast is not necessarily in the best interests of
all (non-activist) shareholders.
Thus, if labor union pension fund and public pension fund activist interests are aligned with
other shareholders, then we should observe that an outside director who complies with these activists’
requests, as specified in a majority vote shareholder proposal, is more likely to retain her board seat
and attract external directorships. If instead these activists are motivated by private benefits, then
instead we should observe punishment for those directors who comply with their requests. Directors
may comply with self-serving activist requests in order to avoid bad publicity or damage to their
personal reputations from becoming future targets of ‘just vote no’ campaigns. Choi, Fisch, and Kahan
(2011), using data on ISS vote recommendations and vote outcomes from 2005 and 2006, show that
directors on boards that ignore a majority vote are substantially more likely to receive a “withhold precedes the mutual fund vote disclosure regulation. These plans typically have written voting policies or follow proxy consultant recommendations, similar to mutual funds. 7 In their comprehensive sample of mutual funds, they also find that 86% of shareholder proposals on the topic of submitting the poison pill to a shareholder vote received an ISS recommendation to vote in favor, and that these proposals received 78% of votes in favor. Examining the incentives and influence of proxy consultants is a topic of increasing regulatory and academic interest.

11
vote” recommendation and a high percentage of “withhold” votes. Furthermore, Del Guercio, Seery,
and Woidtke (2008) report that a failure to implement proposals that receive majority votes is the third
most common stated reason by activists for launching a ‘just vote no’ campaign against directors in
their sample. Managers and directors at unionized firms in particular might comply with union
pension fund requests to enjoy the “quiet life” in order to buy peace with employees or head off more
aggressive union tactics (Bertrand and Mullainathan, 2003; Cronqvist et al., 2009). This should be
especially true if the union pension fund sponsoring the proposal also represents unionized employees
at that same firm. These are sponsors who have the greatest incentive to make life difficult for
managers and directors who ignore their requests, and the least incentive to give up completely if at
first they are ignored.
2.3 Data on majority vote shareholder proposals
Our final sample of 610 majority vote shareholder proposals from 1996 to 2004 comes from
two main sources, the Council of Institutional Investors (CII) and the Investor Responsibility Research
Center (IRRC) (now RiskMetrics). The CII is an investor group founded in 1985 to promote best
practices in corporate governance. The membership is primarily union and public pension funds, but
also includes corporate pension funds. One issue that has consistently remained on the CII’s agenda
for over a decade is corporate boards that fail to implement a shareholder proposal despite a majority
of votes cast in favor of that proposal. Every year the CII sends a letter to the boards of directors at
companies receiving a majority of vote support requesting that the proposal be implemented, tracks the
company response (whether they implement, send a letter to the CII explaining why they did not, or do
not respond), and tabulates a summary available to its member pension funds (prior to 2004 this
summary was available publicly on its website). We use this annual list from the CII containing the
firm, proposal topic, proposal sponsor, and whether the company implemented the proposal from 1998

12
to 2004 as a starting point in collecting our sample. We then supplement this with company responses
from ISS and data on shareholder proposals from the IRRC Corporate Governance Bulletin.
Specifically, we add data on the percentage of votes cast, 49 proposals from 1996 and 1997 (years not
covered by CII), and 12 proposals from 1998 to 2004 that do not appear on the CII list. We also obtain
the share ownership of the proposal sponsor directly from corporate proxy statements. In 416 proposals
the proxy discloses the sponsor name and share ownership. In the remaining cases, the proxy statement
states that this information is only available upon request. While the IRRC Corporate Bulletin lists
proposal sponsors in these cases where the company does not disclose sponsor information in the
proxy statement, they do not provide sponsor ownership information. Thus, sponsor ownership is
missing whenever the company does not disclose it in the proxy statement. For proposals not on the
CII list, we determine board responses by examining press announcements, proxy statements, and 10-k
filings in the subsequent year. When ISS documents a response and CII does not, we conduct a search
to verify the correct response. We identify 643 proposals from 1996 to 2004, and are able to obtain the
necessary data on 610 proposals.
2.4 Should all majority vote shareholder proposals be implemented? Evidence from “close-call”
proposals
The Council of Institutional Investors, among others, interprets a board’s failure to implement a
majority-supported proposal as a sign of entrenchment. Defenders of the authority of the board to
exercise proper discretion interpret a board’s failure to implement as a sign that the board’s fiduciary
duty and superior information led them to conclude that the governance change is not in the best
interests of all shareholders. To provide some initial evidence on this, we follow the spirit of the tests
in Cunat et al. (2012) and identify a sample of ‘close-call’ shareholder proposals from 1996 to 2004
with vote outcomes between 45% and 55%. They argue that ‘close-call’ proposals are particularly
informative about the valuation effects of a proposed governance change because 1) there is a discrete

13
increase of about 20% in the probability of being implemented around the 50% threshold (Ertimur et
al., 2010); 2) the vote outcome is not anticipated by the market; and 3) target firm characteristics do
not systematically differ within this narrow band of outcomes, mitigating selection bias concerns.
Thus, a comparison of the price reaction to a proposal passing versus a proposal failing provides an
estimate of the expected effect of implementing the governance change. Because our interest is in
distinguishing between sponsor types, we compare the price reactions across close-call proposals
sponsored by union pension funds, public pension funds, and other sponsors.
Table 1 contains the average and median two-day CAR (-1,0) at the vote outcome (annual
meeting date) for close-call passed and failed proposals by sponsor. We also report the percentage of
CARs that are positive in each category. We find that proposals that barely pass have significantly
lower CARs than proposals that barely fail only for union-sponsored proposals. Specifically, the
average CAR is 1.06% lower for union sponsored proposals that pass, and this difference is significant
at the 10% level. In contrast, proposals that barely pass have a large, 2.08% average CAR if sponsored
by a public pension fund, while their proposals that barely fail have a -1.35% average CAR. The
difference of 3.43% is significant at the 5% level. The results for median CARs are quantitatively
similar. The sample of public pension fund close-call proposals is small (n=9 for barely passed and
=11 for barely failed), but the difference in stock price reactions across union and public pension fund
sponsors are striking and suggestive that not all passed proposals are met with a positive stock price
reaction. Although not reported in the table, the mean CARs for passed proposals across union and
public pension funds sponsors are significantly different at the 5% level, while the mean CARs for
failed proposals across these two sponsor types are different at the 10% level.
Using the arguments in Cunat et al., one interpretation is that a higher probability of a union-
sponsored request being implemented is considered bad news by investors, while a higher probability
of a public pension fund request being implemented is considered good news. We find no significant
difference in reaction to close-call proposals by other sponsor types. Interestingly, these results are

14
consistent with the findings of Cai and Walkling (2011) who examine ‘Say on Pay’ shareholder
proposals in 2006-2008, which are primarily sponsored by union pension funds. They find that
proposals that pass have a significantly lower CAR by 2.3% than proposals that fail. Together, these
results suggest that it is not a given that all non-binding shareholder proposals that pass should be
implemented by the board, despite vocal activist pressure to do so. In the next sections, we explore
reasons why implementing union fund requests in particular would be systematically bad news for
shareholders.
2.5 Majority vote shareholder proposals: summary statistics and compliance rates
In the remainder of the paper, we analyze only majority vote proposals, excluding any
proposals with less than 50% vote support. Table 2 contains summary statistics on our sample of
majority vote proposals and the subsequent board response. The first column of Panel A shows that
unconditionally over our sample period, majority vote shareholder proposals have a 17.7% probability
of the board responding by fully complying with the activist request, and a 22.6% probability of the
board either fully complying or compromising with the activist by taking a lesser action before the next
annual meeting. The average proposal receives 63.5% of votes cast in favor and the average proposal
sponsor owns only 0.26% of shares outstanding. Finally, using primarily information reported in 10-k
filings, we report the percentage of proposal targets where the firm has a unionized workforce.
Although we check the robustness of our results to alternate definitions of a unionized workforce, we
report results where we define a firm as unionized if any of its employees are subject to collective
bargaining agreements.8 We find that 69.5% of majority vote proposals are at unionized firms.
8 We use unionization data from Ertimur, Ferri, and Muslu (2011) for firms that overlap in our samples, and thank these authors for generously sharing their data. We then supplement this for missing firms using the same data sources and variable definitions described in Appendix 5 of their paper. Specifically, we primarily use 10-k filings, but also consult F-7 filings from the U.S. Department of Federal Mediation and Conciliatory Service (FMCS) available from their website when information is missing from the 10-k. The National Labor Relations Act requires employers or employees’ representatives to file a report 60 days prior to the termination or modification of a collective bargaining agreement. This filing provides

15
The next columns report statistics by sponsor type. Union pension funds sponsor 32.6% of all
majority vote proposals, while public pension funds sponsor 7.5%. Renneboog and Szilagyi (2010)
report that these sponsor types represent 33% and 4.8% of all shareholder proposals that came to a vote
from 1996 to 2005, suggesting that public pension funds have disproportionately more success in
garnering majority vote support. Public pension fund majority vote proposals are concentrated by
sponsor. The top two sponsors, the New York City pension funds and CalPERS, represent 86% of all
public pension fund majority vote proposals. When union-affiliated sponsors are considered
separately, the top two union pension fund sponsors, United Brotherhood of Carpenters and Joiners of
America (UBCJA) and Amalgamated Bank’s Longview Fund, represent only 36% of all union pension
fund majority vote proposals. However, when we consider all member unions affiliated with the AFL-
CIO umbrella organization, they represent nearly 94%. Thus, the universe of institutional sponsors of
majority vote shareholder proposals represents only a handful of unique entities.
We find that the average vote support for union sponsored majority vote proposals is
significantly lower, while the full compliance rate is significantly higher, relative to other sponsors.
The average ownership of union pension fund sponsors (0.01%) is also significantly smaller than the
other sponsor types, but it is possible that their ownership is underestimated due to their use of external
portfolio managers who report holdings separately.9 While the average ownership of public pension
fund sponsors is larger (0.51%), it is not significantly different from the other sponsor types. Union
pension fund proposals are at firms with lower unionization rates (63.3%), relative to other sponsors,
although public pension funds proposal firms have significantly lower rates of unionization (55.2%).
The next columns provide statistics by proposal topic. Eighty-six percent of all majority vote
proposals request that the board either remove an anti-takeover provision or put its removal up for a the firm name, union name, bargaining unit size, and notice date. We also check the robustness of our results to alternate definitions of a unionized firm, such as 5% or more of employees are subject to collective bargaining agreements, or any union activity such as a contract negotiation or conflict with unions reported. Our results are qualitatively similar under these definitions. 9 For example, the document “Facts about the AFL-CIO’s Proxy Votes” explains that they sponsor shareholder proposals using their Reserve Fund, not subject to ERISA.

16
binding shareholder vote. Within this category, the most popular requests, accounting for 73% of all
majority vote proposals, are to de-stagger the board and remove the poison pill. These two types have
significantly lower full compliance rates than other proposal topics. Most of the compromises are in
the poison pill category and typically represent the case where the company agreed to let the poison
pill expire, but reserved the right to adopt a new plan without shareholder approval in the future if the
board decides that it is in the best interest of shareholders to do so. Based on press reports and the fact
that companies tend to receive additional poison pill proposals in the year following the compromise,
we infer that activists do not consider this board action as a satisfactory response to their request.10 For
this reason, in our tests we pool compromises with ignoring activists’ requests, but we note that our
results are not sensitive to how we treat compromise responses. We find a below-average unionization
rate for the category of expense stock options (43.6%), which is not surprising since many of these
firms are in the high-tech industry, which tends not to have high rates of unionization.
We also present summary statistics for an early (1996-2000) versus later (2001-2004) period.
As noted by Ertimur et al. (2010) and Renneboog and Szilagyi (2010), shareholder proposals have
enjoyed increasingly higher average vote support over time. This is evident in the increase in the
number of majority vote proposals from 188 in the earlier period (representing 19.7% of all
shareholder proposals, untabulated) to 422 in the later period (35.4% of all shareholder proposals).
Even within majority vote proposals, we find significantly higher vote support in the later sample
period, but the compliance rate is only slightly higher (18.7% vs. 14.9%) and is not significantly
different.
Finally, in the last two columns, we present summary statistics for the number of times a
proposal receives majority vote support. Four hundred and fifteen proposals, or 68% of the sample,
10 Some have labeled this board response a “fiduciary out” because it justifies the ultimate authority of the board of directors to exercise their best judgment in fulfillment of their fiduciary duties, even if a previous shareholder vote indicated a different decision. Critics argue that this feature makes boards unaccountable to shareholders, while proponents argue that it is necessary to run the firm efficiently and in a manner consistent with state law. See for example “Tale of Two Poison Pills” by Stephen Taub on cfo.com (12/13/04).

17
receive majority vote support for only one year, indicating it is the first time the proposal receives
majority vote support. In the remaining 32% of proposals, the company previously had a proposal on
the same topic receive majority vote support. We find significantly higher vote support but lower full
implementation rates for repeat targets. We also find significantly higher sponsor ownership for first
time proposals (0.38%) than for repeat targets (0.02%). These target firms that ignore multiple
consecutive majority vote proposals are precisely the reason that the CII began tracking and
publicizing whether or not firms implement these proposals. In our tests, we consider whether or not
the firm is a repeat target.
In Table 2, Panel B contains the number of majority vote proposals by sponsor type, cross-
tabulated with proposal topic, time period, and repeat target status. Union pension funds sponsor
proposals relatively evenly across all five proposal topic categories, while 80% of public pension fund
sponsored proposals are concentrated in removing or voting on a staggered board. It might seem
counter-intuitive that unions favor dismantling anti-takeover provisions given that layoffs and
restructurings often accompany takeovers. Results in the literature, however, suggest that firms with
employees who own significant stock in the firm or are unionized are less likely to be acquired (Rauh,
2006; Chen et al., 2011). These authors suggest that employee stock ownership or unionization is an
effective substitute for traditional takeover defenses. Finally, union pension funds are also the primary
sponsors of proposals to expense stock options, accounting for 95% of these proposals. This fits the
prediction of Matsusaka and Ozbas (2013) whereby union activists might pick proposal topics that
management cares a lot about, such as their compensation, in order to provide a credible threat that
they will apply more pressure if side payments are not made to them (e.g., employee benefits).
In examining sponsor type by time period, public pension fund sponsors stand out as having a
similar number of proposals in the earlier and later time period, in contrast to the other sponsor types
that mirror the overall sample pattern of a much greater number of majority vote proposals in the post-

18
2000 period. Public pension funds also stand out in terms of having a larger percentage of one-time
proposals (85% versus 79% for union pension funds and 60% for other sponsors).
2.6 Determinants of board compliance with majority vote shareholder proposals
To examine whether boards are more likely to comply with requests from activists when they
feel pressure from unionized employees, we examine determinants of compliance rates in Table 3. In
Panel A we examine the rate of compliance by proposal sponsor type and by whether the firm’s
employees are unionized. Consistent with the “quiet life” hypothesis, we find significantly higher
compliance rates only in the case where both the sponsor is a union pension fund and the firm is
unionized. Specifically, of firms targeted by union pension funds, 7.1% of boards comply at non-
unionized firms, while the compliance rate is over twenty percentage points higher, 29.4%, at
unionized firms. This difference in compliance is significant at the 1% level. In contrast, for the
sample as a whole and for other sponsor types, there are no significant differences in compliance rates
between unionized and non-unionized firms, suggesting that the unionized status of the firm only
affects the board’s decision when the sponsor is a union.
We also compare compliance rates for the sample of firms where the union fund proposal
sponsor is the same umbrella union representing some or all of the firm’s employees (“dual role”
sponsor). Because the AFL-CIO tends to coordinate corporate governance efforts on behalf of its
member unions, we consider a proposal that is sponsored by the AFL-CIO or one of its members to be
a dual role proposal if one of the firm’s employee collective bargaining agreements is with an AFL-
CIO member union. We also consider an alternate definition where we require an exact match
between a specific union sponsor and a specific collective bargaining agreement (e.g., Sheet Metal
Workers must be both the sponsor name and the union name under that firm). The results are
qualitatively similar under either definition. We find a significantly higher compliance rate when the

19
sponsor is a dual role union (33.7%), relative to the rate for all other majority vote proposals at
unionized firms (13.4%) and even relative to non-dual role union fund sponsors at unionized firms
(12.0%). This suggests that the unionized status of the firm does not influence the board’s decision if
the sponsor does not also represent employees.
In Panel B of Table 3 we examine whether these results extend to a multivariate analysis. We
report estimates of a probit regression where the dependent variable equals one if the board complies
with the request in the majority vote proposal, and zero otherwise. Although they do not examine the
impact of a unionized workforce or a dual role sponsor, Ertimur et al. (2010) examine the determinants
of compliance with majority vote proposals. They find that the percentage of vote support, proponent
ownership, and the sponsor and proposal type are significant determinants of compliance. We include
these variables, and find similar signs and significance for most variables. Specifically, compliance is
significantly more likely for proposals with higher vote support and higher proponent ownership. We
also find results generally consistent with the univariate results in Table 2 Panel A. Proposals to
remove takeover defenses have lower average compliance rates, while first-time majority vote
proposals have higher average rates.
Consistent with the univariate results in Table 3 Panel A, whether or not the firm is unionized is
not significantly related to compliance. Further, comparing column (1) to the other columns suggests
that the increase in the probability of compliance for union fund sponsors is driven by the sub-sample
of unionized firms. The interaction of the union pension fund sponsor dummy with the unionized firm
dummy is positive and highly significant at the 1% level in all specifications. While the magnitude of
the marginal effect varies across specifications and whether the interaction term includes the unionized
firm dummy or the dual role dummy, it is economically significant in all specifications. The marginal
effect of a union fund sponsor targeting a unionized firm implies that the probability of board
compliance increases 21 to 41 percentage points relative to a non-unionized firm and 11 to 18.5
percentage points relative to other sponsors (untabulated).

20
In contrast, the increased likelihood of compliance with public pension fund sponsors is not
driven by the sub-sample of unionized firms. Thus, contrary to common criticisms of public pension
funds, boards do not appear to cater to them due to a perception of labor-friendly interests. Overall,
our results are consistent with the view that boards are more likely to comply with union sponsors who
are likely to aggressively and persistently target the firm due to their interests as unionized employees.
Thus, compliance may be motivated by “quiet life” benefits rather than the governance changes being
in the best interests of shareholders. In the next section, we test whether the directors who appear to
have catered to union stakeholders face punishment in the director labor market.
3. Empirical Analysis on Directorships
3.1 Matched control sample approach
To test whether director turnover and the change in external board seats is abnormal in union
and public pension fund targets relative to what it would be if not targeted, we adopt a matched
control sample approach. Specifically, for each firm with a majority vote proposal we identify a
sample of non-targeted firms with sales in the previous fiscal year within 25% of a target firm’s. We
then retain the control firm with the smallest deviation score from the targeted firm in terms of size and
prior stock return performance.11 In the event of duplicate controls, we retain the matched pair with
the smallest deviation score. We then find an alternative control with the next smallest deviation score
for the unmatched targeted firm.
We match on size and stock performance for three reasons. First, a large literature shows that
shareholder proposal targets tend to be large, poorly performing firms relative to non-targeted firms
11 We compute the deviation score as Deviation = [(SalesT – SalesC )/(SalesT + SalesC )]2 + [(AssetsT – AssetsC)/(AssetsT + AssetsC
)]2 +[(Market-Adjusted Stock ReturnT – Market-Adjusted Stock ReturnC)/( Market-Adjusted Stock ReturnT + Market-Adjusted Stock ReturnC)]2 , where subscripts T and C represent targeted and potential control firms and Market-Adjusted return is the firm’s one-year buy and hold return ending in December prior to the annual meeting minus the CRSP value-weighted market return over the same period. We calculated the deviation score using different measures of size, and the inclusion of both Sales and Assets yielded the closest set of control firms. Other papers that calculate deviation score in a similar manner include Ertimur, Ferri, and Muslu (2011), Butler and Wan (2010), and Huang and Stoll (1996).
21
(Karpoff, Malatesta, and Walkling, 1996; Smith, 1996; Strickland, Wiles, and Zenner, 1996; Thomas
and Cotter, 2007; and Ertimur et al. 2010). Second, several studies have documented that both director
and CEO turnover is highest among poorly performing firms (Warner, Watts, and Wruck, 1988; Denis
and Denis, 1995). Furthermore, Yermack (2004) reports that recent stock performance is the best
predictor of both director and CEO turnover, relative to accounting performance or lagged stock
performance. Finally, we would like the loss of a board seat to have the same meaning in the majority
vote sample and the control sample. This is more likely to be the case if positions are roughly
equivalent in terms of prestige and pay, which is arguably correlated with firm size.
Table 4 contains summary statistics on firm and governance characteristics for the sample of 493
firm-years and the 493 matching control firm-years. We obtain data on financial characteristics from
CRSP and Compustat, governance and board data from the IRRC (Riskmetrics) databases, and
institutional ownership from Thomson Financial’s database of SEC 13F filings. All variable
definitions are in the table header. We conduct tests of differences in means and medians and in paired
differences for all majority vote firms versus the matching control firms.
Although sales, total assets, and one-year stock performance are similar by construction, we also
find no significant difference between market value of equity. We do, however, find that recent
accounting performance, as measured by industry-adjusted operating performance in the most recent
fiscal year, is significantly lower for majority vote firms. We find no significant difference in board
size, but a significantly higher percentage of independent directors and percentage institutional
ownership at target firms, proxies often associated with better governance. In contrast, using other
variables commonly used as proxies for good governance in the literature, majority vote firms tend to
have significantly worse governance structures. For example, we find that target firms tend to have
lower board member stock ownership, higher rates of the CEO also serving as chairman of the board,
and more anti-takeover provisions (poison pill, staggered board, G-Index) relative to control firms.
Given that the vast majority of proposal topics are to remove anti-takeover provisions, the greater

22
prevalence of these provisions is perhaps not surprising. The next section of the paper will examine
director turnover across these two sets of firms at the level of the individual outside director.
3.2 Abnormal outside director turnover and director reputation effects to director decision making
In this section we test whether the observed effect on director reputation, as measured by retention
of their board seat at majority vote target firms and at other external firms, depends on how the board
responds to the activist request. In particular, our main interest is to test whether the reputational effect
of a given board response (e.g., comply with activist request) varies by proposal sponsor and by
unionized status of the firm.
3.2.1 Director-level characteristics and univariate tests
To conduct our tests we identify all non-employee directors at the time of the annual meeting
where the proposal garnered a majority vote, along with their counterparts in the matching control
firms using the IRRC director database from 1996 to 2007. We identify whether the director retains
her seat on the board, as well as the director’s net change in the number of external public company
directorships for the three subsequent annual meetings after the majority vote (years +1, +2, and +3).
We use proxy statements and searches in Lexis-Nexis to identify board seats in cases where this
information is missing from the IRRC database. In our analysis we adopt three practices that are
standard in the market for directors literature. First, we examine the effects up to three-years following
the event, in part because staggered board elections are a common governance structure, which is
especially true in our sample. Second, we exclusively analyze the reputational effect on outside
directors and not on insiders, as these are the directors charged with monitoring management and
ensuring that decisions are made in the best interests of shareholders. Finally, we examine the change

23
in external directorships for the sub-sample of outside directors that have at least one external board
seat, as directors serving on no other boards cannot lose an external seat.
Table 5 contains a univariate comparison of director turnover and changes in external
directorships for the full majority vote sample relative to the control sample, and for sub-samples
according to director response to the different sponsor types. We note the statistical significance in the
table of a two-tailed t-test for differences in means assuming equal variances. In calculating own
board turnover, directors who die, or directors on the boards of firms that are acquired or bankrupt, are
treated as missing. These rules yield 5,288 targeted directors and 5,434 control directors for the one-
year director turnover comparison.
The approximately 10.7% one-year turnover rate for majority vote directors is slightly higher
than the rate of 9.8% of the matching controls, but the difference is not statistically significant. The
annualized rates for the three-year turnover rate are also similar for both targeted and control firms at
approximately 9.5%. Yermack (2004) reports a 4.6% outside director turnover rate overall, and a 10%
rate in the worst performance decile, while Coles and Hoi (2003) report a 9.7% rate. Overall, outside
director turnover does not appear to be abnormally high in majority vote firms, or in sub-samples by
board response to particular sponsor types. Two exceptions are that three-year director turnover
appears to be higher for directors complying with union pension funds, and lower for directors
ignoring requests of public pension fund sponsors, but these results are statistically weak. We note that
Coles and Hoi (2003) and Fich and Shivdasani (2007) also do not find abnormal own board turnover
following events such as opting out of a state anti-takeover law or fraud litigation, but do find effects
on external directorships, which we examine next.
In calculating the change in external directorships, we include directors on the boards of
majority vote firms that are acquired or bankrupt, but we do exclude directors with no external board
seats at time 0 and directors who die before year +3. This yields 3,710 targeted directors and 3,586
control directors. Majority vote directors hold 2.25 external directorships on average, which is similar
24
to control directors, who hold 2.24 external directorships on average. The only director sub-sample
that appears to hold an abnormally large number of external directorships relative to control directors
includes those who ignore a request from public pension funds. These directors hold an average of 2.4
external seats compared to 1.93 for the control directors.
Comparing the net change in external directorships, we find no significant abnormal change for
majority vote directors overall. However, abnormal change varies according to director response and
sponsor type. In particular, directors who comply with requests from unions experience a significant,
negative abnormal change in external directorships during the three years following a majority vote,
but directors who ignore experience no abnormal changes. In contrast, we find that directors who
comply with requests from public pension funds experience abnormal net gains in external
directorships within the first year of the majority vote proposal. Consistent with this, directors who
ignore requests from public pension funds experience a significant net loss in external seats during the
one- and three-year periods following the majority vote. Finally, directors who comply with requests
from other sponsors experience a significant, positive abnormal change in external seats.
Taken together, the univariate results provide preliminary evidence that public pension fund
incentives are aligned with other shareholders, but union incentives are not. Directors ignoring public
pension fund requests are more likely to lose external directorships than their controls over both the
following one-year and three-year periods, while directors who comply with public pension funds gain
more external seats, though only in the following year. On the other hand, directors who comply with
union requests lose more external directorships than their controls, while no penalties are evident for
directors who ignore union requests. We examine the robustness of these results in a multivariate
setting in the next section.

25
3.2.2 Director response and outside director turnover
Table 6 reports probit regression estimates of the probability of outside director turnover in the
one year (specifications 1 to 3) and in the three years (specifications 4 to 6) following majority vote
support. In all specifications we pool the target director observations and their corresponding controls.
In specifications 1 and 4 we test for effects by sponsor type for directors who comply with activists and
separately for directors who ignore activists’ requests, relative to control directors. We note the effect
on target directors of complying or ignoring is not necessarily symmetric. Because the vast majority of
shareholder proposals are ignored, taking no action may be more of a non-event than the higher
visibility, less ambiguous, and relatively rare event of complying with an activist request. In
specifications 2 and 5, we test for a differential effect on directors targeted by unions at unionized
firms, while in specifications 3 and 6 we test for differential effects at dual role firms. We control for
firm and director characteristics and compute robust standard errors corrected for firm-level clustering.
We control for the following year 0 director characteristics: age (between 65 and 69, or over
69), tenure, number of external public company directorships, gray designation, gender, committee
membership, and chair of committee designation. We additionally control for whether the CEO
originally appointing the director is no longer CEO and whether the current CEO departs within the
following year. We control for the following firm characteristics: natural log of previous calendar
year-end market value of equity, prior fiscal year-end leverage, prior calendar year market-adjusted
stock return, and the market-adjusted stock return from year 0 to +1 (or 0 to +3 for the three-year
turnover specifications), beginning in March of year 0. We begin in March to include the annual
meeting for most firms and to cover the same period for both campaign and control firms. We
additionally control for the change in institutional ownership from eight quarters to the quarter before
the annual meeting (year -2 to 0).

26
Similar to Yermack (2004), we find that the likelihood of leaving the board is higher if the
CEO who appointed the director is no longer in office, if CEO turnover occurred within the following
year after the annual meeting, and if the director is older. Unlike Yermack (2004), however, previous
market-adjusted stock performance is not significant in any of the specifications. Similar to Ertimur et
al. (2010), we find that the likelihood of leaving the board is lower if a director is a member of the
compensation, audit, or nominating committee, especially if the director is also the committee chair.
Although the relation between three-year director turnover and director characteristics is similar to the
relation over one year, there are a few exceptions. Here, gray directors are significantly more likely to
lose their board seat, while the result that committee chairs are less likely to lose their board seat is
now insignificant. Unlike the results for one year, we find director turnover over three years is
negatively related to the market-adjusted performance during the three years after targeting.
Regarding the variables of interest, we find that the likelihood of leaving the board either
within one year or within three years is significantly greater across all specifications for directors who
comply with requests from unions. We estimate the marginal effect of a director complying with a
union request on the probability of director turnover within one year to be a 3 to 8 percentage point
increase and within three years to be a 6 to 19 percentage point increase, which is large compared to
the unconditional probability of 8.6% and 26.5%, respectively. Interestingly, we find a negative and
significant coefficient for the union compliance dummy interacted with a unionized firm, indicating
that the probability of director turnover within both one year and three years is lower for directors at
unionized firms that comply with union fund activists. The marginal effects here are relatively large as
well, indicating that the probability of director turnover at firms complying with unions is 38% to 63%
lower at unionized firms relative to non-unionized firms. Although the dual role interactions are
similarly negative, they are not significant. In untabulated results, we find that director turnover at
both unionized firms and dual role firms that comply with union activists is not significantly different
from turnover at non-target firms, and thus the higher rate of turnover for directors complying with

27
unions is driven by non-unionized firms. One interpretation of these results is that directors are
generally punished with higher turnover for complying with union sponsors, but are able to buy peace,
or lower turnover, by complying with their unionized employees.
In contrast, we find no significant relation between director turnover for directors who either
comply with requests from public pension funds or from other sponsors. In addition, directors who
ignore activist requests do not experience abnormal turnover, regardless of sponsor type. One
exception is that there is a marginal significance for greater turnover after three years for directors who
ignore union sponsors. While significant in only one specification, it may indicate higher average
turnover for directors targeted by union pension funds, regardless of whether the director ignores or
complies with the union fund. Overall, the multivariate analysis suggests that outside director turnover
is abnormally high only for directors of majority vote firms complying with union pension fund
requests at non-unionized firms.
3.2.3 Director response and reputation in the market for directors
Assuming that the change in the number of external directorships indicates a change in the
demand for a director’s services, we examine the relation between director response to majority vote
proposals and director reputation. Table 7 contains the results of an ordinary least squares regression
of the change in the number of other public company directorships held by the director over the one
year and the three years following a majority vote proposal, using robust standard errors controlling for
firm-level clustering. Table 7 contains specifications similar to Table 6 except for the exclusion of
target firm CEO departure variables. Similar to other studies, we focus our analysis on outside
directors with at least one external board seat so that a loss in external directorships is possible.
Consistent with the literature, directors who are older and sit on more boards experience a
lower net gain in external directorships. We additionally find that directors serving on compensation

28
and audit committees experience a greater net gain in external directorships. Similar to Ertimur et al.
(2010), we find that the one-year change in the number of seats is negatively related to market-adjusted
performance during the year after the annual meeting, although the effect on the three-year change is
no longer significant. Ertimur et al. interpret the negative relation as being potentially driven by
directors of firms with positive abnormal performance choosing to focus their board service on their
well-performing firm and less on external boards.
We generally find support for the hypothesis that directors are punished in the external labor
market for complying with union pension fund requests, especially at unionized firms and when union
funds also represent the firm’s employees. We find a significant net loss in directorships for directors
complying with a request by union pension funds, and the three year negative change in directorships
appears to be driven by the sub-sample of unionized firms (specification 5) or dual role firms
(specification 6). Consistent with this, directors who withstand the pressure of dual role unions and
ignore their requests are rewarded in the director labor market (specification 6). Furthermore, the
magnitude of the effects suggests a sizable decrease of nearly one-third of a directorship within three
years for directors complying with unions at unionized firms.12
In contrast, directors appear to be rewarded with additional directorships for complying with
both public pension funds and other sponsors. Recall that approximately 80% of the majority vote
proposals sponsored by public pension funds are to de-stagger the board, a highly visible action when
the board complies. Further, Bebchuk, Cohen, and Farrell (2009) find that staggered boards are
associated with lower firm value, and Guo, Kruse, and Noel (2008) find a shareholder wealth gain
upon the announcement of the boards’ intention to de-stagger the board. Thus, a reward for complying
12 The magnitude is also comparable to other studies of events revealing lax monitoring or alignment with management, such as the revelation of fraud (Srinivasan, 2005; Fich and Shivdasani, 2006), opting in favor of protection from takeovers (Coles and Hoi, 2003), or resisting a takeover bid despite poor performance (Harford, 2003). These studies report average changes in external directorships ranging from 0.2 to 0.5 directorships.

29
with public pension fund requests is consistent with the findings of these papers. Finally, we find no
significant relation for directors who ignore a request by public pension funds or other activists.
3.2.4 Director reputation and first time majority vote proposals
It is possible that the market for directors views the response to repeat majority vote proposals
and first time majority vote proposals differently, or that the first response is more revealing about
director quality. To investigate this and determine robustness, we repeat our analysis of director
turnover and director reputation excluding repeat majority vote proposals in columns (1) through (4) of
Table 8A (columns (2) and (5) from Tables 6 and 7), and Table 8B (columns (3) and (6) of Tables 6
and 7). In columns (5) through (8), we include additional specifications that are variations on the net
change in external directorships. Specifically, we include probit regression estimates of the probability
that a director loses an existing external directorship in the one year and in the three years following
majority vote support in columns (5) and (6). We also include probit regression estimates of the
probability than a director gains a new external directorship in the one year and in the three years
following majority vote support in columns (7) and (8).
We find the results of Tables 6 and 7 to be generally robust, and in many cases stronger, when
examining the sub-sample of first-time majority vote proposals. In addition, the results for the probit
regressions on gaining or losing an external directorship confirm the net change in directorships
variable, and lead to similar inferences. For example, directors who comply with unions at unionized
firms are significantly more likely to lose a directorship, and less likely to gain a directorship, within
three years. In general, we find robust evidence that director turnover is not significantly different for
directors at unionized firms who comply with a request from unions, and these directors experience
lower net gains in external directorships.
30
The results for directors who comply with public pension funds contrast with those for directors
who comply with unions. These directors do not experience abnormal own board turnover; but
experience a significant net gain in external directorships following compliance. Probit estimates
confirm this, as directors complying with public pension funds are significantly more likely to gain an
external directorship. Furthermore, we find consistent results for directors who ignore a public
pension fund request. This is the only sponsor type where we observe a significant increase in the
likelihood of a loss in external directorships, and a decrease in the likelihood of a gain in external
directorships, for ignoring a majority-supported proposal. The results for other sponsors are most
similar to the results for public pension funds.
Taken together, the multivariate results are consistent with the view that directors who comply
with unions are punished in the external market while directors who ignore unions are not. In contrast,
directors complying with majority vote requests by public pension funds and other sponsors are
rewarded with a greater net gain in external seats. These results are generally consistent with the
close-vote event study analysis in section 2.4, where we find that the market reacts negatively to news
that a union-sponsored proposal is more likely to be implemented, but positively to the same news in
the case of public pension fund sponsors.
4. Conclusion
Union and public pension funds are by far the most activist among shareholders adopting “low-
cost” activism strategies, especially among institutional investors. Their activism has extended beyond
shareholder proposals to lobbying Congress and the SEC for controversial corporate reforms. The
dominance of labor union and public pension funds among shareholder activists has been highly
contentious, and has led to much speculation as to their true motives. It is inherently difficult to infer
an agent’s motivation, and attempts to establish whether union and public pension fund activism is in
the interests of other shareholders have yielded mixed results.

31
We take a new approach and rely on the labor market for directors to reveal new evidence on
activist motives. Specifically, we examine a comprehensive sample of shareholder proposals that
receive majority vote support to test whether directors who comply with activists are punished or
rewarded in the labor market for directors. We find that directors who comply with requests of union
pension fund sponsors at unionized firms experience a greater loss in external board seats than
directors of control firms. We interpret punishment in the labor market for directors complying with
union requests at unionized firms as indication that the directorships market views these union requests
as self-serving, rather than beneficial to other shareholders. This interpretation is also supported by
our finding that the main determinant of whether the board will comply with the activist’s request is
whether the union fund also represents the employees at that firm in collective bargaining negotiations.
Thus, our findings suggest that the labor market for directors provides improved ex-ante incentives for
directors to withstand the pressure from employees and other stakeholders to take actions that are not
in the best interests of shareholders.
We also contribute to the debate on regulatory changes, such as Say on Pay and proxy access,
that shift power to shareholder activists and away from boards of directors. Our results show that
managers and boards of unionized firms can be vulnerable to the pressure from employee stakeholders,
consistent with several findings in the labor and finance literature. Thus, providing more potent, low-
cost tools to activists that enable them to apply greater pressure on boards may have unintended,
detrimental effects on shareholders. Our findings are also consistent with the arguments in Brown and
Kirman (2004) that corporations should not be run by referendum; not every shareholder proposal that
garners a majority of vote support is in the best interests of all shareholders. Rather, our findings
support the argument that the decision power should reside with the directors, who have fiduciary
duties to make decisions in shareholders’ interests.
In contrast to union fund sponsors, we find no evidence that directors who comply with
requests by public pension funds are punished, and instead find that these directors are rewarded with

32
additional directorships. We find public pension fund sponsors to be the only activist type associated
with both rewards to directors for complying with their requests, and, punishment for ignoring them.
These results suggest that public pension fund officials are not deserving of the criticisms that their
activism is purely motivated by personal political aspirations or publicity, nor is it consistent with
criticisms that they are sympathetic to labor union interests.

33
References
Anabtawi, Iman and Lynn Stout, 2007, Fiduciary duties for activist shareholders, Stanford Law Review 60, 1255-1308. Agrawal, Ashwini, 2012, Corporate governance objectives of labor union shareholders: Evidence from
proxy voting, Review of Financial Studies 25, 187-226. Alexander, Frederick H. and James D. Honaker, 2008, Power to the franchise or the fiduciaries?: An
analysis of the limits on stockholder activist bylaws, Delaware Journal of Corporate Law Review 33, 750-769.
Ashraf, Rasha, Narayanan Jayaraman, and Harley E. Ryan, Jr., 2012, Do pension-related business ties
influence mutual fund proxy voting?: Evidence from shareholder proposals on executive compensation, Journal of Financial and Quantitative Analysis 47, 567-588.
Bainbridge, Stephen, 2006, The case for limited shareholder voting rights, UCLA Law Review 53,
601-636. Bainbridge, Stephen, 2010, Director primacy, Working paper, UCLA Bebchuk, Lucian, Alma Cohen, and Allen Ferrell, 2009, What matters in corporate governance?,
Review of Financial Studies 22, 783-827. Bereskin, Frederick L and Clifford W. Smith Jr., 2011, Mechanisms of board turnover: Evidence from
backdating, Unpublished working paper, University of Delaware. Bertrand, Marianne, and Sendil Mullainathan, 2003, Enjoying the quiet life? Corporate governance and
managerial preferences, Journal of Political Economy 111, 1043-1075. Black, B. S., 1997. Shareholder activism and corporate governance in the United States. In: Newman,
P. (ed.), The New Palgrave Dictionary of Economics and the Law 3, pp. 459–465. Brav, Alon., Wei Jiang, and Hyunseob Kim, 2010, Hedge fund activism: A review, Foundations and
Trends in Finance 4, 1-66. Brickley, James, Jeffrey Coles, and James Linck, 1999, What happens to CEOs after they retire? New
evidence on career concerns, horizon problems, and CEO incentives, Journal of Financial Economics 35, 371-390.
Brownstein, Andrew R. and Igor Kirman, 2004, Can a board say no when shareholders say yes?
Responding to majority vote resolutions, The Business Lawyer 60 23-77. Butler, Alexander W. and Hong Wan, 2010, Stock market liquidity and the long-run stock performance
of debt issuers, Review of Financial Studies 23, 3966-3995. Cai, Jay and Ralph Walkling, 2011, Shareholders say on pay: Does it create value? Journal of
Financial and Quantitative Analysis 46, 299-339.

34
Cen, Ling, Sudipto Dasgupta, and Rik Sen., 2011, Discipline or Disruption? Stakeholder relationships
and the effect of takeover threat, Unpublished working paper, University of Toronto. Chen, Huafeng (Jason), Marcin Kacperczyk, and Hernan Ortiz-Molina, 2012, Do non-financial
stakeholders affect the pricing of risky debt? Evidence from unionized workers. Review of Finance 16, 347-383.
Choi, Stephen J., Jill E. Fisch, and Marcel Kahan, 2011, Voting through agents: How mutual funds
vote on director elections. Working paper, NYU. Cohn, Jonathan B., Stuart L. Gillan, Jay C. Hartzell, 2012, On enhancing shareholder control: A
(Dodd-) frank assessment of proxy access. Working paper, University of Texas. Coles, Jeffrey and Chun-Keung Hoi, 2003, New evidence on the market for directors: Board
membership and Pennsylvania senate bill 1310. Journal of Finance 58, 197-230. Cronqvist, Henrik, Fredrik Heyman, Mattias Nilsson, Helena Svaleryd, and Jonas Vlachos, 2009, Do
entrenched managers pay their workers more?” Journal of Finance 64, 309-339. Cunat, Vicente, Mireia Gine, and Maria Guadalupe, 2012, The vote is cast: The effect of corporate
governance on shareholder value” Journal of Finance 67, 1943-1977. Davis, Gerald and Han Kim. 2007. Business ties and proxy voting by mutual funds. Journal of
Financial Economics 85, 552570. Del Guercio, Diane, Laura Seery, and Tracie Woidkte. 2008. Do Boards Pay Attention When
Institutional Investor Activists ‘Just Vote No’? Journal of Financial Economics 90:1, 84103. Denis, David and Diane Denis, 1995, Performance changes following top management dismissals,
Journal of Finance 50, 1029-1057. Dyck, Alexander and Luigi Zingales, 2002, “The corporate governance role of the media in R. Islam
ed. The right to tell: The role of the Media in Development, The World Bank, Washington DC, 2002.
Ertimur, Yonca, Fabrizio Ferri, and Stephen Stubben, 2010, Board of director responsiveness to
shareholders: Evidence from shareholder proposals, Journal of Corporate Finance 16, 53-72. Ertimur, Yonca, Fabrizio Ferri, and Volkan Muslu, 2011, Shareholder activism and CEO pay, Review
of Financial Studies 24, 535-592. Faleye, Olubunmi, Vikas Mehrotra, and Randall Morck, 2006, When labor has a voice in corporate
governance, Journal of Financial and Quantitative Analysis 41, 489-510. Fama, Eugene, 1980, Agency problems and the theory of the firm, Journal of Political Economy 88,
288-307.

35
Fama, Eugene and Michael Jensen, 1983, Separation of ownership and control, Journal of Law and Economics 26, 301-325.
Fama, Eugene and Michael Jensen, 1983, Separation of ownership and control, Journal of Law and
Economics 26, 301-325. Ferri, Fabrizio, 2012, ‘Low-cost’ shareholder activism: A review of the evidence, In Claire Hill and
Brett McDonnell,eds., Research Handbook on the Economics of Corporate Law. Northampton: Elgar Publishers.
Georgeson, 2011, Annual corporate governance review. Gillan, Stuart L. and Laura T. Starks, 1998, A survey of shareholder activism: motivation and
empirical evidence, Contemporary Finance Digest 2, 10-34. Gillan, Stuart L. and Laura T. Starks, 2007, The evolution of shareholder activism in the United States,
Journal of Applied Corporate Finance Digest 19, 55-73. Gilson, Stuart, 1990, Bankruptcy, boards, banks, and blockholders: evidence on changes in corporate
control when firms default, Journal of Financial Economics 27, 355-388. Gompers, Paul, Joy Ishii, and Andrew Metrick, 2003, Corporate governance and equity prices,
Quarterly Journal of Economics, 107-155. Grundfest, Joseph A., 1993, Just vote no: A minimalist strategy for dealing with barbarians inside the
gates, Stanford Law Review 45, 857-937. Guo, Re-Jin, Timothy A. Kruse, and Tom Nohel, 2008, Undoing the powerful anit-takeover force of
staggered boards, Journal of Corporate Finance 14, 274-288. Harford, Jarrad, 2003, Takeover bids and target directors’ incentives: the impact of a bid on directors’
wealth and board seats, Journal of Financial Economics 69, 51-83. Huang, Roger D. and Hans R. Stoll, 1996, Dealer vs. Auction markets: A paired comparison of
execution costs on NASDAQ and the NYSE, Journal of Financial Economics 41, 313-357. Johnson, William C., Jonathan Karpoff, and Sangho Yi., 2013, The bonding hypothesis of takeover
defenses: Evidence from IPO firms, Unpublished working paper, Suffolk University. Kahan, Marcel and Edward B. Rock, 2007, Hedge funds in corporate governance and corporate
control, University of Pennsylvania Law Review 155, 1021-1093. Kaplan, Steven and David Reishus, 1990, Outside directorships and corporate performance, Journal of
Financial Economics 27, 389-410. Karpoff, Jonathan M., 2001, The impact of shareholder activism on target companies: A survey of
empirical findings, Unpublished working paper, University of Washington.

36
Karpoff, Jonathan M., Paul H. Malatesta, and Ralph A. Walkling, 1996, Corporate governance and shareholder initiatives: Empirical evidence, Journal of Financial Economics 42, 365-395.
Lee, David, and Alexandre Mas, 2012, Long-run impacts of unions on firms: New evidence from
financial markets, 1961-1999, Quarterly Journal of Economics 127, 333-378. Matsusaka, John and Oguzhan Ozbas, 2013, Managerial accommodation, proxy access, and the cost of
shareholder empowerment,Working paper University of Southern California. Morgan, Angela, Annette Poulsen, Jack Wolf, and Tina Yang, 2011, Mutual funds as monitors:
Evidence from mutual fund voting, Journal of Corporate Finance 17, 914-928. Parrino, Robert, Richard Sias, and Laura Starks, 2003, Voting with their feet: institutional ownership
changes around forced CEO turnover, Journal of Financial Economics 68, 3-46. Rauh, Joshua D., 2006, Own company stock in defined contribution plans: A takeover defense?,
Journal of Financial Economics 81, 379-410. Renneboog, Luc, and Peter G. Szilagyi. 2010. "The Role of Shareholder Proposals in Corporate
Governance." Journal of Corporate Finance 17:1, 167188. Romano, Roberta, 1993, Public pension fund activism in corporate governance reconsidered.
Columbia Law Review 93, 795-853. Romano, Roberta, 2001, Less is more: Making shareholder activism a valued mechanism of corporate
governance, Yale Journal on Regulation 18, 174-252. Smith, Michael P., 1996, Shareholder activism by institutional investors: Evidence from CalPERS.
Journal of Finance 51, 227-252. Srinivasan, Suraj, 2005, Consequences of financial reporting failure for outside directors: Evidence
from accounting restatements and audit committee members, Journal of Accounting Research 43, 291-334.
Strickland, Deon, Kenneth Wiles, and Mark Zenner, 1996, A requiem for the USA: is small
shareholder monitoring effective? Journal of Financial Economics 40, 319-338. Thomas, Randall and James Cotter, 2007, Shareholder proposals in the new millennium: Shareholder
support, board response, and market reaction, Journal of Corporate Finance 13, 368-391. Warner, Jerold, Ross Watts, and Karen Wruck, 1988, Stock prices and top management changes,
Journal of Financial Economics 20, 461-492. Woidtke, Tracie, 2002, Agents watching agents? Evidence from pension fund ownership and firm
value, Journal of Financial Economics 63, 99-131. Yermack, David, 2004, Remuneration, retention, and reputation incentives for outside directors.
Journal of Finance 59, 2281-2308.

37
Table 1. Comparison of the stock price reaction to the outcome of close-call shareholder proposals 1996 to 2004 This table contains average abnormal returns on the vote outcome (annual meeting) date for ‘close-call’ shareholder proposals that receive vote support between 45% and 55% that we identify from the IRRC (RiskMetrics) database. We include all corporate governance proposals with vote outcomes in this range. We estimate market model parameters in the two hundred-day period ending 50 days prior to the announcement, using the value-weighted CRSP index as a proxy for the market. We report average cumulative abnormal returns (CARs) in the two-days around the annual shareholder meeting when the vote outcome was revealed. Median CARs are in parentheses and the percentage of CARs that are positive are in square brackets. The last column contains the mean difference between passed and failed proposals by sponsor type, and ***, **, and * indicate statistical significance using a two-tailed test.
Passed Proposals 55%>vote>50%
CAR (-1,0)
Failed Proposals 50%>vote>45%
CAR (-1,0)
Sponsor Type
Mean (Median)
[% Positive]
N
Mean (Median)
[% Positive]
N
Difference (and t-test
significance)
Union pension fund -0.38%
(-0.34%) [44.4%]
45 0.67%
(0.25%) [54.9%]
51
-1.06%*
Public pension fund 2.08%
(1.99%) [77.8%]
9 -1.35%
(-1.30%) [36.4%]
11
3.43%**
Other 0.25%
(-0.08%) [50.0%]
54 0.27%
(0.01%) [48.5%]
101
-0.02%

38
Table 2. Majority vote shareholder proposals (1996-2004) Panel A. Compliance rates and votes in favor by sponsor type, proposal topic, year of vote, whether repeat proposal This table reports the frequency of majority vote shareholder proposals, defined as a Rule 14a-8 proposal where the percentage of votes cast is greater than or equal to 50%. We obtain data on majority vote proposals from the Council of Institutional Investors annual list and the IRRC (now RiskMetrics) shareholder proposal database. Proposal sponsors are classified as either a labor union pension fund, public pension fund, or other. The Other sponsor type includes individuals and private investor groups. Proposal topic includes 1) remove or vote on poison pill, 2) remove or vote on the staggered board, 3) other anti-takeover topic (includes vote on golden parachutes, eliminate supermajority voting, restore shareholders rights to a special meeting) 4) expense stock options at time of grant 5) Other (e.g., confidential voting, majority of independent directors on board). A majority vote proposal is categorized as full compliance if the board fully complies with the request of the proposal before the next annual meeting, and is categorized as compromise if the board takes a significant action, but falls short of what the activist requested. Most of these cases involve poison pills where the company agrees to let the poison pill expire, but reserves the right to adopt a new one in the future without shareholder consent. % vote support is the percentage of votes cast in favor of the proposal. Sponsor ownership % is the percentage of shares outstanding of the target firm owned by the proposal sponsor(s). The number of shares owned by the proposal sponsor is disclosed along with the sponsor’s statement in support of the proposal in the proxy statement. 416 out of the 610 proposals disclose share ownership information. The others state that this information is available to those requesting it from the company. Our data source contains information when the proposal sponsor name is missing from the proxy, but does not have the missing ownership information. The ownership means below are based on 416 proposals with available information. A firm is categorized as Unionized if any of its employees belong to a union as reported in the 10-K in the year prior to the annual meeting. F-7 filings are used to supplement information from the 10-k when union information is missing. We supplement unionization data we received from Ertimur et al (2011), using the definitions and procedure outlined in their Appendix 5. ***, **, * indicate the results of a two-sided t-test for differences in means of targets in a particular column to that of targets in all other columns within the same grouping (e.g., mean full compliance rate of targets of union pension fund sponsors relative to that of all targets of other sponsor types).
Sponsor Type
Proposal Topic
Year of vote
Receives majority vote
proposal All Union
pension fund
Public pension
fund
Other
Poison pill
Staggered board
Other anti-
takeover
Expense stock
options
Other 1996 -2000
2001 -2004
Once More than once
Number of proposals 610 199 46 365 210 233 78 55 34 188 422 415 195
Number full compliance 108 42 12 53 26 32 32 6 11 28 79 82 25
Number full compliance
or compromise 138 47 12 79 56 32 33 6 11 29 109 96 42
% full compliance 17.7% 21.1%* 26.1% 14.5%*** 12.6%** 13.7%** 41.0%*** 10.9% 34.4%** 14.9% 18.7% 19.8%** 12.8%
% Vote support 63.5% 61.9%*** 65.2% 64.2%** 65.6%*** 63.4% 61.7%* 58.4%*** 63.0% 61.6% 64.3%** 62.1%*** 66.4%
Sponsor Ownership % 0.26% 0.01%** 0.51% 0.39%*
0.65%*** 0.10%** 0.01% 0.00% 0.54%
0.41% 0.20%
0.38%** 0.02%
Unionized firm % 69.5% 63.3%** 52.2%*** 75.1%*** 71.0% 73.8%* 74.4% 43.6%*** 61.8% 66.0% 71.1%***
65.8%*** 77.4%

39
Table 2. Majority vote shareholder proposals (1996-2004) (continued) Panel B. Number of majority vote proposals by sponsor type, proposal topic, year of vote, and repeat proposals
Sponsor Type
Proposal Topic
Year of vote
Received majority vote
proposal Poison
pill Staggered
board Other anti-
takeover
Expense stock
options
Other 1996 -2000
2001 -2004
Once More than once
Union pension fund 58 50 28 52 11 66 133 157 42
Public pension fund 2 37 4 0 3 24 22 39 7
Other 150 146 46 3 20 98 267 219 146

40
Table 3. Predicting board compliance with majority vote shareholder proposals This table primarily uses the same variables defined in Table 2. In Panel A, the compliance rate is the percentage of boards at proposal firms in various sub-categories that fully comply with the activists’ requests as outlined in the majority vote shareholder proposals. “Dual role” unionized firms indicate cases where the proposal sponsor is a union pension fund that represents some or all of the employees in collective bargaining negotiations at the proposal target firm. We consider a proposal that is sponsored by the AFL-CIO or one of its member unions to be a dual role proposal if the target firm has an employee collective bargaining agreement with one of AFL-CIO’s member unions. We consider the proposal sponsor Longview Fund to be affiliated with the UNITE union based on information from their website. We obtain information on the specific unions at proposal firms from either the 10-k filing on EDGAR or F-7 filings reported on the U.S. Department of Federal Mediation and Conciliatory Service (FMCS) website. In the probit regressions of Panel B, all variables are indicator variables except the continuous variables percentage vote support (votes in favor as a percentage of votes cast), prior 1-year market-adjusted return, and sponsor ownership. The prior 1-year market adjusted returns are the compounded monthly returns for the firm for the 12 months ending the December before the annual meeting year less the compounded monthly returns for CRSP's value-weighted market index for the corresponding period. Panel A. Univariate analysis of compliance rates
Mean [N]
Mean [N]
Mean [N]
Mean [N]
All proposals
Union pension-sponsor
Public pension-sponsor
Other
sponsor
Unionized firms 18.2% [423]
29.4%***
[126] 16.7% [24]
13.2% [273]
Non-unionized firms 16.4% [183]
7.1% [70]
36.4% [22]
18.7% [91]
Dual role unionized firms 33.7%***
[101] 33.7%***
[101] N/A N/A
Non-dual role firms
14.5% [505]
8.4% [95]
Unionized firms:
Dual role unionized firms 33.7%***
[101] 33.7%**
[101] N/A N/A
Non-dual role unionized firms 13.4% [322]
12.0% [25]

41
Table 3. Predicting board compliance with majority vote shareholder proposals (continued) Panel B. Probit analysis of compliance board compliance with majority vote shareholder proposals (1) (2) (3) (4) (5) (6) (7) Compliance
=1 Compliance
=1 Compliance
=1 Compliance
=1 Compliance
=1 Compliance
=1 Compliance
=1 Constant -2.96*** -2.70*** -2.41*** -1.53** -2.77*** -2.45*** -1.58** (0.000) (0.000) (0.000) (0.027) (0.000) (0.000) (0.023)
% Vote support 0.02*** 0.02*** 0.03*** 0.02** 0.02*** 0.02*** 0.01* (0.002) (0.002) (0.000) (0.040) (0.004) (0.001) (0.077)
Sponsor ownership % 0.09** 0.10** (0.041) (0.032)
Prior 1-year market-adjusted return 0.05 0.13 0.06 -0.07 0.12 0.05 -0.09 (0.770) (0.461) (0.742) (0.762) (0.486) (0.777) (0.694)
Post-2000 proposal 0.19 0.23 0.17 0.27 0.19 0.13 0.26 (0.180) (0.114) (0.294) (0.139) (0.200) (0.396) (0.152)
First time MV proposal 0.36*** 0.39*** 0.32** 0.27 0.37*** 0.31** 0.24 (0.010) (0.006) (0.025) (0.143) (0.008) (0.033) (0.186)
Poison Pill -0.74*** -0.98*** -0.75*** -1.02*** (0.007) (0.008) (0.006) (0.005)
Staggered Board -0.64** -0.91** -0.66** -0.97*** (0.020) (0.010) (0.015) (0.006)
Other anti-takeover 0.19 0.09 0.17 0.05 (0.505) (0.804) (0.540) (0.890)
Expense stock options -0.77** -0.77* -0.81** -0.80* (0.032) (0.074) (0.023) (0.064)
Unionized firm 0.13 -0.25 -0.21 -0.34 (0.353) (0.184) (0.282) (0.151)

42
Union sponsor 0.28** -0.62** -0.48 -0.78** -0.31 -0.20 -0.58** (0.044) (0.032) (0.118) (0.019) (0.132) (0.388) (0.024)
Public pension fund sponsor 0.42* 0.49 0.49 0.43 0.39* 0.39 0.48* (0.076) (0.158) (0.172) (0.265) (0.097) (0.119) (0.084)
Unionized firm*Union sponsor 1.23*** 1.05*** 1.31*** (0.000) (0.002) (0.001)
Unionized firm*Public pension fund sponsor -0.33 -0.32 -0.13 (0.495) (0.516) (0.813)
Dual role*Union sponsor 0.95*** 0.80*** 1.16*** (0.000) (0.001) (0.000)
Observations 606 606 606 415 606 606 415 Pseudo R2 0.047 0.081 0.137 0.172 0.079 0.134 0.181

43
Table 4. Comparison of firm and governance characteristics for majority vote firms and control firms This table reports mean and median values of firm and governance characteristics in majority vote proposal firms and control firms. For each firm with a majority vote proposal we identify a sample of non-targeted firms with sales in the previous fiscal year within 25% of the target firm’s. We then retain the control firm with the smallest deviation score from the targeted firm in terms of size and prior 1-year market-adjusted stock return performance. The firm characteristics are from Compustat as measured in the fiscal year-end prior to the annual meeting. The prior 1-year market adjusted returns are the compounded monthly returns for the firm for the 12 months ending the December before the annual meeting year less the compounded monthly returns for CRSP's value-weighted market index for the corresponding period. Industry-adjusted OROA is operating income before depreciation divided by beginning period total assets, minus the median value for the same two-digit primary SIC industry. Institutional ownership is the number of outstanding shares owned by 13F institutions as reported in the SEC 13F filing in the quarter prior to the annual meeting as a percentage of the total number of shares outstanding reported for the same quarter by CRSP. The Governance Index is that reported by Gompers, Ishii, and Metrick (2003), where higher numbers indicate that more anti-takeover provisions are in place. We use the latest index available prior to the annual meeting of the annual meeting year based upon dates for which the indices were constructed. Insider ownership sums stock ownership of all of the firm’s board members, using data from the IRRC director database. Board size and the percentage of inside directors are measured the annual meeting year using the IRRC director database. Staggered board and poison pill existence is taken from the IRRC corporate governance database. The table reports the p-values of tests for differences in means and medians between the majority vote firms with matching control firms. ***, **, * (a, b, c) represent significantly different from zero means (medians) at the 1%, 5%, and 10% level.
Majority vote proposal firms
Control firms
p-values
Mean (Median)
N
Mean (Median)
N
t-test (medians
test)
Prior sales ($M) 12,786.4 (7,422.2)
493 12,105.8 (7,395.4)
493 .44
(.61)
Total assets ($M) 26,198.0 (8,833.8)
493 25,830.9 (8,063.4)
493 .94
(.80)
Prior 1-year market-adjusted return (%) -0.7
(-3.0) 493
-0.6 (-4.0)
493 .94
(.76)
Market value of equity ($M)
16,418.3 (6,323.3)
486 18,175.2 (6,147.7)
493 .39
(.80)
Prior industry-adjusted OROA (%)
5.0**
(2.6) 482
6.6 (3.2)
485 .02
(.04)
Board size 10.7 (11)
493 10.9 (11)
493 .21
(.17)
Percentage of independent directors (%)
74.4***
(76.9) 493
68.5 (71.4)
493 .00
(.00)
Institutional ownership (%)
65.9***
(66.4) 491
62.8 (63.7)
493 .00
(.01)

44
Insider ownership (%) 2.5***
(0) 428
8.3 (1.1)
447 .00
(.00)
Governance index
10.5***
(11) 483
9.7 (10)
478 .00
(.00)
% of firms with:
Staggered boards 78.5***
(100) 483
58.4 (100)
478 .00
(.00)
Poison pills 70.2***
(100) 483
56.3 (100)
478 0.00 (.00)
CEO is also Chairman 85.4***
(100) 493
74.2 (100)
493 .00
(.00)

45
Table 5. Univariate analysis of director turnover and net change in external directorships The table reports two-sided t-test results for differences in means between sample and control firms, where ***, **, * indicate significance at the 1%, 5%.10%.
Director turnover # external
directorships
Net change in external board seats
(Year 0 to 1) (Year 0 to 2) (Year 0 to 3)
Year 0
(Year 0 to 1) (Year 0 to 2) (Year 0 to 3)
All majority vote proposal firms: 0.107 (N = 5288)
0.199 (N = 5070)
0.288 (N = 4824)
2.25 (N = 3710)
-0.201 (N = 3695)
-0.409 (N = 3687)
-0.581 (N = 3676)
All controls: 0.098 (N = 5434)
0.193 (N = 5274)
0.284 (N = 5033)
2.24 (N = 3586)
-0.199 (N = 3576)
-0.399 (N = 3566)
-0.564 (N = 3553)
Union sponsored (compliance):
0.149 (N = 382)
0.247 (N = 361)
0.358*
(N = 335) 2.18
(N = 266) -0.291
(N = 265) -0.515
(N = 264) -0.749*
(N = 263)
Controls: 0.129 (N = 412)
0.240 (N = 412)
0.303 (N = 400)
2.24 (N = 272)
-0.199 (N = 271)
-0.379 (N = 269)
-0.569 (N = 269)
Union sponsored (board ignores):
0.098 (N = 1269)
0.189 (N = 1208)
0.273 (N = 1131)
2.17 (N = 924)
-0.169 (N = 918)
-0.357 (N = 916)
-0.475 (N = 913)
Controls: 0.104 (N = 1728)
0.204 (N = 1690)
0.281 (N = 1609)
2.19 (N = 1138)
-0.209 (N = 1137)
-0.373 (N = 1133)
-0.518 (N = 1130)
Public pension fund sponsored (compliance):
0.092 (N = 87)
0.241 (N = 79)
0.328 (N = 64)
2.43 (N = 58)
0.155*
(N = 58) -0.069
(N = 58) -0.534
(N = 58)
Controls: 0.066 (N = 91)
0.144 (N = 90)
0.357 (N = 84)
1.96 (N = 51)
-0.098 (N = 51)
-0.255 (N = 51)
-0.333 (N = 51)
Public pension fund sponsored (board ignores):
0.121 (N = 256)
0.198 (N = 252)
0.272* (N = 246)
2.40***
(N = 174) -0.266**
(N = 173) -0.465
(N = 172) -0.791***
(N = 172)
Controls: 0.117 (N = 351)
0.199 (N = 337)
0.346(N = 324)
1.93 (N = 207)
-0.092 (N = 207)
-0.353 (N = 207)
-0.473 (N = 207)
Other sponsored (compliance):
0.100 (N = 488)
0.189 (N = 481)
0.283 (N = 445)
2.18 (N = 314)
-0.208 (N = 312)
-0.309**
(N = 311) -0.392*
(N = 311)
Controls: 0.091 (N = 496)
0.213 (N = 483)
0.299 (N = 469)
2.12 (N = 317)
-0.256 (N = 317)
-0.483 (N = 315)
-0.561 (N = 312)
Other sponsored (board ignores):
0.106 (N = 2786)
0.196 (N = 2681)
0.286 (N = 2595)
2.29 (N = 1958)
-0.208 (N = 1953)
-0.441 (N = 1950)
-0.621 (N = 1943)
Controls: 0.093 (N = 3334)
0.187 (N = 3226)
0.279 (N = 3079)
2.29 (N = 2231)
-0.203 (N = 2222)
-0.419 (N = 2216)
-0.595 (N = 2206)

46
Table 6. Predicting outside director turnover This table contains probit regression estimates of the probability of incumbent outside director turnover at a majority vote proposal firm or control firm within one year or within three years of year 0 (annual meeting where proposal received a majority of vote support). This analysis is at the level of individual incumbent directors that the firm’s proxy statement identifies as board members or nominees in the year of the majority vote proposal. We use the IRRC director database, supplemented by the firm’s proxy statement, to identify which directors remain on the firm’s board at the next annual meeting. Director characteristics are from the IRRC database as of year 0. The market-adjusted returns are the one-year or three-year compounded monthly returns for the firm beginning in March of year 0 less the compounded monthly returns for CRSP's value-weighted market index for the corresponding period. The variable ‘the appointing CEO is no longer in office’ is equal to one if director tenure is greater than CEO tenure for the CEO in office in year 0. CEO departs before next annual meeting is equal to one if the CEO is no longer in office at the next annual meeting, and we find a press announcement within one year of the annual meeting indicating a CEO departure. Directors on the boards of firms that are acquired or bankrupt, or who die before the next annual meeting, are treated as missing in the analysis. P-values, reflecting robust standard errors corrected for firm-level clustering, are in parentheses. ***, **, * indicate significance at the 1%, 5%, and 10% levels. Director Turnover Director Turnover (0 to +1) (0 to +1) (0 to +1) (0 to +3) (0 to +3) (0 to +3) (1) (2) (3) (4) (5) (6) Constant -1.70*** -1.70*** -1.70*** -1.17*** -1.16*** -1.17*** (0.000) (0.000) (0.000) (0.000) (0.000) (0.000)
Director age 65 to 69 0.34*** 0.34*** 0.34*** 0.66*** 0.67*** 0.66*** (0.000) (0.000) (0.000) (0.000) (0.000) (0.000)
Director age >= 70 1.08*** 1.09*** 1.08*** 1.47*** 1.47*** 1.47*** (0.000) (0.000) (0.000) (0.000) (0.000) (0.000)
Director tenure -0.00 -0.00 -0.00 -0.01* -0.01* -0.01* (0.702) (0.732) (0.731) (0.092) (0.100) (0.097)
Number of external directorships -0.02 -0.02 -0.02 -0.01 -0.01 -0.01 (0.214) (0.223) (0.214) (0.260) (0.265) (0.260)
Director is gray 0.08 0.08 0.08 0.20*** 0.20*** 0.20*** (0.234) (0.239) (0.246) (0.001) (0.001) (0.001)
Appointing CEO is no longer in office 0.11* 0.10* 0.10* 0.15*** 0.15*** 0.15*** (0.051) (0.060) (0.053) (0.001) (0.001) (0.001)
CEO departs before next annual meeting 0.21** 0.21** 0.20** 0.23*** 0.23*** 0.23*** (0.011) (0.012) (0.012) (0.000) (0.000) (0.000)
Director is female -0.03 -0.03 -0.03 0.00 0.00 0.00

47
(0.632) (0.638) (0.637) (0.981) (0.986) (0.983)
Director is on compensation committee -0.09* -0.09* -0.09* -0.06 -0.06 -0.06 (0.060) (0.063) (0.064) (0.123) (0.132) (0.128)
Director is on audit committee -0.18*** -0.18*** -0.18*** -0.17*** -0.17*** -0.17*** (0.000) (0.000) (0.000) (0.000) (0.000) (0.000)
Director is on nominating committee -0.10** -0.10** -0.10** -0.09** -0.09** -0.09** (0.029) (0.027) (0.028) (0.010) (0.011) (0.011)
Director chairs a committee -0.14*** -0.14*** -0.14*** -0.03 -0.03 -0.03 (0.008) (0.008) (0.008) (0.434) (0.439) (0.431)
Market capitalization, year -1 0.03* 0.03* 0.03* 0.03* 0.03* 0.03* (0.083) (0.097) (0.093) (0.058) (0.074) (0.066)
Leverage, year -1 -0.05 -0.00 -0.01 0.21 0.27 0.24 (0.790) (0.998) (0.939) (0.228) (0.134) (0.182)
Market-adjusted stock return, year 0 to +1 0.03 0.03 0.03 (0.611) (0.661) (0.638)
Market-adjusted stock return, year 0 to +3 -0.07** -0.07** -0.07** (0.014) (0.012) (0.014)
Market-adjusted stock return, year -1 to 0 -0.06 -0.06 -0.06 -0.09 -0.10 -0.10 (0.436) (0.384) (0.399) (0.156) (0.124) (0.138)
Change in institutional ownership, -2 to 0 0.11 0.11 0.12 0.07 0.07 0.07 (0.661) (0.673) (0.634) (0.789) (0.807) (0.783)
Union sponsor * compliance 0.19** 0.40*** 0.31*** 0.18* 0.52*** 0.35* (0.037) (0.000) (0.003) (0.093) (0.002) (0.065)
Unionized * Union sponsor * compliance -0.25* -0.42** (0.055) (0.036) Dual role * Union sponsor * compliance -0.15 -0.22 (0.302) (0.317) Union sponsor * ignore 0.06 0.15 0.12 0.07 0.16* 0.11

48
(0.377) (0.131) (0.166) (0.269) (0.070) (0.202)
Unionized * Union sponsor * ignore -0.16 -0.17 (0.197) (0.156)
Dual role * Union sponsor * ignore -0.14 -0.08 (0.235) (0.490)
Public pension sponsor * compliance -0.05 -0.06 -0.06 0.06 0.06 0.06 (0.816) (0.793) (0.805) (0.711) (0.746) (0.725)
Public pension sponsor * ignore 0.12 0.11 0.12 0.01 0.01 0.01 (0.369) (0.379) (0.375) (0.927) (0.959) (0.941)
Other sponsor * compliance 0.04 0.04 0.04 0.02 0.02 0.02 (0.730) (0.726) (0.728) (0.854) (0.847) (0.852)
Other sponsor * ignore 0.05 0.05 0.05 0.03 0.03 0.03 (0.408) (0.406) (0.410) (0.560) (0.558) (0.560)
Observations 9910 9910 9910 9127 9127 9127 Pseudo R2 0.086 0.087 0.087 0.117 0.117 0.117 p-values in parentheses * p < 0.10, ** p < 0.05, *** p < 0.01

49
Table 7. Regression analysis of the net change in other public company directorships of outside directors following a majority vote proposal This table contains estimates from an OLS regression of the change in external public company directorships from year 0 to year +1 or year 0 to year +3 for a sample of outside directors for target firms with a majority vote proposal and control firms using the same sample of directors as in the earlier tables. Director characteristics are measured in year 0 and are from the IRRC director database, or if missing, from proxy statements. Directors of firms that are acquired or bankrupt are included. Directors who die before the next annual meeting are set to missing. P-values, reflecting robust standard errors corrected for firm-level clustering, are in parentheses. ***, **, * indicate significance at the 1%, 5%, and 10% levels. Net Change in Directorships Net Change in Directorships (1) (2) (3) (4) (5) (6) (0 to +1) (0 to +1) (0 to +1) (0 to +3) (0 to +3) (0 to +3)Constant 0.18* 0.18* 0.18* 0.42*** 0.43*** 0.44*** (0.057) (0.061) (0.060) (0.004) (0.004) (0.003)
Director age 65 to 69 -0.11*** -0.11*** -0.11*** -0.51*** -0.50*** -0.50*** (0.000) (0.000) (0.000) (0.000) (0.000) (0.000)
Director age >= 70 -0.39*** -0.39*** -0.39*** -0.74*** -0.74*** -0.74*** (0.000) (0.000) (0.000) (0.000) (0.000) (0.000)
Director tenure -0.00 -0.00 -0.00 -0.00 -0.00 -0.00 (0.454) (0.453) (0.445) (0.397) (0.401) (0.397)
Number of external directorships -0.13*** -0.13*** -0.13*** -0.36*** -0.36*** -0.36*** (0.000) (0.000) (0.000) (0.000) (0.000) (0.000)
Director is gray 0.04 0.04 0.04 -0.08* -0.08* -0.08* (0.344) (0.344) (0.340) (0.081) (0.081) (0.080)
Director is female 0.01 0.01 0.01 -0.01 -0.01 -0.01 (0.700) (0.704) (0.706) (0.818) (0.826) (0.806)
Director is on compensation committee 0.06*** 0.06*** 0.06*** 0.04 0.04 0.04 (0.007) (0.007) (0.007) (0.233) (0.230) (0.258)
Director is on audit committee 0.06*** 0.06*** 0.06*** 0.12*** 0.12*** 0.12*** (0.006) (0.007) (0.007) (0.000) (0.000) (0.000)

50
Director is on nominating committee 0.03 0.03 0.03 0.02 0.02 0.02 (0.219) (0.226) (0.223) (0.583) (0.564) (0.559)
Director chairs a committee -0.03 -0.03 -0.03 -0.04 -0.04 -0.04 (0.251) (0.251) (0.255) (0.278) (0.275) (0.277)
Market capitalization, year -1 -0.01 -0.01 -0.01 -0.00 -0.00 -0.00 (0.475) (0.495) (0.499) (0.839) (0.781) (0.776)
Leverage, year -1 -0.07 -0.07 -0.07 -0.18 -0.18 -0.19 (0.459) (0.491) (0.437) (0.204) (0.217) (0.181)
Market-adjusted stock return, year 0 to +1 -0.09*** -0.09*** -0.09*** (0.006) (0.006) (0.006)
Market-adjusted stock return, year 0 to +3 -0.01 -0.01 -0.01 (0.699) (0.684) (0.679)
Market-adjusted stock return, year -1 to 0 -0.07* -0.07* -0.07* 0.03 0.03 0.03 (0.076) (0.075) (0.080) (0.627) (0.639) (0.610)
Union sponsor * compliance -0.08* -0.19** -0.14* -0.20* 0.09 0.07 (0.086) (0.037) (0.063) (0.070) (0.418) (0.433)
Unionized * Union sponsor * compliance 0.13 -0.35** (0.215) (0.030)
Dual role * Union sponsor * compliance 0.08 -0.35** (0.420) (0.024)
Union sponsor * ignore 0.01 0.03 0.01 0.03 0.00 -0.04 (0.733) (0.478) (0.868) (0.606) (0.954) (0.563)
Unionized * Union sponsor * ignore -0.04 0.04 (0.536) (0.652)
Dual role * Union sponsor * ignore 0.01 0.16* (0.828) (0.081)
Public pension sponsor * compliance 0.31** 0.31** 0.32** 0.07 0.07 0.07 (0.036) (0.036) (0.036) (0.649) (0.657) (0.655)

51
Public pension sponsor * ignore -0.07 -0.07 -0.07 -0.17 -0.18 -0.18 (0.282) (0.284) (0.286) (0.118) (0.114) (0.116)
Other sponsor * compliance -0.04 -0.04 -0.04 0.15** 0.15** 0.15** (0.432) (0.432) (0.432) (0.026) (0.026) (0.026)
Other sponsor * ignore -0.01 -0.01 -0.01 -0.05 -0.05 -0.05 (0.650) (0.650) (0.651) (0.222) (0.221) (0.222)
Observations 6978 6978 6978 6936 6936 6936 Adjusted R2 0.08 0.08 0.08 0.24 0.24 0.24 p-values in parentheses * p < 0.10, ** p < 0.05, *** p < 0.01

52
Table 8A. Analysis of director turnover, the net change in other public company directorships, and lost or gained directorships of outside directors for first time majority vote proposals including unionized interactions In this table we repeat earlier analysis after excluding repeat majority vote proposals. Column (1) is the same specification as Table 5, specification (3), and column (2) is the same specification as Table 5, specification (6), except that here we exclude repeat majority vote proposals. Columns (3) and (4) are the analogous specifications to Table 6 column (3) and Table 6 column (6), respectively. Column (5) contains probit regression estimates of the probability that an outside director lost an external directorship within one year of the annual meeting of the majority vote proposal and column (6) contains the analogous estimates for directorships lost within three years of the annual meeting. Column (7) contains probit regression estimates of the probability that an outside director gained an external directorship within one year of the annual meeting of the majority vote proposal and column (8) contains the analogous estimates for directorships gained within three years of the annual meeting. P-values, reflecting robust standard errors corrected for firm-level clustering, are in parentheses. ***, **, * indicate significance at the 1%, 5%, and 10% levels. Director turnover Net Change in the
number of directorships
Lost a directorship Gained a directorship
(0 to +1) (0 to +3) (0 to +1) (0 to +3) (0 to +1) (0 to +3) (0 to +1) (0 to +3)
(1) (2) (3) (4) (5) (6) (7) (8) Constant -1.79*** -1.33*** 0.20* 0.39** -1.24*** -0.69*** -0.81*** -0.43** (0.000) (0.000) (0.069) (0.024) (0.000) (0.000) (0.000) (0.046)
Director age 65 to 69 0.37*** 0.69*** -0.12*** -0.50*** 0.17*** 0.47*** -0.09 -0.42*** (0.000) (0.000) (0.001) (0.000) (0.004) (0.000) (0.248) (0.000)
Director age >= 70 1.08*** 1.48*** -0.39*** -0.76*** 0.54*** 0.68*** -0.35*** -0.73*** (0.000) (0.000) (0.000) (0.000) (0.000) (0.000) (0.007) (0.000)
Director tenure -0.00 -0.00 -0.00 -0.00 -0.00 0.00 -0.01* -0.01** (0.783) (0.241) (0.401) (0.143) (0.891) (0.487) (0.068) (0.012)
Number of external directorships -0.02 -0.02 -0.12*** -0.36*** 0.21*** 0.29*** -0.01 -0.13*** (0.297) (0.159) (0.000) (0.000) (0.000) (0.000) (0.512) (0.000)
Director is gray 0.08 0.15** 0.01 -0.07 0.01 0.08 0.02 -0.15* (0.298) (0.023) (0.763) (0.163) (0.871) (0.236) (0.823) (0.087)
Appointing CEO is no longer in office 0.08 0.14*** (0.229) (0.006)

53
CEO departs before next annual meeting 0.17* 0.20*** (0.070) (0.003)
Director is female -0.05 0.04 0.01 -0.06 -0.03 -0.01 -0.06 -0.17** (0.454) (0.532) (0.754) (0.188) (0.665) (0.928) (0.441) (0.021)
Director is on compensation committee -0.12** -0.07* 0.05* 0.04 -0.09* -0.06 0.05 0.04 (0.040) (0.096) (0.087) (0.283) (0.057) (0.165) (0.435) (0.478)
Director is on audit committee -0.12** -0.14*** 0.08*** 0.11*** -0.10** -0.09** 0.04 0.01 (0.011) (0.001) (0.003) (0.005) (0.041) (0.044) (0.495) (0.876)
Director is on nominating committee -0.02 -0.08* 0.05* 0.05 -0.05 -0.10** 0.00 0.04
(0.639) (0.066) (0.066) (0.193) (0.229) (0.025) (0.941) (0.414)
Director chairs a committee -0.20*** -0.07 -0.03 -0.03 0.03 0.01 -0.04 -0.02 (0.002) (0.157) (0.386) (0.446) (0.572) (0.790) (0.553) (0.714)
Market capitalization, year -1 0.04* 0.04** -0.01 0.00 0.01 -0.00 -0.02 -0.01 (0.090) (0.029) (0.379) (0.920) (0.623) (0.795) (0.268) (0.484)
Leverage, year -1 -0.12 0.39* -0.05 -0.12 0.04 0.10 -0.27 -0.23 (0.596) (0.061) (0.664) (0.440) (0.818) (0.575) (0.236) (0.268)
Market-adjusted stock return, year 0 to +1 0.04 -0.08** 0.08 -0.21***
(0.498) (0.024) (0.201) (0.003)
Market-adjusted stock return, year 0 to +3 -0.04 -0.01 -0.03 0.01 (0.191) (0.646) (0.319) (0.774)
Market-adjusted stock return, year -1 to 0 -0.13 -0.14* -0.13*** 0.01 0.09 -0.12* -0.34*** -0.07
(0.132) (0.061) (0.006) (0.907) (0.235) (0.078) (0.002) (0.385)
Change in institutional ownership, -2 to 0 0.05 0.07 (0.856) (0.822)
Union sponsor * compliance 0.44*** 0.54*** -0.19** 0.09 0.33*** -0.06 -0.50 0.14 (0.000) (0.001) (0.047) (0.435) (0.004) (0.665) (0.206) (0.345)
Unionized * Union sponsor * compliance -0.28** -0.45** 0.11 -0.37** -0.20 0.36** 0.33 -0.49** (0.027) (0.023) (0.336) (0.028) (0.188) (0.046) (0.440) (0.036)

54
Union sponsor * ignore 0.17 0.16* 0.01 0.02 0.06 0.12 0.16 0.16* (0.131) (0.091) (0.757) (0.821) (0.537) (0.124) (0.116) (0.081)
Unionized * Union sponsor * ignore -0.16 -0.12 -0.04 0.01 -0.03 -0.11 -0.13 -0.14 (0.258) (0.337) (0.513) (0.893) (0.817) (0.362) (0.353) (0.263)
Public pension sponsor * compliance 0.04 0.08 0.35** 0.11 -0.38 0.08 0.48 0.23** (0.886) (0.700) (0.038) (0.547) (0.170) (0.741) (0.115) (0.020)
Public pension sponsor * ignore 0.14 0.06 -0.12* -0.16 0.11 0.24* -0.33* -0.02 (0.345) (0.651) (0.075) (0.132) (0.378) (0.058) (0.075) (0.882)
Other sponsor * compliance 0.14 0.07 -0.03 0.16** 0.18** -0.07 0.21* 0.18 (0.298) (0.512) (0.643) (0.034) (0.037) (0.487) (0.093) (0.140)
Other sponsor * ignore 0.06 0.03 -0.03 -0.06 0.06 0.06 0.04 -0.02 (0.398) (0.628) (0.501) (0.328) (0.341) (0.381) (0.632) (0.791)
Observations 6584 6098 4562 4538 4562 4538 4562 4538 Pseudo R2 0.088 0.119 0.058 0.093 0.026 0.054 Adjusted R2 0.08 0.23 p-values in parentheses * p < 0.10, ** p < 0.05, *** p < 0.01

55
Table 8B. Analysis of director turnover, the net change in other public company directorships, and lost or gained directorships of outside directors for first time majority vote proposals including union dual role In this table we repeat earlier analysis after excluding repeat majority vote proposals. Column (1) is the same specification as Table 5, specification (3), and column (2) is the same specification as Table 5, specification (6), except that here we exclude repeat majority vote proposals. Columns (3) and (4) are the analogous specifications to Table 6 column (3) and Table 6 column (6), respectively. Column (5) contains probit regression estimates of the probability that an outside director lost an external directorship within one year of the annual meeting of the majority vote proposal and column (6) contains the analogous estimates for directorships lost within three years of the annual meeting. Column (7) contains probit regression estimates of the probability that an outside director gained an external directorship within one year of the annual meeting of the majority vote proposal and column (8) contains the analogous estimates for directorships gained within three years of the annual meeting. P-values, reflecting robust standard errors corrected for firm-level clustering, are in parentheses. ***, **, * indicate significance at the 1%, 5%, and 10% levels.
Director turnover Net Change in the number of
directorships
Lost a directorship Gained a directorship
(0 to +1) (0 to +3) (0 to +1) (0 to +3) (0 to +1) (0 to +3) (0 to +1) (0 to +3) (1) (2) (3) (4) (5) (6) (7) (8) Constant -1.80*** -1.33*** 0.20* 0.39** -1.24*** -0.70*** -0.81*** -0.43** (0.000) (0.000) (0.067) (0.022) (0.000) (0.000) (0.000) (0.047)
Director age 65 to 69 0.37*** 0.69*** -0.12*** -0.50*** 0.17*** 0.47*** -0.09 -0.42*** (0.000) (0.000) (0.001) (0.000) (0.004) (0.000) (0.243) (0.000)
Director age >= 70 1.08*** 1.48*** -0.39*** -0.76*** 0.54*** 0.68*** -0.35*** -0.73*** (0.000) (0.000) (0.000) (0.000) (0.000) (0.000) (0.007) (0.000)
Director tenure -0.00 -0.00 -0.00 -0.00 -0.00 0.00 -0.01* -0.01** (0.797) (0.244) (0.399) (0.143) (0.898) (0.470) (0.066) (0.012)
Number of external directorships -0.02 -0.02 -0.12*** -0.36*** 0.21*** 0.29*** -0.01 -0.14*** (0.289) (0.153) (0.000) (0.000) (0.000) (0.000) (0.497) (0.000)
Director is gray 0.07 0.15** 0.01 -0.08 0.01 0.08 0.02 -0.15* (0.313) (0.025) (0.763) (0.157) (0.870) (0.227) (0.805) (0.092)
Appointing CEO is no longer in office 0.08 0.15*** (0.204) (0.005)
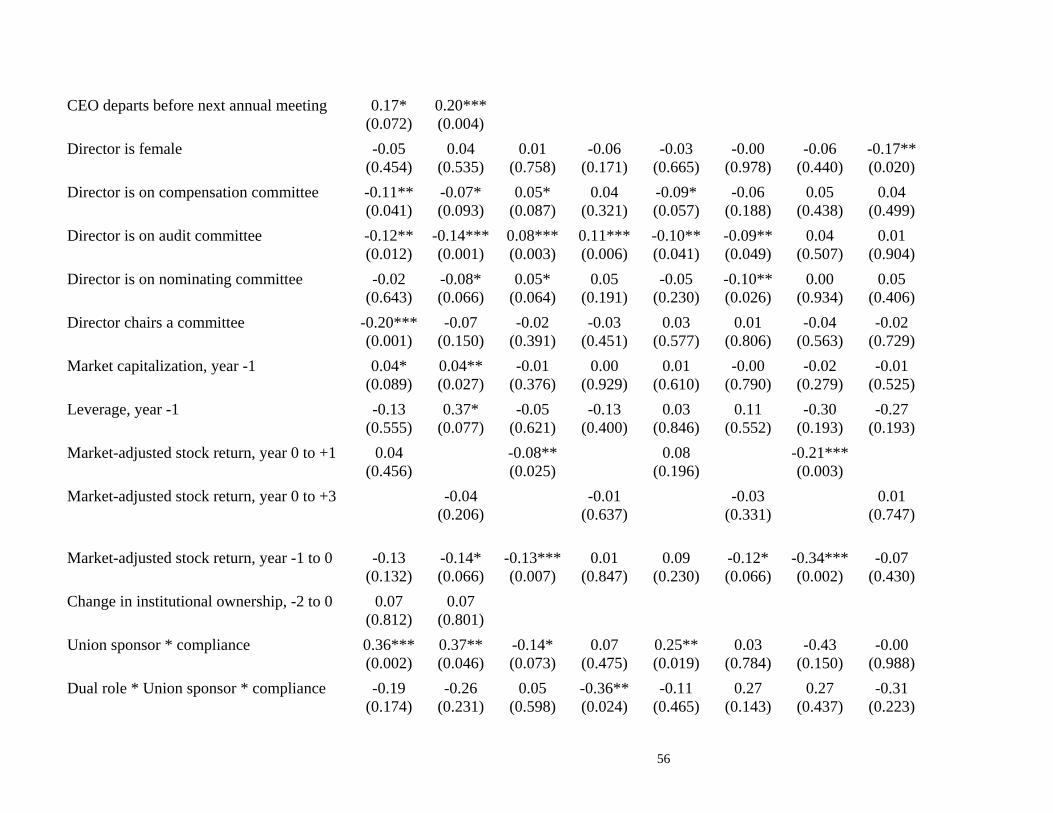
56
CEO departs before next annual meeting 0.17* 0.20*** (0.072) (0.004)
Director is female -0.05 0.04 0.01 -0.06 -0.03 -0.00 -0.06 -0.17** (0.454) (0.535) (0.758) (0.171) (0.665) (0.978) (0.440) (0.020)
Director is on compensation committee -0.11** -0.07* 0.05* 0.04 -0.09* -0.06 0.05 0.04 (0.041) (0.093) (0.087) (0.321) (0.057) (0.188) (0.438) (0.499)
Director is on audit committee -0.12** -0.14*** 0.08*** 0.11*** -0.10** -0.09** 0.04 0.01 (0.012) (0.001) (0.003) (0.006) (0.041) (0.049) (0.507) (0.904)
Director is on nominating committee -0.02 -0.08* 0.05* 0.05 -0.05 -0.10** 0.00 0.05 (0.643) (0.066) (0.064) (0.191) (0.230) (0.026) (0.934) (0.406)
Director chairs a committee -0.20*** -0.07 -0.02 -0.03 0.03 0.01 -0.04 -0.02 (0.001) (0.150) (0.391) (0.451) (0.577) (0.806) (0.563) (0.729)
Market capitalization, year -1 0.04* 0.04** -0.01 0.00 0.01 -0.00 -0.02 -0.01 (0.089) (0.027) (0.376) (0.929) (0.610) (0.790) (0.279) (0.525)
Leverage, year -1 -0.13 0.37* -0.05 -0.13 0.03 0.11 -0.30 -0.27 (0.555) (0.077) (0.621) (0.400) (0.846) (0.552) (0.193) (0.193)
Market-adjusted stock return, year 0 to +1 0.04 -0.08** 0.08 -0.21*** (0.456) (0.025) (0.196) (0.003)
Market-adjusted stock return, year 0 to +3 -0.04 -0.01 -0.03 0.01 (0.206) (0.637) (0.331) (0.747)
Market-adjusted stock return, year -1 to 0 -0.13 -0.14* -0.13*** 0.01 0.09 -0.12* -0.34*** -0.07 (0.132) (0.066) (0.007) (0.847) (0.230) (0.066) (0.002) (0.430)
Change in institutional ownership, -2 to 0 0.07 0.07 (0.812) (0.801)
Union sponsor * compliance 0.36*** 0.37** -0.14* 0.07 0.25** 0.03 -0.43 -0.00 (0.002) (0.046) (0.073) (0.475) (0.019) (0.784) (0.150) (0.988)
Dual role * Union sponsor * compliance -0.19 -0.26 0.05 -0.36** -0.11 0.27 0.27 -0.31 (0.174) (0.231) (0.598) (0.024) (0.465) (0.143) (0.437) (0.223)

57
Union sponsor * ignore 0.17* 0.14 -0.00 -0.03 0.06 0.16** 0.11 0.09 (0.097) (0.123) (0.962) (0.667) (0.516) (0.027) (0.208) (0.281)
Dual role * Union sponsor * ignore -0.20 -0.10 -0.01 0.15 -0.03 -0.24** -0.05 0.00 (0.162) (0.435) (0.872) (0.177) (0.809) (0.046) (0.742) (0.983)
Public pension sponsor * comply 0.04 0.08 0.35** 0.11 -0.38 0.08 0.48 0.23** (0.886) (0.700) (0.038) (0.547) (0.170) (0.741) (0.115) (0.020)
Public pension sponsor * ignore 0.14 0.06 -0.12* -0.16 0.11 0.24* -0.33* -0.02 (0.343) (0.635) (0.075) (0.131) (0.374) (0.058) (0.075) (0.902)
Other sponsor * compliance 0.14 0.07 -0.03 0.16** 0.18** -0.07 0.21* 0.18 (0.297) (0.512) (0.643) (0.034) (0.037) (0.486) (0.093) (0.138)
Other sponsor * ignore 0.06 0.03 -0.03 -0.06 0.06 0.06 0.04 -0.02 (0.401) (0.630) (0.501) (0.329) (0.340) (0.382) (0.632) (0.794)
Observations 6584 6098 4562 4538 4562 4538 4562 4538 Pseudo R2 0.088 0.119 0.058 0.093 0.026 0.053 Adjusted R2 0.08 0.24
p-values in parentheses * p < 0.10, ** p < 0.05, *** p < 0.01