Embed Size (px)
Citation preview
Research in International Business and Finance 26 (2012) 79– 96
Contents lists available at ScienceDirect
Research in International Businessand Finance
journal homepage: www.elsevier.com/locate/r ibaf
Do sovereign rating changes trigger spillover effects?
Emawtee Bissoondoyal-Bheenick ∗
Monash University, Accounting and Finance, Bld H, Level 3, 900 Dandenong Road, Caulfield East, VIC 3145, Australia
a r t i c l e i n f o
Article history:Received 24 May 2010Received in revised form 6 April 2011Accepted 4 July 2011
Available online 12 July 2011
JEL classification:G12G14G15
Keywords:Sovereign ratings changesSpillover effectsEvent studyStandard and PoorsMoody’s
a b s t r a c t
This paper examines whether changes in a particular country’ssovereign ratings provided by Standard and Poor’s and Moody’strigger a spillover effect on other countries. The analysis focuses ontwo sets of countries namely where there are trade links betweenthe countries and where there are links between the financial mar-kets of each country. The findings indicate that there are moresignificant results when the links in financial markets are analysedcompared to trade links. Moreover, the results are dependent onwhich rating is under analysis, that is, Standard and Poor’s LocalCurrency, Standard and Poor’s Foreign Currency, Moody’s BankDeposit or Moody’s bonds and notes. Finally, there does appear to bea contamination effect for both upgrades and downgrades amongthe countries.
© 2011 Elsevier B.V. All rights reserved.
1. Introduction
As the barriers to international capital flows come down and improved communications and tech-nology provides low-cost information about foreign securities, investors are realizing the enormouspotential of international investment. It has been very essential for market players and firms seek-ing foreign funds to assess all the risks associated with raising funds in international markets. Theformation of international portfolios requires a large number of inputs for an active investmentdecision. One of the key inputs that have been cited over the years are the credit ratings pro-vided by the rating agencies. Rating agencies provide an overall appraisal for the creditworthinessof each country. Ratings agencies are an integral part of modern capital markets. Their assessmenton sovereign and corporate entities has been used as benchmarks by governments and investors.
∗ Corresponding author. Tel.: +61 3 9925 5669; fax: +61 3 9925 5986.E-mail address: [email protected]
0275-5319/$ – see front matter © 2011 Elsevier B.V. All rights reserved.doi:10.1016/j.ribaf.2011.07.001

80 E. Bissoondoyal-Bheenick / Research in International Business and Finance 26 (2012) 79– 96
This is particularly the case of institutional investors who are bound to invest in investment gradeinstruments, which is usually above a rating of BBB- in the case of Standard and Poor’s and Baa3 forMoody’s.
One of the key services provided by the agencies is sovereign ratings, which is a crucial assess-ment tool for investors and businesses seeking information about the financial risks in developedand emerging markets worldwide. Sovereign ratings address the credit risks of national govern-ments, but not the specific default risks of other issuers. Rating agencies have been identified asbeing the culprits of various financial turmoil that we have seen over the past decades. It is thereforeessential to focus on whether a rating change of one particular country triggers a spillover effecton other economies’ stock market returns. The key research question in this paper is to addresswhether sovereign rating changes trigger spillover effects using both Moody’s and Standard andPoor’s data.
Moody’s and Standard and Poor’s have often been subject to controversy on the sovereign rat-ings that they provide. Some examples include the Mexican crisis (see Branston, 1995). In general,there is much disagreement on the low rated countries. The literature in the sovereign ratingsarea provides with analysis where both of the agencies are considered, (see Bissoondoyal-Bheenick,2004, where the focus is the differential impact of the ratings on the stock markets). This papertests for any potential spillovers following rating announcements as well as assess the own marketreaction.
Research on the effects of sovereign rating changes has flourished in the 1990s. Cantor and Packer(1996a,b) analyse the ratings assigned for 1 year, 1995, by the two rating agencies, Moody’s andStandard and Poor’s to 49 countries by using eight economic explanatory variables. Another line ofresearch undertaken by Cantor and Packer (1996a,b) and which was revisited by Reinsen and VonMaltzan (1999) is the study of the effect of sovereign ratings on emerging markets bond yields spreads.Evidence from both studies suggest that the rating agencies’ opinion affect market spreads, that is thereaction of bond yields to the announcement of changes in the agencies’ sovereign risk opinions arefollowed by bond yields movements in the expected direction.
The impact of sovereign rating changes on national stock markets is tested by Brooks et al. (2004).Their study reveals that rating downgrades have a wealth impact on stock markets, while ratingupgrades do not have an impact on the market. In addition, the results indicate that there is notan equal reaction to sovereign rating changes by rating agencies and multiple downgrades do notappear to impart an additional wealth effect on country markets. Kaminsky and Schmukler (2002)analyse the impact of sovereign rating changes and outlook on emerging markets. They find that ratingchanges not only have a direct impact on stock and bond markets of the countries being rated, butthey also contribute to cross-country contagion, particularly during crisis times and among neighborcountries.
Rating agencies have been subject to criticisms during the past decade particularly around thefinancial crises in the world markets. The rating agencies had harsh criticism following the currentcredit crunch, the East Asian crisis and before that in the case of the Mexican crisis in 1994–1995.Rating agencies have been criticized as being promoters of financial instability. The objective of thisstudy is to assess whether a change in the rating of one country impacts on the stock market ofanother country. Hence, the aim of the paper is to assess whether there are any spillover effects, witha particular focus as to whether there are spillover effects among countries that are linked on the basisof trade or on the basis of any financial links. The study equally assesses whether the results changeas different ratings are used, namely, Standard and Poor’s Local Currency, Standard and Poor’s ForeignCurrency, Moody’s Bank Deposit or Moody’s bonds and notes. The major contribution of this paper tothe sovereign rating as well as the contagion literature is to assess any spillover effects following arating change for countries, which have a close link. In addition, this study will extend previous workon the impact of sovereign rating changes on national stock markets by using ratings from Moody’sin terms of bonds and notes and bank deposit ratings with a view to test if different rating agenciesimpact differently on the market.
The plan of this paper is as follows. In Section 2, the data used in the study as well as the modelingframework are outlined. Section 3 presents the empirical results of the analysis, while the final sectioncontains some concluding remarks.
E. Bissoondoyal-Bheenick / Research in International Business and Finance 26 (2012) 79– 96 81
2. Data and modeling framework
2.1. Data
The sample consists of the ratings of the Asia Pacific Economic Cooperation (APEC) countries forthe period 1 January 1990 through to 31 December 2001. The choice of the sample captures the SouthEast Asian Crisis as well as reflecting data availability for this 12-year period. The set of countriesused include 17 markets from the APEC countries including: Australia, Canada, Chile, China, HongKong, Indonesia, Japan, Korea, Malaysia, Mexico, New Zealand, Peru, Philippines, Singapore, Thailand,Taiwan and USA. The focus of this study is on the Asian markets, but the paper makes use of APECcountries so as to include some developed countries in the analysis such as US and Australia which havea dominant influence on the Asian market. However, it should be noted that this paper is assessing thespillover over effects following sovereign rating change and US does not have a rating change, henceCanada, which is one of the APEC countries is also included the study. The rating industry countsthree major players, namely, Standard and Poor’s, Moody’s and Fitch, all originated in the USA. Theanalysis, however, centres on Standard and Poor’s and Moody’s. This is because Standard and Poor’sprovide ratings in terms of foreign currency as well as local currency and being the earliest provider ofratings, S&P has a well-established set of rating history. The distinction between local currency ratingsand foreign currency ratings is important given that sovereign governments default more frequentlyon foreign currency debt than on local currency debt. In each of the last 25 years, sovereign foreigncurrency default rates have exceeded sovereign local currency default rates by at least three times.Standard & Poor’s Ratings Services believes this relative performance is likely to hold in the future andthus often rates sovereign foreign currency obligations below local currency obligations.1 Moody’sprovide country ratings in terms of foreign currency as well as local currency for bank deposit andbonds and notes. In this study, due to data availability, foreign currency bank deposit and foreigncurrency bonds and notes are included.2 Thus, the study tries to assess changes in these four differentrating categories available from these two market leaders who cover some 80 percent of sovereigncredit ratings. Although the two agencies use different symbols in assessing ratings, every Moody’s’symbol has its counterpart in Standard and Poor’s. The difference between the two agencies is usuallyone to two notches.
In order to decide on the set of possible combinations of countries to assess potential spillovers,there are numerous possibilities. A starting point will be to consider the different pairs that could bemade out of these 17 countries. However the fundamental problem with this method is that we willend up with 136 different possible combinations and hence this is not a very feasible way to pro-ceed. Another possible suggestion is that we account for the different size and economic status of thecountries, given that a possible argument may be that if larger and developed countries have a ratingchange, this may trigger a more significant impact on other countries as compared to a rating changein a smaller and less developed country. However, given the key research question on this paper isto assess spillover effects, it is important to consider countries where the rating agencies have beenactively making changes. In the case of US for example, it has always been rated at AAA by Standardand Poor’s (Aaa- Moody’s) and hence if we want to identify potential spillovers, we cannot use the dis-tinction of size or how strong is the economy. Hence the set of countries that is the potential spilloversto be associated with a particular country have been based on two criteria, that is, by identifying thetrade links between the countries – bilateral import and export of greater than 5 percent of total trade– and by identifying financial links between the countries – a correlation coefficient of greater than20 percent between national stock market returns. Table 1 shows the number of countries that havebeen identified as potential spillover countries by each of these criteria for each of the four rating
1 For more information on the distinction between S&P foreign and local currency ratings, go to the websitewww.standardandPoor’s.com, under the under the Criteria and methodologies section. See also Brooks et al. (2004) for theuse of different types of sovereign ratings provided by the agencies.
2 For a clear explanation of the difference between these two ratings utilised in the study, refer to www.Moody’s.com underthe ratings definition section . Please note this requires a free registration to access.
82 E. Bissoondoyal-Bheenick / Research in International Business and Finance 26 (2012) 79– 96
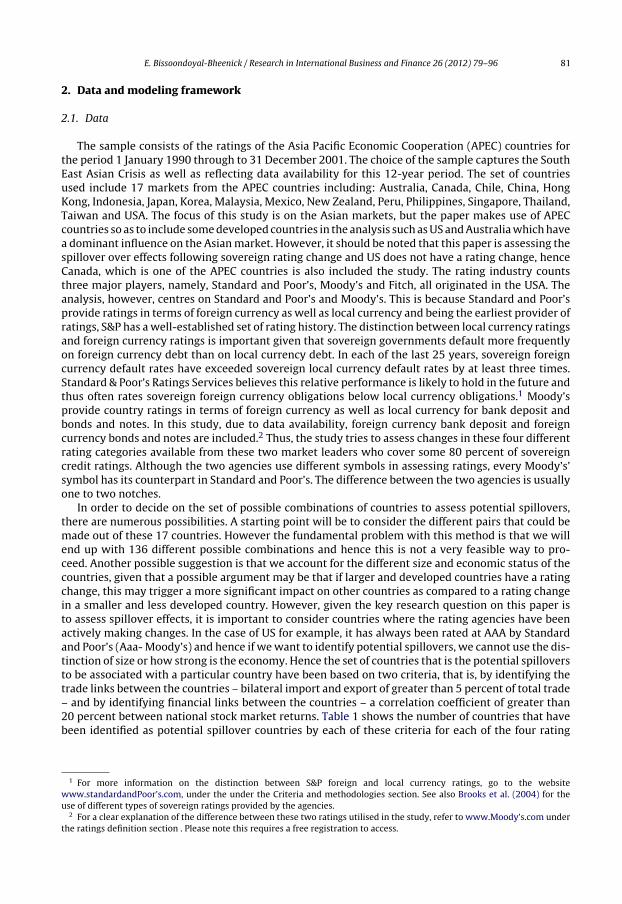
Table 1List of countries under analysis. This table shows the set of potential spillovers to be associated with each country in each study.The rating categories include Standard and Poor’s foreign currency rating (SPFC), Standard and Poor’s local currency rating(SPLC), Moody’s bank deposit ratings (MBN) and Moody’s bonds and notes rating (MBN). In the case of trade links, N/A impliesthat there is no or less than 5 percent trade between the countries, while in the case of financial links, it implies that there isno or less than 20 percent correlation between the financial markets of the countries.
Countries Trade links analysis Financial links analysis
SPFC SPLC MBD MBN SPFC SPLC MBD MBN
AustraliaCanada N/A N/A N/AChile N/A N/A N/AChina N/A N/A N/A N/AHong Kong N/A N/AIndonesiaJapanKoreaMalaysiaMexico N/ANew Zealand N/APeru N/A N/APhilippinesSingaporeThailandUSTaiwan N/A N/A N/A
Total no. of countries 15 15 13 12 16 14 16 16
categories, namely, Standard and Poor’s foreign currency ratings, Standard and Poor’s local currencyratings, Moody’s bonds and notes ratings and Moody’s bank deposit ratings.
Table 2 presents a summary of the rating activity across the two leading agencies. Panel A showsthe numbers for trade links while panel B shows the numbers for financial links for Standard and Poor’sForeign Currency Rating (SPFC), Standard and Poor’s Local Currency (SPLC), Moody’s Bank Deposits(MBD) and Moody’s bonds and notes (MBN) over the 12-year period 1990–2001. The financial linksinvolves a higher number of observations compared to the trade links. Daily market returns for each
Table 2Summary of rating activity for the 12-year period January 1990–December 2001. This table summarises the sovereign rat-ing activity across the two leading agencies: Standard and Poor’s and Moody’s. It shows the number of own upgrades, owndowngrades, other upgrades, and other downgrades for both the trade links and financial links study.
Number ofcountries
Number of ownupgrades
Number of owndowngrades
Number ofother upgrades
Number of otherdowngrades
Panel A: Trade linksStandard and Poor’s:
Foreign currency ratings 15 19 25 68 81Local currency ratings 15 6 26 30 75
Moody’s:Bank deposits 13 8 17 33 53Bonds and notes 12 13 13 38 38
Panel B: Financial linksStandard and Poor’s:
Foreign currency ratings 16 19 23 137 155Local currency ratings 14 6 24 53 149
Moody’s:Bank deposits 16 8 17 85 116Bonds and notes 16 14 13 110 99

E. Bissoondoyal-Bheenick / Research in International Business and Finance 26 (2012) 79– 96 83
country were collected from DataStream International. The DataStream World Index was used to proxyfor a world benchmark return.3
2.2. Modeling framework
The set of countries identified as potential spillovers for each country was determined using the5 percent trade link and 20 percent financial link benchmark. To determine the impact of ratingschanges of the set of countries on a particular country, that is, to test for spillover effects, an eventstudy methodology is used. Daily risk adjusted returns are derived from the conventional marketmodel:
ARit = Rit − (˛i + ˇi Rmt) (1)
where Rit is the return on market i at day t, Rmt is the corresponding return on the World Index at dayt, and ˛i and ˇi are the market model parameters obtained from an ordinary least squares regressions.
The market model parameters are based upon approximately 6 months of daily return observationsbeginning 120 days through to 21 days before the sovereign rating change. The event period rangesfrom 10 days before to 10 days after the rating change. Abnormal return test statistics are takenfrom Boehmer et al. (1991) and are estimated as follows: risk adjusted abnormal returns are firststandardised to give the ‘standardised abnormal return’ (SAR):
SARit = ARit
�̂i
√√√√1 + 1Ti
+ (Rmt − R̄m)2∑−21
E=−120(Rmt − R̄m)2
(2)
where �̂i is market i’s standard deviation of the risk adjusted abnormal share price return during theestimation period; Ti is the number of trading days in the estimation period of country i; and R̄m is theaverage world market return during the estimation period.
For each day in the event period, the cross-sectional standard deviation of the standardised abnor-mal returns is then calculated. This can be written as:
�SARt =
√√√√√√∑Ni=1
(SARit −
N∑i=1
SARit/N
)2
N(N − 1)(3)
The standardised cross-sectional test statistic is thus:
Z =∑N
i=1SARit/N
�SARt
(4)
The individual standardised abnormal returns are assumed to be cross-sectionally independent anddistributed normally. By the Lindberg-Levy and Lindberg-Feller central limit theorems (Greene, 2000),the distribution of the sample average standardised abnormal returns will converge to normality.
3. Results
3.1. Trade link analysis
3.1.1. Standard and Poor’s foreign and local currency rating changesAn event study is carried out to capture whether changes in sovereign ratings impact on a particular
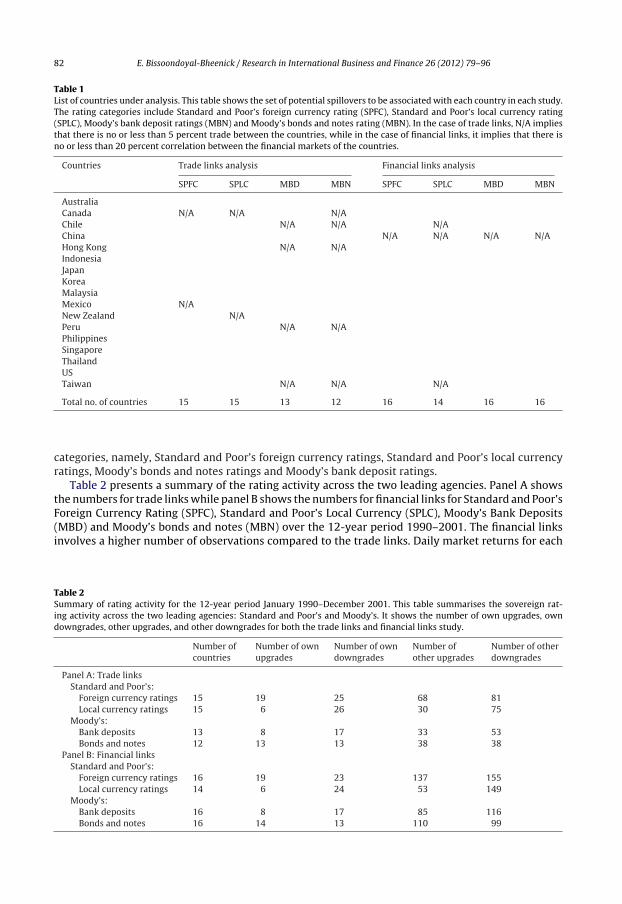
country’s market. Table 3 reports the market reaction to Standard and Poor’s foreign currency rating
3 The use of DataStream return indices with the world index as being the market return has been used in previous studies(see for example, Brooks et al., 2004). The correlation coefficient between the return index for each country and the world indexvaries from −0.1 to 0.8.
84E.
Bissoondoyal-Bheenick /
Research
in International
Business and
Finance 26 (2012) 79– 96
Table 3Market reaction to S&P foreign currency sovereign rating changes – trade link analysis. This table reports standardised average abnormal returns (SARs) and cumulative abnormal returns(CAR) as measures of the own-market reaction as well as the foreign-market reaction to Standard & Poor’s (S&P) foreign currency rating changes under the trade links category. AAR aregenerated using a standard mean adjusted event study methodology. A rating change occurs when S&P announces a rating change.
Event day Own upgrade n = 19 Own downgrade n = 25 Other upgrade n = 68 Other downgrade n = 81
SAR CAR t-Stat SAR CAR t-Stat SAR CAR t-Stat SAR CAR t-Stat
−10 −0.2734 −0.2734 −1.05 −0.6042 −0.6042 −1.60 −0.3970 −0.3970 −0.65 0.1751 0.1751 0.37−9 −0.2825 −0.5559 −1.12 0.2118 −0.3923 0.96 0.3890 −0.0080 1.53 0.3116 0.4866 1.06−8 0.0439 −0.5120 0.24 0.0764 −0.3159 0.18 0.0800 0.0720 0.63 0.3790 0.8656 1.33−7 0.2351 −0.2769 1.07 0.2859 −0.0300 0.77 0.2939 0.3660 1.60 0.1688 1.0344 0.57−6 −0.0500 −0.3269 −0.16 0.3692 0.3392 0.82 −0.0076 0.3584 −0.04 0.5444 1.5788 0.87−5 −0.0429 −0.3698 −0.18 −0.0528 0.2864 −0.12 0.4950 0.8534 1.68 0.2570 1.8358 0.72−4 0.2672 −0.1026 1.37 0.4838 0.7702 1.51 −0.1820 0.6714 −1.34 −0.1655 1.6703 −0.26−3 0.1890 0.0864 0.82 −0.2610 0.5092 −2.29** −0.6504 0.0210 −1.24 0.6653 2.3355 1.97**
−2 0.1052 0.1916 0.47 0.2252 0.7345 0.87 −0.1519 −0.1309 −1.27 0.4417 2.7773 1.68*
−1 0.1645 0.3561 1.01 −0.1631 0.5714 −0.43 0.2888 0.1579 1.23 0.1134 2.8907 0.25
0 0.4359 0.7919 1.68* −0.4929 0.0784 −1.72* −0.4699 −0.3120 −1.44 −0.4867 2.4040 −0.81
1 0.1558 0.9478 0.56 −0.1996 −0.1212 −1.06 0.1868 −0.1251 0.98 0.4628 2.8668 1.692 0.1544 1.1022 0.82 0.1675 0.0464 0.39 −0.2313 −0.3565 −1.07 0.0863 2.9531 0.213 0.2458 1.3480 1.22 0.1309 0.1773 1.26 −0.5513 −0.9078 −0.93 0.2325 3.1856 0.894 −0.0616 1.2864 −0.33 0.2633 0.4406 1.09 0.1963 −0.7114 1.36 0.0915 3.2771 0.445 0.0526 1.3391 0.21 0.0152 0.4558 0.16 0.3916 −0.3198 1.18 0.4379 3.7150 1.556 −0.1581 1.1810 −0.88 −0.1716 0.2843 −0.51 0.4268 0.1070 0.94 0.4778 4.1928 1.66*
7 −0.2802 0.9008 −1.35 0.7400 1.0242 2.46** 0.2390 0.3459 0.68 0.4044 4.5973 1.568 0.0828 0.9836 0.41 0.1412 1.1654 0.45 0.1358 0.4817 0.84 0.3055 4.9028 2.02**
9 0.2419 1.2256 0.92 −0.0355 1.1299 −0.06 0.0815 0.5632 0.46 −0.1204 4.7823 −0.4910 −0.0865 1.1391 −0.51 −0.3043 0.8256 −1.18 −0.6470 −0.0838 −1.12 0.4891 5.2714 1.37
* Statistical significance at 10% level.** Statistical significance at 5% level.

E. Bissoondoyal-Bheenick / Research in International Business and Finance 26 (2012) 79– 96 85
changes for the trade link analysis. The number of domestic-country rating changes examined is 44for 15 countries (19 upgrades and 25 downgrades). While for the foreign-country rating changes thenumber increases to 149 events (68 other upgrades and 81 other downgrades). The first two panels ofTable 3 (own upgrade and own downgrade) reports the impact of sovereign rating changes of a countryon its own market. It aggregates the results of the 15 countries, which are taken into considerationfor SPFC under the trade link category. The last two panels of the table (other upgrade and otherdowngrade) indicate the results of the potential spillovers associated with each country. While thetest has been undertaken for each set of countries, the results reported considers the impact of upgradeand downgrade on an average basis for the 15 countries. The analysis of own-market impact is similarto those documented by previous research, namely, that upgrades do not have a great wealth impactwhile downgrades do reveal some impact. Table 3 indicates that prior to the rating downgrades, marketreturns are not significantly worse or better than in other periods. However, on the announcementday, the standardised average abnormal returns (SAR) are significantly negative at −4.92% (which isa corresponding – 1.05% average abnormal return4 (AAR) – 1 day return). Following the downgradein sovereign rating, the market reverts to normal with returns similar to prior periods. For the ratingupgrades, the impact of a change is not significant except on the announcement day.
Considering the foreign-country effect, that is, the spillover effect, it does appear that rating down-grades do have an impact on other markets. Over a 3 days event window, the returns are statisticallysignificantly on days prior and after the announcement day. However, it should be noted that contraryto expectations, the average standardised abnormal returns are positive following the rating down-grades. In contrast, for foreign-country upgrades, the returns are not significantly different comparedto other periods.
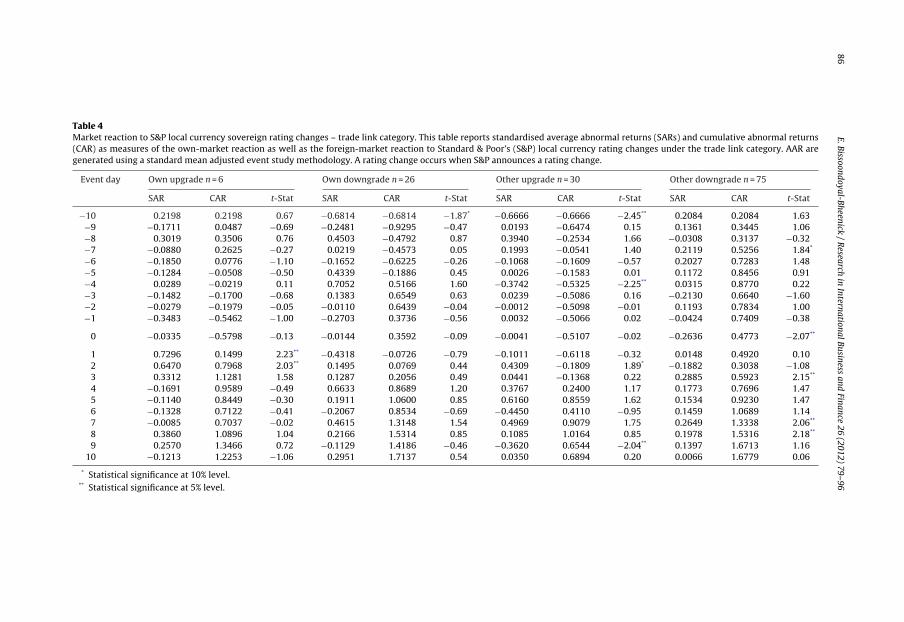
Table 4 reports the market reaction to Standard and Poor’s local currency re-ratings for the trade linkanalysis. The number of observations used for own-market study is 32 (6 upgrades and 26 downgrades)for 15 countries. The number of events increases to 105 observations (30 upgrades and 75 downgrades)for the foreign-country analysis. Considering the own-market effect, the results indicate that localcurrency rating changes do not contribute to significant market reaction. For rating downgrades, thereturns are not significantly different compared to other periods. However, for rating upgrades, thereis a tendency of negative returns prior to the announcement date. However, on two consecutive daysafter the announcement date, the returns are significantly positive.
The foreign-country market effect indicates that we do have spillover effects following a localcurrency rating change. For both other upgrades and other downgrades, the impact on the domesticmarket is substantially significant on several days over the event window. For other downgrades, onthe announcement day, average standardised abnormal returns are significantly negative at −2.61%(corresponding AAR of −0.51%). However for other days over the event window, both prior and after theannouncement day, the returns are significantly positive. The own upgrades study reveals significantimpacts on the domestic market. However, the trend in the average abnormal returns varies frombeing negative prior to the announcement day to a significantly positive return.
In summary, with reference to the event study carried out for S&P, under the trade link category, theresults for own-market study are in general, consistent with prior studies, whereby rating upgrades donot have a great wealth impact as compared to rating downgrades, usually associated with significantimpact on the market. In addition, it does appear Standard and Poor’s sovereign rating changes doexhibit some spillover effect on the domestic market for both upgrades and downgrades.
3.1.2. Moody’s bank deposit and bonds and notes rating changesThe event study under the trade links analysis is repeated by using the rating changes provided by
Moody’s. Moody’s provides ratings in terms of bank deposit as well as bonds and notes. The objectiveof undertaking this study using Moody’s ratings is to determine whether the results of own-marketas well as foreign-market impact are dependent on the rating category applied.
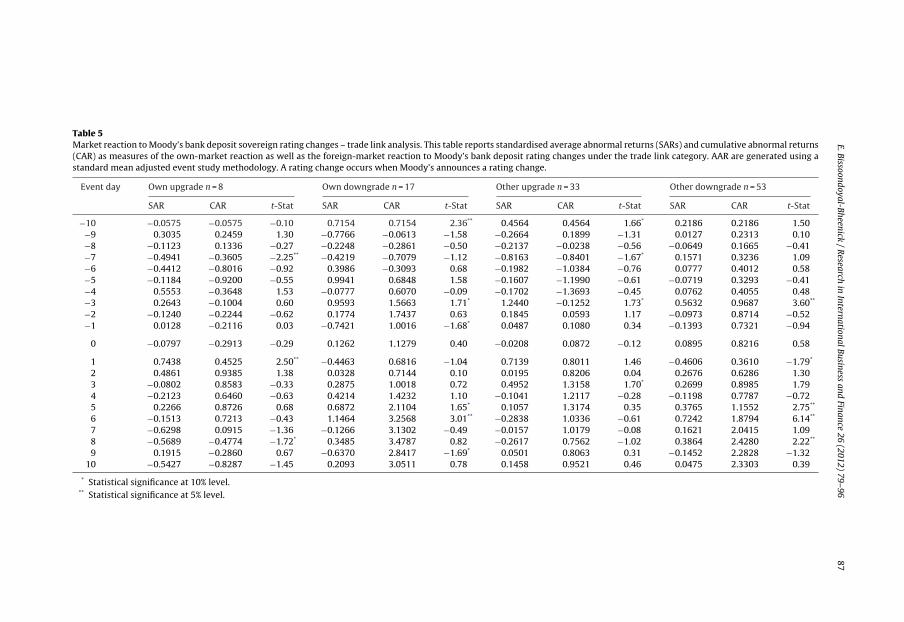
Table 5 reports the market reaction to Moody’s bank deposit rating changes on the trade linksbasis, which involves 13 countries. The own-market study includes 25 events (8 upgrades and 17
4 Note that the tables’ in the paper report the average standardised abnormal return SAR – which explains the magnitude ofthe returns. The average abnormal return – AAR is not reported in the tables.
86E.
Bissoondoyal-Bheenick /
Research
in International
Business and
Finance 26 (2012) 79– 96
Table 4Market reaction to S&P local currency sovereign rating changes – trade link category. This table reports standardised average abnormal returns (SARs) and cumulative abnormal returns(CAR) as measures of the own-market reaction as well as the foreign-market reaction to Standard & Poor’s (S&P) local currency rating changes under the trade link category. AAR aregenerated using a standard mean adjusted event study methodology. A rating change occurs when S&P announces a rating change.
Event day Own upgrade n = 6 Own downgrade n = 26 Other upgrade n = 30 Other downgrade n = 75
SAR CAR t-Stat SAR CAR t-Stat SAR CAR t-Stat SAR CAR t-Stat
−10 0.2198 0.2198 0.67 −0.6814 −0.6814 −1.87* −0.6666 −0.6666 −2.45** 0.2084 0.2084 1.63−9 −0.1711 0.0487 −0.69 −0.2481 −0.9295 −0.47 0.0193 −0.6474 0.15 0.1361 0.3445 1.06−8 0.3019 0.3506 0.76 0.4503 −0.4792 0.87 0.3940 −0.2534 1.66 −0.0308 0.3137 −0.32−7 −0.0880 0.2625 −0.27 0.0219 −0.4573 0.05 0.1993 −0.0541 1.40 0.2119 0.5256 1.84*
−6 −0.1850 0.0776 −1.10 −0.1652 −0.6225 −0.26 −0.1068 −0.1609 −0.57 0.2027 0.7283 1.48−5 −0.1284 −0.0508 −0.50 0.4339 −0.1886 0.45 0.0026 −0.1583 0.01 0.1172 0.8456 0.91−4 0.0289 −0.0219 0.11 0.7052 0.5166 1.60 −0.3742 −0.5325 −2.25** 0.0315 0.8770 0.22−3 −0.1482 −0.1700 −0.68 0.1383 0.6549 0.63 0.0239 −0.5086 0.16 −0.2130 0.6640 −1.60−2 −0.0279 −0.1979 −0.05 −0.0110 0.6439 −0.04 −0.0012 −0.5098 −0.01 0.1193 0.7834 1.00−1 −0.3483 −0.5462 −1.00 −0.2703 0.3736 −0.56 0.0032 −0.5066 0.02 −0.0424 0.7409 −0.38
0 −0.0335 −0.5798 −0.13 −0.0144 0.3592 −0.09 −0.0041 −0.5107 −0.02 −0.2636 0.4773 −2.07**
1 0.7296 0.1499 2.23** −0.4318 −0.0726 −0.79 −0.1011 −0.6118 −0.32 0.0148 0.4920 0.102 0.6470 0.7968 2.03** 0.1495 0.0769 0.44 0.4309 −0.1809 1.89* −0.1882 0.3038 −1.083 0.3312 1.1281 1.58 0.1287 0.2056 0.49 0.0441 −0.1368 0.22 0.2885 0.5923 2.15**
4 −0.1691 0.9589 −0.49 0.6633 0.8689 1.20 0.3767 0.2400 1.17 0.1773 0.7696 1.475 −0.1140 0.8449 −0.30 0.1911 1.0600 0.85 0.6160 0.8559 1.62 0.1534 0.9230 1.476 −0.1328 0.7122 −0.41 −0.2067 0.8534 −0.69 −0.4450 0.4110 −0.95 0.1459 1.0689 1.147 −0.0085 0.7037 −0.02 0.4615 1.3148 1.54 0.4969 0.9079 1.75 0.2649 1.3338 2.06**
8 0.3860 1.0896 1.04 0.2166 1.5314 0.85 0.1085 1.0164 0.85 0.1978 1.5316 2.18**
9 0.2570 1.3466 0.72 −0.1129 1.4186 −0.46 −0.3620 0.6544 −2.04** 0.1397 1.6713 1.1610 −0.1213 1.2253 −1.06 0.2951 1.7137 0.54 0.0350 0.6894 0.20 0.0066 1.6779 0.06
* Statistical significance at 10% level.** Statistical significance at 5% level.
E. Bissoondoyal-Bheenick
/ R
esearch in
International Business
and Finance
26 (2012) 79– 9687
Table 5Market reaction to Moody’s bank deposit sovereign rating changes – trade link analysis. This table reports standardised average abnormal returns (SARs) and cumulative abnormal returns(CAR) as measures of the own-market reaction as well as the foreign-market reaction to Moody’s bank deposit rating changes under the trade link category. AAR are generated using astandard mean adjusted event study methodology. A rating change occurs when Moody’s announces a rating change.
Event day Own upgrade n = 8 Own downgrade n = 17 Other upgrade n = 33 Other downgrade n = 53
SAR CAR t-Stat SAR CAR t-Stat SAR CAR t-Stat SAR CAR t-Stat
−10 −0.0575 −0.0575 −0.10 0.7154 0.7154 2.36** 0.4564 0.4564 1.66* 0.2186 0.2186 1.50−9 0.3035 0.2459 1.30 −0.7766 −0.0613 −1.58 −0.2664 0.1899 −1.31 0.0127 0.2313 0.10−8 −0.1123 0.1336 −0.27 −0.2248 −0.2861 −0.50 −0.2137 −0.0238 −0.56 −0.0649 0.1665 −0.41−7 −0.4941 −0.3605 −2.25** −0.4219 −0.7079 −1.12 −0.8163 −0.8401 −1.67* 0.1571 0.3236 1.09−6 −0.4412 −0.8016 −0.92 0.3986 −0.3093 0.68 −0.1982 −1.0384 −0.76 0.0777 0.4012 0.58−5 −0.1184 −0.9200 −0.55 0.9941 0.6848 1.58 −0.1607 −1.1990 −0.61 −0.0719 0.3293 −0.41−4 0.5553 −0.3648 1.53 −0.0777 0.6070 −0.09 −0.1702 −1.3693 −0.45 0.0762 0.4055 0.48−3 0.2643 −0.1004 0.60 0.9593 1.5663 1.71* 1.2440 −0.1252 1.73* 0.5632 0.9687 3.60**
−2 −0.1240 −0.2244 −0.62 0.1774 1.7437 0.63 0.1845 0.0593 1.17 −0.0973 0.8714 −0.52−1 0.0128 −0.2116 0.03 −0.7421 1.0016 −1.68* 0.0487 0.1080 0.34 −0.1393 0.7321 −0.94
0 −0.0797 −0.2913 −0.29 0.1262 1.1279 0.40 −0.0208 0.0872 −0.12 0.0895 0.8216 0.58
1 0.7438 0.4525 2.50** −0.4463 0.6816 −1.04 0.7139 0.8011 1.46 −0.4606 0.3610 −1.79*
2 0.4861 0.9385 1.38 0.0328 0.7144 0.10 0.0195 0.8206 0.04 0.2676 0.6286 1.303 −0.0802 0.8583 −0.33 0.2875 1.0018 0.72 0.4952 1.3158 1.70* 0.2699 0.8985 1.794 −0.2123 0.6460 −0.63 0.4214 1.4232 1.10 −0.1041 1.2117 −0.28 −0.1198 0.7787 −0.725 0.2266 0.8726 0.68 0.6872 2.1104 1.65* 0.1057 1.3174 0.35 0.3765 1.1552 2.75**
6 −0.1513 0.7213 −0.43 1.1464 3.2568 3.01** −0.2838 1.0336 −0.61 0.7242 1.8794 6.14**
7 −0.6298 0.0915 −1.36 −0.1266 3.1302 −0.49 −0.0157 1.0179 −0.08 0.1621 2.0415 1.098 −0.5689 −0.4774 −1.72* 0.3485 3.4787 0.82 −0.2617 0.7562 −1.02 0.3864 2.4280 2.22**
9 0.1915 −0.2860 0.67 −0.6370 2.8417 −1.69* 0.0501 0.8063 0.31 −0.1452 2.2828 −1.3210 −0.5427 −0.8287 −1.45 0.2093 3.0511 0.78 0.1458 0.9521 0.46 0.0475 2.3303 0.39
* Statistical significance at 10% level.** Statistical significance at 5% level.
88 E. Bissoondoyal-Bheenick / Research in International Business and Finance 26 (2012) 79– 96
downgrades), while the foreign-market study comprises of 86 events (33 upgrades and 53 down-grades). Consistent with the results obtained in the Standard and Poor’s study for the own-marketimpact, downgrades seems to have some impact on stock market returns over the event window. Therating upgrade events are associated with a significantly positive return following the announcementday. However, on the other days the returns are not quantifiably different from other periods. It shouldbe highlighted that for the rating, the average abnormal returns vary from being positive as well asnegative over the event window.
Similar to the results obtained for Standard and Poor’s local currency ratings, it does appear thatchanges in foreign-country banks deposit ratings impact on domestic market for both rating upgradesonly 3 days prior to announcement. However, on the announcement days as well as the followingdays the returns are not quantifiably different. This implies prior to announcement, rating upgradesof Moody’s bank deposit carries some informative value to investors, or alternatively are anticipatedby the market. With regards to rating downgrades, prior to the announcement day, the returns areneither worse nor better, compared to other periods. However, following the announcement day, thereturns are significant over a number of days with the average standardised abnormal returns beingsubstantially negative for only one day at −4.60% (AAR of −0.74%). On all other days, the returns aresignificantly positive.
Table 6 reports the market reaction to Moody’s bonds and notes rating changes, which involves 12countries. The number of events for the own-market effect is 26 (13 upgrades and 13 downgrades),while the foreign-country rating changes include 76 observations (38 upgrades and 38 downgrades).The result indicates that the impact on the domestic market is similar to the results obtained forMoody’s bank deposits changes. On average, both rating upgrades and rating downgrades have awealth impact on the domestic market. For the rating downgrades events, the abnormal returns aresignificant for a few days over the event window. However, the returns vary from being positive aswell as negative. For rating upgrades events, prior to announcement day, the significant returns areassociated with a negative impact. However, 3 days after the announcement day, the returns revertto a significant positive of 0.62% on day 3.
Considering the foreign-country Moody’s Bonds and notes rating changes, it does appear that ingeneral, other downgrades do have an impact on the domestic market. However, contrary to expecta-tions, the average abnormal returns are significantly positive. In contrast, the foreign-country ratingupgrades are not significantly different from other periods.
In summary, the event study carried out for Moody’s rating changes reveal that the results ofwhether rating changes impact on financial markets depends to some extent on which rating is beingtaken into consideration. In addition, it does appear to have a spillover effect for rating downgradesprovided by Moody’s under the trade links analysis. The overall results for the trade links analysissuggest that in general downgrades have an impact on the market, in particular for own countryimpact, while upgrades announcement made by Moody’s seems to provide some informative value,but this is not the case for upgrade announcement by Standard and Poor’s. For the spillover effects,it seems that both agencies downgrades announcement trigger some impact on the other markets,though the impact is not very strong.
3.2. Financial links analysis
3.2.1. Standard and Poor’s foreign and local currency rating changesThe assessment of spillover effects has been carried out by linking the countries on the basis of
trade and on the possible correlation between the financial markets. The financial links assessmentis important, because nowadays, with globalisation, financial markets are more integrated. A recentexample of spillover effect is the South East Asian Crisis, which had an impact on other countriesfinancial markets. While there are other methods that are suggested in the literature to test for con-tagion, for instance the use of multivariate correlation models (see Chiang et al., 2007; Longin andSolnik, 1995; Li et al., 2008), this study focuses on those countries where the correlation coefficientbetween the national stock market returns is greater than 20 percent and apply a standard event studymethodology. The sample obtained under this criteria is larger than the trade links analysis and hencethe number of events used in this study is higher.

E. Bissoondoyal-Bheenick
/ R
esearch in
International Business
and Finance
26 (2012) 79– 9689
Table 6Market reaction to Moody’s bonds and notes sovereign rating changes – trade links analysis. This table reports standardised average abnormal returns (SARs) and cumulative abnormalreturns (CAR) as measures of the own-market reaction as well as the foreign-market reaction to Moody’s bonds and notes rating changes under the trade links category. AAR are generatedusing a standard mean adjusted event study methodology. A rating change occurs when Moody’s announces a rating change.
Event day Own upgrade n = 13 Own downgrade n = 13 Other upgrade n = 38 Other downgrade n = 38
SAR CAR t-Stat SAR CAR t-Stat SAR CAR t-Stat SAR CAR t-Stat
−10 0.4052 0.4052 0.79 0.4002 0.4002 0.98 0.1363 0.1363 0.76 0.4245 0.4245 2.33**
−9 0.3041 0.7093 1.15 −1.1557 −0.7554 −2.01** 0.1830 0.3193 0.83 0.0341 0.4586 0.19−8 −0.7753 −0.0660 −2.72** 0.0180 −0.7374 0.03 −0.2273 0.0920 −1.30 −0.1040 0.3546 −0.51−7 −0.3727 −0.4387 −1.39 −0.3357 −1.0731 −0.79 0.0962 0.1882 0.37 −0.0852 0.2694 −0.47−6 −0.1039 −0.5426 −0.34 0.3847 −0.6884 0.53 0.0465 0.2347 0.29 −0.0456 0.2238 −0.25−5 0.1449 −0.3977 1.02 0.8107 0.1223 0.99 −0.1841 0.0506 −1.19 −0.1362 0.0876 −0.57−4 0.4085 0.0108 1.77* 0.3118 0.4341 0.29 −0.0183 0.0323 −0.12 0.1306 0.2182 0.63−3 0.1691 0.1799 0.48 0.5770 1.0111 0.86 0.4967 0.5290 1.87* 0.7513 0.9694 4.17**
−2 −0.0476 0.1322 −0.11 0.2008 1.2119 0.78 0.1165 0.6455 0.69 0.1527 1.1221 0.63−1 0.0591 0.1914 0.17 −0.7095 0.5025 −1.74* 0.0144 0.6599 0.10 0.1177 1.2398 0.82
0 −0.2469 −0.0556 −0.57 0.4073 0.9098 1.40 −0.1475 0.5125 −1.04 0.0283 1.2681 0.18
1 0.3485 0.2929 1.95* −0.4281 0.4816 −1.30 −0.0588 0.4536 −0.30 0.0776 1.3458 0.552 0.3014 0.5942 1.23 −0.2732 0.2085 −0.70 0.2065 0.6602 1.27 −0.0255 1.3203 −0.143 0.6698 1.2640 2.60** 0.3883 0.5968 0.89 0.4191 1.0793 2.55** 0.0845 1.4048 0.624 −0.3690 0.8950 −1.14 0.4988 1.0956 1.36 0.1072 1.1865 0.78 0.0905 1.4953 0.615 −0.1948 0.7002 −1.41 0.6031 1.6987 1.83* 0.0599 1.2464 0.34 0.3365 1.8318 2.36**
6 −0.0792 0.6210 −0.18 0.9686 2.6673 3.11** −0.1359 1.1105 −0.90 0.6150 2.4468 4.91**
7 −0.1623 0.4586 −0.97 −0.2278 2.4395 −0.70 −0.2192 0.8913 −1.32 0.2274 2.6742 1.208 −0.5304 −0.0718 −1.66* 0.0571 2.4966 0.15 −0.4176 0.4737 −1.48 0.2300 2.9042 1.169 0.2433 0.1715 0.98 −0.2217 2.2749 −0.59 0.1239 0.5975 0.92 −0.0234 2.8807 −0.21
10 −0.0894 0.0821 −0.27 −0.1040 2.1708 −0.29 −0.0225 0.5750 −0.11 −0.0883 2.7924 −0.56
* Statistical significance at 10% level.** Statistical significance at 5% level.

90 E. Bissoondoyal-Bheenick / Research in International Business and Finance 26 (2012) 79– 96
The event study methodology is applied to the set of countries and the results for Standard andPoor’s foreign currency rating changes is reported in Table 7. The number of countries includedunder this sample is 16 countries with a higher number of events. There are 42 events to test foran own-market wealth impact (19 upgrades and 23 downgrades), while the foreign-country ratingchanges impact comprise of 292 events (137 upgrades and 155 downgrades). The increase in thenumber of events suggests that the correlation between financial markets is substantially strong,except for China, which has a correlation of less than 5 percent with all the other countries in thesample. The overall results for the financial links shows much stronger results for the spillovereffects with downgrades having a more significant impact in the markets than upgrades. For the owncountry effects, consistent with the literature downgrades announcement from both agencies have asignificant impact on the stock return. The results following upgrades are consistent with the resultsobtained under the trade link analysis in that only upgrades from Moodys have an impact on themarket while Standard and Poor’s do not.
Table 7 clearly indicates that Standard and Poor’s foreign currency rating upgrades do not have asignificant own-market impact, while rating downgrades have a significant impact on the announce-ment day. These findings are consistent with previous research on the impact of ratings changes onindividual companies. The impact of foreign-country rating changes on the domestic market is clearfrom Table 7. The results shows spillover effects following a change in Standard and Poor’s foreigncurrency rating for both other upgrades and other downgrades. The returns are substantially signifi-cant under both circumstances for a number of days over the event window. For other upgrades ratingevents, on announcement day and the following days, the average abnormal returns follow a negativetrend. For other downgrades, over the entire event window, the ratings have a significant impact onthe market. However, the returns vary from being both positive and negative.
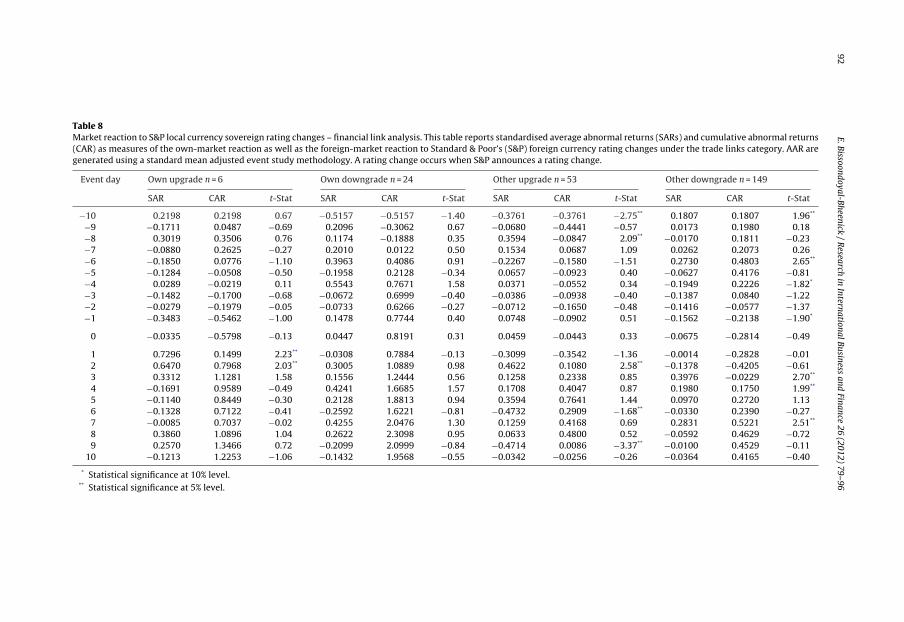
The study is repeated using Standard and Poor’s local currency rating changes. The results arereported in Table 8, which include 14 countries with 30 events for the own-market wealth impact(6 upgrades and 24 downgrades) and 202 events for the foreign-country rating changes (53 otherupgrades and 149 other downgrades). Generally for the domestic-market impact, the analysis of localcurrency rating changes reveals that there is no additional information imparted by the announcementof a rating change. However, following the announcement day, the average abnormal returns for ratingupgrades are significantly positive for 2 days. The market reverts to normal with returns in general,similar to other periods.
The impact of other upgrades and other downgrades of S&P local currency rating are clear. For bothother upgrades and other downgrades, the market seems to have a significant impact over the eventwindow. Contrary to expectation of having negative returns following downgrade announcementsand positive returns following upgrade announcements, the average abnormal returns fluctuate frompositive to negative under both circumstances. In summary, there does appear to be spillover effectsfollowing a change in the rating provided by Standard and Poor’s.
3.2.2. Moody’s bank deposit and bonds and notes rating changesThe impact of Moody’s bank deposit rating changes on the domestic market as well as the
impact of foreign-market rating changes on the domestic market are reported in Table 9. The sampleincludes 16 countries with 25 events for own-market rating changes (8 upgrades and 17 down-grades), and 201 events for the foreign-market rating changes (85 other upgrades and 116 otherdowngrades). The results of the own-market impact suggest that both own upgrades and owndowngrades have an impact on the market. For rating upgrades events, the average standardisedabnormal returns are significantly positive following the announcement day at 7.22% (AAR of 0.8%).The rating downgrades are associated with a significant impact for only 2 days over the eventwindow. However, prior to the announcement day, the average abnormal return is substantiallynegative.
The analysis of the impact of foreign-country rating changes clearly suggests the presence ofspillover effects following a change in Moody’s bank deposit ratings for downgrades. For the otherdowngrades, the average abnormal returns are substantially significant over the event window. Forother upgrades events, on announcement day, contrary to expectations, the average standardisedabnormal return is significantly negative at −2.43% (AAR of −0.16%). In contrast, for other downgrades

E. Bissoondoyal-Bheenick
/ R
esearch in
International Business
and Finance
26 (2012) 79– 9691
Table 7Market reaction to S&P foreign currency sovereign rating changes – financial link analysis. This table reports standardised average abnormal returns (SARs) and cumulative abnormalreturns (CAR) as measures of the own-market reaction as well as the foreign-market reaction to Standard & Poor’s (S&P) foreign currency rating changes under the trade links category.AAR are generated using a standard mean adjusted event study methodology. A rating change occurs when S&P announces a rating change.
Event day Own upgrade n = 19 Own downgrade n = 23 Other upgrade n = 137 Other downgrade n = 155
SAR CAR t-Stat SAR CAR t-Stat SAR CAR t-Stat SAR CAR t-Stat
−10 −0.3619 −0.3619 −1.41 −0.6013 −0.6013 −1.66* −0.0818 −0.0818 −0.90 −0.0676 −0.0676 −0.76−9 0.0460 −0.3159 0.28 0.2691 −0.3322 0.88 −0.0582 −0.1400 −0.67 −0.1540 −0.2217 −1.64*
−8 0.0675 −0.2485 0.40 0.0949 −0.2373 0.37 −0.0546 −0.1946 −0.70 0.2279 0.0062 2.32**
−7 0.0900 −0.1585 0.41 0.3153 0.0780 0.80 0.1983 0.0037 2.34** 0.0724 0.0786 0.86−6 0.1243 −0.0342 0.44 0.4028 0.4808 0.83 0.0281 0.0318 0.28 0.1085 0.1871 0.88−5 0.1121 0.0778 0.45 −0.0425 0.4383 −0.07 0.2433 0.2751 2.39** −0.0995 0.0876 −1.00−4 0.1340 0.2118 0.92 0.5350 0.9733 1.51 0.0529 0.3281 0.67 −0.5459 −0.4584 −3.13**
−3 0.1325 0.3444 0.56 −0.2785 0.6948 −1.79* −0.1159 0.2122 −1.68* 0.3271 −0.1312 2.33**
−2 0.1352 0.4796 0.66 0.2715 0.9664 0.84 −0.1161 0.0961 −1.53 0.0918 −0.0395 0.64−1 0.0799 0.5595 0.53 −0.1827 0.7837 −0.53 0.1354 0.2315 1.66* −0.2626 −0.3020 −2.77**
0 0.3071 0.8666 1.38 −0.5468 0.2368 −1.95** −0.2215 0.0100 −2.77** −0.5334 −0.8354 −1.26
1 0.2501 1.1167 0.93 −0.2289 0.0080 −0.82 −0.0942 −0.0841 −1.05 −0.0167 −0.8521 −0.132 0.1535 1.2702 0.81 0.1887 0.1966 0.49 −0.0141 −0.0982 −0.19 −1.1887 −2.0409 −1.183 0.2016 1.4718 0.99 0.1301 0.3268 0.59 −0.1206 −0.2188 −1.46 1.0707 −0.9701 1.644 −0.0522 1.4195 −0.28 0.2976 0.6243 0.95 −0.1466 −0.3654 −2.07** 0.1313 −0.8388 0.885 −0.2349 1.1846 −1.20 0.0205 0.6448 0.07 −0.0799 −0.4453 −0.93 0.2591 −0.5798 2.35**
6 −0.1424 1.0423 −0.81 −0.1643 0.4806 −0.40 −0.0106 −0.4559 −0.10 0.0136 −0.5661 0.097 −0.1308 0.9115 −0.70 0.7971 1.2776 2.39** −0.1295 −0.5854 −1.74* 0.6120 0.0459 2.38**
8 0.1955 1.1070 1.00 0.1468 1.4245 0.49 −0.0103 −0.5957 −0.12 −0.0964 −0.0505 −1.169 0.1900 1.2970 0.77 −0.0516 1.3729 −0.22 −0.0175 −0.6132 −0.20 0.0605 0.0100 0.48
10 0.0606 1.3576 0.38 −0.2902 1.0827 −2.12** −0.0426 −0.6558 −0.47 −0.0505 −0.0405 −0.50
* Statistical significance at 10% level.** Statistical significance at 5% level.
92E.
Bissoondoyal-Bheenick /
Research
in International
Business and
Finance 26 (2012) 79– 96
Table 8Market reaction to S&P local currency sovereign rating changes – financial link analysis. This table reports standardised average abnormal returns (SARs) and cumulative abnormal returns(CAR) as measures of the own-market reaction as well as the foreign-market reaction to Standard & Poor’s (S&P) foreign currency rating changes under the trade links category. AAR aregenerated using a standard mean adjusted event study methodology. A rating change occurs when S&P announces a rating change.
Event day Own upgrade n = 6 Own downgrade n = 24 Other upgrade n = 53 Other downgrade n = 149
SAR CAR t-Stat SAR CAR t-Stat SAR CAR t-Stat SAR CAR t-Stat
−10 0.2198 0.2198 0.67 −0.5157 −0.5157 −1.40 −0.3761 −0.3761 −2.75** 0.1807 0.1807 1.96**
−9 −0.1711 0.0487 −0.69 0.2096 −0.3062 0.67 −0.0680 −0.4441 −0.57 0.0173 0.1980 0.18−8 0.3019 0.3506 0.76 0.1174 −0.1888 0.35 0.3594 −0.0847 2.09** −0.0170 0.1811 −0.23−7 −0.0880 0.2625 −0.27 0.2010 0.0122 0.50 0.1534 0.0687 1.09 0.0262 0.2073 0.26−6 −0.1850 0.0776 −1.10 0.3963 0.4086 0.91 −0.2267 −0.1580 −1.51 0.2730 0.4803 2.65**
−5 −0.1284 −0.0508 −0.50 −0.1958 0.2128 −0.34 0.0657 −0.0923 0.40 −0.0627 0.4176 −0.81−4 0.0289 −0.0219 0.11 0.5543 0.7671 1.58 0.0371 −0.0552 0.34 −0.1949 0.2226 −1.82*
−3 −0.1482 −0.1700 −0.68 −0.0672 0.6999 −0.40 −0.0386 −0.0938 −0.40 −0.1387 0.0840 −1.22−2 −0.0279 −0.1979 −0.05 −0.0733 0.6266 −0.27 −0.0712 −0.1650 −0.48 −0.1416 −0.0577 −1.37−1 −0.3483 −0.5462 −1.00 0.1478 0.7744 0.40 0.0748 −0.0902 0.51 −0.1562 −0.2138 −1.90*
0 −0.0335 −0.5798 −0.13 0.0447 0.8191 0.31 0.0459 −0.0443 0.33 −0.0675 −0.2814 −0.49
1 0.7296 0.1499 2.23** −0.0308 0.7884 −0.13 −0.3099 −0.3542 −1.36 −0.0014 −0.2828 −0.012 0.6470 0.7968 2.03** 0.3005 1.0889 0.98 0.4622 0.1080 2.58** −0.1378 −0.4205 −0.613 0.3312 1.1281 1.58 0.1556 1.2444 0.56 0.1258 0.2338 0.85 0.3976 −0.0229 2.70**
4 −0.1691 0.9589 −0.49 0.4241 1.6685 1.57 0.1708 0.4047 0.87 0.1980 0.1750 1.99**
5 −0.1140 0.8449 −0.30 0.2128 1.8813 0.94 0.3594 0.7641 1.44 0.0970 0.2720 1.136 −0.1328 0.7122 −0.41 −0.2592 1.6221 −0.81 −0.4732 0.2909 −1.68** −0.0330 0.2390 −0.277 −0.0085 0.7037 −0.02 0.4255 2.0476 1.30 0.1259 0.4168 0.69 0.2831 0.5221 2.51**
8 0.3860 1.0896 1.04 0.2622 2.3098 0.95 0.0633 0.4800 0.52 −0.0592 0.4629 −0.729 0.2570 1.3466 0.72 −0.2099 2.0999 −0.84 −0.4714 0.0086 −3.37** −0.0100 0.4529 −0.11
10 −0.1213 1.2253 −1.06 −0.1432 1.9568 −0.55 −0.0342 −0.0256 −0.26 −0.0364 0.4165 −0.40
* Statistical significance at 10% level.** Statistical significance at 5% level.

E. Bissoondoyal-Bheenick
/ R
esearch in
International Business
and Finance
26 (2012) 79– 9693
Table 9Market reaction to Moody’s bank deposit sovereign rating changes – financial link analysis. This table reports standardised average abnormal returns (SARs) and cumulative abnormalreturns (CAR) as measures of the own-market reaction as well as the foreign-market reaction to Moody’s Bank Deposit rating changes under the trade link category. AAR are generatedusing a standard mean adjusted event study methodology. A rating change occurs when Moody’s announces a rating change.
Event day Own upgrade n = 8 Own downgrade n = 17 Other upgrade n = 85 Other downgrade n = 116
SAR CAR t-Stat SAR CAR t-Stat SAR CAR t-Stat SAR CAR t-Stat
−10 −0.1217 −0.1217 −0.22 0.3238 0.3238 0.99 −0.0547 −0.0547 −0.36 0.2394 0.2394 2.19**
−9 0.3410 0.2193 1.58 −0.6606 −0.3368 −1.36 −0.1859 −0.2406 −1.51 −0.1705 0.0689 −1.80*
−8 −0.2493 −0.0301 −0.61 −0.1705 −0.5074 −0.38 0.0819 −0.1586 0.61 −0.1094 −0.0405 −0.92−7 −0.6170 −0.6470 −2.94** −0.3751 −0.8824 −1.04 −0.2232 −0.3818 −1.52 −0.0067 −0.0472 −0.07−6 −0.4412 −1.0882 −0.98 0.2037 −0.6787 0.35 −0.2013 −0.5831 −1.44 0.1346 0.0873 1.53−5 −0.1108 −1.1990 −0.55 0.7735 0.0947 1.23 −0.1830 −0.7661 −1.30 −0.1586 −0.0712 −1.31−4 0.5146 −0.6845 1.44 0.2641 0.3588 0.32 −0.0116 −0.7777 −0.08 0.0407 −0.0306 0.38−3 0.1624 −0.5221 0.38 0.5798 0.9386 1.01 −0.0858 −0.8634 −0.69 0.1334 0.1028 1.14−2 −0.1453 −0.6674 −0.79 0.0017 0.9402 0.01 −0.3170 −1.1804 −2.00** −0.3127 −0.2099 −2.7388−1 −0.0945 −0.7619 −0.23 −0.7171 0.2232 −1.67* 0.0590 −1.1214 0.44 −0.2072 −0.4172 −1.93*
0 0.1652 −0.5967 0.46 0.2526 0.4757 0.84 −0.2436 −1.3650 −1.93 −0.1134 −0.5306 −0.98
1 0.7225 0.1258 2.38** −0.3796 0.0961 −0.88 −0.0173 −1.3822 −0.12 −0.2929 −0.8235 −1.6582 0.4562 0.5820 1.33 −0.1654 −0.0693 −0.52 0.0548 −1.3274 0.41 0.1709 −0.6526 1.043 −0.0644 0.5176 −0.29 0.1029 0.0336 0.27 0.1617 −1.1657 1.08 0.3250 −0.3276 3.16**
4 −0.3880 0.1296 −1.12 0.1272 0.1608 0.31 0.1054 −1.0603 0.78 −0.8247 −1.1523 −3.54**
5 0.0937 0.2233 0.27 0.5433 0.7042 1.27 0.2813 −0.7790 2.06** 0.5258 −0.6265 3.02**
6 −0.3483 −0.1250 −0.93 1.0390 1.7432 2.66** 0.1064 −0.6725 0.93 0.5511 −0.0754 4.93**
7 −0.6967 −0.8217 −1.68* −0.1495 1.5937 −0.56 −0.1424 −0.8149 −0.98 0.0091 −0.0662 0.108 −0.5949 −1.4167 −1.91* −0.0628 1.5309 −0.20 −0.0747 −0.8896 −0.55 0.3227 0.2565 2.50**
9 0.2145 −1.2021 0.81 −0.5049 1.0260 −1.15 0.1503 −0.7393 1.08 −0.0643 0.1922 −0.6010 −0.3651 −1.5672 −0.85 0.1775 1.2035 0.63 −0.3447 −1.0840 −1.79* −0.1455 0.0467 −1.46
* Statistical significance at 10% level.** Statistical significance at 5% level.

94E.
Bissoondoyal-Bheenick /
Research
in International
Business and
Finance 26 (2012) 79– 96
Table 10Market reaction to Moody’s bonds and notes sovereign rating changes – financial link analysis. This table reports standardised average abnormal returns (SARs) and cumulative abnormalreturns (CAR) as measures of the own-market reaction as well as the foreign-market reaction to Moody’s bank deposit rating changes under the trade link category. AAR are generatedusing a standard mean adjusted event study methodology. A rating change occurs when Moody’s announces a rating change.
Event day Own upgrade n = 14 Own downgrade n = 13 Other upgrade n = 110 Other downgrade n = 99
SAR CAR t-Stat SAR CAR t-Stat SAR CAR t-Stat SAR CAR t-Stat
−10 0.3789 0.3789 0.79 0.4148 0.4148 1.02 −0.0044 −0.0044 −0.04 0.3662 0.3662 2.79**
−9 0.3541 0.7330 1.44 −1.1414 −0.7266 −1.98** 0.3778 0.3735 3.21** −0.1955 0.1707 −1.71−8 −0.5492 0.1837 −1.65* 0.0310 −0.6956 0.06 −0.0167 0.3568 −0.14 −0.1279 0.0427 −0.90−7 −0.2019 −0.0182 −0.71 −0.3227 −1.0182 −0.76 −0.1417 0.2151 −1.36 −0.1532 −0.1104 −1.36−6 −0.1222 −0.1404 −0.42 0.3988 −0.6194 0.55 0.0122 0.2273 0.14 −0.0150 −0.1254 −0.13−5 0.1800 0.0396 1.31 0.8253 0.2059 1.01 −0.1418 0.0854 −1.34 −0.1100 −0.2354 −0.73−4 0.5062 0.5457 2.22** 0.3271 0.5330 0.31 0.1148 0.2002 1.26 0.1392 −0.0962 1.13−3 0.2492 0.7950 0.78 0.5925 1.1256 0.89 −0.2068 −0.0065 −1.66 0.1291 0.0329 1.01−2 0.0583 0.8532 0.15 0.2152 1.3407 0.84 −0.0636 −0.0702 −0.55 −0.0616 −0.0287 −0.49−1 0.0983 0.9516 0.30 −0.6957 0.6450 −1.69* 0.1313 0.0612 1.20 −0.1216 −0.1503 −1.04
0 −0.1494 0.8021 −0.36 0.4218 1.0668 1.47 0.1758 0.2369 1.39 −0.1534 −0.3037 −1.36
1 0.4192 1.2213 2.43** −0.4125 0.6543 −1.28 0.0062 0.2431 0.06 0.1020 −0.2017 0.772 0.3105 1.5319 1.36 −0.2593 0.3951 −0.67 −0.0049 0.2382 −0.04 −0.0136 −0.2153 −0.123 0.6661 2.1980 2.81** 0.4045 0.7996 0.93 0.3132 0.5514 2.86** 0.3383 0.1230 3.44**
4 −0.3830 1.8150 −1.26 0.5138 1.3135 1.39 0.2785 0.8299 2.10** −0.2657 −0.1427 −2.41**
5 −0.1049 1.7101 −0.70 0.6184 1.9319 1.82 0.1758 1.0057 1.60 0.1296 −0.0131 1.186 0.0232 1.7333 0.06 0.9865 2.9184 3.05** 0.0820 1.0877 0.94 0.5468 0.5337 4.96**
7 −0.1538 1.5795 −0.97 −0.2133 2.7051 −0.67 −0.0775 1.0103 −0.84 0.0650 0.5987 0.638 −0.4869 1.0926 −1.67 0.0751 2.7802 0.21 0.0344 1.0446 0.33 0.0875 0.6862 0.719 0.1808 1.2734 0.71 −0.2072 2.5730 −0.54 0.3143 1.3589 2.88** −0.1149 0.5713 −1.19
10 −0.0658 1.2076 −0.22 −0.0899 2.4831 −0.26 −0.1698 1.1891 −1.19 −0.2434 0.3279 −1.99
* Denotes statistical significance at 10% level.** Denotes statistical significance at 5% level.

E. Bissoondoyal-Bheenick / Research in International Business and Finance 26 (2012) 79– 96 95
events, there is a strong general negative tendency in the average abnormal returns following therating change.
The last set of event study analysis is carried out using Moody’s bonds and notes rating changesfor 16 countries. The results are reported in Table 10. The number of events involved in the own-market study is 27 (14 upgrades and 13 downgrades), while for the foreign country rating changes,the number of events is 209 (110 other upgrades and 99 downgrades). The results are similar tothe results obtained in the trade links analysis. On average, both upgrades and downgrades have animpact on the domestic market. For rating upgrades, the average standardised abnormal returns aresignificantly positive following the announcement day at 4.19% (AAR of 0.56%). For rating downgrades,even if the returns are significant for a few days over the event window, the average abnormal returnfluctuates from positive to negative. The foreign-country rating changes analysis suggests in general,the presence of spillover effects following rating downgrades.
In summary, under the financial links analysis, Moody’s rating changes impact on domestic marketfor both upgrades and downgrades, which shows that the results are dependent on which rating isused in the study. In addition, changes in Moody’s ratings suggest that there do exist some spillovereffects following a rating change, in particular rating downgrades.
4. Conclusion
This study complements previous research on the impact of sovereign rating changes on financialmarkets. In this paper, the main focus is to examine whether changes in a particular country’s sovereignrating provided by Standard and Poor’s and Moody’s trigger a spillover effect on other countries. Inaddition, the paper assesses whether the results obtained from previous research, namely, sovereignrating downgrades convey information to the market while upgrades do not have a significant impact,can be applied to ratings provided by different rating agencies.
The event study has been carried out for two broad sets of linkage between markets, that is, byusing trade links and financial links for four different categories of ratings – Standard and Poor’sforeign currency ratings, Standard and Poor’s local currency ratings, Moody’s bank deposit rat-ings and Moody’s bonds and notes ratings. The results suggest that in general, there does appearto be a contamination effect for downgrades among the countries. However, the use of two dif-ferent criteria to link the countries suggests that financial links among countries are strongerthan trade links. Hence, there are more significant results when the links in financial markets areanalysed.
Consistent with previous research on sovereign rating regarding own-market impact, the resultssuggest that under both studies – trade links and financial links, in general, rating downgrades have asignificant impact on the domestic market, whereas rating upgrades do not carry the same informativevalue. Surprisingly, an important finding in this study is that this finding cannot be generalised for allthe rating agencies. The results suggest that different rating agencies affect the market differently. Inthe case of Moody’s rating changes, under both studies – trade links and financial links, rating upgradesdo have an impact on the market. This suggests that before generalising that upgrades do not have animpact on the market while downgrades impact on the market, we need to be careful. The evidenceobtained from the study suggests that this can be applied in the case of Standard and Poor’s ratingchanges only.
There are several potential extensions to this paper, all of which would help better understand theeffects of sovereign credit rating changes. It would be interesting to test whether there is any coor-dination between the rating agencies prior to changes in sovereign ratings and hence assess whetherthere is a joint impact on the market. Another possible line of research is that with the existence ofnew rating agencies such as Duff and Phelps and Fitch, it does appear that these rating agencies assignmore favorable ratings than Moody’s and Standard and Poor’s, see Linden et al. (1998). Hence, a studyof whether these new rating agencies impact on the market differently as compared to the well estab-lished rating agencies can equally be taken. These issues are beyond the scope of this paper and arematerial for further research in the area of sovereign ratings.
96 E. Bissoondoyal-Bheenick / Research in International Business and Finance 26 (2012) 79– 96
References
Bissoondoyal-Bheenick, E., 2004. Rating timing differences between the two leading agencies: Standard and Poor’s and Moody’s.Emerg. Markets Rev. 5, 361–378.
Boehmer, E., Musumeci, J., Poulsen, A.B., 1991. Event-study methodology under conditions of event-induced variance. J. FinancialEcon. 30, 253–272.
Branston, L., 1995. Mexican crisis underlies agency pitfalls. Financial Times (February).Brooks, R., Faff, R.W., Hiller, D., Hiller, J., 2004. The national market impact of sovereign rating changes. J. Bank. Finance 28,
233–250.Cantor, R., Packer, F., 1996a. Determinants and impact of sovereign credit rating. Federal Reserve Bank New York Econ. Policy
Rev. (October), 1–15.Cantor, R., Packer, F., 1996b. Sovereign risk assessment and agency credit ratings. Eur. Financial Manage. 2, 247–256.Chiang, T.C., Jeon, B.N., Li, H., 2007. Dynamic correlation analysis of financial contagion: evidence from Asian markets. J. Int.
Money Finance 26 (November (7)), 1206–1228.Greene, W.H., 2000. Econometric Analysis, 4th ed. Prentice Hall.Kaminsky, G., Schmukler, S., 2002. Emerging Market Instability: Do Sovereign ratings Affect Country Risk and Stock Returns?
World Bank Policy Research Papers 2678, www.worldbank.org/research.Li, H., Jeon, B.N., Cho, S.-Y., Chiang, T.C., 2008. The impact of sovereign rating changes and financial contagion on stock market
returns: evidence from five Asian countries. Global Finance J. 19 (1), 46–55.Linden, F., McNamara, G., Vaaler, P., 1998. Idiosyncratic Region and Rater Effects on Sovereign Credit Ratings. A paper submitted
for presentation in the International Management Division of the Academy of Management Annual Meeting.Longin, F., Solnik, B., 1995. Is the correlation in international equity returns constant: 1960–1990? J. Int. Money Finance 14,
3–26.Reinsen, H., Von Maltzan, J., 1999. Boom and Bust and Sovereign ratings. Int. Finance 2, 273–293.