Embed Size (px)
Citation preview
Do Sales Matter?: Evidence from UK Food Retailing
T.A. Lloyd*, C.W. Morgan*, S. McCorriston** and E. Zgovu*
Abstract
This paper assesses the role of sales as a feature of price dynamics using scanner data. The study analyses an extensive, high frequency panel of supermarket prices consisting of over 230,000 weekly price observations on around 500 products in 15 categories of food stocked by the UK’s seven largest retail chains. In all, 1,700 weekly time series are available at the barcode-specific level including branded and own-label products. The data allows the frequency, magnitude and duration of sales to be analysed in greater detail than has hitherto been possible with UK data. The main results are: (i) sales are a key feature of aggregate price variation with around 40 per cent of price variation being accounted for by sales once price differences for each Unique Product Code (UPC) level across the major retailers are accounted for; (ii) there is considerable heterogeneity in the use of sales across retailers; (iii) much of the price variation that is observed in the UK food retailing sector is accounted for by price differences between retailers; (iv) only a small proportion of price variation that is observed in UK food retailing is common across the major retailers suggesting that cost shocks originating at the manufacturing level is not one of the main sources of price variation in the UK; (v) own-label products also exhibit considerable sales behaviour though this is less important than sales for branded goods; and (vi) there is some evidence of coordination in the timing of sales across retailers insofar as the probability of a sale at the UPC level at a given retailer increases if the product is also on sale at another retailer. Keywords: Sales, price variation, retail prices. JEL Classification: L16; L66; Q13.
*Tim Lloyd, Wyn Morgan and Evious Zgovu are, respectively, Associate Professor, Professor and
visiting researcher in the School of Economics, University of Nottingham, UK.
** Steve McCorriston is Professor in the Department of Economics, University of Exeter, UK.
Sales and Retail Price Dynamics: Evidence from UK Food Retailing.
1. Introduction
In this paper, we explore the role of sales in explaining the dynamics of retail food
prices using scanner data for all major retailers in the UK food sector. In general, the
role of sales matters from two broad perspectives: first, set against a background that is
often characterised by ‘sticky’ prices, sales play a potentially important role both in
respect of temporary price variation and retail price inflation more generally (Kehoe
and Midrigan, 2008); second, from an industrial organisation perspective, the issue
arises with respect to understanding price setting and the extent to which firms
compete via temporary reductions in price. As a consequence, the role of sales in
explaining retail price movements has received some attention in the recent
macroeconomic and industrial organisation literature, often with specific reference to
retail food prices. Most notably, using US data, Hosken and Rieffen (2004) emphasize
the importance of sales in overall price adjustment and provide evidence that sales are
a significant feature of retail price dynamics. Specifically, depending on the product
category, they report that 20 to 50 per cent of the annual variation in retail (food) prices
is due to sales. Nakamura and Steinsson (2008) report that 20 per cent of price changes
are due to sales which are typically concentrated in relatively few sectors such as food
and clothing. Berck et al. (2008) use weekly data on orange juice in the US. They note
that the existing industrial organisation literature on sales implicitly assumes that sales
are determined by manufacturers not retailers while their results suggest that
understanding the role of retailers is key in understanding sales behaviour1, 2. The issue
1 This issue has also been highlighted by Hosken and Rieffen (2004).
1
of whether sales originate at the retail level rather than being determined by
manufacturers is also addressed by Nakamura and Steinsson (op. cit.) and Hosken and
Rieffen (op. cit.)3.
In this paper, we contribute to the empirical literature on sales and the role of sales in
price variation using high-frequency (weekly) data on UK food retailing with scanner
data covering all the major food retailers in the UK. Our coverage provides the most
comprehensive overview of the role of sales in retail food price dynamics to date by
identifying the extent and importance of sales for over 500 food products using high
frequency (weekly) data for all major retail chains in a well-defined market, the data
also allowing us to separate our the existence of sales for own-label and branded
products. Specifically, we use scanner data at the Unique Product Code (UPC) level,
covering 500 products in 15 categories of food sold in the UK’s seven largest food
retail chains over a two and a half year period from September 2001 to April 2004. The
data we employ are at weekly intervals rather than monthly (see, in comparison,
Hosken and Rieffen (op. cit.) and Nakamura and Steinsson (op. cit.) who use monthly),
which is an advantage if promotions exist for only one or two weeks at a time (Hosken
and Rieffen, op. cit.)4. In addition, the UPC data is available at the individual retailer-
level and our coverage relates to all the major food retailers in the UK, giving 1,704
2 Most notable contributions that address the issue of sales include Varian (1980), Sobel (1984), Pesendorfer (2002) among others. These papers relate sales either to firms discriminating among different types of consumers or over time. Another strand emphasises the role of store inventories. For an example of the latter, see Aguirregabiria (1999). 3 The observation that sales are more likely to be driven by retailers rather than manufacturers is also noted by Nakamura (2008), the role of retailers in price behaviour more generally being highlighted by Villas-Boas (2007) and Chevalier et al. (2003) among others. 4 Data frequency and how the data are reported is an issue in identifying sales. In Nakamura and Steinsson (2008), the data is monthly and comes from the Bureau of Labor Statistics (BLS) used to construct the consumer price index where a ‘sale’ is denoted by a sale flag when the data is collected. Nakamura (2008) uses weekly scanner data at the UPC level by retailer and store for one year. Berck et al. (2008) use weekly scanner data for two product categories (fresh and concentrated orange juice) across stores and retailers across the US. In the latter, they have to define what will be categorised as a “sale” in the data, which is the approach that is also followed here. Determining a sale in this manner is also the approach followed by Hosken and Rieffen (2004).
2

UPCs in all. The UK’s food retailing sector is highly concentrated and with the retail
chains reportedly employing national pricing strategies, the data coverage here offers
important insights into the significance of sales across different retail chains.5. Finally,
the UPC data we use separates out own-label products from branded products for each
of the major retailers, so we are able to offer an assessment based on brand status,
something that was not possible in the studies by Hosken and Rieffen (op. cit.) and
Nakamura (op. cit.). This distinction has been highlighted by Berck et al. (op. cit.) but
the data coverage in their paper related to orange juice products only. As such, we
offer a more general perspective on the brand/own-label distinction relating to the
contribution of sales in retail price dynamics.
Our key results are as follows: (i) sales are a key feature of aggregate price variation
with around 40 per cent of price variation being accounted for by sales once price
differences for each UPC level across the major retailers are accounted for; (ii) much
of the price variation that is observed in the UK food retailing sector is actually
accounted for by persistent price differences between retailers; (iii) there is
considerable heterogeneity in the use of sales across retailers; (iv) only a small
proportion of price variation that is observed in UK food retailing is common across
the major retailers, suggesting that cost shocks originating at the manufacturing level is
not one of the main sources of price variation in the UK (this observation being
consistent with Nakamura (op. cit) and Hosken and Rieffen (op. cit.) for the US but
with the evidence reported here being suggesting that the role of ‘common’ shocks to
be less important than in the US); (v) own-label products also exhibit considerable 5 Concerns about the potential for market power exerted by UK food retailers have attracted the attention of the UK Competition Commission. See Competition Commission (2000) for a comprehensive overview of this sector and assessment relating to concerns about market power. In 2005, the four leading retailers had a combined share of around 75 per cent of the retail grocery market (Office of Fair Trading, 2006).
3

sales behaviour though this is less important than sales for branded goods; and (vi)
there is some evidence of coordination in the timing of sales across retailers insofar as
the probability of a sale at the UPC level at a given retailer increases if the product is
also on sale at another retailer.
The paper is organised as follows. In Section 2, we describe the data that forms the
basis for the analysis of sales. In Section 3, we present a discussion of the
methodological issues in identifying sales periods and, in Section 4, we provide a
summary of the principal features of sales in the UK food retailing sector. In Section 5,
we provide an overall assessment of the relative importance of sales in price variation
and gauge the role of sales against ‘common’ price changes originating from the
manufacturing sector and retailer-specific price variation. We address the timing of
sales across retailers in Section 6 and, in Section 7, we summarise and conclude.
2. Price Data
In the empirical analysis, we utilise an extensive and high-frequency panel of
supermarket food prices derived from electronic point of sale (EPOS) data obtained
from Nielsen Scantrack, a leading market research company which collects data
relating to in-store transactions. Our data derives from the records of the seven largest
of these supermarkets which, as a group, represented around three-quarters of all food
sales in the UK during the sample period. 6
6 The seven supermarkets included in the sample are Tesco, Sainsbury, ASDA, Safeway, Somerfield, Kwik Save and Waitrose. The remaining 25% of sales are accounted for by small national and regional supermarket chains and independent retailers. Discounters such as Lidl, Netto and Aldi did not submit data to Neilsen at the time of the sample, but together accounted for less than 3% of market share. Marks and Spencer did not sell branded goods and are excluded for this reason.
4

The price information contained in the data set is based on the details recorded by laser
bar-code scanners as products pass through supermarket check-outs. As a result, prices
are based on 100% of transactions of the sampled products rather than derived from
consumer surveys. Overall, the data covers 231,069 weekly price observations on 507
products in 15 categories of food.7 They relate to a (137 observation) sample frame
running from 8th September 2001 to 17th April 2004. Some 90% of products are
available throughout this period, the minimum number of observations for any product
being 103 weeks. 8
Each price observation in the sample represents the simple average of the prices posted
in each of the retailers’ stores on the Saturday of each week. Price observations are
thus retailer-based national (Great Britain) averages. For a retailer such as Tesco, the
largest in the UK, prices are averaged over those posted in several hundred of its stores
nationwide. While store managers may have some flexibility over pricing, particularly
for perishable items, the large number of products stocked in most stores (which
typically exceeds 25,000) mitigates against widespread differences between stores.
Also, major UK grocery retail chains claim that national pricing strategies are the norm
for the bar-coded food products (Competition Commission, 2000).
One key feature of the prices is that they incorporate the effect of promotional activity.
The price data used in this study include all promotional activity, whether in the form
of price (e.g. ‘50% off’) or quantity (‘buy-one-get-one-free’) discounts. Discounts
7 The 15 categories are orange juice, instant coffee, breakfast cereals, teabags, yoghurt, wrapped bread, tinned tuna, tinned tomatoes, tinned soup, corned beef, fish fingers, frozen peas, frozen chips, Jam and frozen pizza. 8 Time series are contiguous (in that there are no missing observations once the time series has begun) in 100% of cases, although some (10%) start later than 8th September. All time series finish in the week ending 17th April 2004.
5
relating to store ‘loyalty’ cards are not included since they apply to the consumer’s
total spend rather than the prices of specific products.
The data set identifies products at a highly detailed level. In general, two products are
distinct if they have different bar-codes, so that 100 gram and 200 gram jars of the
same brand of instant coffee are different products for which separate prices are
recorded. Furthermore, many of the products are national brands that are sold by all
retail chains, so the data set contains retailer-specific prices of such products. We
identify each retailer-product combination with a Unique Product Code (UPC), so that,
for example, a 100 gram jar of Nescafe ‘Gold Blend’ instant coffee stocked by Tesco
and Sainsbury are two separate UPCs each with their own time series of weekly prices.
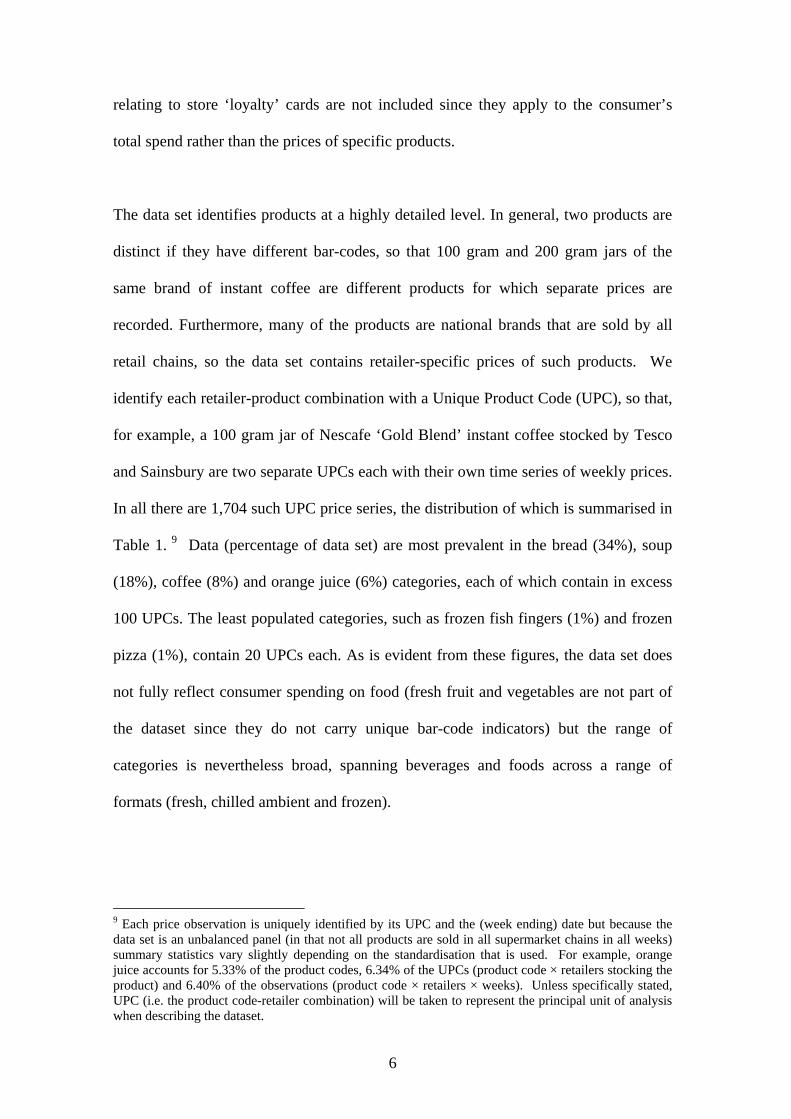
In all there are 1,704 such UPC price series, the distribution of which is summarised in
Table 1. 9 Data (percentage of data set) are most prevalent in the bread (34%), soup
(18%), coffee (8%) and orange juice (6%) categories, each of which contain in excess
100 UPCs. The least populated categories, such as frozen fish fingers (1%) and frozen
pizza (1%), contain 20 UPCs each. As is evident from these figures, the data set does
not fully reflect consumer spending on food (fresh fruit and vegetables are not part of
the dataset since they do not carry unique bar-code indicators) but the range of
categories is nevertheless broad, spanning beverages and foods across a range of
formats (fresh, chilled ambient and frozen).
9 Each price observation is uniquely identified by its UPC and the (week ending) date but because the data set is an unbalanced panel (in that not all products are sold in all supermarket chains in all weeks) summary statistics vary slightly depending on the standardisation that is used. For example, orange juice accounts for 5.33% of the product codes, 6.34% of the UPCs (product code × retailers stocking the product) and 6.40% of the observations (product code × retailers × weeks). Unless specifically stated, UPC (i.e. the product code-retailer combination) will be taken to represent the principal unit of analysis when describing the dataset.
6
As Table 1 also shows, seven categories contain products in both branded (sold with
the manufacturer’s name) and own-label (sold under the retailer’s name) forms. Own-
label products with the same product profile (e.g. an 800 gram standard medium sliced
white loaf) are treated as one product and have the same product code in the data base.
Retailer-specific prices of these products (i.e. UPCs) represent the Tesco own-label
800 gram standard medium sliced white loaf or the Sainsbury own label 800 gram
standard medium sliced white loaf, for example. Hence, own-label versions of the
same product are treated analogously to the branded products stocked by multiple
retailers in the Nielsen Scantrack data set. In the UK, where sales of own-label
products account for a significant minority of the total consumer spend, this dimension
of the data set offers potential insights in to any differences between the pricing of
manufacturer- and retailer- branded products. Own-label products account for nearly
one-fifth of the products listed in the data set.
Table 1 Here
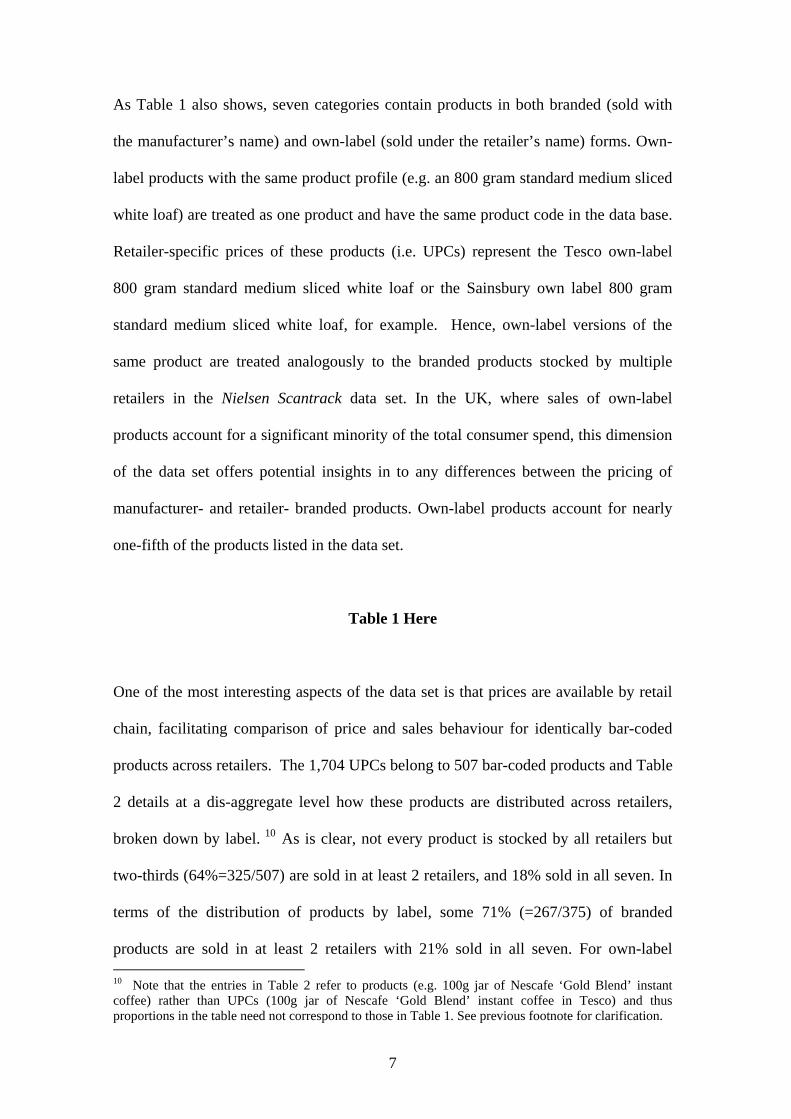
One of the most interesting aspects of the data set is that prices are available by retail
chain, facilitating comparison of price and sales behaviour for identically bar-coded
products across retailers. The 1,704 UPCs belong to 507 bar-coded products and Table
2 details at a dis-aggregate level how these products are distributed across retailers,
broken down by label. 10 As is clear, not every product is stocked by all retailers but
two-thirds (64%=325/507) are sold in at least 2 retailers, and 18% sold in all seven. In
terms of the distribution of products by label, some 71% (=267/375) of branded
products are sold in at least 2 retailers with 21% sold in all seven. For own-label 10 Note that the entries in Table 2 refer to products (e.g. 100g jar of Nescafe ‘Gold Blend’ instant coffee) rather than UPCs (100g jar of Nescafe ‘Gold Blend’ instant coffee in Tesco) and thus proportions in the table need not correspond to those in Table 1. See previous footnote for clarification.
7
products, comparable statistics are 43% and 11% suggesting that coverage is
reasonably broad across the market as a whole, particularly for branded goods.
Table 2 Here
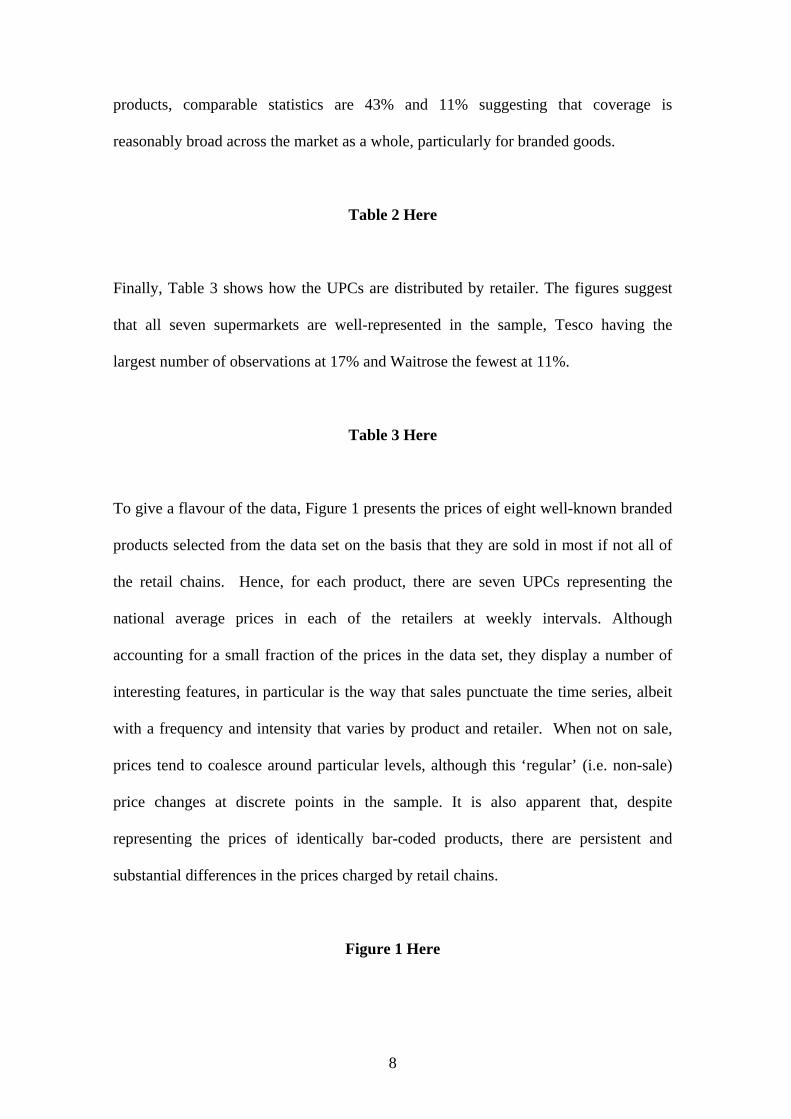
Finally, Table 3 shows how the UPCs are distributed by retailer. The figures suggest
that all seven supermarkets are well-represented in the sample, Tesco having the
largest number of observations at 17% and Waitrose the fewest at 11%.
Table 3 Here
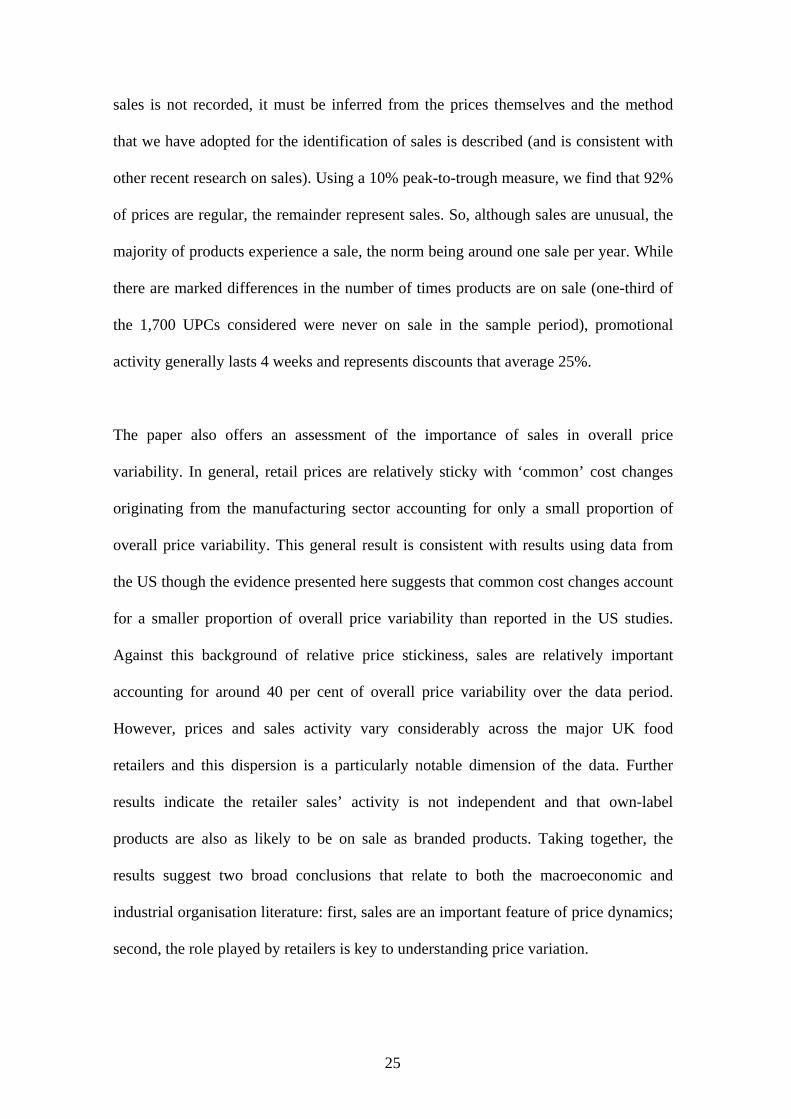
To give a flavour of the data, Figure 1 presents the prices of eight well-known branded
products selected from the data set on the basis that they are sold in most if not all of
the retail chains. Hence, for each product, there are seven UPCs representing the
national average prices in each of the retailers at weekly intervals. Although
accounting for a small fraction of the prices in the data set, they display a number of
interesting features, in particular is the way that sales punctuate the time series, albeit
with a frequency and intensity that varies by product and retailer. When not on sale,
prices tend to coalesce around particular levels, although this ‘regular’ (i.e. non-sale)
price changes at discrete points in the sample. It is also apparent that, despite
representing the prices of identically bar-coded products, there are persistent and
substantial differences in the prices charged by retail chains.
Figure 1 Here
8
Using the entire data set, the average difference between the highest and lowest weekly
prices paid for products with the same barcode is 30%. For branded products this
dispersion is 27% and, for own-label products, 45%. While these figures underline the
fact that price dispersion is pervasive and significant, it seems likely that such
dispersion arises from not only from persistent price differentials across retailers but
also the compounding effect of sales.
Before we attempt to disentangle the contribution of these effects to overall price
variation, it is useful to investigate the dispersion of average prices charged by each
retailer over the sample. To do so, consider Table 4 which details the average prices of
products in each retailer for branded, own-label and all products (i.e. branded and own-
label combined). As alluded to above, not every product is stocked by all retailers so
the table reports prices based on two classifications of products: (a) those products
stocked in each retailer and (b) the subset of 92 products (comprising 78 branded 14
own-label) and that are stocked by all seven retailers. Being common to all the
retailers, these products typically represent market leaders, major national brands and
everyday own-label products such as standard white loaf and tinned tomatoes. The
table also lists the rank order of average prices by supermarket (1 denoting the
cheapest) and the number of price observations upon which the averages are based.
With differences according to the product grouping and label status, the picture is a
complex one, but a few features are particularly noteworthy. In terms of the
classification given by (a) namely, the products that each supermarket stocks, there
appears to be a cluster of supermarkets (Asda, Somerfield and Kwik Save) selling
9

branded products at low cost and another cluster of mainstream retailers (comprising
Asda, Tesco and Sainsbury) selling own-label products at low cost.
While offering a useful summary of pricing across retailers, it is price comparisons
based on a common basket of products that should generate a more accurate
comparison. Using the prices of the 92 products stocked in all seven retailers, we find
that a single cluster of supermarkets (Asda, Tesco, Sainsbury and Kwik Save) offers
low prices in both branded and own-label product categories. One retailer (Asda)
appears in all such clusters and leads the rankings whichever way the data are
classified. While it offers the same average price for the set of branded products as the
UK’s largest retailer, Tesco, it is prices of like-for-like own-label products are
markedly lower than its rivals.
Overall, the following stylised facts emerge from this simple analysis of average
prices, namely: (i) the average prices for national brands and brand leaders are
remarkably similar, particularly among the four retailers with the lowest average
prices; (ii) there is a significant premium for branded products; (iii) when comparing
the like-for-like products in our sample, it is the mainstream retailers that offer the
lowest prices for both branded and own-label products. Clearly, when assessing the
role of sales in retail price variation, we need to control for the underlying intra-retailer
price differences at the UPC level.
Table 4 Here
10

3. Creating Sales Data
In order to investigate the impact of sales, an indicator variable is created to identify
sale periods. Prices are generally not declared as ‘sale’ or ‘regular’ by manufacturers or
retailers in the data sets constructed by government departments or commercial
organisations, with the result that the identification of sale periods is based upon the
prices themselves. Broadly speaking, sales are simply periods of temporary price
reduction, although the precise definition employed in empirical work varies. For
example, prices supplied by the Bureau of Labour Statistics (BLS) for the construction
of the U.S. Consumer Price Index is identified as ‘on sale’ if the product is sold below
its ‘regular selling price’, as assessed by the Bureau’s field agents in the monthly
survey. Nakamura and Steinsson (op. cit.) use this sales flag to identify sale periods.
Hosken and Reiffen (op. cit.) also use BLS data but define a sale with reference to the
actual behaviour of prices, rather than the field agents’ assessment. Specifically, if a
price falls by more than some fixed percentage (they consider 10% and 20%) between
two adjacent months (m-1 and m) but is then reversed in the following month (i.e.
between m and m+1), the product is treated as being on sale in month m. In other
words, a product is recorded as being ‘on sale’ in month m if the prices in months m-1
and m+1 are markedly (i.e. 10% or 20%) higher. Unlike the Nakamura and Steinsson
(op. cit.) measure, this definition implicitly restricts sales to last one month, although
this is probably not an unreasonable assumption in the majority of cases. Nevertheless,
because price setting typically occurs on a weekly basis, some of the finer detail of
price adjustment is inevitably obscured by the use of monthly data.
In recent studies analysing weekly price data, definitions of sale prices are modified to
reflect the data set’s higher frequency. For example, Campbell and Eden (2005) define
11
a sale to have occurred if a price decline of 10% or more between weeks w-1 and w is
then completely reversed within two weeks (i.e. in w +1 or w+2). Using this definition,
a sale lasts for a minimum of one and a maximum of three weeks. Berck et al. (op.cit.)
consider price falls of 25%, 35% and 50%, but use the store’s modal price ( ) over a
two year period as the basis for comparison rather than the price in the week preceding
the decline. Using this definition, sales are recorded for all weeks w in which the price
falls a certain percentage below . While this approach leaves the length of sales
unconstrained, it relies upon the mode being representative of the non-sale (or
‘regular’) price. Where regular prices changes over time (reflecting general inflation or
specific changes in production costs, for example), the use of the mode to identify sales
is arguably less than ideal (see below).
p~
p~
11
The foregoing discussion serves to highlight some of the practical difficulties in
identifying sales (‘periods of temporary low prices’) from price data alone, namely the
duration of ‘temporary’, the magnitude of ‘low’ and the reference price used in the
assessment of each. Mindful of these considerations, we define a sale as a period
during which price falls by at least x% of the observation immediately preceding the
decline in prices, and then which is reversed within 12 weeks. With this definition,
there are several points to note. First, sales of long duration (i.e. less than 3 months) are
allowed for. While sales of 2-4 weeks are typically believed to be the norm and sales
of longer than 6 weeks rare in UK food retailing (Competition Commission, 2000
p.116), this measure does allow for the (albeit infrequently observed) longer sale
durations. Second, it is the cumulative price drop (i.e. the peak-to-trough difference)
11 It is noteworthy that in their study of refrigerated and frozen orange juice, Berck et al. (2008) find evidence of a clear mode in fewer than half the refrigerated products and in two-thirds of frozen products they analyse.
12
that is used rather than any week-on-week change in price that is used to define the
magnitude of price change. This allows for price changes that are staggered over more
than a single week at the start or end of a sale period. This may be important in our
data if a national price promotion is implemented over adjacent weeks. Third, it is
actual prices that act as the reference price. This is likely to be useful in cases where
there is no single non-sale price that applies over the entire sample. Hence, the regular
price, refers to a state of nature (paralleling the status of the term sale price) rather than
a fixed value such as the mode. Fourth, in recognition of the fact that results inevitably
depend on the price decline that is chosen, we consider three thresholds, namely x =
10%, 25%, and 35%. Fifth, the sale period ends when prices return to a new regular
price. With this condition, prices do not need to return to their pre-sale level. Finally,
all prices between the initial decline and the subsequent reversal are counted as sale
prices.
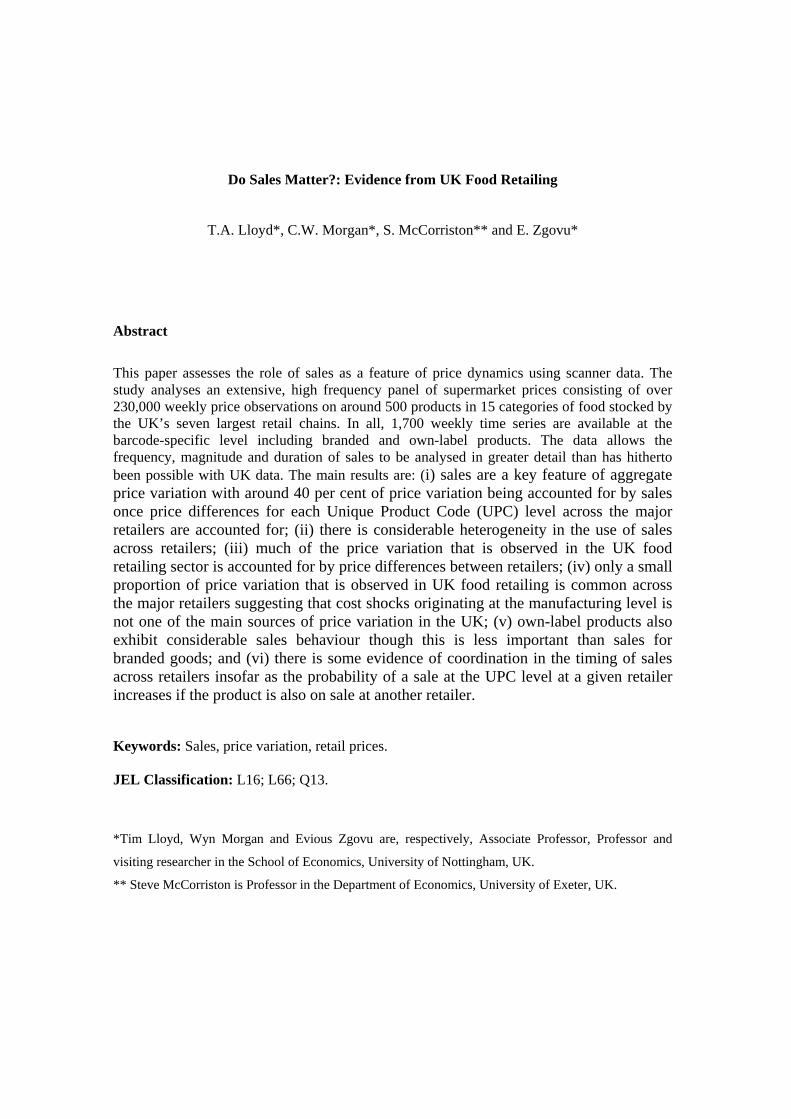
In order to illustrate the effect of these conditions in the creation of a sale indicator,
consider the stylised weekly time series of prices depicted in Figure 2. While the figure
is by no means representative of the price series in the data set, it exhibits some of the
more problematic features that characterise some series, most notably changes in the
regular price and staggered sale prices. At the top of the figure are labels (R and S
denoting regular and sales prices respectively) generated by application of our sales
algorithm with a 10% threshold to the stylised data. Numbers adjacent to the price
levels denote the (non-zero) week-on-week percentage price changes.
In the figure, there are three episodes of lower prices, commencing at weeks , and
, although only one (at time and shaded grey)) is recorded as a ‘sale’ by our
αt βt
χt βt
13
definition. This owes to the fact this is the only one of the three periods which satisfies
the conditions that (a) the peak-to-trough price drop exceeds 10% and (b) the price
returns to a level similar to the pre-sale level within 12 weeks. Note that neither of the
(9%) falls that make up the 18% cumulative decline would trigger a sale using a 10%
week-on-week criterion. The two other periods of price decline shown (at and )
do not qualify as sales by our definition because in the first case the price decline (of
2%) is too small; and in the second case, the decline is not reversed. The ability to
discriminate between sale episodes and periods in which the regular price falls is useful
since both aspects of behaviour are apparent in some of the price series over the sample
period. The hypothetical data also illustrate the limitations of using the sample mode
(denoted by
αt χt
p~ in Figure 2) as a measure of the regular price or indeed monthly (rather
than weekly) prices, to detect sales. Whereas changes (or trends) in the regular price
undermine the former, aggregation confounds the latter; neither identifies the sale in
Figure 2.
Figure 2 Here
While the flexibility of the sales definition we have adopted in this paper seeks to
overcome some of the key issues in data of this sort, it should not be overlooked that
any set of criteria designed to distinguish sales from changes in the regular price using
prices alone are to some extent arbitrary. As a guiding principle, it seems reasonable
that the larger the transitory price decline is, the more likely it is that the observations
represent a sale. For this reason, we initially consider (peak-to-trough) price drops of
10%, 25% and 35% in sales identification, a description of which is presented in the
following section.
14
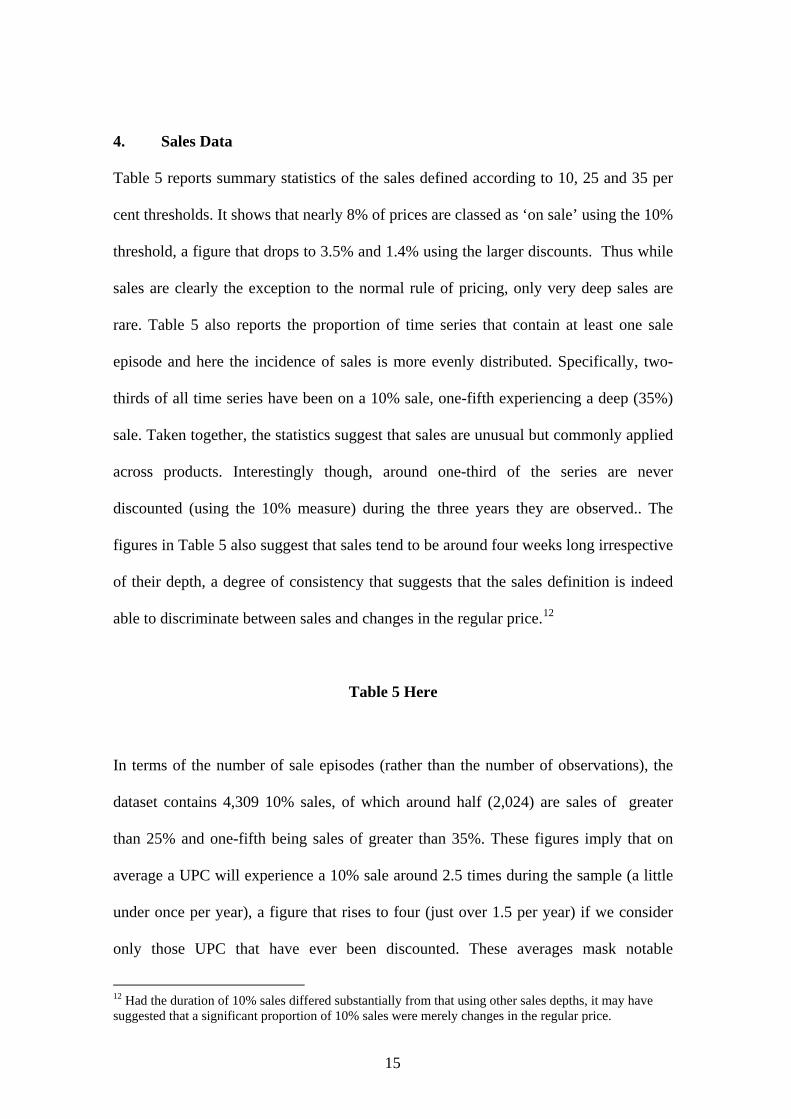
4. Sales Data
Table 5 reports summary statistics of the sales defined according to 10, 25 and 35 per
cent thresholds. It shows that nearly 8% of prices are classed as ‘on sale’ using the 10%
threshold, a figure that drops to 3.5% and 1.4% using the larger discounts. Thus while
sales are clearly the exception to the normal rule of pricing, only very deep sales are
rare. Table 5 also reports the proportion of time series that contain at least one sale
episode and here the incidence of sales is more evenly distributed. Specifically, two-
thirds of all time series have been on a 10% sale, one-fifth experiencing a deep (35%)
sale. Taken together, the statistics suggest that sales are unusual but commonly applied
across products. Interestingly though, around one-third of the series are never
discounted (using the 10% measure) during the three years they are observed.. The
figures in Table 5 also suggest that sales tend to be around four weeks long irrespective
of their depth, a degree of consistency that suggests that the sales definition is indeed
able to discriminate between sales and changes in the regular price.12
Table 5 Here
In terms of the number of sale episodes (rather than the number of observations), the
dataset contains 4,309 10% sales, of which around half (2,024) are sales of greater
than 25% and one-fifth being sales of greater than 35%. These figures imply that on
average a UPC will experience a 10% sale around 2.5 times during the sample (a little
under once per year), a figure that rises to four (just over 1.5 per year) if we consider
only those UPC that have ever been discounted. These averages mask notable
12 Had the duration of 10% sales differed substantially from that using other sales depths, it may have suggested that a significant proportion of 10% sales were merely changes in the regular price.
15

differences between branded and own-label products. While the duration of sales is
similar, branded products tend to be discounted both more frequently and more deeply
than own-label products. As is clear from the distribution of sale episodes per UPC
displayed in Figure 2, most products that have been on sale, have only ever been
discounted once during the sample frame, although there are a small number of
frequently discounted products.
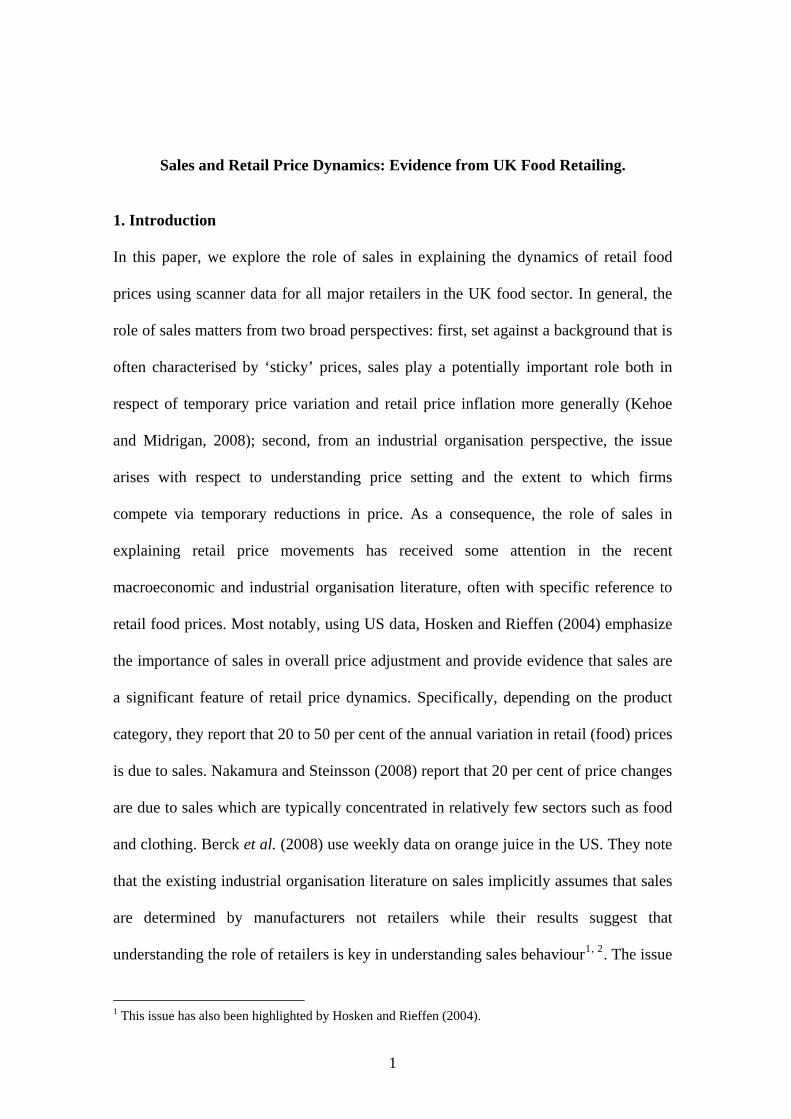
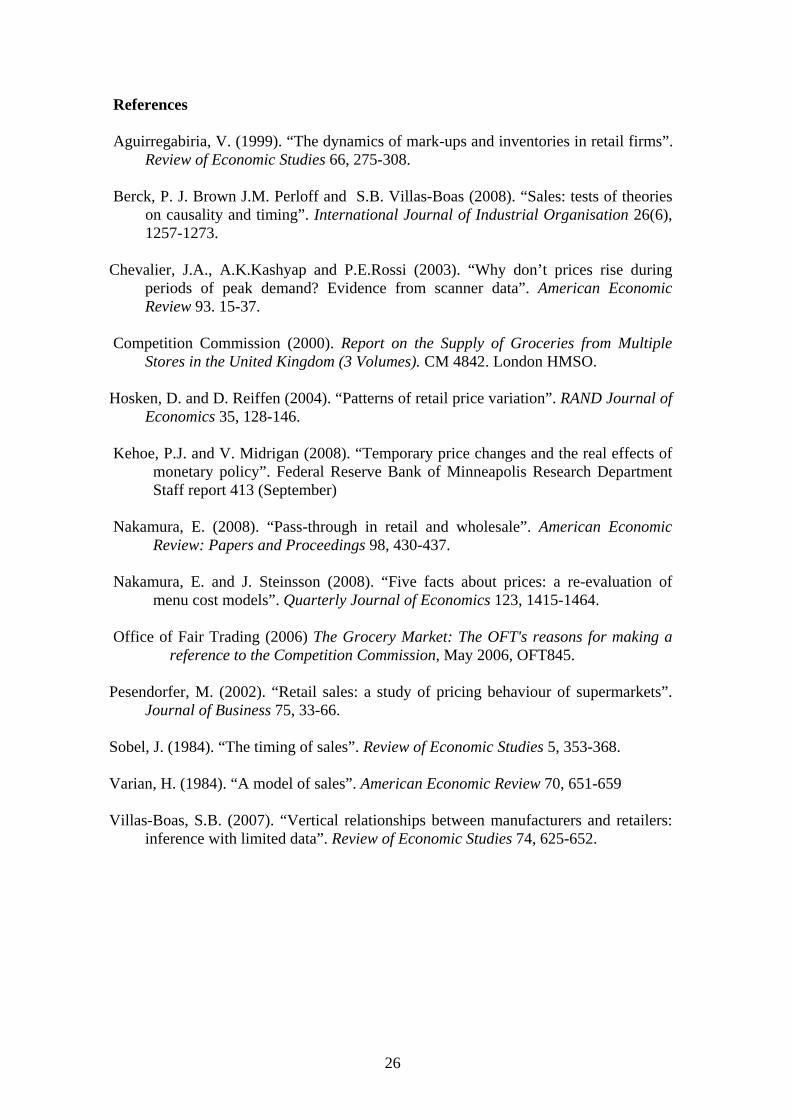
For a more complete picture the distribution of sales depth, consider Figure 3. While
sales in excess of 80% have occurred in a handful of cases, discounts in excess of 50%
are rare, accounting for less than 5% of all sales. The majority of sales represent
discounts of between 10 and 30%, the median discount being 24%.
Figure 3 Here
Figure 4 Here
Finally, to gain an impression of the use of sales by each of the national retailers,
consider Figure 5 which shows the proportion of each retailer’s prices that are sales
under the three thresholds. There are quite marked differences across retailers: Asda
uses sales rarely (almost one-tenth of the average); Safeway, Somerfield and Kwik
Save form a group of ‘discounters’ in that the use of sales is above average for the food
retailing sector as a whole; Tesco, Sainsbury and Waitrose are “average” users of sales
activity. This classification is consistent across the depth of sales but becomes
increasingly apparent the deeper the sale. All use deep sales rarely, this being even less
16
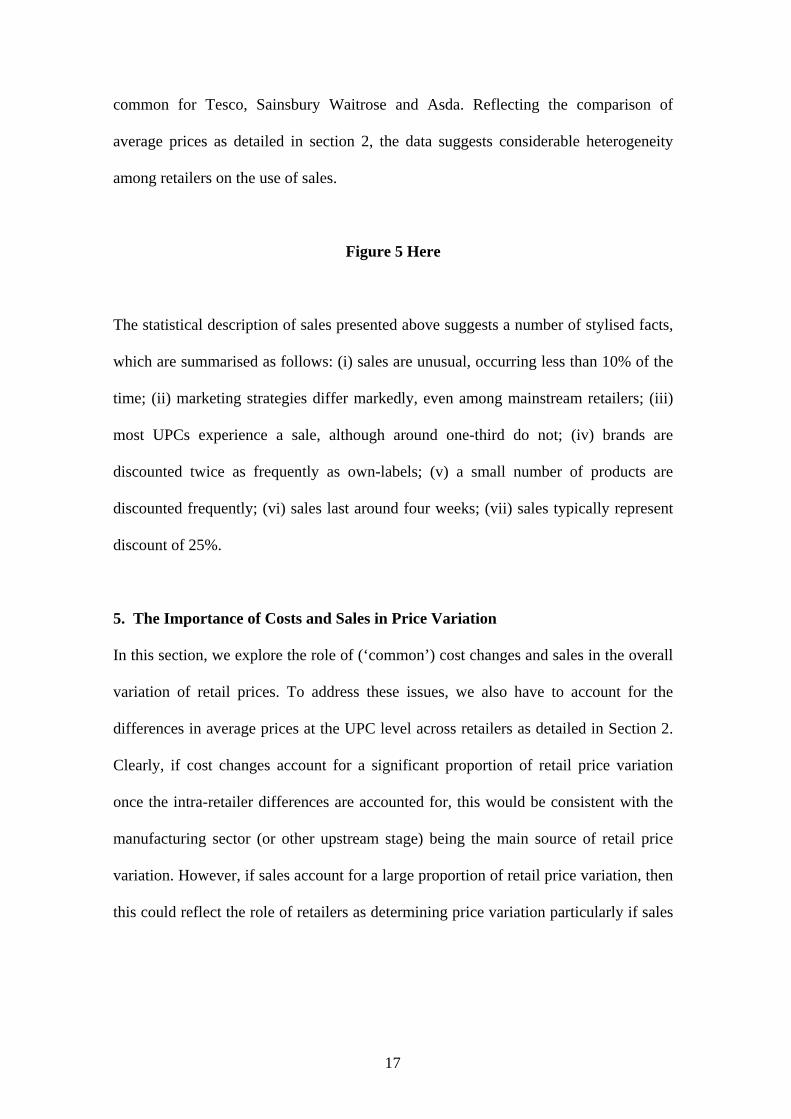
common for Tesco, Sainsbury Waitrose and Asda. Reflecting the comparison of
average prices as detailed in section 2, the data suggests considerable heterogeneity
among retailers on the use of sales.
Figure 5 Here
The statistical description of sales presented above suggests a number of stylised facts,
which are summarised as follows: (i) sales are unusual, occurring less than 10% of the
time; (ii) marketing strategies differ markedly, even among mainstream retailers; (iii)
most UPCs experience a sale, although around one-third do not; (iv) brands are
discounted twice as frequently as own-labels; (v) a small number of products are
discounted frequently; (vi) sales last around four weeks; (vii) sales typically represent
discount of 25%.
5. The Importance of Costs and Sales in Price Variation
In this section, we explore the role of (‘common’) cost changes and sales in the overall
variation of retail prices. To address these issues, we also have to account for the
differences in average prices at the UPC level across retailers as detailed in Section 2.
Clearly, if cost changes account for a significant proportion of retail price variation
once the intra-retailer differences are accounted for, this would be consistent with the
manufacturing sector (or other upstream stage) being the main source of retail price
variation. However, if sales account for a large proportion of retail price variation, then
this could reflect the role of retailers as determining price variation particularly if sales
17
feature significantly for the prices of branded and own-label products and given that
sales activity appears to be fairly heterogeneous across retailers.13
Specifically, we use simple regression models to gauge the relative importance of these
in price variation. To do so, we estimate price regressions containing increasingly rich
sets of dummy variables: in Model 1, the baseline specification, we fit a set of UPC-
based dummy variables to the price data (i.e. one dummy for each UPC), around which
variation can be assessed. In this model, the coefficient attached to each UPC dummy
represents the average weekly price of a bar-coded product (such as a 200g jar of
Nescafe standard blend instant coffee) at each retailer stocking the product over the
sample period. In Model 2, the UPC-based dummies are augmented with a set of
product-level variables that represent the market (i.e. across all supermarkets) average
regular price for each product (such as a 200g jar of Nescafe standard blend instant
coffee) in which all sale prices have been replaced by the last regular price preceding
each sale. Purged of promotional prices, this variable offers a means by which we can
capture underlying movements in the regular prices, of which changes in production
costs (such as the price of coffee beans) are likely to matter.14 In Model 3, a set of
sales dummies is also included, each dummy representing a unique sale episode. With
prices in all models being expressed in natural logarithms, the regression standard
errors represent the standard deviation of UPC prices as a proportion of the mean level
during the sample, and it is this that we use to evaluate the impact of ‘costs’ and sales
in UPC level price variation. These results suggest that retail food prices in the UK are
fairly sticky, that ‘common’ cost changes are not a principal cause of retail price 13 Of course, the variation of sales activity across retailers could reflect price discrimination by manufacturers given the heterogeneity of sales behaviour across retailers. However, the presumption would be that retailers (not manufacturers) would be able to determine the (sale) prices of own-label products. 14 Nakamura (2008) and Hosken and Rieffen (2004) offer similar tests on US data.
18
variation and that, in the context of relatively sticky prices, sales activity account for a
significant proportion of the retail price variation that is observed.
To facilitate comparison across the models, we use price data from the 967 UPCs that
are sold in at least two supermarkets and have experienced a sale of at least 10% during
the sample period. The parameters of Models 1, 2 and 3 are estimated by ordinary least
squares using 132,280 price observations and the regression standard errors (rse)
reported in Table 6. Results for the ‘All’ regressions head the table with results by label
and retailer appended beneath. The results suggest that the standard deviation of prices
at the UPC level is around 12%, a figure that changes little we confine the analysis to
brands or own-label. Allowing for our cost proxy- the movement in the industry
average regular prices- (Model 2) reduces the standard deviation by a little over one
percentage point, a result that holds irrespective of the brand/own-label distinction.
Accounting for sales (Model 3) has a more marked effect, reducing the variation by
over four percentage points but here the effect of sales is larger for brands (4.6%) than
own label products (3.1%).
These results are comparable with those of Hosken and Rieffen (op.cit.) and Nakamura
(op.cit.). They also conclude that sales account for a high proportion of price variability
though the extent of price stickiness is lower for the data used here than Nakamura (op.
cit.) finds for the US. In her study, she reports that only 16 per cent of price variation is
common across all stores selling an identical product. The reduction in the rse as we
move from Model 1 to Model 2 suggests that around 9 per cent of price variation is
common across the UK food retailing sector.
19
Turning to price variation by retailer, Table 6 suggest a group of retailers headed by
Safeway (at 15%) with relatively high price variation, and a group of retailers lead by
Asda (at 9%) with the lowest variation. Interestingly, while Asda uses sales
infrequently (see Figure 5), its’ price variation is only marginally lower than other
mainstream retailers, suggesting that Asda has a tendency to change regular prices
more than other similar retailers. The effect of our costs measure is broadly the same
across retailers with the result that patterns in overall price variation are driven by
promotional behaviour.
Comparison of the variation between the models in Table 6, delivers estimates of the
contribution of costs and sales in UPC price variation. Using the ‘All Products’
classification, costs account for 11% of the price variation, a figure which changes little
by label. Of primary interest is the contribution of sales, which turns out to be 37%
overall, with a marked difference between brands and own-label products (39% and
26% respectively). The corresponding proportions by retailer are shown in Figure 6,
where the patterns in the absolute levels of price variation are reflected in the relative
measures, namely that, while industry costs have broadly relatively small and broadly
similar effects across retailers, the contribution of sales is around 40% of UPC price
variation in all with the exception of Asda.
Table 6 Here
Taken together, the picture that emerges from this analysis is one in which sales
dominate the effect of costs (as proxied by industry average regular prices, at least) in
price variation and combined they account for nearly two-thirds of price variation at
20

the UPC level. Furthermore, sales are more important for branded products so that by
these measures, idiosyncratic shocks are relatively more important for own-label
products than brands, possibly reflecting their less uniform composition within the
product definition. While the market segments by sales behaviour to some extent, it is
also remarkable how important sales are for all retailers.15
Figure 6 Here
6. Are Sales Across Retailers Related?
Since we have prices by retailer, we can address whether sales behaviour is related
across retailers. Recall, first of all, that the use of sales by retailer varies (see Figure 6).
Taking sales greater than 25% as the benchmark, three retailers are higher employ sales
than average, Tesco (the market leader) is a below average user of sales, while Asda
hardly ever employed sales over the sample period. Taken from a general perspective,
the raw data therefore indicates that sales are unlikely to be a common experience
across retailers. However, to address the issue more directly, we assess whether the
probability of a sale in one retailer is influenced by a sale in another retailer using the
data available at the UPC level. The central idea here is to determine whether a sale in
a specific UPC introduced by a given retailer is a random event or may be related to the
presence of a sale in one or more rival retailers.
15 As a final step, we carried out the same analysis by UPC. As Hosken and Riefen (2004) note, the relative role of costs and sales can vary across products. The results do not differ significantly from the above: prices are relatively sticky across for UPCs that constitute a product group and the role of costs is fairly marginal in each case. Sales account for a higher than average proportion of price variation some frozen UPCs (e.g. peas, pizzas) and a lower than average proportion of price variation for bread. Since the results do not provide additional insights beyond those made above, we do not report them in the text. Detailed results are available upon request.
21
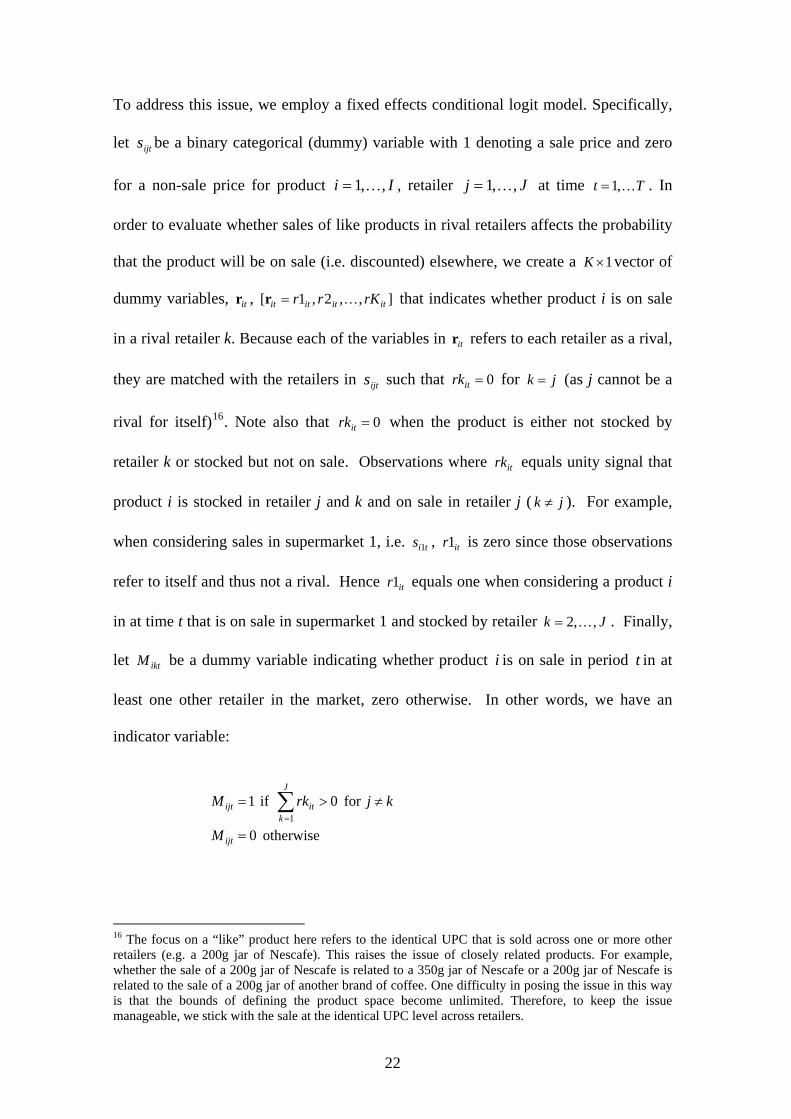
To address this issue, we employ a fixed effects conditional logit model. Specifically,
let be a binary categorical (dummy) variable with 1 denoting a sale price and zero
for a non-sale price for product
ijts
Ii ,,1K Jj ,,1K= , retailer = at time . In
order to evaluate whether sales of like products in rival retailers affects the probability
that the product will be on sale (i.e. discounted) elsewhere, we create a
Tt K,1=
1×K vector of
dummy variables, , that indicates whether product i is on sale
in a rival retailer k. Because each of the variables in r refers to each retailer as a rival,
they are matched with the retailers in such that
itr 2,1[ rr=r ],, itit rKK
ijts
itit
it
0=itrk k for j= (as j cannot be a
rival for itself)16. Note also that 0=itrk when the product is either not stocked by
retailer k or stocked but not on sale. Observations where equals unity signal that
product i is stocked in retailer j and k and on sale in retailer j (
itrk
jk ≠ ). For example,
when considering sales in supermarket 1, i.e. , is zero since those observations
refer to itself and thus not a rival. Hence equals one when considering a product i
in at time t that is on sale in supermarket 1 and stocked by retailer k
ti1s r
,
it1
itr1
J,2 K= . Finally,
let be a dummy variable indicating whether product is on sale in period t in at
least one other retailer in the market, zero otherwise. In other words, we have an
indicator variable:
iktM i
otherwise 0
for 0 if 11
=
≠>= ∑=
ijt
kitijt
M
kjrkMJ
16 The focus on a “like” product here refers to the identical UPC that is sold across one or more other retailers (e.g. a 200g jar of Nescafe). This raises the issue of closely related products. For example, whether the sale of a 200g jar of Nescafe is related to a 350g jar of Nescafe or a 200g jar of Nescafe is related to the sale of a 200g jar of another brand of coffee. One difficulty in posing the issue in this way is that the bounds of defining the product space become unlimited. Therefore, to keep the issue manageable, we stick with the sale at the identical UPC level across retailers.
22
If product i is only stocked by one supermarket, the set of J dummy variables will
each be zero and hence will be zero. Where this happens (about one-third of the
products are only sold in one supermarket), product i drops out of the regression
analysis. To investigate whether sales are affected by presence of a sale elsewhere in
the market, we estimate:
itrk
ijtM
ijtijtiijt Ms εβα ++= (1)
where the iα represent the UPC-based heterogeneity (fixed effects) and ijtε are
disturbances with constant mean and variance. Assuming that ijtε are uncorrelated with
the timing of sales in supermarkets, i.e. 0]|E[ =ijtijt Mε then, given that is a binary
variable, implies that
ijts
]|1[P]|E[ MsM == ijtijtijtijts β is the predicted partial marginal
probability of a sale on a product given a sale of the same product in at least one other
supermarket at time period t. Clearly, if a sale of a product at one retailer is
independent of the identical product being on sale at any other retailer, 0=β . Where
0>β ( 0<β ), this indicates that a sale in a given retailer for a specific UPC is more
(less) likely given the existence of a sale elsewhere in period t.
We further amend the test by identifying separately whether the sale of the product is
related across retailers for own-label products. In this case, the own-label definition
relates to the “same” own-label product sold across retailers. For example, we are
relating the sale of Tesco 1 litre orange juice with Sainsbury’s 1 litre orange juice. A
priori, we may expect less relatedness in the sale of products across retailers when it
applies to own-label goods.
23
Table 7 reports the estimated probability that a product will be on sale given that it is
on sale in at least one other retailer using the marginal effects of the conditional logit
model. The results, which are reported for both branded and own-label products, reject
the hypothesis that a sale by a retailer is unrelated to the existence of a sale in the same
UPC elsewhere for branded products but not in the case of own-labels. Specifically,
(10%) sales in branded products increase the likelihood of sales in rivals stocking the
product by some 14.3%, a probability that rises slightly for deeper sales. Thus, sales
on branded products are not random events, but are to some extent co-ordinated,
suggesting a tendency for promotions to be uniformly offered across (at least a subset
of) retailers. However, the probability is not ‘high’ in the sense that the results do not
indicate that there is perfect coordination in the use of sales. Own-label products
present a contrasting picture: namely, for 10% and 25% sales, the results indicate that
sales are independent across retailers though, for the 35% sale category, sales are not
independent. Given that sales with the 35% benchmark are considerably less common,
we can conclude that in most cases, sales of own-label goods by retailers are
independent. 17
Table 7 Here
7. Conclusions
This paper presents an analysis of promotional sales using an extensive, high frequency
micro-economic database of supermarket prices in the UK. Given that the timing of
17 We also investigated whether sales behaviour by retailer related to the intensity of sales behaviour across other retailers. Specifically, the discussion in the text relates to whether the sale by one retailer related to the product being on sale at any one of the other retailer. We further investigated the issue in terms of whether the probability of a sale by one retailer depended on how many other retailers the product was on sale at. The results indicate that the probability of a sale increases depending on the number of retailer which also had the product on sale. For example, for the greater than 25% sale benchmark, the probability that the product was on sale at one other retailer was 16.2%; if the product was on sale at two or more retailer, the probability increased to 24.7% with estimates statistically significant at the 5% level. Results are available on request.
24
sales is not recorded, it must be inferred from the prices themselves and the method
that we have adopted for the identification of sales is described (and is consistent with
other recent research on sales). Using a 10% peak-to-trough measure, we find that 92%
of prices are regular, the remainder represent sales. So, although sales are unusual, the
majority of products experience a sale, the norm being around one sale per year. While
there are marked differences in the number of times products are on sale (one-third of
the 1,700 UPCs considered were never on sale in the sample period), promotional
activity generally lasts 4 weeks and represents discounts that average 25%.
The paper also offers an assessment of the importance of sales in overall price
variability. In general, retail prices are relatively sticky with ‘common’ cost changes
originating from the manufacturing sector accounting for only a small proportion of
overall price variability. This general result is consistent with results using data from
the US though the evidence presented here suggests that common cost changes account
for a smaller proportion of overall price variability than reported in the US studies.
Against this background of relative price stickiness, sales are relatively important
accounting for around 40 per cent of overall price variability over the data period.
However, prices and sales activity vary considerably across the major UK food
retailers and this dispersion is a particularly notable dimension of the data. Further
results indicate the retailer sales’ activity is not independent and that own-label
products are also as likely to be on sale as branded products. Taking together, the
results suggest two broad conclusions that relate to both the macroeconomic and
industrial organisation literature: first, sales are an important feature of price dynamics;
second, the role played by retailers is key to understanding price variation.
25
References
Aguirregabiria, V. (1999). “The dynamics of mark-ups and inventories in retail firms”. Review of Economic Studies 66, 275-308.
Berck, P. J. Brown J.M. Perloff and S.B. Villas-Boas (2008). “Sales: tests of theories
on causality and timing”. International Journal of Industrial Organisation 26(6), 1257-1273.
Chevalier, J.A., A.K.Kashyap and P.E.Rossi (2003). “Why don’t prices rise during
periods of peak demand? Evidence from scanner data”. American Economic Review 93. 15-37.
Competition Commission (2000). Report on the Supply of Groceries from Multiple
Stores in the United Kingdom (3 Volumes). CM 4842. London HMSO.
Hosken, D. and D. Reiffen (2004). “Patterns of retail price variation”. RAND Journal of Economics 35, 128-146.
Kehoe, P.J. and V. Midrigan (2008). “Temporary price changes and the real effects of
monetary policy”. Federal Reserve Bank of Minneapolis Research Department Staff report 413 (September)
Nakamura, E. (2008). “Pass-through in retail and wholesale”. American Economic
Review: Papers and Proceedings 98, 430-437. Nakamura, E. and J. Steinsson (2008). “Five facts about prices: a re-evaluation of
menu cost models”. Quarterly Journal of Economics 123, 1415-1464. Office of Fair Trading (2006) The Grocery Market: The OFT's reasons for making a
reference to the Competition Commission, May 2006, OFT845. Pesendorfer, M. (2002). “Retail sales: a study of pricing behaviour of supermarkets”.
Journal of Business 75, 33-66. Sobel, J. (1984). “The timing of sales”. Review of Economic Studies 5, 353-368. Varian, H. (1984). “A model of sales”. American Economic Review 70, 651-659 Villas-Boas, S.B. (2007). “Vertical relationships between manufacturers and retailers:
inference with limited data”. Review of Economic Studies 74, 625-652.
26
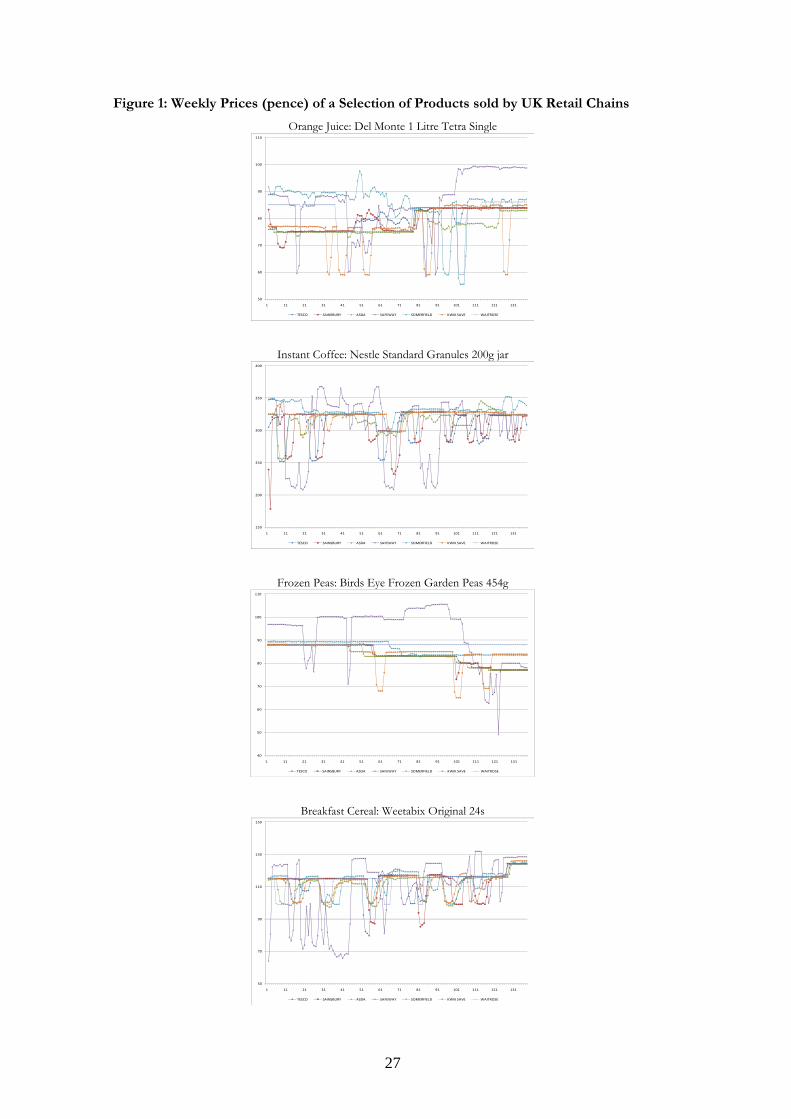
Figure 1: Weekly Prices (pence) of a Selection of Products sold by UK Retail Chains
Orange Juice: Del Monte 1 Litre Tetra Single
50
60
70
80
90
100
110
1 11 21 31 41 51 61 71 81 91 101 111 121 131
TESCO SAINSBURY ASDA SAFEWAY SOMERFIELD KWIK SAVE WAITROSE
Instant Coffee: Nestle Standard Granules 200g jar
150
200
250
300
350
400
1 11 21 31 41 51 61 71 81 91 101 111 121 131
TESCO SAINSBURY ASDA SAFEWAY SOMERFIELD KWIK SAVE WAITROSE
Frozen Peas: Birds Eye Frozen Garden Peas 454g
40
50
60
70
80
90
100
110
1 11 21 31 41 51 61 71 81 91 101 111 121 131
TESCO SAINSBURY ASDA SAFEWAY SOMERFIELD KWIK SAVE WAITROSE
Breakfast Cereal: Weetabix Original 24s
50
70
90
110
130
150
1 11 21 31 41 51 61 71 81 91 101 111 121 131
TESCO SAINSBURY ASDA SAFEWAY SOMERFIELD KWIK SAVE WAITROSE
27

Teabags: PG Tips Blended Teabags 160s
90
140
190
240
290
340
390
1 11 21 31 41 51 61 71 81 91 101 111 121 131
TESCO SAINSBURY ASDA SAFEWAY SOMERFIELD KWIK SAVE WAITROSE
Yoghurt: Muller Light Pot Cheery Single 200g
75
100
125
150
175
200
225
1 11 21 31 41 51 61 71 81 91 101 111 121 131
TESCO SAINSBURY ASDA SAFEWAY SOMERFIELD KWIK SAVE WAITROSE
Sliced Bread: Kingsmill Medium Sliced White 800g
40
50
60
70
80
1 11 21 31 41 51 61 71 81 91 101 111 121 131
TESCO SAINSBURY ASDA SAFEWAY SOMERFIELD KWIK SAVE WAITROSE
Jam: Streamline Strawberry 400g Jar
80
100
120
140
160
1 11 21 31 41 51 61 71 81 91 101 111 121
TESCO ASDA SAFEWAY SOMERFIELD KWIK SAVE
28

Figure 2: Sales Identification in a Stylised Weekly Time Series of Prices
Figure 3: The Frequency of Sales
010
2030
40P
erce
nt
0 10 20 30
Number of 10% sale episodes per upc
-6
-2
13
-9
13
10
-2
-6
2
R R R R R R R S S S S S R R R R R R R R R R R R R R R
price
-9
p~-5
tχ tβ weeks tα
29
Figure 4: Size Distribution of Sales
010
020
030
040
0Fr
eque
ncy
10 20 30 40 50 60 70 80 90
Sale Depth (%)
Figure 5: The Prevalence of Sale Prices by Retailer (%)
30
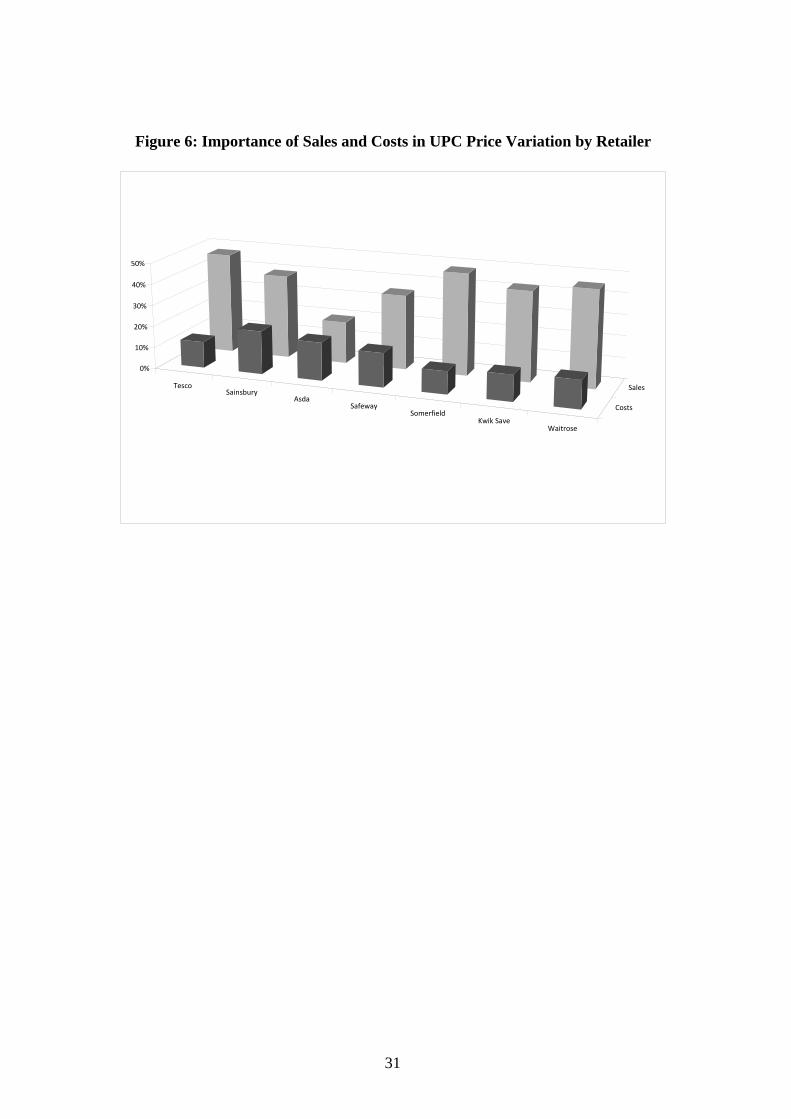
Figure 6: Importance of Sales and Costs in UPC Price Variation by Retailer
Tesco Sainsbury
AsdaSafeway
SomerfieldKwik Save
Waitrose
Costs
Sales
0%
10%
20%
30%
40%
50%
31

Table 1: Distribution of Unique Product Codes (UPCs) by Category
Category Brands Own Label All % of total
Orange Juice 57 51 108 6.34
Instant Coffee 111 27 138 8.10
Tinned Tuna 51 0 51 2.99
Tinned Tomatoes 50 0 50 2.93
Tinned Soup 237 71 308 18.08
Oven Chips 83 0 83 4.87
Corned Beef 25 5 30 1.76
Frozen Peas 34 0 34 2.00
Fish Fingers 20 0 20 1.17
Breakfast Cereal 66 0 66 3.87
Tea Bags 59 8 67 3.93
Yoghurt 65 4 69 4.05
Wrapped Bread 488 95 583 34.21
Jam 33 44 77 4.52
Frozen Pizza 20 0 20 1.17
Total 1,399 305 1,704 100.00
32

Table 2: The Distribution of Products (by label) Stocked by the Supermarkets
Number of Supermarkets
1 2 3 4 5 6 7 Total
Branded
107 46 36 37 28 43 78 375
28% 12% 10% 10% 7% 11% 21% 100%
59% 68% 92% 76% 85% 98% 85% 74%
Own Label
75 22 3 12 5 1 14 132
57% 17% 2% 9% 4% 1% 11% 100%
41% 32% 8% 24% 15% 2% 15% 26%
Total
182 68 39 49 33 44 92 507
36% 13% 8% 10% 6% 9% 18% 100%
100% 100% 100% 100% 100% 100% 100% 100%
Note: Cell entries in bold represent the number of series in each classification, with this number expressed as a percentage of the row (label) and column (sold in) totals respectively in the cell entries beneath.
Table 3: Distribution of Unique Product Codes by Retailer
Chain UPCs % of total
Tesco 292 17.14
Sainsbury 275 16.14
Asda 228 13.38
Safeway 263 15.43
Somerfield 242 14.20
Kwik Save 221 12.97
Waitrose 183 10.74
Total 1,704 100.00
33
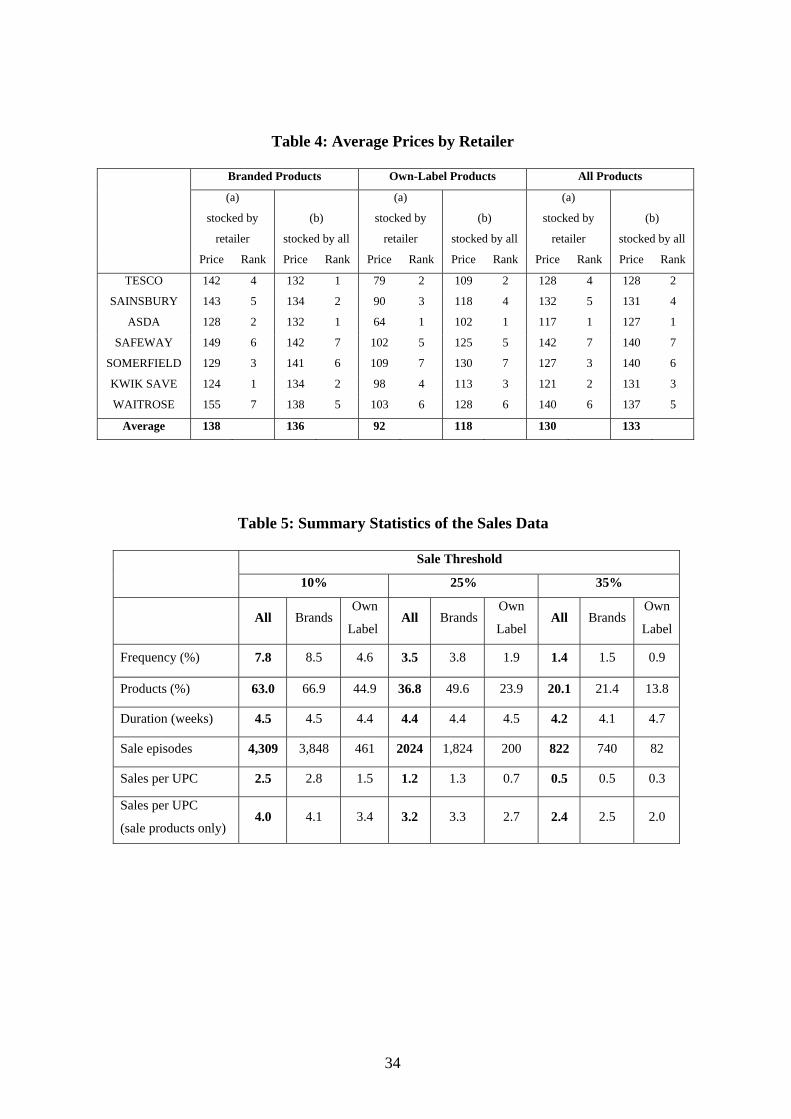
Table 4: Average Prices by Retailer
Branded Products Own-Label Products All Products
(a)
stocked by
retailer
(b)
stocked by all
(a)
stocked by
retailer
(b)
stocked by all
(a)
stocked by
retailer
(b)
stocked by all
Price Rank Price Rank Price Rank Price Rank Price Rank Price Rank
TESCO 142 4 132 1 79 2 109 2 128 4 128 2
SAINSBURY 143 5 134 2 90 3 118 4 132 5 131 4
ASDA 128 2 132 1 64 1 102 1 117 1 127 1
SAFEWAY 149 6 142 7 102 5 125 5 142 7 140 7
SOMERFIELD 129 3 141 6 109 7 130 7 127 3 140 6
KWIK SAVE 124 1 134 2 98 4 113 3 121 2 131 3
WAITROSE 155 7 138 5 103 6 128 6 140 6 137 5
Average 138 136 92 118 130 133
Table 5: Summary Statistics of the Sales Data
Sale Threshold
10% 25% 35%
All Brands
Own
Label All Brands
Own
Label All Brands
Own
Label
Frequency (%) 7.8 8.5 4.6 3.5 3.8 1.9 1.4 1.5 0.9
Products (%) 63.0 66.9 44.9 36.8 49.6 23.9 20.1 21.4 13.8
Duration (weeks) 4.5 4.5 4.4 4.4 4.4 4.5 4.2 4.1 4.7
Sale episodes 4,309 3,848 461 2024 1,824 200 822 740 82
Sales per UPC 2.5 2.8 1.5 1.2 1.3 0.7 0.5 0.5 0.3
Sales per UPC
(sale products only) 4.0 4.1 3.4 3.2 3.3 2.7 2.4 2.5 2.0
34

35
Table 6: Regression Standard Error (standard deviation) of Food Product Prices
Model 1
UPC
Model 2
UPC + Costs
Model 3
UPC+
Costs+Sales
All Products 0.1185 0.1052 0.0609
Label
Brand 0.1182 0.1052 0.0592
Own Label 0.1207 0.1050 0.0737
Retailer
Tesco 0.0949 0.0832 0.0382
Sainsbury 0.1122 0.0894 0.0452
Asda 0.0912 0.0749 0.0569
Safeway 0.1461 0.1227 0.0713
Somerfield 0.1232 0.1100 0.0509
Kwik Save 0.1298 0.1138 0.0589
Waitrose 0.0943 0.0819 0.0388
Table 7: Marginal Effect of a Sale in at Least One Other Retailer on the Probability of a Sale Elsewhere
Ex le tent of Sa 10% Sale 25% Sale 35% Sale Branded 0.143*
(.0084) 0.178*(0.0118)
0.172* (0.0274)
Own‐label Dummy ‐0.0148(.0401)
0.0138(0.0630)
0.342* (0.0572)
Note: Stars denote significance at the five per cent level. Models estimated using robust standard errors.