Embed Size (px)
Citation preview

RESEARCH ARTICLE
Do People Use the Shortest Path? AnEmpirical Test of Wardrop’s First PrincipleShanjiang Zhu1, David Levinson2*
1Department of Civil, Environmental, and Infrastructure Engineering, George Mason University, 4400University Drive, MS 6C1 Fairfax, Virginia, 22030, United States of America, 2 Department of Civil,Environmental, and Geo- Engineering, University of Minnesota, 500 Pillsbury Drive SE, Minneapolis,Minnesota, 55455, United States of America
AbstractMost recent route choice models, following either the random utility maximization or rule-
based paradigm, require explicit enumeration of feasible routes. The quality of model esti-
mation and prediction is sensitive to the appropriateness of the consideration set. However,
few empirical studies of revealed route characteristics have been reported in the literature.
This study evaluates the widely applied shortest path assumption by evaluating routes fol-
lowed by residents of the Minneapolis—St. Paul metropolitan area. Accurate Global Posi-
tioning System (GPS) and Geographic Information System (GIS) data were employed to
reveal routes people used over an eight to thirteen week period. Most people did not choose
the shortest path. Using three weeks of that data, we find that current route choice set gen-
eration algorithms do not reveal the majority of paths that individuals took. Findings from
this study may guide future efforts in building better route choice models.
IntroductionRoute choice analysis investigates the path travelers follow to implement their travel plans. It isthe most frequent, and thus arguably the most important decision travelers make on a dailybasis. Empirical studies show that route and schedule changes are the most dominant reactionsto network changes [1, 2]. Any sound arguments for infrastructure initiatives or policy changesmust be built on precise and reliable prediction of link flow and travel time, and thus on under-lying route choice decisions. Travelers differ in attributes (value of time (VOT), willingness topay, time budgets, etc.), behavioral preferences (e.g. willingness to take risk, willingness toswitch routes with potential savings) experience, and knowledge about travel, all of whichcould lead to significant heterogeneity in route choice behavior. Mainstream research and prac-tice, however, has treated trips as the unit of analysis since the 1950s. This trip-based modelingparadigm assumes homogeneous travelers and tends to focus on some form of User Equilib-rium (UE) state, in which “the journey times in all routes actually used are equal and less thanthose which would be experienced by a single vehicle on any unused route” (known as War-drop’s first principle [3]).
PLOSONE | DOI:10.1371/journal.pone.0134322 August 12, 2015 1 / 18
OPEN ACCESS
Citation: Zhu S, Levinson D (2015) Do People Usethe Shortest Path? An Empirical Test of Wardrop’sFirst Principle. PLoS ONE 10(8): e0134322.doi:10.1371/journal.pone.0134322
Editor: Yan Ropert-Coudert, Institut PluridisciplinaireHubert Curien, FRANCE
Received: August 12, 2014
Accepted: July 9, 2015
Published: August 12, 2015
Copyright: © 2015 Zhu, Levinson. This is an openaccess article distributed under the terms of theCreative Commons Attribution License, which permitsunrestricted use, distribution, and reproduction in anymedium, provided the original author and source arecredited.
Data Availability Statement: Cleansed Data areavailable at the Secure Transportation Data Projecthttp://www.nrel.gov/vehiclesandfuels/secure_transportation_data.html.
Funding: This material is based in part upon worksupported by the National Science Foundation undergrant no. 0825768, BRIDGE: Behavioral Response tothe I-35W Disruption: Gauging Equilibration;Minnesota Department of Transportation projectTraffic Flow and Road User Impacts of the Collapseof the I-35W Bridge over the Mississippi River;Oregon Transportation Research and EducationConsortium for the project Value of Reliability; and theUniversity of Minnesota Metropolitan Consortium.

Although this shortest-path (usually measured as shortest travel time path) assumption andthe resulting aggregate UE approach are simple, intuitive, and easy to implement (efficientsolutions are widely available), it has been criticized for ignoring the heterogeneity among trav-elers and limitations in their spatial knowledge and reasoning ability. Empirical studies (e.g.[4–6] among others) on route choice criteria based on stated preferences indicate that manyother factors such as distance and reliability also affect route decisions. These factors, togetherwith the imperfections in travelers’ perception and reasoning capacity, can push travelers awayfrom the shortest time route. However, Wardrop’s first principle has rarely been directly testedin the field. A pilot study by Jan et al.[7] concluded that travelers often chose paths that differedsignificantly from the shortest time path. Limited by the number of samples (83), they did notanswer a natural follow-up question: to what extent the actual routes deviate from the shortesttime path, which has significant implications for research aiming to relax these behavioralrestrictions on UE models.
Some researchers argue that travelers are still rational in minimizing their perceived traveltime while limited in their capacity to get perfect information. Daganzo and Sheffi [8] intro-duced the Stochastic User Equilibrium (SUE) model and used a random component to repre-sent the perception error and other randomness in the system. Other researchers furtherpointed out that many irrational components could be perfectly rational if modelers could cap-ture travelers’ preferences more accurately. Random Utility Maximization (RUM) models havebeen applied to investigate a wider spectrum of route choice preferences (e.g. shorter distance,less toll, or more freeway use). Bekhor et al. [9] investigated 16 possible combinations of plausi-ble preferences. Along this research branch, significant efforts have been dedicated to overcomethe so-called Independence of Irrelevant Alternatives (IIA) problem. Many variations of RUMmodels have been introduced (e.g. C-logit model [10], Path-Size logit [11], among others).With few exceptions (e.g. [12]), most of these models require explicit enumeration of all feasi-ble routes (the consideration set). A consideration set either too large or too small could signifi-cantly compromise flow prediction [13]. Because route enumeration is also time consuming, itis crucial to establish the scope of routes that are likely to be used by travelers.
In parallel with the research efforts on RUMmodels, other researchers treat travelers as“satisficers” who will switch to a more attractive route when the benefits such as time savingsare large enough. There has been abundant literature on boundedly rational users in fields suchas psychology and economics. Knight [14] pointed out that “the rational thing to do is to beirrational” when considering the “deliberation and estimation cost”. Conlisk [15] provided acomprehensive review on this topic and concluded that the importance of bounded rationalityis supported by both wide-ranging evidence and its excellent success in describing behavior. Inthe context of travel demand modeling, Mahmassani and Chang [16] introduced the Bound-edly Rational User Equilibrium (BRUE) when investigating the departure time choice on anidealized network with a single Origin-Destination (OD) pair and a unique route. Nakayamaet al. [17] employed a micro-simulation model to investigate BRUE and pointed out thatBRUE does not necessarily converge to UE. Lou et al. [18] further evaluated the mathematicalproperties of BRUE and revealed that BRUE assignments are not unique and when the thresh-old for route switching is large enough, congestion pricing schemes may make the systemworse off. Their results showed that the extent to which people’s choices deviate from theshortest path is also crucial in determining the domain of possible BRUE results, and thus per-formance of policies under evaluation.
In contrast with the aggregate modeling paradigm, many researchers argue that the routechoice problem should be investigated from an individual perspective. For example, Tawfikand Rakha [19] argued that a paradigm shift from network (such as UE and SUE) to driveroriented modeling is necessary for the route-choice problem and revealed the route choice
Do People Use the Shortest Path?
PLOS ONE | DOI:10.1371/journal.pone.0134322 August 12, 2015 2 / 18
The funders had no role in study design, datacollection and analysis, decision to publish, orpreparation of the manuscript.
Competing Interests: The authors have declaredthat no competing interests exist.
patterns estimated by the two modeling paradigms are very different based on data collected ina real-world route choice experiment. Examples of the latter category includes cognitive-psy-chology models [20], fuzzy models [21], and models based on data mining [22], among others.Zhang developed a behavioral user equilibrium model [23].
However, many advanced models in both categories still heavily rely on the shortest pathassumption. For example, Jha et al. [24] assume drivers are provided with travel time informa-tion on five shortest paths when investigating day-to-day dynamics using DYNASMART.Some models such as MATSIM [25] applied RUMmodels on a pre-determined choice set gen-erated by the K-shortest path algorithms [26]. The number of alternatives and their generationprocess is arbitrary and depends on computing convenience. Similarly, route choice modelswhich adopt a rule-based paradigm (e.g.ALBATROSS by Arentze and Timmermans [27] andAgent-based Route Choice model by Zhang et al. [28]) also require a well-defined consider-ation set based on which route choice rules could be derived and applied for flow prediction. Achoice set which is not correctly specified can distort both the calibration and the predictionprocess [13]. Therefore, the research question, “How Far is Traffic from User Equilibrium?”,has significant implications for both macroscopic and individual travel demand models.
However, empirical studies about formation of the consideration route set are few (Bovy[13] reviewed this topic). The difficulties are three-fold: first, unlike other dimensions such asmode and destination choice, route choice is very difficult to describe. Bekhor et al. [9] reportedgaps and ambiguity in the written descriptions of travelers’ habitual route in their analysis andshortest paths were applied to fix them. Second, most data only contain habitual routes, while alarge portion of candidate routes that have been considered but not frequently chosen have notbeen reported during the survey process. Third, the size and complexity of the regional trafficnetwork makes it difficult to define and distinguish highly overlapping candidates. Prato [29]later provided a more comprehensive review (in both choice set generation and discrete choicemodel estimation) and arrived at similar conclusions.
Bekhor et al. [9] evaluated the habitual route reported by faculty and staff from the Massa-chusetts Institute of Technology in Cambridge, Massachusetts. The data were collected in writ-ten description and shortest paths were utilized where ambiguity or holes were found. Amongthe 188 routes between 91 OD-pairs, 37% of respondents followed the shortest time path (90%overlapping is required for coverage) and 22% followed the shortest distance path. Similarly,Prato and Bekhor [30] evaluated 236 routes between 182 OD pairs in Turin, Italy and found53.5% of respondents chose the shortest distance path while 43.3% chose the shortest timepath. However, neither study reported how much longer those non-shortest paths were com-pared to the shortest ones. Moreover, both studies used planning network and assignmentresults to derive path travel time, which may not be sufficiently accurate.
Spissu et al. [31] show significant amounts of intra-individual variability from a sample of12 university students. Related research explained route switching behavior as a function offactors beyond travel time [32].
Several studies have examined taxis. Morikawa et al. [33] measured the travel time on 6alternative routes (one of them a toll road) based on Global Positioning System (GPS) datafrom 1500 taxis in Nagoya, Japan during two months and evaluated the route choice decisionsof the same set of vehicles. They found a high percentage of trips employed non-shortest path(e.g. using the toll road while travel time on it is even longer than toll-free alternatives) andthey concluded that this phenomenon is due to the lack of knowledge of network connectivityor travel time reliability. However, their samples are biased in both the subjects identity (taxionly) and the trip destination (the airport). Ding et al. [34] investigated routing policy choiceset generation based on individual-level route choice data from GPS observations in Stock-holm, Sweden and Singapore. They found that with a threshold of 80% to define the same
Do People Use the Shortest Path?
PLOS ONE | DOI:10.1371/journal.pone.0134322 August 12, 2015 3 / 18

route, a combination of link elimination and simulation method can identify 92% of the routepeople actually use. Ma and Fukuda [35] compare shortest path routes of taxis with hyperpathsand find that hyperpaths have more explanatory power. GPS data from Taxis may not be con-sistent with general traffic.
A branch of the literature has explored the route choice decisions of users of non-automodes. Bicyclists are known not to follow the shortest path because of obvious qualitative dif-ferences in routes. This has included stated preference work [36] as well as more recent GPSbased revealed preference analysis [37–40]. Motorcyclists also have different preferences [41].
The onset of recent smart phone based GPS (as well as earlier research based on triangula-tion) has opened new data avenues that promise to make this type of analysis more widespread[42]. Similarly, new tools for both Geographic Information System (GIS) and route choicemodeling are also making this research more feasible [29, 43, 44].
Empirical research demonstrates that automobile travelers care about tolls [45], stops [46],reliability [47], traffic lights [48], and aesthetics [49]. Further, travel time is systematically mis-perceived [50].
This study investigates the characteristics of routes followed by randomly recruited subjectsduring a study period of up to 13 weeks and compares them with the shortest time or distancepath. GPS devices have been installed in subjects’ vehicles and their trajectories during theentire study period documented. The travel trajectories of instrumented vehicles are projectedonto a GIS map of high-resolution and their characteristics analyzed. In contrast with previousstudies, this study uses observed travel time derived from the travel time of the same set ofinstrumented vehicles (serving as probe vehicles). The shortest time or distance paths aredeveloped based on the same GIS map, ensuring the consistency across different routes. Find-ings from this study could help evaluate current route choice models and provide guidance forconstructing choice sets. Moreover, the shortest path assumption is still commonly employedin practice, from aggregate planning models to emerging agent-based models (e.g. TRANSIMS[51], MATSIM [25]). Therefore, an empirical evaluation of how far this assumption deviatesfrom observation in the field would help researchers and practitioners better interpret resultsand improve future models.
The next section summarizes major findings in this study. Details of modeling approachand data used in this study will then be presented.
ResultsThis study captures the actual routes travelers follow during an eight-week study period usingGPS data detailed GIS road map. The actual routes are then compared with the shortest timepath predicted by the model, showing the gap between the ideal assumption of human routechoice behavior and the actual behavior. Four popular choice set generation algorithms, all ofwhich are widely used in modeling human route choices, are then evaluated using the identi-fied routes. Details about the data and the way routes are identified will be presented in theMaterials and Methods section.
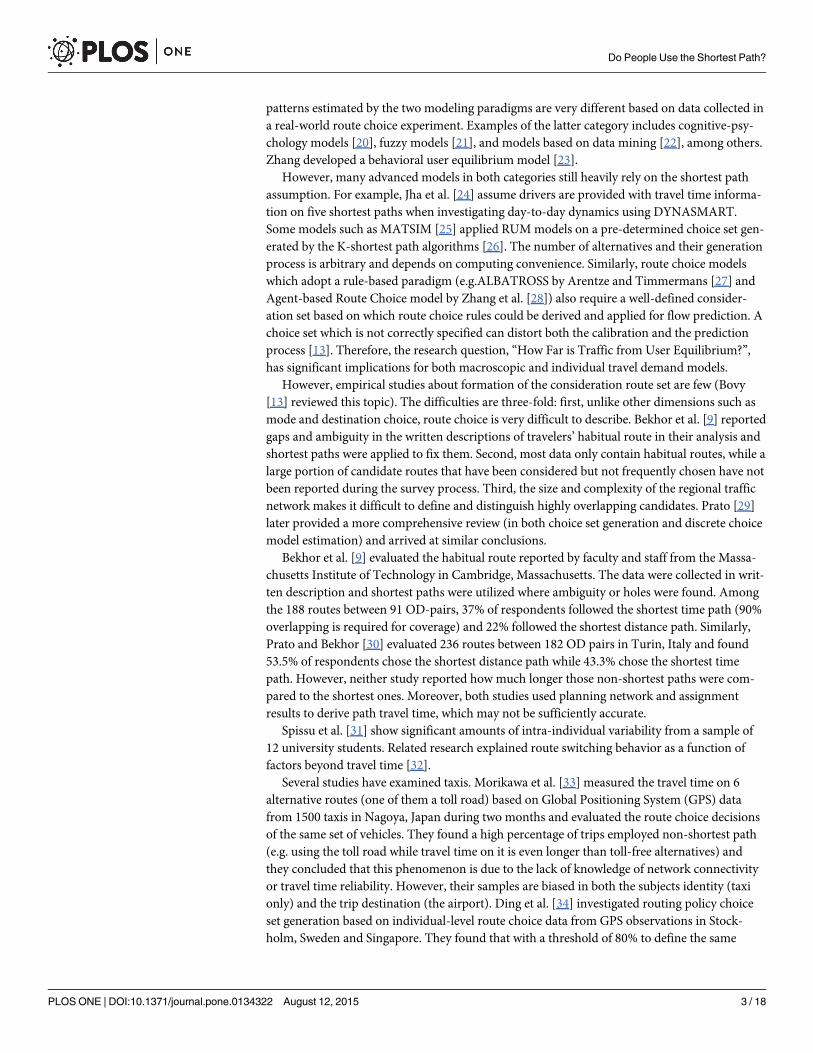
Do people use the shortest path?The identified routes and the shortest time routes are then compared segment-by-segmentusing GIS and the results are summarized in Fig 1 for commute and non-commute trips. If tworoutes overlap, the difference should be 0. In contrast, if two routes do not overlap at all, theyare 100% different in the graph. By the most strict standard (0% different), about 34% of alltrips (commute plus non-commute) followed the shortest time path. If the standard is relaxed
Do People Use the Shortest Path?
PLOS ONE | DOI:10.1371/journal.pone.0134322 August 12, 2015 4 / 18
to 10% as most previous studies suggest, then about 40% of all trips follow the shortest timepath.
This result may seem high because a large number of short trips do not actually have manyfeasible alternatives and thus are more likely to follow the shortest time path. If we only evalu-ate commute trips which are usually longer, then only 13.5% of trips completely coincide withthe shortest time path. By relaxing the standard to 10% overlapping, 21.7% of trips followedthe shortest time path. Non-commute trips are similar to the overall set of trips as most tripsare for non-work purposes.
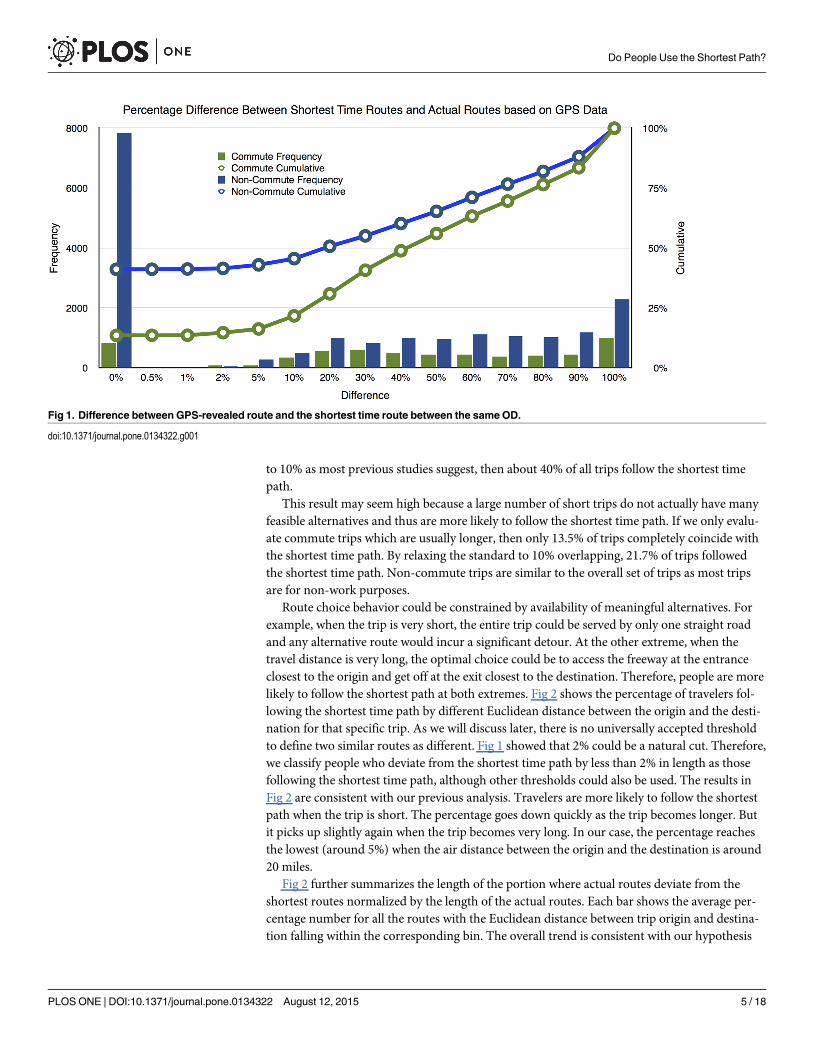
Route choice behavior could be constrained by availability of meaningful alternatives. Forexample, when the trip is very short, the entire trip could be served by only one straight roadand any alternative route would incur a significant detour. At the other extreme, when thetravel distance is very long, the optimal choice could be to access the freeway at the entranceclosest to the origin and get off at the exit closest to the destination. Therefore, people are morelikely to follow the shortest path at both extremes. Fig 2 shows the percentage of travelers fol-lowing the shortest time path by different Euclidean distance between the origin and the desti-nation for that specific trip. As we will discuss later, there is no universally accepted thresholdto define two similar routes as different. Fig 1 showed that 2% could be a natural cut. Therefore,we classify people who deviate from the shortest time path by less than 2% in length as thosefollowing the shortest time path, although other thresholds could also be used. The results inFig 2 are consistent with our previous analysis. Travelers are more likely to follow the shortestpath when the trip is short. The percentage goes down quickly as the trip becomes longer. Butit picks up slightly again when the trip becomes very long. In our case, the percentage reachesthe lowest (around 5%) when the air distance between the origin and the destination is around20 miles.
Fig 2 further summarizes the length of the portion where actual routes deviate from theshortest routes normalized by the length of the actual routes. Each bar shows the average per-centage number for all the routes with the Euclidean distance between trip origin and destina-tion falling within the corresponding bin. The overall trend is consistent with our hypothesis
Fig 1. Difference between GPS-revealed route and the shortest time route between the sameOD.
doi:10.1371/journal.pone.0134322.g001
Do People Use the Shortest Path?
PLOS ONE | DOI:10.1371/journal.pone.0134322 August 12, 2015 5 / 18

except for the extreme long trips (� 40 km). Due to the low density of the freeway network, theroute choice for long trips could significant deviate from each other if the traveler chooses dif-ferent initial movement (e.g. first go East vs. go South). It is also complicated by the existenceof the Mississippi River and the limited number of river crossing points (people may prefer dif-ferent river crossing points, especially after the I-35W collapse). Empirical study on a differentnetwork could help to test these hypotheses.
The theory of Boundedly Rational User Equilibrium argues that people can choose any ofthe alternative routes whose travel time does not exceed the shortest time route by an empiri-cally defined threshold. Therefore, it is interesting to compare the travel time on route peopleactually choose and the shortest time route. Fig 3 summarizes the results. For about 50% of thetrips, the actual chosen routes that are less than 30 seconds longer than the shortest time routes.In almost 90% of cases people choose routes that are less than 5 minutes longer than the short-est time routes. Commute routes deviate from shortest time routes slightly more in percentagecompared with non-commute routes. The difference between actual routes and shortest traveltime routes for most trips is small, but non-trivial, since 5 minutes represents almost one-fifthof the average commute time (24 minutes) in the Twin Cities area.
The relevant scale in difference may also provide important empirical evidence. Fig 4 showsthe difference in travel time between the chosen and shortest time route as a percentage of theshortest path time. About 55% of non-commute and 30% of commute trips follow a route thatis almost as good as the shortest time path (less than 5% longer in time). Although about 80%of non-commute trips and 70% of commute trips follow a route that has a travel time less than20% longer than the shortest time path, the number of trips that follow a much longer routeis still significant. People may have different motivations in choosing a route other than theshortest. For example, they may drop off children or spouse (in ways undetected by our defini-tion of trips as engine off or being stopped for a sufficiently long time), or stop briefly for a cof-fee, or simply because they prefer to use a route that possesses other desirable features. Theempirical evidence presented in this paper pointed out such non-optimal choices from trafficassignment perspective is not trivial either in frequency or in significance. More empirical stud-ies are warranted to better understand such behavior.
Fig 2. Percentage of trips in which travelers follow the shortest time path and percentage difference in length between the actual route and theshortest path by Euclidean distance between the origin and destination.
doi:10.1371/journal.pone.0134322.g002
Do People Use the Shortest Path?
PLOS ONE | DOI:10.1371/journal.pone.0134322 August 12, 2015 6 / 18

Route choice set generationChoice set generation plays an important role in route choice since many existing modelsrequire explicit enumeration of the routes to be considered. Extending previous research (suchas [9, 30]), this study evaluates 4 widely-used route choice set generation (K-shortest path)algorithms based on the same GPS data as described in previous sections. By using the GPS
Fig 3. Comparison in travel time between actual commute/non-commute trip route and corresponding shortest time route.
doi:10.1371/journal.pone.0134322.g003
Fig 4. Difference in travel time between chosen route and shortest time route as a percentage of the shortest path time.
doi:10.1371/journal.pone.0134322.g004
Do People Use the Shortest Path?
PLOS ONE | DOI:10.1371/journal.pone.0134322 August 12, 2015 7 / 18
data instead of surveys, this study avoids gaps and ambiguity when identifying routes peopleactually use. Moreover, many people use more than one route between the same origin anddestination within a time period, which are usually under-reported in a one-day, or evenmulti-day, survey. In contrast, this diversity in route choices can be easily captured by GPSdata and applied for testing choice set generation algorithms. Therefore, an evaluation ofchoice set generation algorithms based on GPS data should inform travel demand modeling.
To simplify the problem, the current study only looks at home-to-work trips before theopening of I-35W replacement bridge, when traffic conditions are stable. The same analysiscould also be applied for trips of other purposes and for other time periods. In total, 657 home-to-work trips made by 95 subjects have been identified during these three weeks. Any home-to-work trips that included identifiable side stops are excluded from this study. Four algo-rithms are evaluated here:
1. Link labeling: The labeling approach, originally proposed by Ben-Akiva et al. [52], calculatespaths that maximize different definitions, including shortest travel time, shortest free-flowtravel time, shortest distance, least congestion, etc.
2. Link elimination: The link elimination algorithm [53] generates Kth shortest path by findingthe shortest path after removing all links of the first K − 1 shortest paths from the network.It stops when no new path can be found because of missing network connectivity. Thisstudy adopts a variant of this algorithm by only eliminating one-third of links (those locatedin the middle one-third of the path) during each iteration to avoid premature stopping dueto failures of network connectivity when major junctions are removed.
3. Link penalty: The link penalty approach [54] generates new shortest paths after multiplyingthe travel time of each link on the current shortest path by 1.05.
4. Simulation: The simulation approach computes the shortest path for each draw of linkimpedances. Many impedance distributions have been tested and three sets of them arepresented:
(a) normal distributions with mean travel time and travel time variance derived from GPSobservations,
(b) normal distribution with mean travel time derived from GPS observation and a varianceequal to 15% of the mean (the optimal parameter with an overlap threshold of 80%), and
(c) normal distribution with mean travel time derived from GPS observation and a varianceequal to 20% of the mean (which has been used in [30]).
A left truncation that is equivalent to a minimal speed of 8 mph (12.9 kmh − 1) is adopted.Sensitivity tests to the number of draws are also applied. Table 1 summarizes the percent-age of routes that are covered by each algorithm again all routes observed through GPSdata. The random draw of the travel time on each link is independent, though there is evi-dence that strong correlation exists between the travel times on links [55].To avoid trivial alternatives, overlap thresholds must be defined when comparing different
routes. A wide range of values have been used in literature and no consensus about appropriatethresholds has emerged. This study tests three different thresholds of the percentage of links ina path that are identical between the observed and generated route, 100%, 90%, and 80%. Thetotal number of observed routes increases as we adopt a higher threshold to distinguish differ-ent routes. Overall, 249 routes have been observed if two routes are only the same when 100%of their link segments overlap.
Do People Use the Shortest Path?
PLOS ONE | DOI:10.1371/journal.pone.0134322 August 12, 2015 8 / 18

As Table 1 shows, no single label performs well in predicting routes people actually use. Thecoverage provided by the least time approach (9% with an overlap threshold of 90%) is consis-tent with previous analysis on the percentage of commuters who follow the shortest path. Thecoverage is lower than that found by Prato and Bekhor [30] based on data collected in Turin,Italy (about 27%). However, the Turin network only contains 1,427 links, while the Twin Citiesnetwork contains 22,477 links. The extra complexity introduced by network size makes itharder to generate routes people actually use on the Twin Cities network. Most travelers preferusing freeways to local streets. And travel time is in general a better impedance measure thandistance. When combining all five labels together, the labeling approach can only generate 37%of all observed routes with an overlap threshold of 80%.
The link elimination algorithm generates between 29 and 58 unique routes (with an overlapthreshold of 90%) for subjects. However, it could eliminate crucial links of observed routes inthe first few iterations, preventing us from replicating those routes through an iterative pathsearching process. Therefore, it is not surprising to find a very low coverage rate (11%) for thelink elimination algorithm.
Table 1. Coverage: Percentage of generated routes which are observed using alternative route choiceset generation algorithms based on GPS data and Twin Cities regional planning network.
Overlap threshold (%)
Algorithm description and parameters 100 90 80
Labeling approach
Least time 2 9 16
Least free-flow time 6 16 23
Least distance 2 5 9
Maximize freeways path 4 12 19
Minimize(Freeway + 2Expressway + 4Arterial + 4Local) Time
Minimize freeways path 1 2 3
Minimize(4Freeway + 2Expressway + Arterial + Local) Time
All labels combined 9 25 37
Link elimination for Least Time path 3 11 25
(eliminate 33% of middle links)
Link penalty 15 unique routes 6 24 44
Link penalty 40 unique routes 7 28 50
Link penalty 80 unique routes 8 28 50
Minimize simulated time, observed σ2, 12 draws 4 13 25
Minimize simulated time, observed σ2, 24 draws 6 15 28
Minimize simulated time, observed σ2, 48 draws 7 18 33
Minimize simulated time, σ2 = 15% of mean, 12 draws 2 13 31
Minimize simulated time, σ2 = 15% of mean, 24 draws 4 20 39
Minimize simulated time, σ2 = 15% of mean, 48 draws 5 23 44
Minimize simulated time, σ2 = 15% of mean, 96 draws 10 30 59
Minimize simulated time, σ2 = 15% of mean, 192 draws 12 39 63
Minimize simulated time, σ2 = 20% of mean, 12 draws 2 10 28
Minimize simulated time, σ2 = 20% of mean, 24 draws 4 16 39
Minimize simulated time, σ2 = 20% of mean, 48 draws 5 23 46
Minimize simulated time, σ2 = 20% of mean, 96 draws 10 33 57
Minimize simulated time, σ2 = 20% of mean, 192 draws 15 44 60
Total number of observed routes (counts) 249 189 163
doi:10.1371/journal.pone.0134322.t001
Do People Use the Shortest Path?
PLOS ONE | DOI:10.1371/journal.pone.0134322 August 12, 2015 9 / 18

The link penalty algorithm performs better in general. However, increasing the requirednumber of unique routes before the algorithm stops does not significantly improve the cover-age rate (from 24% to 28% when required unique routes increase from 15 to 40 (the number ofroutes is consistent with that used in Bekhor et al. [9])). The algorithm could have continued toidentify similar routes with relatively small differences. Choosing an appropriate penalty factorcould be crucial for improving efficiency of the algorithm, which presents an interesting topicfor future research.
The simulation approach outperforms its deterministic counterparts. The coverage rate isonly about one-third if we generate travel time from observed travel time distributions. Bychoosing a travel time distribution with relatively large variance (observed σ2 is on average3% of the mean on freeway links and 14% of the mean on arterial links), we can generate asmany as 63% of routes observed through the GPS study in 192 iterations. A variance which istoo large will also result in a lower coverage or hit ratio. A variance equal to 15% of the meanprovides the highest coverage or hit ratio at a 80% overlap threshold, or a small number ofdraws at a 80% overlap threshold. However with more draws and at the 90% overlap thresh-old, a different variance may have a higher hit ratio. We can expect higher coverage throughmore iterations. However, the marginal benefit of doing so diminishes as the number ofiterations increases. In addition to its advantage in explicitly generating choice set, the simula-tion approach can also be applied on network loading, which defined the feasible choice setimplicitly. For example, Mirchandani and Soroush [56] applied the simulation approach tosolve the generalized traffic equilibrium with profitabilities link travel time and heterogenousperceptions.
Running time for the link elimination, link penalty, and simulation approaches are similar,while minimizing one label for the labeling approach takes much less time (a few seconds). Thelink elimination approach stops in 1636 seconds. The link penalty approach with a stop crite-rion of 80 unique routes for each OD takes 2248 seconds. The simulation approach finishes192 iterations in 1291 seconds (all tests are conducted on a Power Mac G5 3.00GHz). Consid-ering the number of observed routes each approach can generate, the simulation approachexhibits significant advantage.
ConclusionsThis study empirically tests, and rejects, the shortest-path assumption which has been widelyapplied in both research and practice. The results show that about two-thirds of the subjects donot use the shortest travel time path during a three week study time period. No subjects fol-lowed the shortest distance path unless it also coincided with the shortest travel time path.
None of the existing route choice set generation algorithms provides satisfactory results ingenerating a choice set. Most of these algorithms rely on evaluation of shortest time paths.However, travelers clearly have other preferences when making their route choices. There-fore, a better understanding of people’s route preferences could also inform the developmentof choice set generation algorithms. Clearly, a choice set that includes all alternative routeswould in turn contribute to improvement in the accuracy of individual route choice model-ing. The GPS-based approach developed in this study reveals people’s day-to-day routepatterns with an accuracy that cannot be achieved through conventional surveys. The multi-plicity of routes between the same origin and destination becomes obvious when using GPSdata over a long period of time, which poses new challenges for choice set generation algo-rithms. The coverage rates provided by all algorithms evaluated in this study are consistentlylow. To cover most routes that people may choose, a wide spectrum of preference labelsshould be considered. Although simulation approaches do not directly address diversity in
Do People Use the Shortest Path?
PLOS ONE | DOI:10.1371/journal.pone.0134322 August 12, 2015 10 / 18

route preferences, they may actually reflect imperfections of network knowledge and ran-domness in behavior. Consistent with previous studies, this study finds that simulationapproaches provide an efficient way to generate alternative routes and outperforms manydeterministic route generation algorithms.
In most circumstances, people choose routes that are less than 5 minutes longer than theshortest time routes. However, we have observed some trips that represent a significant detourfrom the shortest time path. Since trips in this study are defined based on the engine-on andengine-off activities or dwell time, we cannot exclude the situations when people detour forpurposes such as dropping off passengers. These side trips could help to explain the occasionalunusually long detours observed in our data, especially for commute trips. GPS data alone can-not provide information about trip purpose. More advanced analyses that combine GPS datawith land use data to identify trip purposes can be used [57].
Materials and MethodsThis study has been reviewed and approved by the Institutional Review Board (IRB Code Num-ber 0806S34983) of the University of Minnesota. All participants have been informed about thestudy, and been asked to read and sign the consent form before their participation. This materialis based in part upon work supported by the National Science Foundation under Grant No.0825768, BRIDGE: Behavioral Response to the I-35WDisruption: Gauging Equilibration; Min-nesota Department of Transportation project Traffic Flow and Road User Impacts of the Col-lapse of the I-35W Bridge over the Mississippi River; Oregon Transportation Research andEducation Consortium for the project Value of Reliability; and the University of MinnesotaMetropolitan Consortium. No additional external funding received for this study.
GPS DataGPS data utilized in this study was collected during a 13-week long study targeting behavioralreactions to the I-35W Bridge reopening on September 18th, 2008. Recruiting occurred viaannouncements on craigslist, City Pages online and newspaper (a local free weekly), flyers atgrocery stores and local libraries, postcards handed out in downtown parking ramps, and emailto more than 7000 University of Minnesota staff (excluding students and faculty). People inter-ested in participating in the study completed an on-line survey, providing background infor-mation about demographics, driving habits, job and residential locations, and commute routesbefore and after the I-35W bridge collapse. Participants were randomly selected among thosewho 1) were between 21 and 65 years old, 2) commute alone, 3) have a valid drivers license, 4)are likely to be affected directly or indirectly by the opening of the new I-35W Bridge accordingto their usual commute routes. Either a logging Global Positioning System (GPS) devices(QSTARZ BT-Q1000p GPS Travel Recorder powered by DC output from in-vehicle cigarettelighter) or a real-time communicating GPS device (adapted from the system deployed in theCommute Atlanta study ([58]) was installed in the vehicle of study participants. The GPSdevice is non-intrusive and unlikely to affect the behavior of participants. No instructions weregiven and participants were free to make travel choices. In total, 190 subjects participated inthis study. However, only 143 GPS records were recovered due to the failure of devices (thedata from GPS loggers could only be checked at the end of the study. Some of them failedbecause of power supply problems, such as being disconnected by subjects).
The logging GPS devices accurately monitored the travel trajectories of each probe vehicleat a frequency of one point per 25 meters up to 13 weeks, about 3 weeks before the reopeningof the bridge and between 8 and 10 weeks after it. The real-time communicating GPS devicerecorded the position of instrumented vehicles for every second. The geographic location and
Do People Use the Shortest Path?
PLOS ONE | DOI:10.1371/journal.pone.0134322 August 12, 2015 11 / 18

time stamps of each point were documented and projected onto a GIS map for post-processing.The GPS data were then matched to The Lawrence Group (TLG) Twin Cities network, a detailednetwork conflated to the real road geometry, using ArcGIS [59].
An algorithm was developed and applied to ensure all points have been snapped to the near-est link which
• is directly connected to the upstream link previously identified,
• is consistent with the travel direction of nearby GPS points, and
• is connected to the downstream link which is also consistent with travel direction of down-stream GPS points.
This algorithm rules out the possibility of incorrectly snapping the GPS point to the link onthe opposite direction and on crossing directions. The high resolution of one point every 25meters (the real-time communicating GPS provided an even higher resolution) reduces thepossible of holes and discontinuity in identified routes to a minimum. In rare cases of datalosses due to the communication difficulties with satellites, the shortest time path was used toconnect the different segments of the same trip. This algorithm, combined with accurate GISfiles, ensures that the right links will be identified for each trip. It also helps to ensure that thespeed estimated from vehicle trajectories will later be assigned to the link through which travel-ers passed. A visual check was conducted for all trips of two random subjects during the entirestudy period, and confirmed the accuracy of the algorithm.
Link Speed EstimationThe speed with which the probe vehicle traversed a link along its trajectory could be estimatedby comparing the spatial and temporal distances between points at each end of the link. Theaverage link speed could be estimated from all probe vehicles passing this link during a definedtime period. There has been a large body of literature discussing the minimal number of obser-vations required to ensure reliable speed estimates. For example, Cheu et al. [60] concludedthat ten probe vehicles must pass though a link within the sampling period to achieve an accu-racy within a 95% confidence interval. The number of observations required for a reliable traveltime estimate depends on speed variance on each link and the desired confidence level. For thisstudy, a link speed estimate was regarded as valid only if more than 10 samples were availableduring that time period.
The large number of GIS equipped vehicles act as probe vehicles for the purpose of measur-ing travel speed on the network. The long study period allows us a large number of observa-tions not only on freeway links, but also on major arterial links and local streets in downtown(see Fig 5). The latter is very important since it represents a significant chunk of total trafficand is unavailable in previous studies relying upon freeway loop detectors. Speed samples onarterial roads in the outer suburbs are generally low. However, road density in those areas werelow and the traffic was unlikely to vary much due to scattered demand. Therefore, speed onroads with insufficient samples were assumed constant through the study and equal to theaverage speed on all the links of the same functional class defined by the US Census Bureau intheir TIGER files [61]. The data can be downloaded from http://www.datafinder.org
Two major network changes occurred during this study time period: the replacement I-35W bridge was opened on September 18, 2008 and a section of the fourth lane westbound onthe I-94 Bridge between the interchange with I-35W and Highway 280, a major mitigationmeasure implemented after the bridge collapse in 2007, was closed on October 12, 2008 andreturned to operation as a bus-only shoulder lane.
Do People Use the Shortest Path?
PLOS ONE | DOI:10.1371/journal.pone.0134322 August 12, 2015 12 / 18

Parthasarathi and Levinson [62] investigated the speed pattern for the Twin Cities based onboth travel survey and loop detector data, and concluded that the morning and the afternoonpeak periods (when congestion is sufficient to affect speed) are 6:00 am to 9:00 am and 2:00 pmto 7:00 pm, respectively. Combining the three time-of-day periods, Morning Peak, Middle ofthe Day, and Afternoon Peak, with the three phases, August 26th—September 18th, September18th—October 12th, and October 12th—November 30th, 9 study periods were defined. Allspeed observations during non-holiday weekdays were pooled for each time period accordinglyand average speed for each link with more than 10 samples was estimated. Because of theirminor role in traffic analysis and the small number of observations available, two other timeperiods, Before Morning Peak and After Afternoon Peak, were ignored in this study.
The TLG network contains 290,231 links and 113,864 nodes for the Twin Cities Metropoli-tan area. Although it provides great accuracy, it dramatically slows down the path search algo-rithm. Moreover, the amount of observed data on suburban streets are low and trip variationin these regions is also low due to low road density. Therefore, the metropolitan planning net-work, which contains 22477 links and 8618 nodes and has been widely used in regional trafficanalysis, has been used in the analysis. Speed estimation derived on the TLG network wastransferred to the overlapping link from the planning network. Both networks have been
Fig 5. The number of speed observations on each link during the entire study period.
doi:10.1371/journal.pone.0134322.g005
Do People Use the Shortest Path?
PLOS ONE | DOI:10.1371/journal.pone.0134322 August 12, 2015 13 / 18
conflated to the same geometry and overlapped accurately. Bovy [13] and Schuessler et al. [63]discuss network simplification.
Commute and non-commute trips based on GPS DataBy following the steps described in the second section, links are identified along the vehicletrajectories, which are then divided into trips. A trip is defined between one engine-on andengine-off event, or when the vehicle failed to move more than 25 meters within 5 minutes(dwell time), or when the vehicle deviates from street center lines for more than 20 metersduring 5 minutes, whichever comes first. The length of dwell time used to define trip ends inprevious studies varies from 45 seconds to 300 seconds (e.g. 45s [64], 120s [65, 66], 300s [67]or multiple values [68]). The upper bound has been chosen in this study because 1) the rampmetering system in the Twin Cities area generates queues with a maximum delay of 4 minutesat freeway on-ramps; 2) a typical cycle length at signal-control intersections is 180s and it ispossible to wait more than 1 cycle during peak periods; 3) the accuracy of the GIS map hashelped to identify short off-street stops. Other filtering criteria such as circuity [69] and head-way change. Du and Aultman-Hall [68] have also been suggested. However, the effectivenessof these criteria depend on the characteristics of the GPS data and need to be validated againstdetailed travel diary data. Therefore, this study did not adopt these more context-specificrules.
All participants in this study were frequent commuters. A large number of trips could beobserved. This is important because it increases the chance to identify the commute routes thatare seldom used but do exist in the consideration set, which cannot be revealed by reportedhabitual routes used in previous studies. We separate commute routes and non-work routesbecause they are likely to differ in time pattern; further commute trips usually have a targetedarrival time while non-work trips tend to be more flexible.
Home-to-work trips are defined as any trips starting within a 600 m radius from home andending in a 600 m radius from the work location during a work day, without any stop longerthan 5 minutes. The work-to-home trips are defined similarly. The threshold of 600 metersrepresents approximately 4 city blocks, which is chosen by observing parking and work placesfor a subset of subjects.
The GPS data provide the origin, destination, departure time and arrival time of each trip.These data, combined with the speed map we developed in the early section, allow us to evalu-ate the actual route choice and shortest time and distance routes (see Fig 6 for example). Bothtravel time of the actual route and shortest time path are evaluated based on the speed corre-sponding to the departure time of each trips. Any trips starting before 6:00 am or after 7:00pm are excluded from this study because we do not have enough speed data to support suchanalysis.
In total 25,157 trips conducted by 143 of the study’s subjects have been identified by apply-ing filtering criteria discussed in this section. Among them, 6,059 are commute trips. It shouldbe pointed out that if people stopped for more than 5 minutes on their way home or to work,these trips are broken into two trips and no longer treated as commute trips. While this treat-ment is consistent with our definition of trips, their impacts should be carefully evaluated infuture study.
For each OD pair, the shortest distance and shortest time route have been estimated byusing the speed estimation during the corresponding time of the day and time periods.These speeds are averages of the direct observations obtained from the trajectory of probevehicles, which distinguishes this study from previous studies exclusively based on assign-ment models.
Do People Use the Shortest Path?
PLOS ONE | DOI:10.1371/journal.pone.0134322 August 12, 2015 14 / 18

AcknowledgmentsWe would also like to thank Henry Liu. Kathleen Harder, John Bloomfield, Randy Guensler,and Shu Hong. Any opinions, findings, and conclusions or recommendations expressed in thismaterial are those of the authors and do not necessarily reflect the views of the National ScienceFoundation, Minnesota Department of Transportation, Oregon Transportation Research andEducation Consortium or others.
Author ContributionsConceived and designed the experiments: DML. Performed the experiments: SZ. Analyzed thedata: SZ. Wrote the paper: SZ DML.
References1. Cairnes S SA, Goodwin P. Disappearing traffic? The story so far. Proceedings of the Institution of Civil
Engineers. 2002 March; p. 13–22.
2. Giuliano G, Golob J. Impacts of the Northridge Earthquake on Transit and Highway Use. Journal ofTransportation and Statistics. 1998; 1(2):1–20.
Fig 6. Example of commute route identification and comparison.
doi:10.1371/journal.pone.0134322.g006
Do People Use the Shortest Path?
PLOS ONE | DOI:10.1371/journal.pone.0134322 August 12, 2015 15 / 18
3. Wardrop JG. Some theoretical aspects of road traffic research. In: Proceedings of the Institute of CivilEngineers, Pt. II. vol. 1; 1952. p. 325–378.
4. Abdel-Aty MA, Kitamura R, Jovanis PP. Using stated preference data for studying the effect ofadvanced traffic information on drivers’ route choice. Transportation Research Part C. 1997; 5(1):39–50. doi: 10.1016/S0968-090X(96)00023-X
5. Chen TY, Chang HL, Tzeng GH. Using a weight-assessing model to identify route choice criteria andinformation effects. Transportation Research Part A. 2001; 35(3):197–224.
6. Train K, WilsonWW. Estimation on stated-preference experiments constructed from revealed-prefer-ence choices. Transportation Research Part B. 2008; 42(3):191–203. doi: 10.1016/j.trb.2007.04.012
7. Jan O, Horowitz AJ, Peng ZR. Using global positioning system data to understand variations in pathchoice. Transportation Research Record,. 2000; 1725(1):37–44. doi: 10.3141/1725-06
8. Daganzo CF, Sheffi Y. On stochastic models of traffic assignment. Transportation Science. 1977; 11(3):13. doi: 10.1287/trsc.11.3.253
9. Bekhor S, Ben-Akiva ME, RammingMS. Evaluation of choice set generation algorithms for route choicemodels. Annals of Operations Research. 2006; 144(1):235–247. doi: 10.1007/s10479-006-0009-8
10. Cascetta E, Russo F, Viola FA, Vitetta A. A model of route perception in urban road networks. Transpor-tation Research Part B. 2002; 36(7):577–592. doi: 10.1016/S0191-2615(00)00041-2
11. Ben-Akiva M, Bowman J, Ramming S, Walker J. Behavioral Realism in Urban Transportation PlanningModels. Transportation Models in the Policy-Making Process: Uses, Misuses and Lessons for theFuture. 1998;p. 4–6.
12. Dial R. A probabilistic multipath traffic assignment algorithm which obviates path enumeration. Trans-portation Research. 1971; 5(2):83–111. doi: 10.1016/0041-1647(71)90012-8
13. Bovy PHL. On Modelling Route Choice Sets in Transportation Networks: A Synthesis. TransportReviews. 2009;29:43–68. doi: 10.1080/01441640802078673
14. Knight FH. Risk, Uncertainty, and Profit, Boston, MA: Hart, Schaffner & Marx. 1921;.
15. Conlisk J. Why bounded rationality? Journal of Economic literature,. 1996; 34(2):669–700.
16. Mahmassani HS, Chang GL. On boundedly rational user equilibrium in transportation systems. Trans-portation Science. 1987; 21(2):89. doi: 10.1287/trsc.21.2.89
17. Nakayama S, Kitamura R, Fujii S. Drivers’ Learning and Network Behavior: Dynamic Analysis of theDriver-Network System as a Complex System. Transportation Research Record: Journal of the Trans-portation Research Board. 1999; 1676(-1):30–36. doi: 10.3141/1676-04
18. Lou Y, Yin Y, Lawphongpanich S. Robust congestion pricing under boundedly rational user equilibrium.Transportation Research Part B. 2009;.
19. Tawfik AM, Rakha HA. Network route-choice evolution in a real-time experiment: A necessary shiftfrom network to driver oriented modeling. In: 91st Annual Meeting of Transportation Research BoardPaper Compendium DVD 12-1640Washington D.C.; 2012.
20. Nakayama S, Kitamura R. Route choice model with inductive learning. Transportation ResearchRecord: Journal of the Transportation Research Board. 2000; 1725(-1):63–70. doi: 10.3141/1725-09
21. Ridwan M. Fuzzy preference based traffic assignment problem. Transportation Research Part C,.2004; 12(3):209–233. doi: 10.1016/j.trc.2004.07.003
22. Park K, Bell M, Kaparias I, Bogenberger K. Learning user preferences of route choice behaviour foradaptive route guidance. Intelligent Transport Systems, IET. 2007; 1(2):159–166. doi: 10.1049/iet-its:20060074
23. Zhang L. Behavioral foundation of route choice and traffic assignment. Transportation ResearchRecord: Journal of the Transportation Research Board. 2011; 2254(1):1–10. doi: 10.3141/2254-01
24. Jha M, Madanat S, Peeta S. Perception updating and day-to-day travel choice dynamics in traffic net-works with information provision. Transportation Research Part C. 1998; 6(3):189–212. doi: 10.1016/S0968-090X(98)00015-1
25. Balmer KWAM, Nagel K. An agent-based demand modeling framework for large scale micro-simula-tion. In: 85th Annual Meeting of Transportation Research Board, Washington D.C., 2006; 2006.
26. Ziliaskopoulos A. Optimum Path Algorithms on Multidimensional Networks: Analysis, Design, Imple-mentation and Computational Experience. University of Texas at Austin; 1994.
27. Arentze T, Timmermans H. A learning-based transportation oriented simulation system. TransportationResearch Part B: Methodological. 2004; 38(7):613–633. doi: 10.1016/j.trb.2002.10.001
28. Zhang L, Levinson D, Zhu S. Agent-basedmodel of price competition, capacity choice, and product dif-ferentiation on congested networks. Journal of Transport Economics and Policy. 2008; 42(3):435–461.
Do People Use the Shortest Path?
PLOS ONE | DOI:10.1371/journal.pone.0134322 August 12, 2015 16 / 18

29. Prato CG. Route choice modeling: past, present and future research directions. Journal of ChoiceModelling. 2009; 2(1):65–100. doi: 10.1016/S1755-5345(13)70005-8
30. Prato CG, Bekhor S. Applying Branch-and-Bound Technique to Route Choice Set Generation. Trans-portation Research Record. 2006; 1985(-1):19–28. doi: 10.3141/1985-03
31. Spissu E, Meloni I, Sanjust B. Behavioral analysis of choice of daily route with data from global position-ing system. Transportation Research Record: Journal of the Transportation Research Board. 2011;2230(1):96–103. doi: 10.3141/2230-11
32. Vacca A, Meloni I. Understanding Route Switch Behavior: An Analysis Using GPS Based Data. Trans-portation Research Procedia. 2015;5:56–65. doi: 10.1016/j.trpro.2015.01.018
33. Morikawa T, Miwa T, Kurauchi S, Yamamoto T, Kobayashi K. R Kitamura and M Kuwahara SimulationApproaches in Transportation Analysis Springer Science+ Business Media, Inc, New York. 2005;135:136.
34. Ding J, Gao S, Jenelius E, Rahmani M, Huang H, Ma L, et al. Routing Policy Choice Set Generation inStochastic Time-Dependent Networks: Case Studies for Stockholm, Sweden, and Singapore. Trans-portation Research Record: Journal of the Transportation Research Board. 2014;(2466):76–86. doi:10.3141/2466-09
35. Ma J, Fukuda D. Hyperpath or Shortest Path: An Evaluation Method and a Case Study with GPS ProbeData. In: Proceedings of the Eastern Asia Society for Transportation Studies. vol. 9; 2013.
36. Tilahun NY, Levinson DM, Krizek KJ. Trails, lanes, or traffic: Valuing bicycle facilities with an adaptivestated preference survey. Transportation Research Part A: Policy and Practice. 2007; 41(4):287–301.
37. Harvey F, Krizek KJ, Collins R. Using GPS data to assess bicycle commuter route choice. In: Transpor-tation Research Board 87th Annual Meeting. 08-2951; 2008.
38. Broach J, Dill J, Gliebe J. Where do cyclists ride? A route choice model developed with revealed prefer-ence GPS data. Transportation Research Part A: Policy and Practice. 2012; 46(10):1730–1740.
39. Hood J, Sall E, Charlton B. A GPS-based bicycle route choice model for San Francisco, California.Transportation letters. 2011; 3(1):63–75.
40. Menghini G, Carrasco N, Schüssler N, Axhausen KW. Route choice of cyclists in Zurich. Transportationresearch part A: policy and practice. 2010; 44(9):754–765.
41. Turner A. The role of angularity in route choice. In: Spatial information theory. Springer; 2009. p. 489–504.
42. Bierlaire M, Chen J, Newman J. Modeling route choice behavior from smartphone GPS data. ReportTRANSP-OR. 2010; 101016:2010.
43. Papinski D, Scott DM. A GIS-based toolkit for route choice analysis. Journal of Transport Geography.2011; 19(3):434–442. doi: 10.1016/j.jtrangeo.2010.09.009
44. Papinski D, Scott DM, Doherty ST. Exploring the route choice decision-making process: A comparisonof planned and observed routes obtained using person-based GPS. Transportation research part F:traffic psychology and behaviour. 2009; 12(4):347–358. doi: 10.1016/j.trf.2009.04.001
45. Carrion C, Levinson D. Valuation of travel time reliability from a GPS-based experimental design.Transportation Research Part C: Emerging Technologies. 2013; 35:305–323. doi: 10.1016/j.trc.2012.10.010
46. Zhang L, Xie F, Levinson D. Illusion of Motion. Transportation Research Record: Journal of the Trans-portation Research Board. 2009; 2135(1):34–42. doi: 10.3141/2135-05
47. Carrion C, Levinson D. Value of travel time reliability: A review of current evidence. Transportationresearch part A: policy and practice. 2012; 46(4):720–741.
48. Palat B, Delhomme P, Saint Pierre G. Numerosity heuristic in route choice based on the presence oftraffic lights. Transportation Research Part F: Traffic Psychology and Behaviour. 2014; 22:104–112.doi: 10.1016/j.trf.2013.11.004
49. Zhang L, Levinson D. Determinants of route choice and value of traveler information: a field experiment.Transportation Research Record: Journal of the Transportation Research Board. 2008; 2086(1):81–92.doi: 10.3141/2086-10
50. Parthasarathi P, Levinson D, Hochmair H. Network structure and travel time perception. PloS one.2013; 8(10):e77718. doi: 10.1371/journal.pone.0077718 PMID: 24204932
51. Nagel K, Beckman RJ, Barrett CL. TRANSIMS for transportation planning. LA- Los Alamos Unclassi-fied Report UR 98–4389; 1998.
52. Ben-Akiva M, BERGMANM, DALY A, RAMASWAMYR. Modeling Inter Urban Route Choice Behavioir.Proceedings of the Ninth International Symposium on Transportation And Traffic Theory. 1984;.
Do People Use the Shortest Path?
PLOS ONE | DOI:10.1371/journal.pone.0134322 August 12, 2015 17 / 18

53. Azevedo J, Santos Costa MEO, Silvestre Madeira JJER, Vieira Martins EQ. An algorithm for the rank-ing of shortest paths. European Journal of Operational Research. 1993 Aug; 69(1):97–106. doi: 10.1016/0377-2217(93)90095-5
54. De La Barra T, Perez B, Anez J. Multidimensional path search and assignment. Proceedings of the21st PTRC Summer Meeting. 1993; 363:307–319.
55. Levinson D, Zhu S. A Portfolio Theory of Route Choice; 2010. working paper.
56. Mirchandani P, Soroush H. Generalized traffic equilibrium with probabilistic travel times and percep-tions. Transportation Science. 1987; 21(3):133–152. doi: 10.1287/trsc.21.3.133
57. Huang Y. Accessibility and non-work destination choice: A microscopic analysis of GPS travel data.UNIVERSITY OFMINNESOTA; 2014.
58. Rates E. Atlanta Commute Vehicle Soak and Start Distributions and Engine Starts per Day Impact onMobile Source. Atlanta. 2007;.
59. Craig WJ. White knights of Spatial Data Infrastructure: The role and motivation of key individuals.URISA journal. 2005; 16(2):5–13.
60. Long Cheu R, Xie C, Lee DH. Probe vehicle population and sample size for arterial speed estimation.Computer-aided civil and infrastructure engineering. 2002; 17(1):53–60. doi: 10.1111/1467-8667.00252
61. Marx RW. The TIGER system: automating the geographic structure of the United States census. Intro-ductory Readings in Geographic Information Systems. 1990;p. 120–141.
62. Parthasarathi ASNG Pavithra, Levinson D. The Importance of Being Early. 2009;.
63. Schuessler N, Balmer M, Axhausen KW. Route choice set for very high resolution data. In: The 89thAnnual Conference of Transportation Research Board, Washington D.C.; 2010.
64. Schönfelder S, Axhausen KW, Antille N, Bierlaire M, Axhausen KW, Axhausen KW, et al. Exploring thePotentials of Automatically Collected GPS Data for Travel Behaviour Analysis: A Swedish Data Source.Citeseer; 2002.
65. Wolf J, Guensler R, BachmanW. Elimination of the travel diary: Experiment to derive trip purpose fromglobal positioning system travel data. Transportation Research Record: Journal of the TransportationResearch Board. 2001; 1768(-1):125–134. doi: 10.3141/1768-15
66. Stopher P, FitzGerald C, Xu M. Assessing the accuracy of the Sydney Household Travel Survey withGPS. Transportation. 2007; 34(6):723–741. doi: 10.1007/s11116-007-9126-8
67. Doherty ST, Noël N, Lee-Gosselin M, Sirois C, Ueno M, Theberge F. Moving beyond observed out-comes: Integrating Global Positioning Systems and interactive computer-based travel behaviour sur-veys. Transportation Research E-Circular, C. 2001; 26:449–466.
68. Du J, Aultman-Hall L. Increasing the accuracy of trip rate information from passive multi-day GPS traveldatasets: Automatic trip end identification issues. Transportation Research Part A. 2007; 41(3):220–232.
69. Axhausen K, Schonfelder S, Wolf J, Oliveria M, Samaga U. Eighty weeks of gps traces, approaches toenriching trip information. In Transportation Research Board Annual Meeting. 2004.
Do People Use the Shortest Path?
PLOS ONE | DOI:10.1371/journal.pone.0134322 August 12, 2015 18 / 18


![Shortest-pathg rocerys hoppingjustinppearson.com/pages/shortest-path-grocery-shopping/shortest-path-grocery-shopping.pdfGraphPlot[meshGraph, ImageSize→ Full] Getthegraphvertices](https://img.dokumen.tips/doc/110x75/5ec9717fc18133726b4d56ff/shortest-pathg-rocerys-h-graphplotmeshgraph-imagesizea-full-getthegraphvertices.jpg)