Embed Size (px)
Citation preview

Do Payday Loans Cause Bankruptcy?�
Paige Marta Skiba
Vanderbilt University
Jeremy Tobacman
University of Pennsylvania and NBER
November 9, 2009
Abstract
Some recent papers using geographical sources of variation �nd that payday loans, despite
their annualized interest rates of at least several hundred percent, may provide bene�ts to
borrowers and their communities. This paper uses individual-level identi�cation from a dis-
continuity in the evaluation of loan applications and �nds the opposite result, at least for the
subsample identifying the local average treatment e¤ect. Speci�cally, we show that for �rst-
time applicants near the 20th percentile of the credit-score distribution, access to payday loans
causes Chapter 13 bankruptcy �lings over the next two years to double. In part, this large e¤ect
is caused by small ($300) loans because consumers are already �nancially stressed when they
begin borrowing on payday loans. In addition, many payday borrowers take out multiple loans,
so that the cumulative interest burden from payday loans amounts to roughly 11% of the total
liquid debt interest burden at the time of bankruptcy �ling. We �nd no evidence of strategic
payday borrowing in anticipation of debt erasure in bankruptcy.
JEL Codes: D14 (Personal Finance), K35 (Personal Bankruptcy Law), D12 (Consumer Eco-
nomics: Empirical Analysis)
�We would like to thank David Abrams, Dan Benjamin, David Card, Michael Clemens, Raj Chetty, StefanoDellaVigna, Ed Glaeser, Michael Greenstone, Zack Grossman, Joseph Hennawi, Pamela Jakiela, Kory Kroft, DavidLaibson, David S. Lee, Ulrike Malmendier, Paco Martorell, Justin McCrary, Markus Mobius, Sendhil Mullainathan,Devin Pope, Matthew Rabin, Steve Raphael, Emmanuel Saez, Mel Stephens, Justin Sydnor, and Maisy Wong formany helpful conversations, and seminar audiences at The Federal Reserve Bank of Chicago, Harvard University,IFS, Oxford University, RAND, Wharton, and UC Berkeley for valuable feedback. Susan Carter, Jonathan Leungand Chandini Singh provided excellent research assistance. We are also grateful to Elizabeth Warren for facilitatingaccess to the bankruptcy data and to the Horowitz Foundation and a Warburg grant from the Harvard EconomicsDepartment for �nancial support. Earlier versions of this paper circulated under the title, �Measuring the Individual-Level E¤ects of Access to Credit: Evidence from Payday Loans.�
1

1 Introduction
An estimated ten million American households borrow on payday loans each year and payday
lenders now have more storefronts in the United States than McDonald�s and Starbucks combined.1
According to the Survey of Consumer Finance, 2.38 percent of households in 2007 (weighted to
represent a nationally representative sample) used payday loans within the past year. Payday loans
o¤er borrowers a few hundred dollars cash until their next paydays. Borrowers provide proof of
employment and a post-dated check for the principal and interest which is deposited by the lender
typically two weeks later. Short payday loans generate high interest payments. Finance charges
are typically 18 percent for the duration of the loan, and most payday borrowers are paid biweekly.
This implies an APR of at least 18% x 26 = 468%, since people paid biweekly receive 26 paychecks
in a year.2
Standard economic theory suggests that consumer credit� even high-interest credit� can facil-
itate consumption-smoothing, and the payday loan industry asserts that the loans help customers
cope with short-term shocks that arise between paychecks.
Many policymakers and consumer advocates have a di¤erent view, deeming the loans predatory
and usurious. In a typical example, State Senator Jim Ferlo of Pennsylvania argued that payday
lenders �encourage you not to pay them back and they reel you in. They start the process of getting
you hooked �nancially. You accumulate interest and it becomes a vicious cycle�(Mauriello 2005).
The polarized debate on the consequences of this increasingly popular form of credit has led 11
states to pass legislation restricting or prohibiting payday lending, and in November 2005 the FDIC
capped the number of payday loans a borrower could take out each year (FDIC 2005).3
In this paper, we provide borrower-level estimates of the e¤ects of access to payday loans. A
regression discontinuity provides identi�cation at the individual level, in the unique context of
a proprietary dataset from a large payday lender. We match individuals from the proprietary
dataset with public records on bankruptcy petitions and then exploit the regression discontinuity
1Stephens, Inc., an investment bank that monitors the industry, has compiled a national database of paydaylending outlets using information from state regulatory agencies and telephone listings. Most recently, they counted22,300 payday loan outlets in the US in 2008. They also reported that the annual dollar volume of loans grewfourfold in four years to $40 billion dollars in 2003 (Robinson and Wheeler 2003, PricewaterhouseCoopers 2001).
2Payday lenders typically do not allow interest to compound, but an alternative APR measure that better capturesthe cost of liquidity is 100 �
�1:1826 � 1
�= 7295%: Skiba and Tobacman (2008a, 2008b) assess, respectively from the
demand side and the supply side, how these interest rates can persist in equilibrium.3The cap depends on the loan durations. Any e¤ect of the rule would have appeared after our period of observation.
2

to estimate the e¤ect of access to payday loans on chapter 7 and chapter 13 bankruptcies.4 To
interpret the mechanisms driving the bankruptcy results, we also measure the e¤ect of payday loan
access on subsequent payday borrowing.
Institutional features of the loan application process at the lender that has provided our data
make the regression-discontinuity approach possible.5 Payday loan applications are approved if and
only if the applicant�s credit score exceeds a �xed threshold, with few exceptions. Our identifying
assumption is that, controlling for �exible smooth functions of the credit score, unobservable char-
acteristics of �rst-time applicants in the immediate neighborhood of the threshold are similar. If
this is true, di¤erences in bankruptcy rates between barely approved and barely rejected applicants
can be attributed to payday loan access.6
Depending on the speci�cation, our regression-discontinuity estimates imply a doubling of chap-
ter 13 bankruptcy petitions within two years of a �rst-time applicant�s successful payday loan ap-
plication. Nonparametric estimates support the conclusion that payday loan access increases the
probability of �ling for bankruptcy, though those estimates introduce other puzzles. An innova-
tion of this paper is that we are able to decouple these results to reveal that the average pattern
conceals substantial heterogeneity. Our �ndings are consistent with the interpretation that payday
loans� and interest payments on them� might be su¢ cient to tip the balance into bankruptcy for
a population that is already severely �nancially stressed: The personal bankruptcy rate among
all applicants in our dataset, 2.3% per year, is greater than the rate in the general population by
a factor of 6.05. Note again that payday loan interest rates exceed rates on most other forms of
credit, and that most payday loan applicants have exhausted other liquidity sources (Elliehausen
and Lawrence 2001).
These �ndings are surprising because payday loans are small (mean�median�$300), and bank-
ruptcy is a cumulative �nancial outcome. We interpret the bankruptcy results by �rst examining
4We study bankruptcy petitions, regardless of whether the petition was dismissed. The majority of Chapter 13petitions are dismissed in our data. We view petitions themselves as an outcome of interest, representing a formof �nancial distress. Because bankruptcy law precludes creditors from contacting debtors once a petition is �led,regardless of the outcome of the process, debtors may �le to protect themselves from creditors even if their debts areunlikely to be discharged. Hereafter we use �petition�and ��ling� interchangeably.
5Regression-discontinuity analyses are now commonplace. For the econometric foundations, see Thistlethwaiteand Campbell (1960), Hahn, Todd and der Klaauw (2001), Porter (2003) and McCrary (2008). Many modernapplications stemmed from the work of Angrist and Lavy (1999); see also, especially, David Lee�s many recentcontributions (Lee 2008, Lee and Card 2008, Lee and McCrary 2005, DiNardo and Lee 2004, Lee, Moretti andButler 2004). Imbens and Lemieux (2007) provide a useful practical guide.
6Throughout the paper, for convenience we refer to the e¤ect of �rst-application approval, conditional on applying,as the e¤ect of �payday loan access.�
3
the consequences of �rst-time payday loan approval for subsequent high-interest-rate borrowing.
We demonstrate that approval for one payday loan results in a pattern of future payday loan appli-
cations: �rst-time applicants in our dataset who are approved apply, on average, for 5.2 more loans
than rejected �rst-time applicants over the next 12 months. In dollar terms, this results in $1600
in loans and $300 in interest payments. This suggests payday loan applicants have a persistent
demand for credit, so, having discovered a place where credit is available, they return frequently.
We also examine detailed information on creditors, assets, and liabilities from the subsample of
individual bankruptcy petitions that statistically identify our empirical estimates. The absence of
short-run e¤ects of payday loan approval on bankruptcy petitions casts doubt on the theory that
payday borrowers are strategically accumulating debt in anticipation of bankruptcy. Our results
are more consistent with a medium-run e¤ect compromising of borrowers�overall �nancial stability
due to repeated �nance charges made to the payday lender.
Beyond these speci�c �ndings, the paper extends the literature on the e¤ects of credit access
and on payday loans speci�cally by revealing substantial heterogeneity in e¤ects that previous
work without individual-level data conceals. The payday loan industry, and the subprime-lending
market more broadly,7 have grown dramatically in the last decade. Data on high-interest lending
are proprietary, con�dential, and politically sensitive. This paper relies on an administrative dataset
from a major payday lender, comprising detailed demographic and borrowing information for the
full population of loan applications over a four-year period. Individual identi�ers in the application
records� such as name, date of birth, and Social Security number� allow us to match each applicant
to public records on bankruptcy petitions. This unique, large-scale, matched database and our
individual-level identi�cation strategy allow us to explore the microeconomic channels through
which credit a¤ects consumers, complementing the rich literature which identi�es market-level
impacts of credit.8
The analysis in this paper has several limitations. First, while our research design provides
7Payday loans are one form of �fringe banking�Caskey (1994). Like check cashing services and pawnshops, paydaylenders provide alternatives to traditional banks. Caskey (1991, 1994, 2001, 2005) has studied fringe banking in greatdetail; Flannery and Samolyk (2005) have analyzed the pro�tability of the payday lending industry; Elliehausenand Lawrence (2001) conducted surveys of payday borrowers; and Stegman and Faris (2003) review the payday loanindustry�s business practices, but the literature on fringe banking remains sparse. Washington (2006) and Adams,Einav and Levin (2006) have studied fringe banking and subprime lending more recently.
8Among the vast literature in economics on borrowing and credit, there is very little empirical research on thecausal impact of individual-level random variation in the ability to borrow money. Excellent exceptions are the workof Gross and Souleles (2002) and Ausubel (1999) on credit cards, and Karlan and Zinman (2005), Karlan and Zinman(forthcomingb) and Karlan and Zinman (forthcominga) studies of South African consumer credit.
4

clean identi�cation, it has limited ability to address welfare issues. The social costs of chapter
13 bankruptcy are di¢ cult to measure.9 The second limitation is that our data derive from a
single lender that operates hundreds of payday loan outlets but is not a monopolist. Thus, our
main estimates represent an upper bound on any e¤ects access to payday loans has on subsequent
payday borrowing behavior and a lower bound on the e¤ects on bankruptcy. We explore how
competition in payday lending a¤ects the results below by estimating the e¤ects separately for zip
codes where this �rm operates 100% of the shops and zip codes where this �rm has medium and
high levels of competition.
Third, it is unclear how readily any results will generalize beyond the ten million working
households borrowing on payday loans each year to other borrowers. Finally, a limitation common
to all research employing the regression-discontinuity approach10 is that estimates are identi�ed o¤
of a small range around the discontinuity. Payday loan access may a¤ect consumers with very high
or very low credit scores di¤erently than the marginal applicants that drive this paper�s estimates.
We believe Karlan and Zinman (forthcominga) argue rightly, however, that it is particularly valuable
to study the e¤ects of credit access on marginal borrowers since they are likely to be the �rst a¤ected
by changes in policy or lenders�choices.
Our paper adds to the growing literature on the e¤ect of high-interest credit by using individual-
level variation rather than aggregate-level changes in access to payday loans such as changes in state
regulatory environments or zip-code or county-level shocks. Consensus regarding whether access
to payday loans increases or decreases �nancial strain is illusive. While our work adds to the
research �nding that payday loans increase �nancial strain, we additionally focus more directly on
heterogeneity in estimates of the e¤ect of payday lending masked by recent work. By uncovering
payday lending�s heterogeneous e¤ects on di¤erent types of consumers, we may yet be able to
reconcile what at �rst appeared to be various research designs contradicting one another.
Using data on check bouncing from Federal credit processing centers, complaints to the FTC
about lenders and debt collectors, and state consumer bankruptcy �lings from 1997 to 2007, these
9A companion paper (Skiba and Tobacman 2008a) develops a structural dynamic-programming model of con-sumption, saving, payday loan borrowing and default behavior. That paper�s model includes standard features likeliquidity constraints and uncertainty, and also incorporates institutionally realistic payday loans and generalizationsof the discount function. Method of simulated moments estimates of the model�s key parameters support the hypoth-esis of partially naive quasi-hyperbolic agents, and the estimated structural model permits evaluation of the welfareimplications of policy alternatives.10More generally, discrete instrumental variables identify only local average treatment e¤ects (Imbens and Angrist
1994).
5

variables change in Georgia and North Carolina after payday loans were prohibited in 2004 and 2005,
respectively. The authors do di¤erence in di¤erence estimations along with DD regressions that
control for unemployment and �nd that in Georgia, relative to other states with no law change,
check bouncing, complaints, and chapter 7 bankruptcies all increased signi�cantly. Chapter 13
bankruptcies, however, fell. Coe¢ cients are similar for North Carolina (which results they consider
preliminary because of the timing and sample size) but returned checks are no longer signi�cant.
Finally, they use Hawaii, where the legal limit for pay day loans doubled in 2003 and thus they
have a longer sample, and �nd similar results. Their results indicate that reduced access to payday
loans has a negative impact on consumer welfare.
Similarly, Oregon put a cap on the maximum interest rate a lender could charge along with
a minimum loan term of 31 days in 2007 which e¤ectively reduced the number of payday lenders
in the state. Zinman (forthcoming) applies a di¤erence in di¤erence approach to compare payday
borrower�s use of credit and �nancial situation in Washington (where there was no change in
law) and Oregon before the change to after the change. His �ndings show that payday borrowers
in Oregon substituted to bouncing checks and paying late bills after the law and they had a
signi�cantly greater likelihood of experiencing an adverse event such as job loss or a decrease in
�nancial situation.
Work by Morse (2009) and Melzer (2009) provides estimates of payday lending�s e¤ects using
geographic variation in the placement of stores for identi�cation. Morse studies the e¤ects that
�nancial distress has on the foreclosures and crimes in areas where there is access to pay day
loans relative to areas that do not have access. Using zip code level data on natural disasters,
foreclosures, and crimes for the state of California between 1996 and 2002, she employs a di¤erence
in di¤erence in di¤erence (DDD) approach to �nd that while areas experiencing the exogenous shock
of a �nancial disaster have an increase in foreclosures and small crimes, the presence of a payday
lender in the zip code mitigates these e¤ects. She concludes that these results are evidence that
payday loans help alleviate problems for people in �nancial distress caused by a natural disaster;
she is, however, clear that these results do not automatically apply to all payday debtors, especially
those who are using the loans on a habitual basis.
In order to study the impact of access to payday loan on �nancial and medical hardship without
having results biased by endogenous store location and state-level policy decisions, Melzer measures
access to payday loans as the distance from a county in a state where payday loans are prohibited
6

to the closest state where there are payday loans. He uses household data from Urban Institute�s
National Survey of America�s Families, which asks questions on �nancial hardship (di¢ culty paying
bills, Cutting Meals, Moving out because of �nancial problems, and not using a phone for a month
to save money) along with questions on health related issues (Postponing medical care, dental care,
and drug purchases). Melzer runs a probit estimation and checks with a di¤erence in di¤erence
regression (using the fact that some of the border states changed their laws) to �nd that access to
loans had a positive impact on �nancial hardships, especially di¢ culty paying bills. The results
are not as conclusive in the DD test for health related variables, but the probit estimation does
reveal evidence that access to payday loans increases the likelihood of postponing any medical care.
Overall, Melzer �nds that payday loan access has a negative impact on the �nancial well-being of
individuals.
Zinman and Carrell (2008) look at the impact of the presence of payday loans on Air Force
personnel�s performance, a concern expressed by the Pentagon. Using the assignment of airmen to
bases by occupational needs and not choice, along with the variation in laws on the prohibition of
payday loans between states and over time, they can determine the e¤ect on reenlistment eligibil-
ity, presence of an Unfavorable Information File, and forced enrollment in a Weight Management
Program over there periods 1996 to 2004 and 1996 to 2007. They �nd the presence of payday loans
in states where an airmen is assigned increases the likelihood of Reenlistment Ineligibility and an
Unfavorable Information �le, especially for the young and �nancially unsophisticated (proxied for
by job assignment), which provides support for the Pentagon�s concern that payday loans cause
�nancial distress for military personnel.
Additionally, Karlan and Zinman (forthcominga) implement an experiment in South Africa to
study the price elasticity of demand for high-interest credit. Dennis Campbell and Tufano (2008)
use county-level data to show that access to payday loans is associated with an increase in bank
account closures. Lefgren and McIntyre (2008) show that bankruptcy rates are not in�uenced by
the legalization of payday lending.
The remainder of the paper proceeds as follows. In Section 2, we provide additional background
on payday loans. Section 3 outlines our estimation strategy, focusing on the credit-score disconti-
nuity. We present our main empirical results, on the e¤ect of payday loans on bankruptcy �lings,
in Section 4. Section 6 examines the mechanisms driving these results, and Section 7 concludes.
7

2 Payday Loans: Data and Institutional Features
The payday loan data we use are administrative records from a provider of �nancial services. To
apply for payday loans at this company, individuals �ll out loan applications and present their most
recent pay stubs, checking-account statements, and utility or phone bills, along with state-issued
photo IDs. The lender uses applicants�pay stubs to infer the dates of their next paydays and assign
loan due dates. The duration of payday loans is extremely short, ranging from one week to one
month depending on how frequently the borrower is paid. Payday loans are collateralized with
personal checks dated on borrowers�upcoming paydays.11
We study individuals whose �rst loan application at this company occurred at an outlet in
Texas. This universe of data includes over 1 million loan applications by about 145,000 individuals.
Table I presents demographic and background characteristics of this population and summary
information about their applications and loans. All data are de�ated with the CPI-U to January
2002 dollars. We censor and replace with missing the top 0:1% of the distributions of bank balance
and take-home pay. We also replace age with missing if age is less than 18.
Consistent with survey evidence on payday borrowers, women are slightly more common than
men in our population, and a large share of the applicants are Black or Hispanic.(Elliehausen and
Lawrence 2001) Median annualized individual income is about $20,000, and the median balance in
applicants�checking accounts is $66.12
3 Identi�cation
3.1 The Credit-Score Regression Discontinuity
Access to payday loans depends on a credit score calculated at the time of the loan application
by a third party called Teletrack.13 Scores above a �xed threshold result in loan approval, while
11The longstanding practice of some employers who provide advances against upcoming paychecks is distinct fromthe topic studied here: payday lenders do not directly garnish paychecks to obtain loan repayment.12Having a checking account is a precondition for receiving a payday loan: each applicant must have an account
against which to write her postdated personal check. As a result, payday loans are not used by the unbanked(Washington 2006), though that population is targeted by services like check cashing that some payday lenders alsoo¤er.13The credit-scoring formula is proprietary, but we understand these scores to di¤er from FICO scores in depending
on a shorter history of behavior and focusing on borrowing histories in the subprime market. Though Teletrack servesall major payday lenders, the lenders establish their own criteria for approving loan applications. Skiba and Tobacman(2008b) discuss more details of the credit-scoring process in the context of the pro�tibility of payday lenders.
8

applications with scores below that threshold are rejected. Among the 17.4% of �rst-time applicants
with scores below the threshold, 99.6% are rejected, while 96.9% of �rst-time applicants scoring
above the threshold are approved. The credit-scoring formula and the threshold for approval
were adjusted at all shops once during our period of observation, in August 2002. We perform
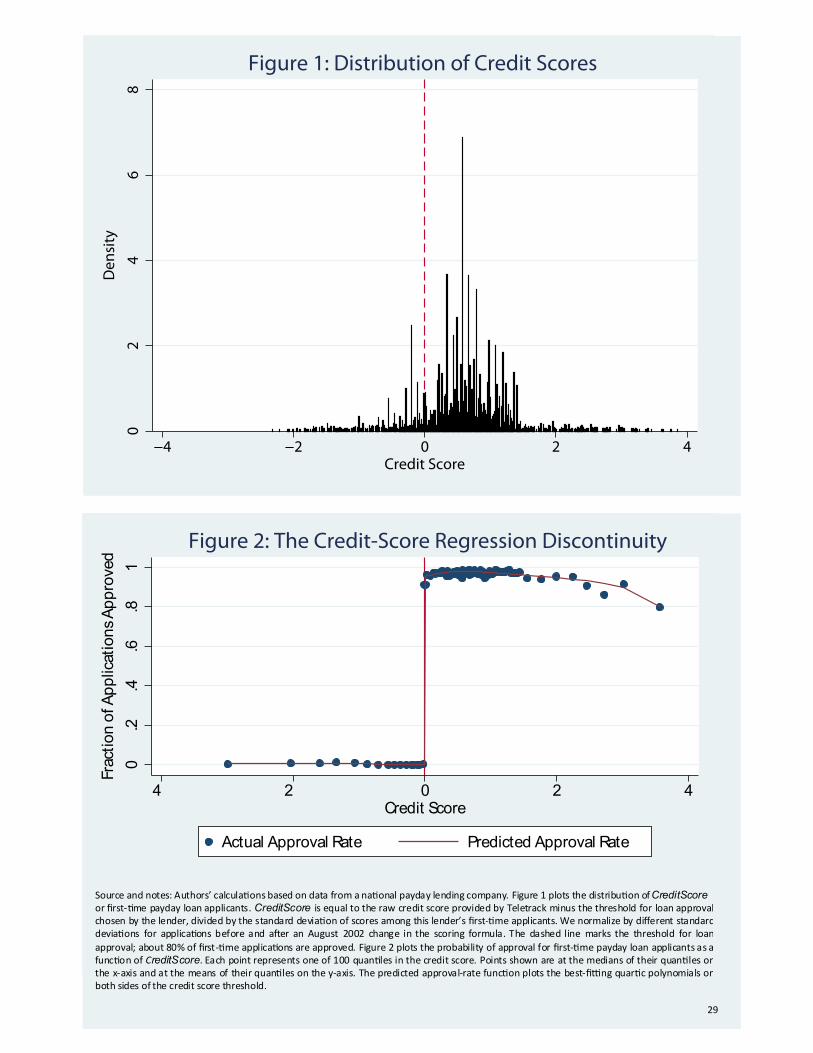
the analysis three ways. First, we focus on a single variable called CreditScore, which is equal
to the raw Teletrack score minus the approval threshold that was in force at the time of the
application, normalized by the corresponding pre- or post-August 2002 standard deviation of raw
scores. However, standard tests indicate the pre- and post-August 2002 distributions of CreditScore
di¤er. Thus we explore the e¤ects pre and post the credit score change in Section 5.2. The main
speci�cations assume the functional form of the e¤ects of CreditScore did not change. Figure 1
plots a histogram of CreditScore for �rst-time payday loan applicants.14
Consistent with the company�s stated policy, the credit score has a discontinuous e¤ect on the
probability a payday loan application is approved. Figure 2 displays the probability of approval
among �rst-time applicants, Approved; as a function of CreditScore. Two quartic polynomials, �t
independently to the data on either side of the credit-score threshold, are superimposed on the
�gure.
We quantify the discontinuity by examining the coe¢ cient on an indicator for being above
the threshold, AboveThr, in regressions of Approved on AboveThr; functions of CreditScore, and
control variables presented in Table II. Most generally, for �rst-time applicants we estimate:
Approvedi = �0 + �1AboveThri + f (CreditScorei) + X0i + �M
0ti + "i; (1)
where f (�) is a function of the credit score; Xi is a vector of demographics and background charac-
teristics including gender, race dummies, age, monthly income, job tenure, pay frequency dummies,
checking account balance, the number of �not su¢ cient funds�events on the most recent bank state-
ment, months in current residence, dummies for homeownership, direct deposit, and garnishment
of paycheck, and dummies for missing for each of these variables; and M t is a full set of dummies
for month of �rst payday loan application, so M ti = 1 if �{�s �rst application was in month t and
M t0i = 0 for t0 6= t. In our benchmark speci�cations, f (�) is a quartic in CreditScorei interacted
with AboveThri.15
14We focus on credit scores at the time of �rst payday loan applications for reasons discussed below.15Equivalently, since AboveThri = I (CreditScorei � 0) ; f (�) equals independent quartics on either side of the
9

Columns 1-5 of Table II report OLS (linear probability model) regressions based on this speci�-
cation. In every speci�cation, the coe¢ cient on AboveThr is highly signi�cant and equal to slightly
less than 1. The R-squared in Column 1 equals 0.84 when only AboveThr is included on the
right-hand-side (RHS). As the subsequent columns add in a quartic in CreditScore fully interacted
with AboveThr; the demographics listed above, and the dummies for month of �rst payday loan
application, the coe¢ cient on AboveThr hardly changes and the R-squared increases by only 1%.
Probits in Columns 6-8 (showing marginal e¤ects) reveal the same pattern.
Other institutional features permit us to exploit the exogeneity of AboveThr conditional on
f (CreditScorei) for �rst-time applicants. During the application process, the payday loan com-
pany�s employee submits information about the applicant electronically to the company�s central
servers, which in turn send a query to Teletrack. Within minutes, a yes-or-no noti�cation of whether
the application was approved or declined is returned. Neither applicants themselves nor the em-
ployees in the store are informed of the applicants� scores or the passing credit-score threshold.
Moreover, Teletrack uses additional information from other lenders, which is not available to this
lender�s employees, to compute the score: an OLS regression of the Teletrack scores of �rst-time
payday loan applicants on the demographic and background variables listed in Table I, including
a full set of month dummies, yields an R-squared of 0.365. Thus AboveThr likely impacts an
individual�s future choices only insofar as AboveThr a¤ects application approval. The regressions
reported above therefore constitute the �rst stage of an IV strategy, with a plausible exclusion
restriction, that we use throughout the rest of the paper. See also the Identi�cation Appendix for
further discussion.
3.2 Empirical Speci�cations
Using the credit-score discontinuity described in the previous section, we estimate the e¤ect of
payday loan approval on each outcome of interest at horizons from � = 1d to � = 3y after the �rst
payday loan application. We denote the outcome by individual i between the date of �rst payday
loan application and horizon � by Outcome�i . We consider several speci�cations. First, we estimate
this equation using OLS:
Bankruptcy�i = �0 + �1Approvedi + f (CreditScorei) + X0i + �M
0ti + "i: (2)
threshold.
10

Our main speci�cation is a reduced form:
Bankruptcy�i = �0 + �1AboveThri + f (CreditScorei) + X0i + �M
0ti + "i: (3)
Third, we run IV regressions, instrumenting for Approved with AboveThr: Additionally we restrict
the OLS, IV and Reduced Form speci�cations to subsets of the data, narrowing in to +/-0.5 and
+/-0.1 standard deviations around the credit-score threshold. Our preferred speci�cation estimates
equation 3 for the sample +/-0.5 standard deviations near the threshold. The Imbens-Lemieux sug-
gestion for bandwidth-choice criterion is inapplicable here because of our binary outcome variables.
(Imbens and Lemieux 2007)
4 Bankruptcy
The literature on personal bankruptcy raises two questions of signi�cant interest. First, do �lers
act strategically when they �le, i.e., do they accumulate debt which will be discharged in the event
of bankruptcy, hold assets up to and not above the state�s exemption limit, and choose the optimal
chapter for their case? Second, to what extent does bankruptcy serve as a form of social insurance?
Papers in the former literature are divided. White (1998), for example, concludes that at least
10% of households would gain �nancially from bankruptcy �ling. By contrast, using state-level
variation, Lehnert and Maki (2002) �nd that �lers optimally �negative estate plan,�by converting
liquid assets into dischargeable debts before �ling. Literature examining the social insurance aspect
of bankruptcy is limited. Himmelstein, Warren, Thorne and Woolhandler (2005) survey bankruptcy
�lers and �nd that half cite medical debt as a factor in their �lings. Domowitz and Sartain
(1999) �nd that employment and medical shocks account for some bankruptcies, supporting the
�bankruptcy as insurance� point of view. White and Zhu (2009) provide strong evidence that
chapter 13 is largely used by debtors solely to avoid home foreclosure.
Using the procedures described above, we measure the e¤ect of payday loan access on chapter
7 and chapter 13 personal bankruptcy �lings. Payday loan approval could a¤ect the probability
of bankruptcy in several ways. First, people with little outstanding credit are unlikely to �le for
court protection from creditors, implying that any loan approval, by providing a creditor, could
increase the probability of bankruptcy. Second, loan approval could temporarily alleviate �nancial
pressure� for instance until labor supply can be increased. In this case we might expect rejection
11

of a payday loan to increase bankruptcy petitions. Third, payday loans could also have a medium-
term e¤ect on the personal �nances of borrowers as interest payments (at very high rates) add up.
Because payday loans mature each pay period (typically two weeks), whereas payments on other
loans are generally due each month, payday interest payments may take priority and borrowers
may fall further behind on other accounts. We next evaluate these hypotheses.
Our approach complements existing empirical work on the determinants of bankruptcy, for
example by distinguishing between chapter 7 and 13 bankruptcy petitions. Chapters 7 and 13
result in di¤erent private and social bene�ts and costs. Chapter 7 bankruptcy relieves a debtor of
all dischargeable debts.16 Non-exempt assets must be turned over to the �ler�s trustees at the time of
�ling. A trustee sells these assets and repays creditors. Texas has an unlimited homestead allowing
debtors to keep their home. Debtors can �le for chapter 7 bankruptcy no more than once every 6
years. Chapter 13 bankruptcy, by contrast, does not result in the erasure of dischargeable debt.
Instead, each �ler proposes a several-year repayment plan to the court, and the judge determines
whether the repayment plan is reasonable based on income, assets, etc. After successful completion
of the repayment plan, the remainder of debts are discharged. Judges determine whether debtors
can a¤ord repayment under a chapter 13 reorganization; and, if so, judges do not permit �ling
under chapter 7. Debtors can �le for chapter 13 bankruptcy as often as they wish, i.e., they can
revise their repayment plan and submit changes to the judge repeatedly. Debtors can �le chapter
7 bankruptcy following a chapter 13 �ling and often do so if they �nd they cannot a¤ord their
original repayment plan. Bankruptcy �lings appear on debtors�credit reports for 10 years.
The Bankruptcy Abuse Prevention and Consumer Protection Act (BAPCPA) of 2005 made it
harder to �le for bankruptcy and particularly for chapter 7, for example, by requiring the �ler to
attend credit counseling and introducing income-based means tests.17 While enactment of BAPCPA
occurred after our sample period, there could have been anticipatory e¤ects of the reform, as the
bill was signed in April 2005, which does allow us to examine the e¤ect of anticipation of reform
within one year of a consumer�s �rst payday loan application. Below we analyze the impact of
BAPCPA anticipation on the treatment in Section 5.1.
16Back taxes, most student loans, and child-support and alimony obligations are non-dischargeable. For moredetails on the bankruptcy process, see White (2009), Lefgren and McIntyre (2008) and White and Zhu (2009).17White (2007) provides a thorough discussion of the institutional features of BAPCPA, the political economy
surrounding the acts signing and enactment as well as discussion of consumers�reacttion to this reform.
12

4.1 Data
Personal bankruptcy petitions are public record and are available online through Public Access to
Court Electronic Records (PACER). We study the universe of 641,521 chapter 7 and chapter 13
personal bankruptcy �lings in the four United States Bankruptcy Courts in Texas from January
2001 through June 2005. The data include the date of �ling, the chapter of �ling (7 or 13),
the disposition of the bankruptcy case (generally, dismissal or discharge of debts), and individual
identi�ers that permit linkage to the payday loan data. We supplement these data with a small
sample of the detailed bankruptcy petitions debtors submit during the �ling process. The sample
consists of the 211 applicants closest to the credit-score threshold, with approximately half on either
side. These data include the names of the creditors (loan collection agencies in some cases), and
the amount and description of the type of debt for each creditor.
Table III provides an overview of the data we use. Panel A shows an individual bankruptcy
rate (as a fraction of population) for Texas as a whole of 0.38% per year (about 34 of the national
bankruptcy rate). Panel A also reports the fraction of chapter 7 versus chapter 13 �llings. (Ac-
cording to informal communications with the PACER Service Center, debtors �le under chapter 13
in order to protect their homes from foreclosure.)
We identify debtors in the PACER bankruptcy dataset with payday loan applicants if the
following variables in the two datasets match exactly: �rst name, last name, zip code of home
residence, and last four digits of Social Security number. By these criteria, as reported in Panel
A of Table III, 8,331 of the 145,519 payday loan applicants �led for personal bankruptcy during
the bankruptcy sample period.18 Given that the average amount of time from �rst payday loan
application to the end of the bankruptcy data period is 2.48 years, we compute an average rate of
8831145519�2:48 = 0:023 bankruptcy petitions per payday applicant per year. Comparing to Panel A of
Table III, we see that payday loan applicants have a bankruptcy base rate that is 0:023=0:0038 �
6:05 times the average rate in the population.
Panel B of Table III provides basic summary statistics on the fraction of those above and below
the credit threshold who �led for bankruptcy. These averages begin to tell the story that people
above the threshold are more likely to �le. Of course these are simple means, which do not control
18Of the 3,768 people who match in the Northern District for example, included are 244 couples in which bothspouses applied for payday loans. Our analysis below ignores the intra-household correlation structure of bankruptcy�ling.
13

for any demographics. Our next step is to the regression speci�cations which can test the e¤ect of
payday loan access on bankruptcy.
4.2 Main Estimation Results
Using the credit-score regression discontinuity, we estimate the e¤ect of payday loan approval on
chapter 7, chapter 13, and total personal bankruptcy �lings at one- and two-year horizons using
the basic speci�cation, Equation 3. Ch could be 7, 13, or All, and the dependent variables are as
above. The RHS variables are as described in Section 3 above.19
Table IV reports estimates of Equation 3 for Ch 2 f7; 13; Allg and � 2 f1y; 2yg : We multiply
the outcome variables by 100, so coe¢ cients in the table can be interpreted as the increase in
bankruptcies in percentage points associated with unit increases in the independent variables.
Column 1 presents the OLS results for the full sample, which shows little association between
loan approval and chapter 7 bankruptcy, and a strong and signi�cant association between loan
approval and chapter 13 bankruptcy. Speci�cally, approval is associated with an increase of 0.328
(0.319) percentage points in chapter 13 bankruptcies over one year (two years). Relative to the
baseline bankruptcy rate among payday loan applicants of 2.3%, this is an increase of 0:332:3 = 14:3%;
relative to the much lower baseline rate in the general population, it is an increase of 0:330:382 = 88%.
However, the OLS results could well be biased. For example omitted characteristics that a¤ect
bankruptcy declarations, like household assets, could be correlated with Approved even beyond
their correlation with f (CreditScore) and X. As a result, we focus more closely on individuals with
credit scores close to the threshold for loan approval. For them, there is more reason to believe that
approval may be randomly assigned conditional on the other independent variables. Speci�cally,
Columns 2 and 3 restrict to the subsample with credit scores no more than 0.5 and 0.1 standard
deviations, respectively, from the credit-score threshold for loan approval. For both chapter 7 and
chapter 13 bankruptcy, the standard errors on Approved rise in these columns as the number of
observations falls.
Section 3 demonstrated that a large share of the variation in Approved can be explained by
AboveThr, an indicator for whether the credit score is above a lender-de�ned threshold. To the
extent individual characteristics cause slippage between AboveThr and loan approval, correlation
19As the time horizon increases our number of observations falls: we compute Bkcy (Ch)�i for individual i only ifi�s �rst PDL application is at least � before the end of the bankruptcy sample period. This induces cohort e¤ectswhich we control for by including dummies for month of �rst PDL application in our regressions.
14

between those characteristics and propensity or ability to declare bankruptcy (e.g., if loan approval
is correlated with resourcefulness at paperwork, which is also necessary for completing a bankruptcy
�ling) could bias even the restricted-range OLS estimates. However, controlling for f (CreditScore)
and X, which do change discontinuously at the credit-score threshold, we can estimate the causal
impact of AboveThr on bankruptcy propensities. In Column 4 of Table IV we show that this
reduced-form e¤ect of AboveThr on chapter 7 bankruptcies within 2 years is smaller than the
full-sample OLS coe¢ cient on Approved and statistically insigni�cant. Column 4 also shows the
reduced-form e¤ect for chapter 13 which is nearly the same as the OLS coe¢ cient; AboveThr
increases chapter 13 bankruptcies by 0.341 percentage points over two years, or 0:3412:3 = 15% above
their baseline rate. Again, the increase relative to the baseline rate in the general population
is roughly 90%. The standard errors of these reduced-form OLS regressions fall by an order of
magnitude if we use Poisson or negative binomial regression instead. Columns 5 and 6 show the
narrowed ranges (0.5 and 0.1 standard deviations in credit score) of the reduced-form estimate.
Finally, to obtain another measure of the impact of Approved we instrument for it with
AboveThr. The IV regressions with the full sample, in Column 7 of this table, use all of the
available data but identify the parameter of interest only o¤ of the variation in Approved induced
at the credit-score threshold by AboveThr. As we would predict given the �rst stage regressions
(reported in Section 3), these regressions yield results almost identical to the reduced-form in
magnitude and signi�cance. Columns 8 and 9 again narrow the range of observations to 0.5 and
0.1 standard deviations around the credit-score threshold. The coe¢ cients rise in both cases and
become signi�cant when restricting to data within a 0.5 sd range, not surprising given the strong
relationship between AboveThr and Approved. The IV estimates are nearly identical to the reduced
form.
There are no statistically signi�cant overall e¤ects of access to payday loans on chapter 7
bankruptcy �llings. (Results are in the �rst Panel of Table IV.) The positive e¤ect access to
payday loans has on chapter 13 bankruptcies is revealed by the pattern of signi�cant coe¢ cients in
the 0.5 standard-deviation range for both the one- and two-year horizons.
These regression �ndings are also re�ected in Figures 3a, 3b, 4a and 4b which plot one- and
two-year chapter 7 and chapter 13 �ling rates versus credit-score centiles. Points shown are at
the medians of their quantiles on the x-axis and at the means of their quantiles on the y-axis. In
addition, the �gures plot a predicted bankruptcy rate generated from the reduced form regression.
15

We view the �gures as reinforcing the conclusions of the regression analysis and identifying their
limitations: a large e¤ect of payday loan approval on bankruptcy appears to be present, but the
e¤ect may be sensitive to the range around the threshold that is examined and to the functional
form of the credit-score controls.
Additionally, Figures 5a and 5b plot the reduced-form coe¢ cient estimates from the main
regressions as a function of the window around the threshold in standard deviations. We plot the
point estimates for each regression varying the bandwidth around the credit-score threshold up to
2 standard deviations, with +/- two-standard errors of the estimates.
One interesting feature of these �gures is that among this entire population, the probability
of �ling for bankruptcy increases in the �rst application credit score. We conjecture this overall
positive correlation is present because the sample of payday loan applicants is selected to have
had di¢ culties in regular (prime) credit markets; individuals with higher subprime credit scores
are more likely to have prime debt they would like to erase; and individuals with higher subprime
credit scores are more likely to have the �nancial savvy to �gure out how to �le for bankruptcy.
Our results are signi�cant for chapter 13 but not chapter 7. Our e¤ects on chapter 13 are driven
by the fact that 78% of our sample �ler chapter 13, despite the fact that about three quarters of
�lers in the US �le chapter 7. This makes sense in light of the main considerations in chapter choice
among debtors. To �le chapter 13, debtors must have regular income from which to make their 3-5
year plan payments. As payday borrowers must have regular income to obtain a payday loan, it is
logical that 78% of payday applicants who �le for bankruptcy �le chapter 13, as shown in Table
III. 2) A major factor in bankruptcy �lers�chapter choice is attorneys�fees. Chapter 7 bankruptcy
requires that debtors pay their attorneys fees up front, typically about $1500. Chapter 13 requires
debtors to pay only modest amount up front, around $200. Mann and Porter (forthcoming 2009)
document the fact that low-income bankruptcy �lers, like those in our sample, do not have the
liquidity to �le chapter 7 and thus enter chapter 13.
5 Robustness
We have examined this dependence on functional form further. In the context of the reduced-form
regressions with dependent variable Bkcy132y; we experiment with constraining f (CreditScore) to
be identical on either side of the threshold; removing f (CreditScore) entirely; removing the dummies
for month of �rst payday loan application; and removing the �nancial and demographic control
16

variables. We also use probits; linear probability models; and non-parametric locally weighted
polynomial (lowess) regressions. Most of the coe¢ cients in these speci�cations go in the same
direction and are signi�cant, including the lowess regressions. Section 5.2 discusses these results in
detail.
Speci�cally, the locally-weighted polynomial regressions of bankruptcy �ling rates on the credit
score, computed using Stata�s lowess command with a bandwidth of 0.8, are run separately above
and below the credit-score threshold. The �tted values of these regressions close to the thresh-
old represent the best available numeric approximations of the limits, from above and below the
threshold, of the bankruptcy �ling rates. The di¤erence between the two limits is the estimator;
and its standard error is estimated by bootstrapping. Speci�cally, we take 50 bootstrap samples of
the population within 0.2 standard deviations of the threshold, keeping �xed proportions on each
side. For each sample we compute the di¤erence between the estimated �ling rate immediately to
the right of the threshold and immediately to the left. The reported standard error is the standard
deviation of the estimates from each of the 50 bootstrap samples.
Because of the computational intensity of this analysis, we only report estimates for our bench-
mark case of chapter 13 bankruptcies within two years of the �rst payday loan application. The
nonparametrics con�rm the linear analysis reported above: the lowess point estimate of the e¤ect
on chapter 13 �lings within two years is 2.39 percentage points with a standard error of 1.01.
All of the analysis so far has focused on the cumulative e¤ect until � = 1y or � = 2y after the
�rst payday application. E¤ects on chapter 7, chapter 13 and all bankruptcies at horizons from
� = 1d to � = 3y are presented in Figures 8a-8c, which plot the estimated coe¢ cients on Approved
in reduced-form full-range regressions.20
5.1 Bankruptcy Reform
The largest change in bankruptcy law in the US to date was the Bankruptcy Abuse Prevention and
Consumer Protection Act of 2005 (BAPCPA). It was signed into law in April 2005 and went into
e¤ect in October 2005. BAPCPA was meant to reduce the number of �abusive �lings.�BAPCPA
made it more di¢ cult for debtors to �le either chapter.
The centerpiece of BAPCPA was the income-base means test. The means test was designed to
20The number of observations shrinks as � grows since we drop individuals for whom our sample period ends beforethe full � duration after their applications. This induces cohort e¤ects, which we control for by including dummiesfor month of �rst payday loan application in our regressions.
17

channel consumers into chapter 7 over chapter 13, thus making a full discharge of all debts more
di¢ cult. Debtors wishing to �le chapter 7 must have an average income in the last six months
below the median income in their state for a similar household size. Debtors who do not pass the
means test can attempt to �le chapter 13.
The signing and enactment of BAPCPA had a dramatic on the number of �lings. A large increase
in �lings occurred between April and October 2005 in anticipation of harsher �ling standards. A
drop in �lings followed the enactment in October 2005.
To test whether BAPCPA had an impact on the e¤ect access to payday loans had on bankruptcy
�lings, we use a subsample of the data which was exposed to BAPCPA. Because our sample only
goes to August 2004, we can only look at the impact of anticipation of BAPCPA because enactment
occurred in October 2005, too late for us to observe su¢ cient sample sizes. Table VIII shows
results separated by people who applied for payday loans before, and after, the credit-score change
in August 2002. We show the impact of payday loan access on bankruptcy �lings in the quarters
leading up to the enactment of BAPCPA. These results are strongest for people in the lower part of
the credit score distribution (those who �rst application was after the credit-score change). These
results are consistent with our general �ndings that the impact of payday loans is larger for people
in more severe �nancial distress.
5.2 Heterogeneity
We uncover substantial heterogeneity in the e¤ect of payday loan access on personal bankruptcy
�ling rates. First, we consider alternative functional forms for f (�) and the error. Instead of
the benchmark quartic in CreditScorei interacted with AboveThri; we try quadratics and cubics
interacted with AboveThri and quadratics, cubics, and quartics not interacted with AboveThri:
Second, instead of the linear probability models that we run in the benchmark OLS, reduced-form,
and IV regressions, we implement probits for binary outcomes and probits for I (Outcome�i > 0)
for non-binary outcomes. Third, for discrete, non-binary outcomes (e.g., the number of chapter 13
bankruptcy �lings), we run count regressions (Poisson and negative binomial). Fourth, as suggested
above, we fully interact a Post-August-2002 dummy with f (CreditScorei) and AboveThri. Next,
we run locally weighted polynomial regressions to nonparametrically estimate the treatment e¤ect
(Fan and Gijbels 1996, Hahn et al. 2001, Porter 2003, Imbens and Lemieux 2007). Sixth, we run
regressions for time � before each outcome, checking for the absence of e¤ects on these �placebo
18

outcomes.�
Finally, it should be noted that throughout the paper we focus on identi�cation from first
loan applications. In principle, more power would be available if our �rst stage included all ap-
plications. However, there is more slippage between AboveThr and application approval after the
�rst loan application: the lender is more likely to have a history on a repeat applicant that in-
forms its approval choice. In addition, the regression results reported above indicate we already
have considerable power in the �rst stage, and using all applications would require correcting for
intra-applicant correlation structure in the e¤ect of AboveThr on application approval and the
e¤ect of approval on the outcome variables of interest. We do replicate all the analysis using a new
endogenous variable, an indicator for whether an individual ever has an application approved:
In cases where any of these modi�cations to the benchmark speci�cation matter materially we
discuss them below. A full set of the results is available upon request. We further investigate
these e¤ects by looking at heterogeneity in Table V. Again we rely on the 0.5 standard-deviation
reduced-form estimates. (IV estimates are nearly identical.) Regressions are estimated for gender,
race and homeownership status. Sample sizes shrink so standard errors are large. Nonetheless,
chapter 13 results remain statistically signi�cant for females and blacks. Chapter 7 results are
negative in most cases. Texas has a generous homestead exemption so we may expect di¤erential
results for homeowners and renters, and indeed the e¤ects are larger for homeowners for chapter
13 �lings.
One potential concern with our results is that our data come from a single lender. Rejected
applicants may be able to obtain payday loans elsewhere. However, this observation strengthens
our qualitative �ndings about the e¤ect of payday loan access on bankruptcy: if rejected applicants
may borrow anyway, our estimates represent a lower bound on the true e¤ect of payday loan access.
We explore this issue further by estimating e¤ects by various levels of competition this lender faces
by zip code. Table VIII shows the results. As expected, estimates are larger and strongly signi�cant
for monoline shops versus multiline shops.21
The rest of this subsection discusses sources of evidence about the quantitative size of the
21Pawn loans are collateralized with personal items like jewelry, electronics, tools or guns. The loan principaltypically equals half of the item�s (secondhand) retail value. At the time the loan is made, the lender receives andstores the collateral. Items are stored at the pawnshop as long as the borrower continues to service the loan, and inthis way loans can be renewed inde�nitely. The borrower receives the item back (�redeems�the item) upon repayingthe loan. When a loans becomes 30 days past due, the collateral is removed from storage and put on sale at thepawnshop.
19

underestimate.
First, all major payday lenders use the same subprime credit-rating agency, Teletrack Inc., to
provide information on loan applicants. Each lender may, however, choose its own threshold for
approving loan applications (and may use a smoother decision rule), and we lack information about
those practices.22 If all lenders do choose exactly the same threshold, our estimated coe¢ cients will
not re�ect bias due to substitution opportunities. To the extent the �rms have comparable costs
(Flannery and Samolyk 2005) and the industry is competitive (Skiba and Tobacman 2008b), they
would adopt identical thresholds in equilibrium.
Second, we suspect the underestimate of the e¤ect of payday loan approval on bankruptcy to
be small is that this company�s loans remain attractive to rejected applicants. Of the 20% of
applicants who were �rst declined, 48% re-apply. Only 9% of re-applicants were ever approved, but
those who were approved borrowed on average $2485 and paid $415 in interest, comparing near par
with initially approved applicants, who cumulatively borrowed $2793 and paid $477 in interest.
In addition to the qualitative discussion on the underestimate of the e¤ects, we can quantita-
tively test how the e¤ect di¤ers by market share. We run regressions by the level of market share for
this lender by zip code. Using Reference USA database, we determine the number of competitors
this lender had during the sample period. Results for various speci�cations by market share and
store tenure are shown in Table VIII. We also explore the e¤ect of payday loans broken down by
whether an applicant applied before or after the credit-score formula changed in August 2002 in
Table VIII and Appendix Table 2. Figures 6 and 7 show the results of access to payday loans on
chapter 7 and chapter 13 bankruptcies in high market share locations. The e¤ect of payday loans
on bankruptcy is highest in zip codes where this lender has 100% market share.
6 Mechanisms and Interpretation
As discussed above the typical payday loan is quite small: in our dataset the mean and median
principal are approximately $300. This section investigates how such small loans might impact
cumulative �nancial outcomes like bankruptcy. First, we show that approval of a single loan appli-
cation initiates a pattern of subsequent borrowing from this lender. Second, we provide suggestive
evidence that borrowers only partially substitute toward other sources of credit, perhaps because of
22Endogeneity of the approval decision rules does not matter for our estimates. The distribution of credit scores issmooth near the credit score approval threshold.
20

costs of search. Third, we compare the interest costs from payday loans and applicants�total debt
interest burden at the time of bankruptcy �ling, and �nd that payday loan interest constitutes a
nontrivial share. Together, these �ndings suggest that payday loan approval could su¢ ce to tip
applicants, who are already �nancially stressed, into bankruptcy.
6.1 Subsequent Payday Loan Applications
The identi�cation strategy used to measure the e¤ect of payday loan access on bankruptcy can also
be used to measure e¤ects on subsequent borrowing from this lender. We observe more subsequent
loans than bankruptcies, so results are more precisely identi�ed and less sensitive to the choice of
speci�cation. Analogously to bankruptcy analysis above, our main regression speci�cation is:
(nbr pdl applications)�i = �0 + �1Approvedi + f (CreditScorei) + X0i + �M
0ti + "i;
where the RHS variables are as described above.
The sharp discontinuity we obtain from estimating this equation for subsequent payday appli-
cations and subsequent amount borrowed make the results easy to see graphically. Full results are
shown in Table VI. Estimation results are presented for � = 2y in Figures 9a and 9b. When com-
paring �rst-time payday loan applicants who are approved and rejected, �̂1 equals the number of
additional applications, within two years, caused by �rst-application approval. The OLS speci�ca-
tion using the full range of credit scores implies that �̂1 = 4:606 and is highly signi�cant. Rejected
�rst-time applicants apply again at very low rates, so the coe¢ cient mostly re�ects the subsequent
applications made by those who are approved. The reduced-form and IV estimates con�rm these
�ndings. In addition, they have nearly identical coe¢ cients and standard errors, as expected given
the strength and precision of the �rst stage. We also restrict the sample to +/-0.5 and +/-0.1
standard deviations in the credit score using the OLS speci�cation, as in the bankruptcy speci�-
cations. Similarly we restrict the sample for the IV estimates. In each case, standard errors rise
as sample sizes fall, though all coe¢ cients remain positive and signi�cant. Summary statistics on
these outcomes are found in Table VI. Panel B summarizes, by various credit-score ranges, the
subsequent payday applications and amounts borrowed for one year and two years after the �rst
payday loan application.
Because AboveThr is correlated with subsequent loan approval probabilities, the e¤ect of
21

Approved on the total dollar value of subsequent payday loans is strictly not identi�ed. In ad-
dition, in some sense the demand for credit re�ected in the number of subsequent applications is
the quantity of primary interest. However, we may still estimate the subsequent dollar amounts
of borrowing predicted by Approved. Access to payday loan credit, conditional on application,
predicts roughly $2200 of additional payday borrowing at this company within two years.
Figures 9a and 9b plot these results. Each point represents a centile in the credit score, and the
points shown are at the medians of their quantiles on the x-axis and at the means of their quantiles
on the y-axis. Overlaid are the best-�tting quartic polynomials on either side of the credit-score
threshold.
We repeat this analysis for time horizons from � = 1d to � = 3y: To summarize the estimated
coe¢ cients over this full range of time horizons, Figures 10a, 10b and 10c plot the reduced-form full
range �̂1�s. The line is above zero, implying payday loan applicants who were approved for their �rst
loan applied more subsequently than those whose �rst application was denied. Two-standard-error
bands are also shown on the graph. The reduced-form regression with range restricted to +/-0.5
standard deviations, implies that approval of �rst-time payday loan applications causes 6.11 more
payday loan applications within the next two years, signi�cant at the 1-percent level.23
6.2 Assets and Liabilities of Payday Borrowers
Together, these �ndings paint a picture of substantial high interest rate borrowing following payday
loan approval, and a substantial di¤erential in high interest rate borrowing between initially ap-
proved and initially rejected applicants. Detailed data on creditors, debts, and assets for a sample
of the 211 bankruptcy �lers closest to the credit-score threshold provide additional information,
shown in Table VII.24 Twenty-three percent of these individuals had payday loan debt at the time
they �led for bankruptcy, and 12 percent had outstanding payday loan debt at the company that
supplied our data. Average outstanding payday loan balances at all payday lenders and at our data
provider conditional on borrowing were respectively $1,323 and $567.
23We have also estimate the e¤ect of payday loan approval on pawn borrowing from the same company. In theshort-run, rejection of a �rst-time payday loan application increases the probability of taking out a pawn loan fromthis company by a factor of two, implying payday loan applicants substitute between forms of credit. However, thise¤ect dissipates quickly, and in dollar amounts it is small compared to the observed increase in subsequent paydayborrowing.24The sample consists 211 people who applied for a payday loan and subsequently �led for bankruptcy. The data
are from bankruptcy petitions of the 104 people closest to the threshold (from below) and 107 people closest to thethreshold (from above). The samples are not exactly balanced due to ties in the credit score.
22

Payday loan debt outstanding is therefore a small fraction of the $34,000 of unsecured debt
that these bankruptcy �lers had on average.25 However, cumulative interest payments on payday
and pawn loans, because of their very high interest rates and very short durations, were signi�cant.
If we assume the �lers�unsecured debt carried 15% APRs, the payday loan interest burden would
have been approximately $5670:15�$34;000 � 11% of these individuals�total annual interest burden. We
consider it plausible that this could su¢ ce to tip �nancially stressed payday loan applicants into
bankruptcy.
7 Conclusion
We �nd that payday loan applicants approved for their �rst loans �le for chapter 13 bankruptcy
signi�cantly more often than rejected �rst-time applicants. The magnitude of the e¤ect is very
large, representing an increase of between 0.3 and 3.3 percentage points in bankruptcy �ling rates.
In our preferred speci�cation the estimated e¤ect size is 2.48 percentage points. Opportunities for
rejected applicants to substitute toward credit elsewhere imply that our quantitative estimates are
lower bounds on the true e¤ects.
These results are consistent with the interpretation that payday loan applicants are �nancially
stressed; �rst-time loan approval precedes signi�cant additional high interest rate borrowing; and
the consequent interest burden tips households into bankruptcy. Though some strategic bankruptcy
�lings may occur, our �ndings suggest that households generally do not borrow on payday loans
to take advantage of an upcoming bankruptcy �ling. This paper�s results inform the contentious
policy debate which has led to 11 states banning payday lending on the presumption that they lead
to bankruptcy and lower consumers�welfare. We have uncovered substantial heterogeneity in the
e¤ect of access to credit� evidence hidden in aggregate-level analyses.
25Strategic gaming of the bankruptcy system implies debtors would accumulate as much debt as possible before�ling. This hypothesis receives no more than tentative support from our results.
23

A Identi�cation Appendix
We �rst report further tests of the exogeneity of AboveThr and demographic characteristics of
payday loan applicants. A potential source of bias in this research design is selection close to
either side of the threshold. If payday loan applicants knew both their credit score and the passing
threshold used to approve loans, we could expect applicants who knew they would be declined
not to apply, and additional mass in the distribution in credit scores just above the threshold.
The histogram of the credit score, Figure 1, showed that while there are some credit scores that
are common because of the discrete nature of the scoring process, there is not bunching near the
threshold which would suggest selection bias.
Table A1 reports the values of the control variables on either side of the credit-score threshold.
Each pair of columns reports average values of the control variables below and above the credit-
score threshold, for shrinking credit score ranges around the threshold. Di¤erences between the
columns generally shrink and become less signi�cant going from left to right across the table. It
is not surprising that some signi�cant di¤erences remain, since the credit score is correlated with
many of the control variables.
We also performed two sets of �rst stage placebo regressions. In both types, we regressed
Approved on the usual pair of quartics in CreditScore, the usualX�s, and the usual month dummies.
In the �rst set of placebo regressions, we included modi�ed versions of AboveThr; one by one,
for every value of the credit score. The coe¢ cient on the pseudo-AboveThr, and its statistical
signi�cance, was maximized when it was equivalent to the true AboveThr. The true version of
AboveThr was included in every element of the the second set of placebo regressions, but in that
set we again included, one by one, pseudo-AboveThr�s de�ned for every possible value of the
credit score. In this case, the coe¢ cient on the true AboveThr was always larger and more highly
signi�cant than the coe¢ cient on the pseudo-AboveThr:
24

References
Adams, William, Liran Einav, and Jonathan Levin, �Liquidity Constraints and Their
Causes: Evidence from Subprime Lending,�November 2006. Working Paper.
Angrist, Joshua D. and Victor Lavy, �Using Maimonides�Rule to Estimate the E¤ect of Class
Size on Scholastic Achievement,�Quarterly Journal of Economics, May 1999, 114, 533�575.
Ausubel, Lawrence, �Adverse Selection in the Credit Card Market,�1999. University of Mary-
land mimeo.
Campbell, Asis Martinez-Jerez Dennis and Peter Tufano, �Bouncing Out of the Banking
System: An Empirical Analysis of Involuntary Bank Account Closures,�June 2008. Working
Paper.
Caskey, John P., �Pawnbroking in America: The Economics of a Forgotten Credit Market,�
Journal of Money, Credit, and Banking, February 1991, 23 (1), 85�99.
, Fringe Banking: Check-Cashing Outlets, Pawnshops, and the Poor, New York: Russell Sage
Foundation, 1994.
, �Payday Lending,�Association for Financial Counseling and Planning Education, 2001, 12
(2).
, �Fringe Banking and the Rise of Payday Lending,� in Patrick and Howard Rosenthal, eds.,
Credit Markets for the Poor, Russell Sage Foundation, 2005.
DiNardo, John and David S. Lee, �Economic Impacts of New Unionization on Private Sector
Employers: 1984-2001,�Quarterly Journal of Economics, 2004, 119, 1383�1442.
Domowitz, Ian and Robert L. Sartain, �Determinants of the Consumer Bankruptcy Decision,�
The Journal of Finance, February 1999, 54 (1), 403�420.
Elliehausen, Gregory and Edward C. Lawrence, Payday Advance Credit in America: An
Analysis of Customer Demand, Credit Research Center, Georgetown University, 2001.
Fan, Jianqing and Irene Gijbels, Local Polynomial Modelling and Its Applications, London:
Chapman and Hall/CRC, 1996.
25

FDIC, �Payday Lending Programs: Revised Examination Guidance,�2005, FIL-14-2005. Finan-
cial Institution Letter.
Flannery, Mark and Katherine Samolyk, �Payday Lending: Do the Costs Justify the Price?,�
Federal Reserve Bank of Chicago Proceedings, April 2005.
Gross, David and Nicholas Souleles, �Do Liquidity Constraints and Interest Rates Matter
for Consumer Behavior? Evidence from Credit Card Data,�Quarterly Journal of Economics,
February 2002, 117 (1), 149�185.
Hahn, Jinyong, Petra Todd, and Wilbert Van der Klaauw, �Identi�cation and Estimation
of Treatment E¤ects with a Regression-Discontinuity Design,� Econometrica, 2001, 69 (1),
201�209.
Himmelstein, David, Elizabeth Warren, Debbie Thorne, and Ste¢ e Woolhandler, �Ill-
ness and Injury as Contributors to Bankruptcy,�Health A¤airs, 2 February 2005, 10, W5�63�
73.
Hortacsu, Ali and Chad Syverson, �Product Di¤erentiation, Search Costs, and Competition
in the Mutual Fund Industry: A Case Study of the SP500 Index Funds,�Quarterly Journal
of Economics, May 2004, 119 (2), 403�456.
Imbens, Guido and Joshua Angrist, �Identi�cation of Local Average Treatment E¤ects,�
Econometrica, 1994, 62, 467�475.
and Thomas Lemieux, �Regression Discontinuity Designs: A Guide to Practice,�Working
Paper 13039, National Bureau of Economic Research April 2007.
Karlan, Dean and Jonathan Zinman, �Elasticities of Demand for Consumer Credit,�
Working Papers 926, Economic Growth Center, Yale University Oct 2005. Available at
http://ideas.repec.org/p/egc/wpaper/926.html.
and , �Expanding Credit Access: Using Randomized Supply Decisions to Estimate the
Impacts,�Review of Financial Studies, forthcoming.
and , �Observing Unobservables: Identifying Information Asymmetries with a Consumer
Credit Field Experiment,�Econometrica, forthcoming.
26

Lee, David S., �Randomized Experiments from Non-Random Selection in U.S. House Elections,�
Journal of Econometrics, 2008, 142 (2), 675�697.
and David Card, �Regression Discontinuity Inference with Speci�cation Error,�Journal of
Econometrics, 2008, 142, 655�674.
and Justin McCrary, �Crime, Punishment, and Myopia,� 2005. NBER Working Paper
No. 11491.
, Enrico Moretti, and Matthew J. Butler, �Do Voters A¤ect or Elect Policies? Evidence
from the U.S. House,�The Quarterly Journal of Economics, 2004, 119, 807�859.
Lefgren, Lars and Frank McIntyre, �Explaining the Puzzles of Cross-State Di¤erences in
Bankruptcy Rates,�2008.
Lehnert, Andreas and Dean M. Maki, �Consumption, Debt and Portfolio Choice: Test-
ing the E¤ect of Bankruptcy Law,� Finance and Economics Discussion Series 2002-
14, Board of Governors of the Federal Reserve System (U.S.) 2002. Available at
http://ideas.repec.org/p/�p/fedgfe/2002-14.html.
Mann, Ronald J. and Katherine Porter, �Saving up for Bankruptcy,�Georgetown Law Jour-
nal, forthcoming 2009.
Mauriello, Tracie, �State House, Senate Di¤er on Reining in Payday Loans,�Pittsburgh Post-
Gazette, 2005, December 6.
McCrary, Justin, �Manipulation of the Running Variable in the Regression Discontinuity Design:
A Density Test,�Journal of Econometrics, 2008, 142.
Melzer, Brian T., �The Real Costs of Credit Access: Evidence from the Payday Lending Market,�
January 2009.
Morse, Adair, �Payday Lenders: Heroes or Villains?,�2009. University of Michigan mimeo.
Porter, Jack, �Estimation in the Regression Discontinuity Model,�Manuscript, 2003.
PricewaterhouseCoopers, �The Payday Advance Industry: 1999 Company Survey Findings,�
October 2001. Prepared for Community Financial Services Association of America and Finan-
cial Service Centers of America, Inc.
27

Robinson, Jerry and John Wheeler, �Update on the Payday Loan Industry: Observations on
Recent Industry Developments,�Technical Report, Stephens, Inc. September 2003.
Skiba, Paige Marta and Jeremy Tobacman, �Payday Loans, Uncertainty, and Discounting:
Explaining Patterns of Borrowing, Repayment and Default,�2008. University of Pennsylvania
mimeo.
and , �The Pro�tability of Payday Lending,�2008. University of Pennsylvania mimeo.
Stegman, Michael A. and Robert Faris, �Payday Lending: A Business Model That Encourages
Chronic Borrowing,�Economic Development Quarterly, February 2003, 17 (1), 8�32.
Thistlethwaite, D. and Donald Campbell, �Regression-Discontinuity Analysis: An Alternative
to the Ex Post Facto Experiment,�Journal of Educational Psychology, 1960, 51, 309�317.
Washington, Ebonya, �The Impact of Banking and Fringe Banking Regulation on the Number
of Unbanked Americans,�Journal of Human Resources, Winter 2006, 41 (1), 106�137.
White, Michelle, �Why Don�t More Households File for Bankruptcy?,� Journal of Law, Eco-
nomics, and Organization, 1998, 14, 205�231.
White, Michelle J., �Bankruptcy Reform and Credit Cards,�Journal of Economic Perspectives,
2007, 21 (4), 175�199.
, �Bankruptcy: Past Puzzles, Recent Reforms, and the Mortgage Crisis,�American Law and
Economics Review, 2009, 11 (1), 1�23.
and Ning Zhu, �Saving your Home in Chapter 13 Bankruptcy,�2009.
Zinman, Jonathan, �Restricting Consumer Credit Access: Household Survey Evidence on E¤ects
Around the Oregon Rate Cap,�forthcoming.
and Scott Carrell, �In Harm�s Way? Payday Loan Access and Military Personnel Perfor-
mance,�August 2008.
28
0.2
.4.6
.81
Frac
tion
of A
pplic
atio
ns A
ppro
ved
4 2 0 2 4Credit Score
Actual Approval Rate Predicted Approval Rate
Figure 2: The Credit-Score Regression Discontinuity
02
46
8D
ensi
ty
−4 −2 0 2 4Credit Score
Figure 1: Distribution of Credit Scores
Source and notes: Authors’ calculations based on data from a national payday lending company. Figure 1 plots the distribution of CreditScore or first-time payday loan applicants. CreditScore is equal to the raw credit score provided by Teletrack minus the threshold for loan approval chosen by the lender, divided by the standard deviation of scores among this lender’s first-time applicants. We normalize by different standard deviations for applications before and after an August 2002 change in the scoring formula. The dashed line marks the threshold for loan approval; about 80% of first-time applications are approved. Figure 2 plots the probability of approval for first-time payday loan applicants as a function of CreditScore. Each point represents one of 100 quantiles in the credit score. Points shown are at the medians of their quantiles on the x-axis and at the means of their quantiles on the y-axis. The predicted approval-rate function plots the best-fitting quartic polynomials on both sides of the credit score threshold.
29

Figure 3: One Year Bankruptcy Probabilities
01
23
4B
ankr
uptc
y P
roba
bilit
y (p
erce
nt)
−.5 0 .5Credit Score
Actual Bankruptcy Rate Predicted Bankruptcy Rate
0.5
11.5
2B
ankr
uptc
y P
roba
bilit
y (p
erce
nt)
−.5 0 .5Credit Score
Actual Bankruptcy Rate Predicted Bankruptcy Rate
Figure 3a: Chapter 7 bankruptcies adjusted for demographics
Figures 3a and 3b plot the effect of payday loan access on Chapter 7 and Chapter 13 bankruptcy petitions within the 12 months after applicants’ payday loan application. Each point represents one of 100 bins. Points shown are at the medians of their bins on the x-axis and at the means of their bins on the y-axis. The predicted bankruptcy-rate function plots the best-fitting quartic polynomials on both sides of the credit-score threshold adjusted for demographics, which include dummies for pay frequency, direct deposit, homeownership, race, paycheck garnishment, and dummies for missing values of these; log monthly pay, log checking account balance, job tenure, age, sex, months at current residence, and number of non-sufficient funds on checking statement. The polynomials are restricted to 0.5 standard deviations above and below the passing credit score. Source: Authors' calculations based on data from a national payday lending company and the Texas Bankruptcy Courts' PACER Database.
Figure 3b: Chapter 13 bankruptcies adjusted for demographics
30

0.5
11.
52
Ban
krup
tcy
Pro
babi
lity
(per
cent
)
−.5 0 .5Credit Score
02
46
Ban
krup
tcy
Pro
babi
lity
(per
cent
)
−.5 0 .5Credit Score
Actual Bankruptcy Rate Predicted Bankruptcy Rate
Figure 4: Two-Year Bankruptcy Probabilities
Figure 4a: Chapter 7 bankruptcies adjusted for demographics
Figure 4b: Chapter 13 bankruptcies adjusted for demographics
Actual Bankruptcy Rate Predicted Bankruptcy Rate
Figures 4a and 4b plot the effect of payday loan access on Chapter 7 and Chapter 13 bankruptcy petitions within the 24 months after applicants ’ payday loan application. Each point represents one of 100 bins. Points shown are at the medians of their bins on the x-axis and at the means of their bins on the y-axis. The predicted bankruptcy-rate function plots the best-fitting quartic polynomials on both sides of the credit-score threshold adjusted for demographics. The polynomials are restricted to 0.5 standard deviations above and below the passing credit score. Source: Authors' calculations based on data from a national payday lending company and the Texas Bankruptcy Courts' PACER Database.
31

Figure 5: Effect of Payday Loans on Bankruptcy as a Function of Bandwidth
−6−4
−20
2
0 .5 1 1.5 2Bandwidth (standard deviations around the threshold)
−15
−10
−50
5C
oeffi
cien
t Est
imat
es (
Per
cent
age
Pts
)
0 .5 1 1.5 2
Figure 5a: Chapter 7 Bankruptcy within 2 years
Figures 5a and 5b plot the reduced-form coefficient estimates from the main regressions as a function of the window around the threshold in standard deviations. The line with open circles plots the point estimates for each regression varying the bandwidth around the credit-score threshold up to 2 standard deviations. The solid lines represent +/- two-standard errors of the estimates.
Coe
ffici
ent E
stim
ates
(P
erce
ntag
e P
ts)
Bandwidth (standard deviations around the threshold)
Figure 5b: Chapter 13 Bankruptcy within 2 years
32
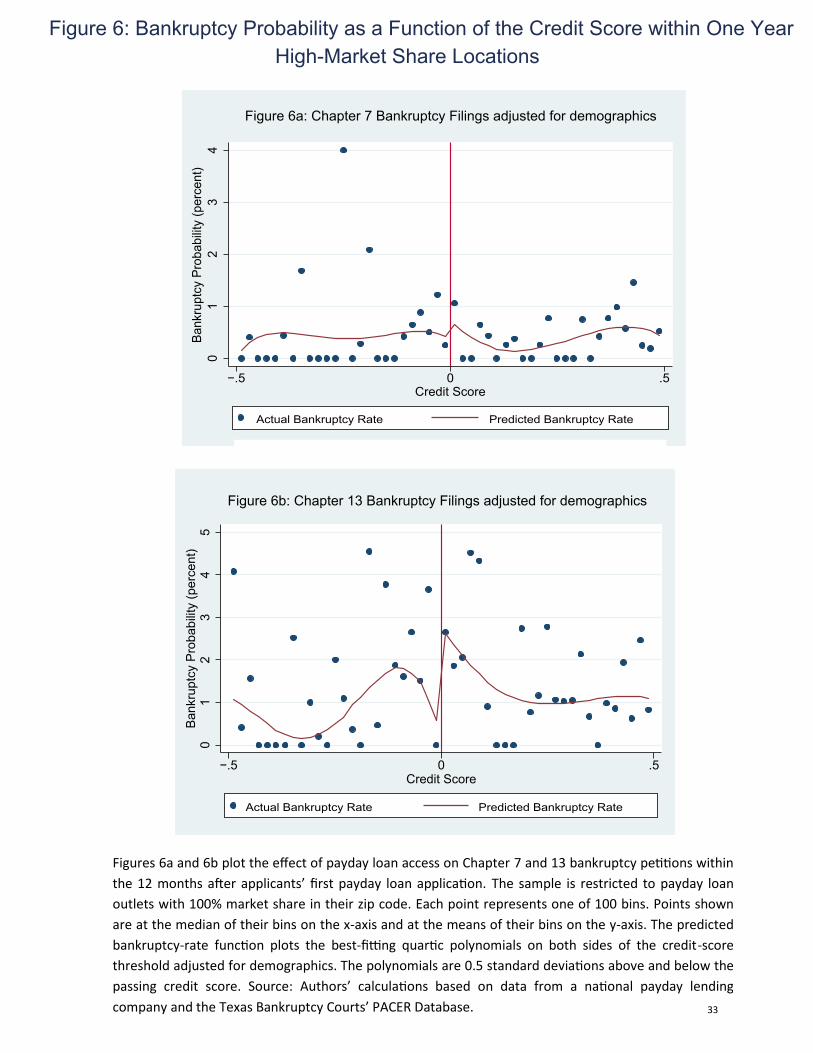
01
23
45
Ban
krup
tcy
Pro
babi
lity
(per
cent
)
−.5 0 .5Credit Score
Figure 6b: Chapter 13 Bankruptcy Filings adjusted for demographics
Figure 6: Bankruptcy Probability as a Function of the Credit Score within One YearHigh-Market Share Locations
Actual Bankruptcy Rate Predicted Bankruptcy Rate
01
23
4Ba
nkru
ptcy
Pro
babi
lity
(per
cent
)
−.5 0 .5Credit Score
Figure 6a: Chapter 7 Bankruptcy Filings adjusted for demographics
Actual Bankruptcy Rate Predicted Bankruptcy Rate
Figures 6a and 6b plot the effect of payday loan access on Chapter 7 and 13 bankruptcy petitions within the 12 months after applicants’ first payday loan application. The sample is restricted to payday loan outlets with 100% market share in their zip code. Each point represents one of 100 bins. Points shown are at the median of their bins on the x-axis and at the means of their bins on the y-axis. The predicted bankruptcy-rate function plots the best-fitting quartic polynomials on both sides of the credit-score threshold adjusted for demographics. The polynomials are 0.5 standard deviations above and below the passing credit score. Source: Authors’ calculations based on data from a national payday lending company and the Texas Bankruptcy Courts’ PACER Database. 33
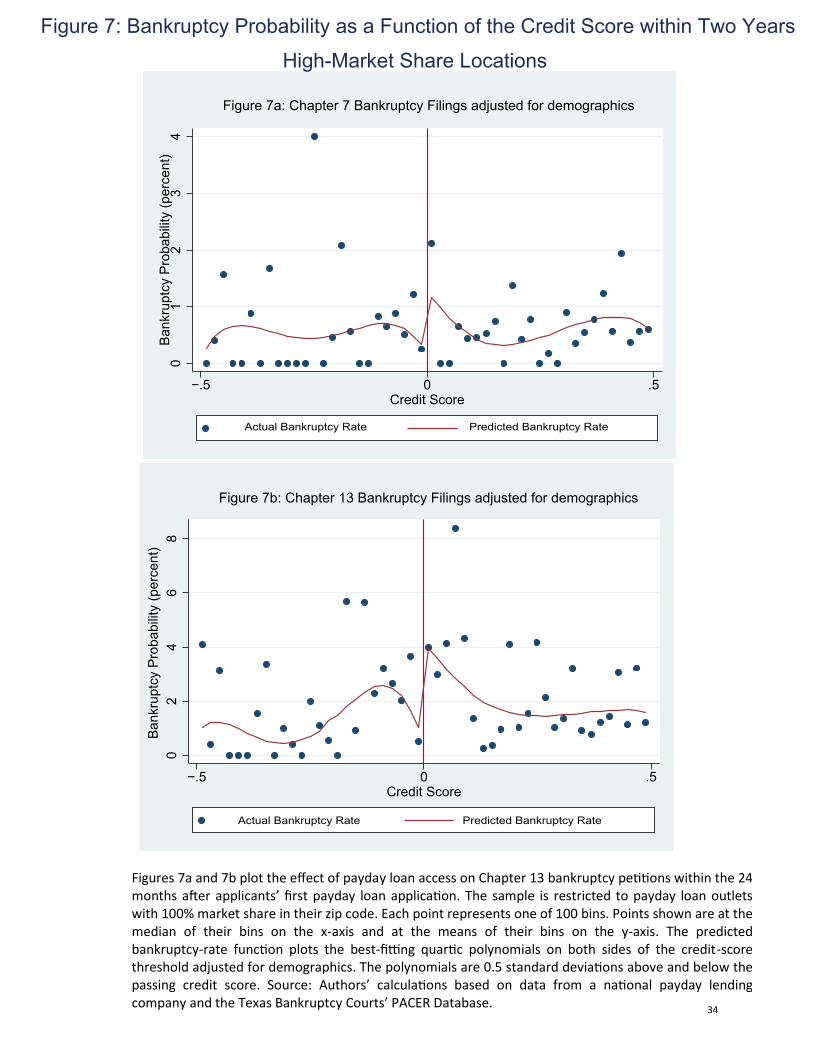
Chapter 13 Bankruptcy Filings adjusted for demographics
Figure 7: Bankruptcy Probability as a Function of the Credit Score within Two Years
High-Market Share Locations
02
46
8B
ankr
uptc
y P
roba
bilit
y (p
erce
nt)
−.5 0 .5Credit Score
Actual Bankruptcy Rate Predicted Bankruptcy Rate
Figure 7b: Chapter 13 Bankruptcy Filings adjusted for demographics
01
23
4B
ankr
uptc
y P
roba
bilit
y (p
erce
nt)
−.5 0 .5Credit Score
Figure 7a: Chapter 7 Bankruptcy Filings adjusted for demographics
Actual Bankruptcy Rate Predicted Bankruptcy Rate
Figures 7a and 7b plot the effect of payday loan access on Chapter 13 bankruptcy petitions within the 24 months after applicants’ first payday loan application. The sample is restricted to payday loan outlets with 100% market share in their zip code. Each point represents one of 100 bins. Points shown are at the median of their bins on the x-axis and at the means of their bins on the y-axis. The predicted bankruptcy-rate function plots the best-fitting quartic polynomials on both sides of the credit-score threshold adjusted for demographics. The polynomials are 0.5 standard deviations above and below the passing credit score. Source: Authors’ calculations based on data from a national payday lending company and the Texas Bankruptcy Courts’ PACER Database.
High-Market Share Locations
34

42
02
46
Perc
enta
ge
Poin
ts
0 1 2 3Time in Years since from First PDL Application
Estimated coefficient Coefficient + 2 s.e.
Coefficient - 2 s.e.
Fig 8a: Effect of Payday Loan Access Over Time: All Bankruptcies
32
10
12
Perc
enta
ge
Poin
ts
0 1 2 3Time in Years since from First PDL Application
Estimated coefficient Coefficient + 2 s.e.
Coefficient - 2 s.e.
Fig 8b: Effect of Payday Loan Access Over Time: Ch7 Bankruptcies
20
24
6
Perc
enta
ge
Poin
ts
0 1 2 3Time in Years since from First PDL Application
Estimated coefficient Coefficient + 2 s.e.
Coefficient - 2 s.e.
Fig 8c: Effect of Payday Loan Access Over Time: Ch13 Bankruptcies
Figures 8a, 8b, 8c. Source: Authors' calculations based on data from a national payday lending company and the electronic records from Texas Bankruptcy Courts via PACER. The middle line represents the reduced-form estimated effect of First Application Approved. The other lines are two-standard-error bands. Regressions producing these estimates include quartic polynomials on both sides of the credit-score threshold, demographic controls, and dummies for month of first application. Figures 8a, 8b, and 8c plot bankruptcy petitions for all Chapters, Chapter 7 and Chapter 13, respectively. 35

010
0020
0030
0040
0050
00D
olla
rs b
orro
wed
with
in 2
yea
rs
−4 −2 0 2 4Credit Score
Actual Application Rate Predicted Application Rate
05
1015
20N
umbe
r pay
day
loan
s w
ithin
2 y
ears
−4 −2 0 2 4Credit Score
Actual Application Rate Predicted Application Rate
Number of payday loans within 2 yearsFigure 9a: Subsequent Payday Loan Applications
Figure 9b: Dollar Amount of Subsequent Payday Loans
Figures 9a and 9b. Source: Authors' calcula ons based on data from a na onal payday lending company. Each point represents one of 100 quan les. Points shown are the medians of their quan les on the x axis and at the mean of their quan les on the y-axis. The predicted line plots the best-fi ng quar c polynomials on both sides of the credit-score threshold. All data are from Texas, 9/2000-8/2004. Figure 8a plots the effect of payday loan access on the number of subsequent payday loan applica ons made. Figure 8b plots the dollar amount subsequently borrowed.
$ borrowed within 2 years
36

02
46
Nu
mb
er o
f Su
bse
qu
ent
Payd
ay L
oan
Ap
plic
atio
ns
0 .5 1 1.5 2Years Since First PDL Application
Estimated coefficient Coefficient + 2 s.e.
Coefficient - 2 s.e.
Number of Subsequent Payday Loan Applications
Figure 10a: Effect of Payday Loan Access Over Time
050
010
0015
0020
00
Am
t ($
) Su
bse
qu
entl
y B
orr
ow
ed
0 .5 1 1.5 2Years Since First PDL Application
Estimated coefficient Coefficient + 2 s.e.
Coefficient - 2 s.e.
Amt ($) Subsequently Borrowed
Figure 10b: Effect of Payday Loan Access Over Time
5010
015
020
025
030
0
Fin
ance
Ch
arg
es ($
) Pai
d S
ub
seq
uen
tly
0 .5 1 1.5 2Years Since First PDL Application
Estimated coefficient Coefficient + 2 s.e.
Coefficient - 2 s.e.
Finance Charges ($) Paid Subsequently
Figure 10c: Effect of Payday Loan Access Over Time
Figures 10a, 10b, 10c. The middle line represents the reduced-form estimated effect of First Application Approved on subsequent behavior in the payday loan market. The other lines are two-standard-error bands. Regressions producing these estimates include quartic polynomials on both sides of the credit-score threshold, demographic controls, and dummies for month of first application. Figures 11a, 11b and 11c plot the number of subsequent application made at this company, the dollar amount borrowed, and the finance charges paid to this company, respectively.
37

Variable Mean Median SD N
Demographic Characteristics:
Age 36.46 35 11.25 145,154Black (%) 48.70 0.49 27,923
Hispanic (%) 29.41 0.48 27,923Female (%) 61.84 0.49 27,922
Monthly Pay ($) 1699 1545 1047 93,997Years at Current Job 4.28 2 7.23 94,384
Paid Weekly (%) 13.45 34.10 94,384Paid Biweekly (%) 50.81 49.99 94,384
Paid Semimonthly (%) 19.08 39.29 94,384Paid Monthly (%) 16.67 37.27 94,384
Wages Garnished (%) 2.88 16.73 67908Direct Deposit (%) 72.67 46.17 94,384
Checking Account Balance ($) 235 66 552 142,407NSF's on Bank Statement 1.09 3.00 145,159
Owns Home (%) 33.84 47.30 67,908Months at Current Residence 67 36 91 145,157
Month of Application 12/2002 1/2003 One year 145,159Loan and Application Characteristics:
Approved (First Application) 0.80 145,159
Approved (All Applications) 0.89 1,097,330
Loan Size ($) 301 289 140 1,097,330
$ Loans Per Person 2279 978 3494 145,159
PAYDAY LOANS
Authors' calculations based on data from a payday lending company. Included are all available demographics for the universe of payday-loan applicants in Texas between 9/2000 and 8/2004. Quantities are
calculated from each individual's first application. These variables, with the exception of Month of First Application, represent the full set of "demographic controls" included in most regression specifications
reported in this paper. Whenever we include these controls, we also include dummies for missing values of each of them. Dummies for each value of Month of First Application are often included as well, and
indicated separately. "NSF's" are "Not Sufficient Funds" events like bounced checks.
TABLE I
38
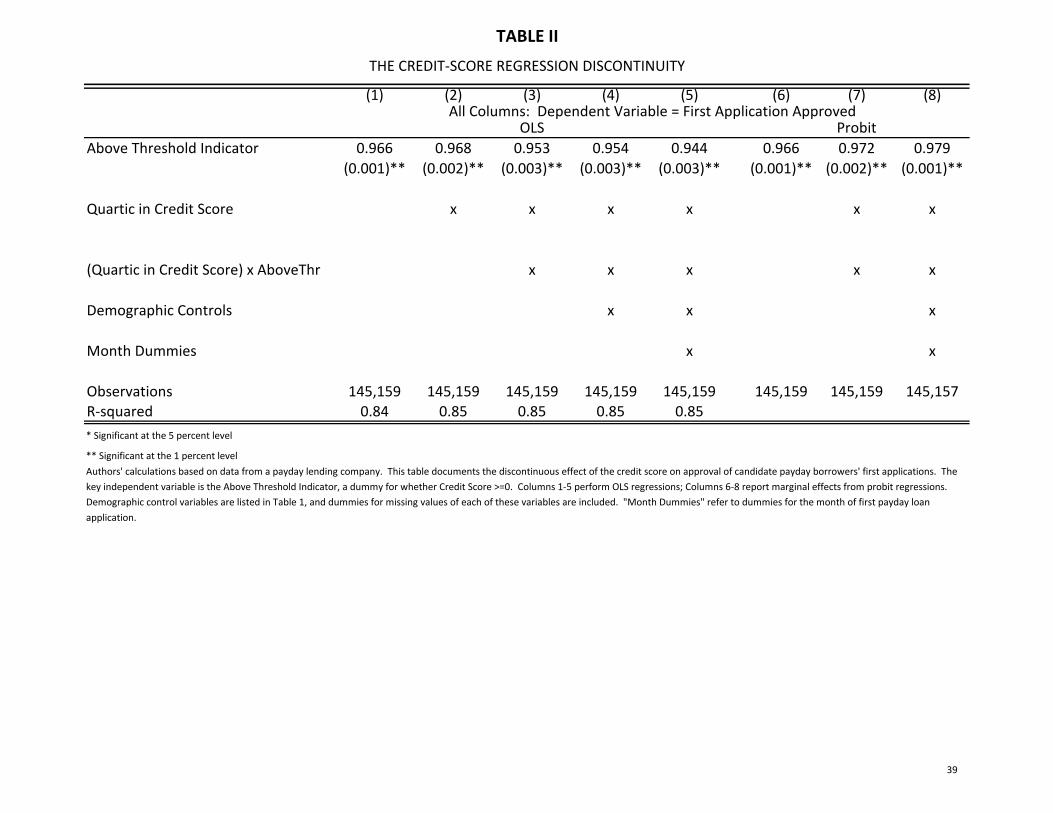
(1) (2) (3) (4) (5) (6) (7) (8)
Above Threshold Indicator 0.966 0.968 0.953 0.954 0.944 0.966 0.972 0.979
(0.001)** (0.002)** (0.003)** (0.003)** (0.003)** (0.001)** (0.002)** (0.001)**
Quartic in Credit Score x x x x x x
(Quartic in Credit Score) x AboveThr x x x x x
Demographic Controls x x x
Month Dummies x x
Observations 145,159 145,159 145,159 145,159 145,159 145,159 145,159 145,157R-squared 0.84 0.85 0.85 0.85 0.85
* Significant at the 5 percent level
** Significant at the 1 percent level
TABLE II
THE CREDIT-SCORE REGRESSION DISCONTINUITY
All Columns: Dependent Variable = First Application ApprovedOLS Probit
Authors' calculations based on data from a payday lending company. This table documents the discontinuous effect of the credit score on approval of candidate payday borrowers' first applications. The
key independent variable is the Above Threshold Indicator, a dummy for whether Credit Score >=0. Columns 1-5 perform OLS regressions; Columns 6-8 report marginal effects from probit regressions.
Demographic control variables are listed in Table 1, and dummies for missing values of each of these variables are included. "Month Dummies" refer to dummies for the month of first payday loan
application.
39

Number of
Bankruptcies
Annual Personal
Bankruptcy Rate, TX
(Individuals)
Bankruptcy filers who
ever apply or applied
for PDL
Bankruptcy petitions per
payday applicant per
year
Chapter 7 382,654 0.23% 2,705 0.007
Chapter 13 258,867 0.15% 5,626 0.016
All 641,521 0.38% 8,331 0.023
Below Threshold Above Threshold Below Threshold Above Threshold Below Threshold Above Threshold
Number of Payday Applicants 25,305 119,854 18,060 84,490 2,957 3,430
Payday Applicants' Bankruptcy Filing Rates (%)
Within 1 Year after First Application (%)
Ch 7 (%) 0.30 0.49 0.35 0.42 0.41 0.26
Ch 13 (%) 1.02 1.32 0.97 1.13 1.12 2.19
All Bankruptcies (%) 1.32 1.81 1.32 1.55 1.52 2.45
Within 2 Years after First Application (%)
Ch 7 (%) 0.40 0.79 0.47 0.66 0.51 0.50
Ch 13 (%) 1.48 2.09 1.45 1.77 1.76 3.18
All Bankruptcies (%) 1.88 2.88 1.91 2.42 2.27 3.67
TABLE III
Panel A uses bankruptcy data from Public Access to Court Electronic Records (PACER) and American Bankruptcy Institute (http://www.abiworld.org/), Texas population data are from the US Census Bureau,
(http://www.census.gov/popest/states/tables/NST-EST2005-01.xls), and the matched sample consists of bankruptcy filers that have the same first name, last name, zip code and final four SSN digits as individuals who applied for loans from a national
payday lender. According to the data from the US Census Bureau, the population of Texas in 2002 was 21,722,394. Panel B uses bankruptcy data from PACER.
BANKRUPTCY SUMMARY STATISTICS
Panel A: Texas Bankruptcy Data
Panel B: Outcome Data Around the Credit Score Approval Threshold
All Credit Scores Within 1 s.d. of Approval Threshold Within 0.1 s.d. of Approval Threshold
40

(1) (2) (3) (4) (5) (6) (7) (8) (9)
OLS OLS OLS Reduced Form Reduced Form Reduced Form IV IV IV
full range range = 0.5sd range = 0.1sd full range range = 0.5sd range = 0.1sd full range range = 0.5sd range = 0.1sd
Chapter 7, One Year -0.041 -0.003 0.053 -0.054 0.169 0.523 -0.056 0.175 0.547
(0.085) (0.170) (0.519) (0.120) (0.294) (1.821) (0.124) (0.304) (1.905)
Chapter 7, Two Years 0.021 0.134 -0.214 -0.098 0.445 2.507 -0.101 0.460 2.622
(0.106) (0.204) (0.641) (0.150) (0.351) (2.245) (0.155) (0.363) (2.353)
Chapter 13, One Year 0.328* 0.785 ** 0.751 0.213 1.797** 1.994 0.220 1.860** 2.086
(0.142) (0.288) (1.173) (0.200) (0.495) (4.111) (0.208) (0.513) (4.301)
Chapter 13, Two Years 0.319* 0.931** -0.376 0.341 2.377** 2.884 0.353 2.460** 3.017
(0.179) (0.356) (1.472) (0.254) (0.614) (5.160) (0.263) (0.635) (5.400)
All Bankruptcies, One Year 0.287* 0.782* 0.804 0.159 1.966** 2.517 0.164 2.035** 2.633
(0.164) (0.334) (1.278) (0.233) (0.574) (4.480) (0.241) (0.595) (4.688)
All Bankruptcies, Two Years 0.340 1.065** -0.590 0.244 2.822** 5.391 0.252 2.920** 5.639
(0.208) (0.411) (1.606) (0.294) (0.708) (5.628) (0.304) (0.732) (5.895)
Number of observations 145,159 47,434 6,387 145,159 47,434 6,387 145,159 47,434 6,387* Significant at the 5 percent level
** Significant at the 1 percent level
TABLE IV
EFFECTS OF PAYDAY LOAN APPROVAL ON BANKRUPTCY FILINGS
Regression coefficients are the estimated treatment effects, in percentage points, of first payday loan approval ("CreditScore ") on bankruptcy filings, and their standard
errors. These effects are computed from regressions that include a quartic in the credit score, a quartic in the credit score interacted with the abovethr dummy,
demographic controls and a full set of dummies for month of loan application. Demographic control variables are listed in Table 1, and dummies for missing values of each
of these variables are included. "Range" refers to the number of standard deviations around the credit-score threshold to which the sample is restricted. Reduced form
regressions report the coefficient on the "above threshold" indicator. The IV regressions instrument for CreditScore with an indicator for whether the credit score exceeds
the approval threshold ("AboveThr").
41
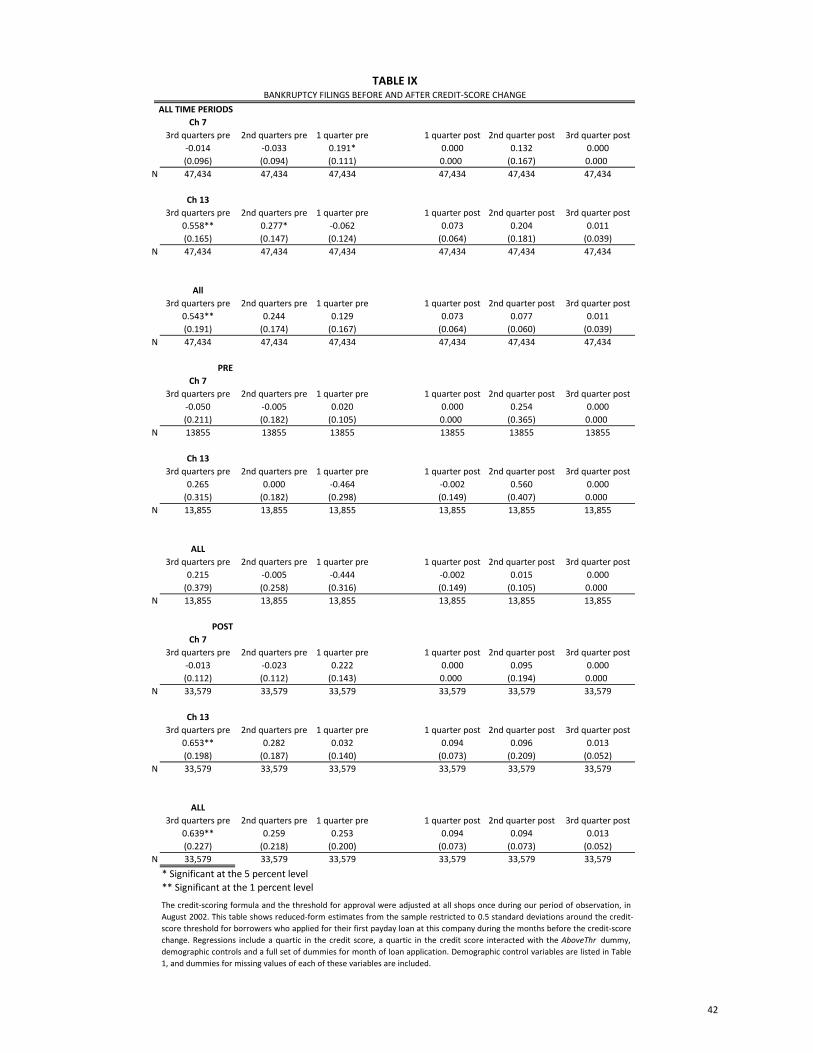
ALL TIME PERIODS
Ch 7
3rd quarters pre 2nd quarters pre 1 quarter pre 1 quarter post 2nd quarter post 3rd quarter post
-0.014 -0.033 0.191* 0.000 0.132 0.000
(0.096) (0.094) (0.111) 0.000 (0.167) 0.000
N 47,434 47,434 47,434 47,434 47,434 47,434
Ch 13
3rd quarters pre 2nd quarters pre 1 quarter pre 1 quarter post 2nd quarter post 3rd quarter post
0.558** 0.277* -0.062 0.073 0.204 0.011
(0.165) (0.147) (0.124) (0.064) (0.181) (0.039)
N 47,434 47,434 47,434 47,434 47,434 47,434
All
3rd quarters pre 2nd quarters pre 1 quarter pre 1 quarter post 2nd quarter post 3rd quarter post
0.543** 0.244 0.129 0.073 0.077 0.011
(0.191) (0.174) (0.167) (0.064) (0.060) (0.039)
N 47,434 47,434 47,434 47,434 47,434 47,434
PRE
Ch 7
3rd quarters pre 2nd quarters pre 1 quarter pre 1 quarter post 2nd quarter post 3rd quarter post
-0.050 -0.005 0.020 0.000 0.254 0.000
(0.211) (0.182) (0.105) 0.000 (0.365) 0.000
N 13855 13855 13855 13855 13855 13855
Ch 13
3rd quarters pre 2nd quarters pre 1 quarter pre 1 quarter post 2nd quarter post 3rd quarter post
0.265 0.000 -0.464 -0.002 0.560 0.000
(0.315) (0.182) (0.298) (0.149) (0.407) 0.000
N 13,855 13,855 13,855 13,855 13,855 13,855
ALL
3rd quarters pre 2nd quarters pre 1 quarter pre 1 quarter post 2nd quarter post 3rd quarter post
0.215 -0.005 -0.444 -0.002 0.015 0.000
(0.379) (0.258) (0.316) (0.149) (0.105) 0.000
N 13,855 13,855 13,855 13,855 13,855 13,855
POST
Ch 7
3rd quarters pre 2nd quarters pre 1 quarter pre 1 quarter post 2nd quarter post 3rd quarter post
-0.013 -0.023 0.222 0.000 0.095 0.000
(0.112) (0.112) (0.143) 0.000 (0.194) 0.000
N 33,579 33,579 33,579 33,579 33,579 33,579
Ch 13
3rd quarters pre 2nd quarters pre 1 quarter pre 1 quarter post 2nd quarter post 3rd quarter post
0.653** 0.282 0.032 0.094 0.096 0.013
(0.198) (0.187) (0.140) (0.073) (0.209) (0.052)
N 33,579 33,579 33,579 33,579 33,579 33,579
ALL
3rd quarters pre 2nd quarters pre 1 quarter pre 1 quarter post 2nd quarter post 3rd quarter post
0.639** 0.259 0.253 0.094 0.094 0.013
(0.227) (0.218) (0.200) (0.073) (0.073) (0.052)
N 33,579 33,579 33,579 33,579 33,579 33,579
* Significant at the 5 percent level
** Significant at the 1 percent level
BANKRUPTCY FILINGS BEFORE AND AFTER CREDIT-SCORE CHANGE
TABLE IX
The credit-scoring formula and the threshold for approval were adjusted at all shops once during our period of observation, in
August 2002. This table shows reduced-form estimates from the sample restricted to 0.5 standard deviations around the credit-
score threshold for borrowers who applied for their first payday loan at this company during the months before the credit-score
change. Regressions include a quartic in the credit score, a quartic in the credit score interacted with the AboveThr dummy,
demographic controls and a full set of dummies for month of loan application. Demographic control variables are listed in Table
1, and dummies for missing values of each of these variables are included.
42

(1) (2) (3) (4) (5) (6) (7) (8)All Male Female Black White Hispanic Homeowners Renters
Chapter 7, One Year 0.169 -0.257 0.331 0.187 0.286 -0.351 -1.741 -0.402
(0.294) (0.822) (0.696) (0.454) (2.068) (1.208) (1.799) (0.631)
Chapter 7, Two Years 0.445 -0.185 -0.145 -0.681 0.739 0.120 -1.644 -1.023(0.351) (1.122) (0.982) (0.787) (2.307) (1.772) (2.155) (0.750)
Chapter 13, One Year 1.797** 1.265 0.133 1.580 -1.040 -1.702 0.460 0.080
(0.495) (2.174) (1.252) (1.503) (3.318) (1.917) (3.881) (0.821)
Chapter 13, Two Years 2.377** -0.174 1.011 2.260 -6.579 -0.317 4.162 0.029(0.614) (2.809) (1.561) (1.903) (4.154) (2.505) (4.976) (1.055)
All Bankruptcies, One Year 1.966** 1.008 0.464 1.768 -0.754 -2.053 -1.282 -0.322
(0.574) (2.318) (1.429) (1.567) (3.898) (2.261) (4.250) (1.044)
All Bankruptcies, Two Years 2.822** -0.358 0.866 1.579 -5.840 -0.197 2.518 -0.994(0.708) (3.014) (1.859) (2.074) (4.736) (3.048) (5.373) (1.316)
Number of observations 47,434 3,347 5,458 4,629 1,663 2,442 2,960 13,823
* Significant at the 5 percent level
** Significant at the 1 percent level
TABLE V
EFFECTS OF PAYDAY LOAN APPROVAL ON BANKRUPTCY FILINGS BY SUBCATEGORIES
Estimates shown are reduced-form estimates from the sample restricted to 0.5 standard deviations around the credit-score threshold. Cells report regression coefficients that are the estimated treatment effects,
in percentage points, of first payday loan approval on bankruptcy filings, and their standard errors. These effects are computed from regressions that include a quartic in the credit score, a quartic in the credit
score interacted with the AboveThr dummy, demographic controls and a full set of dummies for month of loan application. Demographic control variables are listed in Table 1, and dummies for missing values of
each of these variables are included. Column (1) repeats the benchmark results from Table 4. Monoline shops offer payday loans only. The number of observations by subpopulation may not add up due to missing
observations in demographic characteristics.
43
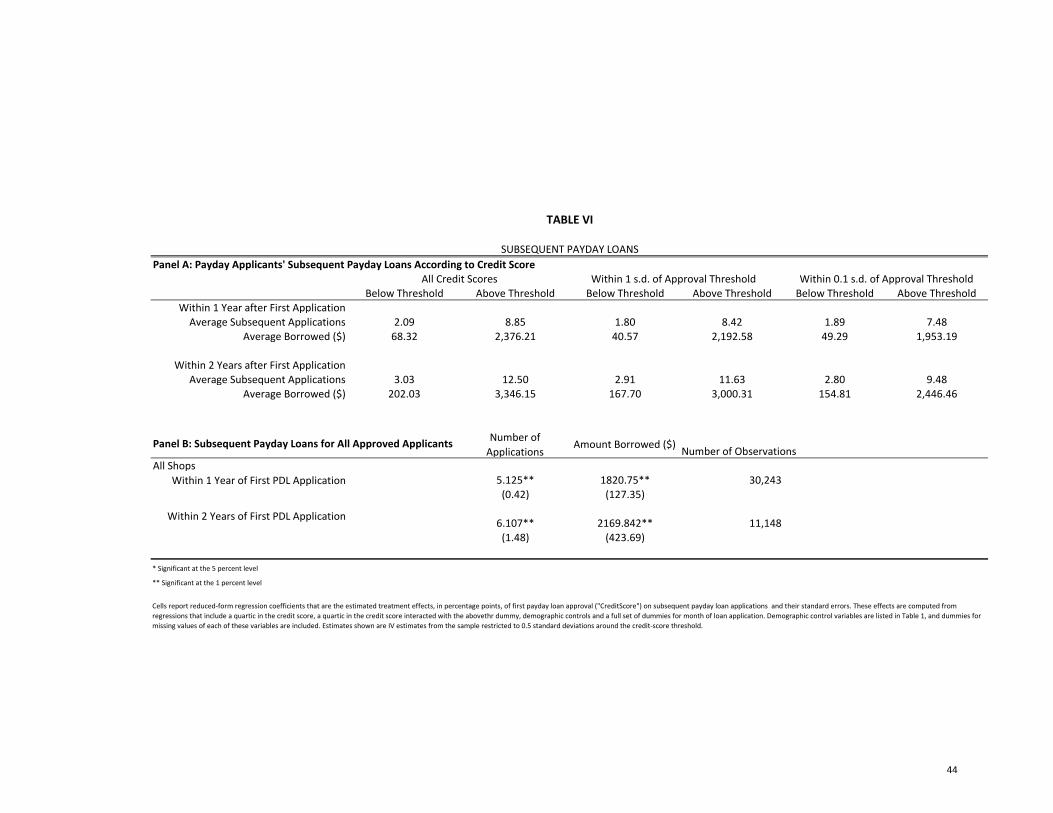
Panel A: Payday Applicants' Subsequent Payday Loans According to Credit Score
Within 1 s.d. of Approval ThresholdBelow Threshold Above Threshold Below Threshold Above Threshold Below Threshold Above Threshold
Within 1 Year after First Application
Average Subsequent Applications 2.09 8.85 1.80 8.42 1.89 7.48Average Borrowed ($) 68.32 2,376.21 40.57 2,192.58 49.29 1,953.19
Within 2 Years after First ApplicationAverage Subsequent Applications 3.03 12.50 2.91 11.63 2.80 9.48
Average Borrowed ($) 202.03 3,346.15 167.70 3,000.31 154.81 2,446.46
Number of
ApplicationsAmount Borrowed ($)
Number of Observations
All Shops
Within 1 Year of First PDL Application 5.125** 1820.75** 30,243(0.42) (127.35)
Within 2 Years of First PDL Application6.107** 2169.842** 11,148
(1.48) (423.69)
* Significant at the 5 percent level
** Significant at the 1 percent level
All Credit Scores
Cells report reduced-form regression coefficients that are the estimated treatment effects, in percentage points, of first payday loan approval ("CreditScore") on subsequent payday loan applications and their standard errors. These effects are computed from
regressions that include a quartic in the credit score, a quartic in the credit score interacted with the abovethr dummy, demographic controls and a full set of dummies for month of loan application. Demographic control variables are listed in Table 1, and dummies for
missing values of each of these variables are included. Estimates shown are IV estimates from the sample restricted to 0.5 standard deviations around the credit-score threshold.
TABLE VI
SUBSEQUENT PAYDAY LOANS
Within 0.1 s.d. of Approval Threshold
Panel B: Subsequent Payday Loans for All Approved Applicants
44

Below Above Below Above
Total Liabilities ($) Mean 145,317 137,954 Total Assets ($) Mean 156,908 83,321SD 106,043 122,601 SD 514,178 63,634
Total Secured Debt Mean 113,096 103,783 Personal Property Mean 22,834 19,872SD 80,054 79,531 SD 21,386 18,868
Total Unsecured Debt Mean 32,221 34,171 Real Property Mean 134,074 63,449SD 37,060 55,202 SD 513,319 57,848
Below Above
Mean 24,696 11,727
SD 25,205 12,321
Mean 16,194 13,674SD 10,729 9,924
Mean 101,264 102,728
SD 42,635 63,075
PAYDAY APPLICANTS' ASSETS AND LIABILITIES
TABLE VII
Panel B: Liabilities by Subcategory
This table shows bankruptcy petition filings for 211 payday loan applicants (104 below and 107 above the passing credit-score threshold) who filed
for bankruptcy after their first payday loan application. Samples are not exactly balanced due to ties in the credit score. Data are from PACER
matched to records from a payday loan company. The two rows under each type of asset or liability are the mean and the standard deviation of dollar
amounts of outstanding debts.
Student Loans
Car Lease
Mortgage
Panel A: General Assets and Liabilities
45
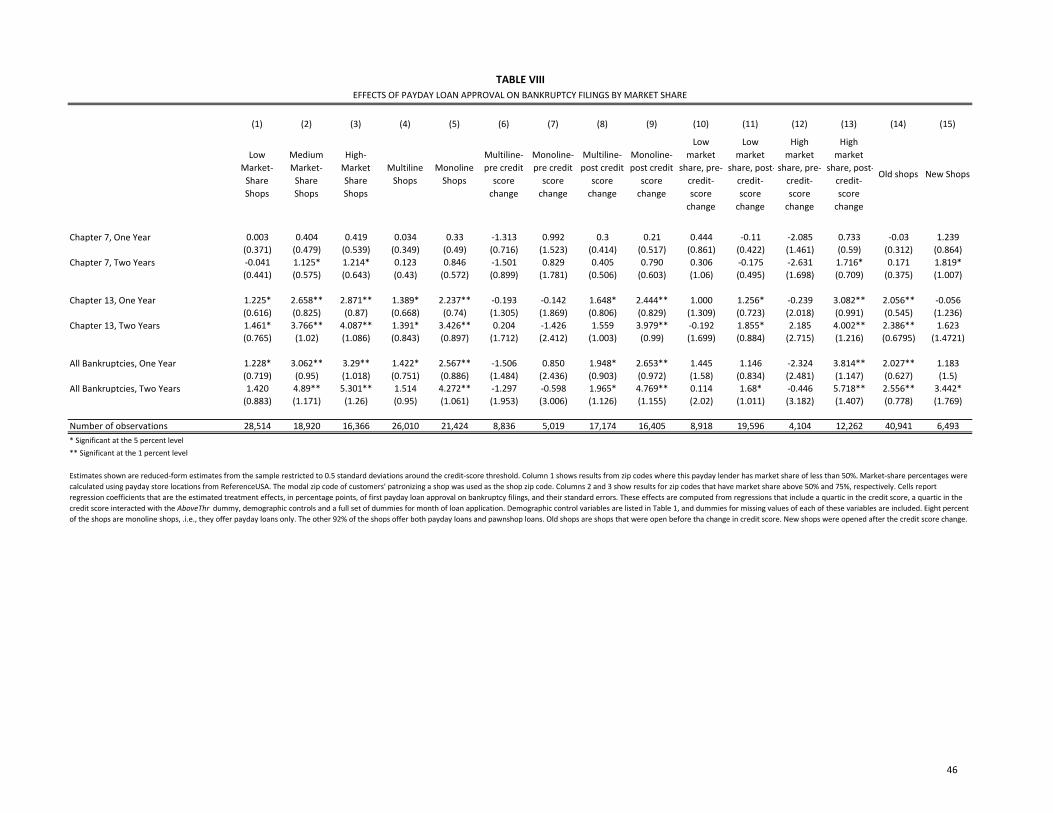
(1) (2) (3) (4) (5) (6) (7) (8) (9) (10) (11) (12) (13) (14) (15)
Low
Market-
Share
Shops
Medium
Market-
Share
Shops
High-
Market
Share
Shops
Multiline
Shops
Monoline
Shops
Multiline-
pre credit
score
change
Monoline-
pre credit
score
change
Multiline-
post credit
score
change
Monoline-
post credit
score
change
Low
market
share, pre-
credit-
score
change
Low
market
share, post-
credit-
score
change
High
market
share, pre-
credit-
score
change
High
market
share, post-
credit-
score
change
Old shops New Shops
Chapter 7, One Year 0.003 0.404 0.419 0.034 0.33 -1.313 0.992 0.3 0.21 0.444 -0.11 -2.085 0.733 -0.03 1.239
(0.371) (0.479) (0.539) (0.349) (0.49) (0.716) (1.523) (0.414) (0.517) (0.861) (0.422) (1.461) (0.59) (0.312) (0.864)
Chapter 7, Two Years -0.041 1.125* 1.214* 0.123 0.846 -1.501 0.829 0.405 0.790 0.306 -0.175 -2.631 1.716* 0.171 1.819*
(0.441) (0.575) (0.643) (0.43) (0.572) (0.899) (1.781) (0.506) (0.603) (1.06) (0.495) (1.698) (0.709) (0.375) (1.007)
Chapter 13, One Year 1.225* 2.658** 2.871** 1.389* 2.237** -0.193 -0.142 1.648* 2.444** 1.000 1.256* -0.239 3.082** 2.056** -0.056
(0.616) (0.825) (0.87) (0.668) (0.74) (1.305) (1.869) (0.806) (0.829) (1.309) (0.723) (2.018) (0.991) (0.545) (1.236)
Chapter 13, Two Years 1.461* 3.766** 4.087** 1.391* 3.426** 0.204 -1.426 1.559 3.979** -0.192 1.855* 2.185 4.002** 2.386** 1.623
(0.765) (1.02) (1.086) (0.843) (0.897) (1.712) (2.412) (1.003) (0.99) (1.699) (0.884) (2.715) (1.216) (0.6795) (1.4721)
All Bankruptcies, One Year 1.228* 3.062** 3.29** 1.422* 2.567** -1.506 0.850 1.948* 2.653** 1.445 1.146 -2.324 3.814** 2.027** 1.183
(0.719) (0.95) (1.018) (0.751) (0.886) (1.484) (2.436) (0.903) (0.972) (1.58) (0.834) (2.481) (1.147) (0.627) (1.5)
All Bankruptcies, Two Years 1.420 4.89** 5.301** 1.514 4.272** -1.297 -0.598 1.965* 4.769** 0.114 1.68* -0.446 5.718** 2.556** 3.442*
(0.883) (1.171) (1.26) (0.95) (1.061) (1.953) (3.006) (1.126) (1.155) (2.02) (1.011) (3.182) (1.407) (0.778) (1.769)
Number of observations 28,514 18,920 16,366 26,010 21,424 8,836 5,019 17,174 16,405 8,918 19,596 4,104 12,262 40,941 6,493
* Significant at the 5 percent level
** Significant at the 1 percent level
Estimates shown are reduced-form estimates from the sample restricted to 0.5 standard deviations around the credit-score threshold. Column 1 shows results from zip codes where this payday lender has market share of less than 50%. Market-share percentages were
calculated using payday store locations from ReferenceUSA. The modal zip code of customers' patronizing a shop was used as the shop zip code. Columns 2 and 3 show results for zip codes that have market share above 50% and 75%, respectively. Cells report
regression coefficients that are the estimated treatment effects, in percentage points, of first payday loan approval on bankruptcy filings, and their standard errors. These effects are computed from regressions that include a quartic in the credit score, a quartic in the
credit score interacted with the AboveThr dummy, demographic controls and a full set of dummies for month of loan application. Demographic control variables are listed in Table 1, and dummies for missing values of each of these variables are included. Eight percent
of the shops are monoline shops, .i.e., they offer payday loans only. The other 92% of the shops offer both payday loans and pawnshop loans. Old shops are shops that were open before tha change in credit score. New shops were opened after the credit score change.
EFFECTS OF PAYDAY LOAN APPROVAL ON BANKRUPTCY FILINGS BY MARKET SHARE
TABLE VIII
46

(1) (2) (3) (4) (5) (6) (9) (10) (11)
3rd quarters pre 2nd quarters pre 1 quarter pre 3rd quarters pre 2nd quarters pre 1 quarter pre 3rd quarters pre 2nd quarters pre 1 quarter pre
.543** 0.244 0.129 0.215 -0.005 -0.444 0.639** 0.259 0.253
0.191 0.174 0.167 0.379 0.258 0.316 0.227 0.218 0.200
3rd quarters pre 2nd quarters pre 1 quarter pre 3rd quarters pre 2nd quarters pre 1 quarter pre 3rd quarters pre 2nd quarters pre 1 quarter pre
0.558** 0.277* -0.062 0.265 0.000 -0.464 0.653** 0.282 0.032
0.165 0.147 0.124 0.315 0.182 0.298 0.198 0.187 0.140
3rd quarters pre 2nd quarters pre 1 quarter pre 3rd quarters pre 2nd quarters pre 1 quarter pre 3rd quarters pre 2nd quarters pre 1 quarter pre
-0.014 -0.033 0.191 -0.050 -0.005 0.020 -0.013 -0.023 0.222
0.096 0.094 0.111 0.211 0.182 0.105 0.112 0.112 0.143
The credit-scoring formula and the threshold for approval were adjusted at all shops once during our period of observation, in August 2002. This table shows reduced-form estimates from the sample restricted to 0.5 standard deviations around the credit-score
threshold for borrowers who applied for their first payday loan at this company during the months before the credit-score change. Regressions include a quartic in the credit score, a quartic in the credit score interacted with the AboveThr dummy, demographic
controls and a full set of dummies for month of loan application. Demographic control variables are listed in Table 1, and dummies for missing values of each of these variables are included.Columns (1)-(3) show results for applicants who applied during the entire
sample period. Columns (4)-(6) show results for applicants who applied for their first payday loan before the lender instituted a change in the credit-score threshold. Columns (9)-(11) show results for applicants who applied after the change. The results show the
effects of payday loan access on subsequent bankruptcy filing rates for quarters leading up to the implimentation of the Bankrtupcy Abuse Prevention and Consumer Protection Act of 2005. * Significant at the 5 percent level. ** Significant at the 1 percent level.
All Chapters All Chapters
Chapter 13 Chapter 13 Chapter 13
Chapter 7 Chapter 7 Chapter 7
N = 47,434
N = 47,434
N = 13,855
N = 13,855
N = 13,855
N = 33,579
N = 33,579
N = 33,579
Table IX: The Effect of Bankrtupcy Reform
N = 47,434
Applicants applying after the credit-score changeApplicants applying before the credit-score changeApplicants applying in all time periods
All Chapters
47
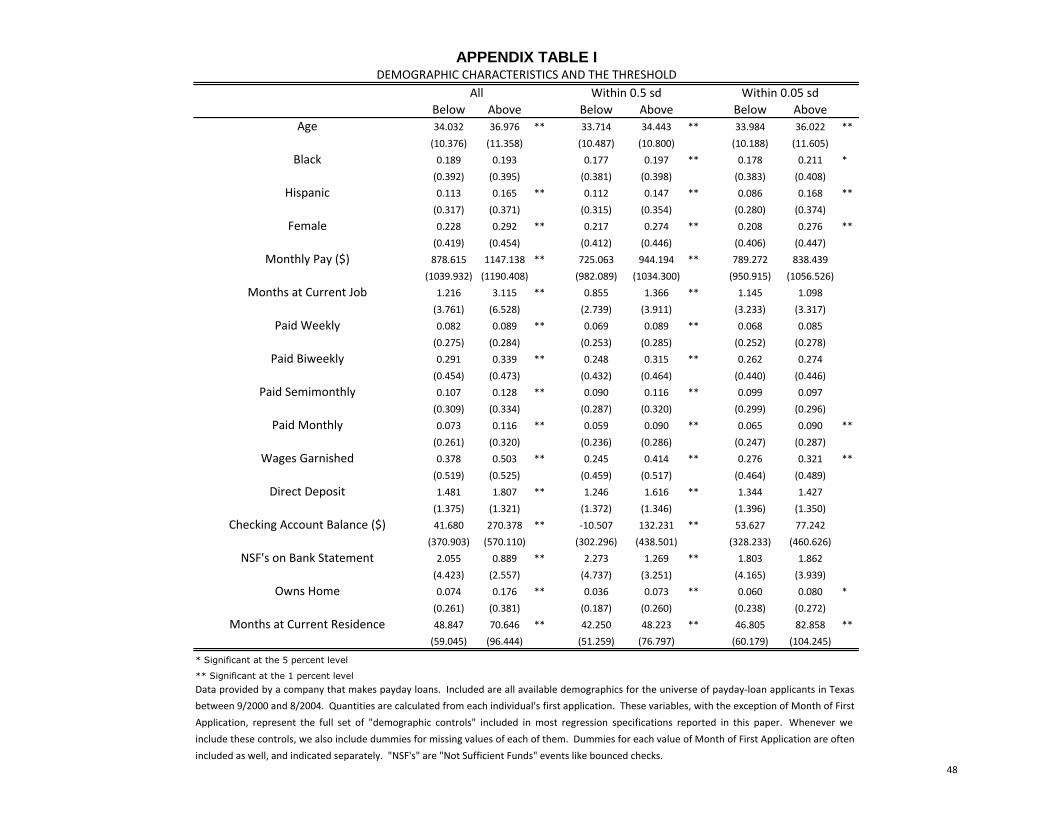
Below Above Below Above Below Above
Age 34.032 36.976 ** 33.714 34.443 ** 33.984 36.022 **
(10.376) (11.358) (10.487) (10.800) (10.188) (11.605)
Black 0.189 0.193 0.177 0.197 ** 0.178 0.211 *
(0.392) (0.395) (0.381) (0.398) (0.383) (0.408)
Hispanic 0.113 0.165 ** 0.112 0.147 ** 0.086 0.168 **
(0.317) (0.371) (0.315) (0.354) (0.280) (0.374)
Female 0.228 0.292 ** 0.217 0.274 ** 0.208 0.276 **
(0.419) (0.454) (0.412) (0.446) (0.406) (0.447)
Monthly Pay ($) 878.615 1147.138 ** 725.063 944.194 ** 789.272 838.439
(1039.932) (1190.408) (982.089) (1034.300) (950.915) (1056.526)
Months at Current Job 1.216 3.115 ** 0.855 1.366 ** 1.145 1.098
(3.761) (6.528) (2.739) (3.911) (3.233) (3.317)
Paid Weekly 0.082 0.089 ** 0.069 0.089 ** 0.068 0.085
(0.275) (0.284) (0.253) (0.285) (0.252) (0.278)
Paid Biweekly 0.291 0.339 ** 0.248 0.315 ** 0.262 0.274
(0.454) (0.473) (0.432) (0.464) (0.440) (0.446)
Paid Semimonthly 0.107 0.128 ** 0.090 0.116 ** 0.099 0.097
(0.309) (0.334) (0.287) (0.320) (0.299) (0.296)
Paid Monthly 0.073 0.116 ** 0.059 0.090 ** 0.065 0.090 **
(0.261) (0.320) (0.236) (0.286) (0.247) (0.287)
Wages Garnished 0.378 0.503 ** 0.245 0.414 ** 0.276 0.321 **
(0.519) (0.525) (0.459) (0.517) (0.464) (0.489)
Direct Deposit 1.481 1.807 ** 1.246 1.616 ** 1.344 1.427
(1.375) (1.321) (1.372) (1.346) (1.396) (1.350)
Checking Account Balance ($) 41.680 270.378 ** -10.507 132.231 ** 53.627 77.242
(370.903) (570.110) (302.296) (438.501) (328.233) (460.626)
NSF's on Bank Statement 2.055 0.889 ** 2.273 1.269 ** 1.803 1.862
(4.423) (2.557) (4.737) (3.251) (4.165) (3.939)
Owns Home 0.074 0.176 ** 0.036 0.073 ** 0.060 0.080 *
(0.261) (0.381) (0.187) (0.260) (0.238) (0.272)
Months at Current Residence 48.847 70.646 ** 42.250 48.223 ** 46.805 82.858 **
(59.045) (96.444) (51.259) (76.797) (60.179) (104.245)
* Significant at the 5 percent level
** Significant at the 1 percent level
Data provided by a company that makes payday loans. Included are all available demographics for the universe of payday-loan applicants in Texas
between 9/2000 and 8/2004. Quantities are calculated from each individual's first application. These variables, with the exception of Month of First
Application, represent the full set of "demographic controls" included in most regression specifications reported in this paper. Whenever we
include these controls, we also include dummies for missing values of each of them. Dummies for each value of Month of First Application are often
included as well, and indicated separately. "NSF's" are "Not Sufficient Funds" events like bounced checks.
APPENDIX TABLE IDEMOGRAPHIC CHARACTERISTICS AND THE THRESHOLD
All Within 0.5 sd Within 0.05 sd
48

(1) (2) (3) (4) (5) (6) (7)
Reduced FormReduced Form, pre-August
2002
Reduced Form, post-August
2002
Reduced form, RHS variable
interaction of AboveThr and
post-August 2002 dummy
Same as col (4) except
allowing functional form of
credit score to vary before
and after credit score change
of August 2002.
Same as Col (5) but without
a post-August 2002 dummy.
Reduced form, RHS variable
interaction of AboveThr and
post-August 2002 dummy.
Sample includes only post-
August 2002 observations.
Chapter 7, One Year 0.169 -0.459 0.233 -0.147 0.134 -0.004 0.101(0.294) (0.712) (0.330) (0.144) (0.346) (0.318) (0.353)
Chapter 7, Two Years 0.445 -0.634 0.559 -0.081 0.477 0.226 0.424(0.351) (0.859) (0.392) (0.172) (0.413) (0.379) (0.420)
Chapter 13, One Year 1.797** -0.033 2.041** 0.512* 1.218* 1.064* 1.122*(0.495) (1.070) (0.577) (0.242) (0.584) (0.536) (0.618)
Chapter 13, Two Years 2.377** -0.079 2.751** 0.681* 1.783* 1.476* 1.717*(0.614) (1.395) (0.705) (0.301) (0.724) (0.665) (0.755)
All Bankruptcies, One Year 1.966** -0.492 2.273** 0.365 1.352* 1.060* 1.223*(0.574) (1.289) (0.662) (0.281) (0.677) (0.622) (0.709)
All Bankruptcies, Two Years 2.822** -0.713 3.310** 0.599* 2.259** 1.702* 2.142*(0.708) (1.649) (0.805) (0.346) (0.834) (0.766) (0.862)
Number of observations 47,434 13,855 33,579 47,434 47,434 47,434 33,579* Significant at the 5 percent level
** Significant at the 1 percent level
Estimates shown are reduced-form estimates from the sample restricted to 0.5 standard deviations around the credit-score threshold. Cells report regression coefficients that are the estimated treatment effects, in percentage points, of first payday loan approval on bankruptcy filings, and
their standard errors. These effects are computed from regressions that include a quartic in the credit score, a quartic in the credit score interacted with the AboveThr dummy, demographic controls and a full set of dummies for month of loan application. Demographic control variables are
listed in Table 1, and dummies for missing values of each of these variables are included.
APPENDIX TABLE II
EFFECTS OF PAYDAY LOAN APPROVAL ON BANKRUPTCY FILINGS BEGORE AND AFTER CREDIT SCORE CHANGE
49