Embed Size (px)
Citation preview
Short Course:
Image classification methods
Lars Kai HansenDTU InformaticsTechnical University of Denmark
Co-workers:Morten Mørup, Kristoffer Madsen, Peter Mondrup, Trine Abrahamsen, Stephen Strother (Toronto)
Lars Kai HansenIMM, Technical University of Denmark
OUTLINE
• Classification of functional images –the doubble agenda– Aim I: To abstract generalizable classifiers from data– Aim II: Robust interpretation / visualization
• Unsupervised (explorative)– Factor models - Linear hidden variable representations– Visualization
• Supervised models (retrieval)– Visualization of non-linear kernel machines– PR-plotting Supervised models
Do not multiply causes!

Lars Kai HansenIMM, Technical University of Denmark
Recent reviews
Lars Kai HansenIMM, Technical University of Denmark
Functional MRI
• Indirect measure of neural activity - hemodynamics
• A cloudy window to the human brain
• Challenges:– Signals are multi-
dimensional mixtures– No simple relation between
measures and brain state -”what is signal and what is noise”?
TR = 333 ms
Lars Kai HansenIMM, Technical University of Denmark
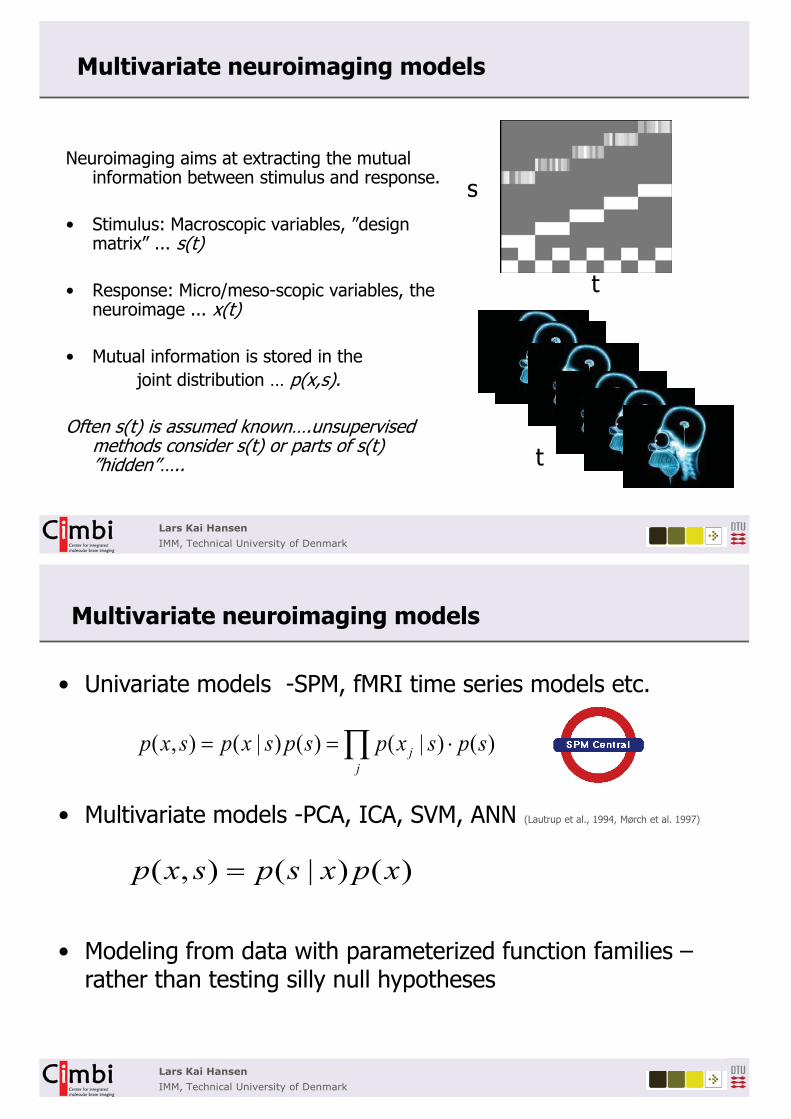
Multivariate neuroimaging models
Neuroimaging aims at extracting the mutual information between stimulus and response.
• Stimulus: Macroscopic variables, ”design matrix” ... s(t)
• Response: Micro/meso-scopic variables, the neuroimage ... x(t)
• Mutual information is stored in the joint distribution … p(x,s).
Often s(t) is assumed known….unsupervised methods consider s(t) or parts of s(t) ”hidden”…..
t
t
s
Lars Kai HansenIMM, Technical University of Denmark
Multivariate neuroimaging models
• Univariate models -SPM, fMRI time series models etc.
• Multivariate models -PCA, ICA, SVM, ANN (Lautrup et al., 1994, Mørch et al. 1997)
• Modeling from data with parameterized function families –rather than testing silly null hypotheses
( , ) ( | ) ( ) ( | ) ( )jj
p x s p x s p s p x s p s� � ��
( , ) ( | ) ( )p x s p s x p x�
Lars Kai HansenIMM, Technical University of Denmark
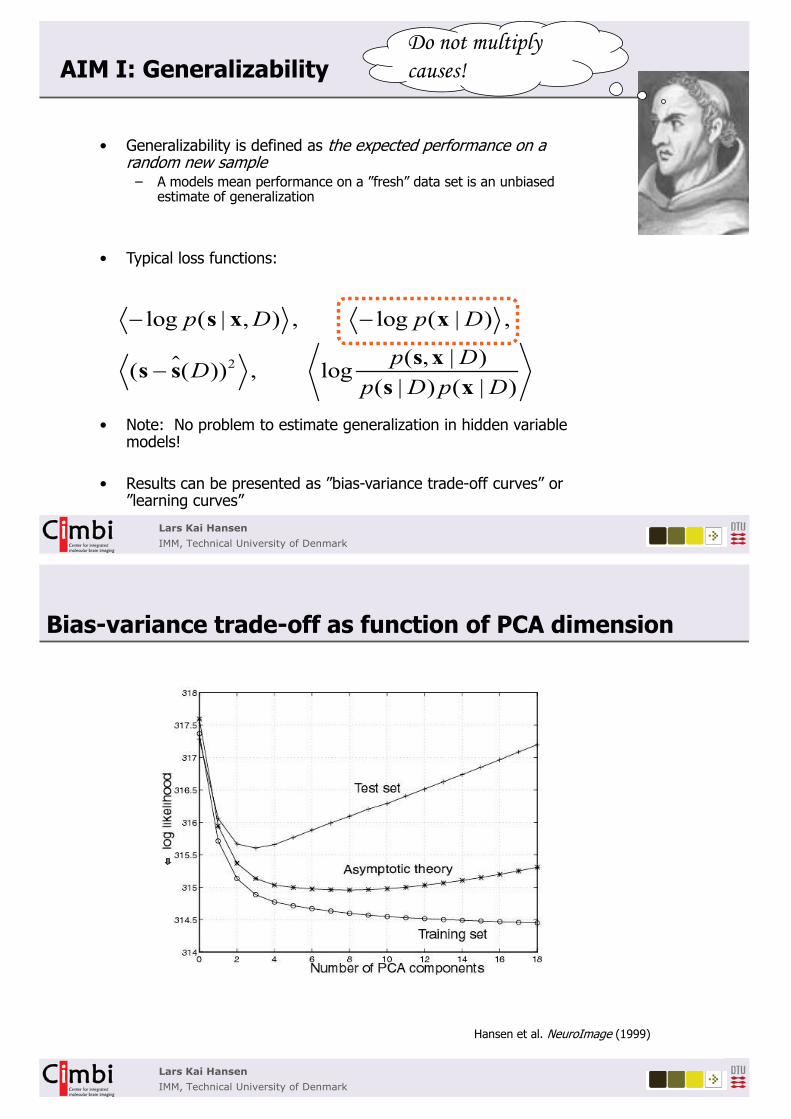
AIM I: Generalizability
• Generalizability is defined as the expected performance on a random new sample
– A models mean performance on a ”fresh” data set is an unbiased estimate of generalization
• Typical loss functions:
• Note: No problem to estimate generalization in hidden variable models!
• Results can be presented as ”bias-variance trade-off curves” or ”learning curves”
2
log ( | , ) , log ( | ) ,
( , | )( ( )) , log( | ) ( | )
p D p D
p DDp D p D
� �
�
s x x
s xs ss x
�
Do not multiply causes!
Lars Kai HansenIMM, Technical University of Denmark
Bias-variance trade-off as function of PCA dimension
Hansen et al. NeuroImage (1999)
Lars Kai HansenIMM, Technical University of Denmark
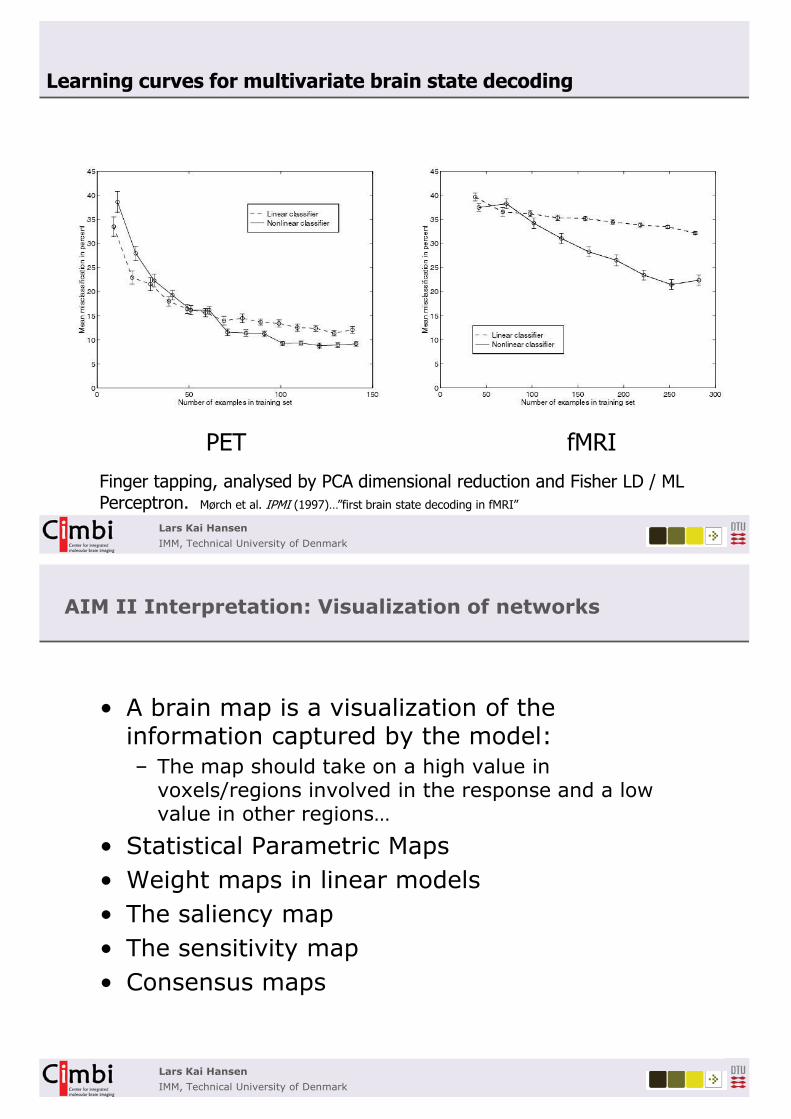
Learning curves for multivariate brain state decoding
PET fMRIFinger tapping, analysed by PCA dimensional reduction and Fisher LD / ML Perceptron. Mørch et al. IPMI (1997)…”first brain state decoding in fMRI”
Lars Kai HansenIMM, Technical University of Denmark
AIM II Interpretation: Visualization of networks
• A brain map is a visualization of the information captured by the model: – The map should take on a high value in
voxels/regions involved in the response and a low value in other regions…
• Statistical Parametric Maps• Weight maps in linear models• The saliency map• The sensitivity map• Consensus maps
Lars Kai HansenIMM, Technical University of Denmark
…hints from asymptotic theory
• Asymptotic theory investigates the sampling fluctuations in the limit N -> �
• Cross-validation good news: The ensemble average predictor is equivalent to training on all data (Hansen & Larsen, 1996)
• Simple asymptotics for parametric and semi-parametric models
• Some results for non-parametric e.g. kernel machines
• In general: Asymptotic predictive performance has bias and variance components, there is proportionality between parameter fluctuation and the variance component...
Lars Kai HansenIMM, Technical University of Denmark
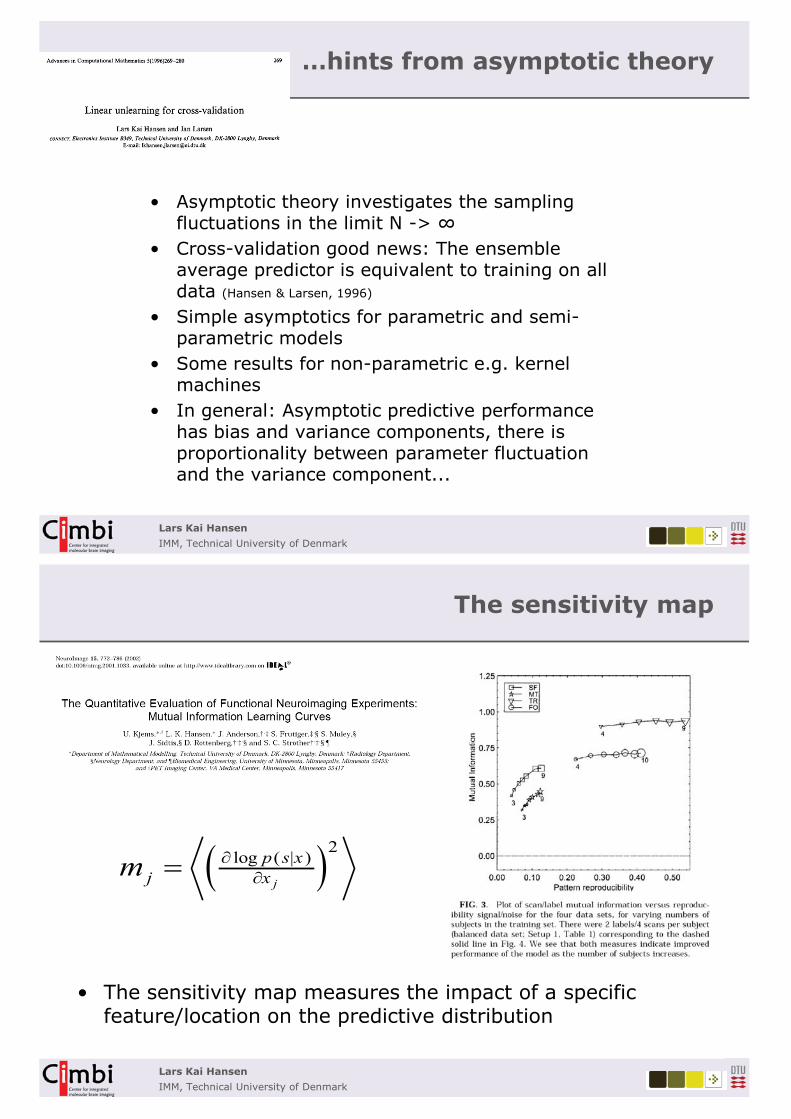
The sensitivity map
• The sensitivity map measures the impact of a specific feature/location on the predictive distribution
� �2log ( | )j
p s xj xm �
��
Lars Kai HansenIMM, Technical University of Denmark
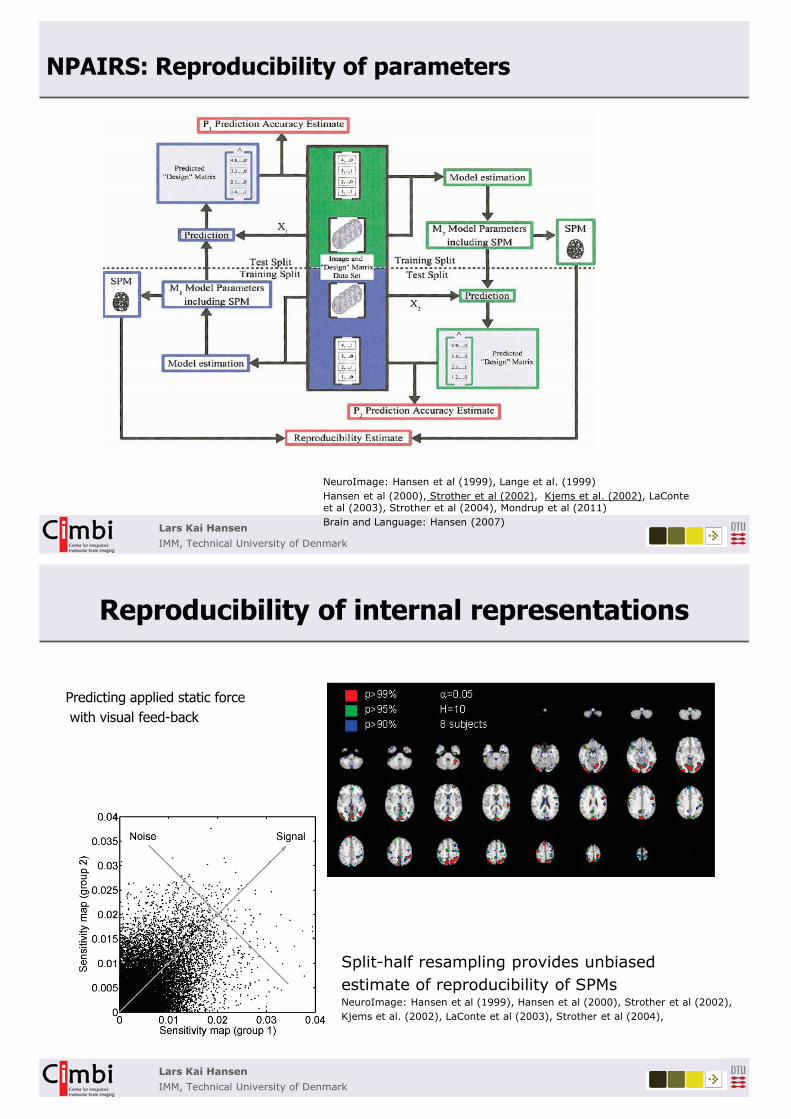
NPAIRS: Reproducibility of parameters
NeuroImage: Hansen et al (1999), Lange et al. (1999)Hansen et al (2000), Strother et al (2002), Kjems et al. (2002), LaConteet al (2003), Strother et al (2004), Mondrup et al (2011)Brain and Language: Hansen (2007)
Lars Kai HansenIMM, Technical University of Denmark
Reproducibility of internal representations
Split-half resampling provides unbiased estimate of reproducibility of SPMsNeuroImage: Hansen et al (1999), Hansen et al (2000), Strother et al (2002), Kjems et al. (2002), LaConte et al (2003), Strother et al (2004),
Predicting applied static forcewith visual feed-back
Lars Kai HansenIMM, Technical University of Denmark
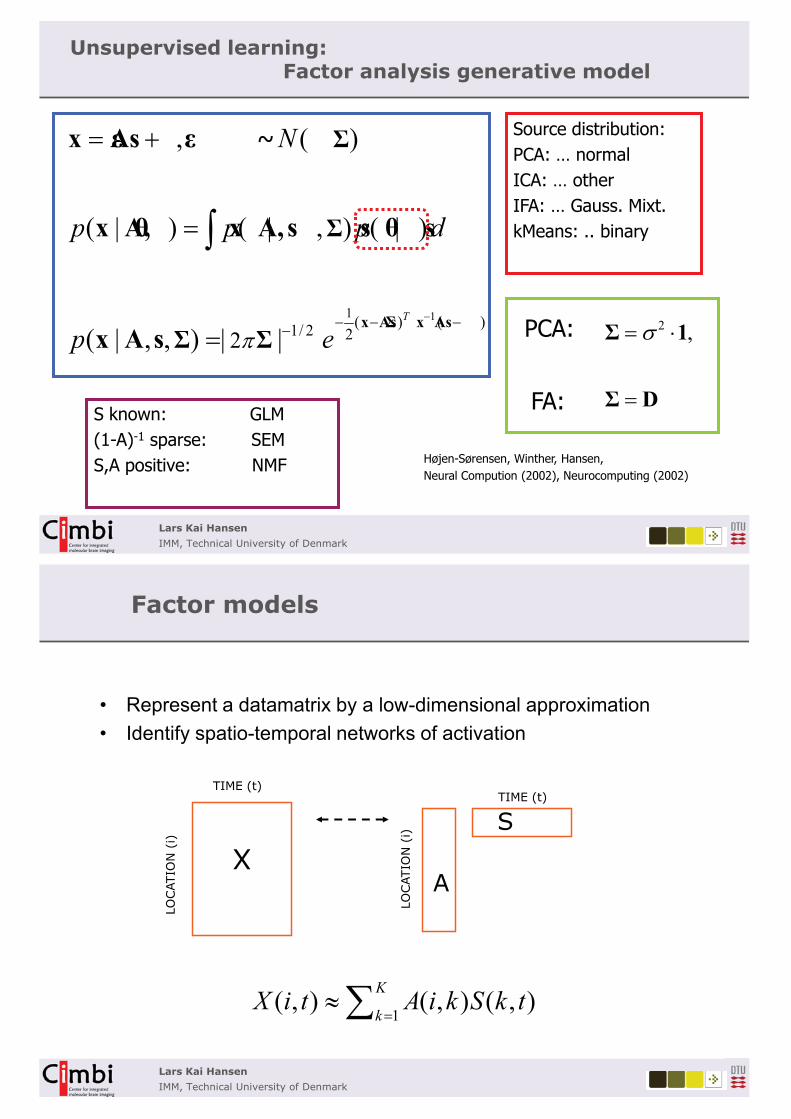
Unsupervised learning: Factor analysis generative model
11 ( ) ( )1/ 2 22
, ( )
( | ) ( | , ) ( | )
( | , , ) | |T
N
p p p d
p e�� � ��
�
�
�
�
x As� � ��
�
�
� �
x As� � ��
x A, � ��� � �
x A s
�
2 ,�� �
�
�
� �
PCA:
FA:
Source distribution:PCA: … normalICA: … otherIFA: … Gauss. Mixt.kMeans: .. binary
S known: GLM(1-A)-1 sparse: SEMS,A positive: NMF Højen-Sørensen, Winther, Hansen,
Neural Compution (2002), Neurocomputing (2002)
~
Lars Kai HansenIMM, Technical University of Denmark
Factor models
• Represent a datamatrix by a low-dimensional approximation• Identify spatio-temporal networks of activation
1( , ) ( , ) ( , )K
kX i t A i k S k t
� �
A
SX
TIME (t)
LOCAT
ION
(i)
LOCAT
ION
(i)
TIME (t)
Lars Kai HansenIMM, Technical University of Denmark
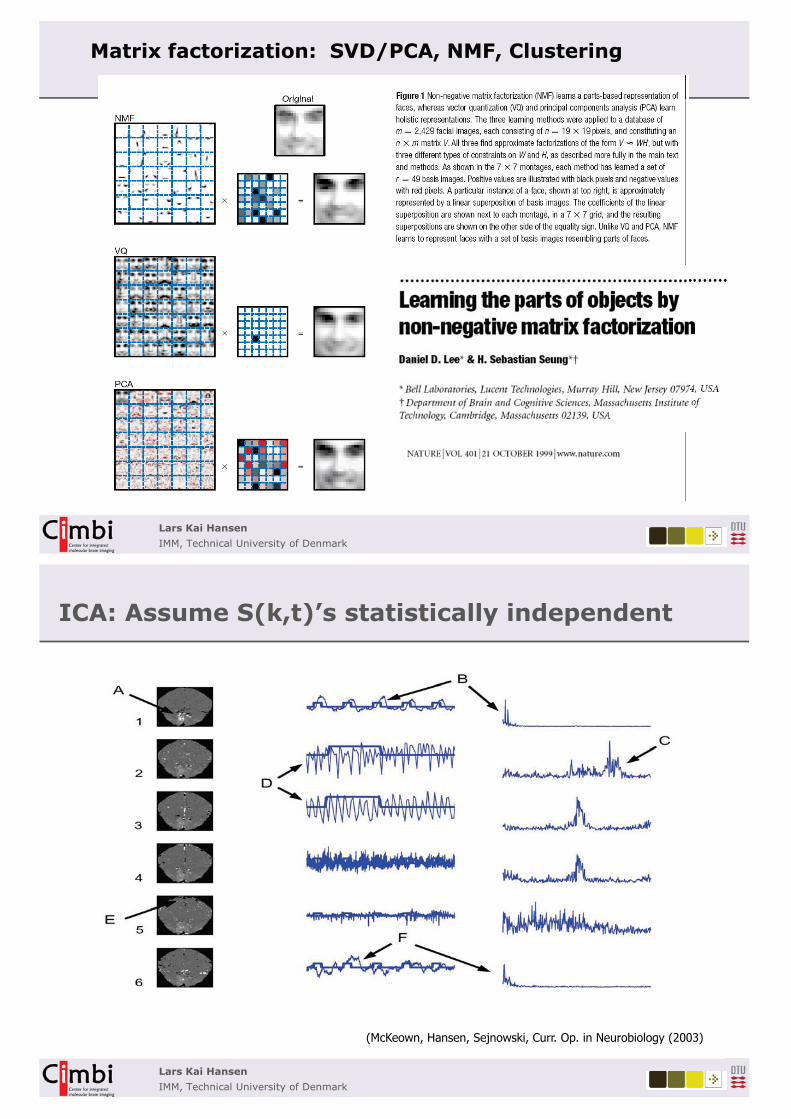
Matrix factorization: SVD/PCA, NMF, Clustering
Lars Kai HansenIMM, Technical University of Denmark
ICA: Assume S(k,t)’s statistically independent
(McKeown, Hansen, Sejnowski, Curr. Op. in Neurobiology (2003)

Lars Kai HansenIMM, Technical University of Denmark
DTU:ICA toolbox
• Infomax/Maximum likelihood Bell & Sejnowski (1995), McKeown et al (1998)
• Dynamic Components Molgedey-Schuster (1994), Petersen et al (2001)
• Mean Field ICA Højen-Sørensen et al. (2001,2002)
• Features: v Number of components (BIC)v Parameter tuningv Binary and mixing contraints (A)v Demo scripts incl. fMRI data
http://cogsys.imm.dtu.dk/toolbox/ica/
Lars Kai HansenIMM, Technical University of Denmark
Modeling the generalizability of SVD
Rich physics literature on ”retarded” learning
• Universality– Generalization for a ”single symmetry
breaking direction” is a function of ratio of N/D and signal to noise S
– For subspace models-- a bit more complicated -- depends on the component SNR’s and eigenvalue separation
– For a single direction, the mean squared overlap R2 =<(uT
1*u0)2> is computed for N,D -���
Hoyle, Rattray: Phys Rev E 75 016101 (2007)
2 22
2
( 1) / (1 ) 1/0 1/S S S S
RS
� � ��
� � �� �
��
2 2/ 1/ /cN D S N D S� �� � �
Nc = (0.0001, 0.2, 2, 9, 27, 64, 128, 234, 400, 625)� = (0.01, 0.06, 0.12, 0.17, 0.23, 0.28, 0.34, 0.39, 0.45, 0.5)
Lars Kai HansenIMM, Technical University of Denmark
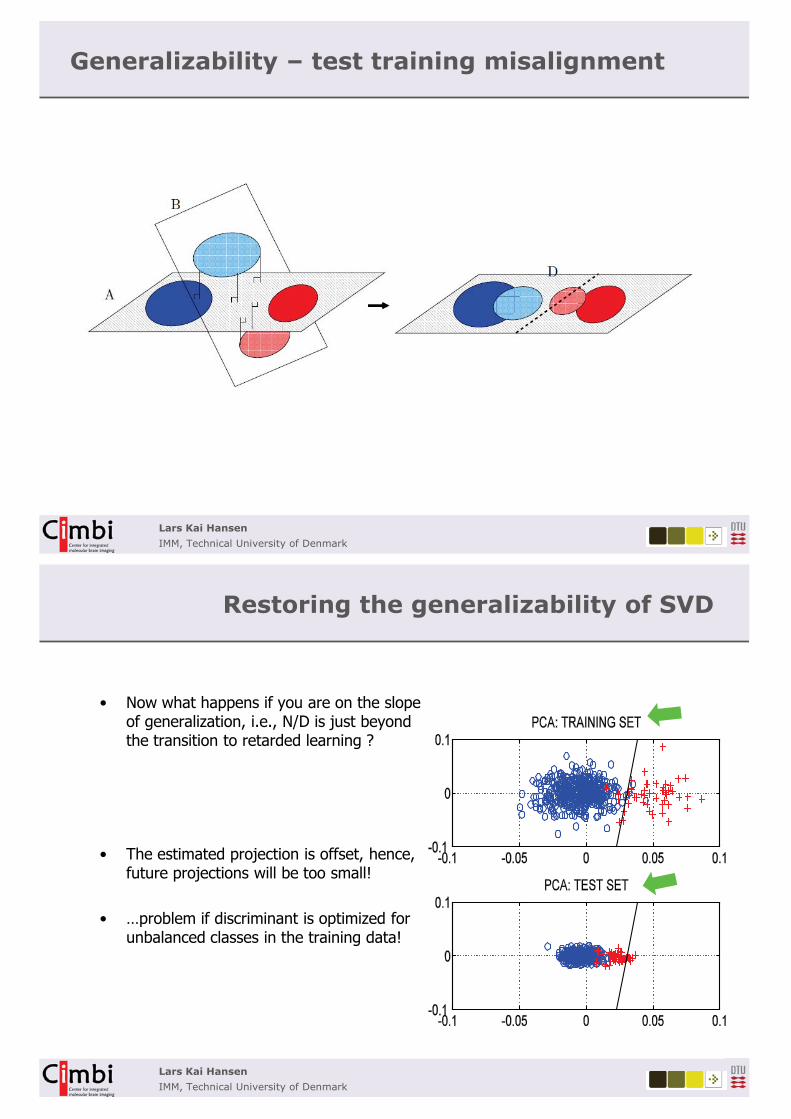
Generalizability – test training misalignment
Lars Kai HansenIMM, Technical University of Denmark
Restoring the generalizability of SVD
• Now what happens if you are on the slope of generalization, i.e., N/D is just beyond the transition to retarded learning ?
• The estimated projection is offset, hence, future projections will be too small!
• …problem if discriminant is optimized for unbalanced classes in the training data!
Lars Kai HansenIMM, Technical University of Denmark
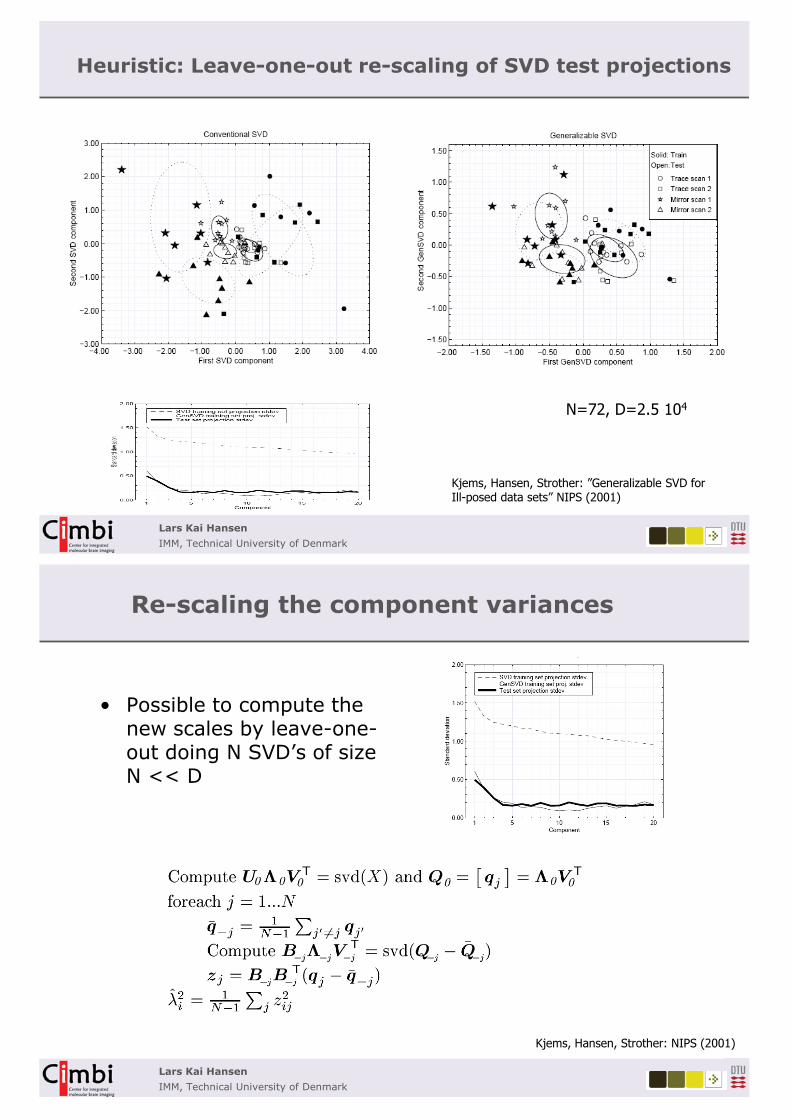
Heuristic: Leave-one-out re-scaling of SVD test projections
Kjems, Hansen, Strother: ”Generalizable SVD for Ill-posed data sets” NIPS (2001)
N=72, D=2.5 104
Lars Kai HansenIMM, Technical University of Denmark
Re-scaling the component variances
• Possible to compute the new scales by leave-one-out doing N SVD’s of size N << D
Kjems, Hansen, Strother: NIPS (2001)
Lars Kai HansenIMM, Technical University of Denmark
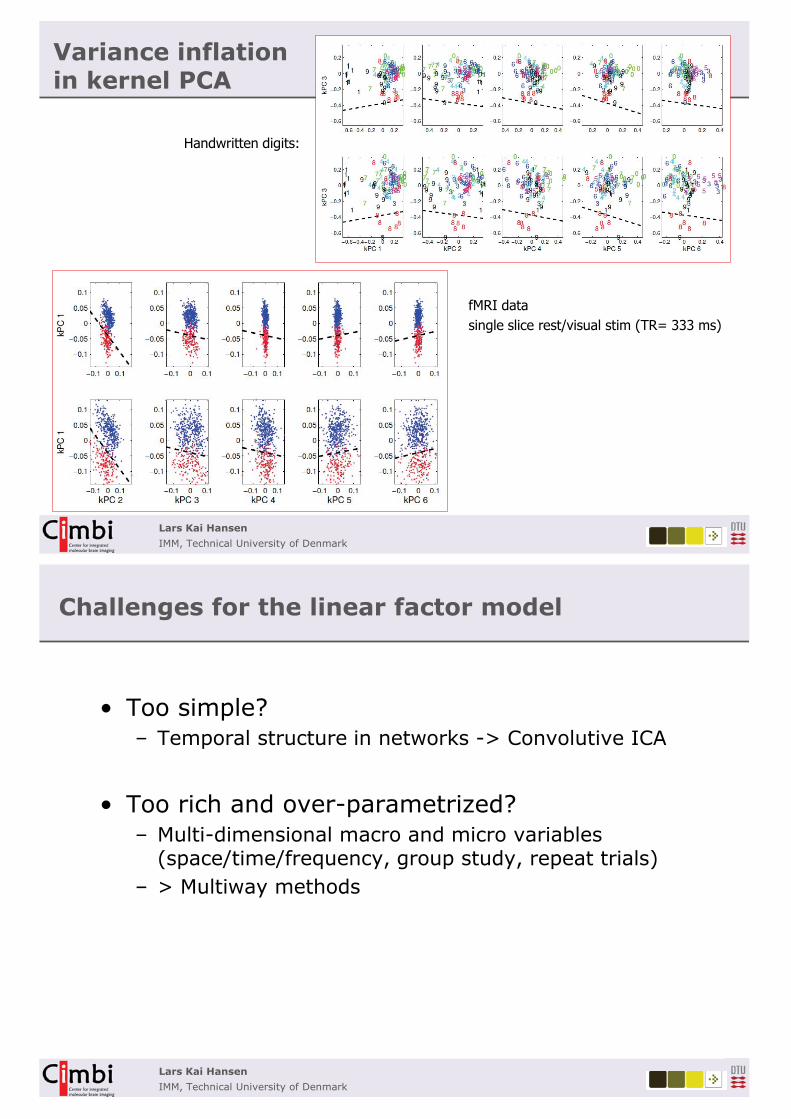
Variance inflation in kernel PCA
Handwritten digits:
fMRI data single slice rest/visual stim (TR= 333 ms)
Lars Kai HansenIMM, Technical University of Denmark
Challenges for the linear factor model
• Too simple?– Temporal structure in networks -> Convolutive ICA
• Too rich and over-parametrized? – Multi-dimensional macro and micro variables
(space/time/frequency, group study, repeat trials) – > Multiway methods
Lars Kai HansenIMM, Technical University of Denmark
Generalizable supervised models - ‘mind reading’
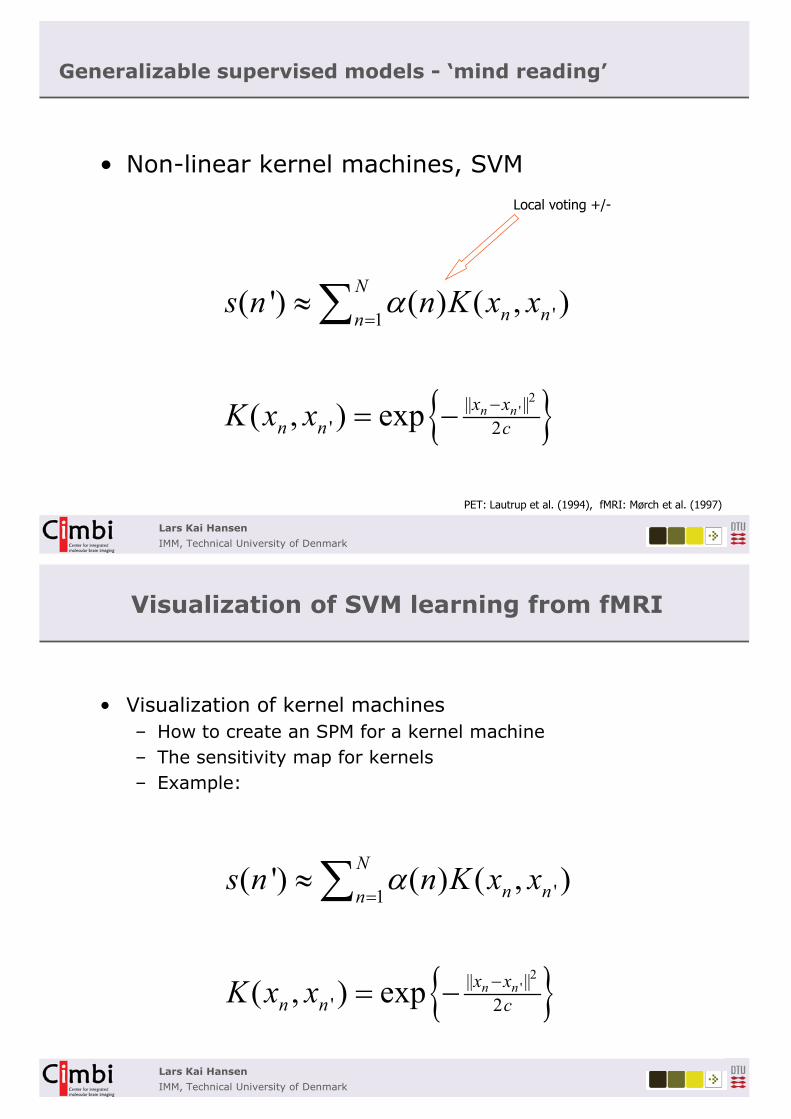
• Non-linear kernel machines, SVM
� �2''1
|| ||' 2
( ') ( ) ( , )
( , ) exp n n
Nn nn
x xn n c
s n n K x x
K x x
��
�
� �
�
Local voting +/-
PET: Lautrup et al. (1994), fMRI: Mørch et al. (1997)
Lars Kai HansenIMM, Technical University of Denmark
Visualization of SVM learning from fMRI
• Visualization of kernel machines– How to create an SPM for a kernel machine– The sensitivity map for kernels– Example:
� �2''1
|| ||' 2
( ') ( ) ( , )
( , ) exp n n
Nn nn
x xn n c
s n n K x x
K x x
��
�
� �
�
Lars Kai HansenIMM, Technical University of Denmark
Visualization of kernel machine internal representations
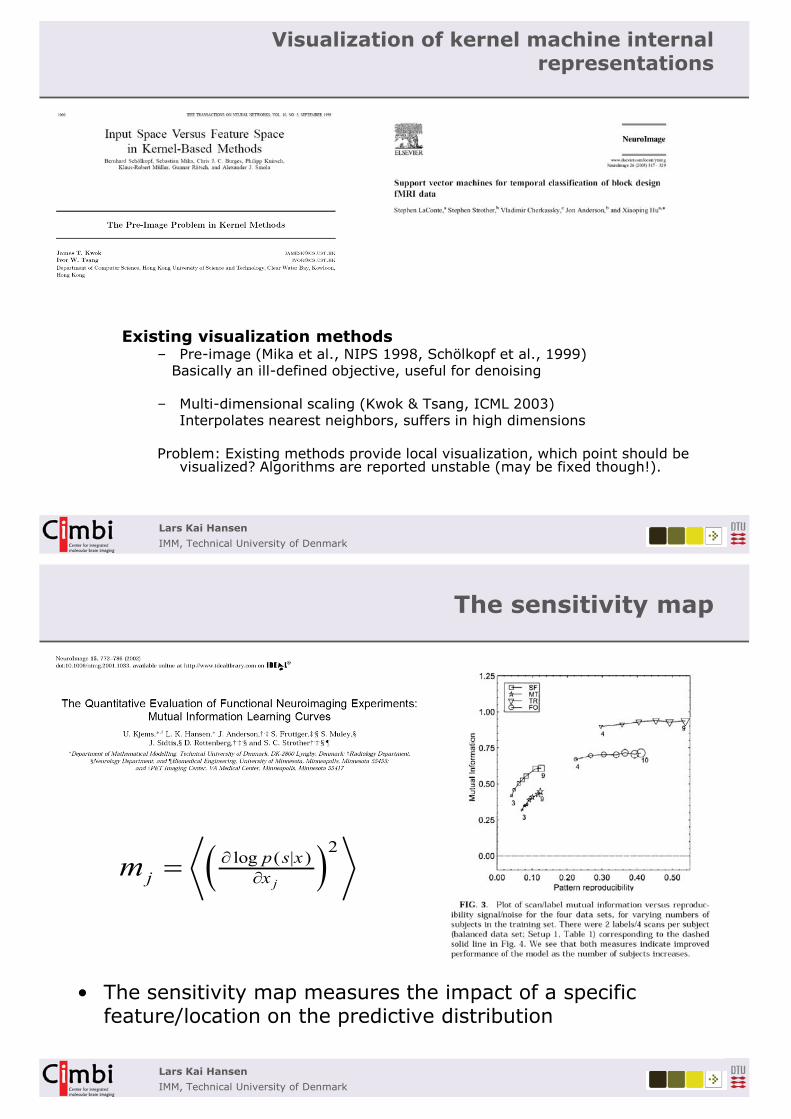
Existing visualization methods– Pre-image (Mika et al., NIPS 1998, Schölkopf et al., 1999) Basically an ill-defined objective, useful for denoising
– Multi-dimensional scaling (Kwok & Tsang, ICML 2003)Interpolates nearest neighbors, suffers in high dimensions
Problem: Existing methods provide local visualization, which point should be visualized? Algorithms are reported unstable (may be fixed though!).
Lars Kai HansenIMM, Technical University of Denmark
The sensitivity map
• The sensitivity map measures the impact of a specific feature/location on the predictive distribution
� �2log ( | )j
p s xj xm �
��
Lars Kai HansenIMM, Technical University of Denmark
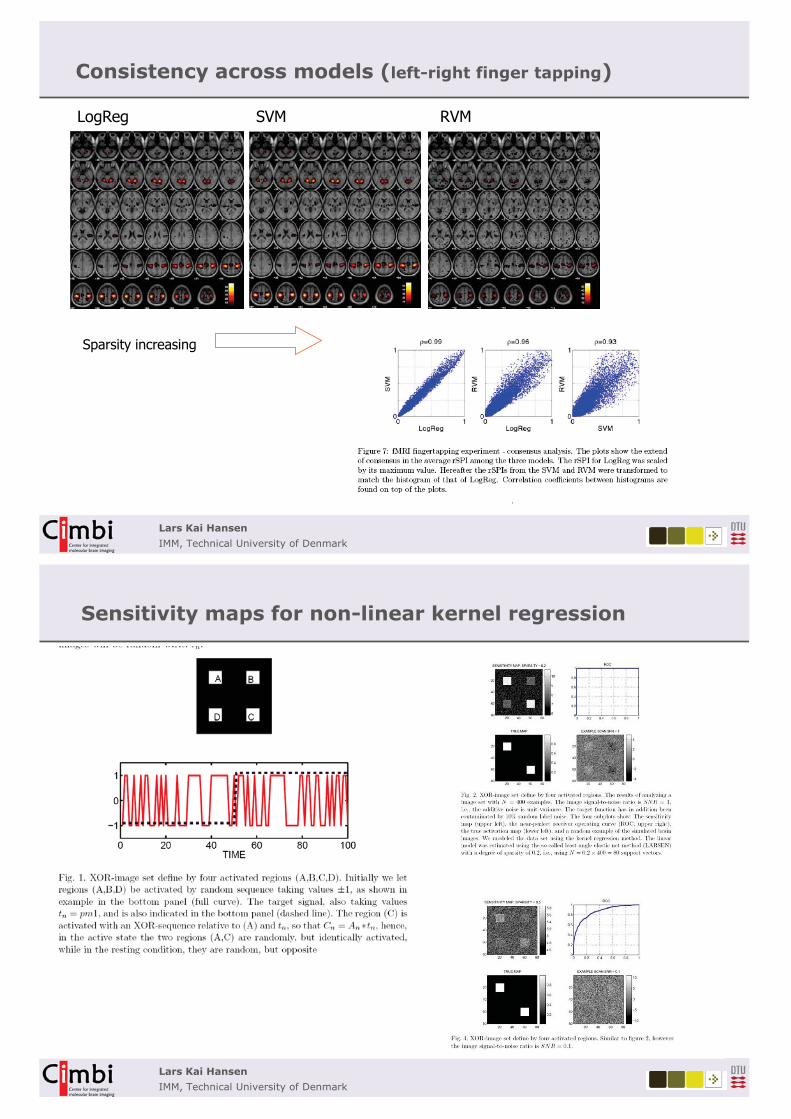
Consistency across models (left-right finger tapping)
SVMLogReg RVM
Sparsity increasing
Lars Kai HansenIMM, Technical University of Denmark
Sensitivity maps for non-linear kernel regression
Lars Kai HansenIMM, Technical University of Denmark
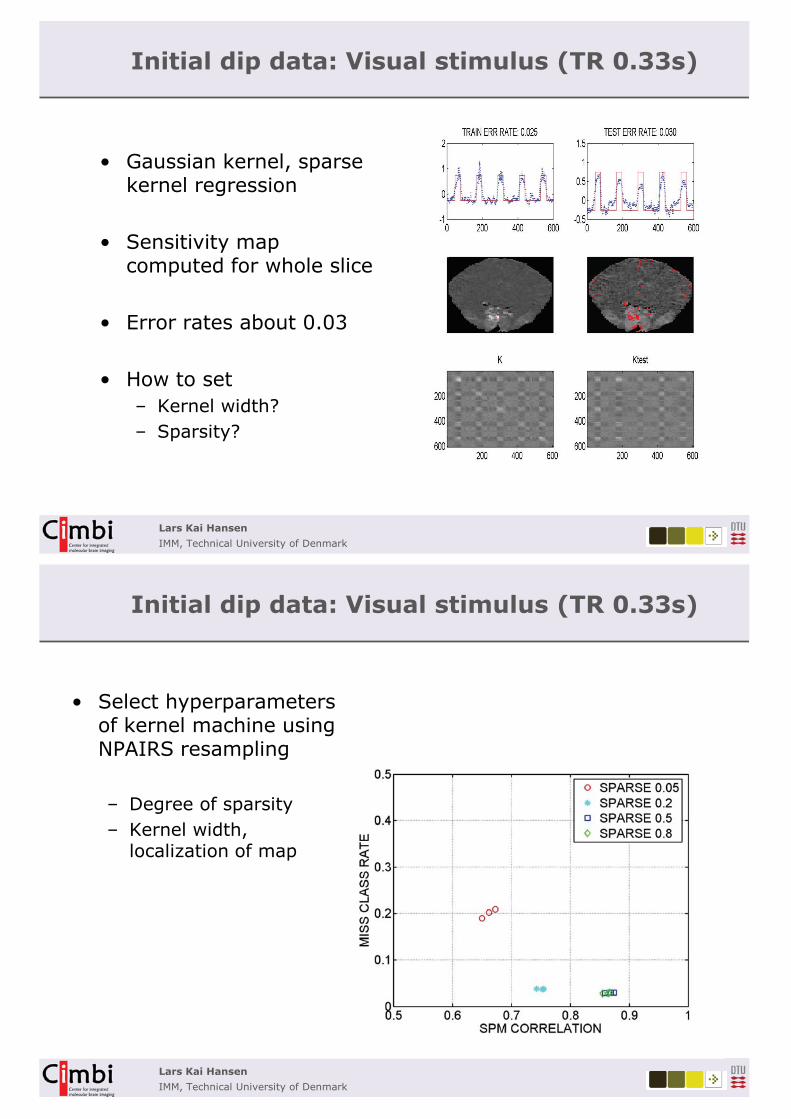
Initial dip data: Visual stimulus (TR 0.33s)
• Gaussian kernel, sparse kernel regression
• Sensitivity map computed for whole slice
• Error rates about 0.03
• How to set – Kernel width?– Sparsity?
Lars Kai HansenIMM, Technical University of Denmark
Initial dip data: Visual stimulus (TR 0.33s)
• Select hyperparameters of kernel machine using NPAIRS resampling
– Degree of sparsity– Kernel width,
localization of map
Lars Kai HansenIMM, Technical University of Denmark
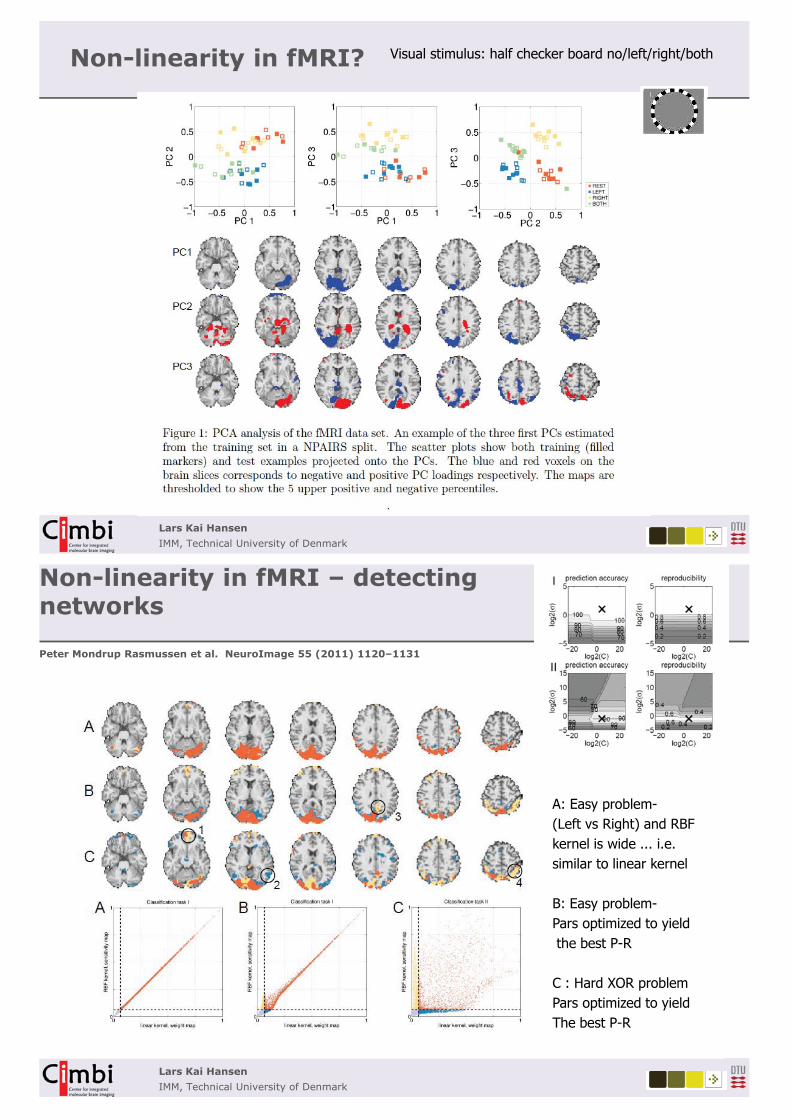
Non-linearity in fMRI? Visual stimulus: half checker board no/left/right/both
Lars Kai HansenIMM, Technical University of Denmark
Non-linearity in fMRI – detectingnetworks
Peter Mondrup Rasmussen et al. NeuroImage 55 (2011) 1120–1131
A: Easy problem-(Left vs Right) and RBF kernel is wide ... i.e.similar to linear kernel
B: Easy problem-Pars optimized to yieldthe best P-R
C : Hard XOR problemPars optimized to yieldThe best P-R
Lars Kai HansenIMM, Technical University of Denmark
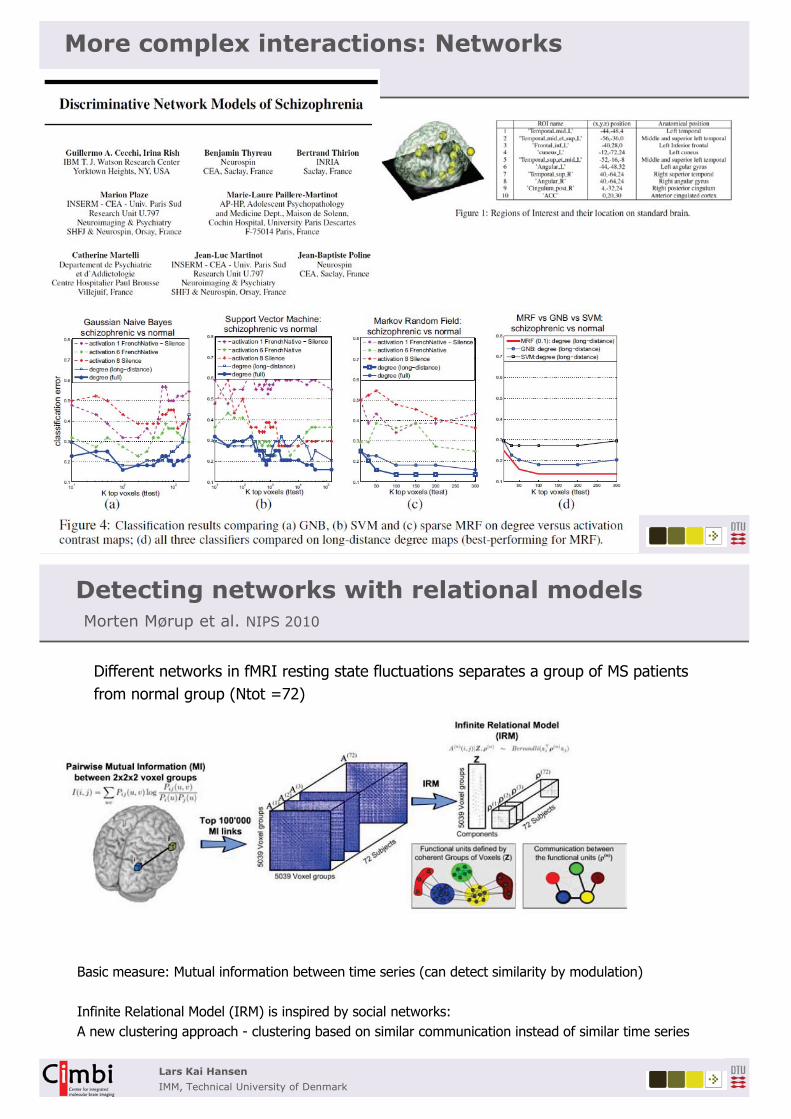
More complex interactions: Networks
NIPS 2009
Lars Kai HansenIMM, Technical University of Denmark
Detecting networks with relational modelsMorten Mørup et al. NIPS 2010
Basic measure: Mutual information between time series (can detect similarity by modulation)
Infinite Relational Model (IRM) is inspired by social networks:A new clustering approach - clustering based on similar communication instead of similar time series
Different networks in fMRI resting state fluctuations separates a group of MS patientsfrom normal group (Ntot =72)
Lars Kai HansenIMM, Technical University of Denmark
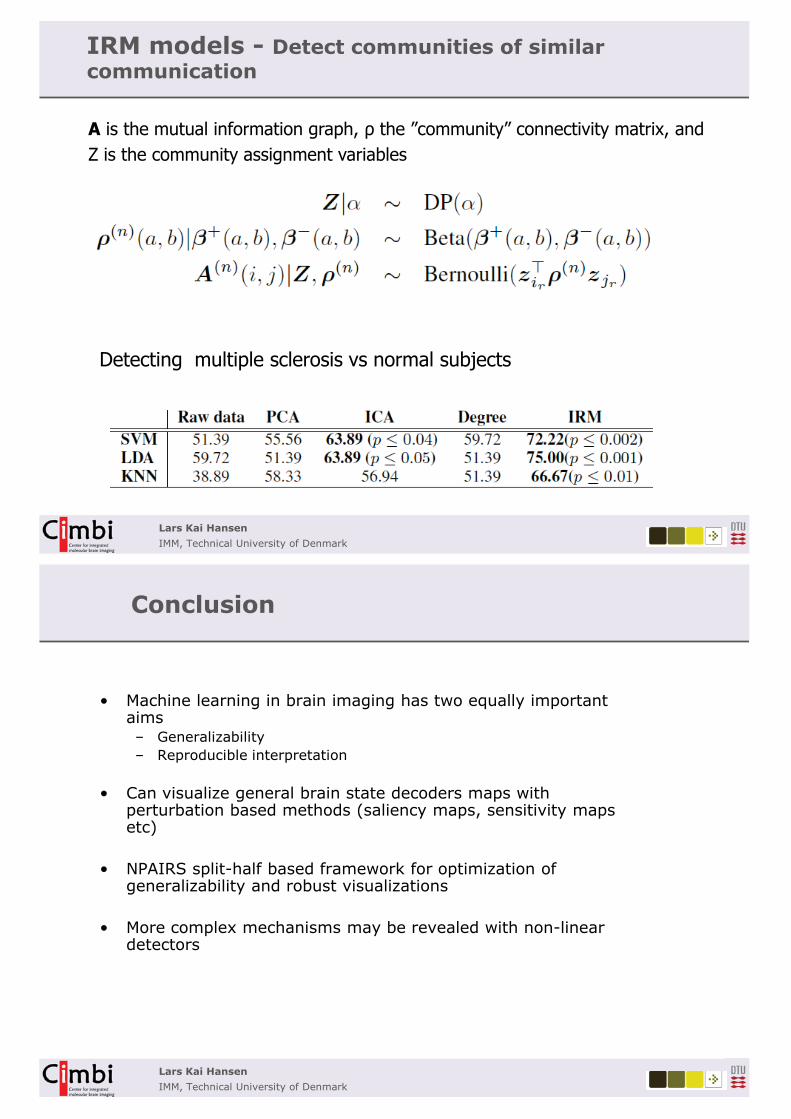
IRM models - Detect communities of similarcommunication
A is the mutual information graph, � the ”community” connectivity matrix, and Z is the community assignment variables
Detecting multiple sclerosis vs normal subjects
Lars Kai HansenIMM, Technical University of Denmark
Conclusion
• Machine learning in brain imaging has two equally important aims– Generalizability– Reproducible interpretation
• Can visualize general brain state decoders maps with perturbation based methods (saliency maps, sensitivity maps etc)
• NPAIRS split-half based framework for optimization of generalizability and robust visualizations
• More complex mechanisms may be revealed with non-linear detectors
Lars Kai HansenIMM, Technical University of Denmark
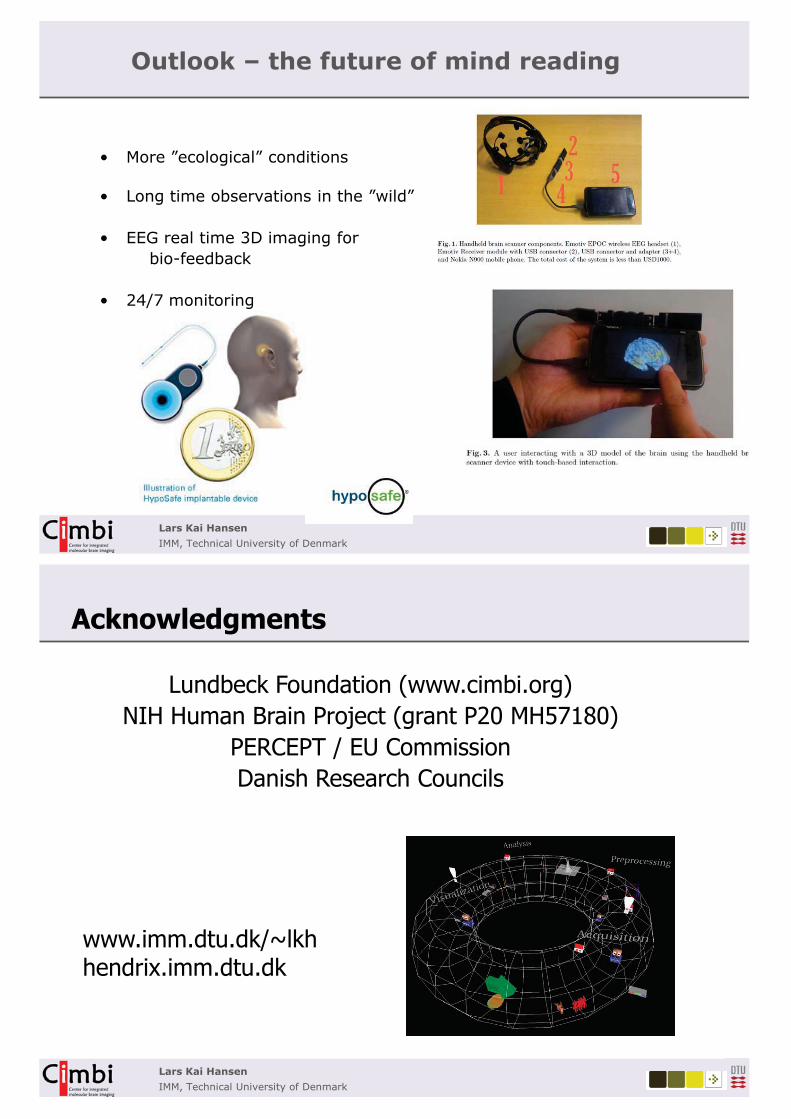
Outlook – the future of mind reading
• More ”ecological” conditions
• Long time observations in the ”wild”
• EEG real time 3D imaging for bio-feedback
• 24/7 monitoring
Lars Kai HansenIMM, Technical University of Denmark
Acknowledgments
Lundbeck Foundation (www.cimbi.org)NIH Human Brain Project (grant P20 MH57180)
PERCEPT / EU CommissionDanish Research Councils
www.imm.dtu.dk/~lkhhendrix.imm.dtu.dk
Lars Kai HansenIMM, Technical University of Denmark
Some references
• Mørch, N., Hansen, L., Strother, S., Svarer, C., Rottenberg, D., Lautrup, B., (1997). Nonlinear vs. linear models in functional neuroimaging: learning curves and generalization crossover. In Proc. IPMI 1997. Vol. Springer Lecture Notes in Computer Science 1230, pp. 259–270.
• Mørch, N., Kjems, U., Hansen, L., Svarer, C., Law, I., Lautrup, B., (1995). Visualization of neural networks using saliency maps. In:Proceedings of the 1995 IEEE Int. Conf. on Neural Networks. Vol. 4 (pp. 2085–2090).
• Hansen, L. K., Paulson, O. B., Larsen, J., Nielsen, F. A., Strother, S. C., Rostrup, E., et al. (1999). Generalizablepatterns in neuroimaging: how many principal components? NeuroImage, 9, 534–544.
• Kjems, U., Hansen, L. K., & Strother, S. C. (2000). Generalizable singular value decomposition for ill-posed datasets. In NIPS (pp. 549–555).
• Hansen L.K., F.AA. Nielsen, S.C. Strother, N. Lange Consensus Inference in Neuroimaging, NeuroImage 13 1212-1218, (2001).
• Kjems, U., Hansen, L., Anderson, J., Frutiger, S., Muley, S., Sidtis, J., et al. (2002). The quantitative evaluation of functional neuroimaging experiments: Mutual information learning curves. NeuroImage, 15(4), 772–786.
• McKeown, M., Hansen, L. K., & Sejnowski, T. J. (2003). Independent component analysis for fMRI: What is signal and what is noise? Current Opinion in Neurobiology, 13(5), 620–629.
• Strother, S., Anderson, J., Hansen, L., Kjems, U., et al. (2002). The quantitative evaluation of functional neuroimaging experiments: The NPAIRS data analysis framework. NeuroImage,15(4), 747–771.
• P. Mondrup Rasmussen, K.H. Madsen, T.E. Lund, L.K. Hansen. (2011) Visualization of nonlinear kernel models in neuroimaging by sensitivity maps. NeuroImage 55(3):1120-1131.
• Trine Julie Abrahamsen, Lars Kai Hansen. (2011). A Cure for Variance Inflation in High Dimensional Kernel Principal Component Analysis. Journal of Machine Learning Research (to appear).