Embed Size (px)
Citation preview

Do Nonprofit Hospitals Provide Less Charity Care When Faced with Financial Losses?
G. Nathan Dong*
Columbia University
April 30, 2017
ABSTRACT
This paper studies the impact of financial loss on the provision of social or merit goods by
nonprofit hospitals. Specifically, it estimates the effect of the sharp reduction in hospital net
income following the 2008 financial crisis on the supply of charity care. Using a quasi-
experimental design with both matched and unmatched control groups, we find that hospital
income is not predictive of changes in uncompensated care provision at the hospital level (i.e.,
individual hospitals use their financial surplus to provide uncompensated care) over the period
2007-2008. Given the fact that the market structure of the health services industry did not
change, at least in the near term, this evidence suggests that holding constant the crowding-out
effect there is no income effect on the supply of charity care. Additionally, from the results of
instrumental variable (IV) regressions, hospitals with less Medicare revenue, higher financial
risk, lower operating efficiency, higher labor costs, and being located in rural areas are
associated with more uncompensated care expenses. Finally, we note that the evidence of the
relationship between charity care and hospital size and asset liquidity is mixed.
Keywords: hospital income, uncompensated care, charity care, income effect
JEL Codes: I11, I18, L30
_____________________________________________________________ * Dept. of Health Policy & Management, Mailman School of Public Health, Columbia University. 722 W 168th Street, New York, NY 10032. Tel: 212-342-0490. E-mail: [email protected]. We thank participants at the International Industrial Organization Conference (Boston) and Renata Kosova (discussant) for helpful comments. No potential conflict of interest relevant to this article was reported.

2
California’s more than 200 non-profit hospitals claim billions of dollars in federal and
state tax exemptions annually. In exchange for that tax relief, they’re required to offer
free and discounted health care for the poor.... Non-profits don’t distribute earnings to
shareholders like for-profit hospitals do and instead plow them back into the organization.
But critics argue that in most other ways, non-profit hospitals are more like businesses
than charities and don’t deserve the breaks.
− California Health Report, June 25, 20141
I. INTRODUCTION
Nonprofit hospitals play an important role in providing public goods in the form of community
services to the poor and uninsured, also known as charity care or uncompensated care, and the
amount of charity care provided varies greatly across nonprofit hospitals (Norton and Staiger
1994; Seidman and Pollock 1991; U.S. General Accounting Office 1991).2 Previous studies have
identified two factors explaining the substantial heterogeneity in the degree to which hospitals
provide charity care: income effect (e.g., Frank et al. 1990) and crowding-out effect (by public
hospitals, e.g., Frank and Salkever 1991). 3 Those empirical studies analyzing the relation
between hospital income and charity care provision, however, provide mixed evidence to
support the “income effect” hypothesis (e.g., Frank and Salkever 1991; Thorpe and Phelps 1991;
Rosko 2004). The endogenous nature of hospital financial performance and the supply of
uncompensated care has limited our understanding of even the most basic questions: do
nonprofit hospitals use their financial income to fund certain unprofitable but socially desirable
services? For instance, in equilibrium it is indeed difficult to distinguish if hospitals earning
higher profits provide more indigent care services with tax-exempt dollars or providing less
uncompensated care actually improve financial performance (by cutting costs), or hospitals
respond to increased competition by reducing their supply of charity care. Two potential
confounding issues that need to be resolved in order to provide clear evidence: The first is to
separate the income effect from the crowding-out effect; and the second is to rule out the
existence of reverse causality.
The research approach that is proposed here is to focus on the effect of the change of
hospital income on the supply of charity care in a short period of time so that market structure
1 Excerpt from Urevich (2014). 2 Not all services provided by nonprofit hospitals are considered public goods in the classic economic sense, although many of them are worthwhile to the public (Vladeck 2006, Hansmann 1980). 3 Also see Abrams and Schmitz (1978) for general theory of government crowding out the supply of private charity.

3
is unlikely to change (i.e., the crowding-out effect is small), and hopefully to obtain a more
validated result. The ideal research design would be a natural experiment that assigns hospitals
randomly to two different groups. The hospitals in the treatment group would be “forced” to
experience financial difficulties that result in lower incomes within a year, and the control
group would not. These hospitals would then be followed through the period of experiment
with a variety of parameters being measured to relate financial income to indigent care
expenses. However, the immeasurable complexity of planning, extensive costs of
implementation, the need for sophisticated coordination and restrictive access to financial
market often make the experimental design an impossible alternative.
Since this type of randomized experiment is not feasible, our solution to this evaluation
problem is to use an exogenous event or a “shock” that caused sharp differential changes in
financial income across hospitals within a narrow time frame to identify the income effect on
charity care provision. The shock in this paper is the sharp decline in financial income during
the Great Recession in 2008 that has weakened the financial stability of almost all corporations
and institutions in the economy, and hospitals are no exception. The financial crisis of 2008 not
only put a major dent in hospital income as a result of the reduction in health care spending
(Martin et. al. 2011), but also led to a slowdown in growth of funding to improve health in
many other countries, which was not anticipated by these health services providers (Leach-
Kemon, et. al. 2012). Figure 1 shows the time series of average net income (scaled by total assets)
of all for-profit firms that are publicly traded on the U.S. stock market from 2005 to 2010. The
number on top of each bar represents the percentage of total assets that for-profit firms use to
generate financial profits on average in each year. Before the financial crisis in 2008, this ratio of
income to assets was generally positive (1.13% in 2005, 1.06% in 2006, 0.65% in 2007), but turned
to negative after the crisis (-1.28% in 2008 and -0.76% in 2009) before it bounced back to normal
in 2010 (0.77%).4
[Insert Figure 1 Here]
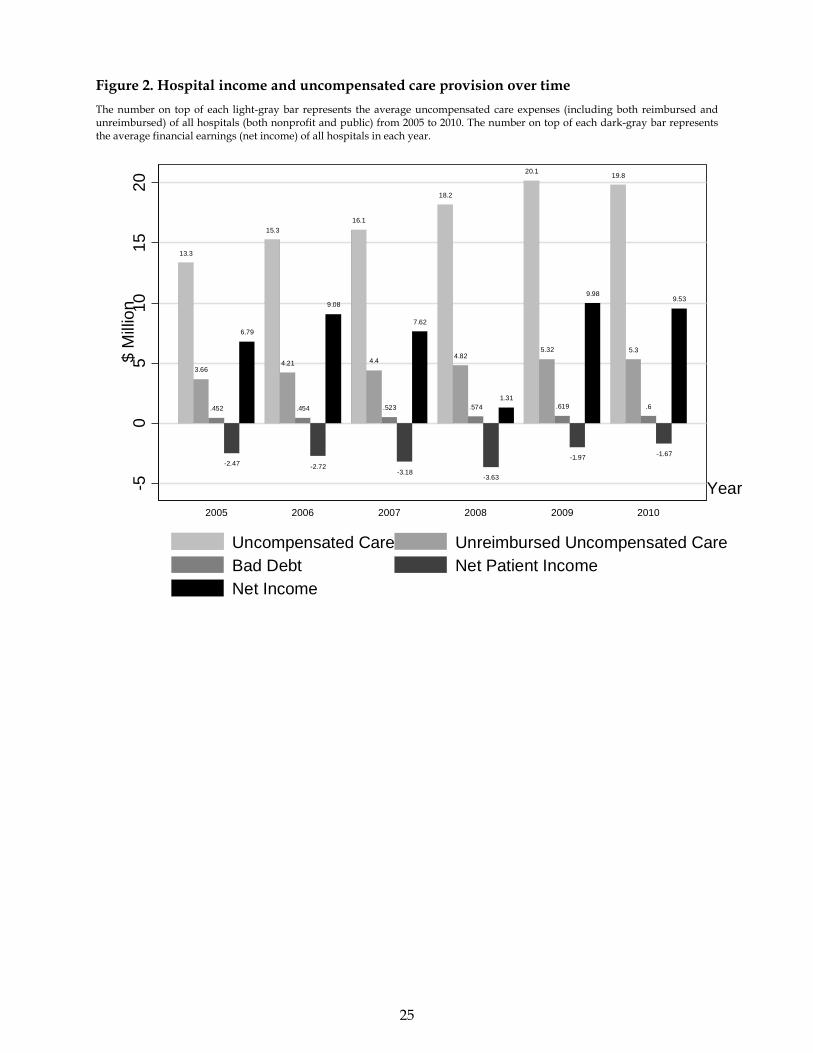
Yet, a similar decline is evidenced for hospitals with a significant drop in both the net
patient service income and the total net income, often known as the Excess of Revenue over
Expenses or the Change in Net Assets for nonprofit hospitals. The difference between these two
measures of hospital financial income is non-operating income. The numbers on top of the two
4 The data is from the Compustat database of Standard & Poor’s.
4
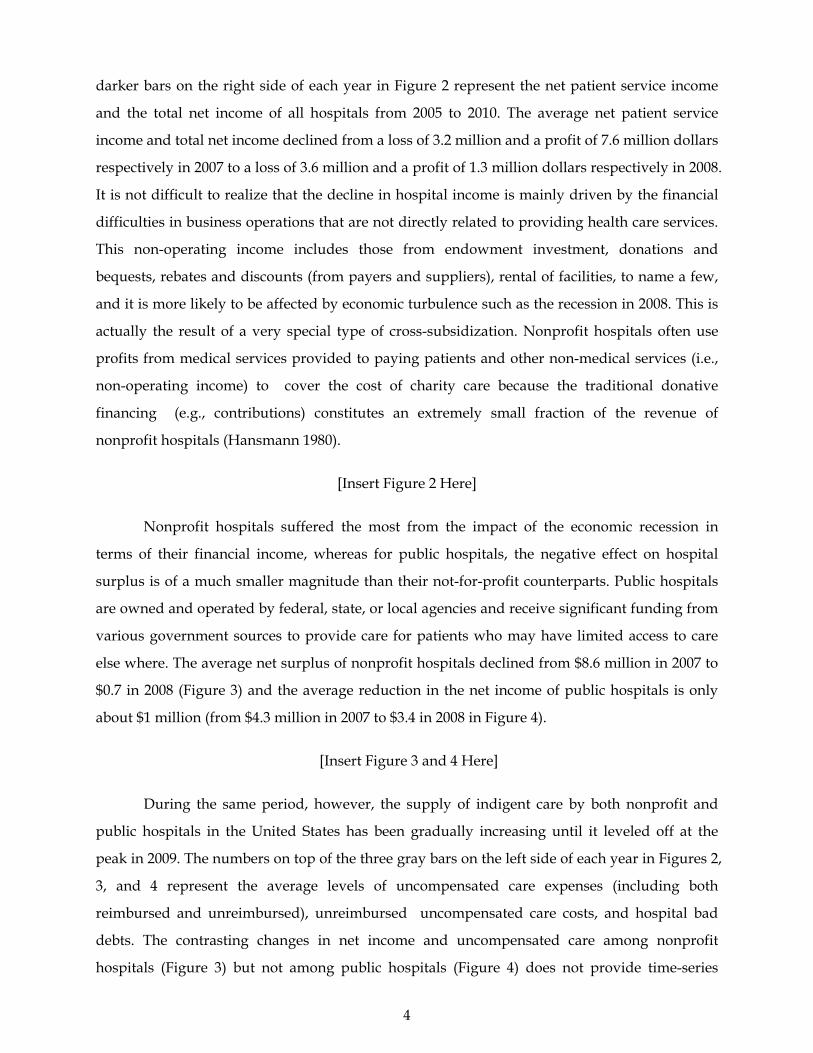
darker bars on the right side of each year in Figure 2 represent the net patient service income
and the total net income of all hospitals from 2005 to 2010. The average net patient service
income and total net income declined from a loss of 3.2 million and a profit of 7.6 million dollars
respectively in 2007 to a loss of 3.6 million and a profit of 1.3 million dollars respectively in 2008.
It is not difficult to realize that the decline in hospital income is mainly driven by the financial
difficulties in business operations that are not directly related to providing health care services.
This non-operating income includes those from endowment investment, donations and
bequests, rebates and discounts (from payers and suppliers), rental of facilities, to name a few,
and it is more likely to be affected by economic turbulence such as the recession in 2008. This is
actually the result of a very special type of cross-subsidization. Nonprofit hospitals often use
profits from medical services provided to paying patients and other non-medical services (i.e.,
non-operating income) to cover the cost of charity care because the traditional donative
financing (e.g., contributions) constitutes an extremely small fraction of the revenue of
nonprofit hospitals (Hansmann 1980).
[Insert Figure 2 Here]
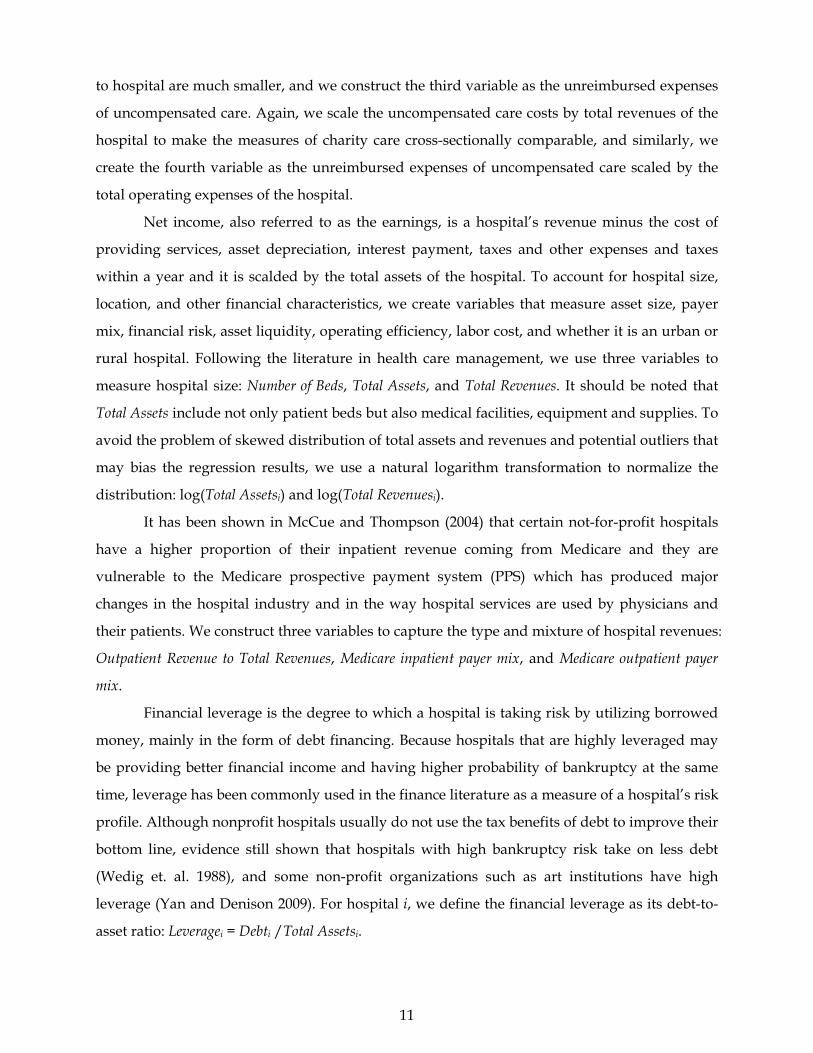
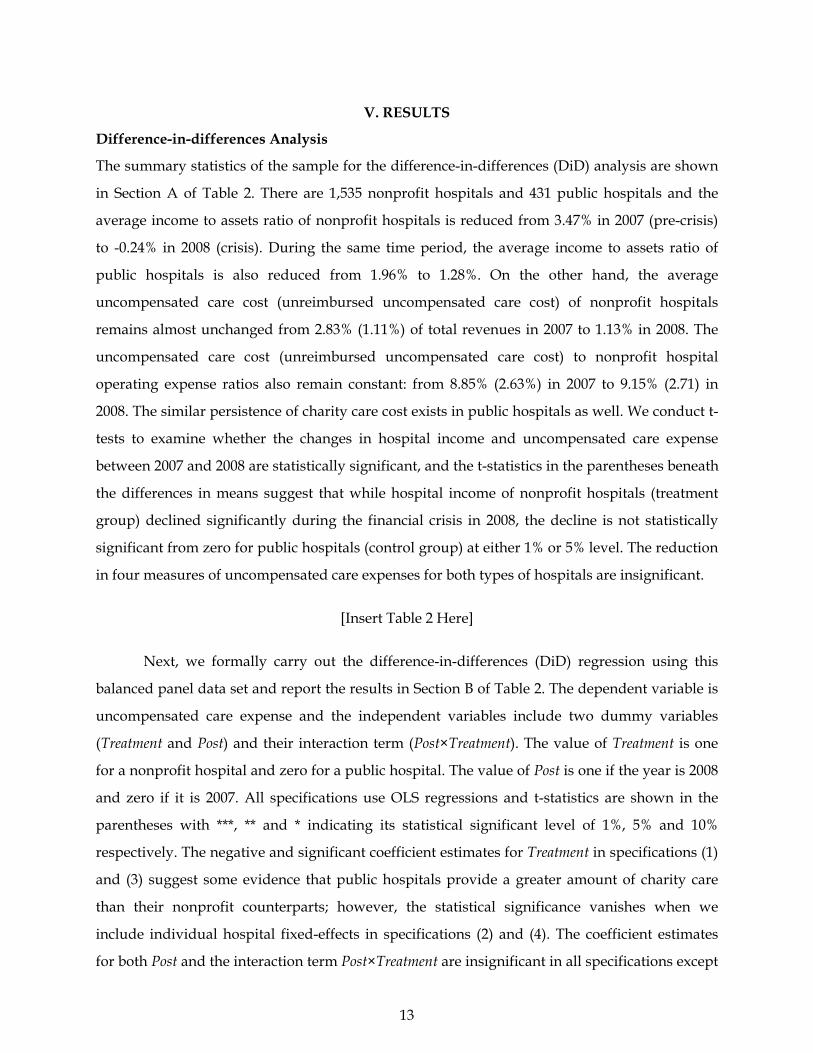
Nonprofit hospitals suffered the most from the impact of the economic recession in
terms of their financial income, whereas for public hospitals, the negative effect on hospital
surplus is of a much smaller magnitude than their not-for-profit counterparts. Public hospitals
are owned and operated by federal, state, or local agencies and receive significant funding from
various government sources to provide care for patients who may have limited access to care
else where. The average net surplus of nonprofit hospitals declined from $8.6 million in 2007 to
$0.7 in 2008 (Figure 3) and the average reduction in the net income of public hospitals is only
about $1 million (from $4.3 million in 2007 to $3.4 in 2008 in Figure 4).
[Insert Figure 3 and 4 Here]
During the same period, however, the supply of indigent care by both nonprofit and
public hospitals in the United States has been gradually increasing until it leveled off at the
peak in 2009. The numbers on top of the three gray bars on the left side of each year in Figures 2,
3, and 4 represent the average levels of uncompensated care expenses (including both
reimbursed and unreimbursed), unreimbursed uncompensated care costs, and hospital bad
debts. The contrasting changes in net income and uncompensated care among nonprofit
hospitals (Figure 3) but not among public hospitals (Figure 4) does not provide time-series

5
evidence to support the income effects. In other words, financial pressure may not reduce the
supply of indigent care by squeezing nonprofit hospital profit margins. It is important to
recognize that the recession of 2008 did not originate in the health care sector, hence it makes
possible to use this event as a natural experiment on the hospitals and to establish an economic
link from shocks in the financial market to financial difficulties in the health care sector that
may result in changes in hospital behavior in providing basic health services to the uninsured.
To estimate the cross-sectional effect of this exogenous income shock induced by the
financial crisis in 2008 on the provision of charity care, we collect financial accounting statement
data from the Medicare Cost Report and use a difference-in-differences (DiD) framework to
analyze this comprehensive data set. The DiD method removes both a common time trend and
persistent differences between the treatment and control groups. The treatment group consists
of nonprofit hospitals and the control group consists of public hospitals. The treatment is the
2008 recession when both for-profit and nonprofit businesses (including hospitals) experienced
a large decline in financial income. Public hospitals in the U.S. play an important role in the
health care safety net and usually located in inner cities or remote rural areas to provide care for
patients who may have limited access to care and are unable to pay for services. Public hospitals
differ substantially from nonprofit hospitals because of their soft budget constraints. They
depend heavily on direct government payments supplied by local, state, and federal agencies
(e.g., Medicaid) or on grants from local governments. Medicaid is a program run by both the
state and federal government for the provision of health care insurance to persons younger than
sixty-five years of age who cannot afford to pay for private health insurance. The federal
government matches the states’ contribution to provide a certain minimal level of available
coverage, and the states may offer additional services at their own expense.
We will compare the changes in the supply of uncompensated care in nonprofit
hospitals whose large reductions in income to the changes in public hospitals with small or no
income reductions. This quasi-experimental research design provides a more credible basis for
evaluating the income effect on the supply of indigent care than those used in previous studies.
The conventional cross-sectional estimates are very sensitive to specification and provide little
evidence of a systematic relationship. Based on the research design of this study, however, we
find no evidence that the exogenous worsening of hospital income caused by the financial crisis
in 2008 actually led to a statistically significant reduction in hospitals’ supply of charity chare.
Following the crisis, nonprofit hospitals experienced, on average, a five percent reduction of
return on assets (income divided by total assets), whereas the reduction is almost zero for public

6
hospitals. During the same time period, hospitals of both types did not change the levels of
uncompensated care provided to the uninsured. Our results are robust to the matched sample
analysis.
We also conduct instrumental variable (IV) regressions using a sample containing only
nonprofit hospitals and also find no evidence of income effect. Just as importantly, the
estimated (zero) impact of hospital income is remarkably stable across a variety of specifications.
For example, the estimates are insensitive to the inclusion of many, detailed covariates as
controls. In addition, there is some evidence that hospitals of smaller size, less revenue from
outpatients and Medicare patients, higher labor costs, and being located in rural areas provide
more uncompensated health care services. Overall, we contribute to this literature by providing
empirical evidence for how nonprofit hospitals respond to income shocks in terms of charity
care provision.
The remainder of the paper is organized as follows. Section II reviews the relevant prior
research on the supply of charity care by nonprofit hospitals in the United States. Section III
illustrates the empirical strategy. Section IV presents the sample data and measurement choice.
Section V evaluates the results. Section VI conducts robustness checks. Section VII discusses the
limitations and concludes.
II. RELATED LITERATURE
The prior studies of hospital behavior are based on the premise that nonprofit hospitals
maximize an objective function that values profit and to some degree the provision of a mission
good that can be envisioned as services, free of charge, to the community subject to budget
constraint that is conditional on input prices, costs and legal requirements (Banks, Paterson and
Wendel 1997; Davidoff et. al. 2000a; Mann et. al. 1995; Lo Sasso and Seamster 2007). Obviously
charity care is part of the mission good because providing uncompensated care reflects the
underlying need for health services among the poor and uninsured. For example, in modeling
private hospital decisions about the provision of indigent care in the community, Frank and
Salkever (1991) assume a nonprofit hospital’s utility function depends on net revenues and the
level of unmet need for charity care subject to a financial break-even constraint. Their model
suggests that a decline in hospital income resulting from exogenous price reductions, holding
total need for charity care constant, would lead nonprofit hospitals to reduce their supply of
uncompensated care for the poor and needy. Specifically in the context of this research, if the
earnings declined after the financial crisis in 2008, nonprofit hospitals would adjust their

7
activities to satisfy their break-even constraints. They might substitute care for other types of
patients and thus reduce care for low-income and uninsured patients. On the other hand,
financial subsidies from Medicaid, federal, state and local government and charity
organizations might be able to offset the potential negative effects of income shocks
(Needleman 2001). Given this, we hypothesize that nonprofit hospitals will reduce their supply
of charity care in response to the loss of income, all other things being equal.
Our study is closely related to two threads of literature. The first relevant body of
literature is on the effect of income changes induced by public payment policies on hospital
uncompensated care provision. For example, Sheingold and Buchberger (1986) and Campbell
and Ahern (1993) examine changes in hospital uncompensated care provision in response to the
Medicare prospective payment system (PPS) and conclude that the new payment system
affected hospital resources available to provide uncompensated care. Lo Sasso and Seamster
(2007) investigate the effect of changes in statewide Medicaid disproportionate share hospital
spending on uncompensated care between 1990 and 2000, but do not find a relationship
between the two. Davidoff et al. (2000b) examine the effect of changing state Medicaid payment
generosity, which in part reflected increased disproportionate share hospital payments to
providers, on uncompensated care provision, and report a positive association between these
measures for nonprofit hospitals. Similar evidence of income effect is reported in Hsieh and
Bazzoli (2012) which uses data on California hospital from 1996 to 2003. Bazzoli et al. (2006)
study the effects of declining Medicaid payment resulting from the Balanced Budget Act (BBA)
of 1997 and suggest that core safety-net hospitals reduced their supply of uncompensated care
in response to this financial pressure.
There is also some evidence from state policies. Thorpe and Phelps (1991) find that
increased uncompensated care payment rates in New York state were positively associated with
hospital uncompensated care provision, whereas Dunn and Chen (1994) do not find evidence of
such relationship between New Jersey’s state diagnosis-related groups (DRGs) reimbursement
reform and hospital uncompensated care. Such relationship, however, is later reported in
Gaskin (1997) that hospital uncompensated care provision was positively affected by the
initiation of the New Jersey Uncompensated Care Trust Fund. More interestingly, even facing
state laws mandating a minimum amount of indigent care to justify tax-exempt status,
nonprofit hospitals in Texas did not increase their supply of charity care (Kennedy et. al. 2010).
Our study is also closely related to a small but growing literature on the relationship
between specific financial conditions of nonprofit hospitals and their supply of charity care.

8
Smith et. al. (1995) develop a theoretical model and provide empirical evidence to support the
hypothesis that philanthropic donations as a source of hospital financing influences the
behavior of the nonprofit hospitals by forcing them to provide returns in the form of charity
care, education, research. Ferdinand et. al. (2014) report that community benefits provided by
hospital of different types increased over time and then leveled off during the start of the recent
economic downturn. Rosko (2001; 2004) examine private, nonprofit hospitals in Pennsylvania
and report conflicting evidence about the association between hospital profitability and the
provision of uncompensated care in two different time periods.
There are several gaps among these existing studies, which are relevant to our study.
First, most studies use hospital data in certain states, for example, California, New Jersey, New
York, and Texas, and so it is unclear how hospitals in other parts of the country will respond to
changes in financial income. Second, although the enactment of federal policies can be
considered exogenous shocks to hospitals, state policies can sometimes be endogenous. For
example, states with hospitals traditionally hesitate to provide indigent care are more likely to
pass laws to mandate minimum standard or to subsidize uncompensated care. Thus, the
specific effect of hospital earnings on the supply of uncompensated care is unclear. Our study
addresses these gaps.
III. EMPIRICAL METHODS
The basic specification of the DiD regression to estimate the effect of this hospital income shock
on its charity care provision is given by
, 0 1 2 3 ,2008 2008i t i t i t i ty Nonprofit Nonprofit
where yi,t is the uncompensated care measure provided by hospital i at time t; Nonprofiti is an
indicator for being a not-for-profit hospital; and 2008 is an indicator for year 2008. The Great
Recession of 2008-2009 profoundly influenced total health care spending and many consumers
decreased their use of health care services partly due to their loss of health insurance coverage
and declining household income (Martin et. al. 2011; Leach-Kemon, et. al. 2012). Our sample
consists of hospital financial statements in 2007 and 2008. We exclude the years before 2007 and
after 2008 to reduce the possibility of confounding from the impacts of other macroeconomic
shocks on hospital behavior.
The difference-in-differences estimate is given by β3, which measures the relative change
between the two types of hospitals over these two years; however, this estimate may be subject
to self-selection bias, i.e., unobserved heterogeneity in selection is correlated with unobserved

9
heterogeneity in the provision of charity care. For example, nonprofit hospitals may be
financially healthier than public hospitals because they are located in areas with more wealthy
patients and therefore nonprofit hospitals provide less charity care. We offer three different
empirical methods to deal with the worry that such correlation will bias the estimated effects:
within estimator, paired difference test, and comprehensive controls.
The first test uses the within estimator on a balanced panel of hospitals to difference out
hospital-level fixed effects:
, 1 2 3 ,2008 2008i t i i t i t i ty Nonprofit Nonprofit
where αi is the fixed effect for hospital i. Essentially this method demeans the level of charity
care expenses of each hospital (yi,t) by its average. Such identifying assumption of all
unobserved heterogeneity coming from hospital-specific fixed effects rather than correlation in
the unobservables driving both hospital financial characteristics and provision of charity care is
critical. According to Cameron and Trivedi (2005), if it is indeed the case that unobserved
hospital characteristics driving selection are independent of observables driving charity care
provision, the DiD regression with hospital-level fixed-effects on a balance panel will produce
consistent estimates. However, this assumption of identification can be violated if idiosyncratic
shocks to hospitals that drive both their financial condition and charity care provision.
The second test examines the differences in charity care provision based on a matched
sample. Matching is a widely used non-experimental method to evaluate the average effect of a
treatment or policy intervention. This method compares the outcomes (uncompensated care
expenses) of the hospitals that experienced financial difficulties with those of “matched”
hospitals that did not, where matches are chosen on the basis of similarity in observed
characteristics. Heckman et. al. (1998) describe the theory underlying matched sample
estimation in the context of labor economics and compare the mean post-program earnings of
job-training program participants with the mean earnings of comparable non-participants. In
this paper, we match nonprofit hospitals with public hospitals based on their location (state and
urban or rural), type (long-term, short-term, children, cancer, psychiatric, rehabilitation, etc.)
and size (number of beds and total assets). We are interested in comparing the average decline
in uncompensated care expenses of nonprofit hospitals with that of otherwise comparable
public hospitals and we attribute differences in the charity care provision of these two groups to
the differences in reduction of financial income.
The third empirical method is focused solely on the nonprofit hospitals. We use the 2008
recession to instrument for exogenous changes to hospital income following the financial crisis.

10
We also apply a comprehensive set of control variables in the 2SLS regressions to reduce
omitted variable bias, as well as the likelihood that our results are affected by optimal
differences endogeneity, in which different hospitals optimally “choose” different their financial
performance and supply charity care (self-selection bias). Besides hospital income, the
specifications include other covariates like hospital size (number of beds, total assets, total
revenues), revenue mix (outpatient, Medicare), financial risk (leverage), operating efficiency
(asset turnover, days sales outstanding), asset liquidity (current ratio, working capital, cash),
asset age, labor cost (salary), and location (urban or rural). Still, there might be differences
across hospital types, states, and even individual hospitals that are not captured by these
variables and that affect uncompensated care expense and hospital income simultaneously. This
may lead to biased and inconsistent parameter estimates; therefore, we add hospital type fixed-
effects and various combinations of state and hospital fixed-effects to address the heterogeneity
in different states and individual hospitals.
IV. DATA
The primary source of financial income, uncompensated care expenses and hospital
characteristics is the Medicare Cost Reports of the Centers for Medicare and Medicaid Services
(CMS). Several unique features of this data set facilitate the current study. First, every year
virtually all hospitals in the U.S. are required to file a cost report in order to receive
reimbursement from the federal government for treating Medicare patients. Second, the sample
covers various types of hospitals: not-for-profit, public, and for-profit. Third, the financial
information in the Cost Reports is more comprehensive and accurate than the previous ones
that use survey data, and it represents the whole hospital industry (Magnus and Smith 2000).
We construct four variables to measure the amount of charity care a hospital provides.
The first variable is the total expenses of uncompensated care including charity costs that are
covered by Medicaid, SCHIP, and state and local indigent care programs and other costs that
are unreimbursed, and the sum is scaled by the total revenue of the hospital. According to the
CMS, they are calculated using the hospital’s charge-to-charge ratio on the patient revenue
forgone. In this case, the hospital has determined that these patients are unable to pay for the
health services rendered by the hospital in a certain year. The second variable is the total
expenses of uncompensated care scaled by the total operating expenses of the hospital.
In most of the cases, hospitals receive reimbursement from Medicare, CHIPS, and state,
and local government programs for treating uninsured individuals; therefore, the “actual” costs
11
to hospital are much smaller, and we construct the third variable as the unreimbursed expenses
of uncompensated care. Again, we scale the uncompensated care costs by total revenues of the
hospital to make the measures of charity care cross-sectionally comparable, and similarly, we
create the fourth variable as the unreimbursed expenses of uncompensated care scaled by the
total operating expenses of the hospital.
Net income, also referred to as the earnings, is a hospital’s revenue minus the cost of
providing services, asset depreciation, interest payment, taxes and other expenses and taxes
within a year and it is scalded by the total assets of the hospital. To account for hospital size,
location, and other financial characteristics, we create variables that measure asset size, payer
mix, financial risk, asset liquidity, operating efficiency, labor cost, and whether it is an urban or
rural hospital. Following the literature in health care management, we use three variables to
measure hospital size: Number of Beds, Total Assets, and Total Revenues. It should be noted that
Total Assets include not only patient beds but also medical facilities, equipment and supplies. To
avoid the problem of skewed distribution of total assets and revenues and potential outliers that
may bias the regression results, we use a natural logarithm transformation to normalize the
distribution: log(Total Assetsi) and log(Total Revenuesi).
It has been shown in McCue and Thompson (2004) that certain not-for-profit hospitals
have a higher proportion of their inpatient revenue coming from Medicare and they are
vulnerable to the Medicare prospective payment system (PPS) which has produced major
changes in the hospital industry and in the way hospital services are used by physicians and
their patients. We construct three variables to capture the type and mixture of hospital revenues:
Outpatient Revenue to Total Revenues, Medicare inpatient payer mix, and Medicare outpatient payer
mix.
Financial leverage is the degree to which a hospital is taking risk by utilizing borrowed
money, mainly in the form of debt financing. Because hospitals that are highly leveraged may
be providing better financial income and having higher probability of bankruptcy at the same
time, leverage has been commonly used in the finance literature as a measure of a hospital’s risk
profile. Although nonprofit hospitals usually do not use the tax benefits of debt to improve their
bottom line, evidence still shown that hospitals with high bankruptcy risk take on less debt
(Wedig et. al. 1988), and some non-profit organizations such as art institutions have high
leverage (Yan and Denison 2009). For hospital i, we define the financial leverage as its debt-to-
asset ratio: Leveragei = Debti /Total Assetsi.

12
We use two variables to measure the asset liquidity, meaning the hospital’s ability to
pay short-term obligations (e.g., debt, payables) using its short-term assets (e.g., cash, inventory,
receivables). The first one is Current Ratioi = Current Assetsi /Current Liabilitiesi. A higher ratio
suggests that the hospital is more likely to make payments to its suppliers and creditors on time.
The second one is Days Cash On Hand represents the number of days of operating expenses that
a hospital can pay with its cash. When the Days Cash On Hand is low, the hospital needs to cut
back its spending or increase its fundraising.
We also construct several variables to control for hospital operating efficiency. Asset
Turnover, or Sales to Assets ratio, indicates how efficiently a hospital generates revenue on each
dollar of its total assets. It is defined as the total revenue divided by the total assets. Days Sales
Outstanding is a measure of the average number of days that a hospital takes to receive payment
from the payer (e.g., insurance company, patient, government, etc.) after providing health care
services to the patient. A higher Days Sales Outstanding number suggests a lower efficiency
because essentially the hospital is selling its services to customers on credit and taking longer to
get paid. Fixed Asset Age represents the approximate age of a hospital’s fixed assets. A larger
Fixed Asset Age means the hospital is depreciating or replenishing its assets in a slower pace.
From a different perspective in understanding operating efficiency, Vitaliano and Toren
(1994) attribute the inefficient operation of health care providers to excessive managerial and
supervisory personnel and diseconomies of size. Brown et. al. (2003) provide evidence that
labor costs in hospitals are a much greater portion of total costs than they are for many other
industries. Fisher et. al. (2006) suggest that executives see labor more as a cost than a profit-
driver. Because both wages and charity care expenses are costs to the hospitals, it can well be
the case that hospitals with higher labor costs provide smaller amount of uncompensated care
in order to maintain profit margins. To capture the wage effect on indigent care provision, we
take the total salaries from the hospital’s financial statement and scaled it by its total revenue to
create a new variable: Salary to Revenue.
Finally, to separate out location factors, we construct a dummy variable Urban with a
value of one if it is an urban hospital and zero if it is a rural hospital. Baldwin et. al. (2004)
document that patients in rural hospitals are more likely than their counterparts located in
urban areas to receive lower quality of care, possibly due to their remoteness from urban
centers. The detailed definition of all variables can be found in Table 1.
[Insert Table 1 Here]
13
V. RESULTS
Difference-in-differences Analysis
The summary statistics of the sample for the difference-in-differences (DiD) analysis are shown
in Section A of Table 2. There are 1,535 nonprofit hospitals and 431 public hospitals and the
average income to assets ratio of nonprofit hospitals is reduced from 3.47% in 2007 (pre-crisis)
to -0.24% in 2008 (crisis). During the same time period, the average income to assets ratio of
public hospitals is also reduced from 1.96% to 1.28%. On the other hand, the average
uncompensated care cost (unreimbursed uncompensated care cost) of nonprofit hospitals
remains almost unchanged from 2.83% (1.11%) of total revenues in 2007 to 1.13% in 2008. The
uncompensated care cost (unreimbursed uncompensated care cost) to nonprofit hospital
operating expense ratios also remain constant: from 8.85% (2.63%) in 2007 to 9.15% (2.71) in
2008. The similar persistence of charity care cost exists in public hospitals as well. We conduct t-
tests to examine whether the changes in hospital income and uncompensated care expense
between 2007 and 2008 are statistically significant, and the t-statistics in the parentheses beneath
the differences in means suggest that while hospital income of nonprofit hospitals (treatment
group) declined significantly during the financial crisis in 2008, the decline is not statistically
significant from zero for public hospitals (control group) at either 1% or 5% level. The reduction
in four measures of uncompensated care expenses for both types of hospitals are insignificant.
[Insert Table 2 Here]
Next, we formally carry out the difference-in-differences (DiD) regression using this
balanced panel data set and report the results in Section B of Table 2. The dependent variable is
uncompensated care expense and the independent variables include two dummy variables
(Treatment and Post) and their interaction term (Post×Treatment). The value of Treatment is one
for a nonprofit hospital and zero for a public hospital. The value of Post is one if the year is 2008
and zero if it is 2007. All specifications use OLS regressions and t-statistics are shown in the
parentheses with ***, ** and * indicating its statistical significant level of 1%, 5% and 10%
respectively. The negative and significant coefficient estimates for Treatment in specifications (1)
and (3) suggest some evidence that public hospitals provide a greater amount of charity care
than their nonprofit counterparts; however, the statistical significance vanishes when we
include individual hospital fixed-effects in specifications (2) and (4). The coefficient estimates
for both Post and the interaction term Post×Treatment are insignificant in all specifications except
14
(7), confirming the t-test results in Section A of Table 2 that nonprofit hospital facing temporary
financial shocks do not necessarily reduce their supply of uncompensated care.
Matched Sample Test
In this matched sample difference-in-differences analysis, we construct the control group by
match public hospitals to nonprofit hospitals in the treatment group based on their location
(state and urban or rural), type (long-term, short-term, children, cancer, psychiatric,
rehabilitation, etc.) and size (number of beds and total assets). The summary statistics of this
smaller sample for the difference-in-differences analysis are shown in Section A of Table 3.
There are 541 nonprofit hospitals and 227 public hospitals due to the fact that some public
hospitals serve as the placebo more than once in the control group. The average income to
assets ratio is 3.54% in 2007 and 0.02% in 2008 for nonprofit hospitals, and 0.79% in 2007 and
1.61% in 2008 for public hospitals. The t-statistics in the parentheses beneath the differences in
means suggest that nonprofit hospitals experienced a significant decline in income during the
recession, whereas the decline is not statistically significant for public hospitals. The reduction
in uncompensated care expenses measured using four different variables are insignificant for
both types of hospitals.
[Insert Table 3 Here]
Again, we conduct the difference-in-differences (DiD) regression using the balanced
panel data set and report the results in Section B of Table 3. The dependent variable is
uncompensated care expense and the independent variables include two dummy variables
(Treatment and Post) and their interaction term (Post×Treatment). The value of Treatment is one
for a nonprofit hospital and zero for a public hospital. The value of Post is one if the year is 2008
and zero if it is 2007. All specifications use OLS regressions and t-statistics are shown in the
parentheses with ***, ** and * indicating its statistical significant level of 1%, 5% and 10%
respectively. Similar to the results from the unmatched sample, the negative and significant
coefficient estimates for Treatment in specifications (1) and (3) suggest some evidence that public
hospitals provide a greater amount of charity care relative to their revenue than their nonprofit
counterparts, but the statistical significance disappears when we include individual hospital
fixed-effects in specifications (2) and (4). The coefficient estimates for the interaction term
Post×Treatment are insignificant at the 1% and 5% level for all specifications, confirming the t-

15
test results reported previously that nonprofit hospital facing temporary financial shocks do not
necessarily reduce their supply of uncompensated care.
Instrumental Variable Regression
In this IV regression analysis, we use the 2008 recession to instrument for exogenous changes to
hospital income following the financial crisis. We will be focused solely on nonprofit hospitals
and include a comprehensive set of control variables in the 2SLS regressions to reduce omitted
variable bias, as well as the likelihood that our results are affected by endogeneity in which
different hospitals optimally “choose” their financial performance and amount of charity care.
The summary statistics of all variables that will be included in the regressions are shown in
Section Table 4.
[Insert Table 4 Here]
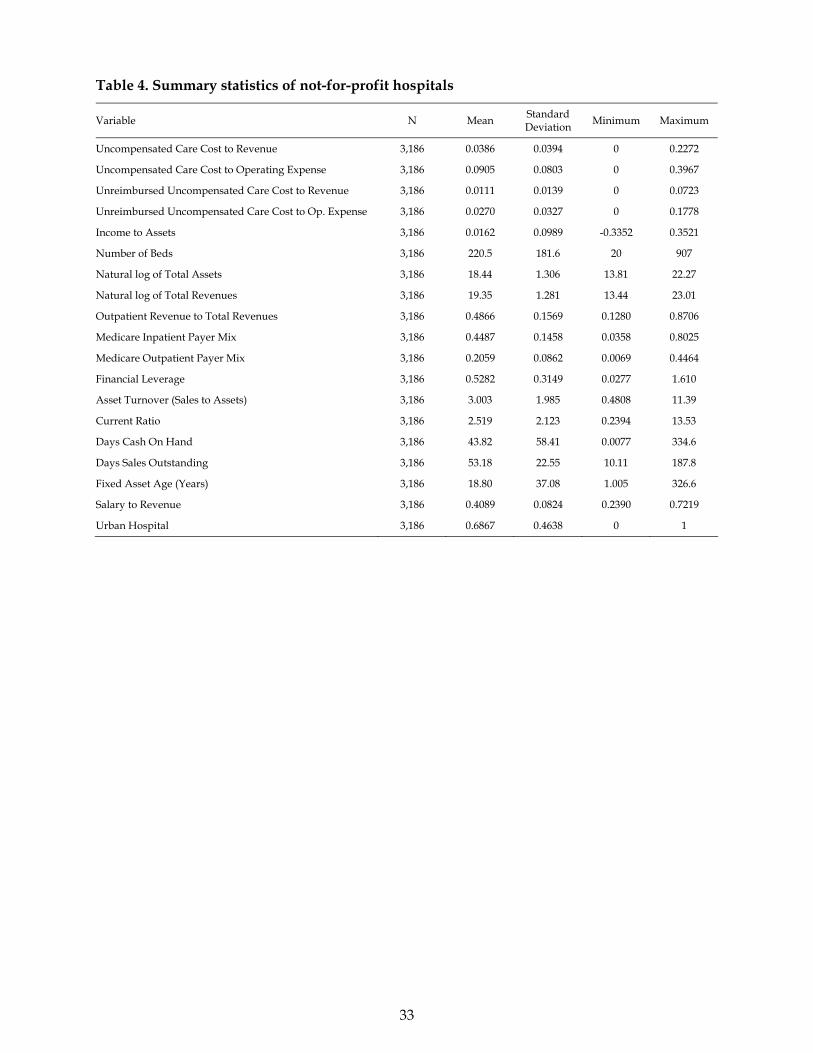
The average cost of uncompensated care is 3.86% (9.05%) of the hospital’s revenue
(operating expense) and the unreimbursed uncompensated care cost is 1.11% (2.70%) of the
hospital’s revenue (operating expense). The lower level of unreimbursed uncompensated care
cost than that of the total uncompensated care cost simply suggests that, on average, hospitals
are able to recover their costs of providing charity care from various government subsidy
programs. On the other hand, labor costs constitute a large portion, roughly 41%, of the revenue.
In this sample, more than two-third (69%) of hospitals are located in urban metropolitan areas
with on average 220 beds. The average hospital size is $102 million in total assets and $253
million in total revenues with almost half (49%) coming from outpatient services revenue.
Medicare payment accounts for about 45% of inpatient revenue and 21% of outpatient revenue.
The total liabilities of an average hospital are about 53% of its total assets. The highest financial
leverage of 161% suggests that some hospitals in our sample are in severe financial distress,
meaning their total liabilities are much larger than total assets (i.e., negative equities). The
average current ratio is 2.5 and it takes about 44 days for an average hospital to exhaust all of its
cash, 53 days to collect its revenue, and 19 years to replace its assets.
The Pearson’s correlations of the sample are reported in Table 5. An examination of the
correlation matrix indicates that correlations between independent variables are generally small.
This low correlation among the covariates helps prevent the problem of multicollinearity that
causes high standard errors and low significance levels when both variables are included in the
same regression. However, there are three pairs of independent variables related to hospital

16
size having correlations above or close to ±70%: Number of Beds and Total Assets (0.72), Number of
Beds and Total Revenues (0.77), and Total Assets and Total Revenues (0.88). To be cautious, we will
separate these pairs of variables in different regression specifications to avoid potential
multicollinearity problems.
[Insert Table 5 Here]
The negative and significant loading on the crisis dummy variable in the first-stage of
the regression reported in the first section of Table 6 suggests that hospital income declined
from 2007 to 2008. The second section of Table 6 provides the second-stage results of the
regression for the statistical relationship between total cost of uncompensated care and the
instrumented hospital income controlling for hospital size (number of beds, total assets, and
total revenues), revenue mix (outpatient revenue to total revenues, Medicare inpatient payer
mix, and Medicare outpatient payer mix), financial risk (leverage), operating efficiency (sales to
assets, days sales outstanding, and fixed asset age), asset liquidity (current ratio, working
capital to total assets, and days cash on hand), and costs (salary to revenue), whether the
hospital is located in an urban area, and hospital types (long-term, short-term, children, cancer,
psychiatric, rehabilitation, etc.) We use the number of beds to proxy for hospital size in
specifications (1), total assets in specifications (2), and total revenues in specifications (3). The
results of the first-stage regressions suggest that the financial crisis (year 2008 dummy) is
strongly predictive of decline in hospital income. In the second-stage regression, after
controlling for various hospital characteristics, the decline in hospital income induced by the
2008 financial crisis did not reduce the supply of charity care as measured by the total cost of
uncompensated care. Across all specifications, smaller hospitals (Total Assets and Total Revenues),
less outpatient revenue and Medicare payments in their revenues, higher financial liquidity
(Current Ratio), higher labor costs (Salary to Revenue), and being located in rural areas are
associated with higher costs of providing uncompensated care services (typically more charity
care services).
[Insert Table 6 Here]
Still, there might be differences across individual hospitals that are not captured by
these variables and that affect uncompensated care expenses and hospital income
simultaneously, and this may lead to biased and inconsistent parameter estimates. We add
hospital level fixed-effects with clustered standard errors on the hospital level and report the

17
results in specifications (4) to (6) of Table 6. In general the statistical significance vanishes for all
determinants when we include individual hospital fixed-effects. Next, we repeat this set of IV
regressions with three other measures of charity care provision on the left hand side: Total Cost
of Uncompensated Care to Operating Expense, Unreimbursed Uncompensated Care Cost to Revenue,
and Unreimbursed Uncompensated Care Cost to Operating Expense. The results reported in Tables 7,
8, and 9 are consistent with our findings in Table 6 except that the coefficients of outpatient
revenue to total revenue and salary to revenue become insignificant at the 5 percent level in
Table 8 and 9 where the dependent variable measures the unreimbursed cost of uncompensated
care.
[Insert Table 7, Table 8, Table 9 Here]
VI. ROBUSTNESS TEST
There are some concerns that we would like to address in this section. The first is the use of
income to assets as the measure of hospital income because this ratio also reflects how
effectively the hospital is converting its invested capital (both debt and equity) into financial
income. We construct an alternative measure of income by scaling the hospital income by its
total revenues: Income to Revenue, rather than by its total assets. Consistent with the results
reported in the previous section, we do not find any significant effect of hospital income on the
total cost of uncompensated care. The coefficient estimates of instrument variable is negative
and significant in the first stage of the regression, and the instrumented Income to Revenue does
not have significant, statistical power to predict the ratio of uncompensated care cost to revenue
in the second-stage of the regression as shown in specification (1) of Table 10. Similar results
using the ratios of uncompensated care cost to operating expense and unreimbursed
uncompensated care cost to revenue and operating expense can be found in specifications (2) to
(4).
[Insert Table 10 Here]
The second concern is the assumption of no change in the market structure of nonprofit
hospitals such that the Great Recession, along with the latest round of hospital consolidation
and closure, did not reduce the number of nonprofit hospitals or lead to an increase in charity
care provided by public hospitals over the period 2007-08 (i.e., crowding-out effects). If the

18
market concentration were increased in this sector, that would have also contributed to the
change in charity care over the crisis period because relatively fewer number of nonprofit
hospitals would need to supply more charity care that were supplied by those “closed”
hospitals, especially when public hospitals do not have enough resources to cope with the
increased demand for free care. Table 11 lists the total numbers of nonprofit and public
hospitals in each state and year. The number of nonprofit hospitals declined by 6 from 2,282 in
2007 to 2,276 in 2008 whereas the number of public hospitals increased by 23 from 946 in 2007 to
969 in 2008. Given the changes are of a small magnitude (–0.3% and +2.4% respectively), the
impact of competitive forces and crowding-out effects on the provision of charity care by
nonprofit hospitals is probably of a less concern in our study. It is worth noting that the
numbers of hospitals in this table are based on the entire sample of the Medicare Cost Report
without imposing data availability constraints. For example, hospital-year observations that do
not have detailed financial information were excluded from the samples used in the univariate
comparisons and regression analysis.
[Insert Table 11 Here]
Finally, the use of the costs of uncompensated care as the measure of charity care has its
limitations due to the concerns of managerial discretion in financial reporting and the practice
of selective disclosure. To verify that the results presented in the previous section are robust to
alternative measures of charity care, we construct a new variable Bad Debt that is unpaid dollar
amount for services rendered from a patient or third party payer for which the provider
expected payment. Overall, the average amount of hospital bad debts remains unchanged from
0.17 percent of total revenues in 2007 to 0.18 percent in 2008 and the difference is statistically
insignificant at 1 percent level. The bad debt to operating expense ratio also remain constant:
from 0.42 percent in 2007 to 0.43 percent in 2008. The similar persistence of charity care costs
exists in public hospitals as shown in Table 12.
[Insert Table 12 Here]
VII. DISCUSSION AND CONCLUSION
Nonprofit hospitals have a substantial share of the health care market in the United States,
accounting for almost 70% of all inpatient cases in acute care hospitals (Frank and Salkever
1994). With tax subsidy policies favorable to these non-for-profit organizations, they play an

19
important role to supply public services (often in charity medical care) under contract to
government. Though existing literature has identified financial income as an important
contributing factor that could lead to the substantial differences in the provision of such public
goods by nonprofit hospitals, the evidence of income effect in regards to whether hospitals
reduce their supply of charity care in response to the loss of income, however, is mixed, with
some studies pointing in the opposite direction.
The ideal research design to answer this question would be a double-blind, placebo-
controlled, longitudinal, natural experiment with hospitals being randomly assigned to the
treatment and control groups, and the treatment is given as a natural “shock” to financial
performance of the “treated” hospitals. Since this type of randomized experiment is not feasible,
in our attempt to address this question, we exploit a quasi-experiment in hospital profits caused
by an unprecedented exogenous change to hospital financial condition. We identify the
transmission mechanism from the exogenous change in hospital income to the behavior of
charity care provision while the health care market structure remains largely unchanged in a
short period of time, thus overcoming the identification and endogeneity issues (crowding-out,
self-selection and reverse causality) that have plagued previous studies.
In this study, we construct a new data set consisting of financial statements of all
hospitals in the United States in 2007 and 2008 and use the recent economic recession as natural
experiment to examine whether and to what extent an exogenous shortfall in hospital income
affects the supply of charity care. The great recession of 2008 not only put a major dent in
hospital income but also led to a slowdown in growth of funding to improve health in many
other countries, which was not anticipated by these health services providers. This paper
attempts to establish an economic link from shocks in the financial market to financial
difficulties in the health care sector that may result in changes in hospital behavior in providing
basic health services to the poor and needy.
Perhaps the most striking result from this research is a non-result: the lack of an
economic link between hospital financial condition and the supply of the mission good. The
decline in a hospital’s financial income did not cause it to reduce its spending on
uncompensated care. In fact, we show that the income effect on the supply of charity care are
indeed small in both difference-in-differences analysis and cross-sectional regressions after
controlling for hospital size, type, payer mix, asset liquidity, financial risk, operating efficiency,
and labor costs.

20
When interpreting the evidence presented in this paper, it is important to bear in mind
that our results rely on the critical assumption of the exogenous nature of the shock and the
exclusion restriction condition. But remember, this assumption is distinct from the claim that
the shock or instrument (economic recession in 2008) is as good as randomly assigned. Rather, it
is a claim about the unique channel for the effect of financial crisis on hospital income and, in
turn, on charity care provision. Still, it is possible that hospital managers are concerned about
the prolonged recession and cut uncompensated care as a precaution independent of the
current financial health of their hospitals. In addition, it can be argued that the amount of
charity care that a hospital can supply is difficult to adjust quickly to respond to changing
financial income and will therefore probably not be set at its cost-minimization or hospital
profit-maximization level. The answer to these concerns will depend on what alternative shocks
or instruments are more suitable. We will leave further exploration of this issue for future
research. Nevertheless, we believe the contribution of this paper to be complementary to
present work that mainly studies the cross-sectional correlations.

21
REFERENCE
Abrams, B.A. and Schmitz, M.D., 1978, The ‘Crowding-Out’ Effect of Governmental Transfers on Private Charitable Contributions, Public Choice 33, 29–39. Baldwin, L., R. MacLehose, G. Hart, S. Beaver, N. Every, and L. Chan, 2004, Quality of Care for Acute Myocardial Infarction in Rural and Urban US Hospitals, Journal of Rural Health 20, 99–108. Banks, D.A., M. Paterson, and J. Wendel, 1997, Uncompensated Hospital Care: Charitable Mission or Profitable Business Decision?, Health Economics 6, 133–143. Bazzoli, G.J., R.C. Lindrooth, R. Kang and R. Hasnain-Wynia, 2006, The Influence of Health Policy and Market Factors on the Hospital Safety Net, Health Services Research 41, 1159–1180. Brown, M., M. Sturman, and M. Simmering, 2003, Compensation Policy and Organizational Performance: The Efficiency, Operational, and Financial Implications of Pay Levels and Pay Structure, Academy of Management Journal 46, 752–762. Cameron, A.C. and P.K. Trivedi, 2005, Microeconometrics: Methods and Applications, Cambridge University Press, New York. Campbell, E.S. and M.W. Ahern, 1993, Have Procompetitive Changes Altered Hospital Provision of Indigent Care?, Health Economics 2, 281–289. Davidoff, A.J., A.B. Garrett, D. Makuc, and M. Schirmer, 2000a, Medicaid-Eligible Children Who Do Not Enroll: Health Status, Access to Care and Implications for Medicaid Enrollment, Inquiry 37, 203–218. Davidoff, A.J., A.T. LoSasso, G.J. Bazzoli, and S. Zuckerman, 2000b, The Effect of Changing State Health Policy on Hospital Uncompensated Care, Inquiry 37, 253-267. Dunn, D.L. and M. Chen, 1994, Uncompensated hospital care payment and access for the uninsured: evidence from New Jersey, Health Services Research 29, 113–130. Ferdinand, A.O., J.P. Epane, and N. Menachemi, 2014, Community Benefits Provided by Religious, Other Nonprofit, and For-profit Hospitals: A Longitudinal Analysis 2000-2009, Health Care Management Review 39, 145–153. Fisher, M., J. Krishnan, and S. Netessine, 2006, Retail Store Execution: an Empirical Study, University of Pennsylvania Working Paper. Frank, R.G. and D.S. Salkever, 1991, The Supply of Charity Services by Nonprofit Hospitals: Motives and Market Structure, RAND Journal of Economics 22, 430–445. Frank, R.G. and D.S. Salkever, 1994, Nonprofit Organization in the Health Sector, Journal of Economic Perspectives 8, 129–144. Frank, R.G., D.S. Salkever, and J. Mitchell, 1990, Market Forces and the Public Good: Competition Among Hospitals and Provision of Indigent Care, Advances in Health Economics and Health Services Research (Scheffler R. and L. Rossiter, eds.), JAI Press, Greenwich, CT.
22
Gaskin, D.J., 1997, Altruism or moral hazard: The impact of hospital uncompensated care pools, Journal of Health Economics 16, 397–416. Heckman J.J., H. Ichimura, and P. Todd, 1998, Matching As An Econometric Evaluation Estimator, Review of Economic Studies 65, 261-294. Kennedy, F.A., L.L. Burney, J.L. Troyer, and J.C. Stroup, 2010, Do Non-profit Hospitals Provide More Charity Care When Faced with a Mandatory Minimum Standard? Evidence from Texas, Journal of Accounting and Public Policy 29, 242–258. Hansmann, H.B., 1980, The Role of Nonprofit Enterprise, Yale Law Journal 89, 835–901. Hsieh, H.M. and G.J. Bazzoli, 2012, Medicaid Disproportionate Share Hospital Payment: How Does It Impact Hospitals’ Provision of Uncompensated Care, Inquiry 49, 254–267. Leach-Kemon K., D.P. Chou, M.P. Schneider, A. Tardif, J.L. Dieleman, B.P.C. Brooks, M. Hanlon, and C.J.L. Murray, 2012, The Global Financial Crisis Has Led To A Slowdown In Growth Of Funding To Improve Health In Many Developing Countries, Health Affairs 31, 228–235. Magnus, S. and D. Smith, 2000, Better Medicare Cost Report Data are Needed to Help Hospitals Benchmark Costs and Performance, Health Care Management Review 25, 65–76. Mann, J., Melnick, G., Bamezai, A., Zwanziger, J., 1995, Managing the safety net: hospital provision of uncompensated care in response to managed care, Advances in Health Economics and Health Services Research 15, 49–77. Martin, A., D. Lassman, L. Whittle, A. Catlin, and National Health Expenditure Accounts Team, 2011, Recession Contributes To Slowest Annual Rate Of Increase In Health Spending In Five Decades, Health Affairs 30, 11–22. Needleman, J., 2001, The Role of Nonprofits in Health Care, Journal of Health Politics, Policy and Law 26, 1113–1130. Norton, E.C. and D.O. Staiger, 1994, How Hospital Ownership Affects Access to Care for the Uninsured, RAND Journal of Economics 25, 171–185. Thompson, J.M. and M.J. McCue, 2004, Organizational and Market Factors Associated with Medicare Dependence in Inpatient Rehabilitation Hospitals, Health Service Management Research 17, 13–23. Rask, K.N. and K.J. Rask, 2000, Public Insurance Substituting for Private Insurance: New Evidence Regarding Public Hospitals, Uncompensated Care Funds, and Medicaid, Journal of Health Economics 19, 1–31. Rosko, M.D., 2001, Factors Associated with the Provision of Uncompensated Care in Pennsylvania Hospitals, Journal of Health and Human Services Administration 24, 352–379.

23
Rosko, M.D., 2004, The Supply of Uncompensated Care in Pennsylvania Hospitals: Motives and Financial Consequences, Health Care Management Review 29, 229–239. Seidman, R.L. and S.B. Pollock, 1991, Trends in Hospital Deductions from Revenue, Hospital Topics 69, 24–54. Sheingold, S. and T. Buchberger, 1986, Implications of Medicare's Prospective Payment System for the Provision of Uncompensated Hospital Care, Inquiry 23, 371-381. Smith, D.G., J.P. Clement, and J.R.C. Wheeler, 1995, Philanthropy and Hospital Financing, Health Services Research 30, 615–635. Thorpe, K.E. and C.E. Phelps, 1991, The Social Role of Not-for-profit Organizations: Hospital Provision of Charity Care, Economic Inquiry 29, 472–484. Urevich, R., 2014, Bill Requires Non-Profit Hospitals to Disclose Spending on Charity Care, California Health Report, June 25. U.S. General Accounting Office (GAO), 1991, Non-Profit Hospitals: Better Standards Needed for Tax Exemption, GAO-T-HRD-91-43. Vitaliano, D. and M. Toren, 1994, Cost and efficiency in nursing homes: a stochastic frontier approach, Journal of Health Economics 13, 281–300. Vladeck, B.C., Paying For Hospitals’ Community Service, 2006, Health Affairs 25, 34–43. Wedig, G., F.A. Sloan, M. Hassan, and M.A. Morrisey, 1988, Capital Structure, Ownership, and Capital Payment Policy: The Case of Hospitals, Journal of Finance 43, 21–40. Yan, W. and D. Denison, 2009, Revenue Structure and Nonprofit Borrowing, Public Finance Review 37, 47–67.

24
Figure 1. Financial income of all for-profit firms in the United States over time
The number on top of each bar represents the percentage of total assets that for-profit firms use to generate financial profits on average in each year from 2005 to 2010. Before the financial crisis in 2008, this ratio of return on assets (ROA) was generally positive (1.13% in 2005, 1.06% in 2006, 0.65% in 2007), but turned to negative after the crisis (-1.28% in 2008 and -0.76% in 2009) before it bounced back to normal in 2010 (0.77%).
.0113.0106
.0065
-.0128
-.0076
.0077
-.01
5-.
01-.
005
0.0
05
.01
Ret
urn
on
Ass
sets
(%
)
2005 2006 2007 2008 2009 2010
25
Figure 2. Hospital income and uncompensated care provision over time
The number on top of each light-gray bar represents the average uncompensated care expenses (including both reimbursed and unreimbursed) of all hospitals (both nonprofit and public) from 2005 to 2010. The number on top of each dark-gray bar represents the average financial earnings (net income) of all hospitals in each year.
13.3
3.66
.452
-2.47
6.79
15.3
4.21
.454
-2.72
9.08
16.1
4.4
.523
-3.18
7.62
18.2
4.82
.574
-3.63
1.31
20.1
5.32
.619
-1.97
9.98
19.8
5.3
.6
-1.67
9.53
-50
510
1520
$ M
illio
n
2005 2006 2007 2008 2009 2010
Year
Uncompensated Care Unreimbursed Uncompensated CareBad Debt Net Patient IncomeNet Income

26
Figure 3. Nonprofit Hospital income and uncompensated care provision over time
The number on top of each light-gray bar represents the average uncompensated care expenses (including both reimbursed and unreimbursed) of nonprofit hospitals from 2005 to 2010. The number on top of each dark-gray bar represents the average financial earnings (net income) of nonprofit hospitals in each year.
13.6
3.66
.478
-1.67
7.68
15.4
4.18
.469
-1.75
9.96
16.1
4.36
.544
-2
8.57
18.1
4.85
.593
-2.35
.703
20.4
5.31
.645
-.667
11.2
21.9
5.5
.626
-.649
11.3
-50
510
1520
$ M
illio
n
2005 2006 2007 2008 2009 2010
Year
Uncompensated Care Unreimbursed Uncompensated CareBad Debt Net Patient IncomeNet Income

27
Figure 4. Public hospital income and uncompensated care provision over time
The number on top of each light-gray bar represents the average uncompensated care expenses (including both reimbursed and unreimbursed) of public hospitals from 2005 to 2010. The number on top of each dark-gray bar represents the average financial earnings (net income) of public hospitals in each year.
12.4
3.66
.365
-5.16
3.8
14.6
4.31
.402
-6.19
5.92
15.8
4.51
.453
-7.29
4.28
18.2
4.71
.51
-7.99
3.39
19.2
5.36
.529
-6.47
5.94
12.3
4.62
.508
-5.25
3.39
-10
010
20$
Mill
ion
2005 2006 2007 2008 2009 2010
Year
Uncompensated Care Unreimbursed Uncompensated CareBad Debt Net Patient IncomeNet Income

28
Table 1. Variable definitions
Variable Name Definition
Uncompensated Care Cost to Revenue Total cost of uncompensated care ÷ Total revenue
Uncompensated Care Cost to Operating Expense Total cost of uncompensated care ÷ Operating expense
Unreimbursed Uncompensated Care Cost to Revenue Other unreimbursed cost of uncompensated care ÷ Total revenue
Unreimbursed Uncompensated Care Cost to Op. Expense Other unreimbursed cost of uncompensated care ÷ Operating expense
Income to Assets Net income ÷ Total assets
Number of Beds Number of all available beds
Natural log of Total Assets log (Total assets)
Natural log of Total Revenues log(Total revenues)
Outpatient Revenue to Total Revenues Total outpatient revenue ÷ Total revenue
Medicare Inpatient Payer Mix Medicare inpatient bed days ÷ Total inpatient bed days
Medicare Outpatient Payer Mix Outpatient Medicare charges ÷ Total outpatient charges
Financial Leverage Total liabilities ÷ Total assets
Asset Turnover (Sales to Assets) Revenue ÷ Total assets
Current Ratio Current assets ÷ Current liabilities
Working Capital To Total Assets (Current assets – Current liabilities) ÷ Total assets
Days Cash On Hand (Cash + Cash equivalents) × 365 ÷ Operating expenses
Days Sales Outstanding (Accounts receivable – Allowances for uncollectible) × 365 ÷ Revenue
Fixed Asset Age (Year) Accumulated depreciation ÷ Annual depreciation expense
Salary to Revenue Salary expense ÷ Revenue

29
Table 2. Difference-in-differences test
Section A. Difference-in-difference The test for changes in uncompensated care expenses from 2007 to 2008 is ∆UncompCare = UncompCare2008 − UncompCare2007. The test for changes in income to assets from 2007 to 2008 is ∆Income = Income2008 − Income2007. t-statistics are shown in the parentheses with ***, ** and * indicating its statistical significant level of 1%, 5% and 10% respectively.
Treatment Group Nonprofit Hospitals
Control Group Public Hospitals Variable Time Period
N Mean Difference N Mean Difference
Pre-treatment (2007) 1,535 0.0383 431 0.0500 Uncompensated Care Cost to Revenue
Treatment (2008) 1,535 0.0384
0.0001 (0.064)
431 0.0504
0.0004 (0.112)
Pre-treatment (2007) 1,535 0.0885 431 0.1027 Uncompensated Care Cost to Operating Expense
Treatment (2008) 1,535 0.0915
0.0030 (0.978)
431 0.1063
0.0036 (0.537)
Pre-treatment (2007) 1,535 0.0111 431 0.0176 Unreimbursed Uncompensated Care Cost to Revenue Treatment (2008) 1,535 0.0113
0.0002 (0.279) 431 0.0177
0.0001 (0.041)
Pre-treatment (2007) 1,535 0.0263 431 0.0369 Unreimbursed Uncompensated Care Cost to Operating Expense Treatment (2008) 1,535 0.0271
0.0008 (0.706) 431 0.0378
0.0009 (0.274)
Pre-treatment (2007) 1,535 0.0347 431 0.0196 Income to Assets
Treatment (2008) 1,535 -0.0024
-0.0371*** (-10.68) 431 0.0128
-0.0068 (-1.107)

30
Section B. DiD regression The dependent variable includes two different measures of uncompensated care costs. The independent variables include two dummy variables (Treatment and Post) and their interaction term (Post × Treatment). The value of Treatment is one for a nonprofit hospital and zero for a public hospital. The value of Post is one if the year is 2008 and zero if it is 2007. All specifications use OLS regressions. z-statistics are shown in the parentheses with ***, ** and * indicating its statistical significant level of 1%, 5% and 10% respectively.
Dependent Variable: Uncompensated Care
Cost to Revenue Uncompensated Care Cost to Op. Expense
Unreimbursed Uncompensated Care
Cost to Revenue
Unreimbursed Uncompensated Care Cost to Op. Expense
(1) (2) (3) (4) (5) (6) (7) (8)
Treatment (Nonprofit) -0.0162** (-2.45)
-0.00833 (-0.84)
-0.0204** (-2.03)
-0.0222 (-0.86)
-0.00356*** (-2.94)
-0.00487 (-1.14)
-0.00315 (-1.63)
-0.00902 (-0.95)
Post (2008) 0.000607
(0.39) 0.000855
(0.42) 0.00412 (1.47)
0.00440 (1.12)
0.000137 (0.12)
0.000318 (0.35)
0.00103 (0.45)
0.00145 (0.79)
Post × Treatment 0.0000298
(0.02) -0.000285
(-0.13) -0.000478
(-0.17) -0.000906
(-0.21) 0.0000110
(0.01) -0.000216
(-0.22) -0.000174
(-0.07) -0.000688
(-0.35)
Constant 0.0837*** (16.71)
0.0208*** (20.47)
0.125*** (16.88)
0.0736*** (37.55)
0.0354*** (35.60)
0.0164*** (35.70)
0.0547*** (35.64)
0.0584*** (63.93)
State Fixed-Effects Yes No Yes No Yes No Yes No
State-level Clustered SE Yes No Yes No Yes No Yes No
Hospital Fixed-Effects No Yes No Yes No Yes No Yes
Hospital-level Clustered SE No Yes No Yes No Yes No Yes
N 3,932 3,932 3,932 3,932 3,932 3,932 3,932 3,932
Adj. R-squared 0.104 0.836 0.124 0.818 0.161 0.827 0.156 0.831

31
Table 3. Matched sample difference-in-differences test
Section A. Difference-in-difference The treatment group consists of nonprofit hospitals and the control group consists of public hospitals that are matched to the nonprofit hospitals in the treatment group based on their location (state and urban or rural), type (long-term, short-term, children, cancer, psychiatric, rehabilitation, etc.) and size (number of beds and total assets). The test for changes in uncompensated care expenses from 2007 to 2008 is ∆UncompCare = UncompCare2008 − UncompCare2007. The test for changes in income to assets from 2007 to 2008 is ∆Income = Income2008 − Income2007. t-statistics are shown in the parentheses with ***, ** and * indicating its statistical significant level of 1%, 5% and 10% respectively.
Treatment Group Nonprofit Hospitals
Control Group Public Hospitals Variable Time Period
N Mean Difference N Mean Difference
Pre-treatment (2007) 541 0.0409 227 0.0617 Uncompensated Care Cost to Revenue
Treatment (2008) 541 0.0417
0.0008 (0.297)
227 0.0547
-0.0070 (-1.491)
Pre-treatment (2007) 541 0.1025 227 0.1333 Uncompensated Care Cost to Operating Expense
Treatment (2008) 541 0.1076
0.0051 (0.896)
227 0.1209
-0.0124 (-1.33)
Pre-treatment (2007) 541 0.0117 227 0.0193 Unreimbursed Uncompensated Care Cost to Revenue Treatment (2008) 541 0.0120
0.0003 (0.351) 227 0.0167
-0.0026 (-1.479)
Pre-treatment (2007) 541 0.0299 227 0.0416 Unreimbursed Uncompensated Care Cost to Operating Expense Treatment (2008) 541 0.0314
0.0015 (0.703) 227 0.0364
-0.0052 (-1.370)
Pre-treatment (2007) 541 0.0354 227 0.0079 Income to Assets
Treatment (2008) 541 0.0002
-0.0352** (-6.132) 227 0.0161
0.0082 (1.124)

32
Section B. DiD regression The dependent variable includes two different measures of uncompensated care costs. The independent variables include two dummy variables (Treatment and Post) and their interaction term (Post × Treatment). The value of Treatment is one for a nonprofit hospital and zero for a public hospital. The value of Post is one if the year is 2008 and zero if it is 2007. All specifications use OLS regressions. z-statistics are shown in the parentheses with ***, ** and * indicating its statistical significant level of 1%, 5% and 10% respectively.
Dependent Variable: Uncompensated Care
Cost to Revenue Uncompensated Care Cost to Op. Expense
Unreimbursed Uncompensated Care
Cost to Revenue
Unreimbursed Uncompensated Care Cost to Op. Expense
(1) (2) (3) (4) (5) (6) (7) (8)
Treatment (Nonprofit) -0.0207* (-1.94)
-0.0104*** (-4.04)
-0.0308* (-1.83)
-0.0445*** (-9.45)
-0.00758** (-2.29)
-0.00972*** (-11.43)
-0.0116* (-1.95)
-0.0245*** (-13.18)
Post (2008) -0.00529 (-1.01)
-0.00258 (-0.52)
-0.00628 (-0.91)
0.0000748 (0.01)
-0.00356 (-1.19)
-0.00174 (-1.06)
-0.00708 (-1.17)
-0.00322 (-0.90)
Post × Treatment 0.00609 (1.16)
0.00332 (0.65)
0.0114 (1.65)
0.00492 (0.52)
0.00385 (1.24)
0.00201 (1.18)
0.00854 (1.37)
0.00464 (1.25)
Constant 0.0389***
(5.91) 0.0314*** (12.56)
0.102*** (10.36)
0.0831*** (18.59)
0.0239*** (10.33)
0.00959*** (11.76)
0.0668*** (16.08)
0.0237*** (13.31)
State Fixed-Effects Yes No Yes No Yes No Yes No
State-level Clustered SE Yes No Yes No Yes No Yes No
Hospital Fixed-Effects No Yes No Yes No Yes No Yes
Hospital-level Clustered SE No Yes No Yes No Yes No Yes
N 1,536 1,536 1,536 1,536 1,536 1,536 1,536 1,536
Adj. R-squared 0.120 0.583 0.152 0.642 0.154 0.683 0.166 0.659
33
Table 4. Summary statistics of not-for-profit hospitals
Variable N Mean Standard Deviation
Minimum Maximum
Uncompensated Care Cost to Revenue 3,186 0.0386 0.0394 0 0.2272
Uncompensated Care Cost to Operating Expense 3,186 0.0905 0.0803 0 0.3967
Unreimbursed Uncompensated Care Cost to Revenue 3,186 0.0111 0.0139 0 0.0723
Unreimbursed Uncompensated Care Cost to Op. Expense 3,186 0.0270 0.0327 0 0.1778
Income to Assets 3,186 0.0162 0.0989 -0.3352 0.3521
Number of Beds 3,186 220.5 181.6 20 907
Natural log of Total Assets 3,186 18.44 1.306 13.81 22.27
Natural log of Total Revenues 3,186 19.35 1.281 13.44 23.01
Outpatient Revenue to Total Revenues 3,186 0.4866 0.1569 0.1280 0.8706
Medicare Inpatient Payer Mix 3,186 0.4487 0.1458 0.0358 0.8025
Medicare Outpatient Payer Mix 3,186 0.2059 0.0862 0.0069 0.4464
Financial Leverage 3,186 0.5282 0.3149 0.0277 1.610
Asset Turnover (Sales to Assets) 3,186 3.003 1.985 0.4808 11.39
Current Ratio 3,186 2.519 2.123 0.2394 13.53
Days Cash On Hand 3,186 43.82 58.41 0.0077 334.6
Days Sales Outstanding 3,186 53.18 22.55 10.11 187.8
Fixed Asset Age (Years) 3,186 18.80 37.08 1.005 326.6
Salary to Revenue 3,186 0.4089 0.0824 0.2390 0.7219
Urban Hospital 3,186 0.6867 0.4638 0 1

34
Table 5. Correlation matrix
Unc
ompe
nsat
ed C
are
Cos
t to
Rev
enue
s
Unc
ompe
nsat
ed C
are
Cos
t to
Ope
rati
ng
Exp
ense
U
nrei
mbu
rsed
Unc
ompe
nsat
ed C
are
Cos
t to
Op
erat
ing
Exp
ense
U
nrei
mbu
rsed
Unc
ompe
nsat
ed C
are
Cos
t to
Op
erat
ing
Exp
ense
Inco
me
to A
sset
s
Num
ber
of B
eds
Nat
ural
log
of T
otal
Ass
ets
Nat
ural
log
of T
otal
Rev
enue
s
Ou
tpat
ient
Rev
enue
to T
otal
Rev
enue
s
Med
icar
e In
pat
ient
Pay
er M
ix
Med
icar
e O
utpa
tien
t Pay
er M
ix
Fina
ncia
l Lev
erag
e
Ass
et T
urno
ver
(Sal
es to
Ass
ets)
Cur
rent
Rat
io
Day
s C
ash
On
Han
d
Day
s Sa
les
Ou
tsta
ndin
g
Fixe
d A
sset
Age
Sala
ry to
Rev
enu
e
Uncompensated Care Cost to Operating Expense
0.89
Unreimbursed Uncompensated Care Cost to Revenue
0.31 0.26
Unreimbursed Uncompensated Care Cost to Op. Expense
0.23 0.27 0.93
Income to Assets -0.04 -0.01 -0.00 0.01
Number of Beds 0.01 0.1 -0.06 -0.01 -0.00
Natural log of Total Assets
-0.09 -0.01 -0.09 -0.02 0.05 0.72
Natural log of Total Revenues
-0.12 0.06 -0.11 0.01 0.04 0.77 0.88
Outpatient Revenue to Total Revenues
0.02 -0.11 0.08 0.00 0.11 -0.54 -0.41 -0.51
Medicare Inpatient Payer Mix
-0.16 -0.22 -0.02 -0.05 -0.07 -0.28 -0.33 -0.36 0.24
Medicare Outpatient Payer Mix
-0.13 -0.12 -0.02 -0.02 0.00 -0.05 -0.04 -0.06 0.09 0.48
Financial Leverage 0.03 0.08 -0.07 -0.03 -0.32 0.02 -0.10 0.04 -0.17 -0.02 -0.08
Asset Turnover (Sales to Assets)
-0.03 0.16 -0.03 0.06 -0.05 0.03 -0.28 0.16 -0.22 -0.04 -0.03 0.34
Current Ratio 0.01 0.01 0.12 0.12 0.20 -0.04 -0.02 -0.07 0.05 -0.01 0.02 -0.40 -0.10
Days Cash On Hand -0.06 -0.05 -0.01 0.01 0.09 0.00 0.13 0.01 -0.00 0.06 0.07 -0.16 -0.21 0.38
Days Sales Outstanding
-0.01 -0.04 -0.02 -0.04 -0.09 -0.07 -0.03 -0.18 -0.03 0.00 0.00 0.00 -0.17 -0.00 0.01
Fixed Asset Age (Years)
0.00 0.01 -0.00 0.00 0.00 0.07 0.09 0.06 -0.06 -0.05 -0.02 -0.00 0.00 -0.03 0.02 0.17
Salary to Revenue 0.20 0.11 -0.04 -0.11 -0.35 -0.07 -0.18 -0.20 -0.00 0.04 -0.13 0.18 -0.00 -0.17 -0.06 0.18 0.03
Urban Hospital -0.08 0.01 -0.09 -0.00 -0.03 0.41 0.44 0.54 -0.47 -0.38 -0.21 0.17 0.17 -0.09 -0.04 -0.08 0.06 -0.03

35
Table 6. Uncompensated care cost-to-revenue and income-to-assets
All specifications use instrumental variables (2SLS) regressions with hospital type fixed-effects and various combinations of state and hospital fixed-effects. Income to assets is instrumented by financial crisis dummy with its value being one if the year is 2008 and zero otherwise. The dependent variable in the second stage regression is total cost of uncompensated care. The independent variables in both stages include the number of hospital beds, natural log of total assets, natural log of total revenues, outpatient revenue to total revenues, Medicare inpatient payer mix, Medicare outpatient payer mix, financial leverage, asset turnover or sales to assets, current ratio, working capital to total assets, days cash on hand, days sales outstanding, fixed asset age in years, salary to revenue, and urban hospital dummy. z-statistics are shown in the parentheses with ***, ** and * indicating its statistical significant level of 1%, 5% and 10% respectively.
First-Stage Regression
Dependent Variable: Financial Income to Assets
(1) (2) (3) (4) (5) (6)
Financial Crisis (year 2008) Dummy -0.0342***
(-11.54) -0.0339***
(-11.40) -0.0341***
(-11.48) -0.0292***
(-11.49) -0.0314***
(-12.13) -0.0305***
(-11.36)
Adj. R-squared 0.299 0.298 0.298 0.653 0.655 0.653
Instrumental Variables (2SLS) Regression
Dependent Variable: Uncompensated Care Cost to Revenue
(1) (2) (3) (4) (5) (6)
Income to Assets (instrumented) 0.0258 (1.00)
0.00634 (0.23)
0.00196 (0.07)
-0.0210 (-0.64)
-0.0229 (-0.74)
-0.0362 (-1.03)
Number of Beds 0.000000832
(0.08)
-0.0000250 (-0.62)
Natural log of Total Assets
-0.00630*** (-3.10)
-0.00214 (-0.57)
Natural log of Total Revenues
-0.00682*** (-3.36)
-0.00858 (-1.13)
Outpatient Revenue to Total Revenues -0.0140 (-1.18)
-0.0343*** (-2.74)
-0.0355*** (-2.91)
-0.0168 (-0.43)
-0.0133 (-0.35)
-0.0112 (-0.29)
Medicare Inpatient Payer Mix -0.0609***
(-5.59) -0.0775***
(-6.13) -0.0784***
(-6.11) -0.0364 (-1.19)
-0.0355 (-1.16)
-0.0353 (-1.14)
Medicare Outpatient Payer Mix -0.0219 (-1.41)
-0.0155 (-1.07)
-0.0146 (-1.01)
0.00538 (0.37)
0.00495 (0.34)
0.00391 (0.27)
Financial Leverage 0.0132** (2.27)
0.00954 (1.68)
0.00907 (1.57)
-0.0140 (-0.99)
-0.0143 (-1.06)
-0.0169 (-1.19)
Asset Turnover (Sales to Assets) -0.000924
(-1.11) -0.00260**
(-2.68) -0.000928
(-1.11) -0.00105 (-0.79)
-0.00147 (-0.85)
-0.000921 (-0.67)
Current Ratio 0.00108**
(2.13) 0.000988**
(2.05) 0.00105**
(2.15) -0.0000133
(-0.03) -0.0000250
(-0.05) -0.0000164
(-0.03)
Days Cash On Hand -0.0000285*
(-1.68) -0.0000193
(-1.09) -0.0000244
(-1.40) -0.00000326
(-0.14) -0.00000171
(-0.07) -0.00000662
(-0.29)
Days Sales Outstanding -0.0000768*
(-1.90) -0.0000806**
(-2.14) -0.000110***
(-2.68) -0.0000667
(-1.33) -0.0000662
(-1.31) -0.000120
(-1.52)
Fixed Asset Age 9.87e-08
(0.00) 0.0000134
(0.48) 0.0000103
(0.41) -0.0000297
(-0.65) -0.0000278
(-0.61) -0.0000274
(-0.58)
Salary to Revenue 0.0969***
(4.94) 0.0729***
(3.52) 0.0697***
(3.37) -0.0272 (-0.61)
-0.0295 (-0.66)
-0.0450 (-0.93)
Urban Hospital Dummy -0.0138***
(-4.79) -0.0100***
(-3.28) -0.00955***
(-3.06) -0.00760 (-0.44)
-0.00777 (-0.45)
-0.00818 (-0.48)
Constant 0.0607***
(4.70) 0.206*** (4.07)
0.221*** (4.31)
0.137*** (3.58)
0.170** (2.22)
0.288** (1.96)
State Fixed-Effects (Clustered SE) Yes Yes Yes No No No
Hospital Fixed-Effects (Clustered SE) No No No Yes Yes Yes
N 3,186 3,186 3,186 3,186 3,186 3,186
Adj. R-squared 0.182 0.202 0.205 0.840 0.840 0.838

36
Table 7. Uncompensated care cost-to-expense and income-to-assets
All specifications use instrumental variables (2SLS) regressions with hospital type fixed-effects and various combinations of state and hospital fixed-effects. Income to assets is instrumented by financial crisis dummy with its value being one if the year is 2008 and zero otherwise. The results of first stage regression are omitted. The dependent variable in the second stage regression is total cost of uncompensated care. The independent variables in both stages include the number of hospital beds, natural log of total assets, natural log of total revenues, outpatient revenue to total revenues, Medicare inpatient payer mix, Medicare outpatient payer mix, financial leverage, asset turnover or sales to assets, current ratio, working capital to total assets, days cash on hand, days sales outstanding, fixed asset age in years, salary to revenue, and urban hospital dummy. z-statistics are shown in the parentheses with ***, ** and * indicating its statistical significant level of 1%, 5% and 10% respectively. Dependent Variable: Uncompensated Care Cost to Operating Expense
(1) (2) (3) (4) (5) (6)
Income to Assets (instrumented) -0.00777 (-0.15)
-0.0306 (-0.55)
-0.0327 (-0.57)
-0.122 (-1.54)
-0.113 (-1.54)
-0.134* (-1.67)
Number of Beds 0.0000122
(0.63)
-0.0000466 (-0.36)
Natural log of Total Assets
-0.00645* (-1.79)
0.00433 (0.43)
Natural log of Total Revenues
-0.00631* (-1.72)
-0.00753 (-0.51)
Outpatient Revenue to Total Revenues -0.0493** (-2.23)
-0.0772*** (-3.48)
-0.0764*** (-3.45)
-0.0425 (-0.56)
-0.0395 (-0.53)
-0.0351 (-0.47)
Medicare Inpatient Payer Mix -0.143*** (-6.02)
-0.164*** (-6.15)
-0.163*** (-5.94)
-0.0698 (-0.99)
-0.0682 (-0.96)
-0.0680 (-0.95)
Medicare Outpatient Payer Mix -0.0389 (-1.21)
-0.0303 (-0.98)
-0.0301 (-0.97)
0.0173 (0.57)
0.0169 (0.56)
0.0157 (0.52)
Financial Leverage 0.0192* (1.85)
0.0146 (1.41)
0.0146 (1.39)
-0.0501* (-1.67)
-0.0476* (-1.68)
-0.0522* (-1.77)
Asset Turnover (Sales to Assets) 0.00412**
(2.48) 0.00231 (1.27)
0.00402** (2.35)
0.000447 (0.13)
0.00159 (0.38)
0.000632 (0.18)
Current Ratio 0.00288***
(2.75) 0.00280***
(2.74) 0.00287***
(2.77) 0.0000118
(0.01) 0.0000527
(0.04) 0.0000135
(0.01)
Days Cash On Hand -0.0000261
(-0.79) -0.0000174
(-0.49) -0.0000230
(-0.67) 0.00000633
(0.13) 0.00000251
(0.05) 0.00000321
(0.06)
Days Sales Outstanding -0.000110
(-1.50) -0.000117
(-1.67) -0.000144*
(-1.88) -0.000116
(-1.03) -0.000103
(-0.90) -0.000159
(-1.01)
Fixed Asset Age 0.0000278
(0.50) 0.0000443
(0.76) 0.0000401
(0.72) -0.0000631
(-0.72) -0.0000628
(-0.71) -0.0000601
(-0.68)
Salary to Revenue 0.103*** (2.87)
0.0770** (2.03)
0.0764** (2.02)
-0.164* (-1.71)
-0.155* (-1.66)
-0.179* (-1.77)
Urban Hospital Dummy -0.0278***
(-5.12) -0.0234***
(-4.14) -0.0233***
(-4.09) -0.0154 (-0.52)
-0.0153 (-0.51)
-0.0160 (-0.53)
Constant 0.131*** (5.45)
0.288*** (3.21)
0.287*** (3.11)
0.293*** (3.50)
0.207 (1.14)
0.421 (1.57)
State Fixed-Effects (Clustered SE) Yes Yes Yes No No No
Hospital Fixed-Effects (Clustered SE) No No No Yes Yes Yes
N 3,186 3,186 3,186 3,186 3,186 3,186
Adj. R-squared 0.192 0.195 0.195 0.804 0.806 0.802

37
Table 8. Unreimbursed Uncompensated care cost-to-revenue and income-to-assets
All specifications use instrumental variables (2SLS) regressions with hospital type fixed-effects and various combinations of state and hospital fixed-effects. Income to assets is instrumented by financial crisis dummy with its value being one if the year is 2008 and zero otherwise. The results of first stage regression are omitted. The dependent variable in the second stage regression is unreimbursed cost of uncompensated care. The independent variables in both stages include the number of hospital beds, natural log of total assets, natural log of total revenues, outpatient revenue to total revenues, Medicare inpatient payer mix, Medicare outpatient payer mix, financial leverage, asset turnover or sales to assets, current ratio, working capital to total assets, days cash on hand, days sales outstanding, fixed asset age in years, salary to revenue, and urban hospital dummy. z-statistics are shown in the parentheses with ***, ** and * indicating its statistical significant level of 1%, 5% and 10% respectively. Dependent Variable: Unreimbursed Uncompensated Care Cost to Revenue
(1) (2) (3) (4) (5) (6)
Income to Assets (instrumented) -0.00382 (-0.40)
-0.00486 (-0.49)
-0.00555 (-0.56)
-0.000272 (-0.02)
0.00000963 (0.00)
-0.0000573 (-0.00)
Number of Beds -0.00000254
(-1.26)
-0.0000174 (-0.97)
Natural log of Total Assets
-0.000547 (-1.23)
-0.000417 (-0.24)
Natural log of Total Revenues
-0.000681 (-1.50)
-0.000363 (-0.14)
Outpatient Revenue to Total Revenues 0.00128 (0.37)
0.00118 (0.33)
0.000801 (0.23)
0.0141 (0.95)
0.0160 (1.07)
0.0160 (1.06)
Medicare Inpatient Payer Mix -0.00335 (-0.89)
-0.00397 (-1.03)
-0.00428 (-1.09)
-0.00192 (-0.21)
-0.00130 (-0.15)
-0.00130 (-0.15)
Medicare Outpatient Payer Mix -0.0117** (-2.49)
-0.0116** (-2.51)
-0.0114** (-2.46)
0.000933 (0.13)
0.000685 (0.09)
0.000658 (0.09)
Financial Leverage 0.000436
(0.22) 0.000294
(0.14) 0.000200
(0.10) -0.00168 (-0.26)
-0.00151 (-0.25)
-0.00149 (-0.23)
Asset Turnover (Sales to Assets) -0.0000580
(-0.28) -0.000182
(-0.89) -0.0000362
(-0.18) 0.000150
(0.23) 0.000106
(0.14) 0.000204
(0.31)
Current Ratio 0.000393*
(1.75) 0.000382*
(1.71) 0.000387*
(1.73) 0.0000104
(0.05) 0.0000104
(0.05) 0.0000132
(0.06)
Days Cash On Hand -0.00000885
(-1.63) -0.00000788
(-1.41) -0.00000827
(-1.51) 0.00000335
(0.29) 0.00000357
(0.31) 0.00000310
(0.27)
Days Sales Outstanding -0.0000174
(-1.41) -0.0000169
(-1.38) -0.0000199
(-1.59) -0.00000748
(-0.29) -0.00000555
(-0.21) -0.00000732
(-0.22)
Fixed Asset Age 0.0000122
(1.07) 0.0000127
(1.11) 0.0000125
(1.09) -0.0000121
(-0.94) -0.0000112
(-0.86) -0.0000113
(-0.86)
Salary to Revenue 0.00305 (0.45)
0.00143 (0.20)
0.000791 (0.11)
-0.00564 (-0.34)
-0.00552 (-0.35)
-0.00563 (-0.32)
Urban Hospital Dummy -0.000845
(-0.83) -0.000642
(-0.67) -0.000544
(-0.56) 0.00232 (0.85)
0.00225 (0.85)
0.00225 (0.84)
Constant 0.0228***
(5.37) 0.0336***
(2.87) 0.0369***
(3.13) 0.0466***
(2.69) 0.0509* (1.65)
0.0500 (1.07)
State Fixed-Effects (Clustered SE) Yes Yes Yes No No No
Hospital Fixed-Effects (Clustered SE) No No No Yes Yes Yes
N 3,186 3,186 3,186 3,186 3,186 3,186
Adj. R-squared 0.222 0.223 0.223 0.829 0.829 0.829
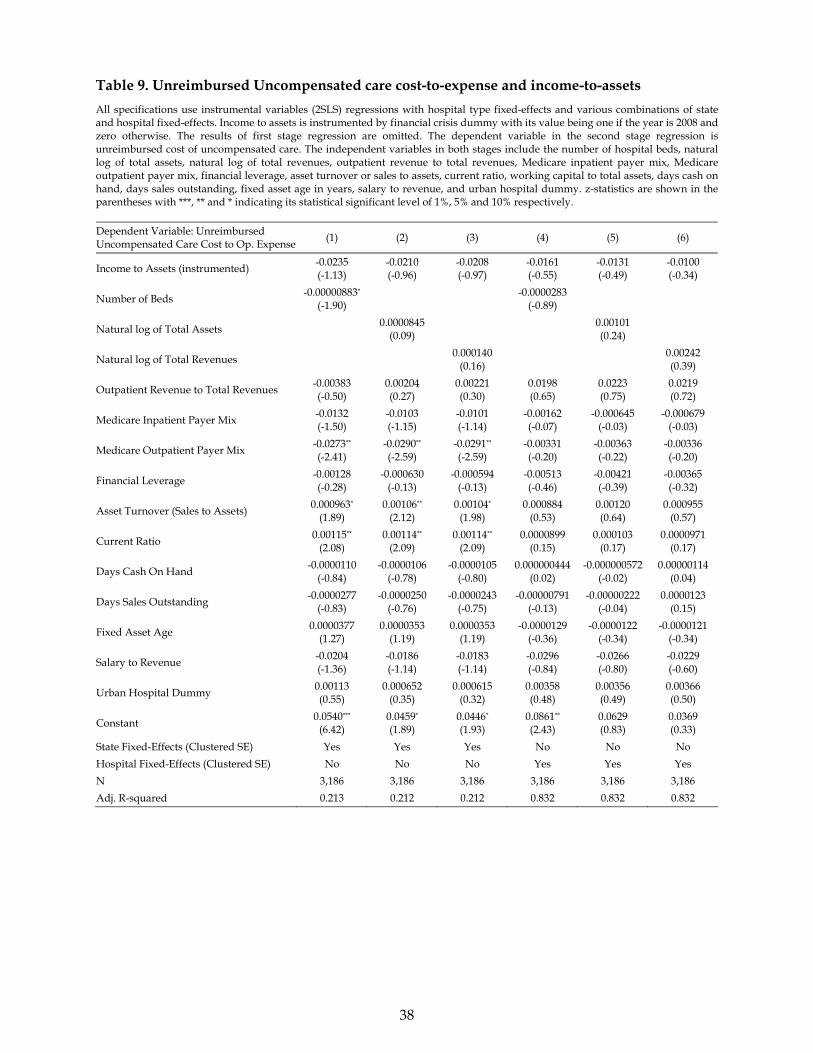
38
Table 9. Unreimbursed Uncompensated care cost-to-expense and income-to-assets
All specifications use instrumental variables (2SLS) regressions with hospital type fixed-effects and various combinations of state and hospital fixed-effects. Income to assets is instrumented by financial crisis dummy with its value being one if the year is 2008 and zero otherwise. The results of first stage regression are omitted. The dependent variable in the second stage regression is unreimbursed cost of uncompensated care. The independent variables in both stages include the number of hospital beds, natural log of total assets, natural log of total revenues, outpatient revenue to total revenues, Medicare inpatient payer mix, Medicare outpatient payer mix, financial leverage, asset turnover or sales to assets, current ratio, working capital to total assets, days cash on hand, days sales outstanding, fixed asset age in years, salary to revenue, and urban hospital dummy. z-statistics are shown in the parentheses with ***, ** and * indicating its statistical significant level of 1%, 5% and 10% respectively. Dependent Variable: Unreimbursed Uncompensated Care Cost to Op. Expense
(1) (2) (3) (4) (5) (6)
Income to Assets (instrumented) -0.0235 (-1.13)
-0.0210 (-0.96)
-0.0208 (-0.97)
-0.0161 (-0.55)
-0.0131 (-0.49)
-0.0100 (-0.34)
Number of Beds -0.00000883*
(-1.90)
-0.0000283 (-0.89)
Natural log of Total Assets
0.0000845 (0.09)
0.00101 (0.24)
Natural log of Total Revenues
0.000140 (0.16)
0.00242 (0.39)
Outpatient Revenue to Total Revenues -0.00383 (-0.50)
0.00204 (0.27)
0.00221 (0.30)
0.0198 (0.65)
0.0223 (0.75)
0.0219 (0.72)
Medicare Inpatient Payer Mix -0.0132 (-1.50)
-0.0103 (-1.15)
-0.0101 (-1.14)
-0.00162 (-0.07)
-0.000645 (-0.03)
-0.000679 (-0.03)
Medicare Outpatient Payer Mix -0.0273** (-2.41)
-0.0290** (-2.59)
-0.0291** (-2.59)
-0.00331 (-0.20)
-0.00363 (-0.22)
-0.00336 (-0.20)
Financial Leverage -0.00128 (-0.28)
-0.000630 (-0.13)
-0.000594 (-0.13)
-0.00513 (-0.46)
-0.00421 (-0.39)
-0.00365 (-0.32)
Asset Turnover (Sales to Assets) 0.000963*
(1.89) 0.00106**
(2.12) 0.00104*
(1.98) 0.000884
(0.53) 0.00120 (0.64)
0.000955 (0.57)
Current Ratio 0.00115**
(2.08) 0.00114**
(2.09) 0.00114**
(2.09) 0.0000899
(0.15) 0.000103
(0.17) 0.0000971
(0.17)
Days Cash On Hand -0.0000110
(-0.84) -0.0000106
(-0.78) -0.0000105
(-0.80) 0.000000444
(0.02) -0.000000572
(-0.02) 0.00000114
(0.04)
Days Sales Outstanding -0.0000277
(-0.83) -0.0000250
(-0.76) -0.0000243
(-0.75) -0.00000791
(-0.13) -0.00000222
(-0.04) 0.0000123
(0.15)
Fixed Asset Age 0.0000377
(1.27) 0.0000353
(1.19) 0.0000353
(1.19) -0.0000129
(-0.36) -0.0000122
(-0.34) -0.0000121
(-0.34)
Salary to Revenue -0.0204 (-1.36)
-0.0186 (-1.14)
-0.0183 (-1.14)
-0.0296 (-0.84)
-0.0266 (-0.80)
-0.0229 (-0.60)
Urban Hospital Dummy 0.00113 (0.55)
0.000652 (0.35)
0.000615 (0.32)
0.00358 (0.48)
0.00356 (0.49)
0.00366 (0.50)
Constant 0.0540***
(6.42) 0.0459* (1.89)
0.0446* (1.93)
0.0861** (2.43)
0.0629 (0.83)
0.0369 (0.33)
State Fixed-Effects (Clustered SE) Yes Yes Yes No No No
Hospital Fixed-Effects (Clustered SE) No No No Yes Yes Yes
N 3,186 3,186 3,186 3,186 3,186 3,186
Adj. R-squared 0.213 0.212 0.212 0.832 0.832 0.832

39
Table 10. Uncompensated care costs and income-to-revenue
All specifications use instrumental variables (2SLS) regressions with hospital type fixed-effects and various combinations of state and hospital fixed-effects. Income to revenue is instrumented by financial crisis dummy with its value being one if the year is 2008 and zero otherwise. The dependent variable in the second stage regression include four different measures of uncompensated care cost. The independent variables in both stages include the number of hospital beds, natural log of total assets, natural log of total revenues, outpatient revenue to total revenues, Medicare inpatient payer mix, Medicare outpatient payer mix, financial leverage, asset turnover or sales to assets, current ratio, working capital to total assets, days cash on hand, days sales outstanding, fixed asset age in years, salary to revenue, and urban hospital dummy. z-statistics are shown in the parentheses with ***, ** and * indicating its statistical significant level of 1%, 5% and 10% respectively.
First-Stage Regression
Dependent Variable: Income to Revenue
Specifications (1) and (3) Specifications (2) and (4)
Financial Crisis (year 2008) Dummy -0.01847***
(-15.59) -0.0177***
(-15.10)
Adj. R-squared 0.305 0.539
Instrumental Variables (2SLS) Regression
Uncompensated Care Cost to Revenues
Uncompensated Care Cost to Operating
Expense
Unreimbursed Uncompensated Care
Cost to Revenue
Unreimbursed Uncompensated Care
Cost to Operating Expense
Dependent Variable:
(1) (2) (3) (4)
Income to Revenue (instrumented) -0.0144 (-0.15)
-0.201 (-1.54)
-0.0435 (-1.12)
-0.0266 (-0.55)
Number of Beds 0.0000121
(0.62) -0.0000270
(-0.21) -0.00000913*
(-1.96) -0.0000257
(-0.83)
Outpatient Revenue to Total Revenues -0.0496** (-2.20)
-0.0454 (-0.61)
-0.00477 (-0.61)
0.0194 (0.64)
Medicare Inpatient Payer Mix -0.143*** (-6.10)
-0.0706 (-1.02)
-0.0128 (-1.46)
-0.00173 (-0.08)
Medicare Outpatient Payer Mix -0.0387 (-1.19)
0.0202 (0.68)
-0.0266** (-2.38)
-0.00292 (-0.18)
Financial Leverage 0.0194** (2.07)
-0.0372 (-1.57)
-0.000535 (-0.13)
-0.00342 (-0.37)
Asset Turnover (Sales to Assets) 0.00411**
(2.51) 0.00191 (0.59)
0.000929* (1.85)
0.00108 (0.67)
Current Ratio 0.00288***
(2.74) 0.000160
(0.14) 0.00114**
(2.06) 0.000110
(0.19)
Days Cash On Hand -0.0000259
(-0.78) 0.00000961
(0.20) -0.0000106
(-0.81) 0.000000878
(0.03)
Days Sales Outstanding -0.000110
(-1.49) -0.000108
(-0.95) -0.0000297
(-0.91) -0.00000677
(-0.11)
Fixed Asset Age 0.0000282
(0.50) -0.0000621
(-0.73) 0.0000389
(1.30) -0.0000128
(-0.36)
Salary to Revenue 0.104*** (2.94)
-0.131 (-1.59)
-0.0176 (-1.23)
-0.0253 (-0.84)
Urban Hospital Dummy -0.0278***
(-5.11) -0.0152 (-0.51)
0.00117 (0.57)
0.00361 (0.48)
Constant 0.131*** (5.63)
0.249*** (3.64)
0.0530*** (6.66)
0.0803*** (2.71)
State Fixed-Effects (Clustered SE) Yes No Yes No
Hospital Fixed-Effects (Clustered SE) No Yes No Yes
N 3,186 3,186 3,186 3,186
Adj. R-squared 0.192 0.808 0.213 0.832

40
Table 11. Number of nonprofit hospitals in each state and year
Nonprofit Public Nonprofit Public
State 2007 2008 2007 2008 State 2007 2008 2007 2008
ALABAMA 20 25 33 30 RHODE ISLAND 8 8 0 0
ALASKA 5 6 5 4 SOUTH CAROLINA 19 19 18 18
ARIZONA 26 30 2 3 SOUTH DAKOTA 41 41 4 4
ARKANSAS 37 37 6 8 TENNESSEE 48 42 23 23
CALIFORNIA 146 148 61 68 TEXAS 107 109 83 84
COLORADO 23 27 20 22 UTAH 21 22 6 6
CONNECTICUT 32 32 0 0 VERMONT 15 15 0 0
DELAWARE 5 6 0 0 VIRGINIA 48 43 3 4
FLORIDA 68 70 18 14 WASHINGTON 37 39 45 46
GEORGIA 53 52 48 48 WEST VIRGINIA 21 23 10 10
HAWAII 11 10 11 12 WISCONSIN 104 97 6 6
IDAHO 12 14 24 22 WYOMING 5 5 11 10
ILLINOIS 104 108 17 18 TOTAL 2,282 2,276 946 969
INDIANA 55 49 23 22
IOWA 46 46 56 57
KANSAS 36 36 69 70
KENTUCKY 59 62 11 9
LOUISIANA 19 18 35 38
MAINE 26 30 1 1
MARYLAND 19 17 0 0
MASSACHUSETTS 53 55 1 0
MICHIGAN 87 84 11 14
MINNESOTA 66 68 32 33
MISSISSIPPI 26 21 39 40
MISSOURI 44 43 33 39
MONTANA 40 39 9 11
NEBRASKA 38 38 40 40
NEVADA 7 8 9 9
NEW HAMPSHIRE 19 20 0 0
NEW JERSEY 60 56 4 5
NEW MEXICO 9 9 10 9
NEW YORK 157 154 12 13
NORTH CAROLINA 52 51 24 25
NORTH DAKOTA 37 36 0 0
OHIO 121 120 18 18
OKLAHOMA 33 32 45 46
OREGON 39 38 9 9
PENNSYLVANIA 118 118 0 1
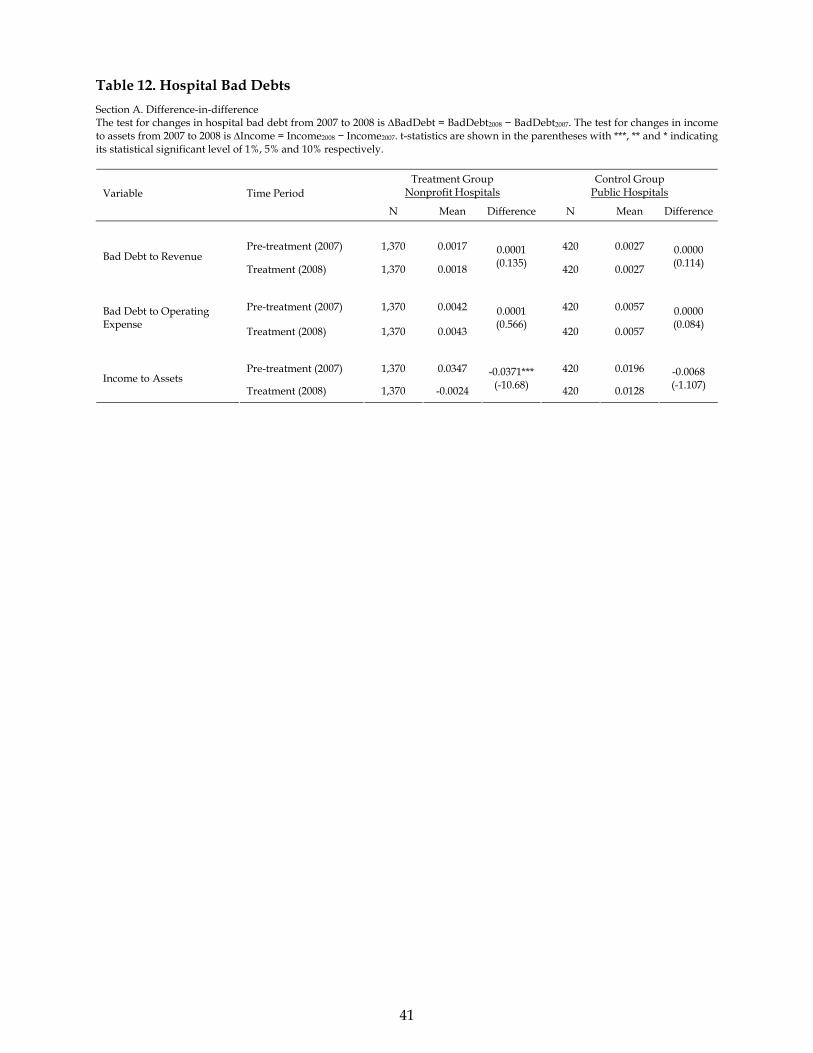
41
Table 12. Hospital Bad Debts
Section A. Difference-in-difference The test for changes in hospital bad debt from 2007 to 2008 is ∆BadDebt = BadDebt2008 − BadDebt2007. The test for changes in income to assets from 2007 to 2008 is ∆Income = Income2008 − Income2007. t-statistics are shown in the parentheses with ***, ** and * indicating its statistical significant level of 1%, 5% and 10% respectively.
Treatment Group Nonprofit Hospitals
Control Group Public Hospitals Variable Time Period
N Mean Difference N Mean Difference
Pre-treatment (2007) 1,370 0.0017 420 0.0027 Bad Debt to Revenue
Treatment (2008) 1,370 0.0018
0.0001 (0.135)
420 0.0027
0.0000 (0.114)
Pre-treatment (2007) 1,370 0.0042 420 0.0057 Bad Debt to Operating Expense
Treatment (2008) 1,370 0.0043
0.0001 (0.566)
420 0.0057
0.0000 (0.084)
Pre-treatment (2007) 1,370 0.0347 420 0.0196 Income to Assets
Treatment (2008) 1,370 -0.0024
-0.0371*** (-10.68) 420 0.0128
-0.0068 (-1.107)

42
Section B. DiD regression The dependent variable includes two different measures of hospital bad debt: Bad Debt to Revenue and Bad Debt to Operating Expense. The independent variables include two dummy variables (Treatment and Post) and their interaction term (Post × Treatment). The value of Treatment is one for a nonprofit hospital and zero for a public hospital. The value of Post is one if the year is 2008 and zero if it is 2007. All specifications use OLS regressions. z-statistics are shown in the parentheses with ***, ** and * indicating its statistical significant level of 1%, 5% and 10% respectively. Dependent Variable: Bad Debt to Revenue Bad Debt to Operating Expense
(1) (2) (3) (4)
Treatment (Nonprofit) -0.000538***
(-3.42) -0.000102
(-0.70) -0.000524*
(-1.77) -0.000269
(-0.64)
Post (2008) -0.0000197
(-0.25) -0.00000690
(-0.06) 0.0000341
(0.22) 0.0000560
(0.24)
Post × Treatment 0.0000318
(0.36) 0.0000135
(0.11) 0.0000654
(0.36) 0.0000300
(0.12)
Constant 0.00118***
(9.65) 0.00275***
(47.57) 0.00157***
(7.25) 0.00973***
(84.05)
State Fixed-Effects Yes No Yes No
State-level Clustered SE Yes No Yes No
Hospital Fixed-Effects No Yes No Yes
Hospital-level Clustered SE No Yes No Yes
N 3,932 3,932 3,932 3,932
Adj. R-squared 0.338 0.826 0.373 0.822

43
Section C. Bad debts and financial income All specifications use instrumental variables (2SLS) regressions with hospital type fixed-effects and various combinations of state and hospital fixed-effects. The variable of Income to Assets is instrumented by financial crisis dummy with its value being one if the year is 2008 and zero otherwise. The dependent variable in the second stage regression include two different measures of hospital bad debt: Bad Debt to Revenue and Bad Debt to Operating Expense. The independent variables in both stages include the number of hospital beds, natural log of total assets, natural log of total revenues, outpatient revenue to total revenues, Medicare inpatient payer mix, Medicare outpatient payer mix, financial leverage, asset turnover or sales to assets, current ratio, working capital to total assets, days cash on hand, days sales outstanding, fixed asset age in years, salary to revenue, and urban hospital dummy. z-statistics are shown in the parentheses with ***, ** and * indicating its statistical significant level of 1%, 5% and 10% respectively.
Bad Debt to Revenue Bad Debt to Operating Expense Dependent Variable:
(1) (2) (3) (4)
Income to Assets (instrumented) -0.00135 (-1.08)
-0.00158 (-0.82)
-0.00365 (-1.24)
-0.00503 (-1.06)
Number of Beds -0.000000844**
(-2.33) 5.90e-08
(0.04) -0.00000197**
(-2.63) 0.000000346
(0.09)
Outpatient Revenue to Total Revenues -0.000516
(-0.82) -0.00158 (-1.13)
-0.00219 (-1.38)
-0.00331 (-1.05)
Medicare Inpatient Payer Mix 0.00194***
(3.75) 0.00308*
(1.92) 0.00398***
(3.48) 0.00755**
(1.99)
Medicare Outpatient Payer Mix 0.000994
(1.19) 0.0000489
(0.04) 0.00289 (1.37)
-0.0000467 (-0.02)
Financial Leverage 0.0000309
(0.20) 0.000262
(0.35) -0.000307
(-0.76) -0.000277
(-0.16)
Asset Turnover (Sales to Assets) 0.0000210
(0.61) -0.0000526
(-0.60) 0.000273***
(3.00) 0.0000106
(0.05)
Current Ratio 0.0000523**
(2.59) -0.00000837
(-0.28) 0.000111**
(2.25) -0.0000330
(-0.42)
Days Cash On Hand -0.000000312
(-0.47) 0.000000338
(0.20) 0.00000118
(0.75) 0.00000227
(0.55)
Days Sales Outstanding -0.00000373**
(-2.14) 0.000000967
(0.27) -0.00000642*
(-1.76) 0.000000735
(0.09)
Fixed Asset Age 0.000000935
(0.86) -0.00000108
(-0.48) 0.00000267
(1.33) -0.00000125
(-0.23)
Salary to Revenue 0.00302***
(3.66) 0.000201
(0.10) 0.00396**
(2.18) -0.00161 (-0.34)
Urban Hospital Dummy -0.000826***
(-6.53) 0.000392
(0.74) -0.00150***
(-5.56) 0.000763
(0.66)
Constant -0.000267
(-0.44) 0.0000698
(0.04) -0.000214
(-0.18) -0.000442
(-0.09)
State Fixed-Effects (Clustered SE) Yes No Yes No
Hospital Fixed-Effects (Clustered SE) No Yes No Yes
N 3,186 3,186 3,186 3,186
Adj. R-squared 0.451 0.865 0.453 0.844