Embed Size (px)
Citation preview

DI
SC
US
SI
ON
P
AP
ER
S
ER
IE
S
Forschungsinstitut zur Zukunft der ArbeitInstitute for the Study of Labor
Do More Educated Leaders Raise Citizens’ Education?
IZA DP No. 7661
September 2013
Luis Diaz-SerranoJessica Pérez
Do More Educated Leaders Raise
Citizens’ Education?
Luis Diaz-Serrano CREIP, Universitat Rovira i Virgili
and IZA
Jessica Pérez CREIP, Universitat Rovira i Virgili
Discussion Paper No. 7661 September 2013
IZA
P.O. Box 7240 53072 Bonn
Germany
Phone: +49-228-3894-0 Fax: +49-228-3894-180
E-mail: [email protected]
Any opinions expressed here are those of the author(s) and not those of IZA. Research published in this series may include views on policy, but the institute itself takes no institutional policy positions. The IZA research network is committed to the IZA Guiding Principles of Research Integrity. The Institute for the Study of Labor (IZA) in Bonn is a local and virtual international research center and a place of communication between science, politics and business. IZA is an independent nonprofit organization supported by Deutsche Post Foundation. The center is associated with the University of Bonn and offers a stimulating research environment through its international network, workshops and conferences, data service, project support, research visits and doctoral program. IZA engages in (i) original and internationally competitive research in all fields of labor economics, (ii) development of policy concepts, and (iii) dissemination of research results and concepts to the interested public. IZA Discussion Papers often represent preliminary work and are circulated to encourage discussion. Citation of such a paper should account for its provisional character. A revised version may be available directly from the author.

IZA Discussion Paper No. 7661 September 2013
ABSTRACT
Do More Educated Leaders Raise Citizens’ Education?* This paper looks at the contribution of political leaders to enhance citizens’ education and investigate how the educational attainment of the population is affected while a leader with higher education remains in office. For this purpose, we consider educational transitions of political leaders in office and find that the educational attainment of population increases when a more educated leader remains in office. Furthermore, we also observe that the educational attainment of the population is negatively impacted when a country transitions from an educated leader to a less educated one. This result may help to explain the previous finding that more educated political leaders favor economic growth. JEL Classification: I21, I25, I28 Keywords: political leaders, primary education, school achievement, political institutions Corresponding author: Luis Diaz-Serrano Department of Economics Universitat Rovira i Virgili Avinguda de la Universitat 1 43204 Reus Spain E-mail: [email protected]
* We acknowledge the financial support from the Spanish Ministry of Economy and Competitiveness (grant # ECO2010-20829).
2
1. Introduction
Recent literature has been demonstrated that leaders play an important role by affecting policy
and economic outcomes (Jones and Olken, 2005; Dreher et al., 2009; Besley et al., 2011) and that
citizens (voters) pay more attention to leaders’ characteristics rather than political parties (Besley
and Coate, 1997; Osborne and Slivinski, 1996). More specifically, literature shows that leaders’
quality, measured by their educational level and personal background, matters for economic
growth (Dreher et al., 2009; Besley et al., 2011) and reforms (Dreher et al., 2009; Göhlmann and
Vaubel, 2007) in a country.
According to Besley et al. (2011), leaders matters for growth since some of them are more
competent than others and are more able to make better policy choices which enhance economic
performance. They consider that the return to having more educated leaders comes from the
assumption that highly educated leaders are also better citizens and are more likely to act in the
benefit of public interest.1
The main goal of this paper is analyze whether political leaders would matter for policy outcomes
and more specifically those regarding the educational achievement of the population. We consider
that one of the key means that the leader has an effect on outcomes is his/her educational
attainment. So, a possible explanation to the potential effect of leader’s education on economic
growth could be through enhancing the education of the population. Human capital is an
1 Besley et al. (2011) define a ‘highly’ educated leader as one who has at least a postgraduate qualification.
3
important input into the production function of a country and has been emphasized as a critical
determinant of economic progress.
Our paper contributes to the literature on leaders’ characteristics and their impact on countries’
outcomes. We look at the contribution of a leader to enhance citizens’ education. We investigate
how the educational attainment of population is affected while a leader with higher education
remains in office. For this purpose, we consider educational transitions of the leaders defined as
the change in the educational level of political leader from one mandate to other. Using a dataset
for the period 1970-2004 and over 140 countries, we show that there is a significant effect of
these transitions on our measure of educational attainment of the population.
Given the aim described above, the paper is organized as follows: Section 2 begins with an
overview of literature that highlights the importance of political leader on different policy
outcomes and especially those that emphasize education as a major feature of the leader; Section
3 provides the conceptual framework of our hypothesis; Section 4 describes the databases and
variables used; Section 5 describes the econometric model and method of estimation; Section 6
presents the results and finally, Section 7 concludes.
2. Literature Review
As mentioned above, recently, a growing body of literature studies the importance of leader’s
characteristics in explaining outcomes. From a theoretical point of view, as Besley et al. (2011)
note, this can be motivated using the citizen-candidate type approach as presented in Besley and
4
Coate (1997) and Osborne and Slivinski (1996). These authors model political competition as a
game between citizens competing to hold public office, where selection based on policy
preferences, talent or virtue can affect policy outcomes.
From the empirical side, some studies look at the influence of leaders and their personal
characteristics on political and economic outcomes such as economic policy, monetary policy and
changes in the form of government. Related to the influence of leaders, i.e. who is the head of
government, Jones and Olken (2005) show that the quality of leaders matters for economic
growth. They stand the role of national leadership rather than the deterministic country
characteristics and relatively persistent policy variables that have been focused in the most
econometric work explaining economic growth. This is precisely the conceptual framework we
we adopt in this paper. Later, Jones and Olken (2009) investigate the effects of assassinations and
assassination attempts against political leaders on the institutional setup within a country between
1875 and 2004. They find that a successful assassination of autocrats will significantly increase
the likelihood of a transition to democracy thereafter. A related study by Hayo and Voigt (2011)
produce similar results. Hayo and Voigt (2011) find that changes in the constitution can be
explained by characteristics of the political system, internal and external political conflicts, and
political leaders, whereas economic and socio-demographic variables do not matter. Despite the
results of both Jones and Olken (2009) and Hayo and Voigt (2011) demonstrate that the
circumstances under which the reign of political leaders is terminated matter for changes in the
form of government, their results do not indicate whether individual characteristics of political
leaders themselves are relevant for such changes.
5
Some studies highlight the gender of the leader as a relevant characteristic and investigate the
impact of women on economic policy. For instance, Chattopadhyay and Duflo (2004) analyze the
influence of women representation in local councils in India on the types of locally provided
public goods. They show that council members invest more in infrastructure that is directly
related to the needs of their own gender. According to their findings women invest more in
infrastructure such as water and roads while men in education.2 Similarly, Svaleryd (2009) studies
whether women’s representation in Swedish local councils affects local public expenditure
structures and finds a positive relation between the share of women on local councils and the
spending on child care and education relative to elderly care. Also, Baltrunaite et al. (2012)
analyze the effects of gender quotas in politics on the quality of politicians and show that the
increase in female representation increases the average education level of elected politicians.
Other relevant characteristics are leaders’ educational attainment and professional background.
Our study is framed in the literature that stresses the impact of leaders’ education on economic
outcomes. Göhlmann and Vaubel (2007) find strong evidence that the inflation preferences of
members of the central bank council depend on their education and professional experience.
According to their findings, more law graduates in the council come along with higher inflation
rates compared to economists while former members of the central bank staff are accompanied by
significantly lower inflation rates than former politicians. Dreher et al. (2009) studied the impact
of education and profession on implementation of market-liberalizing reforms and found that
entrepreneurs, professional scientists, and trained economists are significantly more reform
oriented. For these authors when it comes to designing reform policy, politicians’ education and
2 This paper is framed for studies on the effect of political reservation, i.e. reserving political office for particular
groups in the population. Chattopadhyay and Duflo (2004) studied reservations for women and they argue that
reservation matters by changing the identities of those elected to office.
6
professional experience is likely to be important. Congleton and Zhang (2009) use a similar
approach and analyze the influence of U.S. presidents on economic growth. Their results indicate
that higher levels of education and specific professional experiences of a president substantially
increase economic growth. Constant and Tien (2010) show that foreign education of the leaders
matters for Foreign Direct Investments (FDI) inflows in their home countries above and beyond
standard determinants of FDI which are also essential for a country’s economic growth. Finally,
Besley et al. (2011) expand the set of random leadership transitions to show that leaders matter
for growth as in the previous work of Jones and Olken (2005) and provide evidence supporting
the view that heterogeneity among leaders’ educational attainment is important with growth being
higher by having leaders who are more highly educated.
3. Hypothesis
Our hypothesis is derived from the findings described in the previous section. It has been found
that the elected representative (leader), at least to some degree, can pursue his or her own interests
(Svaleryd, 2009). For instance, a general finding is that women prefer higher social spending than
men (Lott and Kenny, 1999; Abrams and Settle, 1999; Aidt and Dallal, 2008). 3
Also, Hayo and
Neumeier (2012) found that governments led by prime ministers from a poor socioeconomic
background spend significantly more on social security, education, health, infrastructure, and
public safety. Since these results support the idea that leaders spend more in certain areas
3 Abrams and Settle (1999), Aidt and Dallal (2008) and Lott and Kenny (1999) study the effect of women’s suffrage
on the growth of welfare state and the scope of government. Their findings show that social spending is
systematically higher where women have and use the right to vote.

7
according to their preferences, we expect that more educated leaders invest more in education
issues.
As mentioned before, some authors highlight the impact of the educational level of leaders on
economic growth, but they did not give further explanation on the ‘why’. We hypothesize that a
potential explanation for this link is that more educated leaders will take decisions and promote
policies that will increase the human capital of the population. A greater stock of human capital
implies a more skilled and productive workforce, which in turn will increase country’s output
(Barro and Lee, 2001).
Economic theory suggests that human capital is an important determinant of growth, and
empirical evidence for a broad group of countries confirms this linkage (Barro, 1991; Benhabib
and Spiegel, 1994; Romer, 1986, 1989; Lucas, 1988; Jones and Manuelli, 1990). According to
these theories, human capital can boost growth through stimulating technological creation,
invention and innovation, as well as facilitating the uptake and imitation of new technologies.
Also, countries that start with a higher level of educational attainment in their population grow
faster for a given level of initial per capita GDP and for given values of policy-related variables
(Barro, 1991).
While there is little doubt of the theoretical importance of human capital for economic growth,
and that only by providing more and more education countries can continue to prosper in a
globalized economy, there has yet to emerge a consensus among empirical growth researchers on
how to measure and model human capital in growth regressions. Some authors consider that

8
education contributes to economic growth and productivity, but beyond a threshold its
contribution is small and uncertain. For instance, Wolf (2002) argues that high private returns to
education are not matched by high or consistent social returns, and that even if some education
has a positive impact cannot be extrapolated endlessly as education expands. Sala-i-Martin et al.
(2004) create a list of variables that are robust in explaining long-term economic growth, in this
list one of the most important variables is the primary education enrollment rate.
4. Dataset and variables
Our dataset on political leaders contains information for 214 countries over the period 1848-2004.
However, for country level educational attainment there is only available data after 1970.
Therefore, we restrict our study to the period 1970-2004 and over 140 countries. The database
was constructed from different sources as explained below. In order to identify the primary ruler
in each country and year we use Archigos data.4 This database identifies the effective leader of
each independent state and year based on the characteristics of the political system in place
between 1875 and 2004 for 188 countries where two rules are generally followed: i) in
Parliamentary regimes, the prime minister is coded as the ruler while in Presidential systems, it is
the president; ii) in communist states, the Chairman of the Party is coded as the effective ruler.
The educational data for the leaders has been collected by Besley and Reynal-Querol.5 This
dataset contains information on leaders’ educational attainment for a core sample of 1,672 leaders
in 193 countries between 1847 and 2004. The database provides, as a measure of educated
4 For more details about this data see Goemans et al. (2009).
5 We thank Besley and Reynal Querol for providing their database.

9
leaders, a core variable called College degree which is a dummy variable equal to 1 if the leader
has college or post-graduate education (i.e. master’s degree or PhD).6 We use College degree to
construct the educational transitions which are explained in more detail below.
For population’s educational attainment at country level, income per capita and other country
characteristics we use World Bank data.7 Following Persson and Tabellini (2009), our measure of
democracy is based on the Polity IV data covering all major independent states in the global
system over the period 1800-2012. This data provides a measure of democracy (POLITY2) which
capture three different dimensions: how competitive and open the recruitment of chief executive
is; the extent to which the chief executive is constrained institutionally; and how competitive and
regulated political participation is (Besley et al. 2011). Finally, we assemble a new database
which contains information on 587 leaders and 165 countries where the primary completion rate
was available (2800 obs.).
Table 1 contains the description of the outcome variable and the explanatory variables used in this
work. Our outcome variable is population’s primary education completion rate (hereafter PCRT).
This variable is constructed as the ratio, expressed in percentage, between the total number of
new entrants in the last grade of primary education, regardless of age, and the total population of
the theoretical entrance age to the last grade of primary. It is calculated by taking the total number
of students in the last grade of primary school, minus the number of repeaters in that grade,
divided by the total number of children of official graduation age. The ratio can exceed 100% due
6 See Besley and Reynal-Querol (2011) for more details on the construction of this dataset.
7 Education data comes from wbopendata avaible in Stata developed by Azevedo (2011).
10
to over-aged and under-aged children who enter primary school late/early and/or repeat grades.
This variable is the one which is available for a broader sample of countries and years.
—Insert Table 1 here—
In order to assess the impact of changes in the education of political leaders, we create two types
of transitions: positive and negative. A positive transition is picked-up by a dummy variable that
takes the value 1 when a country transitions from a non-educated leader (a leader with no college
education) to an educated one (a leader with at least college education) until the end of the period
in our sample. Analogously, a negative transition is picked-up by a dummy variable that takes the
value 1 when a country transitions from an educated leader (a leader with at least college
education) to a non-educated one (a leader with no college education) until the end of the period.
Countries that experience both types of transitions are excluded from the sample. As we will
explain latter, countries that do not experience any transition will be used as a control group to
assess the impact of leaders educational transitions.
The leader characteristics we control for are education, age and time the leader remains in office
(tenure). Country controls are GDP per capita, number of grades (years) required to complete
primary education (duration of primary) and whether country’s political regime is a democracy or
not. In Table 2 we show a summary statistics of our data. In our sample, on average, the primary
completion rate is 73.3% and the duration of primary is about 5.75 years. In 52.1% of the years
there is a positive transition and in 7.9% of the years there is a negative transition. In 46.1% of the
country-year observations the regime is democratic. The average age of a leader is about 56 years
11
and the average number of years in office is about 8.52. We can observe that all of them vary
across countries and time.
—Insert Table 2 here—
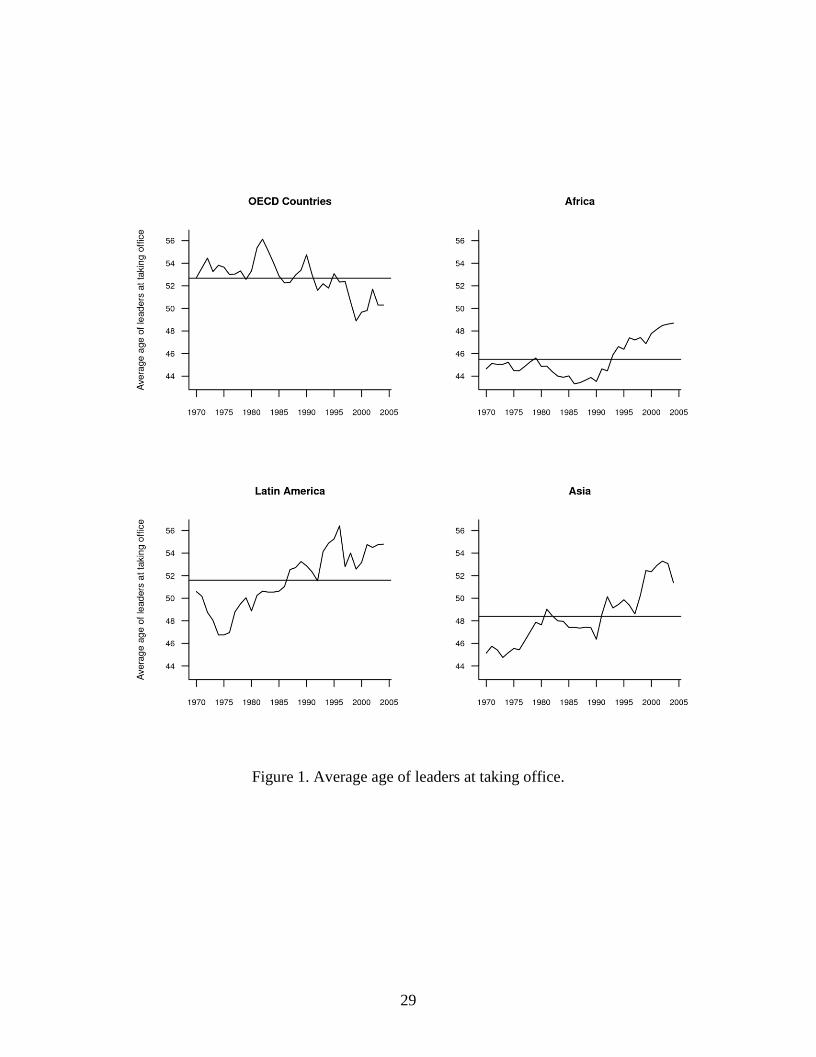
Figures 1 to 3 depict the evolution over time of different leaders’ characteristics (age, tenure and
education) for Latin America, Asia, Africa and OECD countries. In each graph of these figures
the horizontal line indicates the overall mean of the characteristic for all the period (1970-2004).
In Figure 1, we observe that the average age of African leaders upon entering in office is about 46
years , while in Asia it is about 49 years. Latin American leaders are, on average, 52 years old,
almost the same as in OECD countries which it is about 53. In the case of Latin America and
Asian countries, it can be seen a growing trend in the age of the leaders at taking office. In this
sense, more experienced leaders are being elected to rule as the case of OECD countries who
present the oldest leader’s age for holding office. In terms of the number of years in office, Figure
2 shows that African and Asian leaders spend, on average, more time in office that the heads of
government in Latin American and OECD countries. More specifically, on average the term of
office for African leaders is 9.79 years, for an Asian leaders is 9.53 years, while for Latin
American and OECD leaders are 5.64 and 4.91 years, respectively. Furthermore, we can observe
that African leaders, on average, remain in power much longer than their counterparts.
—Insert Figure 1 and 2 here—

12
Figure 3 looks at the variation over time in the proportion of leaders who have college degree
across countries. We observe a growing tendency in the proportion of educated leaders. In this
figure, Asian countries experience the more dramatic increment in the proportion of educated
leaders ranging from 46% in 1970 to 80% in 2004. On average, OECD and Latin American
countries have higher proportions of educated leaders, 85% and 86%, respectively; while these
figures in African and Asian countries are 62% and 66%, respectively. It is worth noting, that
Latin American and OECD countries present almost the same evolution in the characteristics of
the leaders ruling in these countries during the period of our study. The same applies for Asian
and African countries.
—Insert Figure 3 here—
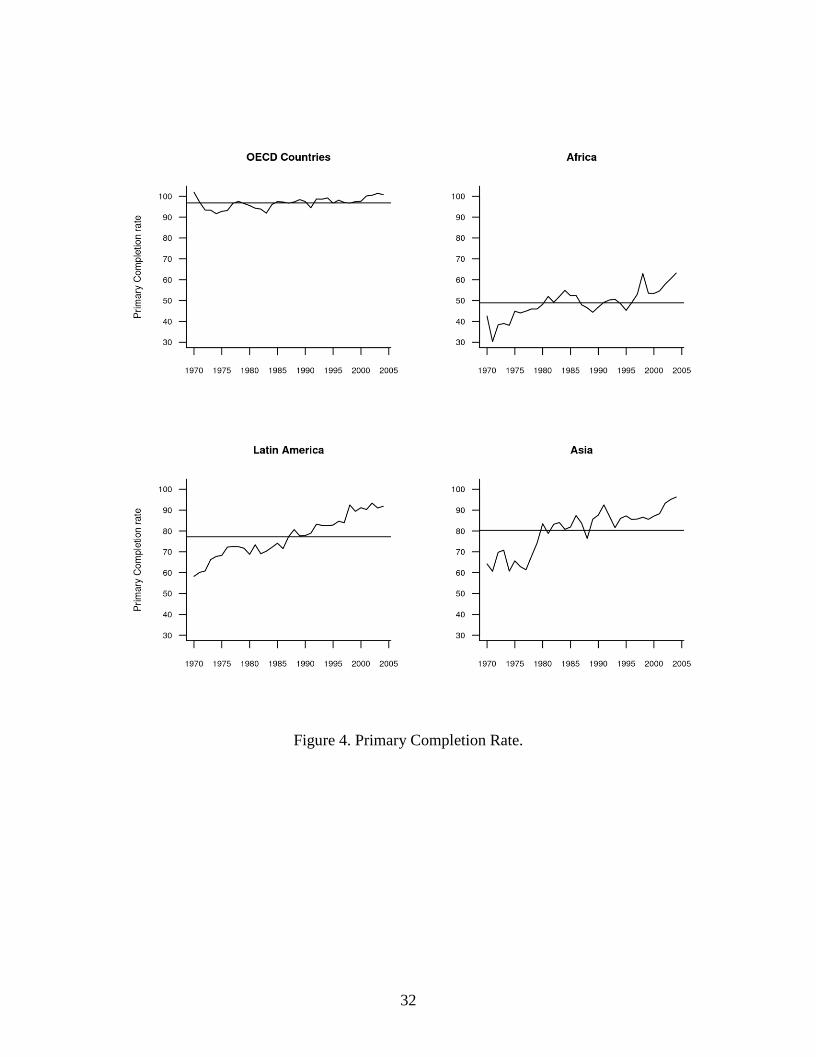
Figure 4 displays the evolution of primary completion rate (PCRT). In this figure, we observe
that, on average, OECD countries have the higher level of educational attainment given that about
96.77% of the students in the last grade of primary complete the primary education, while African
countries present the lowest rate (48.91%). For Latin American and Asian countries the rate of
students completing the last grade of primary are 77.19% and 80.26%, respectively. Comparing
Figures 3 and 4, we observe both an increase in the proportion of educated leaders and an
increase in the primary completion rate.
—Insert Figure 4 here—
13
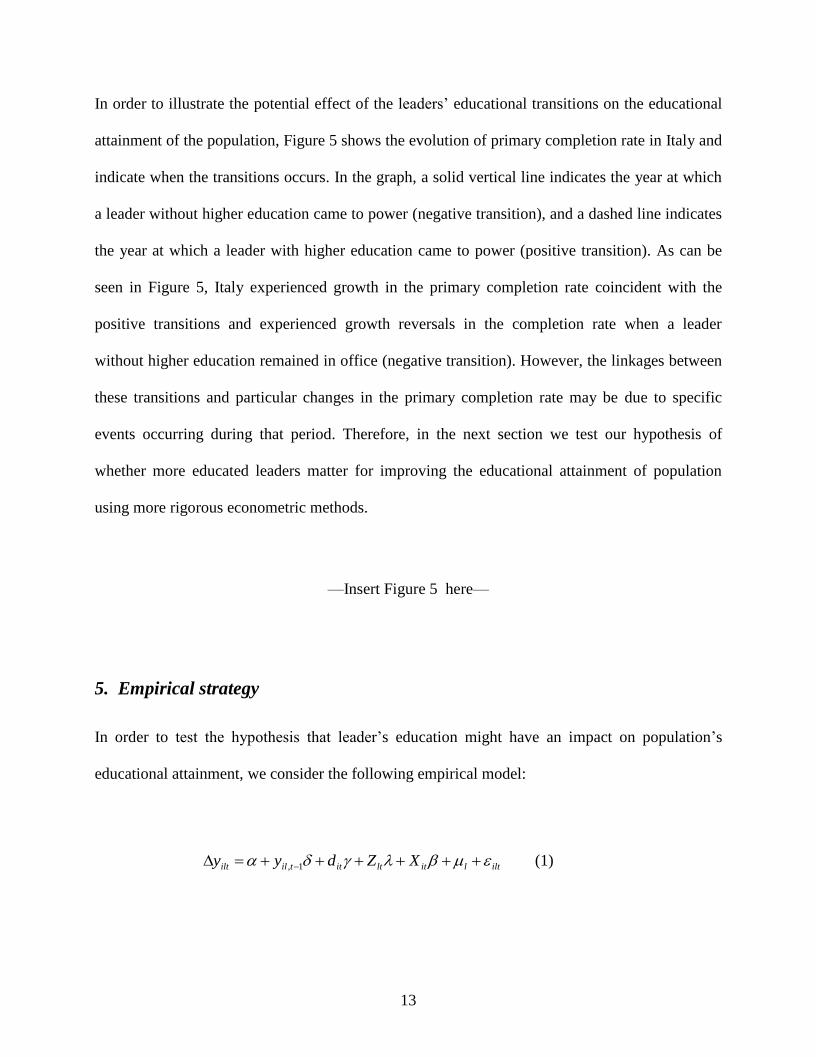
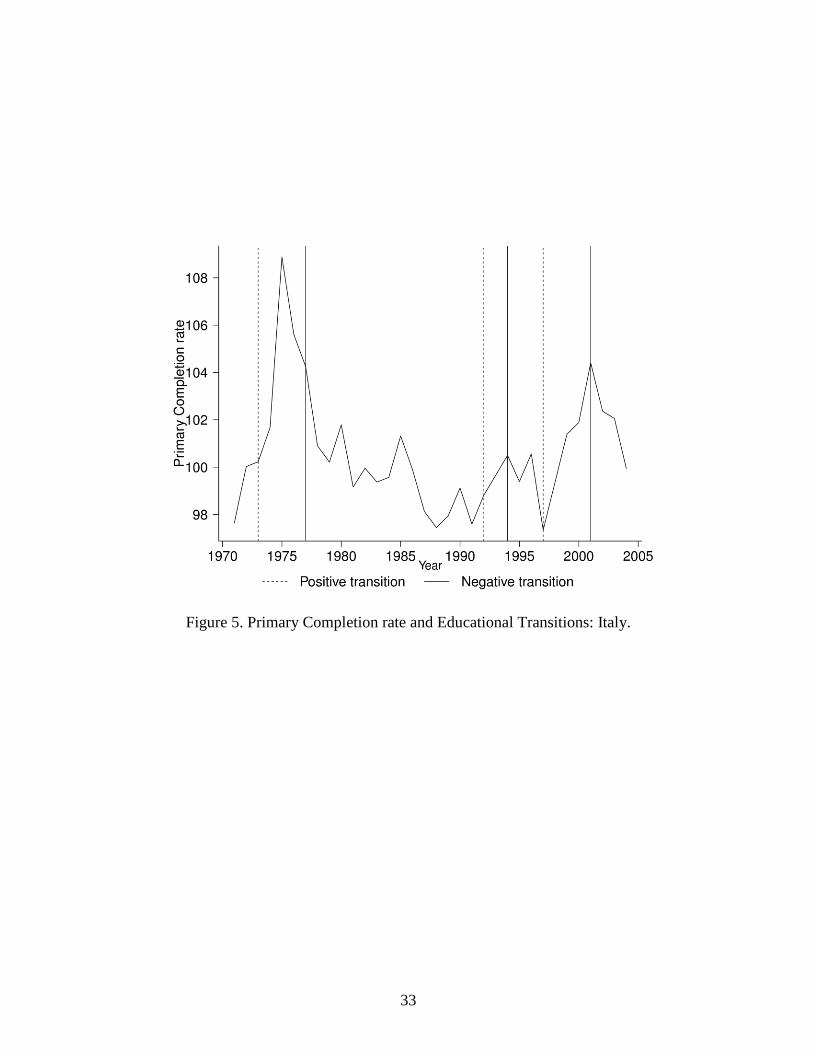
In order to illustrate the potential effect of the leaders’ educational transitions on the educational
attainment of the population, Figure 5 shows the evolution of primary completion rate in Italy and
indicate when the transitions occurs. In the graph, a solid vertical line indicates the year at which
a leader without higher education came to power (negative transition), and a dashed line indicates
the year at which a leader with higher education came to power (positive transition). As can be
seen in Figure 5, Italy experienced growth in the primary completion rate coincident with the
positive transitions and experienced growth reversals in the completion rate when a leader
without higher education remained in office (negative transition). However, the linkages between
these transitions and particular changes in the primary completion rate may be due to specific
events occurring during that period. Therefore, in the next section we test our hypothesis of
whether more educated leaders matter for improving the educational attainment of population
using more rigorous econometric methods.
—Insert Figure 5 here—
5. Empirical strategy
In order to test the hypothesis that leader’s education might have an impact on population’s
educational attainment, we consider the following empirical model:
iltlitltittililt XZdyy 1, (1)

14
where ilty is the educational attainment of population (Primary Education Completion Rate) in
country i at time t while leader l is in office; Δ is the difference operator; itd picks the transition,
the change of the educational level of the political leader in country i at time t; ltZ is a matrix
containing the leaders characteristics; itX is a matrix containing a set of covariates controlling for
country characteristics; l is a leader-specific fixed-effect; ilt is a time-varying error term, and
α, δ, γ, and β are a set of parameters to be estimated. Since we are interested in assessing the
impact of a characteristic of the political leader (education), the inclusion in equation (1) of leader
specific effects l is very convenient. On the one hand, we can control for leader’s unobserved
heterogeneity, which is not controlled for through the leader characteristics included in ltZ . On
the other hand, since one leader can be in office only in one country, the leader-specific effect
also absorbs the country-specific effects.
Our main coefficient of interest is γ, which reflects the effect of the educational transition of the
leader (positive or negative) on the growth rate of the primary completion rate (PCRT). In order
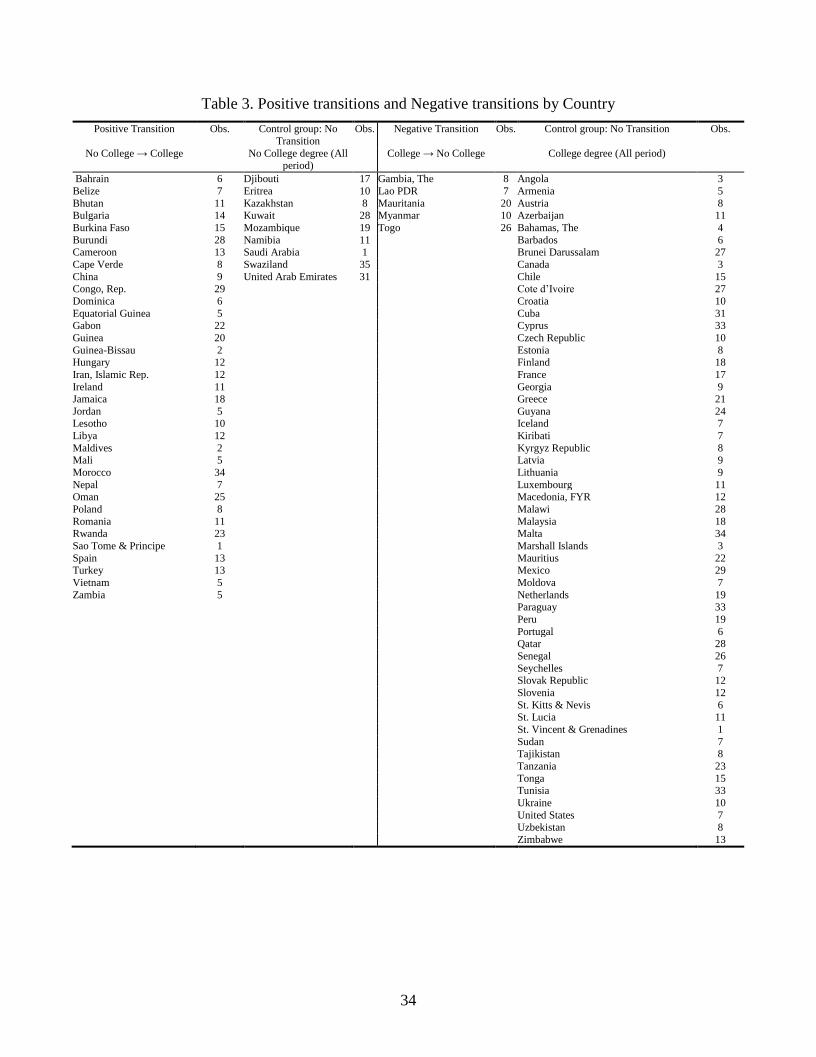
to assess the impact of an educational transition of the leader, countries are compared with a
control group of countries that not experience any transition. When we analyze the impact of a
positive transition (from a leader without to a leader with college education), countries
experiencing this type of transition are compared with countries that have non-educated leaders
during all period of study. On the contrary, countries experiencing negative transitions (from a
leader with to a leader without college education) are compared with countries that have leaders
with college education throughout the period of study (see Table 3).

15
Our outcome variable ( ilty ) is the Primary Completion Rate (PCRT). In order to capture potential
state-dependence in our outcome variable ( ity ), that is, changes in the level of education of the
population depends on its initial value when a leader takes office, we include our endogenous
variable lagged one period ( 1, tiy ). Those countries that have higher primary completion rate will
grow at a lower rate than those countries that have lower completion rates in t-1.
The characteristics of the leader we consider are age and years in office (tenure). Age is
considered since this variable can be associated with cognitive abilities which are important for
political decision making and accurately expressing one’s political preferences or the level of
government responsiveness (Lau and Redlawsk, 2008). Tenure is also important, since is a proxy
of the leader’s experience. In order to control for differences between income levels across
countries, we include the GDP per capita lagged one year, and GDP growth. We also control for
democracy status, since the effect of the leader is supposed to be stronger in autocratic
environments where there are fewer constraints on a leader’s power compared to democratic
regimes (Jones and Olken, 2005; Barro, 1999). Finally, we control for the duration of the primary
which may affect the primary completion rate, since the longer the duration of primary the more
likely to dropout (Angrist and Krueger, 1991).
The econometric strategy used to estimate equation (1) consists of differencing the equation in
order to remove the leader-specific effect l . However, differencing means that even strictly
exogenous variables can become endogenous, in addition to the presence of non-strictly
exogenous variables. Therefore, by construction, in equation (1) we have the lagged difference of
our endogenous variable and it may be that the difference of other explanatory variables is

16
correlated with the error term, which in turn creates a severe problem of endogeneity. Hence, our
core specification will include not only correlated and heteroskedastic residuals, but also non-
strictly exogenous and endogenous variables as covariates. In this context, a fixed-effects model
with the Newey–West corrected covariance matrix provides consistent estimates of the standard
errors in the presence of serial correlation and heteroskedasticity in the residuals. However, the
presence of endogenous covariates creates severe identification problems in the econometric
estimation that in turn lead to inconsistent estimate of model.
In order to estimate equation (1), we use a variant of the Arellano and Bond (1991) Generalized
Method of Moments (GMM) estimator. Arellano and Bover (1995), Blundell and Bond (1998)
and Bond (2002) show that often lags for the levels of these variables are poor instruments, and
they suggest suitable conditions for fixing this problem. One alternative is to instrument
endogenous and non-strictly exogenous variables with lags of their own first differences, instead
of with lags for the variables in levels. The GMM variant of the original Arellano and Bond’s
estimator used here incorporates these elements. In particular, the method we use here has both
one-and two-step versions. We adopt the two-step method as it is the most efficient, though the
estimated variances tend to be biased downwards. In order to fix this, we apply the finite-sample
correction of the two-step covariance matrix proposed in Windmeijer (2005), without which those
standard errors tend to be severely downward biased.8
8 See Roodman (2009) for details.

17
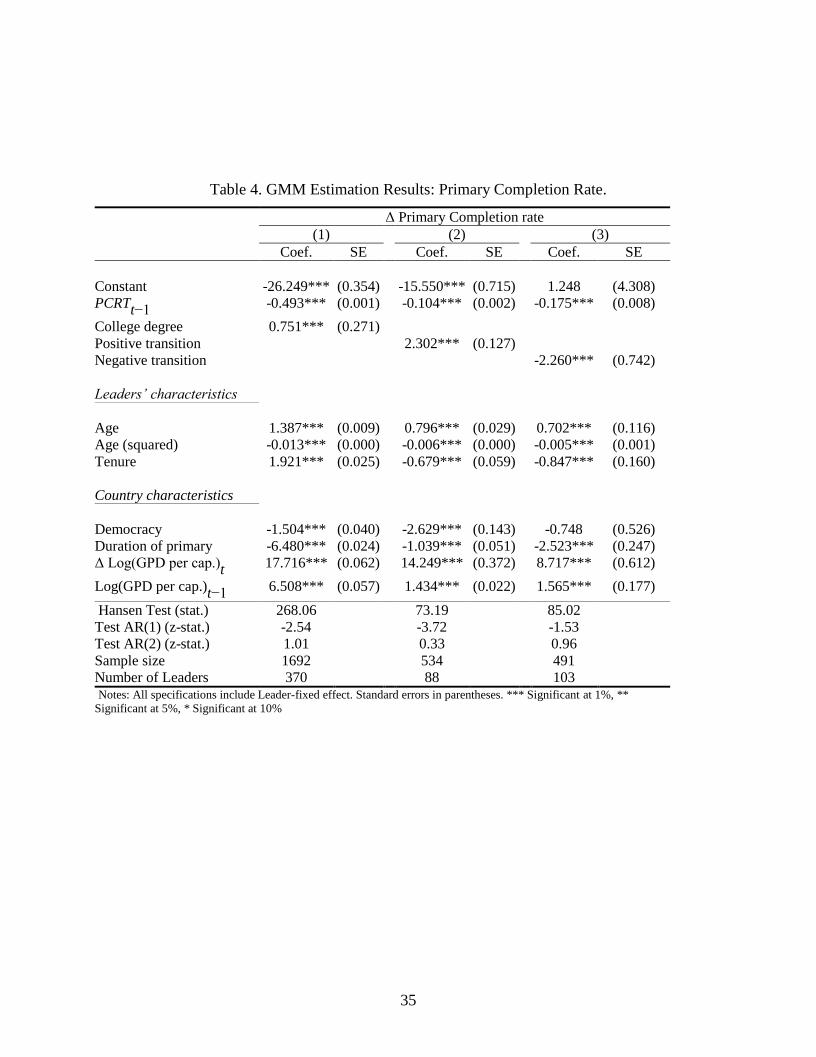
6. Empirical Results
Table 4 report the results from the estimation of our core model (equation 1) by the Generalized
Method of Moments (GMM) . Column (1) presents the results considering just the educational
level of the leader by a dummy variable (college degree or not). Columns (2) and (3) show the
effects of the positive and negative transitions on the PCRT, respectively. As we mention in the
previous section, the control group for the positive transition are those countries which have non-
educated leader all period of study and for negative transition are those countries that have
leaders with college education throughout the period of study. Hence, the interpretation of all
results regarding the impact of the educational transition is relative to these baseline groups. We
first comment on the results regarding our control variables, and latter we focus on our variables
of interest.
—Insert Table 4 here—
Our results indicates that laggard countries in terms of educational achievement tend to
experience a greater growth rate of the PCRT, since we find a significant and negative effect of
the initial value of the primary completion rate (PCRTt-1) for all specifications.
Controlling for leader’s characteristics, we find that age and tenure, which are proxies of leader’s
experience affect positively the educational attainment of the population. This result indicates that
the greater the experience of leaders the greater the effect on the educational level of the

18
population, since they are more able to make decisions given his/her previous experience. We
consider a squared polynomial on age of the political leader and obtain that the effect of age is
inverted U-shaped. This result indicated that the effect is positive but decreasing.
With respect to country variables, we observe that logarithm of GDP per capita lagged one period
and the growth rate of the log GDP per capita exert a positive and statistically significant effect
on the growth rate of the PCRT. On the contrary, the duration of primary education and
democracy has a negative effect on the growth rate of PCRT. This negative effect of duration of
primary indicates that in countries where students have to spend more years in primary education
may also experience higher levels of drop-outs. The negative effect obtained for democratic
countries can be explained by the fact that high levels of schooling are both a prerequisite for
democracy and a major cause of democratization (Lipset, 1959; Barro, 1999; Glaeser et al.,
2004). 9 Therefore, democratic countries with higher levels of primary completion rate will have a
lower growth rate compared to non-democratic countries where the educational attainment tend to
be lower.
Concerning our specific research question our results reveal that leaders’ education indeed affects
the education level of population. Column (1) shows that in the annual growth rate of the PCRT is
larger in countries where the leader possesses a college degree. However, this result could be
explained by the fact that in countries more prone to have educated leaders, also exhibit a
structural propensity to experience a higher growth rate of the PCRT. In order to disentangle this,
we also include the impact of both transitions.
9 According to Acemoglu et al. (2005), education is argued to promote democracy both because it enables a
“culture of democracy” to develop and because it leads to greater prosperity, which is also thought to cause
political development.

19
Ours results shows that when a positive transition occurs there is an increase in the level of
educational attainment, which means that the performance of leaders ruling with (at least) college
degree is better than their counterparts without higher education. This result supports the main
hypothesis we propose in this study, since the educational attainment of population increases
when the country transitions from a non-educated leader to an educated one compared to those
countries with non-educated leaders all the time.
Other result that supports our hypothesis is that unlike positive transition, we find that
transitioning from an educated leader to a less educated one the educational attainment of
population is impacted negatively. We obtain that during the negative transitions, the primary
completion rate experiences a growth reversal comparing to those countries which have educated
leader all period of study. The statistical significant effect of our two main explanatory variables
measuring educational transitions support the finding with the educational level, showing that
more educated leaders lead to more educated citizens.
Finally, we also report the Hansen test of over-identifying restrictions, which is a test of the
validity of instrumental variables.10
The Hansen J statistic replaces the Sargan test used in the
original one-step Arellano-Bond estimator, since the Hansen test is robust to heteroskedasticity or
autocorrelation.11
We find that the validity of the instruments is confirmed for all the
specifications used, since χ2 statistic is not significant in any model. Alternatively, we also show
10
Under the null hypothesis the statistic follows a chi-square where the degrees of freedom are determined by the
number of instruments used in the estimation. 11
See Roodman (2009) for details.

20
the results of the Arellano-Bond test for autocorrelation AR(1) and AR(2). 12
We observe that
AR(1) structure cannot be rejected for estimated models in Columns (1) and (2), while the AR(2)
structure is rejected for all of them. The results of these tests indicate that there is no serial
correlation between the first-differenced variables used as instruments and the first differences of
the residuals ilt . Therefore, they are good instruments.13
7. Conclusions
In this paper we estimate the effect of educational transitions on the educational attainment of
population during the period 1970-2004. We find that more educated leaders lead to more
educated citizens. We find that the educational attainment of population increases when the
country transitions from a non-educated leader to an educated leader compared to those countries
with non-educated leaders all the time. On the contrary, a negative transition, i.e. from a highly
educated leader to a leader with just secondary education, have a negative impact on the
educational attainment of the population. These findings support the main hypothesis we propose
in this study. We hypothesize that the positive link between the education of the political leader
and the education of the population we find here, is as plausible explanation for the effect of
leader’s education on economic growth found in the previous literature. We contribute to the
literature by providing further evidence in the scant but emerging literature that links leaders’
12
The null hypothesis is no autocorrelation and is applied to the differenced residuals. The test for AR (1) process
in first differences usually rejects the null hypothesis because ilt is mathematically related to 1, til with
which it shares a 1, til term. So, negative first-order serial correlation is expected in differences and evidence
of it is uninformative. The test for AR (2) in first differences is more important, because it will detect
autocorrelation in levels between the 1, til in ilt and the 2, til in 2, til .
13 An AR(1) structure implies that serial autocorrelation is removed after one difference, whereas a higher order
structure AR(s), with s≥2, means that a first difference is not enough to remove autocorrelation. Given that the
estimation method used here uses as instruments the first differences, the persistence of this correlation after
applying a first difference would imply that they are endogenous, and hence bad instruments.
21
characteristics with countries’ performance. All this evidence taken together suggests that the
socio-economic background of political leaders may be informative about the type of policies
they can be more sensitive. Therefore, this claims for the convenience of the use of “open lists” in
democratic countries, where voters can decide not only about the party in the government but also
about the individuals in each list.
Acknowledgment
We wish to thank Timothy Besley and Marta Reynal-Querol for generously agreeing to make the
data in Besley and Reynal-Querol (2011) available to us. We acknowledge the financial support
from the Spanish Ministry of Education and Science through Grant ECO2010-20829.
References
Abrams, B. A. and Settle, R. F. (1999). Women’s Suffrage and the Growth of the Welfare State. Public
Choice, 100(3-4):289–300.
Acemoglu, D., Johnson, S., Robinson, J. A., and Yared, P. (2005). From Education to Democracy?
American Economic Review, 95(2):44–49.
Aidt, T. and Dallal, B. (2008). Female Voting Power: The Contribution of Women’s Suffrage to
theGrowth of Social Spending in Western Europe (1869–1960). Public Choice, 134(3):391–417.
22
Angrist, J. D. and Krueger, A. B. (1991). Does Compulsory School Attendance Affect Schooling and
Earnings? The Quarterly Journal of Economics, 106(4):979–1014.
Arellano, M. and Bond, S. (1991). Some Tests of Specification for Panel Data: Monte Carlo Evidence and
an Application to Employment Equations. The Review of Economic Studies, 58(2):277–297.
Arellano, M. and Bover, O. (1995). Another Look at the Instrumental Variable Estimation of Error-
components Models. Journal of Econometrics, 68(1):29 – 51.
Azevedo, J. P. (2011). WBOPENDATA: Stata module to access World Bank databases. Statistical
Software Components, Boston College Department of Economics.
Baltrunaite, A., Bello, P., Casarico, A., and Profeta, P. (2012). Gender Quotas and the Quality of
Politicians. CESifo Working Paper Series No. 3734, CESifo Group Munich.
Barro, R. J. (1991). Economic Growth in a Cross Section of Countries. The Quarterly Journal of
Economics, 106(2):407–43.
Barro, R. J. (1999). Determinants of Democracy. Journal of Political Economy, 107(S6):S158–S183.
Barro, R. J. and Lee, J.-W. (2001). International Data on Educational Attainment: Updates and
Implications. Oxford Economic Papers, 53(3):541–563.
Benhabib, J. and Spiegel, M. M. (1994). The Role of Human Capital in Economic Development Evidence
From Aggregate Cross-country Data. Journal of Monetary Economics, 34(2):143 – 173.

23
Besley, T. and Coate, S. (1997). An Economic Model of Representative Democracy. The Quarterly
Journal of Economics, 112(1):85–114.
Besley, T., Montalvo, J. G., and Reynal-Querol, M. (2011). Do Educated Leaders Matter? The Economic
Journal, 121(554):205–227.
Besley, T. and Reynal-Querol, M. (2011). Do Democracies Select More Educated Leaders? . American
Political Science Review, 105(3):552–566.
Blundell, R. and Bond, S. (1998). Initial Conditions and Moment Restrictions in Dynamic Panel Data
Models. Journal of Econometrics, 87(1):115 – 143.
Bond, S. (2002). Dynamic Panel Data Models: A Guide to Micro Data Methods and Practice. Portuguese
Economic Journal, 1(2):141–162.
Card, D. (1999). The Causal Effect of Education on Earnings. In Ashenfelter, O. C. and Card, D., editors,
Handbook of Labor Economics, volume 3, Part A, pages 1801 – 1863. Elsevier.
Chattopadhyay, R. and Duflo, E. (2004). Women as Policy Makers: Evidence from a Randomized Policy
Experiment in India. Econometrica, 72(5):1409–1443.
Congleton, R. D. and Zhang, Y. (2009). Is it All About Competence? The Human Capital of U.S.
Presidents and Economic Performance. Working papers series, SSRN’s eLibrary.
Constant, A. F. and Tien, B. N. (2010). African Leaders: Their Education Abroad and FDI Flows. IZA
Discussion Papers 5353, Institute for the Study of Labor (IZA).
24
Dee, T. S. (2004). Are There Civic Returns to Education? Journal of Public Economics, 88(9-10):1697 –
1720.
Dreher, A., Lamla, M. J., Lein, S. M., and Somogyi, F. (2009). The Impact of Political Leaders’ Profession
and Education on Reforms. Journal of Comparative Economics, 37(1):169–193.
Göhlmann, S. and Vaubel, R. (2007). The Educational and Occupational Background of Central Bankers
and Its Effect on Inflation: An Empirical Analysis. European Economic Review, 51(4):925 – 941.
Glaeser, E., La Porta, R., Lopez-de Silanes, F., and Shleifer, A. (2004). Do Institutions Cause Growth?
Journal of Economic Growth, 9(3):271–303.
Goemans, H. E., Gleditsch, K. S., and Chiozza, G. (2009). Introducing Archigos: A Dataset of Political
Leaders. Journal of Peace Research, 46(2):269–283.
Hayo, B. and Neumeier, F. (2012). Leaders’ Impact on Public Spending Priorities: The Case of the
German Laender. Technical report, Joint Discussion Paper Series in Economics.
Hayo, B. and Voigt, S. (2011). Endogenous Constitutions: Politics and Politicians Matter, Economic
Outcomes Don’t. Journal of Economic Behavior & Organization, 88(in press):47 – 61.
Jones, B. F. and Olken, B. A. (2005). Do Leaders Matter? National Leadership and Growth Since World
War II. The Quarterly Journal of Economics, 120(3):835–864.

25
Jones, B. F. and Olken, B. A. (2009). Hit or Miss? The Effect of Assassinations on Institutions and War.
American Economic Journal: Macroeconomics, 1(2):55–87.
Jones, L. E. and Manuelli, R. (1990). A Convex Model of Equilibrium Growth: Theory and Policy
Implications. Journal of Political Economy, 98(5):1008–1038.
Lau, R. R. and Redlawsk, D. P. (2008). Older but Wiser? Effects of Age on Political Cognition. The
Journal of Politics, 70(1):168–185.
Lipset, S. M. (1959). Some Social Requisites of Democracy: Economic Development and Political
Legitimacy. American Political Science Review, 53(1):69–105.
Lott, J. R. and Kenny, L. W. (1999). Did Women’s Suffrage Change the Size and Scope of Government?
Journal of Political Economy, 107(6):1163–1198.
Lucas, R. E. (1988). On the Mechanics of Economic Development. Journal of Monetary Economics,
22(1):3 – 42.
Milligan, K., Moretti, E., and Oreopoulos, P. (2004). Does Education Improve Citizenship? Evidence
from the United States and the United Kingdom. Journal of Public Economics, 88(9-10):1667–1695.
Osborne, M. J. and Slivinski, A. (1996). A Model of Political Competition with Citizen-Candidates. The
Quarterly Journal of Economics, 111(1):65–96.
Persson, T. and Tabellini, G. (2009). Democratic Capital: The Nexus of Political and Economic Change.
American Economic Journal: Macroeconomics, 1(2):88–126.
26
Romer, P. M. (1986). Increasing Returns and Long-Run Growth. Journal of Political Economy,
94(5):1002–1037.
Romer, P. M. (1989). Human Capital And Growth: Theory and Evidence. NBER Working Papers 3173,
National Bureau of Economic Research, Inc.
Roodman, D. (2009). How to Do xtabond2: An Introduction to Difference and System GMM in Stata.
Stata Journal, 9(1):86–136.
Sala-I-Martin, X., Doppelhofer, G., and Miller, R. I. (2004). Determinants of Long-Term Growth: A
Bayesian Averaging of Classical Estimates (BACE) Approach. American Economic Review, 94(4):813–
835.
Svaleryd, H. (2009). Women’s Representation and Public Spending. European Journal of Political
Economy, 25(2):186 – 198.
Windmeijer, F. (2005). A Finite Sample Correction for the Variance of Linear Efficient Two-step GMM
Estimators. Journal of Econometrics, 126(1):25 – 51.
Wolf, A. (2002). Does Education Matter? : Myths About Education and Economic Growth. Penguin
Books. Penguin Books Limited.
27
Appendix
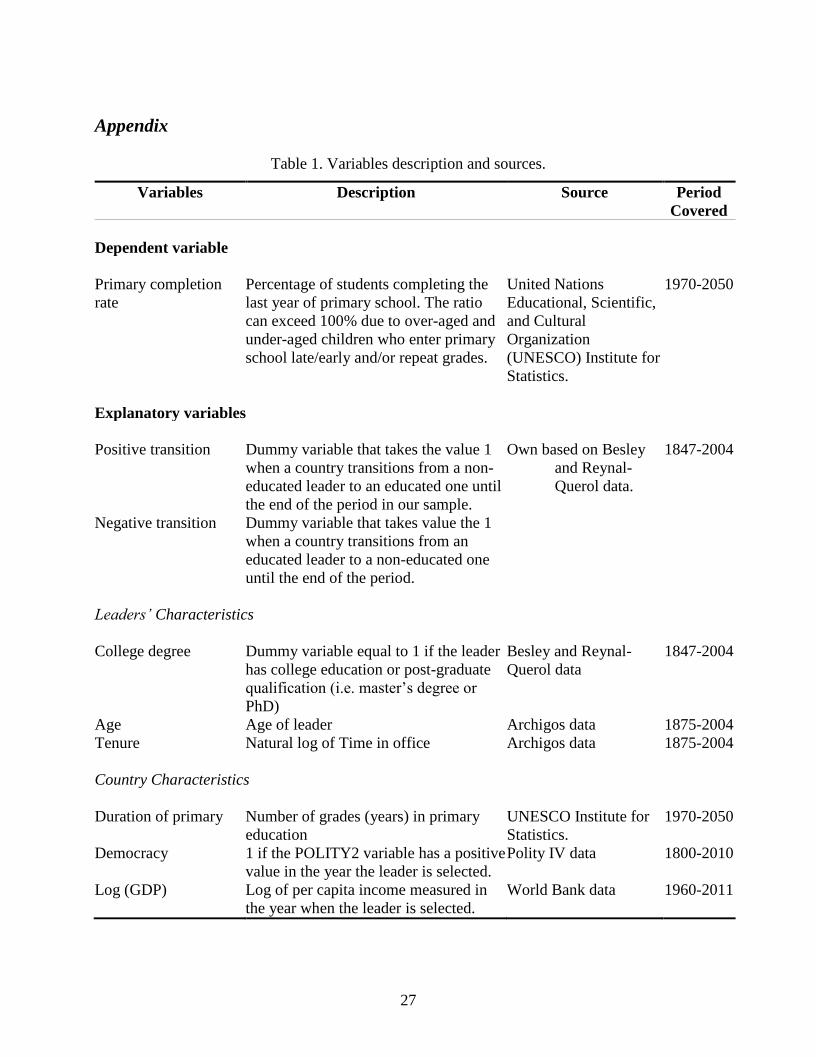
Table 1. Variables description and sources.
Variables Description Source Period
Covered
Dependent variable
Primary completion
rate
Percentage of students completing the
last year of primary school. The ratio
can exceed 100% due to over-aged and
under-aged children who enter primary
school late/early and/or repeat grades.
United Nations
Educational, Scientific,
and Cultural
Organization
(UNESCO) Institute for
Statistics.
1970-2050
Explanatory variables
Positive transition Dummy variable that takes the value 1
when a country transitions from a non-
educated leader to an educated one until
the end of the period in our sample.
Own based on Besley
and Reynal-
Querol data.
1847-2004
Negative transition Dummy variable that takes value the 1
when a country transitions from an
educated leader to a non-educated one
until the end of the period.
Leaders’ Characteristics
College degree Dummy variable equal to 1 if the leader
has college education or post-graduate
qualification (i.e. master’s degree or
PhD)
Besley and Reynal-
Querol data
1847-2004
Age Age of leader Archigos data 1875-2004
Tenure Natural log of Time in office Archigos data 1875-2004
Country Characteristics
Duration of primary Number of grades (years) in primary
education
UNESCO Institute for
Statistics.
1970-2050
Democracy 1 if the POLITY2 variable has a positive
value in the year the leader is selected.
Polity IV data 1800-2010
Log (GDP) Log of per capita income measured in
the year when the leader is selected.
World Bank data 1960-2011

28
Table 2. Summary statistics.
Mean Std. Dev. Observations
overall between within N n
Primary Completion rate
Levels 73.321 28.871 26.762 11.209 2800 165
Δ 0.868 5.211 2.250 5.046 2293 158
Positive transition 0.521 0.500 0.423 0.309 817 44
Negative transition 0.079 0.269 0.222 0.115 904 59
College degree 0.718 0.450 0.355 0.288 2800 165
Age 56.274 11.530 8.917 8.186 2800 165
Tenure (years) 8.522 8.283 5.323 5.796 2800 165
Democracy 0.461 0.499 0.424 0.290 2590 147
Duration of primary 5.756 0.825 0.935 0.210 2800 165
Log(GPD per cap.) 7.453 1.498 1.521 0.216 2594 161
Notes: N=Number of observations per Country-years; n=Number of Countries
29
Figure 1. Average age of leaders at taking office.

30
Figure 2. Average tenure of leaders (expressed in years).

31
Figure 3. Proportion of Leaders with College degree.
32
Figure 4. Primary Completion Rate.
33
Figure 5. Primary Completion rate and Educational Transitions: Italy.
34
Table 3. Positive transitions and Negative transitions by Country
Positive Transition Obs. Control group: No
Transition
Obs. Negative Transition Obs. Control group: No Transition Obs.
No College → College No College degree (All period)
College → No College College degree (All period)
Bahrain 6 Djibouti 17 Gambia, The 8 Angola 3
Belize 7 Eritrea 10 Lao PDR 7 Armenia 5
Bhutan 11 Kazakhstan 8 Mauritania 20 Austria 8 Bulgaria 14 Kuwait 28 Myanmar 10 Azerbaijan 11
Burkina Faso 15 Mozambique 19 Togo 26 Bahamas, The 4
Burundi 28 Namibia 11 Barbados 6 Cameroon 13 Saudi Arabia 1 Brunei Darussalam 27
Cape Verde 8 Swaziland 35 Canada 3
China 9 United Arab Emirates 31 Chile 15 Congo, Rep. 29 Cote d’Ivoire 27
Dominica 6 Croatia 10
Equatorial Guinea 5 Cuba 31 Gabon 22 Cyprus 33
Guinea 20 Czech Republic 10
Guinea-Bissau 2 Estonia 8 Hungary 12 Finland 18
Iran, Islamic Rep. 12 France 17
Ireland 11 Georgia 9 Jamaica 18 Greece 21
Jordan 5 Guyana 24 Lesotho 10 Iceland 7
Libya 12 Kiribati 7
Maldives 2 Kyrgyz Republic 8 Mali 5 Latvia 9
Morocco 34 Lithuania 9
Nepal 7 Luxembourg 11 Oman 25 Macedonia, FYR 12
Poland 8 Malawi 28
Romania 11 Malaysia 18 Rwanda 23 Malta 34
Sao Tome & Principe 1 Marshall Islands 3
Spain 13 Mauritius 22 Turkey 13 Mexico 29
Vietnam 5 Moldova 7
Zambia 5 Netherlands 19 Paraguay 33
Peru 19
Portugal 6 Qatar 28
Senegal 26
Seychelles 7 Slovak Republic 12
Slovenia 12
St. Kitts & Nevis 6 St. Lucia 11
St. Vincent & Grenadines 1
Sudan 7 Tajikistan 8
Tanzania 23
Tonga 15 Tunisia 33
Ukraine 10
United States 7
Uzbekistan 8
Zimbabwe 13
35
Table 4. GMM Estimation Results: Primary Completion Rate.
Δ Primary Completion rate
(1) (2) (3)
Coef. SE Coef. SE Coef. SE
Constant -26.249*** (0.354) -15.550*** (0.715) 1.248 (4.308)
PCRTt−1
-0.493*** (0.001) -0.104*** (0.002) -0.175*** (0.008)
College degree 0.751*** (0.271)
Positive transition 2.302*** (0.127)
Negative transition -2.260*** (0.742)
Leaders’ characteristics
Age 1.387*** (0.009) 0.796*** (0.029) 0.702*** (0.116)
Age (squared) -0.013*** (0.000) -0.006*** (0.000) -0.005*** (0.001)
Tenure 1.921*** (0.025) -0.679*** (0.059) -0.847*** (0.160)
Country characteristics
Democracy -1.504*** (0.040) -2.629*** (0.143) -0.748 (0.526)
Duration of primary -6.480*** (0.024) -1.039*** (0.051) -2.523*** (0.247)
Δ Log(GPD per cap.)t 17.716*** (0.062) 14.249*** (0.372) 8.717*** (0.612)
Log(GPD per cap.)t−1
6.508*** (0.057) 1.434*** (0.022) 1.565*** (0.177)
Hansen Test (stat.) 268.06 73.19 85.02
Test AR(1) (z-stat.) -2.54 -3.72 -1.53
Test AR(2) (z-stat.) 1.01 0.33 0.96
Sample size 1692 534 491
Number of Leaders 370 88 103 Notes: All specifications include Leader-fixed effect. Standard errors in parentheses. *** Significant at 1%, **
Significant at 5%, * Significant at 10%