Embed Size (px)
Citation preview

Do Momentum-Based Strategies Work in Real EstateInvestment Trust?
Terence Tai-Leung Chong1, Hugo Tak-Sang Ip1 & Yuchen Liu2
1The Chinese University of Hong Kong2Columbia UniversityE-mail: [email protected]; [email protected]; [email protected]; [email protected]
Received: 30 November 2020; Revised: 14 December 2020;Accepted 21 December 2020; Publication: 10 February 2021
Abstract: Research on the time series momentum for the Real Estate Investment Trust (REIT)
is rare in the existing literature. This paper aims to contribute to the literature by examining
whether time series momentum works for the United States REIT market. We also compare
profitability with the standard price momentum for REITs, especially with more recent
data during the zerointerestrate period from 2008 to 2015. It is found that taking long
positions by employing momentum strategies can generate an average monthly return of
about 0% to 5% for the REITs in the United States. The momentum profits do fluctuate
across the sample period but do not diminish over time.
Keywords: Momentum Strategies; Time Series Momentum; REITs.
1. Introduction
There is considerable evidence in the literature supporting the effectivenessof momentum strategies. Jegadeesh and Titman (1993) examine variousmomentum strategies for the US stock market and document that strategieswhich buy stocks with high returns over the previous 3 to 12 months and sellstocks with poor returns over the same period earn profits of about 1% permonth for the following 3 to 12 months. They argue that the market underreactsto firmspecific information. Jegadeesh and Titman (2001) find momentumstrategies profitable, and that past winners outperform past losers by aboutthe same magnitude as earlier periods. NovyMarx (2012) sheds new light onthe term structure of momentum. It is shown that for the US stock markets,momentum strategies that rely on returns from the past 7 to 12 months performbetter than using recent past returns of 2 to 6 months. In other words, strategiesbased on relatively intermediate past performance outperform strategies basedon relatively recent performance. Similar results can be obtained ininternational stock market indices, foreign exchange and commodities.Moskowitz et al. (2012) introduce the concept of time series momentum, wherean asset’s own historical returns can predict its future returns. In traditionalprice momentum strategies, researchers sort winners and losers by relativeperformance and will consequently long the relative winners and short therelative losers. In the work of Moskowitz et al. (2012), within a particular
Asian Journal of Economics and Finance. 2021, 3, 1 : 93-113 ARF INDIAAcademic Open Access Publishingwww.arfjournals.com

94 Asian Journal of Economics and Finance. 2021, 3, 1
segment they calculate the returns on assets over the past 1 to 48 months.Instead of taking longshort positions according to relative performance, theylong all securities that have positive returns and short all that have negativereturns. They discern that this time series momentum can be found in stockmarket indices, foreign exchange, bonds as well as commodities.
This approach of sorting and trading all the stocks in a market is notpractical empirically. Ordinary investors will not engage in such strategies.Instead, investors tend to be interested in a particular segment of the markets.In recent years, a number of studies have focused on Real Estate InvestmentTrust (REIT) markets. Chui et al. (2003) find that price momentum generatespositive profits in the REIT market over the period from 1982 to 2000, in whichthe returns are higher from 1993 to 2000. Hung and Glascock (2008) find thatREIT momentum returns are higher during up markets and are positivelycorrelated with the difference between the dividendprice ratios of winnersand losers. In 2010, their further research found that momentum profits forREITs are higher when there is higher volatility.
However, no studies on time series momentum strategies for REITs havebeen reported in the literature. In this paper, we investigate whether timeseries momentum exists in the US REIT market. We will compare profitabilitywith the standard price momentum for REITs, especially with more recentdata during the zerointerestrate period from 2008 to 2015. In addition, wewill check if there is termstructure momentum, as described by NovyMarx(2012).
The remainder of this paper is organized as follows. Section 2 describesthe data and discusses the research methodology. Section 3 reports theempirical results of price momentum strategies. Section 4 details theperformance of time series momentum strategies. Section 5 concludes thepaper.
2. Data and Methodology
In our study, endofmonth closing price data were obtained from the ThomsonReuters Eikon (Datastream). We studied all 148 constituents of the MSCI USREIT Index (RMZ) as at June 2016, over the period from January 1997 to July2016, excluding those that were delisted and had trading suspended. The MSCIUS REIT Index represents about 99% of the universe of US REIT markets,according to the Global Industry Classification Standard (GICS).
Table 1 provides the descriptive statistics of the average monthly pricereturns for each of these 148 REIT constituents. For the whole sample, themaximum average monthly return is 3.911%, while the minimum is 2.165%.We observe that 136 of the 148 REITs experienced positive monthly returns onaverage, and only a minority of 12 suffered negative average monthly returns.The average monthly return of all REITs is 0.848%. These imply that investorstaking long positions for REITs enjoyed profits in general.

Do Momentumbased Strategies Work in Real Estate Investment Trust? 95
Table 1: Descriptive Statistics, Average Monthly Returns of US REITs
Company Ticker AverageName Monthly
Returns
Acadia Realty Trust AKR 0.787%Agree Realty Corp ADC 0.712%Alexander’s Inc ALX 1.135%Alexandria Real Estate Equities Inc ARE 1.037%American Assets Trust Inc AAT 1.313%American Campus Communities Inc ACC 0.991%American Homes 4 Rent Class A AMH 1.036%Apartment Investment & Management Co AIV 0.869%Apple Hospitality REIT Inc APLE 0.818%Ashford Hospitality Prime Inc AHP 0.525%Ashford Hospitality Trust Inc AHT 1.115%AvalonBay Communities Inc AVB 0.951%Boston Properties Inc BXP 0.981%Brandywine Realty Trust BDN 0.631%Brixmor Property Group Inc BRX 1.135%Camden Property Trust CPT 0.754%Care Capital Properties Inc CCP 0.497%CareTrust REIT Inc CTRE 1.017%CBL & Associates Properties Inc CBL 1.173%Cedar Realty Trust Inc CDR 1.286%Chatham Lodging Trust CLDT 0.577%Chesapeake Lodging Trust CHSP 0.594%Colony Starwood Homes SFR 0.529%Columbia Property Trust Inc CXP 0.402%CoreSite Realty Corp COR 2.592%Corporate Office Properties Trust OFC 1.046%Corrections Corp of America CXW 1.182%Cousins Properties Inc CUZ 0.233%CubeSmart CUBE 1.117%CyrusOne Inc CONE 2.477%DCT Industrial Trust Inc DCT 0.429%DDR Corp DDR 0.828%DiamondRock Hospitality Co DRH 0.579%Digital Realty Trust Inc DLR 1.820%Douglas Emmett Inc DEI 0.834%Duke Realty Corp DRE 0.645%DuPont Fabros Technology Inc DFT 2.102%Easterly Government Properties Inc DEA 1.496%EastGroup Properties Inc EGP 0.806%Education Realty Trust Inc EDR 0.482%Empire State Realty Trust Inc ESRT 1.337%EPR Properties EPR 1.049%Equinix Inc EQIX 3.911%Equity Commonwealth EQC 0.021%Equity LifeStyle Properties Inc ELS 1.050%
contd. table 1

96 Asian Journal of Economics and Finance. 2021, 3, 1
Equity One Inc EQY 0.748%Equity Residential EQR 0.785%Essex Property Trust Inc ESS 1.109%Extra Space Storage Inc EXR 1.632%Federal Realty Investment Trust FRT 0.985%FelCor Lodging Trust Inc FCH 0.435%First Industrial Realty Trust Inc FR 0.704%First Potomac Realty Trust FPO 0.044%Forest City Realty Trust Inc Class A FCEA 1.452%Four Corners Property Trust Inc FCPT 3.307%Franklin Street Properties Corp FSP 0.053%Gaming and Leisure Properties Inc GLPI 0.263%General Growth Properties Inc GGP 2.212%GEO Group Inc GEO 1.390%Getty Realty Corp GTY 0.641%Global Net Lease Inc GNL 0.188%Government Properties Income Trust GOV 0.364%Gramercy Property Trust GPT 0.459%HCP Inc HCP 0.627%Healthcare Realty Trust Inc HR 0.419%Healthcare Trust of America Inc Class A HTA 1.261%Hersha Hospitality Trust Class A HT 0.421%Highwoods Properties Inc HIW 0.500%Hospitality Properties Trust HPT 0.444%Host Hotels & Resorts Inc HST 0.701%Hudson Pacific Properties Inc HPP 1.097%Investors Real Estate Trust IRET 0.113%Iron Mountain Inc IRM 1.183%Kilroy Realty Corp KRC 0.741%Kimco Realty Corp KIM 0.902%Kite Realty Group Trust KRG 0.192%LaSalle Hotel Properties LHO 0.923%Lexington Realty Trust LXP 0.433%Liberty Property Trust LPT 0.499%Life Storage Inc LSI 0.798%LTC Properties Inc LTC 0.799%Macerich Co MAC 1.503%MackCali Realty Corp CLI 0.282%Medical Properties Trust Inc MPW 0.788%MidAmerica Apartment Communities Inc MAA 0.795%Monmouth Real Estate Investment Corp MNR 0.488%Monogram Residential Trust Inc MORE 0.682%National Health Investors Inc NHI 0.664%National Retail Properties Inc NNN 0.748%National Storage Affiliates Trust NSA 3.682%New Senior Investment Group Inc SNR 1.959%
contd. table 1
Company Ticker AverageName Monthly
Returns

Do Momentumbased Strategies Work in Real Estate Investment Trust? 97
New York REIT Inc NYRT 0.288%NorthStar Realty Europe Corp NRE 2.165%NorthStar Realty Finance Corp NRF 0.806%Omega Healthcare Investors Inc OHI 0.745%One Liberty Properties Inc OLP 0.786%Paramount Group Inc PGRE 0.171%Pebblebrook Hotel Trust PEB 0.618%Pennsylvania REIT PEI 1.339%Physicians Realty Trust DOC 1.921%Piedmont Office Realty Trust Inc Class A PDM 0.482%Post Properties Inc PPS 0.474%Prologis Inc PLD 0.748%PS Business Parks Inc PSB 0.918%Public Storage PSA 1.162%QTS Realty Trust Inc Class A QTS 3.242%RAIT Financial Trust RAS 0.254%RamcoGershenson Properties Trust RPT 0.572%Realty Income Corp O 0.930%Regency Centers Corp REG 0.817%Retail Opportunity Investments Corp ROIC 0.944%Retail Properties of America Inc RPAI 1.456%Rexford Industrial Realty Inc REXR 1.484%RLJ Lodging Trust RLJ 0.661%Rouse Properties Inc RSE 0.986%Ryman Hospitality Properties Inc RHP 1.082%Sabra Health Care REIT Inc SBRA 0.895%Saul Centers Inc BFS 0.872%Select Income REIT SIR 0.577%Senior Housing Properties Trust SNH 0.659%Seritage Growth Properties Class A SRG 2.686%Silver Bay Realty Trust Corp SBY 0.002%Simon Property Group Inc SPG 1.224%SL Green Realty Corp SLG 1.292%Spirit Realty Capital Inc SRC 1.321%STAG Industrial Inc STAG 1.331%STORE Capital Corp STOR 2.178%Summit Hotel Properties Inc INN 0.884%Sun Communities Inc SUI 0.672%Sunstone Hotel Investors Inc SHO 0.810%Tanger Factory Outlet Centers Inc SKT 1.008%Taubman Centers Inc TCO 1.146%Terreno Realty Corp TRNO 0.649%Tier REIT Inc TIER 2.022%UDR Inc UDR 0.639%Universal Health Realty Income Trust UHT 0.649%Urban Edge Properties UE 1.385%
contd. table 1
Company Ticker AverageName Monthly
Returns

98 Asian Journal of Economics and Finance. 2021, 3, 1
Urstadt Biddle Properties Inc Class A UBA 0.677%Ventas Inc VTR 1.285%VEREIT Inc VER 0.151%Vornado Realty Trust VNO 1.021%Washington REIT WRE 0.490%Weingarten Realty Investors WRI 0.765%Welltower Inc HCN 0.695%Whitestone REIT WSR 0.600%WP Carey Inc WPC 0.723%WP Glimcher Inc WPG 1.484%Xenia Hotels & Resorts Inc XHR 0.789%
Average of All US REITs 0.848%Max 3.911%Min 2.165%
Employing the approach of Jegadeesh and Titman (2001), we rank all theREITs based on their recent endofmonth past returns. We also check if aprice momentum term structure exists, as NovyMarx (2012) suggests. Toalleviate concerns over data snooping, we adopt 1 month, 2 months, 3 monthsand 6 months as the past returns’ lookback periods. Stocks with performancein the top 30% in each lookback period will be included in the winner portfolio,and the bottom 30% in the loser portfolio.
To study price momentum, we will long the winner portfolio and shortthe loser portfolio simultaneously at the end of every month. To study thetrend of momentum profits over time, we examine the performance of thelongshort price momentum portfolios with holding periods of 1 month, 2months, 3 months and 6 months. The longshort portfolios are equally weightedand will not rebalance over the holding period. We summarize these strategiesin Table 2a.
There is currently no research on time series momentum strategies forREITs in the established literature. This paper will investigate if time seriesmomentum exists in the US REIT market. We will calculate the recent pastreturns of all REITs at the end of every month. The lookback periods of pastreturns will be 1 month, 2 months, 3 months and 6 months.
At the end of every month, we take long positions for all REITs withpositive returns in each lookback period and simultaneously take shortpositions for all REITs with negative returns in each lookback period. Wethen evaluate the performances of longshort time series momentumportfolios with holding periods of 1 month, 2 months, 3 months and 6months. The longshort portfolios are equally weighted and willnot rebalance over the holding period. We summarize these strategies inTable 2b.
Company Ticker AverageName Monthly
Returns

Do Momentumbased Strategies Work in Real Estate Investment Trust? 99
Table 2a: Definition of Price Momentum Strategies for US REITs
Lookback Holding Long/ShortPeriod Period
1 month 1 month Long Top 30% Ranked2 months Short Bottom 30% Ranked3 months6 months
2 months 1 month Long Top 30% Ranked2 months Short Bottom 30% Ranked3 months6 months
3 months 1 month Long Top 30% Ranked2 months Short Bottom 30% Ranked3 months6 months
6 months 1 month Long Top 30% Ranked2 months Short Bottom 30% Ranked3 months6 months
Table 2b: Definition of Time Series Momentum Strategies for US REITs
Lookback Holding Long/ShortPeriod Period
1 month 1 month Long All Stocks With Positive Returns
2 months Short All Stocks With Negative Returns
3 months6 months
2 months 1 month Long All Stocks With Positive Returns
2 months Short All Stocks With Negative Returns
3 months6 months
3 months 1 month Long All Stocks With Positive Returns
2 months Short All Stocks With Negative Returns
3 months6 months
6 months 1 month Long All Stocks With Positive Returns
2 months Short All Stocks With Negative Returns
3 months6 months
The performance of the long components, the short components and thelongshort momentum portfolios will be reported. We also evaluate theprofitability of both the price momentum and the time series momentumstrategies for the US REIT market.
100 Asian Journal of Economics and Finance. 2021, 3, 1
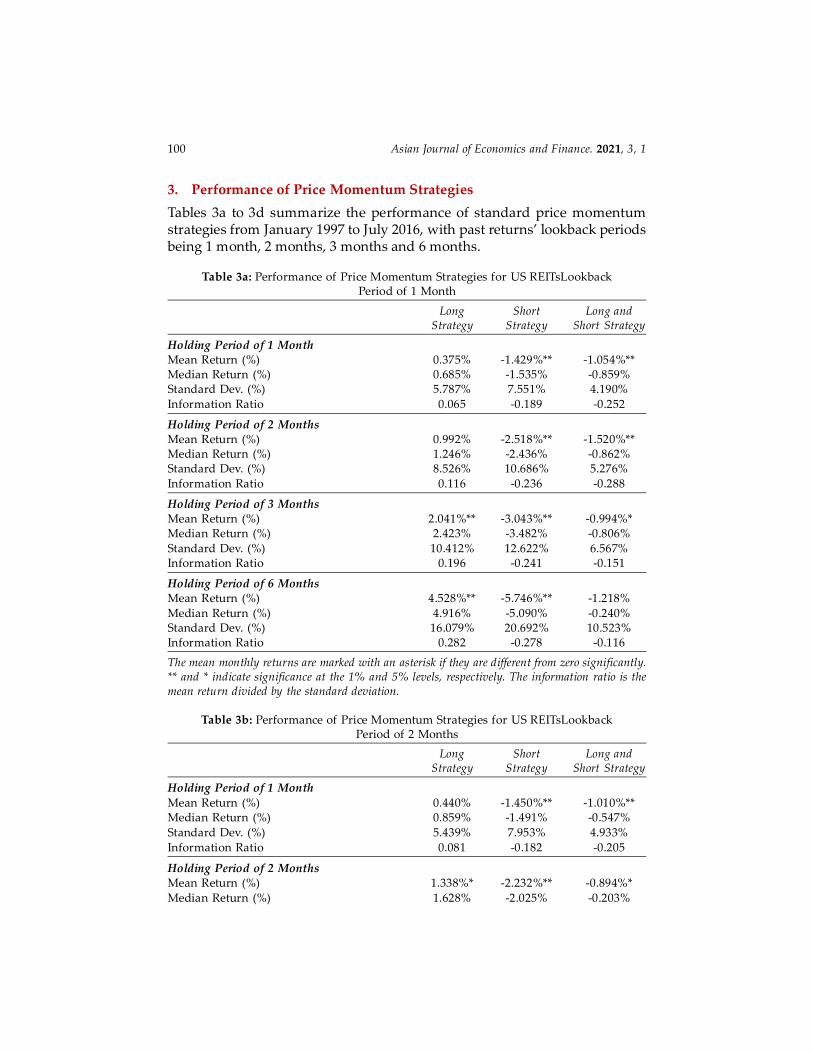
3. Performance of Price Momentum Strategies
Tables 3a to 3d summarize the performance of standard price momentumstrategies from January 1997 to July 2016, with past returns’ lookback periodsbeing 1 month, 2 months, 3 months and 6 months.
Table 3a: Performance of Price Momentum Strategies for US REITsLookbackPeriod of 1 Month
Long Short Long andStrategy Strategy Short Strategy
Holding Period of 1 MonthMean Return (%) 0.375% 1.429%** 1.054%**Median Return (%) 0.685% 1.535% 0.859%Standard Dev. (%) 5.787% 7.551% 4.190%
Information Ratio 0.065 0.189 0.252
Holding Period of 2 MonthsMean Return (%) 0.992% 2.518%** 1.520%**Median Return (%) 1.246% 2.436% 0.862%Standard Dev. (%) 8.526% 10.686% 5.276%
Information Ratio 0.116 0.236 0.288
Holding Period of 3 MonthsMean Return (%) 2.041%** 3.043%** 0.994%*Median Return (%) 2.423% 3.482% 0.806%
Standard Dev. (%) 10.412% 12.622% 6.567%Information Ratio 0.196 0.241 0.151
Holding Period of 6 MonthsMean Return (%) 4.528%** 5.746%** 1.218%
Median Return (%) 4.916% 5.090% 0.240%Standard Dev. (%) 16.079% 20.692% 10.523%Information Ratio 0.282 0.278 0.116
The mean monthly returns are marked with an asterisk if they are different from zero significantly.** and * indicate significance at the 1% and 5% levels, respectively. The information ratio is themean return divided by the standard deviation.
Table 3b: Performance of Price Momentum Strategies for US REITsLookbackPeriod of 2 Months
Long Short Long andStrategy Strategy Short Strategy
Holding Period of 1 Month
Mean Return (%) 0.440% 1.450%** 1.010%**Median Return (%) 0.859% 1.491% 0.547%
Standard Dev. (%) 5.439% 7.953% 4.933%
Information Ratio 0.081 0.182 0.205
Holding Period of 2 MonthsMean Return (%) 1.338%* 2.232%** 0.894%*
Median Return (%) 1.628% 2.025% 0.203%
Do Momentumbased Strategies Work in Real Estate Investment Trust? 101
Standard Dev. (%) 8.278% 11.171% 6.056%
Information Ratio 0.162 0.200 0.148
Holding Period of 3 Months
Mean Return (%) 2.317%* 2.875%* 0.558%
Median Return (%) 2.749% 2.753% 0.006%
Standard Dev. (%) 9.789% 13.223% 6.952%
Information Ratio 0.237 0.217 0.080
Holding Period of 6 Months
Mean Return (%) 4.873%** 5.673%** 0.800%
Median Return (%) 5.572% 5.230% 0.756%
Standard Dev. (%) 15.465% 21.339% 11.945%
Information Ratio 0.315 0.266 0.067
The mean monthly returns are marked with an asterisk if they are different from zero significantly.** and * indicate significance at the 1% and 5% levels, respectively. The information ratio is themean return divided by the standard deviation.
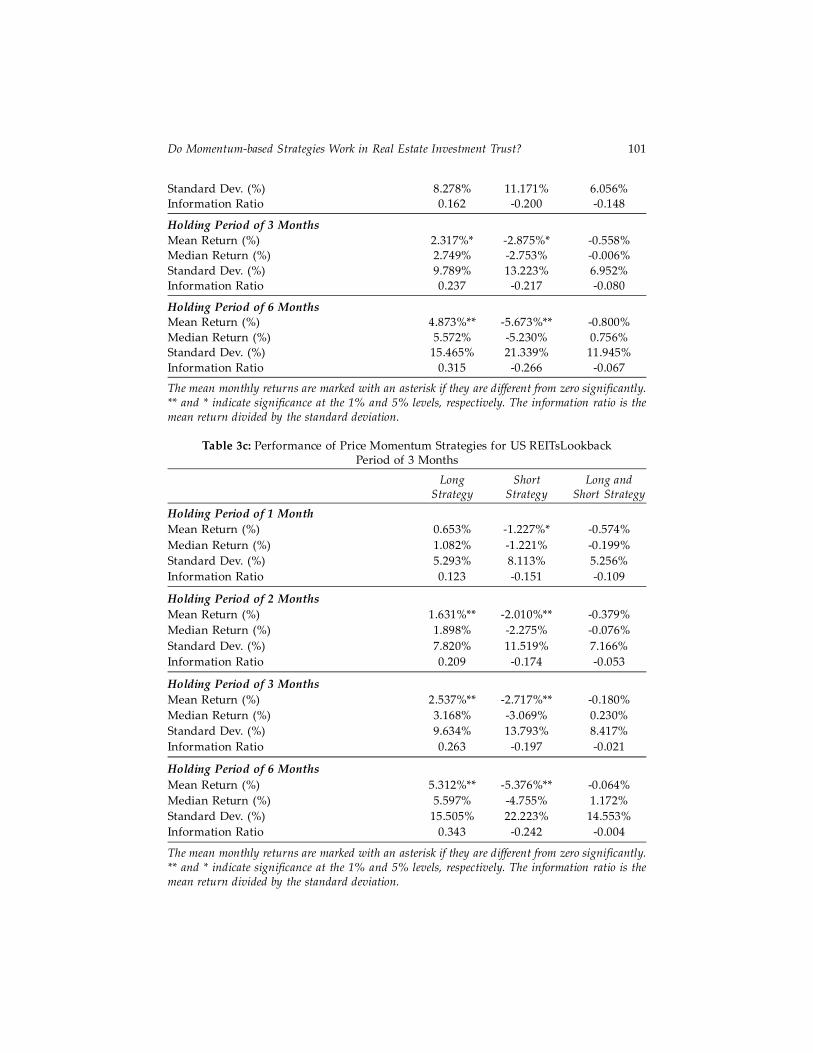
Table 3c: Performance of Price Momentum Strategies for US REITsLookbackPeriod of 3 Months
Long Short Long andStrategy Strategy Short Strategy
Holding Period of 1 Month
Mean Return (%) 0.653% 1.227%* 0.574%
Median Return (%) 1.082% 1.221% 0.199%
Standard Dev. (%) 5.293% 8.113% 5.256%
Information Ratio 0.123 0.151 0.109
Holding Period of 2 Months
Mean Return (%) 1.631%** 2.010%** 0.379%
Median Return (%) 1.898% 2.275% 0.076%
Standard Dev. (%) 7.820% 11.519% 7.166%
Information Ratio 0.209 0.174 0.053
Holding Period of 3 Months
Mean Return (%) 2.537%** 2.717%** 0.180%
Median Return (%) 3.168% 3.069% 0.230%
Standard Dev. (%) 9.634% 13.793% 8.417%
Information Ratio 0.263 0.197 0.021
Holding Period of 6 Months
Mean Return (%) 5.312%** 5.376%** 0.064%
Median Return (%) 5.597% 4.755% 1.172%
Standard Dev. (%) 15.505% 22.223% 14.553%
Information Ratio 0.343 0.242 0.004
The mean monthly returns are marked with an asterisk if they are different from zero significantly.** and * indicate significance at the 1% and 5% levels, respectively. The information ratio is themean return divided by the standard deviation.
102 Asian Journal of Economics and Finance. 2021, 3, 1
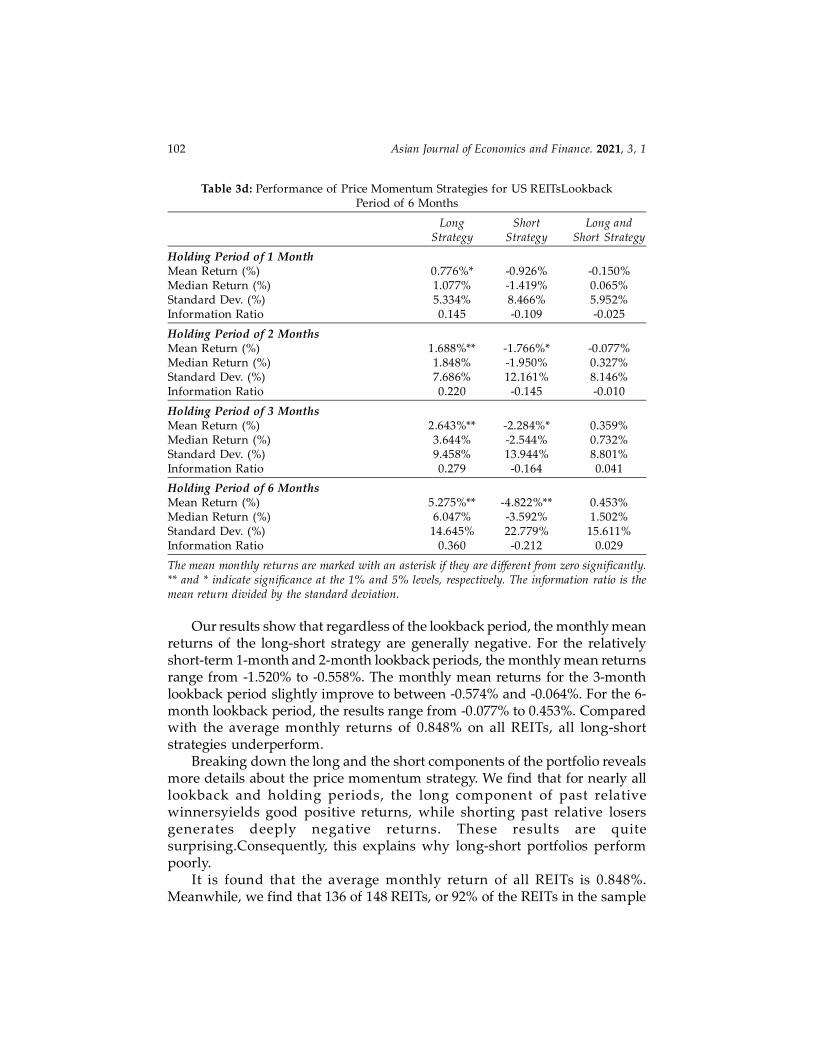
Table 3d: Performance of Price Momentum Strategies for US REITsLookbackPeriod of 6 Months
Long Short Long andStrategy Strategy Short Strategy
Holding Period of 1 MonthMean Return (%) 0.776%* 0.926% 0.150%Median Return (%) 1.077% 1.419% 0.065%Standard Dev. (%) 5.334% 8.466% 5.952%Information Ratio 0.145 0.109 0.025
Holding Period of 2 MonthsMean Return (%) 1.688%** 1.766%* 0.077%Median Return (%) 1.848% 1.950% 0.327%Standard Dev. (%) 7.686% 12.161% 8.146%Information Ratio 0.220 0.145 0.010
Holding Period of 3 MonthsMean Return (%) 2.643%** 2.284%* 0.359%Median Return (%) 3.644% 2.544% 0.732%Standard Dev. (%) 9.458% 13.944% 8.801%Information Ratio 0.279 0.164 0.041
Holding Period of 6 MonthsMean Return (%) 5.275%** 4.822%** 0.453%Median Return (%) 6.047% 3.592% 1.502%Standard Dev. (%) 14.645% 22.779% 15.611%Information Ratio 0.360 0.212 0.029
The mean monthly returns are marked with an asterisk if they are different from zero significantly.** and * indicate significance at the 1% and 5% levels, respectively. The information ratio is themean return divided by the standard deviation.
Our results show that regardless of the lookback period, the monthly meanreturns of the longshort strategy are generally negative. For the relativelyshortterm 1month and 2month lookback periods, the monthly mean returnsrange from 1.520% to 0.558%. The monthly mean returns for the 3monthlookback period slightly improve to between 0.574% and 0.064%. For the 6month lookback period, the results range from 0.077% to 0.453%. Comparedwith the average monthly returns of 0.848% on all REITs, all longshortstrategies underperform.
Breaking down the long and the short components of the portfolio revealsmore details about the price momentum strategy. We find that for nearly alllookback and holding periods, the long component of past relativewinnersyields good positive returns, while shorting past relative losersgenerates deeply negative returns. These results are quitesurprising.Consequently, this explains why longshort portfolios performpoorly.
It is found that the average monthly return of all REITs is 0.848%.Meanwhile, we find that 136 of 148 REITs, or 92% of the REITs in the sample

Do Momentumbased Strategies Work in Real Estate Investment Trust? 103
period, on average experienced positive monthly returns. These imply thatinvestors taking short positions for REITs will in general barely generate profits.
Focusing on the long component, we find that longing the relative winnersis a fruitful tactic. For a holding period of 2 months, monthly returns of thelong strategy range from 0.992% to 1.688%. Monthly returns of a 3monthholding period range between 2.041% and 2.643%. For a 6month holdingperiod, the results range from 4.528% to 5.312%. Regardless of the choice oflookback periods, these price momentum strategiesoutperform the averageREIT monthly return of 0.848%, withprofits increasing with longer holdingperiods.
The information ratio is the mean return divided by the standard deviation.A higher information ratio represents a better riskadjusted performance. Forthe long component, when the holding period increases, the information ratioincreases, with the highest found in the 6month holding period.Theinformation ratio of the 3month holding period ranges from 0.196 to 0.279,while that of the 6month holding period ranges from 0.282 to 0.360.
In conclusion, during the sample period from January 1997 to July 2016,investing in REITs with the strategy of longing the relative winner’s portfoliocan generate an average return from 0.375% to 5.312% per month. The returnis higher when adopting a longer holding period.
To investigate whether the market has corrected its inefficiency over time,we examine the stability of longshort profits by conducting subsampleanalyses. The subsample analyses of 1month, 2month, 3month and 6monthlookback periodsare illustrated in Tables 4a, b, c and d, respectively.
Table 4a: Subsample Analysis of Price Momentum Strategies for US REITsLookbackPeriod of 1 Month
Long Short Long andStrategy Strategy Short Strategy
Holding Period of 1 Month1997 – 2001 0.580% 1.568% 2.148%2002 – 2006 1.141% 2.197% 1.056%2007 – 2011 0.076% 0.690% 0.614%2012 – 2016 1.026% 1.329% 0.303%
Holding Period of 2 Months1997 – 2001 0.502% 2.174% 2.676%2002 – 2006 2.749% 4.185% 1.436%2007 – 2011 0.245% 1.361% 1.606%2012 – 2016 2.247% 2.531% 0.284%
Holding Period of 3 Months1997 – 2001 0.031% 2.345% 2.376%2002 – 2006 4.896% 5.726% 0.830%2007 – 2011 0.201% 1.240% 1.039%2012 – 2016 3.404% 3.093% 0.311%
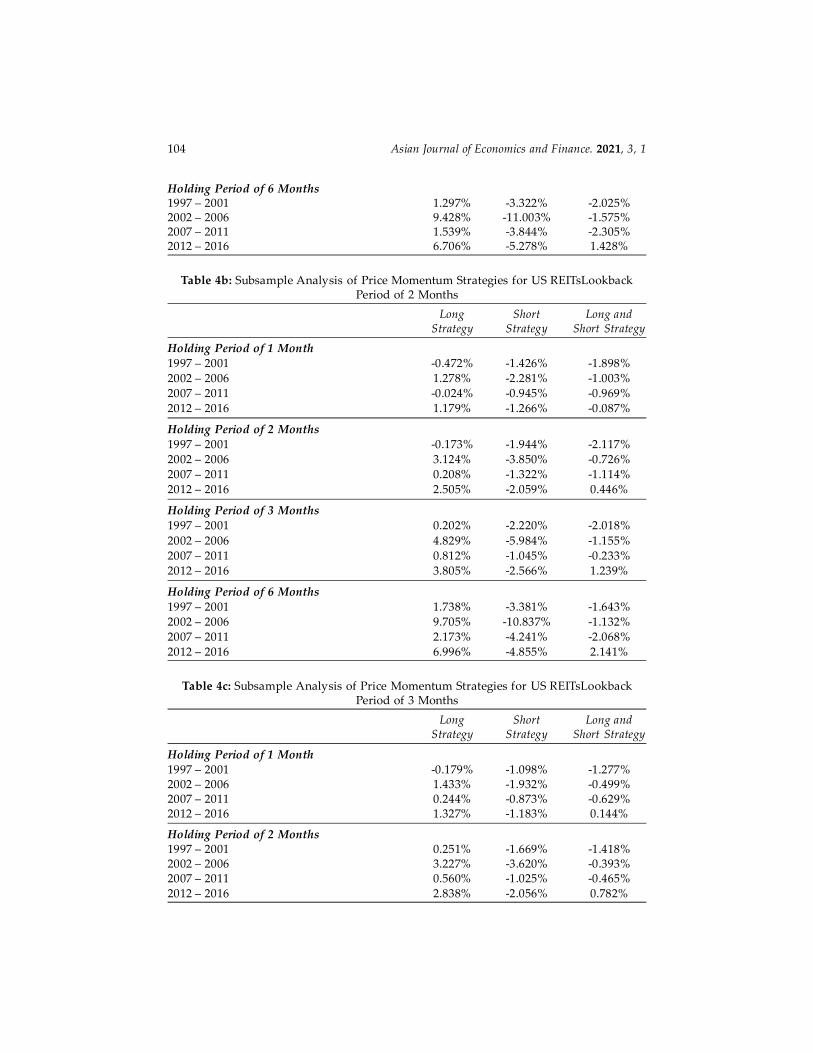
104 Asian Journal of Economics and Finance. 2021, 3, 1
Holding Period of 6 Months1997 – 2001 1.297% 3.322% 2.025%2002 – 2006 9.428% 11.003% 1.575%2007 – 2011 1.539% 3.844% 2.305%2012 – 2016 6.706% 5.278% 1.428%
Table 4b: Subsample Analysis of Price Momentum Strategies for US REITsLookbackPeriod of 2 Months
Long Short Long andStrategy Strategy Short Strategy
Holding Period of 1 Month
1997 – 2001 0.472% 1.426% 1.898%
2002 – 2006 1.278% 2.281% 1.003%
2007 – 2011 0.024% 0.945% 0.969%
2012 – 2016 1.179% 1.266% 0.087%
Holding Period of 2 Months
1997 – 2001 0.173% 1.944% 2.117%
2002 – 2006 3.124% 3.850% 0.726%
2007 – 2011 0.208% 1.322% 1.114%
2012 – 2016 2.505% 2.059% 0.446%
Holding Period of 3 Months
1997 – 2001 0.202% 2.220% 2.018%
2002 – 2006 4.829% 5.984% 1.155%
2007 – 2011 0.812% 1.045% 0.233%
2012 – 2016 3.805% 2.566% 1.239%
Holding Period of 6 Months
1997 – 2001 1.738% 3.381% 1.643%
2002 – 2006 9.705% 10.837% 1.132%
2007 – 2011 2.173% 4.241% 2.068%
2012 – 2016 6.996% 4.855% 2.141%
Table 4c: Subsample Analysis of Price Momentum Strategies for US REITsLookbackPeriod of 3 Months
Long Short Long andStrategy Strategy Short Strategy
Holding Period of 1 Month
1997 – 2001 0.179% 1.098% 1.277%2002 – 2006 1.433% 1.932% 0.499%2007 – 2011 0.244% 0.873% 0.629%2012 – 2016 1.327% 1.183% 0.144%
Holding Period of 2 Months1997 – 2001 0.251% 1.669% 1.418%2002 – 2006 3.227% 3.620% 0.393%2007 – 2011 0.560% 1.025% 0.465%
2012 – 2016 2.838% 2.056% 0.782%

Do Momentumbased Strategies Work in Real Estate Investment Trust? 105
Holding Period of 3 Months1997 – 2001 0.719% 2.110% 1.391%2002 – 2006 4.990% 5.520% 0.530%2007 – 2011 0.788% 1.088% 0.300%2012 – 2016 4.199% 2.566% 1.633%
Holding Period of 6 Months1997 – 2001 2.481% 3.339% 0.858%2002 – 2006 10.067% 10.056% 0.011%2007 – 2011 2.488% 3.993% 1.505%2012 – 2016 7.611% 5.094% 2.517%
Table 4d: Subsample Analysis of Price Momentum Strategies for US REITsLookbackPeriod of 6 Months
Long Short Long andStrategy Strategy Short Strategy
Holding Period of 1 Month1997 – 2001 0.173% 0.521% 0.348%2002 – 2006 1.551% 1.641% 0.090%2007 – 2011 0.210% 0.719% 0.509%2012 – 2016 1.487% 0.983% 0.504%
Holding Period of 2 Months1997 – 2001 0.657% 0.825% 0.168%2002 – 2006 3.315% 3.310% 0.005%2007 – 2011 0.468% 1.321% 0.853%2012 – 2016 2.890% 1.842% 1.048%
Holding Period of 3 Months1997 – 2001 0.935% 0.834% 0.101%2002 – 2006 5.241% 4.921% 0.320%2007 – 2011 1.004% 1.259% 0.255%2012 – 2016 4.106% 2.437% 1.669%
Holding Period of 6 Months1997 – 2001 2.690% 2.021% 0.669%2002 – 2006 10.318% 9.073% 1.245%2007 – 2011 2.464% 4.342% 1.878%2012 – 2016 7.355% 4.845% 2.510%
We divide the 20year sample period from January 1997 to June 2016 intofour fiveyear subsamples. The four subsample periods range from 1997 to2001, 2002 to 2006, 2007 to 2011 and 2012 to 2016.
We observe that in general, the strategies perform best in the 2002 to 2006subsample. For long strategies with 3month holding periods in the 2002 to2006 subsample, average monthly returns are from 4.829% to 5.241%, whichare much better than returns of 2.041% to 2.643% in the whole sample. For 6month holding periods, the monthly mean returns of the long component inthis subsample range from 9.428% to 10.318%, which surpass the whole samplereturns of 4.528% to 5.312%.

106 Asian Journal of Economics and Finance. 2021, 3, 1
In sum, in the 2002 to 2006 subsample, monthly momentum returns fromtaking long positions are the greatest. Moreover, we recognize that theperformance of the long portfolio between 2012 and 2016 is better than that inthe 2007 to 2011 subsample.
Among the four subsamples, the results from 1997 to 2001 are generallythe worst. For long strategies with a 6month holding period, average monthlyreturns are from 1.297% to 2.690%, which are much worse than the wholesample returns of 4.528% to 5.312%. We observe that the price momentumprofits from long portfolios do fluctuate throughout the entire sample period.Nevertheless, our results do not exhibit diminishing price momentum profitsover time. We may therefore conclude that the market for US REITs does notcorrect its inefficiency over our 20year sample.
4. Performance of Time Series Momentum Strategies
We examine the performance of time series momentum strategies from January1997 to July 2016 for US REIT markets. Tables 5a to 5d summarize theperformance of these strategies with past returns lookback periods of 1 month,2 months, 3 months and 6 months.
Table 5a: Performance of Time Series Momentum Strategies for US REITsLookbackPeriod of 1 Month
Long Short Long andStrategy Strategy Short Strategy
Holding Period of 1 MonthMean Return (%) 0.496% 1.715%** 1.222%**Median Return (%) 1.046% 1.747% 0.920%Standard Dev. (%) 5.447% 7.860% 5.048%Information Ratio 0.091 0.218 0.242Holding Period of 2 MonthsMean Return (%) 1.133%* 2.522%** 1.394%**Median Return (%) 1.290% 2.117% 1.024%Standard Dev. (%) 8.345% 10.220% 5.024%Information Ratio 0.136 0.247 0.277Holding Period of 3 MonthsMean Return (%) 2.099%** 2.845%** 0.755%Median Return (%) 2.309% 3.379% 0.540%Standard Dev. (%) 10.153% 11.815% 6.368%Information Ratio 0.207 0.241 0.119Holding Period of 6 MonthsMean Return (%) 4.651%** 5.578%** 0.947%Median Return (%) 4.910% 4.610% 0.186%Standard Dev. (%) 15.264% 19.840% 10.606%Information Ratio 0.305 0.281 0.089
The mean monthly returns are marked with an asterisk if they are different from zerosignificantly. ** and * indicate significance at the 1% and 5% levels, respectively. Theinformation ratio is the mean return divided by the standard deviation.

Do Momentumbased Strategies Work in Real Estate Investment Trust? 107
Table 5b: Performance of Time Series Momentum Strategies for US REITsLookbackPeriod of 2 Months
Long Short Long andStrategy Strategy Short Strategy
Holding Period of 1 MonthMean Return (%) 0.370% 1.402%** 1.032%**Median Return (%) 0.826% 1.559% 0.536%Standard Dev. (%) 5.128% 7.081% 4.183%Information Ratio 0.072 0.198 0.247
Holding Period of 2 MonthsMean Return (%) 1.158%* 2.007%** 0.849%**Median Return (%) 1.677% 1.926% 0.563%Standard Dev. (%) 7.971% 10.037% 4.862%Information Ratio 0.145 0.200 0.175
Holding Period of 3 MonthsMean Return (%) 1.966%** 2.748%** 0.782%Median Return (%) 2.480% 2.447% 0.526%Standard Dev. (%) 9.388% 12.255% 6.553%Information Ratio 0.209 0.224 0.119
Holding Period of 6 MonthsMean Return (%) 4.232%** 5.138%** 0.906%Median Return (%) 4.893% 4.974% 0.354%Standard Dev. (%) 15.169% 18.344% 8.255%Information Ratio 0.279 0.280 0.110
The mean monthly returns are marked with an asterisk if they are different from zero significantly.** and * indicate significance at the 1% and 5% levels, respectively. The information ratio is themean return divided by the standard deviation.
Table 5c: Performance of Time Series Momentum Strategies for US REITsLookbackPeriod of 3 Months
Long Short Long andStrategy Strategy Short Strategy
Holding Period of 1 MonthMean Return (%) 0.569% 1.176%** 0.609%*Median Return (%) 1.050% 1.706% 0.371%Standard Dev. (%) 5.391% 6.866% 3.667%Information Ratio 0.106 0.171 0.166
Holding Period of 2 MonthsMean Return (%) 1.506%** 1.913%** 0.413%Median Return (%) 1.610% 2.346% 0.484%Standard Dev. (%) 8.014% 9.861% 4.874%Information Ratio 0.188 0.194 0.085
Holding Period of 3 MonthsMean Return (%) 2.267%** 2.834%** 0.576%Median Return (%) 2.988% 3.738% 0.455%Standard Dev. (%) 9.085% 12.035% 6.657%Information Ratio 0.250 0.235 0.087

108 Asian Journal of Economics and Finance. 2021, 3, 1
Holding Period of 6 MonthsMean Return (%) 4.328%** 4.935%** 0.625%Median Return (%) 5.064% 5.098% 0.115%Standard Dev. (%) 14.446% 17.715% 7.954%Information Ratio 0.300 0.279 0.079
The mean monthly returns are marked with an asterisk if they are different from zero significantly.** and * indicate significance at the 1% and 5% levels, respectively. The information ratio is themean return divided by the standard deviation.
Table 5d: Performance of Time Series Momentum Strategies for US REITsLookbackPeriod of 6 Months
Long Short Long andStrategy Strategy Short Strategy
Holding Period of 1 MonthMean Return (%) 0.631% 1.110%* 0.470%Median Return (%) 1.255% 1.000% 0.375%Standard Dev. (%) 4.999% 6.968% 4.397%Information Ratio 0.126 0.159 0.107
Holding Period of 2 MonthsMean Return (%) 1.304%** 1.856%** 0.536%Median Return (%) 1.780% 2.277% 0.221%Standard Dev. (%) 7.146% 10.159% 6.314%Information Ratio 0.183 0.183 0.085
Holding Period of 3 MonthsMean Return (%) 2.061%** 2.325%** 0.243%Median Return (%) 3.250% 2.677% 0.098%Standard Dev. (%) 8.696% 11.830% 7.162%Information Ratio 0.237 0.197 0.034
Holding Period of 6 MonthsMean Return (%) 4.039%** 4.280%** 0.203%Median Return (%) 5.381% 2.976% 0.659%Standard Dev. (%) 13.159% 17.698% 10.598%Information Ratio 0.307 0.242 0.019
The mean monthly returns are marked with an asterisk if they are different from zero significantly.** and * indicate significance at the 1% and 5% levels, respectively. The information ratio is themean return divided by the standard deviation.
It is interesting to note that for all lookback periods and all holding periods,all longshort portfolios generate negative returns, ranging from 1.394%to 0.203%, far underperforming the benchmark of 0.848%, the average monthlyreturn of all REITs. Investigating the long and short components of theportfolios in detail, we can identify more characteristics of the time seriesmomentum strategies.
We find that for the US REIT market, when considering all lookback periodsand holding periods, the long component will generate positive returns.Meanwhile, the short component will experience negative returns. This
Do Momentumbased Strategies Work in Real Estate Investment Trust? 109
explains why a simultaneous longshort strategy is not a profitable one. Similarfindings are also observed when adopting price momentum longshortstrategies for REITs. As the average monthly return of all REITs is 0.848%, and92% of the REITs in the sample period experience positive average monthlyreturns, taking short positions for REITs will be a painful lesson.
Consider the long component, for a 1month holding period, monthlyreturns of long strategies range from 0.370% to 0.631%. Monthly returns of a2month holding period range between 1.133% and 1.506%. For the 3monthholding period, the results range from 1.966% to 2.267%. The average monthlyreturns for a 6month holding period are between 4.039% and 4.651%.Regardless of the choice of lookback periods, the time series momentumstrategies outperform 0.848%, the average monthly return of all REITs.Nevertheless, the time series momentum long strategies slightly underperformthe price momentum long strategies.
For long portfolios, we find that the information ratio increases as theholding period increases, with the 6month holding period being the highest,ranging from 0.279 to 0.307.
In conclusion, during the whole sample period from January 1997 toJuly 2016, investing in REITs by taking long positionsin stocks with positivepast returns can generate a return of 0.370% to 4.651% per month on average.The return is higher when adopting a longer holding period andunderperforms the return of the price momentum strategies that long therelative winners.
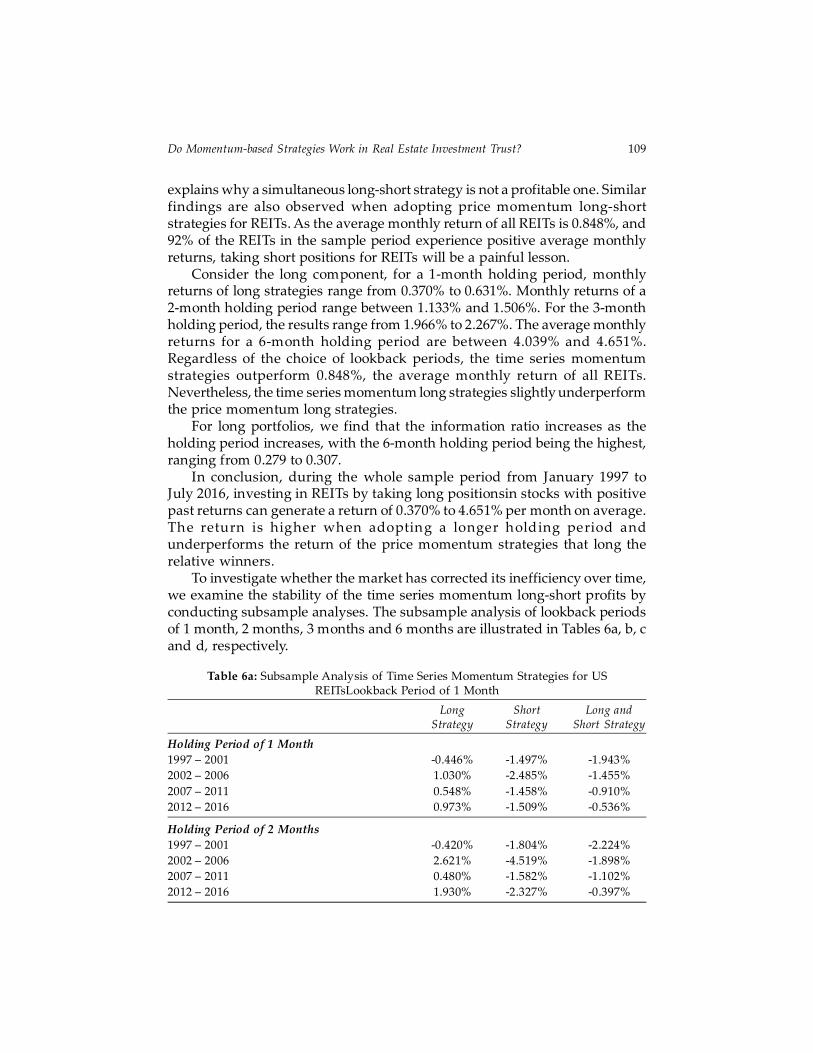
To investigate whether the market has corrected its inefficiency over time,we examine the stability of the time series momentum longshort profits byconducting subsample analyses. The subsample analysis of lookback periodsof 1 month, 2 months, 3 months and 6 months are illustrated in Tables 6a, b, cand d, respectively.
Table 6a: Subsample Analysis of Time Series Momentum Strategies for USREITsLookback Period of 1 Month
Long Short Long andStrategy Strategy Short Strategy
Holding Period of 1 Month
1997 – 2001 0.446% 1.497% 1.943%
2002 – 2006 1.030% 2.485% 1.455%
2007 – 2011 0.548% 1.458% 0.910%
2012 – 2016 0.973% 1.509% 0.536%
Holding Period of 2 Months
1997 – 2001 0.420% 1.804% 2.224%
2002 – 2006 2.621% 4.519% 1.898%
2007 – 2011 0.480% 1.582% 1.102%
2012 – 2016 1.930% 2.327% 0.397%

110 Asian Journal of Economics and Finance. 2021, 3, 1
Holding Period of 3 Months1997 – 2001 0.080% 1.793% 1.713%2002 – 2006 4.280% 5.812% 1.532%2007 – 2011 1.446% 1.100% 0.346%2012 – 2016 3.062% 2.900% 0.162%
Holding Period of 6 Months1997 – 2001 1.401% 3.094% 1.693%2002 – 2006 8.652% 10.766% 2.114%2007 – 2011 2.761% 3.661% 0.900%2012 – 2016 6.762% 5.137% 1.625%
Table 6b: Subsample Analysis of Time Series Momentum Strategies for USREITsLookback Period of 2 Months
Long Short Long andStrategy Strategy Short Strategy
Holding Period of 1 Month
1997 – 2001 0.384% 1.177% 1.561%
2002 – 2006 1.280% 2.423% 1.143%
2007 – 2011 0.294% 0.776% 1.070%
2012 – 2016 1.082% 1.377% 0.295%
Holding Period of 2 Months
1997 – 2001 0.222% 1.623% 1.845%
2002 – 2006 2.832% 4.201% 1.369%
2007 – 2011 0.040% 0.425% 0.465%
2012 – 2016 2.361% 1.935% 0.426%
Holding Period of 3 Months
1997 – 2001 0.162% 1.995% 1.833%
2002 – 2006 4.354% 6.694% 2.340%
2007 – 2011 0.327% 0.098% 0.229%
2012 – 2016 3.473% 2.454% 1.019%
Holding Period of 6 Months
1997 – 2001 1.293% 3.295% 2.002%
2002 – 2006 8.801% 11.069% 2.268%
2007 – 2011 1.604% 1.615% 0.011%
2012 – 2016 6.373% 5.150% 1.223%
Table 6c: Subsample Analysis of Time Series Momentum Strategies for USREITsLookback Period of 3 Months
Long Short Long andStrategy Strategy Short Strategy
Holding Period of 1 Month1997 – 2001 0.327% 1.010% 1.337%2002 – 2006 1.234% 2.322% 1.088%2007 – 2011 0.254% 0.412% 0.158%2012 – 2016 1.232% 1.094% 0.138%

Do Momentumbased Strategies Work in Real Estate Investment Trust? 111
Holding Period of 2 Months1997 – 2001 0.027% 1.360% 1.387%2002 – 2006 2.861% 4.219% 1.358%2007 – 2011 1.074% 0.410% 0.664%2012 – 2016 2.561% 1.898% 0.663%
Holding Period of 3 Months1997 – 2001 0.268% 1.569% 1.301%2002 – 2006 4.381% 7.101% 2.720%2007 – 2011 1.362% 0.339% 1.023%2012 – 2016 3.689% 2.585% 1.104%
Holding Period of 6 Months1997 – 2001 1.669% 2.915% 1.246%2002 – 2006 8.846% 10.461% 1.615%2007 – 2011 1.541% 1.887% 0.346%2012 – 2016 6.627% 5.229% 1.398%
Table 6d: Subsample Analysis of Time Series Momentum Strategies for USREITsLookback Period of 6 Months
Long Short Long andStrategy Strategy Short Strategy
Holding Period of 1 Month1997 – 2001 0.292% 0.575% 0.283%2002 – 2006 1.454% 2.469% 1.015%2007 – 2011 0.350% 0.552% 0.902%2012 – 2016 1.438% 1.098% 0.340%
Holding Period of 2 Months1997 – 2001 0.432% 0.761% 0.329%2002 – 2006 3.028% 4.277% 1.249%2007 – 2011 0.383% 0.872% 1.255%2012 – 2016 2.667% 1.973% 0.694%
Holding Period of 3 Months1997 – 2001 0.490% 0.720% 0.230%2002 – 2006 4.653% 6.196% 1.543%2007 – 2011 0.061% 0.305% 0.366%2012 – 2016 3.818% 2.651% 1.167%
Holding Period of 6 Months1997 – 2001 1.917% 2.421% 0.504%2002 – 2006 9.080% 9.687% 0.607%2007 – 2011 0.008% 1.034% 1.026%2012 – 2016 6.944% 5.401% 1.543%
The entire sample period is from January 1997 to June 2016. We divide the20year sample into four fiveyear subsamples. The four subsample periodsare from 1997 to 2001, 2002 to 2006, 2007 to 2011, and 2012 to 2016.
We observe that in general, the strategies perform the best in the 2002 to2006 subsample. In this subsample, for a holding period of 3 months, the long
112 Asian Journal of Economics and Finance. 2021, 3, 1
monthly mean returns range from 4.280% to 4.653%, which outperform thewhole sample’s returns of 1.966% to 2.267%. For long strategies with a 6monthholding period in the 2002 to 2006 subsample, average monthly returns arefrom 8.652% to 9.080%, which are much better than the whole sample’s returnsof 4.039% to 4.651%.
Overall, the monthly momentum returns from longing all recent pastwinners are the greatest when compared with the whole sample periodaverages. Moreover, we recognize that the performance of the long portfoliobetween 2012 and 2016 is better than those of the remaining two subsamplesof 1997 to 2001 and 2007 to 2011.
Concerning the time series momentum of US REITs, our results do notdemonstrate a diminishing trend of momentum profits over time. We observea similar fact in the case of price momentum. This provides further evidencethat the REIT market does not correct its inefficiency as time passes.
5. Conclusion
Research on time series momentum for REITs is rare in the literature. Thispaper supplements the literature by examining whether time series momentumworks for the US REIT market. Choosing the 148 constituents of MSCI USREIT Index (RMZ) as samples, for the period from January 1997 to July 2016,this paper demonstrates that investing in US REITs using price momentumbased strategies or time series momentum based longshort strategiesgeneratesnegative returns. This is because 92% of the REITs in the sample experiencepositive monthly returns on average. As such, the short components drag downmomentum profits. Further analysis of the long component shows that bothprice and time series momentum generate fruitful profits. For time seriesmomentum, with holding periodsof 3 months and 6 months, average monthlyreturns range from 1.966% to 4.651%. For price momentum with the sameholding period, the mean monthly returns are even higher, from 2.041% to5.312%. Regardless of the choice of lookback periods, we find that both priceand time series momentum strategies outperform the average monthly returnof all US REITs of 0.848%. We also examine the term structure of momentumfor the REIT markets. Our results show that the longer the holding period, thebetter the long portfolio returns. These findings contradict the efficient markethypothesis. To investigate whether the REIT market has corrected itsinefficiency over time, we conduct subsample analyses. We observe that ingeneral, for both time series and price momentum strategies,long portfolioprofits do not decay over time. This provides evidence that the REIT marketdoes not correct its inefficiency over time.
References
Asness, C.S., T.J. Moskowitz, and L.H. Pedersen (2013). “Value and MomentumEverywhere”, The Journal of Finance, 68, 929–985.

Do Momentumbased Strategies Work in Real Estate Investment Trust? 113
Chong, T.T.L and H.T.S. Ip (2009). “Do MomentumBased Strategies Work in EmergingCurrency Markets?”, PacificBasin Finance Journal, 17, 479–493.
Chui, A.C.W., S. Titman, and K.C.J. Wei (2003). “IntraIndustry Momentum: The Caseof REITs”, Journal of Financial Markets, 6, 363–387.
Chui, A.C.W., S. Titman, and K.C.J. Wei (2010). “Individualism and Momentum aroundthe World”, The Journal of Finance, 65, 361–392.
Hung, S.Y.K. and J.L. Glascock (2008). “Momentum Profitability and Market Trend:Evidence from REITs”, The Journal of Real Estate Finance and Economics, 37, 51–69.
Hung, S.Y.K. and J.L. Glascock (2010). “Volatilities and Momentum Returns in RealEstate Investment Trusts”, The Journal of Real Estate Finance and Economics, 41, 126–149.
Jegadeesh, N. and S. Titman (1993). “Returns to Buying Winners and Selling Losers:Implications for Stock Market Efficiency”, The Journal of Finance, 48, 65–91.
Jegadeesh, N. and S. Titman (2001). “Profitability of Momentum Strategies: AnEvaluation of Alternative Explanations”, The Journal of Finance, 56, 699–720.
Moskowitz, T.J., Y.H. Ooi, and L.H. Pedersen (2012). “Time Series Momentum”, Journalof Financial Economics, 104, 228–250.
NovyMarx, R. (2012). “Is Momentum Really Momentum?”, Journal of FinancialEconomics, 103, 429–453.