Embed Size (px)
Citation preview

The UrbanInstitute2100 M Street, N.W.Washington, D.C. 20037Phone: 202.833-7200Fax: 202.429-0687E-Mail: [email protected]://www.urban.org
Do Minority-OwnedBusinessesGet a FairShare ofGovernmentContracts?María E. EnchauteguiMichael Fix Pamela Loprest Sarah C. von der LippeDouglas Wissoker

Copyright q December 1997. The Urban Institute. All rights reserved. Except for short quotes, no part of this bookmay be reproduced or utilized in any form or by any means, electronic or mechanical, including photocopying,recording, or by information storage or retrieval system, without written permission from The Urban Institute.
This research was funded by the Rockefeller Foundation and the United States Department of Justice. Any opinionsexpressed herein are those of the authors and do not necessarily reflect the views of The Urban Institute or its funders.

Acknowledgments
The research and production of this manuscript were made possible bysupport from the Rockefeller Foundation and the U.S. Department ofJustice. The authors would also like to thank Aaron Sparrow for hisexcellent research assistance and Scott Forrey, Barbara Willis, and
Sonja Drumgoole for their expert help in editing, designing, and producingthis report. The authors, of course, assume full responsibility for its content.


Contents
Executive Summary vii
1. Introduction and Overview 1
2. Evidence of Disparity in Government Contracting 9
Analysis of Disparity Studies 9Study Approach 9Major Findings 14Strength of the Results 18
Issues in Interpreting the Findings 25Assessing the National Representativeness of Our Findings 26What Is the Relationship Between Disparity and Discrimination? 27Accounting for Past and Present Discrimination in
Business Formation 29
3. Economic and Policy Context 33
Barriers to Formation and Growth of Minority Firms 34Limited Financial Capital 34Limited Social Capital 36Human Capital Deficits 37Limited Market Access 39Culture and Preferences 39
Barriers to Utilization in Government Contracting 40Steps in the Contracting Process 40Project Design 41Defining the Scope of Affirmative Action Programs 41The Bid Solicitation Process 42The Submission and Evaluation of Bids 42Execution of the Contract, Monitoring Compliance, and Payment 43

Affirmative Action Policies in Contracting: An Overview 44Goals of Affirmative Action Programs 44Federal Affirmative Action Policies 45Proposed Government-Wide Reforms 46State and Local Affirmative Action Programs in Contracting 47
4. Minorities and Contracting: A Research Agenda 53
5. Conclusions 61
Bibliography 63
Appendix: Study Methods 67
About the Authors 118

Chapter 1
Executive Summary
Debates over affirmative action have concentrated on the relative suc-cess of minorities in three principal areas: employment, education,and government contracting. Of the three, government contracting isperhaps the least studied, despite its importance for minority eco-
nomic progress. To provide a national picture of how minority-owned firmsare doing in the area of government contracting, the Urban Institute carriedout a study of the extent to which minority-owned firms receive a representa-tive share of state and local government contract dollars. The purpose of thestudy was to provide information bearing on the need for programs that assistminority-owned firms—including affirmative action in procurement.
The Urban Institute analysis reveals substantial disparities between theshare of contract dollars received by minority-owned firms and the share of allfirms that they represent. Based on their number, minority-owned firmsreceived only 57 cents for every dollar they would be expected to receive.
The Policy ContextImportance of Government ContractingProcurement—like public employment—provides governments with a poten-tially powerful tool for promoting minority opportunities and counteractingdiscrimination. In 1990, procurement at all levels of government representedapproximately $450 billion, or almost 10 percent of GNP. State and local government spending accounted for more than half of all procurement—approximately $250 billion. In a time of government downsizing, the share oftotal government spending that goes to contracting (versus government employ-ment) is likely to rise. Indeed, in 1995, federal spending on contractingexceeded spending for federal employment.
Barriers Encountered by Minority FirmsThere are two types of barriers faced by minority firms: (1) barriers to firm for-mation and growth and (2) barriers to participation in the government contractingprocess itself. It is important to distinguish between the two for policy purposesbecause policies that may increase the number or size of minority firms may notnecessarily increase those firms’ participation in the procurement process.
Barriers to the formation and growth of minority firmsIn general, minority-owned firms are smaller in size and fewer in number thanmajority-owned firms. Major barriers to the formation and development ofminority-owned businesses include:
● Lack of financial capital: minorities have lower incomes, fewer assets, anddiminished access to business loans.
● Lack of social capital: minorities’ access to business networks is limited,and their own family networks may be smaller or less valuable than those oftheir majority counterparts.
● Lower human capital endowments: minorities have less education and pro-fessional training, and their access to union and other apprenticeship pro-grams is more limited.
● Minorities’ access to lucrative, nonminority consumer markets is compara-tively limited, due in part to historical patterns of residential segregation.
Each of these barriers has been produced and perpetuated, at least in part, bydiscrimination.
Barriers to minority participation in the government contracting processMinority firms may turn to government contracts to offset some of the limita-tions imposed by the private market. But barriers embedded in the contractingprocess itself can impede minority firms from winning government contracts.These barriers include:
● Failure of government to break large contracts down into smaller projects sothat minority firms, which tend to be smaller, can compete.
● Extensive granting of waivers from minority subcontracting requirements tomajority contractors.
● Ineffective screening for false minority fronts.● Limited notice of contract competitions.● Bid shopping on the part of majority prime contractors, who disclose minor-
ity firms’ subcontracting bids to their majority competitors so they can beunderbid.
Affirmative Action Policies in ContractingFederal, state, and local governments have addressed these barriers with a widerange of affirmative action programs. These programs fall into two broad cate-
DO MINORITY-OWNED BUSINESSES GET A FAIR SHARE OF GOVERNMENT CONTRACTS?viii
THE URBANINSTITUTE

gories. One uses race as a factor in the award of contracts. Examples include theuse of sole source contracts, set-asides, price or evaluation advantages, and theuse of goals for prime or subcontracting. These policies are intended to directlyincrease the number of contract and subcontract awards received by minorityfirms.
A second category of procurement-related policies seeks to expand thenumber of minority-owned firms contracting with government by increasingtheir financial, social, or human capital. These initiatives are sometimesreferred to as affirmative action programs and sometimes as race-neutral poli-cies. The goal is to put minority firms in a better position to compete as eitherprime contractors or subcontractors. These policies include lending and bond-ing help, technical assistance programs, expanded notice requirements, andimposing prompt payment directives on government agencies. In general, thesepolicies are intended to enlarge the pool of potential minority bidders for pub-lic contracts. They do not, however, directly affect outcomes in the contractorselection process.
Affirmative action programs in contracting have been directed primarily atassisting minority-owned businesses and not, for the most part, at increasingminority employment.
Shifting Legal Requirements for Affirmative Action Programs in ContractingThe future of affirmative action is being defined in large measure by the rul-ings of the Supreme Court in two cases that deal with government contracting.
In a 1989 case, City of Richmond v. J. A. Croson Co., the Supreme Court heldthat state and local preference programs would be subject to the Court’s rigor-ous “strict scrutiny standard.” Under this standard of review, racial classifica-tions must serve a “compelling interest” and be “narrowly tailored” to suitthat purpose. It was in response to Croson that many state and local govern-ments commissioned the “disparity studies” analyzed by the Urban Institute forthis report. The disparity studies document differences between the share ofall firms that minorities own and the share of government contracts theyreceive. In addition, they often document the role that state and local govern-ments and the private sector have played in perpetuating historical patterns ofdiscrimination through their contracting practices.
In June 1995, the Supreme Court decided Adarand Constructors v. Pena,apparently making all federal race-conscious, affirmative action programs sub-ject to the same strict scrutiny standard announced in Croson. The impact ofapplying strict scrutiny to affirmative action programs is profound: Proponentsof race-based policies intended to help minorities must meet the same highstandard of proof required for proponents of race-based practices that disad-vantage minorities.
Method This study examines whether there is disparity in the receipt of state and localgovernment contract dollars between minority-owned and majority-owned
EXECUTIVE SUMMARY
THE URBANINSTITUTE
ix
businesses. After screening 95 state and local disparity studies for basic levelsof consistency and reliability, the Urban Institute researchers combined theresults of 58 studies. Aggregating individual study results provides a nationalpicture of disparity in contracting and more reliable estimates than any indi-vidual study.
After the Supreme Court decision in the Croson case, the percentage of allgovernment contract dollars received by minority-owned businesses was thencompared to the percentage of all businesses “ready, willing, and able” to carryout government contracts that are minority-owned. Where these percentages aresimilar, there is no disparity in government contracting. For example, if 5 per-cent of all “ready, willing, and able” firms are minority-owned and 5 percentof government contracting dollars are awarded to minority-owned firms, thereis no disparity. If only 2 percent of government dollars went to minority-ownedfirms, there would be a disparity.
FindingsWe find substantial disparity in government contracting. That is, minority-owned businesses receive far fewer government contract dollars than wouldbe expected based on their availability. Minority-owned businesses as a groupreceive only 57 cents of each dollar they would be expected to receive basedon the percentage of all “ready, willing, and able” firms that are minority-owned(figure 1).
Further, there is substantial disparity in government contracting for eachminority population group (figure 2). African American-, Latino-, Asian-, NativeAmerican-, and women-owned businesses all receive a substantially lower pro-portion of government contracting dollars than would be expected, given theiravailability. African American-owned businesses receive only 49 percent of thedollars that would be expected. Latino-, Asian-, and Native American-ownedbusinesses receive 44 percent, 39 percent, and 18 percent, respectively. Women-owned businesses fare especially poorly, receiving only 29 percent of theexpected dollars.
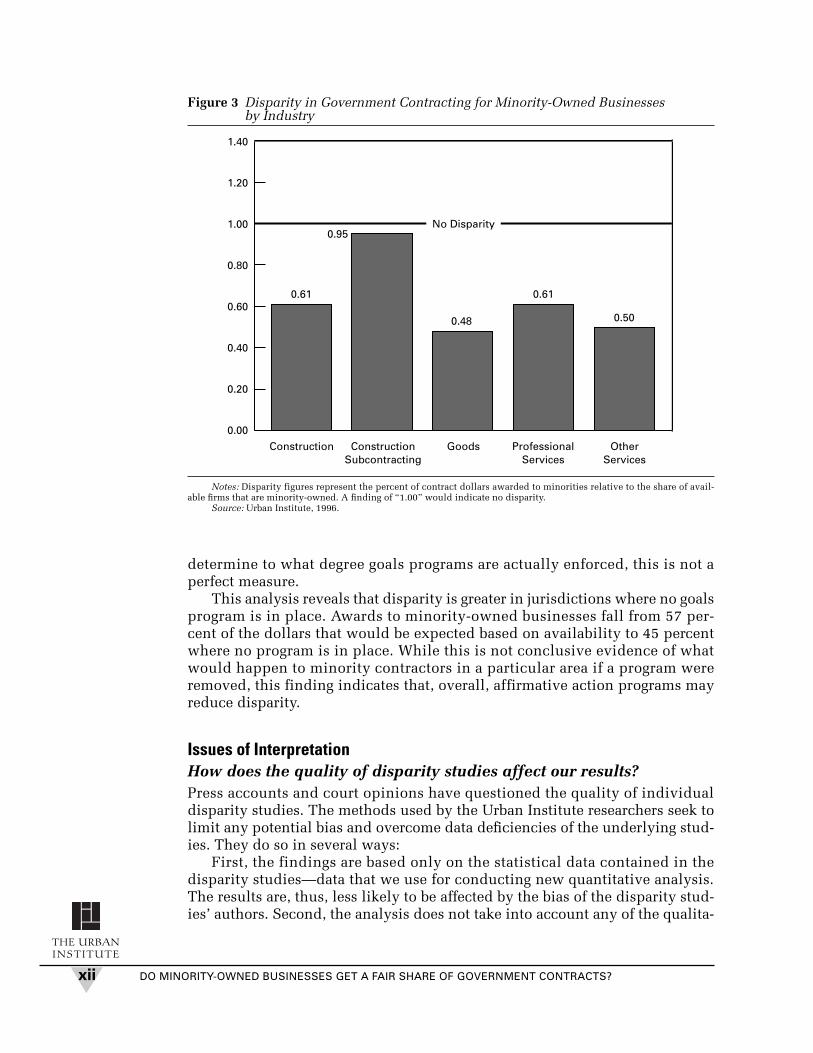
Disparity exists in every industry group studied as well. After separatingcontracts and businesses by broad industry group—construction, goods, pro-fessional services, and services other than professional—we find disparity forall minority groups (figure 3). The only exception is in construction subcon-tracting, where very little disparity is found.
These findings do not differentiate between jurisdictions that had in placestate and local affirmative action programs for procurement and those that didnot. If these programs are effective, it is expected that disparity levels in juris-dictions with such programs would be lower than in places where no programexists. Therefore, a separate examination was conducted of jurisdictions thathad no program in place. This led to an examination of jurisdictions duringtime periods before a program went into effect and where a goals program wasnever adopted.
For the purposes of our analysis, a “program” was considered to be in placeif there were mandatory or voluntary goals for minority- or women-ownedbusiness participation. Because other types of programs, both race-based andnon-race-based, can affect disparity ratios and because it is not possible to
DO MINORITY-OWNED BUSINESSES GET A FAIR SHARE OF GOVERNMENT CONTRACTS?x
THE URBANINSTITUTE

EXECUTIVE SUMMARY
THE URBANINSTITUTE
xi
Figure 1 Disparity in State and Local Government Contracting for Minority-Owned Businesses
Source: Urban Institute, 1996.
Minority firms received only$0.57 for every dollar they wouldbe expected to receive based ontheir availability.
$0.57
$1.00
Figure 2 Disparity in Government Contracting for Minority- and Women-Owned Businesses
No Disparity
1.40
1.20
1.00
0.80
0.60
0.40
0.20
0.00African Latinos Asians Native Women
Americans Americans
Notes: Disparity figures represent the percent of contract dollars awarded to minorities relative to the share of avail-able firms that are minority-owned. A finding of “1.00” would indicate no disparity.
Source: Urban Institute, 1996.
0.490.44
0.39
0.18
0.29
determine to what degree goals programs are actually enforced, this is not aperfect measure.
This analysis reveals that disparity is greater in jurisdictions where no goalsprogram is in place. Awards to minority-owned businesses fall from 57 per-cent of the dollars that would be expected based on availability to 45 percentwhere no program is in place. While this is not conclusive evidence of whatwould happen to minority contractors in a particular area if a program wereremoved, this finding indicates that, overall, affirmative action programs mayreduce disparity.
Issues of InterpretationHow does the quality of disparity studies affect our results?Press accounts and court opinions have questioned the quality of individualdisparity studies. The methods used by the Urban Institute researchers seek tolimit any potential bias and overcome data deficiencies of the underlying stud-ies. They do so in several ways:
First, the findings are based only on the statistical data contained in thedisparity studies—data that we use for conducting new quantitative analysis.The results are, thus, less likely to be affected by the bias of the disparity stud-ies’ authors. Second, the analysis does not take into account any of the qualita-
DO MINORITY-OWNED BUSINESSES GET A FAIR SHARE OF GOVERNMENT CONTRACTS?xii
THE URBANINSTITUTE
Figure 3 Disparity in Government Contracting for Minority-Owned Businesses by Industry
No Disparity
1.40
1.20
1.00
0.80
0.60
0.40
0.20
0.00
Construction Construction Goods Professional OtherSubcontracting Services Services
Notes: Disparity figures represent the percent of contract dollars awarded to minorities relative to the share of avail-able firms that are minority-owned. A finding of “1.00” would indicate no disparity.
Source: Urban Institute, 1996.
0.61
0.95
0.48
0.61
0.50

tive information, such as hearing testimony and historical analysis, presentedin the disparity studies—information that may have led the studies’ authors todifferent conclusions than those warranted by the disparity numbers alone.Third, the methods used by the disparity study authors in their quantitativeanalyses are remarkably consistent. Although there are differences across stud-ies in the sources of data used and in the definition of available firms, eachstudy reports on the same outcomes (i.e., the percentage of government contractdollars awarded to minority-owned firms compared to the percentage of allavailable firms that are minority-owned). While this consistency does notensure against bias, it does make it less likely.
Finally, by aggregating the findings of all the individual disparity studies,stronger estimates of disparity can be derived than from an individual study. Anindividual study may have data limitations (it may be based on a small num-ber of contracts, for example) that make its results comparatively unreliable.In this case, cumulating findings across many studies increases the accuracy ofthe results.
Are our results nationally representative?The findings provide the best evidence to date on the extent to which state andlocal governments nationwide contract with minority firms. They include datafrom some of the largest city and state governments in the country. Findingsare included from large state governments such as New York and Texas, largecities such as New York, and smaller jurisdictions such as Asheville, NorthCarolina. The 58 studies analyzed represent jurisdictions in 18 states and theDistrict of Columbia. They include a variety of governmental units includingcities, counties, states, and special districts such as schools, transportationagencies, and water resource authorities.
The studies screened were collected as part of the most comprehensiveeffort yet undertaken to find and analyze all existing disparity studies. Theeffort, which was carried out by the Department of Justice, employed existinglists of studies, references found in court cases, articles, other disparity stud-ies, and requests to research firms known to have conducted multiple studies.The studies reviewed, however, were not selected to constitute a nationally rep-resentative sample. Because Urban Institute researchers reviewed all studiesmade available by a certain date, there is no reason to believe that the selec-tion process biased the results in any way.
One difficulty in generalizing these findings to all state and local govern-ments is that it is unclear whether disparities found in jurisdictions that com-mission studies differ from those that do not. Answering this question wouldrequire additional data collection in places that did not commission disparitystudies.
Does disparity result from discrimination?The large disparities documented here in government contract awards canresult from government or private discrimination or can be the product ofminority-owned firms being, on average, less qualified to win government con-
EXECUTIVE SUMMARY
THE URBANINSTITUTE
xiii

tracts than majority-owned firms. In the latter case, being less qualified (e.g.,having less experience, fewer employees, or lacking access to bonding) may ormay not result from past or present discrimination. Due to data limitations, itis not possible to determine the degree to which the findings of disparity resultfrom discrimination.
The problem of linking disparity to discrimination is one that has been,and is being, grappled with by the courts. In the Croson case Justice Sandra DayO’Connor noted that “gross statistical disparities” constitute “prima facie proofof a pattern or practice of discrimination” in the employment context. However,it remains to be seen what the courts will accept as adequate proof of statisti-cal disparities in the procurement context.
Policy ImplicationsSeveral straightforward conclusions flow from the results of the analysis. Firstand most important, the results indicate that minority firms are less successfulthan their majority counterparts in obtaining procurement dollars at the stateand local government levels. The wide disparities presented here do not nec-essarily translate into proof of discrimination on the part of state and localgovernments. At a minimum, these findings suggest that barriers remain tominority firms’ participation in the government contracting process.
Second, wide disparities indicate that adoption of affirmative action andother programs designed to assist minority firms has not led to broad displace-ment of majority firms in the award of government contracts. That is, the resultsdo not support claims of widespread reverse discrimination in contracting atthe state and local government levels.
Third, the results indicate that disparities are greater in those areas whereno affirmative action program is in place. While a causal relationship betweenthese facts cannot be established on the basis of this examination alone, theresults may indicate that affirmative action programs help to reduce disparities.
The lack of knowledge about the effectiveness of affirmative action pro-grams, coupled with the wide disparities documented in this report, suggestthat there is not enough empirical evidence to justify the elimination of publicpolicies that promote minority participation in government contracting.Repealing affirmative action policies would limit the tools available to govern-ment to rectify these disparities.
Our findings strongly suggest that the knowledge base that informs the useof race-conscious policies in government contracting needs to be expanded. It is particularly important to evaluate the effectiveness of different race-conscious and race-neutral programs that may expand minority participation inprocurement. Such evaluations are routinely conducted in other areas of publicpolicy, such as job training. Along similar lines, policymakers need a better,more empirically based understanding of the pervasiveness and relative impor-tance of the barriers that minority firms face. In particular, data are needed toassess the fairness of business lending practices and the success of minorityfirms as both prime and subcontractors. Data on both winning and losing bidscould also help explain the source of the wide disparities documented in thisreport.
DO MINORITY-OWNED BUSINESSES GET A FAIR SHARE OF GOVERNMENT CONTRACTS?xiv
THE URBANINSTITUTE

Chapter 1
Introduction and Overview
This report explores the comparative success of minority firms in gov-ernment contracting and the affirmative action programs that governpublic procurement. The report focuses on the results of the UrbanInstitute’s review of 58 disparity studies conducted after the Supreme
Court’s 1989 ruling in City of Richmond v. J. A. Croson Co., 488 U.S. 469 (1989).In general, these studies sought to measure and describe the extent to whichminority firms received contracts from state and local governments.
The studies’ quantitative findings, when taken together, shed new light onthe use of minority contractors and the need for programs that assist them. Insum, despite the fact that race-based preference programs were, or had been,in place in many of the jurisdictions examined, the analysis reveals that minor-ity firms were substantially underutilized by state and local governments,receiving only 57 cents for every dollar they would be expected to receive basedon their availability.
Structure of the ReportThe report begins with a brief discussion of recent developments in affirmativeaction within the courts, the Congress, the executive branch, and the states. Wenote two divergent trends in policy: one toward affirmative action’s reform; theother to its repeal. The next section of the report presents the findings of our analy-sis of state and local disparity studies as well as a number of the core interpreta-tional issues raised by the results. Having presented the disparity studies’ results,we then seek to place the findings in context. To do so, we first provide an overviewof the barriers to minority firm formation and development as well as to minorityfirm participation in the government contracting process. We then sketch the affir-

mative action and other procurement-related policies that have been instituted, atleast in part, to help minority firms overcome these barriers. We conclude with adiscussion of the implications of our findings for public policy, specifically effortsto eliminate affirmative action in contracting that do not appear to be empiricallygrounded. An appendix follows describing our research methods more fully.
We have not focused on women in this report to the same degree as we have racial and ethnic minorities because the recent Supreme Court rulings thathave changed the landscape of affirmative action have dealt with race- and notgender-based programs. The evidence presented in the report does, however,clearly indicate that women-owned firms are underutilized by state and localgovernments.
The Policy EnvironmentThe national debate over affirmative action has concentrated principally onthree areas of policy: employment, higher education, and government con-tracting. Of the three, perhaps the least prominent has been the complex and little-understood area of government contracting. Despite its relative lack of vis-ibility, the scale of public contracting is quite large, making it an importantsource of economic opportunities for historically disadvantaged populations.The area has also been heavily contested, with legal challenges driving a broadjudicial reconsideration of the occasions upon which government can take raceexplicitly into account.
Scale of government contractingThere are two principal areas of government spending: (1) the direct employ-ment of federal, state, and local government employees; and (2) the purchaseof goods and services from private vendors (procurement). In 1990, Harvardscholar Steven Kelman estimated procurement at all levels of government tobe approximately $450 billion, or almost 10 percent of GNP (Kelman 1990).State and local government spending accounted for more than half, or approx-imately $250 billion. In a time of government downsizing, the share of total gov-ernment spending that goes to contracting (versus employment) is likely to rise.Indeed, in 1995, federal spending on contracting exceeded spending for fed-eral employment. Thus, procurement, like public employment, provides gov-ernments at all levels with a potentially powerful tool for promoting minorityopportunities and counteracting discrimination.
While the overall scale of public spending on contracting is large, the share oftotal federal contracting dollars that is provided to minority business enterprisesthrough what might be termed affirmative action programs is modest. Accordingto the President’s Affirmative Action Report, approximately 6.5 percent of all fed-eral prime contracts were awarded to minority-owned firms in 1994.1
Limited number of minority-owned firmsThe potential value of using procurement policy to promote minority entre-preneurship is reinforced by the limited number and size of minority firms.
DO MINORITY-OWNED BUSINESSES GET A FAIR SHARE OF GOVERNMENT CONTRACTS?2
THE URBANINSTITUTE

Minority-owned businesses are a smaller percentage of all businesses thanthe percentage of minorities in the population (see table 1.1).2 While AfricanAmericans constituted 12 percent of the population in 1992, they owned only3 percent of U.S. businesses. Similarly, Latinos represented 9 percent of thepopulation, but owned only 5 percent of businesses. Women-owned firms werealso underrepresented compared to population share. Asian and “other minor-ity business owners,” however, were overrepresented, given their share of thepopulation.
Minority businesses also capture a disproportionately small share of allbusiness receipts. African American firms receive only 1 percent, and Latinofirms only 2 percent of all such revenues. The size disadvantage is also reflectedin the relative number of firm employees, particularly for African Americanfirms: 83 percent of African American firms have no employees, compared to 74 percent of all firms.
Legal challenges to affirmative action in contractingAlthough the programs authorizing affirmative action in federal procurementhistorically have been rather routinely approved by the Congress,3 these con-tracting programs have been the subject of extensive judicial challenges.Indeed, over the past decade, the two landmark Supreme Court cases that havemost restricted the scope of affirmative action have been contracting cases:City of Richmond v. J. A. Croson Co., 488 U.S. 469 (1989) and AdarandConstructors v. Pena, 115 S. Ct. 2097 (1995).
In Croson, the Court held that state and local preference programs wouldbe subject to the Court’s rigorous “strict scrutiny standard.”4 Under this stan-
INTRODUCTION AND OVERVIEW
THE URBANINSTITUTE
3
Table 1.1 Selected Characteristics of 1992 Businesses by Minority Status of Owner(Includes Only Firms with $5,000 or More in Receipts in 1992)
AfricanAmerican Latino Asian1 Female2 All Firms
Percent of Population 11.7% 8.8% 0.4% 51.3% 100.0%
Number of Firms 384,190 552,482 473,945 3,578,580 12,026,590
Percent of Total Firms 3.2% 4.6% 3.9% 29.8% 100.0%
Percent of Total Receipts 1.0% 2.2% 3.0% 19.2% 100.0%
Size of Firm by Number of Paid Employees
None 83.2% 79.2% 71.3% 77.1% 73.9%
Less than 5 employees 13.4% 15.2% 20.4% 15.7% 17.9%
5 to 19 employees 2.7% 4.6% 6.9% 5.6% 6.3%
20 employees or more 0.6% 1.0% 1.4% 1.5% 1.9%
Total 100.0% 100.0% 100.0% 100.0% 100.0%
Source: U.S. Bureau of the Census, 1992 Surveys of Minority- and Women-Owned Business Enterprises.Notes: Firms may be included in more than one minority group. For example, a firm owned by a black Latino person
would be included as both a Latino-owned firm and as an African American-owned firm.1 Firms owned by other minorities (Native Americans, Pacific Islanders, Eskimos and Aleuts) are also included in this
category, although the vast majority are Asian-owned.2 Includes both minority- and white female-owned firms.

dard of review, racial classifications must serve a “compelling interest”5 andmust be “narrowly tailored” to suit that purpose.6 The compelling need andnarrow tailoring requirements impelled many state and local governmentsto commission what has come to be known as “disparity studies.” Thesestudies document, among other things, the disparity between the share ofall firms that minorities own and the share of government contracts theyreceive; the barriers that minority entrepreneurs have encountered in tryingto start or expand firms; and, in some instances, the role that state and localgovernments and the private sector have played in perpetuating historicalpatterns of discrimination through their contracting practices.7 Most studiescontain both statistical and anecdotal data that portray public and privatecontracting outcomes.
In June 1995, the U.S. Supreme Court handed down its decision in AdarandConstructors v. Pena, extending the Croson strict scrutiny standard to federalaffirmative action policy and apparently extending strict scrutiny beyond con-tracting. Indeed, the U.S. Court of Appeals for the Fifth Circuit, relying heavilyon Adarand, has recently invalidated race-based admissions policies at theUniversity of Texas Law School in the case of Hopwood v. State of Texas.8
The upshot of applying strict scrutiny to affirmative action programs, asCroson and Adarand do, is to force proponents of benign, race-based policies(i.e., compensatory policies that benefit minorities) to meet a much higher bur-den of proof than was previously the case. Indeed, the evidentiary burden thatthey must now overcome approximates that imposed on proponents of race-based practices that disadvantage minorities.9 While Justice O’Connor (theauthor of both Croson and Adarand) stated that the decisions do not foreclosethe use of racial preferences, the conditions under which affirmative action pro-grams will be found constitutional appear to be limited.
The President’s review of affirmative actionSearching reappraisals of affirmative action have not been limited to the judi-ciary. Two weeks after the Court announced its ruling in Adarand, PresidentClinton released the results of his yearlong review with his call to “mend, notend” affirmative action. At the same time he issued a directive that federalagencies reevaluate their policies in light of Adarand. The review, directed bythe Department of Justice, has led to the termination of a major set-aside pro-gram within the Department of Defense.10 It has also led to new, proposed rulesthat tie the use and sunset (or termination) of affirmative action programs to cer-tain statistical benchmarks that measure the level of minority underrepresen-tation in contracting within an industry or a region.11
Neither Croson nor Adarand directly addressed the standard of judicialreview that would be applied to preference programs in contracting that aregender-based. The majority of Appeals Court decisions that have considered theissue have held that gender-based affirmative action should be subjected to aless strict form of scrutiny than race-based classifications.12 As a result, mostrecently proposed Executive Branch reforms of affirmative action do notdirectly address women.
DO MINORITY-OWNED BUSINESSES GET A FAIR SHARE OF GOVERNMENT CONTRACTS?4
THE URBANINSTITUTE

Congressional challenges to affirmative actionThe recently ended 104th Congress considered two principal legislative vehi-cles related to affirmative action. The most sweeping of the two bills was knownas the Dole/Canady bill, or the Equal Opportunity Act (H.R. 2128). The billwould basically “end, not mend” affirmative action. Dole/Canady would gobeyond the limitations imposed by Adarand, barring most federal race- andgender-based preferences—even those that respond clearly to identifiable discrimination and are narrowly tailored. (The bill appears to make an excep-tion, however, for outreach and recruitment.) In June 1996 a substitute bill wasintroduced in the House that would narrow the Dole/Canady bill’s broad, government-wide bar to affirmative action to federal contracting and subcon-tracting, areas where the repeal of federal affirmative action policy would pre-sumably find less political resistance.
The second principal affirmative action bill introduced during the 104thCongress was known as the Meyers bill, or the Entrepreneur DevelopmentProgram Act of 1996 (H.R. 3994). Among other things, the Meyers bill repealsSection 8(a) of the Small Business Act, the Minority Small Business and CapitalOwnership Program, which is intended to provide assistance to firms owned bysocially and economically disadvantaged individuals in obtaining federal con-tracts. In practice, this program has provided assistance predominantly to firmsowned by racial minorities. (The Section 8(a) program is discussed in moredetail in chapter 3 of this report.) The Meyers bill was much narrower than theDole/Canady bill. It would repeal the 8(a) program entirely, but unlike theDole/Canady bill, it would not repeal all federal affirmative action programs.
State challenges to affirmative actionAt the state level, the most prominent initiative is the California Civil RightsInitiative (CCRI) or Proposition 209. Proposition 209 eliminates all state andlocal programs that “grant preferential treatment to any individual or group onthe basis of race, sex, color, ethnicity or national origin in the operation of pub-lic employment, public education, or public contracting,” except whererequired by federal law.13 Like the Dole/Canady bill, the initiative eliminatesrace- or gender-based policies. But unlike Dole/Canady, it could be interpretedto bar outreach and other programs directed toward women and minorities aswell as goals and timetables, set-asides, and express quotas.
Policy and Analytic ChallengesThe crux of the current debate over affirmative action can be seen in the judi-cial, administrative, and legislative reforms set out above. Proponents of affir-mative action—led by the Clinton administration—would preserve affirmativeaction policies, tailoring them so that they meet the new strict scrutiny standardof review announced by the Supreme Court. Affirmative action’s opponents—including the authors of the California Civil Rights Initiative—would termi-nate all race-conscious policies.
INTRODUCTION AND OVERVIEW
THE URBANINSTITUTE
5

The burden that the proponents of affirmative action must carry to demon-strate that race-conscious policies meet the Court’s exacting strict scrutiny stan-dard should not be discounted. Among the factors that courts will now considerin weighing race-conscious policies are determining whether:
● policymakers can show with some specificity how current practices and the lingering effects of discrimination have diminished minorities’ op-portunities (it is not enough to demonstrate general patterns of societal discrimination);
● numerical targets set by government for contracting dollars going to minority-owned firms reflect the availability of minority firms that are “ready, will-ing, and able”;
● equivalently effective, race-neutral alternatives exist to set-asides and otherrace-based policies;
● guidance has been provided on when preference programs should be termi-nated; and
● the burdens imposed by race-conscious policies on nonbeneficiaries havebeen minimized.
Taken together, the analytic challenges presented by these criteria raise con-cerns that affirmative action’s reformers may have to meet evidentiary standardsthat outstrip the capacity of existing data and research. Such standards wouldnot only undermine the Adarand Court’s assurance that strict scrutiny need notbe “strict in theory and fatal in fact,” they would effectively repeal affirmativeaction programs ranging from price preferences to simple outreach. This out-come would not be the product of a political choice that affirmative action is nolonger necessary or desirable. Rather, it would be the result of inadequate orunavailable data.
Relevance of Findings of State and Local Disparity Studies for Federal PolicyOur findings of wide disparities between the share minority firms represent ofall firms and the proportion of state and local contracts they receive have broadimplications for federal policymakers. In the first place, spending by state andlocal governments makes up a substantial share of GNP, thereby influencing thenumber and size of minority firms. Second, the literature suggests that the bar-riers faced by minority contractors—problems obtaining bonding and insur-ance, higher supply prices, and the like—are similar at state, local, and federallevels. Third, many of the goods and services purchased by state and local offi-cials are paid for with a mix of federal and local funds. In these instances, fed-eral procurement rules govern state and local activities, and the performanceof state and local government officials is a direct regulatory concern of the fed-eral government. In addition, eliminating discrimination on the part of stateand local government officials is clearly a constitutional responsibility of thefederal government. Finally, the federal government has a responsibility topolice discrimination in the private market as well as the passive participationof state and local governments within those markets.
DO MINORITY-OWNED BUSINESSES GET A FAIR SHARE OF GOVERNMENT CONTRACTS?6
THE URBANINSTITUTE

Notes
1. Affirmative Action Review, Report to the President, The White House, July 19, 1995, at 62(f).
2. Figures in Table 1.1 are based on the U.S. Census Bureau’s 1992 Survey of Minority-OwnedBusiness Enterprises (SMOBE) and Survey of Women-Owned Business Enterprises (SWOBE).These are surveys of small businesses including owners of sole proprietorships, partnerships,and Subchapter S-corporations that have fewer than 35 shareholders.
3. There is an extensive legislative history of congressional approval of programs to aid minor-ity business enterprises. A detailed record is set out at 61 Federal Register at 26042, May 23,1996.
4. The distinction between the limited power of state and local governments to employ racialclassifications and the more expansive authority of the federal government to do so wasdeemed important in Croson and in a number of other Supreme Court rulings addressingaffirmative action programs. The scope of the federal government’s power to utilize race-conscious alternatives or remedies has been substantially narrowed by the Court’s recentopinion in Adarand v. Pena, however.
5. Croson, 488 U.S. at 505.
6. Id. at 508.
7. In a sense, then, the focus on disparity as a measure of discrimination is more a response tothe Court’s edict than a product of academic inquiry into discrimination and its impacts.
8. U.S.C.A. Fifth Circuit, No. 94-50569, March 18, 1996.
9. In his dissenting opinion in Adarand, Justice John Paul Stevens wrote:
The Court . . . assumes that there is no significant difference between a decision by themajority to impose a special burden on the members of a minority race and a decision bythe majority to provide a benefit to certain members of that minority notwithstanding itsincidental burden on some members of the majority. In my opinion that assumption isuntenable. There is no moral or constitutional equivalence between a policy that isdesigned to perpetuate a caste system and one that seeks to eradicate racial subordination.
10. This was a practice known as the “rule of two,” which required that whenever a contract offi-cer could identify two or more small disadvantaged businesses that could bid on a project,the contract be set aside for bidding exclusively by minority firms.
11. 61 Federal Register at 26045 (1996).
12. See, generally, Walter Dellinger, Memorandum to General Counsels, U.S. Department ofJustice, Office of Legal Counsel, June 28, 1995, p. 8, found in Affirmative Action Review,Report to the President of the United States, July 19, 1995.
13. The initiative applies only to the public sector; voluntary affirmative action in the private sec-tor is not considered.
INTRODUCTION AND OVERVIEW
THE URBANINSTITUTE
7


Chapter 2
Evidence of Disparity inGovernment Contracting
This chapter presents the findings of our analysis of state and local dis-parity studies as well as a number of the core interpretational issuesraised by the results.
Analysis of Disparity StudiesAfter the Supreme Court’s 1989 decision in Croson, state and local governmentsbegan to commission studies to assess the existence and extent of discrimina-tion in their contracting processes. These studies provide measures of dispar-ity in the use of minority- and women-owned businesses in government pro-curement. That is, they examine the degree to which the share of contractawards received by minority firms is lower than the proportional representationof minority firms within selected industries. In the analysis presented below,we combine the disparity findings of 58 studies to portray disparities in stateand local government contracting across the nation. We conclude that minority-and women-owned businesses are underutilized in government contracting andthat the degree of underutilization is substantial. These statistical results holdup when subjected to a variety of sensitivity tests.
Study ApproachThis study is the first to present national data on disparities in government con-tracting by combining the results of the large number of studies done for stateand local governments since the Croson decision.

Our basic analytic strategy is to aggregate the quantitative evidence on dis-parity from as many studies as possible to provide a national picture of dispar-ity in state and local contracting. This method seeks to limit any potential biasand overcome data deficiencies of the underlying individual studies in severalways.
First, the findings are based only on the statistical data contained in thestudies—data that we use for conducting new quantitative analysis. The resultsare, thus, less likely to be affected by the bias of the individual authors. Second,the analysis does not take into account any of the qualitative information, suchas hearing testimony and historical analysis, presented in the disparity stud-ies—information that may have led their authors to different conclusions thanthe disparity numbers alone warranted. Third, the methods used by the dis-parity study authors in their quantitative analyses are remarkably consistent.Although there are differences across studies in the sources of data used andin the definition of available firms, each of the studies reports on the same out-comes (i.e., the percentage of government contract dollars awarded to minority-owned firms compared to the percentage of all available firms that are minority-owned). While this consistency does not ensure against bias, it does make it lesslikely.
Finally, by aggregating the findings of all the individual disparity studies,deficiencies in the quality of individual studies can be overcome. An individualstudy may have data limitations (it may be based on a small number of con-tracts, for example) that make its results comparatively unreliable. In this case,cumulating findings across many studies increases the reliability of the results.
Screening studiesWe used a number of criteria to screen each disparity study before including itin our findings. To be included, a study had to (1) present its findings as dis-parity ratios or provide the data necessary to calculate disparity ratios; (2) report findings separately by industry categories; (3) report the number ofcontracts in each industry on which the disparity findings were based or reportthe statistical significance of each disparity finding; and (4) have more than 80 contracts for all years of the study period combined. These criteria weredeveloped to ensure a basic level of consistency and reliability across studies,enabling us to aggregate findings. In addition to applying these clear-cut crite-ria, some studies were excluded because they did not indicate exactly howkey calculations had been performed or because there were significant incon-sistencies throughout the study. Of the 95 studies we reviewed, findings from58 are included in this analysis.1
This screening process should not be taken to mean that the disparity stud-ies we excluded were the “worst” or that those included were the “best.”Disparity studies typically contain much more information than just the numer-ical figures we use in this analysis. For example, many studies report statisti-cal analyses on business formation, historical analyses of regional discrimina-tion, the results of contractor surveys, or the findings of hearings held ondiscrimination in contracting. Since we do not use this information in ouranalysis, we did not evaluate these parts of the studies. Rather, our inclusion
DO MINORITY-OWNED BUSINESSES GET A FAIR SHARE OF GOVERNMENT CONTRACTS?10
THE URBANINSTITUTE

or exclusion of studies reflects only our ability to use the numerical disparityfindings.
Defining disparityNearly all of the post-Croson studies focus on the disparity between govern-ment utilization of minority-owned businesses (i.e., the extent to which theyreceive government contracts or subcontracts) and the availability of those busi-nesses to perform government work. Utilization is typically measured as theproportion of government contract dollars awarded or paid to minority-ownedbusinesses. Availability is the minority-owned share of all firms available todo government work. This definition of the availability of minority- andwomen-owned businesses can be somewhat ambiguous, as there are severalways to define which firms are available to perform government work. Differentstudies employ different, and sometimes multiple, measures of availability. Aswill be discussed below, there is no “best” way to define which firms are avail-able to perform government contracting work, although the choice of measurecan affect the findings.
The degree of disparity is often expressed as a ratio of utilization to avail-ability, or the disparity ratio. A disparity ratio equal to one means that minor-ity contractors are used exactly in proportion to their availability for govern-ment work, while a disparity ratio less than one means that minority firms arebeing disproportionately underutilized. A disparity ratio close to zero indi-cates substantial underutilization. If, for example, 10 percent of the availablefirms in a selected industry were minority-owned and 10 percent of govern-ment contract dollars in that industry were awarded to minority contractors,the disparity ratio would be 1. If the availability of minority-owned firmsremains at 10 percent, but only 7 percent of government contract dollars goto minority-owned firms, then the disparity ratio would be less than 1 (0.7),indicating underutilization of minority-owned firms. However, a disparityratio of 1 does not mean that contract dollars are evenly spread within thegroup of available majority or minority contractors. It is possible to have a dis-parity ratio of 1 and have all contract dollars awarded to minority firms goingto a single firm.
Measuring utilizationUtilization is measured in several ways in the disparity studies. In some stud-ies utilization is based on the dollar amount of contract awards, while in others utilization is based on the dollars actually paid out. If a project ischanged or canceled midstream, the amount of dollars actually paid to thewinning firm can be less than the award at contract time. Measures of uti-lization based on contract award data may overstate dollars going to minor-ity firms if, after a contract is awarded, the prime contractor excludes minor-ity subcontractors from the project. On the other hand, measures based ondollars actually paid out often fail to identify dollars going to minority-ownedsubcontractors because government payments go to the prime contractor andno record is kept of payments to subcontractors.
EVIDENCE OF DISPARITY IN GOVERNMENT CONTRACTING
THE URBANINSTITUTE
11

Several studies calculate an additional measure of utilization based on theproportion of the total number of contract awards that go to minority firms.Because the vast majority of studies measured utilization as a proportion oftotal dollars, we refer to our aggregate results as dollars even though we includeall measures of utilization.
Measuring availabilityThe studies reviewed in this analysis also vary in their approaches to measur-ing availability. Attempting to follow the Croson decision, disparity studiescompare the share of contracts awarded to minority-owned firms to the share ofminority-owned firms that are “ready, willing, and able” or have the “capac-ity” to undertake government contracting work. However, different approachesto identifying qualified firms lead to different availability measures and, in turn,different levels of disparity.
The five most common ways of defining available firms in the studies are:
● firms that have previously won government contracts (i.e., those found onvendors lists);
● firms that have bid on government contracts in the past (i.e., those found onbidders lists) or those that appear on registration or mailing lists of busi-nesses wishing to receive notification of government contract competitions;
● firms that have been certified by a government agency as minority- or women-owned businesses, according to the rules of the jurisdiction;
● firms that express interest in performing government contract work in sur-veys conducted by the authors of disparity studies; and
● all firms.2
These measures reflect different approaches to assessing whether firms havethe capacity to conduct government contract work. Including only firms thathave previously won government contracts is the narrowest commonly usedway of identifying firms that are ready, willing, and able because it assumesfirms must have previously worked for the government to be considered capa-ble. Including firms that have bid on contracts, been certified, or appear onregistration or mailing lists generates broader measures of availability becausethey include firms that have expressed an interest in conducting governmentwork, but may or may not have done public sector work in the past. These mea-sures may include firms that are not capable of government work. Finally, thebroadest measure of availability attributes to all existing firms the capacity tocarry out government work—whether or not they have expressed an interest ingovernment contracting or are qualified to do the work.
Just as these measures differ in the ways they capture firm capacity, theyalso differ in the extent to which they incorporate the effects of discrimina-tion. There is an apparent tradeoff between accounting for the effects of pastand present discrimination and capturing current capacity. There are manystages in the firm formation and procurement process at which discriminationcan take place, from deciding to start a business to actually winning a govern-ment contract (figure 2.1). The more narrowly a measure screens for capacity,the more prior discrimination it builds in. For example, while firms that appear
DO MINORITY-OWNED BUSINESSES GET A FAIR SHARE OF GOVERNMENT CONTRACTS?12
THE URBANINSTITUTE

EVIDENCE OF DISPARITY IN GOVERNMENT CONTRACTING
THE URBANINSTITUTE
13
Winners of Government Contracts
8. Discrimination in private market demand
9. Discrimination in information about government contracting opportunities
10. Discrimination in prices of supplies
1. Discrimination in allocation of government resources
2. Discrimination in hiring3. Discrimination in schooling
4. Discrimination in lending5. Red-lining6. Discrimination in promotions7. Discrimination by unions for
apprenticeships
11. Discrimination in business networks12. Discrimination in bonding13. Discrimination in information on
bids
14. Discrimination in lending for capital growth
15. Discrimination in business and government networks
16. Discrimination in bonding
17. Discrimination in awarding contracts
Data Source
Census
Census
SM/WOBE, EconomicCensus, CountyBusinessPatterns
Surveys
Bidders
Vendors
Willing & Ready(to perform government work)
Business Owners
Employment
Population
Capable(to perform government work)
Shown Interest(in performing government work)
Unemployed and discouraged workers
Underinvestment in human capitaldue to anticipation of labor marketdiscrimination
Potential business owners discouraged by anticipation of market and lending discrimination
Procurement process
Discouraged from government workdue to anticipated discrimination incontracting process
Figure 2.1 Risk Points in the Firm Formation and Procurement Process
on a vendors list are clearly capable of winning government contracts, thesemeasures may be biased by acts of discrimination that have limited the num-ber of minority-owned firms winning contracts or have discouraged firms frombidding on government contracts. As a result, the availability (and the degree ofdisparity) of qualified minorities may be understated by using the more restric-tive vendors lists.
In contrast, broader availability measures that include all minority firms areless likely to build in past and present discrimination on the part of governmentor the business community. However, these broader availability measures willinclude an unknown number of firms that may not be ready, willing, and able toobtain government contracts.
However, taking into account the willingness and ability of firms to carry outgovernment contracts does not always lead to lower measures of minority firmavailability. If minority contractors perceive the public sector to be less dis-criminatory than the private market, they may be more inclined toward govern-ment contract work than majority firms. In fact, minority-owned firms receive alarger share of their revenues from the public sector than do majority firms (Batesand Williams 1995). When minority firms are heavily reliant on public sectorwork, availability measures based on expressed interest in government con-tracting will exceed measures that include all existing firms.
Aside from interest in carrying out government contracts, the individualdisparity studies for the most part do not reflect firms’ capacity to carry out gov-ernment work. For example, one possible indicator of ability to conduct gov-ernment work is firm size. Most of the availability measures used in the dis-parity studies do not take firm size into account.3 Since minority firms tend tobe smaller than majority firms, we might conclude that measures that do nottake size into account are likely to overstate minority availability. However, thisargument relies on the assumption that size is a good predictor of the capacityto perform government contracting work. It could be argued that this assump-tion discounts the potential dynamism of firms, many of which can expand orsubcontract in order to perform large, complex tasks.
Major FindingsWe present our disparity findings for all minority-owned and women-ownedbusinesses in table 2.1 and separately for African American-, Latino-, Asian-,and Native American-owned businesses in table 2.2. Within each group, find-ings are also presented separately for broad industry categories, including con-struction, construction subcontracting, goods (or commodities), professionalservices (such as architecture or engineering), and other (nonprofessional),services such as housekeeping or maintenance. We present results using twodifferent measures: the median disparity ratio for all studies4 and the percentof studies reporting substantial underutilization defined as a disparity ratio lessthan 0.8. From our results we draw the following conclusions:
● African American-, Latino-, Asian-, Native American-, and women-ownedbusinesses are underutilized (i.e., they receive fewer government contractdollars than expected, given their availability).
DO MINORITY-OWNED BUSINESSES GET A FAIR SHARE OF GOVERNMENT CONTRACTS?14
THE URBANINSTITUTE

● Minority-owned businesses receive 57 cents of every dollar expected to beallocated to them based on firm availability (i.e., the median disparity ratiofor all minority businesses across all industries is 0.57).5 This disparity iswidespread, with almost two-thirds of all studies finding substantial under-utilization of minority-owned businesses.
● Women-owned businesses receive only 29 cents of every dollar expected to beallocated to them based on firm availability. This disparity is even morewidespread than for minority-owned businesses; 87 percent of all studiesfind substantial underutilization of women-owned businesses.
● In each industry category minority-owned and women-owned businesses asa group are underutilized.
● All our findings of underutilization are statistically significant with theexception of construction subcontracting and Native Americans in construc-tion. Statistical significance means that these results are unlikely to be due tochance.6
There are some important differences in disparity across industries. We findthat:
● Construction subcontracting has the highest levels of minority- and women-owned business utilization of all industry categories. This may be due to the
EVIDENCE OF DISPARITY IN GOVERNMENT CONTRACTING
THE URBANINSTITUTE
15
Table 2.1 Medians and Distribution of Disparity Ratios for All Minorities andWomen by Industry
Construction Professional OtherConstruction Subcontract Goods Services Services Total
All Minorities
Median 0.61 + 0.95 0.48 * 0.61 + 0.50 * 0.57 *
Disparity Ratio of:0.0 to 0.8 59% 38% 66% 63% 67% 63%0.8 to 1.2 24% 46% 26% 11% 7% 18%1.2 and over 18% 15% 9% 26% 27% 18%
Number of Studies 51 13 47 35 30 163
Women
Median 0.48 * 0.77 0.30 * 0.17 * 0.31 * 0.29 *
Disparity Ratio of:0.0 to 0.8 81% 54% 89% 95% 82% 87%0.8 to 1.2 10% 8% 11% 3% 7% 8%1.2 and over 10% 38% 0% 3% 11% 5%
Number of Studies 52 13 47 37 28 164
Source: Urban Institute analysis of disparity studies.Notes: To calculate the median, we (1) calculate the average disparity ratio for each study; and (2) take the median of
these averages. Median figures for “Total” industries are calculated by taking the median across all studies for all indus-tries. Figures for construction may include dollars paid to both prime and subcontractors. Number of studies for “Total”industries is greater than the number of studies read, because the individual studies include multiple industries. The data onwhich this table is based are reported in table A.3.
Tests were conducted for two null hypotheses: the median equals 1; and the median equals 0.8. The tests of statisticalsignificance were conducted using a “sign” test. Each test measures the probability that the observed distribution of studiesreporting disparity values below 1 (or below 0.8) could occur by chance, if the true median disparity ratio is equal to l (or 0.8).
Cells for which there is less than a 5 percent chance of the observed underutilization occurring by chance given a truemedian of either 0.8 or 1.0 are marked with an asterisk, while cells with a less than 5 percent chance of of the observed under-utilization given a true median of 1.0 (but not 0.8) are marked with a plus sign. A one-tailed test of significance was used.

fact that affirmative action programs in construction often encourage minor-ity participation as subcontractors. These disparity ratios are based on rela-tively few studies and are only statistically significant for African Americans.
● For all minority groups combined, the goods and other services industriesexhibit the most disparity between utilization and availability.
DO MINORITY-OWNED BUSINESSES GET A FAIR SHARE OF GOVERNMENT CONTRACTS?16
THE URBANINSTITUTE
Table 2.2 Medians and Distribution of Disparity Ratios for Minority Subgroups by Industry
Construction Professional OtherConstruction Subcontract Goods Services Services Total
African Americans
Median 0.56 * 0.72 0.48 + 0.33 + 0.49 + 0.49 *
Disparity Ratio of:0.0 to 0.8 64% 62% 59% 63% 65% 63%0.8 to 1.2 14% 31% 14% 14% 15% 14%1.2 and over 22% 8% 27% 23% 19% 23%
Number of Studies 50 13 44 35 26 155
Latinos
Median 0.67 + 0.84 0.24 * 0.60 + 0.26 * 0.44 *
Disparity Ratio of:0.0 to 0.8 59% 46% 74% 65% 80% 68%0.8 to 1.2 18% 15% 10% 24% 12% 16%1.2 and over 22% 38% 17% 12% 8% 16%
Number of Studies 49 13 42 34 25 150
Asians
Median 0.60 * 0.90 0.20 * 0.41 * 0.28 0.39 *
Disparity Ratio of:0.0 to 0.8 63% 38% 67% 71% 69% 67%0.8 to 1.2 10% 31% 10% 9% 8% 9%1.2 and over 27% 31% 24% 21% 23% 24%
Number of Studies 49 13 43 35 26 153
Native Americans
Median 0.72 2.28 0.18 * 0.01 * 0.16 * 0.18 *
Disparity Ratio of:0.0 to 0.8 55% 40% 80% 80% 93% 74%0.8 to 1.2 13% 0% 0% 4% 0% 5%1.2 and over 32% 60% 20% 16% 7% 21%
Number of Studies 31 5 25 25 15 96
Source: Urban Institute analysis of disparity studies.Notes: To calculate the median, we (1) calculate the average disparity ratio for each study; and (2) take the median of
these averages. Median figures for total industries are calculated by taking the median across all studies for all industries.Figures for construction may include dollars paid to both prime and subcontractors. Number of studies for “Total” indus-tries is greater than the number of studies read, because the individual studies include multiple industries. The number ofstudies differs across minority groups, because not all studies report results for all minority groups. The data on which thistable is based are reported in table A.3.
Tests were conducted for two null hypotheses: the median equals 1; and the median equals 0.8. The tests of statisticalsignificance were conducted using a “sign” test. Each test measures the probability that the observed distribution of studiesreporting disparity values below 1 (or below 0.8) could occur by chance, if the true median disparity ratio is equal to l (or 0.8).
Cells for which there is a less than 5 percent chance of the observed underutilization occurring by chance given a truemedian of either 0.8 or 1.0 are marked with an asterisk, while cells with a less than 5 percent chance of of the observed under-utilization given a true median of 1.0 (but not 0.8) are marked with a plus sign. A one-tailed test of significance was used.

● Of all industry groups, professional services has the widest variance in dis-parity across minority groups. Latino-owned businesses have the highestutilization relative to the other minority groups. The disparity ratio forLatino-owned businesses in professional services (0.60) is more than threetimes the ratio for women-owned businesses (0.17) and almost twice the ratiofor African American-owned businesses (0.33).
We also find that the pattern of disparity across industries varies withineach racial and ethnic group:
● African American-owned businesses are most underutilized in the profes-sional services industry category. Underutilization is also relatively high inthe goods and other services industries for these businesses.
● Latino-owned and Asian-owned businesses7 are most underutilized in thegoods and other services industries. Eighty percent of studies find substantialunderutilization of Latino-owned businesses in the other services category.More than two-thirds of studies find substantial underutilization of Asian-owned businesses in both the goods and other services industries.
● Native American-owned firms are extremely underutilized in the goods, pro-fessional services, and other services industries. More than 80 percent of allstudies showed underutilization of Native Americans in professional andother services. Native American-owned firms’ utilization rates are the low-est of any group in these industries.
● Women-owned businesses experience the greatest disparity between the per-cent of contract dollars received and availability. Underutilization is partic-ularly high in professional services, where 95 percent of studies show sub-stantial underutilization.
There are also differences in disparity across geographic regions in the con-struction industry, as shown in table 2.3. We only calculated regional disparityratios for the construction industry because there were not enough studies tosupport a separate regional analysis in the other industries. We find:
● The Midwest has the lowest levels of disparity for each minority group in con-struction. Disparity ratios for the Midwest range from 1.36 for Asian-ownedbusinesses to 0.88 for Native American-owned businesses.
● The West has the highest levels of disparity in construction for all minoritygroups except Asians. The South generally has the second highest levels ofdisparity for minority-owned firms.
● Women-owned construction businesses are substantially underutilized inall regions. Disparity ratios range from 0.41 to 0.69 for women-owned busi-nesses.
Finally, we present the average level of availability as measured in the studiesreviewed. The same level of disparity can exist with very different levels of avail-ability. For example, a disparity ratio of 1 can be consistent with the percentageof businesses that are minority-owned being 2 percent or 40 percent. Obviously,to reach a disparity ratio of 1, minority-owned businesses must win more gov-ernment dollars if availability is 40 percent than if it is 2 percent. We find:
EVIDENCE OF DISPARITY IN GOVERNMENT CONTRACTING
THE URBANINSTITUTE
17

● The median availability for African-American firms is 2.7 percent, for Latinofirms is 2.9 percent, for Asian firms is 1.3 percent, for Native American firmsis 0.6 percent, and for women-owned firms is 10.5 percent. To place thesenumbers in context, note that African Americans, Latinos, Asians, andwomen represent 11.7 percent, 8.8 percent, 0.4 percent, and 51.3 percent ofthe U.S. population, respectively (table 1.1).
Strength of the Results It is important to remember that our results combine findings from studieswhose methods differ in many ways: They use different measures of availabil-ity and utilization; different years of data are used; and construction and other
DO MINORITY-OWNED BUSINESSES GET A FAIR SHARE OF GOVERNMENT CONTRACTS?18
THE URBANINSTITUTE
Table 2.3 Median Disparity Ratios for Minorities and Women in the ConstructionIndustry by Region
West South Northeast Midwest
African Americans
Median 0.28 0.60 0.53 1.01
Number of Studies 15 19 7 9
Latinos
Median 0.54 0.60 0.76 0.90
Number of Studies 15 18 7 9
Asians
Median 0.60 0.34 0.59 1.36
Number of Studies 15 18 7 9
Native Americans
Median 0.08 0.56 NA 0.88
Number of Studies 11 9 NA 7
All Minorities
Median 0.51 0.58 0.69 1.02
Number of Studies 16 17 8 10
Women
Median 0.50 0.58 0.41 0.52
Number of Studies 16 18 8 10
Source: Urban Institute analysis of disparity studies.Notes: See table 2.1 for explanation of how the medians were calculated.NA means results for a particular cell were based on less than 5 studies, and therefore not reported.See table A.1 for full references for the following disparity studies.Studies for the West region include Alameda Co., CA; Albuquerque, NM; Contra Costa Co., CA; Denver Phase II, CO;
Denver RTD, CO; Hayward, CA; Las Vegas, NV; Maricopa Co., AZ; New Mexico; Oakland, CA; Phoenix, AZ; Pima Co., AZ;Richmond, CA; Sacramento, CA; San Jose, CA; Tucson, AZ.
Studies for the South region include Asheville, NC; Dade Co., FL; Dallas, TX; Dallas/Fort Worth International Airport,TX; District of Columbia; Florida; Fort Worth, TX; Greensboro, NC; Houston, TX; Jacksonville, NC; Jefferson Co., AL;Louisiana; Memphis, TN; New Orleans, LA; Orange Co., FL; St. Petersburg, FL; San Antonio, TX; Tampa, FL; Texas.
Studies for the Northeast region include Boston, MA; Massachusetts; New York; New York City, NY; New York CityHousing Authority, NY; Port Authority, NY/NJ; S.E. Pennsylvania Transportation, PA; Syracuse, NY.
Studies for the Midwest region include Chicago, IL; Cincinnati, OH; Columbus, OH; Dayton, OH; Hennepin Co., MN;Milwaukee, WI; Minneapolis, MN; Ramsey Co., MN; St. Paul, MN; St. Paul School District, MN.

contracts funded by the federal government are excluded in some studies andincluded in others. The data used in our estimates are shown in table A.3.
Nonetheless, we believe that our approach to aggregating the disparity stud-ies provides solid evidence of disparity and that differences across the indi-vidual studies do not explain our overall disparity findings. This is becausewe compared our overall findings to studies whose results were:
● based on large numbers of contracts and/or high levels of minority firm availability;
● based on comparatively restrictive measures of minority firm availability;● based on disparity jurisdictions that did not have a race-based goals pro-
gram in place for state or local government contracting; and● drawn from different study authors.
The consistency of the findings across studies when these alternative mea-sures are examined allows us to be more confident of the correctness of theoverall findings. Had the findings of disparity weakened after excluding certaingroups of studies (those with few contracts or less restrictive measures of avail-ability) or differed appreciably across study authors, we would be inclined toquestion them. We discuss below the importance of these sensitivity analyses insupporting our overall findings of disparity.
Findings excluding studies with few contractsWe assume that by aggregating disparity findings across studies, the combineddata provide accurate estimates of overall disparity. However, some individualstudies are more reliable than others, because they are based on greater amountsof data. By examining only those studies with comparatively large numbers ofcontracts and high levels of availability, we can test the robustness of ourresults.8 When we do so we learn that our findings of disparity do not changesubstantially—disparities for all minorities fall from 0.57 to 0.51 and for womenfrom 0.29 to 0.26 (see table 2.4). Tests of statistical significance confirmed ourresults across most industries and populations.
Findings by availability measureAs we discussed earlier, there is no “best” way to define which firms are avail-able to perform government contracting work. We expect, though, that somemeasures will produce stronger evidence of disparity than others. For exam-ple, measures that include all minority-owned firms might lead to findings ofgreater disparity, because they may overstate the number of firms that are ready,willing, and able. However, if we were to find evidence of disparity when onlyfirms that have won government contracts are included, our results should betaken as relatively strong evidence of minority disadvantage in procurement.
Since our findings combine studies using different measures of availabil-ity, we conducted a separate analysis to see whether our results changed whenwe eliminated those that employed the least restrictive measures of availability.We calculated separately the median disparity ratio for measures of availabil-ity that in some way reflect firms that are “ready, willing, and able” (labeled
EVIDENCE OF DISPARITY IN GOVERNMENT CONTRACTING
THE URBANINSTITUTE
19

RWA in table 2.5) and the median disparity ratio for measures of availabilitybased on all firms (i.e., uses the Census Bureau’s SMOBE/SWOBE data).9
As indicated in table 2.5, we generally find higher levels of disparity whenincluding only measures of availability that are limited to ready, willing, andable firms. The disparity ratio for all minorities across all industries, for exam-ple, falls from 0.57 to 0.42 when we exclude measures of availability based onall firms. In fact, disparity ratios based on all firms are generally higher (reflect-ing less disparity) than those based on more restrictive measures of availabil-
DO MINORITY-OWNED BUSINESSES GET A FAIR SHARE OF GOVERNMENT CONTRACTS?20
THE URBANINSTITUTE
Table 2.4 Median Disparity Ratios for Minorities and Women by Industry, Using Only Results from Studies With Large Numbers of Contracts or High Availability
Construction Professional OtherConstruction Subcontract Goods Services Services Total
African Americans
Median 0.36 + 0.72 0.75 0.20 * 0.49 * 0.41 *
Number of Studies 20 5 28 17 16 82
Latinos
Median 0.68 + 0.99 0.19 * 0.71 + 0.36 * 0.36 *
Number of Studies 22 9 26 16 16 80
Asians
Median 0.59 NA 0.17 * 0.19 * 0.22 * 0.19 *
Number of Studies 9 NA 26 18 14 68
Native Americans
Median 0.72 NA 0.19 * 0.09 0.23 0.18 *
Number of Studies 5 NA 11 6 6 28
All Minorities
Median 0.56 * 0.75 0.47 + 0.52 * 0.49 * 0.51 *
Number of Studies 40 10 40 28 28 136
Women
Median 0.45 * 0.54 0.30 * 0.16 * 0.27 * 0.26 *
Number of Studies 31 9 41 31 26 129
Source: Urban Institute analysis of disparity studies.Notes: The results presented in this table are based on a subset of studies with large numbers of contracts or high
availability of minority- or women-owned firms. The criteria for including these studies was a combination of the followinglevels of availability and contracts: (1) 1% availability and 1,175 contracts; (2) 1.25% availability and 940 contracts; (3) 1.5% availability and 783 contracts; (4) 2% availability and 587 contracts; (5) 2.5% availability and 470 contracts; (6) 5% availability and 234 contracts; (7) 10% availability and 116 contracts; (8) 20% availability and 45 contracts. If astudy had the appropriate combination of number of contracts and availability, it was included in the analysis. No study withavailability of less than 0.5% or number of contracts less than 45 was included. If the number of contracts was not reported,the study was included if availability was greater than 10%. For studies with more than one measure of disparity, this crite-rion was applied to every measure in the study. If a majority of measures met the criterion, all measures from the studywere included.
NA means results for a particular cell were based on fewer than 5 studies, and therefore not reported.Tests were conducted for two null hypotheses: the median equals 1; and the median equals 0.8. The tests of statistical
significance were conducted using a “sign” test. Each test measures the probability that the observed distribution of studiesreporting disparity values below 1 (or below 0.8) could occur by chance, if the true median disparity ratio is equal to 1 (or0.8).
Cells for which there is less than 5 percent chance of the observed underutilization occurring by chance given a truemedian of either 0.8 or 1.0 are marked with an asterisk, while cells with less than a 5 percent chance of the observed under-utilization given a true median of 1.0 (but not 0.8) are marked with a plus sign. A one-tailed test of significance was used.

EV
IDE
NC
E O
F DIS
PAR
ITY
IN G
OV
ER
NM
EN
T C
ON
TR
AC
TIN
G
TH
E U
RB
AN
INS
TIT
UT
E
21
Table 2.5 Median Disparity Ratios for Minorities and Women by Industry, Comparing Different Availability Measures
Construction Professional Other Construction Subcontract Goods Services Services Total
All All All All All All Firms RWA Firms RWA Firms RWA Firms RWA Firms RWA Firms RWA
African Americans
Median 0.83 0.52 0.85 0.70 0.69 0.25 0.93 0.11 0.71 0.45 0.80 0.26
Number of Studies 28 36 8 7 31 26 17 24 14 18 90 104
Latinos
Median 0.77 0.53 0.58 0.99 0.32 0.19 0.45 0.43 0.24 0.20 0.41 0.36
Number of Studies 27 36 8 7 29 26 17 24 13 18 86 104
Asians
Median 0.86 0.46 1.01 1.07 0.31 0.19 1.13 0.22 0.47 0.24 0.64 0.31
Number of Studies 26 35 8 7 29 26 17 24 14 18 86 103
Native Americans
Median 2.57 0.48 NA NA 2.06 0.16 0.00 0.00 NA 0.16 0.90 0.16
Number of Studies 5 30 NA NA 6 22 7 22 NA 15 20 89
All Minorities
Median 0.99 0.56 0.97 0.87 0.80 0.35 1.40 0.36 0.99 0.34 0.99 0.42
Number of Studies 28 37 8 7 30 31 17 25 14 22 89 115
Women
Median 0.59 0.43 1.12 0.97 0.21 0.30 0.21 0.20 0.31 0.33 0.31 0.28
Number of Studies 28 38 8 7 31 30 19 25 13 21 91 114
Source: Urban Institute analysis of disparity studies.Notes: Median disparity ratios using measures of availability based on data from the Surveys of Minority- and Women-Owned Business Enterprises are included in the “All Firms”
columns. Those based upon all measures of availability that are more reflective of “ready, willing and able” firms are included in the columns headed “RWA.” Findings from individ-ual studies may be included in both categories if they employed All Firms and RWA measures of availability.
NA means results for a particular cell were based on less than 5 studies, and therefore not reported.
ity. There are several possible explanations for this result. First, the differingavailability measures may produce varied outcomes because the underlyingdata represent different time periods. The SMOBE/SWOBE data used by mostof the studies are from 1987. These data are older than those used to calculatemost other measures of availability and may not capture the growth that hasoccurred over time in the numbers of minority-owned firms. Second, it is alsopossible that limitations in the SMOBE/SWOBE data lead to an underestimateof minority firm availability. For example, some disparity studies fail to adjustfor the fact that the 1987 SMOBE/SWOBE undercounts Asian- and Latino-owned firms.10
Another possible explanation for the finding of less disparity using mea-sures based on all firms is that minority-owned firms make up a higher propor-tion of firms bidding on, or interested in, government contract work than theyrepresent of all existing firms. As mentioned earlier, a greater percentage of minority-owned firms’ revenues come from government sources than domajority-owned firms’ revenues. Whether minority firms’ reliance on govern-ment contracts is due to greater discrimination in the private market, or to themore widespread existence of affirmative action programs in the public sector,it could explain the higher availability of minority-owned firms when usingmore restrictive measures of availability.
Findings for studies without an affirmative action program in placeOur overall findings from the disparity studies do not differentiate between juris-dictions that had state and local affirmative action programs for procurement inplace and those that did not. If these programs are effective, we would expectthat disparity levels in jurisdictions with programs would be lower than placeswhere no program exists. Therefore, we examine separately findings from stud-ies of jurisdictions that had no program in place during the study years.
Defining whether a program is in place is difficult because of the differingtypes of affirmative action programs that exist. For the purposes of our analysis,we considered a “program” to be in place when a jurisdiction had adopted manda-tory or voluntary goals for minority- or women-owned business participation.
There were three separate circumstances in which no program was consid-ered to be in place: (1) jurisdictions during a period of time before a programwent into effect (“pre”); (2) jurisdictions during a period after a program wassuspended (“post”); and (3) jurisdictions where no program had ever beenintroduced (“none”).11 Table 2.6 reports the combined results for the “pre” and“none” groups. The “post” group is not included, because these results are morelikely to reflect the effects of programs that were recently in place.
Comparing these results to our overall findings in table 2.2 makes clear thatdisparity is greater when there are no goals programs in place. The median dis-parity ratios are lower—in some cases substantially lower—for 20 out of 24industry/race groups where no program is in place. For all industries com-bined, the disparity ratio falls from 0.49 to 0.22 for African Americans andfrom 0.44 to 0.26 for Latinos when we restrict the sample to disparities calcu-lated “pre” program or in areas without a program. When the results for timeperiods “post” program are included, we find the same or somewhat lower lev-
DO MINORITY-OWNED BUSINESSES GET A FAIR SHARE OF GOVERNMENT CONTRACTS?22
THE URBANINSTITUTE

els of disparity than we found using only the “pre”/“none” groups (table 2.7).These results, like those in table 2.6, show greater disparity among jurisdic-tions without programs compared to our overall findings, particularly for con-struction and construction subcontracting. But as table 2.8 indicates, whilethere was a clear pattern of greater disparity during periods when no programwas in place across almost all groups and industries, the differences wererarely statistically significant.
While this is not conclusive evidence of what would happen to minoritycontractors in a particular area if a program were removed, it does suggest that,overall, affirmative action programs reduce disparity. However, this findingcould also occur if the level of disparity in a jurisdiction were related to thedecision to start or eliminate goals programs. For example, governments thatadopt affirmative action programs may be less likely to discriminate in the firstplace and therefore may have lower disparity with or without a program inplace than other areas.
EVIDENCE OF DISPARITY IN GOVERNMENT CONTRACTING
THE URBANINSTITUTE
23
Table 2.6 Median Disparity Ratios for Minorities and Women by Industry, UsingResults from Areas Without an Affirmative Action Program in PlaceBefore or During Study Years
Construction Professional OtherConstruction Subcontract Goods Services Services Total
African Americans
Median 0.21 NA 0.24 0.11 0.38 0.22
Number of Studies 14 NA 12 11 8 45
Latinos
Median 0.27 NA 0.16 0.72 0.24 0.26
Number of Studies 14 NA 12 11 8 45
Asians
Median 0.00 NA 0.16 0.19 0.11 0.13
Number of Studies 14 NA 12 11 8 45
Native Americans
Median 0.00 NA 0.25 0.04 0.03 0.04
Number of Studies 9 NA 8 7 5 29
All Minorities
Median 0.43 NA 0.32 0.61 0.50 0.45
Number of Studies 15 NA 12 11 9 47
Women
Median 0.43 NA 0.21 0.07 0.26 0.24
Number of Studies 15 NA 13 12 9 49
Source: Urban Institute analysis of disparity studies.Notes: This table is based on findings from areas and time periods where there was no race-based mandatory or volun-
tary goals program in place at any point up to that time. It does not include findings for time periods after a program had beensuspended.
NA means results for a particular cell were based on fewer than 5 studies, and therefore not reported.

Findings across studies by different authors/firmsThere are several private research firms that have carried out multiple dispar-ity studies. It has been asserted that these firms have a greater incentive to finddisparity than firms or consultants conducting only one or an occasionalstudy.12 We examined whether contractors conducting multiple studies aremore likely to find disparity than others.
We find that the research firms that have conducted multiple disparity stud-ies are no more likely to find disparity than other firms or authors. Table 2.9arrays studies of the construction industry by contractor and results. Results arepresented as the number of studies with disparity ratios less than 0.8, between0.8 and 1.2, and over 1.2.13 We must be careful in interpreting these numbersbecause contractors carrying out multiple studies tend to concentrate in cer-tain geographic areas that may have higher or lower levels of disparity. Eachmajor contractor’s results are fairly similarly distributed across the three cate-gories of disparity. Moreover, no single contractor consistently finds only sub-stantial underutilization.
DO MINORITY-OWNED BUSINESSES GET A FAIR SHARE OF GOVERNMENT CONTRACTS?24
THE URBANINSTITUTE
Table 2.7 Median Disparity Ratios for Minorities and Women by Industry, UsingResults from Areas Without an Affirmative Action Program in PlaceDuring Study Years
Construction Professional OtherConstruction Subcontract Goods Services Services Total
African Americans
Median 0.47 0.51 0.34 0.00 0.46 0.34
Number of Studies 23 6 20 15 15 73
Latinos
Median 0.42 0.75 0.20 0.74 0.16 0.27
Number of Studies 23 6 20 15 15 73
Asians
Median 0.28 0.70 0.16 0.19 0.20 0.19
Number of Studies 23 6 20 15 15 73
Native Americans
Median 0.43 NA 0.15 0.00 0.13 0.13
Number of Studies 16 NA 14 11 11 52
All Minorities
Median 0.46 0.53 0.41 0.61 0.49 0.47
Number of Studies 24 6 21 15 16 76
Women
Median 0.43 0.78 0.21 0.12 0.23 0.25
Number of Studies 24 6 22 16 16 78
Source: Urban Institute analysis of disparity studies.Notes: This table is based on findings from areas and time periods where there was no race-based mandatory or volun-
tary goals program in place at that time; results are included for an area for study years after a program had been suspended.NA means results for a particular cell were based on less than 5 studies, and therefore not reported.

Issues in Interpreting the FindingsIn interpreting the results of our analysis of state and local data on disparity,three possible critiques arise. First, what do disparity ratios drawn from the 58 studies we analyzed tell us about state and local government disparitynationwide? That is to say, how representative are our results? Second, can
EVIDENCE OF DISPARITY IN GOVERNMENT CONTRACTING
THE URBANINSTITUTE
25
Table 2.8 Median Disparity Ratios for Minorities and Women by Industry, UsingResults from Areas With an Affirmative Action Program in Place DuringEach Study Year
Construction Professional OtherConstruction Subcontract Goods Services Services Total
African Americans
Median 0.61 0.95 0.67 0.27 0.49 0.51*
Number of Studies 37 10 30 24 17 108
(–0.97) (–0.92) (–1.28) (–1.53) (–0.98) (–2.11)
Latinos
Median 0.66* 0.94 0.40 0.45 0.29 0.48*
Number of Studies 35 10 27 23 15 100
(–1.80) (–0.92) (–0.56) (0.93) (–1.14) (–1.72)
Asians
Median 0.77* 1.07 0.27 0.50 0.39 0.50*
Number of Studies 35 10 28 24 16 102
(–1.72) (–0.49) (–0.96) (–0.87) (0.14) (–1.94)
Native Americans
Median 0.71 NA 0.19 0.00 0.16 0.16
Number of Studies 21 NA 15 17 8 61
(–1.33) (–0.69) (0.00) (0.04) (–0.27)
All Minorities
Median 0.73 1.01 0.70 0.57 0.36 0.61
Number of Studies 35 10 31 23 19 108
(–1.35) (–1.57) (–1.42) (0.01) (–0.31) (–1.61)
Women
Median 0.45 0.99 0.35 0.18 0.43 0.29
Number of Studies 36 10 31 25 17 109
(0.17) (–0.27) (–0.91) (–.41) (0.85) (–0.73)
Source: Urban Institute analysis of disparity studies.Notes: This table is based on findings from areas and time periods when there was a race-based mandatory or volun-
tary goals program in place.NA means results for a particular cell were based on fewer than 5 studies, and therefore not reported.The tests of statistical significance compare the median disparity ratios for areas with and without an affirmative action
program in place during the study years. The latter medians are reported in table 2.7. These tests were conducted using the Mann-Whitney-Wilcoxon test of the equality of medians from independent samples. Test statistics are reported inparentheses.
Cells for which there is less than a 5 percent chance that the true medians are equal are denoted with an asterisk.One-tailed tests of statistical significance were used.

evidence of disparity be interpreted as evidence of discrimination? Finally, dothe disparity measures we use capture the effects of past and present discrimi-nation on the number and capacity of minority businesses? We address eachseparately in this section.
Assessing the National Representativeness of Our FindingsThe findings from the disparity studies provide the best evidence to date on theextent to which state and local governments nationwide contract with minority
DO MINORITY-OWNED BUSINESSES GET A FAIR SHARE OF GOVERNMENT CONTRACTS?26
THE URBANINSTITUTE
Table 2.9 Disparity Ratios for Minorities and Women in the Construction Industry,Comparing Distributions of Average Disparity Ratios by Study Author
Number of Studies
NERA BBC D.J. Miller Other Contractors
African AmericansDisparity Ratio of:
0.0 to 0.8 9 7 8 90.8 to 1.2 0 2 1 31.2 and over 1 5 1 4
Total Number of Studies 10 14 10 16
LatinosDisparity Ratio of:
0.0 to 0.8 4 9 5 110.8 to 1.2 4 2 3 11.2 and over 2 3 2 3
Total Number of Studies 10 14 10 15
AsiansDisparity Ratio of:
0.0 to 0.8 6 6 8 110.8 to 1.2 2 2 0 11.2 and over 2 6 2 3
Total Number of Studies 10 14 10 15
Native AmericansDisparity Ratio of:
0.0 to 0.8 2 9 3 40.8 to 1.2 0 2 1 11.2 and over 1 3 1 5
Total Number of Studies 3 14 5 10
All MinoritiesDisparity Ratio of:
0.0 to 0.8 7 9 4 110.8 to 1.2 4 2 4 11.2 and over 0 4 1 4
Total Number of Studies 11 15 9 16
WomenDisparity Ratio of:
0.0 to 0.8 8 14 6 140.8 to 1.2 3 0 2 11.2 and over 0 1 2 1
Total Number of Studies 11 15 10 16
Source: Urban Institute analysis of disparity studies.

firms. The studies we reviewed represent a wide range of governments: largestate governments such as New York and Texas, large cities such as New York,and smaller governments such as Asheville, North Carolina. The 58 studies rep-resent findings from 18 states and the District of Columbia as well as a varietyof governmental units including cities, counties, states, and special districtssuch as schools, transportation agencies and water resource authorities.
We performed a sensitivity analysis to see how the results changed whenonly studies with a large number of contracts are included. When we did so, wefound that the disparity ratios of places with large numbers of contracts werequite similar to those with fewer. Since studies that are based on small numbersof contracts often examine small jurisdictions, this at least suggests that dis-parity levels do not vary widely across governments and agencies that differ insize.
One difficulty in trying to extrapolate from these studies to all state andlocal governments is that we do not know whether disparities in jurisdictionsthat commission studies differ from those in jurisdictions that do not. If moststudies respond to allegations by civil rights groups or others that minoritybusinesses are not receiving their due share of contracts, the studies may gen-erate unrepresentatively high disparity ratios. On the other hand, if agencieswith successful minority contracting programs were more likely to commissionstudies, the studies we examined could overrepresent places where minoritygroups receive an unusually high proportion of government contracts. Thiswould mean that disparities nationwide exceed those found in this study. Infact, we have no information on the reasons governmental units commissioneddisparity studies.
What Is the Relationship Between Disparity and Discrimination?The large disparities in government contract awards documented in this reportcan result from government or private market discrimination or they can bethe product of minority-owned firms being, on average, less qualified to wingovernment contracts than majority-owned firms. In the latter case, being lessqualified (e.g., having less experience or fewer employees or lacking access tobonding) may or may not result from past or present discrimination.
We are interested in understanding both the extent of discrimination by gov-ernment in the contracting process itself as well as discrimination in the widerprivate market that may limit minority-owned firms’ ability to compete.Government has a clear responsibility to eliminate direct discrimination in thegovernment contracting process. However, government can also play a role inreducing private market discrimination so that it does not end up passively par-ticipating in private market discrimination through its contracting process. Dueto data limitations, we are unable to determine the degree to which our findingsof disparity represent discrimination, either in the government contractingprocess or the private market.
Little evidence exists, in general, on the extent to which disparity in gov-ernment contracting may be due to discrimination by government officials orparticipants in the private market. However, if we compare the contract awardsof similarly qualified minority-owned and majority-owned firms, we can bemore confident that any resulting disparity in awards is due to current dis-
EVIDENCE OF DISPARITY IN GOVERNMENT CONTRACTING
THE URBANINSTITUTE
27

crimination in the contract process and not differences in the qualifications offirms. Unfortunately, few of the disparity studies include the necessary data tocarry out this comparison. Even if this were possible, there are two difficultieswith this comparison.
First, differences in firm qualifications may themselves result from dis-crimination. We would need, then, to analyze the extent to which the privatemarket practices that determine firm qualifications (bank lending, for exam-ple) are themselves discriminatory.
Second, defining which firms are similarly qualified is not straightforward.Some possible indicators of firm capacity include total revenues, number ofemployees, bonding levels, and experience. Required qualifications may varyby type of contract. For example, firm size may be more important in winninga highway construction contract than a legal services contract.
Our sensitivity analyses represent a step in trying to determine the extentto which disparity is due to discrimination. For instance, when we focus ouranalysis only on the subset of minority firms that have demonstrated an interestin performing government contract work, we still find strikingly wide dispari-ties. However, because we have not been able to separately examine disparityamong firms with equal capacity using the characteristics listed above (i.e., rev-enues, employees and the like), we do not know the degree to which our find-ings of disparity represent discrimination.
The problem of determining whether a disparity can be ascribed to discrimi-nation is also an issue that has been considered—and is still under considera-tion—by the courts. The Supreme Court announced somewhat ambiguous stan-dards to guide the judiciary in examining the question. In the Croson case, whenJustice O’Connor drew an analogy between discrimination in government con-tracting and employment discrimination, she wrote:
There is no doubt that “[w]here gross statistical disparities can be shown,they alone in a proper case may constitute prima facie proof of a patternor practice of discrimination” under Title VII. But it is equally clear that“[w]hen special qualifications are required to fill particular jobs, compar-isons to the general population (rather than to the smaller group of indi-viduals who possess the necessary qualifications) may have little probativevalue.”14
This analysis, and its explicit analogy to the employment context, suggeststhat the courts can consider statistical disparities—such as those presented inthis report—to be evidence of discrimination in the government contractingcontext.
However, it also makes clear that some disparities (for example, the differ-ence between the minority population share and the government’s utilization ofminority firms) do not prove discrimination. Justice O’Connor argued that thecorrect comparison should be between the number of firms “qualified to under-take prime or subcontracting work in public construction contracts” and thenumber actually receiving such contracts.15 However, it remains to be seen whatthe courts will accept as adequate proof of statistical disparities in the pro-curement context.
DO MINORITY-OWNED BUSINESSES GET A FAIR SHARE OF GOVERNMENT CONTRACTS?28
THE URBANINSTITUTE

Accounting for Past and Present Discrimination in Business FormationDiscrimination can prevent minorities from becoming business owners andhamper the growth of minority-owned businesses and contribute to their failure.In the absence of discrimination, it is likely there would be more minority-owned firms, and existing firms would have greater capacity and experience.The analytic question raised, then, is do the availability measures we use under-estimate the share of firms that in the absence of discrimination would be pre-pared to handle government contracts, including those firms that did not form?
As discussed earlier, the differing availability measures used to calculatedisparity ratios are affected by past and present discrimination against minori-ties. But even the most inclusive of all measures of availability used in the dis-parity studies do not take into account the fact that many minority firms neverform because of discriminatory barriers.
Efforts to estimate what the availability of minority-owned firms would be in the absence of race discrimination have been made. This type of “but-for-discrimination” analysis is intended to capture past and present discriminationby the private and government sectors.
The traditional approach to this analysis is to compare the probability thatsimilarly situated minority and nonminority individuals are self-employed.“Similarly situated” refers here to having the same level of education, finan-cial resources, or other characteristics. These analyses also focus on differ-ences in rates of start-up and failure, firm size, or other measures of capacity.16
The difference in these probabilities by race can then be attributed to the effectsof discrimination. The usefulness of this measure depends on how well thestudies account for critical factors that affect business formation and failure.Generally speaking, the more factors included, the more the remaining differ-ences can be attributed to discrimination.
Results from these analyses suggest that availability measures based exclu-sively on existing firms understate the availability of minority-owned busi-nesses (Fairlie and Meyer 1994). A study by Bates (1995) on self-employmentrates found that African Americans had a 48 percent lower probability of enter-ing self-employment than white Americans, after factoring in a wide range ofcharacteristics that affect self-employment. New York State’s 1992 disparitystudy (see table A.1) indicates that minority availability would be 30 percenthigher in construction if minority-owned businesses had formed at rates com-parable to those of majority-owned businesses.
Since our analysis of disparity studies finds wide disparities for existingminority-owned firms, building in the “but for” or counterfactual for avail-ability would likely lead us to find even greater levels of disparity. However,it is also likely that if there were greater numbers of minority-owned firms“ready, willing, and able” to perform government contracts, the proportion ofdollars going to minority-owned firms (their utilization) would change. Thus,it is not clear what the extent of disparity would be in the absence of discrim-ination. In the final analysis, the principal value of the but-for calculus is as anadditional way of assessing the impacts of discrimination on minority-ownedfirms.
EVIDENCE OF DISPARITY IN GOVERNMENT CONTRACTING
THE URBANINSTITUTE
29

Notes
1. The studies reviewed were furnished by the Department of Justice through its efforts to col-lect all existing state and local contracting disparity studies conducted after the Crosondecision.
2. The main source of data on all firms is the U.S. Census Bureau’s Survey of Minority-OwnedBusiness Enterprises and the Survey of Women-Owned Business Enterprises (SMOBE/SWOBE). Sometimes only the number of firms with paid employees is included. There areadditional limitations and issues with the SMOBE/SWOBE data that may end up excludingsome existing minority-owned firms. However, these are not related to whether firms are“ready, willing, and able.” These data issues are discussed in the appendix.
3. The main exception is the occasional exclusion of firms that do not have paid employees.
4. To calculate the median, we first calculate the average disparity ratio for each study. Wethen take the median of these averages.
5. The median disparity ratio for the “all minorities” category is for the most part greater thanthe medians for individual groups. This apparent anomaly is due to the fact that the dispar-ity ratio reported for “all minorities” is the median of all the individual studies’ disparityratios for all minorities, not the average of each minority group’s median presented in table2.1. Further discussion of this point is included in the appendix.
6. The tests of statistical significance are conducted using a “sign” test to determine the likeli-hood that the findings are the result of chance. Each study is considered to be a separaterandom event (the equivalent of a coin flip) in which the outcome is either above or below ahypothesized median (e.g., 1.0). We then calculate the probability that a finding of underuti-lization occurs by chance. The calculations are based on the same theory used to determinewhether a coin is fair, based on seeing the result of a large number of coin flips.
7. Some of the disparity studies group Asian- and Native American-owned businesses togetherbecause of their small numbers. We include findings from these studies in the Asian-ownedbusiness category, since the availability of Asian-owned firms is far greater than NativeAmerican-owned firms. Furthermore, studies for geographic areas where there are greaternumbers of Native American businesses for the most part report disparity separately for thesetwo groups.
8. For a description of how we defined studies that had large enough numbers of contracts orhigh enough minority-owned firm availability for inclusion in this subanalysis, see notes totable 2.4.
9. We attempted to analyze separately studies that used only bidders or vendors lists, but therewas not a sufficient amount of studies to support this analysis.
10. Also, it is not clear that a measure based on all existing firms in a given jurisdiction wouldnecessarily be more restrictive than a measure based on a bidders list in a different juris-diction. Examination of the studies that included multiple measures of availability for thesame geographic area, however, showed the same general pattern within studies as theseresults: Often the measure of availability based on SMOBE/SWOBE showed less availabilityof minority-owned firms than more restrictive measures. This suggests that differences acrossjurisdictions are not likely the reason for these results.
11. Some studies are included in more than one of these groups, because they report findingsfor several time periods.
12. This assertion assumes that the state and local governments that commissioned disparitystudies preferred a finding of disparity, which may not be true.
13. There are 17 different authors of the 58 disparity studies reviewed (see table A.1). In additionto BBC, NERA, and D.J. Miller, several other authors conducted multiple studies. However,the number of studies they conducted were few enough that we include them in the cate-gory “other contractors.”
14. Croson, 488 U.S. at 501 (internal citations omitted).
DO MINORITY-OWNED BUSINESSES GET A FAIR SHARE OF GOVERNMENT CONTRACTS?30
THE URBANINSTITUTE

15. Id. at 502.
16. There is some tension between adjusting for undercapacity of minority firms due to dis-crimination using this type of analysis and creating measures of availability that reflect cur-rent firm capacity as a way of representing only firms that are “ready, willing, and able.”Because minority firms are on average smaller, the first tends to adjust availability upwardwhile the second adjusts it downward.
EVIDENCE OF DISPARITY IN GOVERNMENT CONTRACTING
THE URBANINSTITUTE
31


Chapter 3
Economic and Policy Context
The measure we use in chapter 1 to assess the relative disadvantage ofminority firms in procurement is a disparity ratio. This ratio is definedas the proportion of contracting dollars received by minority firms (uti-lization) divided by a measure of their relative availability (i.e., the
share of all existing firms, or of all firms that are ready, willing, and able thatthey represent). We demonstrated that state and local governments broadlyunderutilize minority firms. We also provide data that indicate the low avail-ability and disadvantaged character of minority firms. While minorities accountfor 21 percent of the population, they own only 12 percent of businesses andreceive only 6 percent of all receipts. We also noted that even where no dis-parity exists, the number and capacity of minority firms can be quite low, withtheir utilization being commensurately limited.
This chapter places our disparity findings in context. It explores the barriersthat prevent minority-owned firms from becoming more numerous, from increas-ing their capacity, and from obtaining government contracts. The first part of thechapter discusses barriers to the formation and growth of minority firms. Thesecond part describes the contracting process itself and discusses how differentsteps in the contracting process may prevent the utilization of minority firms.We do not explore barriers to women’s business ownership. (Women areexcluded from this analysis because recent court challenges to affirmativeaction address the use of racial- and ethnic-, but not gender-based classifica-tions.1) The third section of this chapter provides an overview of affirmativeaction policies in contracting.

Barriers to Formation and Growth of Minority FirmsResearch on minority-owned businesses, along with anecdotal and small sur-vey evidence presented in disparity studies, suggests that the major barriers toformation and development of minority businesses are (1) lack of financialcapital; (2) lack of social capital (e.g., business networks and familial resources);(3) human capital deficits; and (4) lack of market access. These barriers affectthe savings, borrowing, and bonding capacities of minority business owners aswell as their ability to penetrate lucrative markets, to develop stable demand,and to obtain business supplies at competitive prices. Alternative explana-tions for the low levels of minority entrepreneurship have also been advanced.Perhaps the most common is that Latinos’ and African Americans’ cultures arenot conducive to entrepreneurship. But, as discussed later in this chapter, thereis little empirical support for this theory.
Each of the four major barriers to firm formation and development notedabove could themselves be the result of discrimination. For example, low levelsof personal wealth or education among minorities result in part from histori-cal discrimination. Firm owners, customers, bank officials, or government con-tract officers may value the same financial or social attributes less when they areheld by a minority than when they are held by a nonminority. Discriminationthat ascribes membership in a minority group with low productivity, achieve-ment, and quality service can also retard minority firm formation and develop-ment. These discriminatory barriers and practices not only prevent minoritiesfrom achieving their goals of business ownership, but they may also discour-age minorities from even attempting to form businesses. Where obstacles toformation are particularly high, more people may decide to enter salaried sec-tors where discrimination is perceived to be lower, rather than pursuing self-employment (Boyd 1991).
Our understanding of barriers to business formation is based mostly onresearch focusing on African Americans. The self-employment experiencesof Latinos and Asians have been examined mainly within the context ofimmigration (Youngert 1995, Kim et al. 1989, Wong 1989, Borjas 1986, Portesand Bach 1985, Min 1984). As a result, we know less about native-bornLatinos and Asians—populations that are covered by most affirmative actionpolicies.
Limited Financial CapitalIt is broadly acknowledged that lack of sufficient income, wealth, and accessto financial markets limits the formation of minority firms and restricts theirdevelopment.
Insufficient income and wealthMost business owners start with no capital or use their own savings as start-upcapital. More than three-fourths of minority-owned businesses, with the excep-tion of Asian-owned firms, are started without any borrowed capital (table 3.1).2
The importance of one’s own resources in starting a business has broad impli-
DO MINORITY-OWNED BUSINESSES GET A FAIR SHARE OF GOVERNMENT CONTRACTS?34
THE URBANINSTITUTE

cations for Latinos and African Americans, given their lower levels of incomeand wealth.3
Roughly one-third of African Americans and over 30 percent of Latinoslive below the poverty level. Minorities also have lower median incomes: blackand Latino families have 50 percent and 56 percent, respectively, of the medianfamily income of whites.
Minorities also have lower levels of wealth. They are less likely than whitesto own homes or cars or to receive income from investments. Householdsheaded by blacks have, on average, just one-quarter of the assets of white house-holds (Blau and Graham 1990, Meyer 1990). Lower levels of wealth also have adirect effect on intergenerational transfers, as fewer minority parents have muchfinancial capital or other assets to leave to their children. Some analysts call intoquestion the importance of wealth on firm formation given the fact that manyfirms start with no investment at all (Meyer 1990). However, limited wealth isalso a barrier to starting larger firms or financing the growth of a firm over time.
Another potential source of start-up capital is borrowing from friends andfamily. African Americans use these sources of capital less frequently than doothers. As indicated in table 3.1, only 7.5 percent of African American busi-ness owners relied upon loans from friends and family for start-up capital, com-pared to 10.4 percent of nonminority male owners. Asian business owners, bycontrast, rely far more heavily on family and friends as sources of start-up cap-ital than do nonminority males.
Minorities’ low income and wealth is in part the result of discrimination.African Americans, in particular, have been excluded from institutions of
ECONOMIC AND POLICY CONTEXT
THE URBANINSTITUTE
35
Table 3.1 Financial and Social Capital Characteristics of 1987 Business Ownersby Minority Status
African Nonminority American Latino Asian1 Female2 Male
Source of Borrowed Capital3
None (no capital or did not borrow) 77.2% 75.8% 62.6% 78.7% 70.6%
Family or friends 7.5% 11.3% 24.4% 7.9% 10.4%
Commercial bank loan 10.5% 9.4% 13.0% 11.2% 16.9%
Other 9.9% 8.8% 14.4% 7.2% 8.7%
Family Networks
Percent who had close relatives who owned a business 29.7% 32.5% 37.6% 49.3% 50.1%
Percent worked for close relatives who owned a business 10.8% 12.9% 14.2% 18.1% 25.1%
Source: U.S. Bureau of the Census, 1987 Economic Censuses, Characteristics of Business Owners.Notes: Percents are based on the number of owners reporting. 1 Other minorities (Native Americans, Pacific Islanders, Eskimos and Aleuts) are also included in this category, although
the vast majority of business owners in this category are Asian.2 Includes both minority and white female business owners.3 Percents sum to more than 100, because owners can report more than one source of capital.

higher education, received inferior education (Higgs 1989), been deniedemployment opportunities (Fix and Struyk 1993), received lower wages (Juhn,Murphy, and Pierce 1991), and been denied mortgages to buy homes (Munnell,Tootell, Browne, and McEneaney 1996). Each of these factors has contributed tothe high poverty rates and low wealth of African Americans.
Lack of access to financial marketsDespite their greater need for private market loans (due to their relatively low incomes and limited wealth), African Americans and Latinos are less likely than whites to borrow from banks when starting or expanding businesses(table 3.1; Bates 1989). Latino business owners are the least likely to borrowfrom banks (9.4 percent), followed by African Americans (10.5 percent). Loansmay be unobtainable for African Americans and other minorities for a numberof reasons. Many have no history of borrowing and are unable to demonstratecreditworthiness. In addition, African Americans’ low incomes, low homeownership rates, and poorly capitalized firms mean low collateral to back upbusiness loans.
Furthermore, there is evidence that discrimination may be a factor in thelimited access of African Americans and Latinos to lending institutions. AfricanAmericans with the same level of financial capital as whites receive about athird of the loan dollars when seeking business loans (Bates 1991). Minoritiesare also less likely to obtain business loans than are white owners with the sameborrowing credentials (Colorado Center for Community Development 1996,Grown and Bates 1992, Ando 1988).
Limited Social CapitalSocial capital, that is, networks of business associates, family members, cus-tomers, and employees, can also be important in the formation and develop-ment of firms (Fratoe 1988). Here again, minorities are at a disadvantage.
Lack of access to business networksBusiness networks, which commonly involve membership in formal trade andbusiness organizations, such as the Rotary Club, or informal relationships withother successful business owners, can provide a business owner with intro-ductions to new clients and suppliers, information on upcoming projects, andinformation on technical developments and the like. Networks can also serve assources of capital for business owners in need of cash to develop their busi-nesses (Fratoe 1988). As we will discuss further in the review of the contract-ing process, networks may also play a role in determining the winners of gov-ernment contracts.
There is little empirical work on the extent to which minorities’ lack ofaccess to business networks is the result of discrimination. However, minoritieshistorically have had less access than nonminorities to unions, particularly con-struction unions, which are important sources of networking (Hill 1989).4
DO MINORITY-OWNED BUSINESSES GET A FAIR SHARE OF GOVERNMENT CONTRACTS?36
THE URBANINSTITUTE

Given the usefulness of these networks, their inaccessibility can representan important, if subtle, barrier to firm formation and development. Exclusionfrom business networks limits minorities’ access to information about oppor-tunities that can result in opening a business and may also preclude minorityowners from getting information and guidance about areas where their busi-nesses could expand. Several disparity studies report instances in whichnotices to bid for public projects were publicized through networks dominatedby majority businesses. Minorities’ difficulty in penetrating majority-dominatedbusiness networks may confine the relationship of minority and nonminoritycontractors to public projects governed by mandatory set-asides.
Family networksThe family is another important element of social capital that can promote busi-ness formation and support business growth. On the one hand, the family is areadily available work force from which the business owner can draw. Spousesand children commonly serve as paid or unpaid labor in family businesses(Sanders and Nee 1996, Fratoe 1988). The family can also be a form of busi-ness network. Self-employed parents transfer to their children informationabout business as well as the business itself. Having a relative who is a businessowner is highly correlated with entrepreneurship by other family members. Inthis regard, African Americans’ comparatively low marriage rate and highfemale headship limit their ability to draw on the family as a source of socialcapital. Fifty percent of white male business owners had close relatives whoowned a business. A quarter worked for close relatives who owned a business(table 3.1). African Americans, in contrast, are the least likely of any group tohave close relatives who have owned a business or to have worked for close rel-atives who are business owners.
Human Capital DeficitsLatinos and African Americans are more likely than white Americans to havelow levels of education, little experience as business owners, and low overallwork experience. Latinos and African Americans are also less likely to partici-pate in apprenticeship programs or unions (Hill 1989).
EducationEducation fosters business formation and development, as highly educatedindividuals have specific training that can be easily converted into businessownership (e.g., lawyers, physicians, accountants). In addition, educatedindividuals may be better equipped to navigate the business formationprocess, having better knowledge of lending institutions and governmentrequirements.
Latino and African American business owners have the lowest educationallevels of all entrepreneurs (table 3.2). Almost one-third of Latino business own-ers do not have a high school diploma, and less than 30 percent of both Latinos
ECONOMIC AND POLICY CONTEXT
THE URBANINSTITUTE
37

and African Americans have college degrees. White male and Asian business own-ers are more likely to be high school and college graduates, with over half of Asianbusiness owners holding at least a college degree. An additional human capitalbarrier for many Latinos and Asians is an inability to speak English fluently.
Discrimination has also affected the quality and the quantity of minorities’education. Minorities were categorically excluded from many higher educa-tion institutions across the South until the late 1960s. Educational segregationand a lack of interest in educating minorities relegated African Americans inthe South to lower quality schools. Latinos and African American men alsohave lower returns to their education than white non-Hispanic men (Reimers1983).
Lack of educational attainment does not hamper firm formation equallyacross all industries. In construction, for example, firm formation depends lesson educational levels than on prior experience (Bates 1995).
ExperiencePast experience in a related business can be a valuable form of human capitalfor the potential entrepreneur. It provides hands-on training as well as access to
DO MINORITY-OWNED BUSINESSES GET A FAIR SHARE OF GOVERNMENT CONTRACTS?38
THE URBANINSTITUTE
Table 3.2 Human Capital Characteristics of 1987 Business Owners by Minority Status
African Nonminority American Latino Asian1 Female2 Male
(%) (%) (%) (%) (%)
Educational Attainment
Elementary/some high school 23.1 32.2 12.5 9.0 13.2
High school degree/some college 48.1 45.0 35.1 54.6 49.3
College degree or more 28.8 22.6 52.3 36.4 37.4
Total 100.0 100.0 100.0 100.0 100.0
Self-Employment Experience
Percent previously owned a business 9.8 11.0 15.6 13.9 21.7
Work Experience
Less than 2 years 21.5 27.4 31.2 20.7 16.7
2 to 9 years 27.2 31.7 35.7 31.4 28.1
10 to 19 years 26.6 23.0 21.1 27.1 26.5
20 years or more 24.8 18.0 12.0 20.7 28.7
Total 100.0 100.0 100.0 100.0 100.0
Source: U.S. Bureau of the Census, 1987 Economic Censuses, Characteristics of Business Owners.Notes: Percents are based on the number of owners reporting. 1 Other minorities (Native Americans, Pacific Islanders, Eskimos and Aleuts) are also included in this category, although
the vast majority of business owners in this category are Asian.2 Includes both minority and white female business owners.

business networks that can foster interest in business ownership and canincrease the probability of business success. One route to adequate hands-onexperience, particularly in the trades, is union membership. However, minori-ties have historically been denied access to union apprenticeships and mem-bership (Hill 1989; U.S. Federal Register 1996). Prior self-employment alsoincreases the likelihood of success in business. Minority business owners areless likely to have previously owned a business themselves than white businessowners (table 3.2). Latino and Asian business owners are also at a disadvan-tage because they have substantially fewer years of work experience than otherbusiness owners, reflecting in many cases their recent immigration. Almost 30percent of these owners have less than two years’ work experience.
Supervisory and managerial experience serves as an entry point to the self-employment sector and increases the probability of business success (Ando1988). But minorities have encountered problems in obtaining high-level super-visory and managerial opportunities. Moreover, African American supervisorsand managers are about 10 percent more likely than other groups to be in thegovernment sector. If government supervisory and managerial jobs do not pro-vide workers access to business networks, the private market, and industrialexpertise, these positions may be less effective than private market positionsin promoting self-employment.
Limited Market AccessLack of access to white consumers with significant wealth and spending powermay also inhibit the formation and development of minority-owned businesses.As noted earlier in this chapter, minority customers frequently have lowerincomes than white customers. The inability of minority firms to penetrate thewhite consumer market can be a significant barrier for minority firms in need ofrevenue. According to Bates (1989), serving a mixed-race clientele reduces thechance of business failure among African Americans.
The problem, however, is that minority firms often have less access to whitecustomers. This constrained access results from two principal sources. The firstis discrimination by white consumers. Consumer discrimination means thatsome white customers are unwilling to patronize black-owned businesses or areonly willing to do so if the price charged is less than that charged by a whiteowner (Meyer 1990). The second reason for lack of access to the white con-sumer market is racial segregation in housing. Quite apart from any direct dis-crimination, residential segregation will mean that minority business ownersbased in minority communities have little contact with white customers.
Culture and PreferencesDifferences in culture and preferences for self-employment have been advancedas explanations for the lower self-employment rates of black Americans vis-à-vis other ethnic groups (Meyer 1990, Sowell 1983, Chiswick 1983). However,there is little empirical support for this position. Opinion polls indicate thatyoung African Americans are more likely than white Americans to want to formtheir own businesses (Development Associates 1987). Further, the cultural pref-
ECONOMIC AND POLICY CONTEXT
THE URBANINSTITUTE
39

erence hypothesis fails to explain the large geographic differences in blackfirm ownership. Looking only at the states of the South, O’Hare (1990) finds thatthe number of black businesses per thousand black population ranges from 7in Alabama to 14 in Virginia. In addition, the hypothesis that differences in cul-ture and taste explain the high self-employment rates of other ethnic groups—particularly immigrants—overlooks the contribution of other factors to self-employment patterns. One such factor is the role of social class in the countryof origin (Darity 1989). Studies show that the observed advantage of blackimmigrants over native blacks disappears when human capital characteristicsare controlled for (Borjas and Bronars 1989; Fairlie and Meyer 1994; Butcher1994).
Finally, it is difficult to measure entrepreneurial culture, because a myriadof self-employment activities escape official statistics. These activities tend tobe small or sporadic, and complementary to other sources of income. A study ofa “Little Village” in Chicago (Tienda and Raijman 1996) documented the preva-lence of this type of self-employment activity among Mexican Americans.Similar patterns have been documented among women receiving public assis-tance (Edin and Jencks 1992).
Barriers to Utilization in Government ContractingAs we discussed above, the barriers minority firms face to formation and devel-opment can be linked to their limited access to financial, social, and humancapital and to markets. Minority business owners often turn to government con-tracts to offset some of the limitations posed by the private market. But thecontracting process itself presents barriers that prevent minority businessesfrom winning government contracts. In this section we present a step-by-step sketch of the practices embedded in the contracting process that reduceminority-owned business participation in procurement.
This discussion, for the most part, draws on anecdotal evidence con-tained in the disparity studies. We have no way of knowing the frequencywith which any of these practices occurs, or the share of minority businessesthat confront them. Nonetheless, the practices are cited often enough in dis-parity studies to suggest that their occurrence cannot be dismissed as isolatedincidents.
Steps in the Contracting Process For the purpose of this analysis we can subdivide the contracting process intofive more or less discrete steps:
● specifying the design of a particular project and developing contractingrequirements;
● defining the scope of the affirmative action program that will govern a spe-cific project;
● soliciting bids;
DO MINORITY-OWNED BUSINESSES GET A FAIR SHARE OF GOVERNMENT CONTRACTS?40
THE URBANINSTITUTE

● submitting bids and awarding contracts; and● implementing the contract, monitoring post-award compliance, and paying
contractors.
Project DesignGovernment agencies can exercise substantial discretion in the design of projects and contracts that can either promote or inhibit minority firm participation.
Size of contractsAs we indicate above, minority firms tend to be smaller than majority firms.Hence, large contract size may be an obstacle faced by minority firms in pursu-ing government contracts. The inability or unwillingness to break contractsdown into subtasks can have an intentional or unintentional exclusionaryeffect.
Customizing contractsCustomizing projects so they are “wired” to a designated contractor freezesout minority competition. In practice, this is often achieved by drafting contractannouncements with unnecessarily restrictive specifications or designatingsome types of contracts as sole source.5 The effects of such tactics are aggravatedby minorities’ more limited access to networks and government officials inmany localities.
Defining the Scope of Affirmative Action ProgramsAgencies’ and local governments’ affirmative action programs can be designedin ways that limit the degree to which they promote minority firm growth andparticipation in the procurement process.
Emphasis on subcontractsBecause many minority firms are small, one way to increase their utilization isthrough subcontracts with large nonminority firms. Thus, minority set-asidescan be met by encouraging nonminority prime contractors to subcontract tominority-owned firms. While these programs can help small minority firms winawards, they may also lock minority firms into competing as subcontractors.This can limit the experience of minorities in managing and handling large con-tracts and may promote perceptions that these firms are unable to act as primecontractors. Reliance on subcontracting to meet affirmative action goals is evenmore problematic given accounts by minority firm owners that they are oftenrelegated to small, low-skilled subcontracting tasks whose only purpose is tomeet affirmative action goals.6
ECONOMIC AND POLICY CONTEXT
THE URBANINSTITUTE
41

Liberal grants of waiversContract officials can exercise discretion in authorizing exemptions fromminority subcontracting requirements. These waivers can be granted on thebasis of the nature of the project7 or by a judgment that the majority contractorhas made “good faith efforts” to comply with affirmative action program rules.The disparity studies document numerous instances in which these exemp-tions have been abused by majority contractors.8
Ineffective screening for minority business frontsPrograms vary in the degree to which they screen and sanction fraudulentclaims of minority status. Obviously, programs with a high incidence of fraudprovide majority rather than minority contractors with the benefits of affirma-tive action and erode the legitimacy of the program.9
The Bid Solicitation ProcessMany disparity studies document the exclusion of minority firms from the bid-ding process. Exclusionary procedures can take a number of forms, including:
● the use of closed, private calls for bids;● failure to publish contract notices in minority media;● failure to notify minority firms of calls for bids;● providing less complete project information to minority than to white con-
tractors; and ● providing white contractors with project information earlier than their
minority counterparts, enabling them to spend more time developing bids.10
The Submission and Evaluation of BidsMinority firms also report a number of obstacles in submitting bids and in hav-ing them receive impartial evaluation.
Higher supply pricesMinority business owners report being quoted higher supply prices than theirmajority competitors. In one study, minorities reported 10 to 20 percenthigher supply prices. In another, the quoted price was 40 percent higher.11
Indeed, in some instances minority firms hire white staff to negotiate priceswith suppliers.12
Bid shoppingThe disparity studies report that some majority prime contractors reveal thebids they have received from minority firms to other majority subcontractors,enabling them to underbid and win the subcontract. One minority owner saidthe practice was so common that she does not submit subcontract bids until15 minutes before they are due.13
DO MINORITY-OWNED BUSINESSES GET A FAIR SHARE OF GOVERNMENT CONTRACTS?42
THE URBANINSTITUTE
Subjectivity in awardsIn some types of contracts, procurement awards are not based simply onthe bid amount, but on other, more subjective factors (such as the qualityof the proposed work or the ability of the contractor to complete the work successfully). When subjective factors play an important role indeciding to whom the contract should be awarded, there is greater room for discrimination.
Manipulation of the award process to favor particular contractorsThe award process can be directly manipulated to give a particular contractor,often a nonminority firm, the award. In practice this manipulation often takesthe form of rebidding or renegotiating contracts.14 When renegotiation takesplace, requirements of the contracts may be loosened, the description of prod-ucts may change, and the dollar amount of the contract may be revised.
Execution of the Contract, Monitoring Compliance, and PaymentA number of practices occur during the final stages of the contracting processthat reduce minority utilization. Some of the most frequently cited include:
Contract exclusionMinority subcontractors report that they are dropped from contracts after it isawarded or they are simply not called on to perform any work.15 In otherinstances, they are included in a contract bid without their knowledge andnever receive work.16 Presumably, such practices are more common where thereis little monitoring or enforcement on the part of government. Unfortunately,there is very little information on the extent to which state and local govern-ment police minority subcontracting agreements.
Slow paymentSince minority firms are smaller, slow payment on the part of government canjeopardize a firm’s existence, especially when contract performance requiressubstantial out-of-pocket expenditures.17 Late payment by prime contractorsposes the same threat.
Project sabotageFinally, expressions of overt hostility have been experienced by minority con-tractors. Their tools have been stolen, their work destroyed, and signs have beenposted with racial slurs and the like. Other, somewhat less overtly hostileactions include failure on the part of the prime contractor to notify the sub-contractor of changes in schedule or location of the work and isolation ofminority workers on the job site.18
ECONOMIC AND POLICY CONTEXT
THE URBANINSTITUTE
43

Affirmative Action Policies in Contracting: An OverviewOver the past 30 years, governments at the federal, state, and local levels haveresponded to barriers to minority firm formation, development, and participa-tion in the government contracting process with a wide range of procurement-related initiatives. In general, these initiatives fall into two broad categories.The first category involves policies that seek to include race as a factor in theaward of contracts. These policies include the granting of sole source contracts,set-asides, price or evaluation advantages, and the use of goals for prime or sub-contracting. In general, this set of policies is intended to directly increase thenumber of contract and subcontract awards to minority firms.
A second broad category of policies seeks to expand the number of minorityfirms contracting with government by increasing their financial, social, or humancapital. In so doing, they put minority firms in a better position to competeagainst majority firms as either prime contractors or subcontractors. They donot, though, address directly the contractor selection process per se. These poli-cies include lending and bonding help, technical assistance programs, expandednotice requirements regarding bids, and the imposition of prompt payment direc-tives on government agencies. In general, these policies are intended to increasethe size of the pool of potential minority bidders on public contracts.
There are basically three tiers of governmental procurement programs andrules to which affirmative action policies apply. One governs the purchase ofgoods and services by the federal government. Another governs the purchaseof goods and services by state and local governments using their own funds.And a third—essentially a hybrid—governs state and local procurementfinanced with federal funds, to which special federal rules apply. This type ofpass-through regulation is most prominent in the transportation area. Federalcontracting and pass-through rules were the subject of the 1995 Supreme Courtruling in Adarand v. Pena. State and local contracting was the subject of theCroson decision in 1989 and of the many disparity studies that were commis-sioned in its wake.
Goals of Affirmative Action ProgramsIt appears that policies at all levels of government are premised upon a mix ofinterrelated remedial, social, and economic goals. Perhaps the most frequentlyarticulated rationale for affirmative action in procurement is to compensate forthe present effects of past—and, in some instances, current—discrimination.19
Government action has sometimes been the source of that discrimination;sometimes it has been the result of private action. It has been argued that gov-ernment itself can be a passive participant in private discrimination, princi-pally by contracting with firms that discriminate. In fact, Justice O’Connor’sdecision in Croson identifies the problem of passive participation as a potentialjustification for affirmative action.20
Social goals have also animated affirmative action policies in contracting.In the wake of increasing urban violence in the late 1960s, and the warningsof the Kerner Commission, President Lyndon Johnson directed sole source con-tracts to minority businesses located in the central cities. President RichardNixon continued on this course, expanding efforts to direct federal contracts to
DO MINORITY-OWNED BUSINESSES GET A FAIR SHARE OF GOVERNMENT CONTRACTS?44
THE URBANINSTITUTE
minority firms. Ultimately, these early efforts were codified by Congress inthe Section 8(a) program and various other programs during the 1970s. Butwhile the goals of promoting economic development in distressed areas andreducing minority unemployment have not, for the most part, been centralgoals of procurement policy, a social welfare (or distributional) orientation hasremained. This is evident in the programs’ terminology, most notably the factthat federal programs are directed at “economically and socially disadvan-taged” firms.
Finally, growth and economic goals are also commonly advanced as ration-ales for affirmative action programs in contracting. These goals have encom-passed expanding the economic growth and industrial capability of the UnitedStates (by increasing the number of minority and other small businesses),increasing minority entrepreneurship, expanding the market share of minorityfirms, and moving minorities into sectors of the economy where they were his-torically underutilized.21
These complex and varied goals exist alongside the primary objectives ofprocurement policy: to promote cost competition, administrative simplicityand transparency, and, of late, decentralization of authority.22
Federal Affirmative Action PoliciesFederal affirmative action policies in contracting consist of both government-wide directives as well as rules that apply to specific agencies. Here again, a dis-tinction should be drawn between policies that influence the contract awarddecision and those intended to expand the pool of minority firms and bidders.
Government-wide procurement policiesPerhaps the most prominent affirmative action policy bearing on contractawards is the use of goals in awarding contracts to minority-owned businessenterprises (MBEs) and women-owned business enterprises (WBEs). Federallaw establishes several overall national goals to encourage broader participationin federal procurement: a 20 percent goal for small businesses; a 5 percent goalfor small disadvantaged businesses (SDBs); and a 5 percent goal for women-owned firms.23 Individual federal agencies negotiate their own goals annuallywith the Small Business Administration. The goals are flexible, as they can bewaived when minority firms are not available in a specific region or industry.This flexibility may account for the fact that the federal government did notachieve its 5 percent goal for minority contracting until 1993, 15 years after itwas introduced.
The federal government employs other government-wide policy tools thatinfluence the award decision and complement these goals. Perhaps the bestknown is the Section 8(a) (Minority Small Business and Capital Ownership)program, administered by the SBA. Under this program, the SBA itself serves asa prime contractor, negotiating contracts with individual federal agencies todeliver goods and services.24 The SBA then subcontracts with individual firmsthat are owned by individuals who are socially and economically disadvan-taged.25 These subcontracts are usually let in a sole source, noncompetitivefashion.
ECONOMIC AND POLICY CONTEXT
THE URBANINSTITUTE
45

Unlike other federal affirmative action programs, the goal of the Section 8(a)program is expressly developmental as it is intended to incubate—and graduate—SDBs. As a result, entry into the program is restricted to firms ownedby individuals whose net worth is less than $250,000. Participation in the pro-gram is restricted to nine years, and continuing participation is conditionedon the firm receiving a diminishing share of its total revenues from govern-ment contracts. Importantly, the program also incorporates other elementsdesigned to overcome the barriers to minority firm development, includingtraining and consulting.
In the Section 8(a) program, the SBA subcontracts directly with small dis-advantaged businesses. Under another government-wide program, the SBA—again serving as an intermediary between federal agencies and the private sector—requires private, prime contractors to subcontract, or set aside, a shareof their federally funded projects for SDBs. This program (the Section 8(d) pro-gram) has a less explicitly developmental rationale as it is geared to moremature contractors. Accordingly, the wealth threshold of firms that participateas subcontractors is higher, there is no durational limit imposed on SDBinvolvement, and the program does not incorporate other developmental fea-tures, like technical assistance, to the same degree.26
Proposed Government-wide ReformsIn May 1997 the Federal Acquisition Regulation Council issued proposed reg-ulations that would broadly reform the use of affirmative action in federal pro-curement policy.27 The proposed rule would, in effect, authorize national dis-parity studies across 80 differing industries. In industries where a disparity isfound between the government’s utilization of minority firms and the share ofminority-owned businesses represented within the sector, the use of price pref-erences up to 10 percent or evaluation credits would be authorized. (Underbid preferences, the bids of nonminority contractors are inflated by 10 percent, giving minority firms a price advantage. Evaluation credits increasethe scores of proposals submitted by prime contractors whose pre-contractbids commit them to subcontracting to minority firms.) In industries where nosuch disparity is found, the government can make further inquiry to determinethe impact of past discrimination on suppressing the growth and formation ofminority firms. Reduction or elimination of the price preferences or evaluationcredits would then depend on the result of such a “but-for-past-patterns-of-discrimination” analysis.
One notable feature of the proposed rules is their reliance on price prefer-ences and evaluation credits rather than set-asides or other forms of shelteredcompetition. While the former do not restrict competition to minority firms, thelatter make race a condition of eligibility for bidding on a government contract.
Agency-specific effortsIn addition to these government-wide programs, most federal agencies anddepartments have developed their own affirmative action programs in procure-ment.28 The procurement policies at the Department of Defense (which
DO MINORITY-OWNED BUSINESSES GET A FAIR SHARE OF GOVERNMENT CONTRACTS?46
THE URBANINSTITUTE

accounted for 71 percent of all federal contracting in Fiscal Year 1990) and theDepartment of Transportation are notable not just for the scale of activityinvolved but for the tools employed. Both agencies have adopted affirmativeaction policies that incorporate open competition but provide minority firmswith an advantage in the bidding or pricing process.
The Defense Department employs bid-price preferences, inflating the bids ofnonminority contractors by 10 percent.29 In 1994 the Congress authorized theuse of bid-price preferences government-wide with the passage of the FederalAcquisition and Simplification Act (FASA).
Beyond its own participation in Section 8(a) programs and its efforts to meetselected statutory goals for minority contracting, the Department of Trans-portation has imposed a contracting requirement on its state and local grantrecipients, requiring that state and local governments pay a 1.5 to 2 percent pre-mium to contractors who use women and minority contractors and providethem with technical assistance.30
Capital and other assistance programsThese contract-award policies are supplemented by numerous federal programsintended to increase minority firms’ financial, social, and human capital. Theydo so by providing:
● equity capital;31
● loan guarantees;32
● technical assistance;33
● mentoring;34 and ● guarantees for surety bonds.35
State and Local Affirmative Action Programs in ContractingDuring the 1970s and 1980s many state and local governments adopted affir-mative action policies that paralleled those in place at the federal level. Theemergence of these programs appears to be less the result of congressional orjudicial imperatives than the product of growing political influence amongminorities and women within state and municipal legislatures and a growingawareness of inequities in the contracting process.36 For the most part, the toolsemployed (goals, set-asides, bid preferences, technical assistance, loan guaran-tees, etc.) resemble those in place at the federal level, responding as they do tothe same barriers to minority firm formation and development.
Many jurisdictions have adopted goals policies. But these policies vary ina number of common ways:
● Some apply government-wide; others to an agency or department; some to a particular industry, such as construction only; others are developed on acontract-by-contract or project basis.
● Some are voluntary, others are mandatory.37 Goals that are voluntary perform a scorekeeping function; those that are mandatory function as set-asides.
ECONOMIC AND POLICY CONTEXT
THE URBANINSTITUTE
47

● In some cases the goals apply to all minorities viewed collectively; in othersthey are applied to individual racial/ethnic groups. In some jurisdictionsgoals apply only to racial or ethnic minorities; in others they extend towomen and the disabled.
● In some instances goals go beyond the promotion of minority business devel-opment to incorporate employment or community development objectives.
Like the federal government, states and localities have employed tools otherthan goals that affect contract award outcomes. These include bid preferences(see above); evaluation credits (where the use of minority contractors increasesthe score a proposal receives); and sheltered competition (contracts for whichonly minority contractors are allowed to bid).
State and local governments have also enacted a wide range of policies thatare intended to redress the financial, social, and human capital needs of minor-ity contractors in ways that do not bear directly on contract awards. In someinstances the lending, training, or other programs are directed exclusively tominorities; in other instances they are directed to all small businesses.
In the areas of financial capital, the programs that aid minority businessesinclude lending and venture capital programs as well as loan guarantees; bond-ing assistance in the form of waivers or bond guarantees; insurance assistance;the imposition of prompt payment requirements on government agencies; andpolicies that promote breaking large contracts into smaller, discrete projects soMBEs can compete for them.
Policies intended to overcome MBEs’ limited social capital—that is, theirlimited mainstream corporate networks—include mandates that informationabout pending contracting opportunities be widely disseminated in the minor-ity media. They also include requirements that a minimum number of MBEbids be received on specific contracts, a strategy intended to force increasedoutreach. In addition, policies that require use of minority subcontractors areintended to increase the access of smaller minority firms to private-sector net-works as well as to government dollars.
In terms of human capital, many state and local governments make avail-able subsidized technical assistance to help MBEs navigate bonding, bidding,and other processes that are part of the procurement process. They may alsooffer training in bid preparation and other relevant business practices.
SanctionsAt federal, state, and local levels of government, government officials haveavailable a number of sanctions that can be invoked by government when con-tractors fail to meet their MBE contracting goals. In order of severity, theseinclude:
● providing written notice;● withholding payments;● recovering amounts from the contractor that are equal to the unmet project
goal;● terminating the contract; and● debarring the contractor.
DO MINORITY-OWNED BUSINESSES GET A FAIR SHARE OF GOVERNMENT CONTRACTS?48
THE URBANINSTITUTE

Unfortunately, neither the disparity studies nor other sources provide docu-mentation on how frequently or severely these sanctions are invoked. Thislack of information may itself suggest that affirmative action programs are notespecially vigorously enforced.
Impact of CrosonWhile we might expect that Croson would have changed the character of moststate and local affirmative action programs in contracting, that does not appearto be the case. A survey of state minority business enterprise programs con-ducted by the Council of State Community Development Agencies in 1992 and1993 found that Croson had no effect on 14 of 26 state programs that dealtdirectly with procurement (i.e., involved goals or policies that directly affectcontract awards such as set-asides or price preferences). A small number ofjurisdictions (four) shifted from mandatory to voluntary goals; four temporar-ily suspended their programs; one delayed the promulgation of goals; and twoended their programs. In at least one instance, a state increased its minoritycontracting goal in the wake of Croson, after receiving the results of its dispar-ity study.
Effectiveness of programs in overcoming barriers faced by minority firmsIdeally, we would conclude this chapter by reviewing the literature thatexplores the impact of both race-conscious and race-neutral programs in over-coming the barriers described in the first part of this chapter. However, ourreview of the literature and relevant data has found that it is extremely lim-ited. This suggests to us that deepening our knowledge of the frequency withwhich minority firms encounter differing obstacles (such as discrimination inreceiving business loans), and of the effectiveness of different race-neutral andrace-conscious programs, is critical if programs are to be effectively targetedand readily defended. We return to this issue in the chapter that follows.
Notes
1. Readers interested in the business-ownership process of women are referred to “SmallBusiness Success Among Men- and Women-Owned Firms in Rural Areas,” Leann Tiggesand Gary P. Green, Rural Sociology 59 (Summer 1994): 289–310; “Self-Employment andProviding Child Care,” Rachel Connelly, Demography 29 (February 1992): 17–29; “Winner’sCircles: Chicago’s Experiment in Low-Income Enterprise,” Scott Bailey, Policy Review 63(Winter 1993): 82–85; and “Micro-Enterprise and Women: The Viability of Self-Employmentas a Strategy for Alleviating Poverty,” Roberta Spalter-Roth, Enrique Soto, and LilyZandniapour, Institute for Women’s Policy Research, November 1994.
2. The figures presented in tables 3.1 and 3.2 are drawn from the Census Bureau’s 1987Characteristics of Business Owners (CBO). The data are from a 1991 survey of more than125,000 business owners whose firms were operational in 1987. Unlike SMOBE/SWOBE,these data represent owners rather than firms, so there can be multiple entries per firm. Thesurvey is restricted to owners of small businesses. The “Asian” category also includes PacificIslanders, Native Americans, and Alaskan Natives. References in the text to Asians refer tothis category.
ECONOMIC AND POLICY CONTEXT
THE URBANINSTITUTE
49

3. However, Bates (1996) notes that of African American firms started in the previous 10 yearswith more than $5,000 in receipts, only 30 percent started with no capital.
4. Contemporary evidence about discrimination by unions can be found in 61 Federal Register26054–26057, May 23, 1996.
5. See table A.1 for complete references for the following disparity studies: Tucson, ch. 9, p. 21; Albuquerque, ch. 6, p. 15; and Hennepin County, ch. 6, p. 28.
6. See table A.1 for complete references for the following disparity studies: North CarolinaInstitute of Minority Economic Development, “City of Greensboro Minority and WomenBusiness Enterprise Capacity Study,” 1992, p. 14; and BBC, “The City of Tucson DisparityStudy,” 1994, pp. ix–10.
7. For an instance of the degree to which contract dollars are exempted from meeting affirmativeaction, see the study of the City of Baltimore, pp. 31–36 (see table A.2 for complete reference).
8. A document circulated among contractors in Milwaukee, for example, instructed contrac-tors on exploiting the good faith efforts exemption to hiring minority subcontractors. Amongother things, the document recommended that prime contractors (1) send certified letters tominority businesses they know have ceased operations or changed addresses; (2) leave mes-sages on minority firms’ answering machines but do not return their calls; (3) do not giveinformation about when a bid is due; and (4) do not lend drawings of the project to minoritysubcontractors. Affirmative Action Consulting Ltd. and Ralph G. Moore and Associates(AAC/RGMA), “M/WBE Disparity Study for the County of Milwaukee, City of Milwaukee,and Milwaukee Public Schools,” 1992.
9. Instances of fraud related to minority fronts as reported by minority business owners can befound in NERA, “The Utilization of Minority- and Women-Owned Business Enterprises bythe Regional Transportation District” (Denver, Colorado), September 1992, p. 14; NorthCarolina Institute of Minority Economic Development, “City of Greensboro Minority andWomen Business Enterprise Capacity Study,” 1992, p. 17; and BBC, “The City of TucsonDisparity Study,” 1994, pp. ix–17. See table A.1 for complete references for these disparitystudies.
10. Instances of these practices can be found in BBC, “Disparity Study: City of Albuquerque,”December 1995, pp. vi–13; Mason Tillman, “The Maricopa County Minority- and Woman-Owned Business Enterprise Program Study,” 1989, p. 84; NERA, “The Utilization of Minority-and Woman-Owned Business Enterprises by Alameda County,” June 1992, p. 187; and D.J.Miller, “Memphis/Shelby County Intergovernmental Consortium Disparity Study,” October1994, pp. vii–6-20. See table A.1 for complete references for these disparity studies.
11. See, for example, NERA, “The Utilization of Minority- and Woman-Owned BusinessEnterprises by the City of Hayward,” March 1993, p. 23; and D. J. Miller, “Memphis/ShelbyCounty Intergovernmental Consortium Disparity Study,” October 1994, pp. vii–10. See tableA.1 for complete references for these disparity studies.
12. See, for example, MGT of America, “Final Report: City of Tallahassee MBE Disparity Fact-Finding Study,” January 1990; and BBC, “The City of Tucson Disparity Study,” 1994, pp. ix–24. See tables A.1 and A.2 for complete references for these disparity studies.
13. For instances of this practice see Mason Tillman, “The Maricopa County Minority- andWoman-Owned Business Enterprise Program Study,” 1989, p. 72; BBC, “Disparity Study: Cityof Albuquerque,” December 1995, pp. vi–14; and Mason Tillman, “City of San Jose DisparityStudy: Professional Services and Procurement,” April 1995, pp. iii–9. The case of the minor-ity woman who waits until 15 minutes prior to the due time to submit the bid is in MasonTillman’s study of the City of San Jose. See table A.1 for complete references for these dis-parity studies.
14. See, for example, NERA, “The Utilization of Minority- and Women-Owned BusinessEnterprises by the Regional Transportation District” (Denver, Colorado), September 1992, p. 32; NERA, “The Utilization of Minority- and Woman-Owned Business Enterprises by theCity of Hayward,” March 1993, pp. v–65; Affirmative Action Consulting Ltd. and Ralph G.Moore and Associates (AAC/RGMA), “M/WBE Disparity Study for the County of Milwaukee,City of Milwaukee, and Milwaukee Public Schools,” 1992, p. 7. See table A.1 for completereferences for these disparity studies.
DO MINORITY-OWNED BUSINESSES GET A FAIR SHARE OF GOVERNMENT CONTRACTS?50
THE URBANINSTITUTE

15. These practices are documented in the following studies: NERA, “The Utilization ofMinority- and Women-Owned Business Enterprises by the Regional Transportation District”(Denver, Colorado), September 1992, p. 27; and NERA, “The Utilization of Minority- andWoman-Owned Business Enterprises by Alameda County,” June 1992, p. 180. In 14 of the97 contracts examined in the Alameda study, the minority subcontractor was not used onthe project. See table A.1 for complete references for these disparity studies.
16. Instances in which the minority subcontractor is not aware of his/her inclusion in a bid arereported in Mason Tillman, “The Maricopa County Minority and Woman-Owned BusinessEnterprise Program Study,” p. 72, and BBC, “The Disparity Study of Women/MinorityBusiness Enterprises: Hennepin County,” June 1995, pp. vii–17. See table A.1 for completereferences for these disparity studies.
17. See the studies BBC, “Disparity Study: City of Albuquerque,” December 1995, pp. i–16;Mason Tillman, “City of San Jose Disparity Study: Professional Services and Procurement,”April 1995, pp. iii–22; and Mason Tillman, “The Maricopa County Minority- and Woman-Owned Business Enterprise Program Study,” p. 79. See table A.1 for complete references forthese disparity studies.
18. These practices are documented in BBC, “Disparity Study: City of Albuquerque,” December1995, pp. i–27; D.J. Miller, “Memphis/Shelby County Intergovernmental ConsortiumDisparity Study,” October 1994, pp. vii–9; and NERA, “The Utilization of Minority andWoman-Owned Business Enterprises by the City of Hayward,” March 1993, pp. vi–23. Seetable A.1 for complete references for these disparity studies.
19. Chief Justice Warren Burger’s 1979 decision in Fullilove v. Klutznick, upholding a Depart-ment of Transportation set-aside program, captures this remedial purpose:
Congress had before it, among other data, evidence of a long history of marked dispar-ity in the percentage of public contracts awarded to small business enterprises. Thisdisparity was considered to result not from any lack of capable or qualified minoritybusinesses, but from the existence and maintenance of barriers to competitive access,which had their roots in racial discrimination, and which continue today, even absentany intentional discrimination or other unlawful conduct. Fullilove v. Klutznick, 448U.S. 448, 478 (1979).
20. Croson, 488 U.S. at 492.
21. See, generally, The Final Report of the U.S. Commission on Minority Business Development,1992.
22. See From Red Tape to Results: Creating a Government that Works Better and Costs Less,Report of the National Performance Review, September 7, 1993, p. 26.
23. See, generally, Affirmative Action Review, Report to the President, The White House, July19, 1995, p. 60.
24. The reason for inserting the SBA as the prime contractor is to ensure that neophyte minor-ity firms are not taken advantage of by government contract officers.
25. Under the relevant law, the Small Business Administration presumes that Black Americans,Hispanic Americans, Native Americans, and Asian Pacific Americans are socially disadvan-taged. This presumptive eligibility does not extend to firms owned by white women. Onlyfirms owned by U.S. citizens are eligible for Section 8(a) program participation. Even firmsowned by legal permanent residents are not eligible for the program. 13 CFR §124.105(b).
26. Testimony of Philip Lader, Administrator, the Small Business Administration, “The SmallBusiness Administration’s §8(a) Minority Business Development Program,” Hearing beforethe Committee on Small Business, U.S. Senate, April 4, 1995, p. 27.
27. See, generally, 62 Federal Register 25648–25453, May 9, 1997.
28. See Charles Dale, A Brief Legal Overview of Federal Affirmative Action Statutes andExecutive Orders, American Law Division Memorandum, the Congressional ReferenceService, March 8, 1995.
29. Citation to §1207 Program.
ECONOMIC AND POLICY CONTEXT
THE URBANINSTITUTE
51

30. 15 U.S.C. § 644(g).
31. Through, for example, the SBA’s Small Business Investment Companies.
32. Id.
33. Through, for example, the Commerce Department’s Minority Business DevelopmentAdministration.
34. Through mentor-protégé efforts that have been developed by a number of federal agencies.
35. Through the SBA’s surety bond program.
36. Programs in Ohio were spurred by the Black Elected Democrats; in Michigan, by the legisla-tive Black Caucus; and in Illinois, by the Black Caucus of the General Assembly, for example.See, generally, National Directory of State Minority Business Enterprise Programs, TheCouncil of State Community Development Agencies, 1993. Interview of William Taylor, attor-ney, Washington, D.C., June 26, 1996.
37. This aspect of the policy is often determined by the way in which the “good faith effort”clause that frequently accompanies the goals is written or whether this clause is enforced.
DO MINORITY-OWNED BUSINESSES GET A FAIR SHARE OF GOVERNMENT CONTRACTS?52
THE URBANINSTITUTE

Chapter 4
Minorities and Contracting:
A Research Agenda
In this study we find that minority firms receive 57 cents for every dollarthey would be expected to receive based on their number, in state and localgovernment contracts. These wide disparities exist across all minoritygroups and industries examined. While these findings do not tell us the sources of the disparities, or what
policies would increase the ability of minority-owned firms to win govern-ment contracts, they do call into question current efforts to eliminate affirma-tive action programs in contracting. At the same time, our limited understand-ing of the sources of, and remedies for, existing disparities makes clear that newdata are needed to design and efficiently target public sector investments, reg-ulations, and antidiscrimination enforcement. Indeed, we are struck by how lit-tle national research there is that documents the barriers faced by minorityfirms and that evaluates the policies designed to eliminate them.
In this chapter we identify some of the research issues that emerge fromour meta-analysis of disparity studies. These issues include understanding thesources of disparities, the barriers faced by minority firms, how those barriershave changed over time, and the effectiveness of public policies intended topromote minority business. We propose a research agenda that not only beginsto fill these gaps, but can be readily implemented.
I(A) Research Issue: What Are the Sources of Disparity? Standing alone, findings of disparity—or differences in the proportions of gov-ernment contracts received by minority and majority firms—will always be sub-

ject to differing interpretations and debate. This owes to the fact that, in theabsence of further research, the results can be interpreted in two differing ways.On the one hand, findings of wide disparities can be taken as evidence thatminority firms are treated unfairly in the private market or in the governmentcontracting process. On the other hand, disparities can be interpreted as areflection of the diminished size, capacity, and qualifications of minority firms,and not as evidence of current unfair practices. This does not rule out the pos-sibility that disparities are the product of unfair past practices in the privatemarket or in the government contracting process.
A key research question, then, is whether disparity results from systematicdifferences in the qualifications of minority and majority firms. If disparities dis-appear when firms with equivalent qualifications are compared, this could meanthat minority firms’ failure to win contracts owes to their limited size, exper-tise, or capitalization. Such a finding could also be viewed as establishing thatgovernment procurement practices are fair. But even if we find that there are nodisparities among equally qualified firms, the fact that minority firms do lesswell than majority firms in obtaining government contracts raises other ques-tions regarding (a) the barriers minority firms currently face in the private mar-ket; (b) the historical practices that account for their disadvantaged character;and (c) the government interventions that might increase their qualifications.
But what if it turns out that disparities persist when we control for qualifi-cations such as size and experience? This finding would strongly suggest thatminority firms are unfairly treated, raising a second set of questions: Are dis-parities the result of barriers that minority firms face in the private market: inaccess to loans, bonds, or business networks, for example? Or do they resultfrom barriers that minority firms encounter in the contracting process itself:from restricted access to information on available contracts, from biased eval-uation of bids, from the exclusion of minority firms from contract awards, orfrom a government’s over-reliance on sole source contracts? Are disparities theproduct of both private and public sector actions?
This discussion suggests the importance of distinguishing between privatemarket and governmental sources of barriers that minority firms confront.Policies that address private market barriers will not efficiently reduce dispar-ities that are rooted in governmental practices. At the same time, regulatingthe government contracting processes will not efficiently eliminate disparitiesif minority firms typically lose government contracts because they cannotobtain loans, business contacts, or performance bonds in the private sector.
Once we identify the source of disparities (whether they are the product ofbarriers in the private market or the government contracting process, or both),we then need to identify the barriers that have the largest impacts on minorityfirm formation and growth. A related policy issue is whether barriers areerected to purposefully discriminate against minorities. That is, are the barri-ers confronted by minorities the result of neutral practices that have a dispro-portionate impact on minority firms (e.g., an unwillingness to break large pro-curement contracts down so that smaller firms can bid on them)? Or are they theresult of an intent to exclude minority firms from awards? In the case of thelatter, the goals of policymakers might not only be to eliminate barriers, but tosanction and deter illegal behavior.
DO MINORITY-OWNED BUSINESSES GET A FAIR SHARE OF GOVERNMENT CONTRACTS?54
THE URBANINSTITUTE

I(B) Research Approach: What Are the Sources of Disparity?The role of qualifications in disparityTo determine whether disparity in government contracting is due to differencesin qualifications of minority- and majority-owned firms, disparity ratios forfirms of similar size or experience should be developed. If disparity is due tounequal treatment of equals by government or the private market, we expect tosee disparity among equally qualified firms.
The use of differing measures of disparity can help us understand whetherminority firms are being treated equitably. For instance, the availability ofminority firms can be calculated as the share of all workers that are employedby minority-owned businesses rather than the share of all businesses thatminority-owned businesses represent. Using this measure one would concludethat minority firms were being treated equitably if the number of dollarsreceived per employee is the same for minority- and majority-owned firms.1
The success rates of minority- and majority-owned firms in obtaining govern-ment contracts should be compared within a multivariate statistical frameworkthat more completely controls for the qualifications of the firms involved. Onesource of data for such an analysis is the Census Bureau’s Characteristics ofBusiness Owners (CBO) survey, which provides detailed data on firm and ownercharacteristics. The CBO data can be matched to administrative records of eachfirm’s receipt of federal contracts and, if possible, to data on whether firms had bidfor government contracts. The resulting data file would then enable examinationof the qualifications of firms bidding on, and receiving, government contracts.
What role do barriers play in disparity?New data collection efforts will be required to understand how specific barriersdisadvantage minority-owned firms in the procurement process. Existing sur-veys and administrative sources provide few data on the barriers faced by smallbusinesses or on whether firms bid for contract work. The Census Bureau’sCharacteristics of Business Owners should be augmented by questions onaccess to lending, bonding, competitive supply prices and other barriers, aswell as questions on whether firms have bid for or won government contracts.These data would make possible a comparison of the relative success of minor-ity and majority firms in obtaining government contracts, where the firmsappear to have equal access to loans, bonds, and supplies. By calculating dis-parity ratios for government contracting among firms with comparable access toprivate sector financing and supplies, one can make a convincing case that thisdisparity reflects government decisions.
Our understanding of the barriers minority firms face could also beadvanced by collecting quantitative data on the bid solicitation process andthe outcomes of minority firms. Data could be systematically collected on (a) the share of solicited minority- (and majority-) owned firms that bid; (b) theshare of firms making bids that win; and (c) the dollar differences between the winning majority and minority bids.
Finally, detailed case studies of the contracting process can help us under-stand why minority firms are not winning government contracts. Interviews
MINORITIES AND CONTRACTING: A RESEARCH AGENDA
THE URBANINSTITUTE
55

could be conducted with procurement officers overseeing contracts that quali-fied minority firms lost to comparably qualified majority-owned firms.Interviews probing the perceived barriers faced by minority firms could alsobe conducted with representatives of the firms involved. Qualified minorityfirms that chose not to bid on government contracts could also be interviewedto learn why they chose not to participate. We assume that interviews withprocurement officers and other participants in the contracting process couldidentify specific contracting practices and requirements that repeatedly work tothe disadvantage of minority firms. The identification of such practices andrequirements could help target remedial actions.
The contribution of discrimination to the differing barriers faced byminority- and majority-owned firmsMore needs to be known about whether minority-owned firms are discrimi-nated against in trying to obtain loans, bonding, and competitively priced sup-plies. Anecdotal evidence suggests that a problem exists in each area, but thereis little quantitative evidence to describe the prevalence of each problem.
Analysis of Community Reinvestment Act dataEffective studies of discrimination in lending could be modeled on studies inmortgage lending. Since 1990, banks have been required to keep records onmortgage applications, which are then analyzed by government agencies andothers to evaluate whether minority and majority loan-seekers are treated equi-tably. Recent changes in record-keeping requirements for commercial loansunder a May 1995 amendment to the Community Reinvestment Act should gen-erate data that will shed light on differential treatment in commercial lending.Under the amendment, large banks are required to make available records onthe number and size of commercial loans made by Census tract. Such datawould permit us to examine for the first time comparative lending patterns inminority versus majority neighborhoods with similar commercial bases.
Paired testsPaired testing could be used to measure the role of race in access to loans,bonds, or competitively priced supplies. In these studies, testers who have sim-ilar qualifications except for their race would be sent to request a commercialloan or the prices of materials. Differences in success rates or quoted priceswould provide credible evidence on race-based differential treatment. Suchtests have been used successfully to study applications for employment, forhousing, and in pilot studies of home mortgages.
II(A) Research Issue: Have the Barriers Minority Firms Face Declined Over Time? Another key policy issue is whether recent cohorts of minority firms are faringbetter than older firms. If newer minority firms are more qualified than older
DO MINORITY-OWNED BUSINESSES GET A FAIR SHARE OF GOVERNMENT CONTRACTS?56
THE URBANINSTITUTE

firms, what accounts for this change over time: Reduced discrimination in pri-vate markets and government contracting? The adoption of government set-aside and other affirmative action programs? Increases in human, financial, andsocial capital among minorities?
An analysis of different cohorts of minority firms would inform whether thedisadvantaged status of minority firms owes to current or historical practices. Ifrecent cohorts of minority firms fare as well as their majority counterparts, itwould appear that the practices that have led to minority firm disadvantageare largely in the past. As a result, policy interventions could be targeted toolder firms, and current government contracting practices could be retained.
II(B) Research Approach: Changes in Minority Firms’ Qualifications Over TimeIf the treatment of minority firms in the market has improved over time, weshould see fewer differences in the qualifications of minority- and majority-owned firms in more recent cohorts of firms. Data on start-up and failure ratesof minority versus majority businesses as well as changes in revenues can beobtained by linking data on minority status (from the Survey of Minority-Owned Business Enterprises) with longitudinal data on firm revenues, employ-ment, births, and deaths. Such data are readily available for manufacturingfirms; more limited data are available for other industries. By examining theseindicators for newer and older cohorts of firms and comparing them to similarcohorts from previous years, we can learn whether new cohorts of minorityfirms continue to have lower average levels of qualifications.
III(A) Research Issue: How Effective Are Different Policy Interventions? The disparity studies commissioned by state and local governments have pri-marily focused on whether local set-aside or other programs satisfy shiftinglegal requirements and whether affirmative action policies are needed. Butthese studies rarely address a different, equally fundamental policy question:What policies might reduce disparities the most? One result has been that pro-grams designed to assist minority businesses have not been rigorously evalu-ated in the same way as other social welfare initiatives such as employment andtraining programs. Accordingly, we know little about exemplary practices, andhave little systematic knowledge about the relative impacts that differing inter-ventions such as set-asides, price preferences, or expanded outreach have hadon minority firm formation and growth.
III(B) Research Approach: How Effective Are Different PolicyInterventions? Documentation of existing programsState and local government officials could be surveyed to document the pro-grams and policies intended to assist minority-owned businesses and the his-tories of such programs and policies. These include set-aside programs, lendingassistance, bonding waivers for small contracts, technical assistance, and other
MINORITIES AND CONTRACTING: A RESEARCH AGENDA
THE URBANINSTITUTE
57

programs. The survey should examine the scope and legal authority of differingprograms including, for example, their funding, mechanisms for enforcement,and staffing. Such a survey should be administered to state and local govern-ments that do and do not have programs to assist minority-owned businesses.
The survey could focus on the states and 28 large metropolitan areas thatwere surveyed by Tim Bates and the Council of State Community DevelopmentAgencies, and the Joint Center for Political and Economic Studies.2 To date,there has been no follow-up of these data collection efforts. As a result, no systematic description of programs exists in localities other than the 28 metro-politan areas originally studied, and no follow-up tracks how the original pro-grams have changed over time. Such a follow-up effort would enable us to learnhow programs have evolved in response to the political and legal challenge torace-based programs and in response to administrators’ sense of the programs’effectiveness.
Evaluating program effectivenessThe above survey data can provide the basis for evaluating the effectiveness ofdiffering minority-business assistance programs. As there is little or no sys-tematic analysis of the effectiveness of minority-business assistance programsand set-asides, even rudimentary research is worthwhile. Results of the sur-vey, in combination with existing data, can begin to address such basic ques-tions as how differing interventions affect minority (and nonminority) busi-ness start-up and subsequent success and the relative effectiveness of set-asidesand other policies.
The evaluation would compare the success of minority-owned firms injurisdictions with differing types of minority-assistance programs. For example,one could compare the success of minority firms in areas with set-aside pro-grams to that of firms in areas with no programs at all. The success of firms (i.e.,their size, growth, death rates, and receipt of government contracts) would bemeasured using data on minority- and nonminority-owned businesses fromsources such as Characteristics of Business Owners and the Economic Census.Program characteristics would come from the survey and data gathered by Batesand the Joint Center. Regression analysis would be used to determine whetherspecific programs appear to reduce disadvantage for minority businesses.
Bates and Williams (1993) performed a similar analysis using data from theBates/Joint Center’s survey and the Characteristics of Business Owners survey.That research can be advanced by using longitudinal data on both programand business characteristics and by examining a larger number of metropoli-tan areas. With longitudinal data, we can directly control for minority firmsuccess prior to program implementation. Increasing the number of jurisdic-tions will allow more precise estimates than could be obtained in earlier work.
A more rigorous approach to evaluating the effectiveness of programsdesigned to assist minority-owned business would include random assignment.In random assignment, potential participants are assigned at random to one oftwo programs. The two programs are alternative policy options that the evalu-ator wishes to compare. For example, minority-owned businesses might qualifyfor either a program providing capital, bonding, and other assistance or a pro-
DO MINORITY-OWNED BUSINESSES GET A FAIR SHARE OF GOVERNMENT CONTRACTS?58
THE URBANINSTITUTE

gram providing these types of assistance as well as a points advantage whenapplying for government contracts. The relative effectiveness of the twoapproaches would be measured as the difference in outcomes for the firms inthe two programs and provide a means of assessing whether the points programis narrowly tailored. These sorts of evaluations have been quite influential inaffecting welfare policy, and a variant of the model could usefully be appliedto minority business development and set-aside programs.
ConclusionWhile substantial evidence has been collected over the past decade on dispari-ties in procurement between majority and minority contractors, few data havebeen systematically collected on the sources of those disparities, how the bar-riers facing minority firms have changed over time, and the effectiveness ofdiffering policies designed to promote minority businesses. We believe thatinformation on each is needed to pick the right policy tools, to target them,and to justify the choice of any race-conscious measure in the face of a skepti-cal judiciary and electorate. We believe that the research agenda advanced heregoes some distance toward illuminating the sources of disparity and the effec-tiveness of different policies. Further, most of the proposed research can beaccomplished with existing data or limited additional data collection and, as aresult, at modest cost.
Notes
1. While measures of availability that account for employment might better reflect capacity thanmeasures based simply on the number of minority firms, they could also bias results moreheavily in favor of firms that have historically benefited from discrimination in the publicand private sectors.
2. See Council of State Community Development Agencies, National Directory of State MinorityBusiness Enterprise Programs; Report to the U.S. Department of Commerce Minority BusinessDevelopment Agency, 1993; and Joint Center for Political and Economic Studies, Assessmentof Minority Business Development Programs, Report to the U.S. Department of CommerceMinority Business Development Agency, 1994.
MINORITIES AND CONTRACTING: A RESEARCH AGENDA
THE URBANINSTITUTE
59


Chapter 5
Conclusions
This report documents for the first time clear, nationwide patterns of disparity in minority contracting at the state and local government lev-els. We found that minority-owned businesses win only 57 cents ofevery dollar they would be expected to win based on the share of all
firms they represent. Almost two-thirds of the jurisdictions included in this studyreported substantial disparity (a disparity ratio below 0.8) in government dollarsgoing to minority-owned businesses. Moreover, these low utilization rates occurdespite the limited number (or availability) of minority firms. These pronounceddisparities occur across all minority groups. They are, however, particularlyaggravated among women: women receive 29 cents of every dollar they wouldbe expected to receive based on the share of firms they represent, and 87 percentof jurisdictions report substantial disparities for women-owned firms.
These disparity results are quite robust, holding up when they are subjectedto a number of sensitivity tests designed to gauge their accuracy. For example,they stand up when we limit our analysis to studies that only have large num-bers of contracts and a large number of available minority contractors (i.e., stud-ies that generate the most reliable results). And they remain valid when weemploy only restrictive measures of minority firm availability.
Several straightforward conclusions flow from the results of the analy-sis. First and most important, the results indicate that minority firms areless successful than their majority counterparts in obtaining procurementdollars at the state and local government levels. The wide disparities pre-sented here do not necessarily translate into proof of discrimination on thepart of state and local governments. At a minimum, these findings suggestthat barriers to minority firms’ participation in the government contractingprocess remain and that the introduction of race-neutral policies could sim-ply perpetuate current patterns of disparity that are observed in receipt ofgovernment contracts.

Second, wide disparities indicate that adoption of affirmative action andother programs designed to assist minority firms has not led to broad displace-ment of majority firms in the award of government contracts. That is, the resultsdo not support claims of widespread reverse discrimination in contracting atthe state and local government levels.
Third, the results also indicate that disparities are greater in those areas inwhich there is no affirmative action program in place. While a causal relation-ship between these facts cannot be established on the basis of this examina-tion alone, the results may indicate that affirmative action programs help toreduce disparities.
The lack of knowledge about the effectiveness of affirmative action pro-grams, coupled with the wide disparities documented in this report, suggestthat there is not enough empirical evidence to justify the elimination of publicpolicies that promote minority participation in government contracting.Repealing affirmative action policies would limit the policy tools available togovernment aimed at rectifying disparities.
Our findings and analysis strongly suggest that the knowledge base in thispolicy area needs to be deepened. In the first place, the measurement of dis-parities needs to be improved so we can better distinguish between disparitydue to discrimination and due to differences in the qualifications of minority-and majority-owned firms. We need to understand what characteristics identifyfirms that are qualified to do government work, including the role of firm sizeand experience.
In addition to distinguishing the sources of disparity, we need a better under-standing of the most important and commonly encountered barriers that minor-ity firms confront. To ascertain the pervasiveness and relative importance ofthese barriers, we need to develop indicators of how minority versus majorityfirms fare at crucial stages in the contracting process. That is, we need betteranswers to questions such as: Do comparable minority and majority firms havedifferent access to bonding or business loans? Are minority-owned firms quotedhigher prices by suppliers than majority-owned firms? How often are minorityversus majority subcontractors cut out of a contract after the prime wins?
The bidding process warrants special consideration. Governments at all levels could easily and systematically collect data on the number of minorityand nonminority bid solicitations, the number and type of unsolicited bidsreceived, etc., making it possible to analyze the differences between winningand losing bids. Examination of these data could prove very helpful in under-standing why minority firms are losing out in the contracting process. Theycould also be instrumental in setting price preferences that are fair and effectivein industries where minority firms are disadvantaged.
Finally, broadening our understanding of how effective different programsare in objective terms will be crucial to making them work better. A startingpoint would be to evaluate the effectiveness of current programs for minoritybusiness. To date, there has been little systematic evaluation of the ability ofset-aside and other minority business programs to meet program goals. Suchevaluations are routinely conducted in other policy areas, such as employ-ment and training programs, and they have played a major role in shaping federal policy.
DO MINORITY-OWNED BUSINESSES GET A FAIR SHARE OF GOVERNMENT CONTRACTS?62
THE URBANINSTITUTE

Chapter 1
Bibliography
Ando, Faith. 1988. “Capital Issues and the Minority-Owned Business.” Review of BlackPolitical Economy (Spring): 78–109.
Bailey, Scott. 1993. “Winners’ Circles: Chicago’s Experiment in Low-IncomeEnterprise.” Policy Review 63 (Winter): 82–85.
Bates, Timothy. 1989. “The Changing Nature of Minority Business: A ComparativeAnalysis of Asian, Nonminority and Black-owned Businesses.” The Review of BlackPolitical Economy (Fall): 25–42.
Bates, Timothy. 1991. “Commercial Bank Financing of Black and White Small BusinessStart-ups.” Quarterly Review of Economics and Business 31(1):
Bates, Timothy. 1995. “Self-Employment Entry Across Industry Groups.” Journal ofBusiness Venturing 10:143–56.
Bates, Timothy. 1996. “The Financial Capital Needs of Black-owned Businesses.”Journal of Developmental Entrepreneurship 1(1):1–15.
Bates, Timothy, and Darrell Williams. 1995. “Preferential Procurement Programs andMinority-Owned Businesses.” Journal of Urban Affairs 17(1):1–17.
Blau, Francine, and David Graham. 1990. “Black-White Differences in Wealth and AssetComposition.” Quarterly Journal of Economics: 321–39.
Borjas, George J. 1986. “The Self-Employment Experience of Immigrants.” Journal ofHuman Resources 21(4):485–506.
Borjas, George J. 1992. “Ethnic Capital and Intergenerational Mobility.” QuarterlyJournal of Economics (February): 123–50.

Borjas, George J., and Stephen G. Bronars. 1989. “Consumer Discrimination and Self-Employment.” Journal of Political Economy 97(3):581–605.
Boyd, Robert L. 1991. “A Contextual Analysis of Black Self-Employment in LargeMetropolitan Areas, 1970–1980.” Social Forces 70(2):409–29.
Butcher, Kristin F. 1994. “Black Immigrants in the United States: A Comparison WithNative Blacks and Other Immigrants.” Industrial and Labor Relations Review 47(2, January): 265–84.
Chiswick, Barry R. 1983. “The Earnings and Human Capital of American Jews.” Journalof Human Resources 18 (Summer): 313–36.
Colorado Center for Community Development, University of Colorado at Denver. 1996.Survey of Small Business Lending in Denver.
Connelly, Rachel. 1992. “Self-Employment and Providing Child Care.” Demography 29(February): 17–29.
Darity, William Jr. 1989. “What’s Left of the Economic Theory of Discrimination?” InThe Question of Discrimination: Racial Inequality in the U.S. Labor Market, editedby Steven Shulman and William Darity Jr. (153–89). Middletown, CT.
Development Associates Inc. 1987. Attitudes and Inclinations of Minority YouthToward Business Ownership. Washington, D.C.: U.S. Department of Commerce,Minority Business Development Agency.
Edin, Kathryn, and Christopher Jencks. 1992. “Reforming Welfare.” In RethinkingSocial Policy: Race, Poverty, and the Underclass, edited by Christopher Jencks(204–36). Cambridge, MA: Harvard University Press.
Evans, David S., and Linda S. Leighton. 1989. “Some Empirical Aspects of Business.”American Economic Review 79:519–35.
Fairlie, Robert W., and Bruce D. Meyer. 1994. The Ethnic and Racial Character of Self-Employment. National Bureau of Economic Research, Working Paper No. 4791.
Fix, Michael, and Raymond Struyk, editors. 1993. Clear and Convincing Evidence:Measurement of Discrimination in America. Washington, D.C.: The Urban InstitutePress.
Fratoe, Frank A. 1988. “Social Capital of Black Owners.” Review of Black PoliticalEconomy 16 (Spring): 33–50.
Freeman, Richard B. 1989. Labor Markets in Action: Essays in Empirical Economics.Cambridge, MA: Harvard University Press.
Green, Gary P., Leann M. Tigges, and Irene Browne. 1995. “Social Resources, Job Search,and Poverty in Atlanta.” Research in Community Sociology 5:161–82.
DO MINORITY-OWNED BUSINESSES GET A FAIR SHARE OF GOVERNMENT CONTRACTS?64
THE URBANINSTITUTE

Grown, Caren, and Timothy Bates. 1992. “Commercial Bank Lending Practices and theDevelopment of Black-Owned Construction Companies.” Journal of Urban Affairs 14(1).
Higgs, Robert. 1989. “Black Progress and the Persistence of Racial EconomicInequalities, 1865–1940,” In The Question of Discrimination: Racial Inequality inthe U.S. Labor Market, edited by Steven Shulman and William Darity Jr. (9–31).Middletown, CT.
Hill, Herbert. 1989. “Black Labor and Affirmative Action: An Historical Perspective.” InThe Question of Discrimination: Racial Inequality in the U.S. Labor Market, editedby Steven Shulman and William Darity Jr. (190–267). Middletown, CT.
Juhn, Chinhui, Kevin M. Murphy, and Brooks Pierce. 1991. “Accounting for theSlowdown in Black-White Wage Convergence.” In Workers and Their Wages:Changing Patterns in the United States, edited by Marvin Kosters (107–43).Washington, D.C.: American Enterprise Institute.
Kelman, Steven. 1990. Procurement and Public Management: The Fear of Discretionand the Quality of Government Performance. Washington, D.C.: AmericanEnterprise Institute.
Kim, Kwang Chung, Won Moo Hurh, and Marylin Fernandez. 1989. “Intra–groupDifferences in Business Participation: Three Asian Immigrant Groups.” Inter-national Migration Review 23(1):73–95.
Meyer, Bruce D. 1990. “Why Are There so Few Black Entrepreneurs?” National Bureauof Economic Research, Working Paper No. 3537.
Min, P. G. 1984. “From White-Collar Occupations to Small Business: KoreanImmigrants’ Occupational Adjustment.” Social Science Quarterly 25 (Summer):333–52.
Munnell, Alicia H., Geoffrey M. B. Tootell, Lynn E. Browne, and James McEneaney.1996. “Mortgage Lending in Boston: Interpreting HMDA Data.” American EconomicReview 86 (1, March): 25–53.
O’Hare, William P. 1990. “Black Business Ownership in the Rural South.” Review ofBlack Political Economy (Winter): 93–104.
Portes, Alejandro, and R. L. Bach. 1985. Latin Journey: Cuban and Mexican Immigrantsin the United States. Berkeley, CA: University of California Press.
Reimers, Cordelia. 1983. “Labor Market Discrimination Against Hispanic and BlackMen.” Review of Economic Statistics 65 (4, November): 570–79.
Sanders, Jimmy, and Victor Nee. 1996. “Social Capital, Human Capital, and ImmigrantSelf-Employment.” American Journal of Sociology 61 (April): 231–49.
Sowell, Thomas. 1983. The Economics of Politics and Race: An InternationalPerspective. New York: Quill.
BIBLIOGRAPHY
THE URBANINSTITUTE
65

Spalter-Roth, Roberta, Enrique Soto, and Lily Zandniapour. 1994. “Micro-Enterpriseand Women: The Viability of Self-Employment as a Strategy for AlleviatingPoverty.” Institute for Women’s Policy Research (November).
Tienda, Marta, and Rebeca Raijman. 1996. “Forging Mobility in a Low WageEnvironment: Mexican Immigrants in Chicago’s ‘Little Village’.” Paper preparedfor the Urban Poverty Workshop, Northwestern University and University ofChicago.
Tigges, Leann, and Gary P. Green. 1994. “Small Business Success Among Men- andWomen-Owned Firms in Rural Areas.” Rural Sociology 59 (Summer): 289–310.
U.S. Federal Register. 1996. Part VI Department of Justice: Federal Procurement;Proposed Reforms to Affirmative Action; Notice. Vol. 61, No. 101. (May 23):26042–26063.
Wilson, K. L., and Alejandro Portes. 1980. “Immigrants’ Enclaves: An Analysis of theLabor Market Experience of Cubans in Miami.” American Journal of Sociology86: 295–319.
Wong, Bernard. 1989. “The Chinese: New Immigrants in Chinatown.” In NewImmigrants in New York, edited by Nancy Foner (243–72). New York: ColumbiaUniversity Press.
Youngert, Andrew M. 1995. “Testing Hypotheses of Immigrant Self-Employment.”Journal of Human Resources 30(1):194–204.
DO MINORITY-OWNED BUSINESSES GET A FAIR SHARE OF GOVERNMENT CONTRACTS?66
THE URBANINSTITUTE

Chapter 1
Appendix: Study Methods
This appendix discusses several issues related to the methods used inconducting the analysis discussed in chapter 2. Our analysis is basedon a review of 95 disparity studies. Disparity ratios from 58 of thesestudies were included in our findings. A complete list of these studies
is given in table A.1. We do not, however, know what percentage of all exist-ing disparity studies were reviewed because there is no systematic collection orlist of disparity studies undertaken across the country.
Study selection criteriaTo be included in our analysis, a study had to (1) present disparity findings forgovernment contracting (alternatively, it could present the availability and uti-lization figures necessary to calculate disparity ratios); (2) report findings sepa-rately by industry category; (3) report the number of contracts in each industryon which disparity findings were based or report the statistical significance of eachdisparity finding; and (4) have more than 80 contracts for all years of the studyperiod combined. These criteria were developed to ensure a basic level of consis-tency and reliability across studies to enable us to aggregate findings. In additionto these clear-cut criteria, some studies were excluded because they did not indi-cate exactly how key calculations had been performed or because there were sig-nificant inconsistencies throughout the study. Of the 95 studies we reviewed, find-ings from 58 are included in this analysis. A list of the 37 studies that were notincluded in the analysis and reasons for their exclusion are given in table A.2.1
The actual disparity findings on which our analysis is based are reportedin tables A.3a–d. These tables list percentage availability, disparity ratios, andstatistical significance for African Americans, Latinos, Asians, NativeAmericans, all minorities, and women. These tables also include the jurisdic-

tion of the study, the type of availability measure used, the number of con-tracts included, and the years examined. A separate table is included for severalindustry categories: construction, goods, professional services, and “other” (i.e.,nonprofessional) services. Not all studies report findings for all of these indus-tries or for all groups. In some cases, we had to calculate the disparity ratio(when a study only reports availability and utilization separately) or calculatethe inverse of reported ratios (when a study reported the ratio of availability toutilization). When a study only reported data for African Americans, Latinos,and Asians separately, we calculated the disparity ratio for “all minorities.”
Many individual study findings in table A.3 are not statistically significant.This means that the study does not have strong evidence of disparity for thatparticular industry and ethnic group. This could occur either because no dis-parity exists or because the evidence presented is not very reliable, and there-fore we cannot tell whether or not there is a disparity. The studies do not typi-cally provide enough information to distinguish between these twopossibilities. If few contracts are examined or if the availability of minority-owned firms is very low, a study typically provided less reliable evidence onthe question of disparity. In that case, only if the observed disparity ratio is veryfar from 1 can we claim that the study shows under- or overutilization.However, combining a large number of individual studies, as our study does,provides stronger evidence than any individual study.
Calculating average disparity ratios for each studyWhen studies present several different measures of disparity, we take the mean of these measures to provide one disparity ratio per study for each industry/minority group.
Some disparity studies present disparity measures for several agencies orcontracting authorities in the geographic area. For example, a single study donefor Jacksonville, Florida, presents separate disparity ratios for the city, the elec-tric authority, the port authority, and the school board. We average all of thesemeasures together to get a better measure of disparity in government contract-ing for the Jacksonville area. This approach also increases the amount of data onwhich our disparity ratio is based because the number of contracts for a singleagency may be small. In some cases, separate disparity studies were commis-sioned for different agencies within the same geographic area. For example,separate disparity studies were conducted for the city of Dallas and theDallas/Fort Worth International Airport. In cases like these, we include a sepa-rate average for each study. Aggregating these studies would be problematicbecause they may use data from different time periods, may use different meth-ods, and are conducted by different authors.
We calculated the average disparity ratio for the construction industry in aslightly different way. The disparity ratio is intended to reflect the share ofdollars received by minority- or women-owned businesses as either prime orsubcontractors. Some studies allocate all contract dollars awarded to therace/ethnicity of the prime contractor, ignoring payments to subcontractors. Forthese studies, if separate data on subcontracts are available, we average all ofthe disparity ratios for prime and subcontractor utilization to calculate the aver-age disparity ratio. If subcontract data are not available, we average the data
DO MINORITY-OWNED BUSINESSES GET A FAIR SHARE OF GOVERNMENT CONTRACTS?68
THE URBANINSTITUTE

for the prime contractors alone. If a study appropriately allocates total dollarsawarded to the prime and subcontractors, we use that data to calculate the aver-age disparity ratio for the study.
Calculating median disparity ratiosTo obtain the overall disparity ratio for a set of studies, we calculate the medianof the average disparity ratios. For example, the disparity ratio for AfricanAmerican-owned businesses in the goods industry is the median of the aver-age disparity for African Americans in goods in each study. We use the medianbecause while the disparity ratio cannot fall below 0, there is no limit to howhigh it can be. This means that measures of underutilization are limited to arange between 0 and 1, but overutilization is unlimited. This aspect of the dis-parity ratios means that simple averages can give disproportionate weight tomeasures of overutilization. For example, if there were five disparity ratios, 0.1,0.3, 0.5, 0.5, and 17.3, the median disparity is 0.5, but the average disparity is3.1. This median disparity more accurately reflects the overall disparity for thestudies we examine than does the average disparity.
In some cases the median disparity ratio for the “all minorities” category islarger than most or all of the median disparity ratios for the individual minoritygroups. This is a counterintuitive result, though it is correct. We believe itcomes from the presence of outliers—studies in which the disparity ratio is veryhigh (e.g., 10) for individual racial groups—and the fact that these outliersrarely occur for more than one minority group in an individual study. Theexample following will make clear how this can happen.
Suppose we have two racial groups, A and B, and we analyze three stud-ies. The disparity findings from the studies for the two groups are as follows:
Racial GroupA B
Study 1 10 0.5Study 2 0.5 10Study 3 0.8 0.8
Median 0.8 0.8
The median for both racial group A and B is 0.8 (because half the studies havevalues less than or equal to 0.8 and half have values greater than or equal to 0.8).Now, let’s suppose that the minority population is made up equally of A’s andB’s. The overall averages for each study are then
Racial GroupA B Overall Average
Study 1 10 0.5 5.25Study 2 0.5 10 5.25Study 3 0.8 0.8 0.80
Median 0.8 0.8 5.25
The overall median of the sample averages is 5.25, which is greater than themedian values for either group A or B. Note that 5.25 gives a better sense of
APPENDIX: STUDY METHODS
THE URBANINSTITUTE
69

the overall average findings than does 0.8 (the average of the outcomes for thetwo racial groups). Two of the studies show very high disparity ratios, a fact thatwould be totally lost if we relied on the average of the outcomes for the tworacial groups.
Limitations of Census SMOBE/SWOBE dataMany of the studies make use of data from the U.S. Census Bureau’s Survey ofMinority-Owned Business Enterprises (SMOBE) and Survey of Women-OwnedBusiness Enterprises (SWOBE). Of the 58 studies included in the analysisabove, more than half use data from these surveys (SMOBE/SWOBE) for at leastone of their measures of availability. Data from SMOBE/SWOBE are used so fre-quently in part because they are readily available and in part because they pro-vide an estimate of the minority share of all firms. However, these data haveseveral weaknesses that need to be accounted for by researchers.
First, the data include as small businesses all persons who filed a tax returnindicating that they are self-employed. These data are known to overcount thenumber of very small businesses, since the data include large numbers of per-sons with small amounts of self-employment income. Many of these smallbusinesses are unlikely to have the capacity to carry out government contracts.Although some disparity studies adjust the data by excluding firms withoutemployees or firms with less than a minimum amount of revenues, in manycases they do not. If MBE’s are overrepresented among small firms, and if smallfirms are unable to carry out government contracts, then studies that do notexclude them will overstate MBE availability.
Second, prior to 1992 both the SMOBE and SWOBE data excluded C-cor-porations. C-corporations are defined by tax status and include all corpora-tions with more than 35 shareholders and many smaller corporations for whomthere is a tax advantage to filing under this status. Roughly half of the studiesincluded in our analysis adjust for the missing C-corporations, so that avail-ability reflects all firms within an industry. Studies that do not adjust for theexclusion of C-corporations are expected to overstate availability, as minority-owned businesses are less likely to be represented among these larger firms.Some recent evidence on this issue comes from a supplement to the 1992SWOBE, which was intended to measure the availability of C-corporationsamong women-owned businesses and all businesses. According to this data,women-owned corporations are less likely to be C-corporations than otherfirms. This suggests that studies using data prior to 1992 that ignored this issuewere likely to overstate the availability of women-owned businesses. However,we have no comparable data on minority-owned firms.
A third problem with the SMOBE/SWOBE data is that they undercountHispanic- and Asian-owned firms to a significant degree. In 1982, for example,approximately one-sixth of Hispanic-owned firms were not counted. The cen-sus provides adjustments to correct for this undercount, but these adjustmentswere applied in only half of the disparity studies included in our analysis.Although the adjustments for undercounts themselves are not very precise, itis clear that the estimated availability of Hispanic- and Asian-owned firms isunderstated when these adjustments are not made.2
DO MINORITY-OWNED BUSINESSES GET A FAIR SHARE OF GOVERNMENT CONTRACTS?70
THE URBANINSTITUTE

Finally, SMOBE/SWOBE are available only every five years and are typi-cally not available until several years after the time of the survey. Therefore,using this data for availability generally meant a difference of at least severalyears between the date of availability and utilization for these disparity studies.One-third of the studies using SMOBE/SWOBE made some adjustment for thisdifference, usually by assuming the growth rate of minority-owned firms usingdata on self-employment and the growth rate between 1982 and 1987. Studiesthat did not make an adjustment may understate minority business availabil-ity, if the number of minority businesses was growing faster than the numberof businesses overall. Earlier studies are less likely to adjust for the growth inthe number of businesses over time, but this is less of a problem for them sincetheir utilization data is from a time period closer to the 1987 SMOBE/SWOBEavailability data.
Notes
1. We are aware of at least an additional 19 disparity studies that were not received in time tobe reviewed for this study.
2. The undercount was due to the particular method used in SMOBE and SWOBE to identifyHispanic- and Asian-owned firms. A change in methodology in 1992 eliminated this problemfor partnerships and S-corporations. Hispanic- and Asian-owned sole proprietorships are stillundercounted in the 1992 data.
APPENDIX: STUDY METHODS
THE URBANINSTITUTE
71

Table A.1Disparity Studies Included in Analysis
Alabama, Birmingham-Jefferson County Transit Authority, “Final Report of aStudy to Support a Disadvantaged Business Enterprise Set-Aside Program,”MGT of America, August 17, 1992.
Arizona, “Disparity Study: City of Phoenix,” BBC, July 1993.
Arizona, “The City of Tucson Disparity Study,” BBC, June 3, 1994.
Arizona, “Pima County Disparity Study,” BBC, June 1994.
Arizona, “The Maricopa County Minority- and Woman-Owned BusinessEnterprise Program Study,” Mason Tillman (publication date not given—report commissioned in September 1989).
California, “The Utilization of Minority- and Woman-Owned BusinessEnterprises by Alameda County,” NERA, June 1992.
California, “The Utilization of Minority- and Woman-Owned Business Enter-prises by Contra Costa County,” NERA, May 1992.
California, “The Utilization of Minority- and Woman-Owned Business Enter-prises by the City of Hayward,” NERA, March 1993.
California, “Sacramento Municipal Utility District: M/WBE Disparity Study,”Mason Tillman, October 1992.
California, “Oakland Unified School District Disparity Study,” Mason Tillman,November 1994.
California, “City of Richmond Disparity Study,” Mason Tillman, March 1994.
California, “City of San Jose Disparity Study: Professional Services and Pro-curement,” Mason Tillman, April 1995.
California, “MBE/WBE Disparity Study For the City of San Jose” (Construction),BPA Economics, Mason Tillman, and Boasberg and Norton, 1990.
Colorado, “Denver Disparity Study: Goods, Services and Remodeling” (PhaseII of an earlier study), BBC, June 27, 1991.
Colorado, Denver, “The Utilization of Minority- and Women-Owned BusinessEnterprises by the Regional Transportation District,” NERA, September 14,1992.
District of Columbia, “Discrimination Study on Minority Business Enterprises:Final Report,” District of Columbia Department of Human Rights andMinority Business Development, A.D. Jackson Consultants, Inc., July 1,1994.
Florida, “State of Florida: Minority/Women Business Study,” Phases I–II, TEMAssociates, Inc., December 1990.
DO MINORITY-OWNED BUSINESSES GET A FAIR SHARE OF GOVERNMENT CONTRACTS?72
THE URBANINSTITUTE

Florida, “A Minority- and Women-Owned Business Discrimination Study,” prepared for Metropolitan Dade County, Parts I–IV, MRD Consulting,November 29, 1993.
Florida, “City of Jacksonville Disparity Study,” D.J. Miller, November 1990.
Florida, “Disparity Study for the Orange County Consortium,” D.J. Miller,February 24, 1993.
Florida, “City of St. Petersburg Disparity Study,” D.J. Miller, June 1990.
Florida, “City of Tampa Disparity Study,” D.J. Miller, November 1990.
Illinois, City of Chicago, “Report of the Blue Ribbon Panel to the HonorableRichard M. Daley, Mayor of the City of Chicago,” March 29, 1990.
Louisiana, “Discrimination in New Orleans: An Analysis of the Effects ofDiscrimination On Minority and Female Employees and Business Owners,”NERA, September 13, 1994.
Louisiana, “State of Louisiana Disparity Study, Volume II: An Analysis ofDisparity and Possible Discrimination in the Louisiana ConstructionIndustry and State Procurement System and its Impact on Minority- andWomen-Owned Firms Relative to the Public Works Arena,” D.J. Miller &MBELDEF, June 1991.
Maryland, “The Utilization of Minority-Business Enterprises by the State ofMaryland,” prepared for the State of Maryland Department of Trans-portation, NERA, December 6, 1994.
Maryland, “State of Maryland Minority Business Utilization Study, FinalReport,” Vols. I & II, A.D. Jackson Consultants, Inc., and Coopers & Lybrand,March 15, 1990.
Maryland, “An Examination of Prince George’s County’s Minority BusinessProgram,” Parts I–III, February 1991.
Massachusetts, “Executive Office of Transportation and Construction, DisparityStudy, Phase I: Final Report,” D.J. Miller, March 16, 1994.
Massachusetts, “The Utilization of Minority- and Woman-Owned BusinessEnterprises in the Boston Metropolitan Area,” NERA, June 1994.
Minnesota, “The Disparity Study of Women/Minority Business: City ofMinneapolis,” BBC, June 1995.
Minnesota, “The Multi-Jurisdictional Disparity Study of Minority/Women Busi-ness Enterprises: City of Saint Paul,” BBC, September 1995.
Minnesota, “The Multi-Jurisdictional Disparity Study of Minority/Women Busi-ness Enterprises: Ramsey County,” BBC, September 1995.
Minnesota, “The Disparity Study of Women/Minority Business Enterprises:Hennepin County,” BBC, June 1995.
APPENDIX: STUDY METHODS
THE URBANINSTITUTE
73

Minnesota, “Multi-Jurisdictional Disparity Study of Minority/Women BusinessEnterprises: Independent School District No. 625,” BBC, September 1995.
Nevada, “Regional Economic Disparity Study: City of Las Vegas,” and Las VegasArea Local Governments (including: City of Las Vegas, Clark CountyDepartment of Aviation, Clark County Department of General Services,Clark County Regional Flood Control District, Clark County SanitationDistrict, Clark County School District, Housing Authority of the City of LasVegas, Housing Authority of the County of Clark, Las Vegas–Clark CountyLibrary District, Las Vegas Convention and Visitors Authority, Las VegasValley Water District, Regional Transportation Commission, UniversityMedical Center, the University of Nevada, Las Vegas, and the CommunityCollege of Southern Nevada), BBC, July 1994.
New Mexico, “Disparity Study: City of Albuquerque,” BBC, December 1995.
New Mexico, “New Mexico State Highway & Transportation DepartmentDisparity Study,” Vols. I & II, BBC, January 1995.
New York, “A Study of Disparity and Utilization of Minority- and Women-Owned Businesses by the Port Authority of NY & NJ,” Office of Businessand Job Opportunity and the Office of Economic Policy Analysis, June 1993.
New York, “Utilization of Minority- and Woman-Owned Business Enterprisesby the New York City Housing Authority,” NERA, September 28, 1993.
New York, “Opportunities Denied! A Study of Racial and Sexual Discrim-ination Related to Government Contracting in New York State,” ExecutiveSummary and Appendices A–E, New York State Division of Minority andWomen Development, 1992.
New York, “The Utilization of Minority- and Women-Owned Business Enter-prises by the City of New York,” NERA, January 24, 1992.
New York, “City of Syracuse Report of Local Public Works Contracting,”Knowledge Systems & Research, January 1991.
North Carolina, “City of Greensboro Minority and Women Business EnterpriseCapacity Study,” and “City of Greensboro Minority and Women BusinessEnterprise Disparity Study,” North Carolina Institute of Minority EconomicDevelopment, January/July 1992.
North Carolina, “Final Report: Minority Business Disparity Study to SupportCity of Asheville Minority Business Plan,” Research and EvaluationAssociates and MGT of America, October 29, 1993.
Ohio, “City of Cincinnati Croson Study,” Vols. I & II, Institute for PolicyResearch, University of Cincinnati, April 17, 1992.
Ohio, City of Columbus, “Predicate Study,” BBC and MBELDEF, August 1992;and “City of Columbus Predicate Study Second Supplemental Report:Construction, Goods and Services,” BBC, January 1995.
Ohio, “City of Dayton Disparity Study,” D.J. Miller, March 1991.
DO MINORITY-OWNED BUSINESSES GET A FAIR SHARE OF GOVERNMENT CONTRACTS?74
THE URBANINSTITUTE

Pennsylvania, “The Utilization of Minority- and Women-Owned BusinessEnterprises by the Southeastern Pennsylvania Transportation Authority,”NERA, September 29, 1993.
Tennessee, “Memphis/Shelby County Intergovernmental Consortium DisparityStudy,” D.J. Miller, October 1994.
Texas, “The State of Texas Disparity Study: A Report to the Texas Legislatureas Authorized by H.B. 2626, 73rd Legislature,” NERA, December 27, 1994.
Texas, “Availability/Disparity Study: Forth Worth Transportation Authority,”BBC, November 1993.
Texas, “Availability/Disparity Study: Dallas/Fort Worth International Airport,”BBC, November 1993.
Texas, “Disparity Study: City of Fort Worth,” BBC, November 1993.
Texas, “Disparity Report for Houston City Government,” D.J. Miller, November1994.
Texas, “Availability and Disparity Study for the City of Dallas,” D.J. Miller,February 1995.
Texas, San Antonio, “The Utilization of Minority- and Women-Owned BusinessEnterprises in Bexar County,” NERA, April 15, 1992.
Wisconsin, “M/WBE Disparity Study for the County of Milwaukee, City ofMilwaukee, and Milwaukee Public Schools,” Affirmative Action ConsultingLtd., and Ralph G. Moore and Associates (AAC/RGMA), April 1992.
APPENDIX: STUDY METHODS
THE URBANINSTITUTE
75

Table A.2Disparity Studies Excluded from Analysis and Reasons for Exclusion
California, “Alameda County Transportation Authority Disparity Study: FinalReport,” Mason Tillman, June 1994:
Utilization data is for Alameda County—not the transportation author-ity. The utilization data is taken directly from the NERA study onAlameda County, which is included. This study was not included, inorder to avoid duplication.
California, “City of Los Angeles, Department of Airports: MBE/WBE UtilizationStudy,” Executive Summary, Mason Tillman, January 1993:
No calculation of availability is performed. The study demonstratesextremely low levels of utilization which may be useful by themselvesor if availability data were compiled.
Colorado, “Denver Disparity Study Phase I: Construction and ProfessionalDesign Services,” BBC, June 22, 1990:
The study does not test findings for statistical significance and does notprovide number of contracts by industry. In addition, it is poorly orga-nized and unclear.
Colorado, “Analysis of Minority- and Women-Owned Businesses in the DenverMetropolitan Area: Goods and Services Marketplace,” BBC, 1995:
Study examines disparity in the private sector, not in government contracting.
Colorado, “Analysis of Minority- and Women-Owned Businesses in the DenverMetropolitan Area Construction and Professional Design Marketplace,” BBC, 1995:
Study examines disparity in the private sector, not in government contracting.
Colorado, Denver, “Potential Annual Goal Setting Methodology for GeneralServices,” BBC, 1995:
This is not a disparity study, but a set of recommendations about howDenver should set goals in the General Services area.
Connecticut, “The New Connecticut: Toward Equal Opportunity in State Con-tracting,” Hendersen, Hyman & Howard (date unclear):
This study does not provide estimates of availability. The study doescontain extensive legislative history and ample evidence of a histori-cal trend of non-compliance with legislated set-aside goals.
Connecticut, “Committee Report: Special Committee on Section 12 1/2 Review,New Haven, Board of Aldermen: Minority and Women Participation in the NewHaven Construction Industry,” with appended report by Jaynes Assoc., May 23,1990:
Only scant information is provided on utilization and availability.What information is provided does not necessarily match up in termsof time periods. The study contains an excellent analysis of historicaldiscrimination in the New Haven construction trades.
DO MINORITY-OWNED BUSINESSES GET A FAIR SHARE OF GOVERNMENT CONTRACTS?76
THE URBANINSTITUTE

District of Columbia, “Availability and Utilization of Minority- and Women-Owned Business Enterprises at the Metropolitan Washington AirportsAuthority,” NERA, February 14, 1990:
The method used to calculate utilization appears to be flawed.Utilization appears to be based on the required goal for each contractrather than an examination of the actual dollars received by minoritybusinesses. It is also unclear how the estimates of the disparities inthe number of awards are calculated.
District of Columbia, “The Metropolitan Washington Airports Authority, LocalDisadvantaged Business Enterprise (LDBE) Program: An Examination of itsEffectiveness in Improving Contract Access for Minority and Women BusinessEnterprises,” MBELDEF, April 22, 1992:
This is not a disparity study. Instead this document is an attempt byMBELDEF to evaluate the “race-neutral” LDBE program which was putin place after the Metro Airports Authority disbanded its MBE programin the wake of Croson. For the most part this study consists of surveysand interviews with MBEs, attempting to determine what changes inaccess have accompanied changes in the program. The only data pro-vided regard utilization before and after the program was shut off. [Thestudy reports that M/WBE utilization was 33 percent under the previ-ous mandatory preference program and that M/WBE participation fellto 9–15 percent under the new LDBE program.]
District of Columbia, “An Examination of [Washington Suburban SanitaryCommission’s] WSSC’s Minority Business Program,” Summary and Recom-mendations, Part I: Legal Analysis, MBELDEF, March 1988:
The key part of this study (Part II) was not received. That section prob-ably contains whatever data analysis was performed by the authors. Areview of the executive summary suggests that this report does notappear to calculate availability in a usable way.
Florida, Dade County Public Schools, “Minority Business EnterprisesUtilization Study Recommendations and Administrative Responses,” Bureau ofManagement and Accountability Division of Minority Business Enterprises,April 24, 1991:
This study did not include the necessary data for calculating disparityratios.
Florida, Hillsborough County, “Hillsborough County Disparity Study,” D.J.Miller (date unclear; pre-Croson):
Organization of data in the study makes it impossible to determinenumber of contracts in each industry category. No disparity ratios arecalculated and therefore no standard error tests are conducted. Thestudy pre-dates the Supreme Court’s decision in Croson.
Florida, “Final Report: City of Tallahassee MBE Disparity Fact-Finding Study,”MGT of America, Inc., January 11, 1990:
The study does not test findings for statistical significance and does notprovide number of contracts by industry.
APPENDIX: STUDY METHODS
THE URBANINSTITUTE
77

Georgia, “Public Policy and Promotion of Minority Economic Development:City of Atlanta and Fulton County, Georgia,” Brimmer and Marshall, Vols.I–VIII, June 29, 1990:
While study provides a huge amount of information, it does not presentany appropriately paired data on utilization and availability to calcu-late disparity in government contracting. In most cases availabilityand utilization data are not presented by industry or broken down byracial groups or gender. Where such data are presented (e.g., for con-struction), the availability data is presented for “all minorities” whilethe utilization data are presented for minorities and women combined,and thus calculation of disparity ratios are not possible. The studyfocuses on disparity in the private market.
Georgia, “Unequal Access: Minority Contracting and Procurement with theAtlanta Board of Education,” Thomas Boston, August 8, 1991:
Study does not calculate statistical significance or report number ofcontracts by industry. The study shows that 50 percent of the firmslisted as minority-owned by the school board are in fact owned bywhite men. The study also finds that minority-owned businesses thathad applied to be included on the list of potential bidders were notincluded.
Illinois, “Report Concerning Consideration and Adoption of the RevisedRemedial Plan for Minority and Women Business Enterprise EconomicParticipation,” Board of Education of the City of Chicago, January 30, 1991:
Study does not calculate statistical significance or report number ofcontracts by industry.
Illinois, “Predicate Study for the Cook County Minority- and Women-OwnedBusiness Enterprise Program,” by Thomas G. Abram and James J. Zuehl,Vedder, Price, Kaufman & Kammholz, September 2, 1993:
Study does not break down disparity results by industry.
Louisiana, “State of Louisiana Disparity Study: Volume I of An Analysis ofDisparity and Possible Discrimination in the Louisiana Construction Industryand State Procurement System and Its Impact on Minority- and Women-OwnedFirms Relative to the Public Works Arena,” LSU and Southern University, April1990:
The study does not provide disparity results in a form consistent withthe other studies in our analysis. The study provides an interestingregression analysis of disparity, controlling for a number of factors thatcould affect the award of government contracts including experience,bonding, and revenues.
Louisiana, “An Analysis, Critique and Chronicle of the Audubon Park Com-mission Minority Business Enterprise Plan,” Xavier University of Louisiana(date unclear):
This study has no availability measurements—it deals exclusively withminority participation. It does include a good deal of anecdotal evi-dence and an interesting discussion of “fronting” and other plan “man-agement” issues.
DO MINORITY-OWNED BUSINESSES GET A FAIR SHARE OF GOVERNMENT CONTRACTS?78
THE URBANINSTITUTE

Louisiana, “Basic Findings, Conclusions and Recommendations on The Audu-bon Park Commission Minority Business Enterprise Plan,” Xavier University ofLouisiana, August 8, 1990:
This was simply a summary of the above study. Again, no availabilitymeasures were included.
Maryland, City of Baltimore, “Notice of Public Comment Period andAssessment of Baltimore City’s Minority and Women’s Business EnterpriseProgram in Light of Croson: Draft Report,” by Michael Millemann and MaxwellChibundu, Maryland School of Law, November 1989:
This study provides very sketchy information about availability and(especially) about utilization. It also does not provide either the num-ber of contracts or tests for statistical significance.
Maryland, National Capital Parks and Planning Commission, “Minority,Female, Disabled Business Utilization Study,” A.D. Jackson Consultants, Inc.November 4, 1992:
The study does not test findings for statistical significance and does notprovide number of contracts by industry.
Massachusetts, “Blueprint of Tasks for Massachusetts MBE/WBE DisparityStudies,” Marcus Weiss & Affiliates, and D.J. Miller, July 1990:
This is not a disparity study. Instead it is a strategy for compiling adisparity study.
Massachusetts, Brief of Defendant MBTA in Perini v. MBTA (date unclear):This is a legal brief and not a disparity study. Data on government uti-lization and appropriate measures of availability are extremely sparse.
Massachusetts, “Availability and Utilization of Minority- and Women-OwnedBusiness Enterprises at the Massachusetts Water Resources Authority,” NERA,November 21, 1990:
Availability and utilization measures are not compatible. Specifically,utilization combines construction and architecture/engineering ser-vices, while availability is calculated for each industry separately. Thismakes it impossible to calculate disparity ratios by industry.
Minnesota, “A Study of Discrimination Against Women- and Minority-OwnedBusinesses and of Other Small-Business Topics,” by the Minnesota Departmentof Administration, Management Analysis Division, January 1990:
Findings reported only for three-digit industry categories.
North Carolina, “A Preliminary Report: An Examination of MarketplaceDiscrimination in Durham County,” MBELDEF, July 1, 1991:
Preliminary report (not a disparity study) containing no data on uti-lization or availability.
North Carolina, “State of North Carolina, North Carolina General Assembly:Study of Minority and Women Business Participation in Highway Con-struction,” MGT of America, Inc., January 26, 1993:
The study does not test findings for statistical significance and does notprovide number of contracts by industry.
APPENDIX: STUDY METHODS
THE URBANINSTITUTE
79

Ohio, “City of Columbus, Construction Supplemental Report,” BBC, September1993:
The information in this study was actually provided in a more detailedform in the Second Supplemental Report, issued in January 1995.Therefore the data from that report were used instead.
Ohio, City of Columbus, “Employment Predicate Study,” BBC, August 1992:This study evaluates their program requiring contractors to meet cer-tain minority employment goals. It does not deal with disparity in con-tract dollars awarded.
South Carolina, State, “Report to the General Assembly: A Limited-ScopeReview of the SC Department of Highways and Public Transportation MinorityGoals Program,” by the South Carolina Legislative Audit Council, May 1991:
The study does not test findings for statistical significance and does notprovide number of contracts by industry.
Texas, Tarrant County, “Availability Study,” BBC, November 1993:This is not a disparity study. It covers only availability. No data on uti-lization were provided.
Washington, City of Seattle/Pierce and King Counties, “Study of Minority/Women Business Participation in Purchasing and Concessions,” WashingtonConsulting Group, July 9, 1990:
Study does not provide usable availability information. Statistics areprovided about the number of minority firms which are available, butno information is provided about the number of all available firms andtherefore a ratio cannot be calculated.
Wisconsin, “A Study to Identify Discriminatory Practices in the MilwaukeeConstruction Marketplace,” Consta & Assoc., February 1990:
Study did not include required disparity information. It focused on a historical review of discrimination in the Milwaukee constructionmarketplace.
DO MINORITY-OWNED BUSINESSES GET A FAIR SHARE OF GOVERNMENT CONTRACTS?80
THE URBANINSTITUTE

AP
PE
ND
IX: S
TU
DY
ME
TH
OD
S
TH
E U
RB
AN
INS
TIT
UT
E
81
CONSTRUCTIONAlameda County, CA–Large Contract $ SM/WOBE 66 1985–87 1.3 1.90 N.S. 3.2 1.01 N.S. 1.5 0.00 N.S. 6.0 0.95 C 2.3 0.00 N.S.Alameda County, CA–Large Contract # SM/WOBE 66 1985–87 1.3 2.20 N.S. 3.4 2.20 N.S. 1.4 0.00 N.S. 6.1 1.70 C 2.4 0.00 N.S.Alameda County, CA–Large Contract $ SM/WOBE 18 1989–90 3.8 0.00 N.S. 6.2 0.67 N.S. 10.5 0.02 N.S. 20.5 0.21 C 9.3 0.00 N.S.Alameda County, CA–Large Contract # SM/WOBE 18 1989–90 3.3 0.00 N.S. 5.7 1.90 N.S. 6.0 0.91 Under 15.0 1.09 C 7.1 0.00 N.S.
Alameda County, CA–Small Contract $ SM/WOBE 62 1987–90 4.2 0.00 N.S. 6.6 0.92 N.S. 4.0 0.02 N.S. 14.8 0.42 C 7.0 0.95 N.S.Alameda County, CA–Small Contract # SM/WOBE 62 1987–90 4.0 0.00 N.S. 6.3 0.76 N.S. 4.3 0.37 N.S. 14.6 0.44 C 7.7 0.62 N.S.
Alameda Co., CA–Federal–Lrg Contract $ NS 10 1985–87 1.1 0.00 N.S. 2.8 1.80 N.S. 0.4 0.00 N.S. 4.2 1.19 C 1.6 0.00 N.S.Alameda Co., CA–Federal–Lrg Contract # NS 10 1985–87 1.1 0.00 N.S. 2.9 3.30 N.S. 0.5 0.00 Under 4.5 2.13 C 1.7 0.00 N.S.Alameda Co., CA–Federal–Lrg Contract $ NS 5 1989–90 2.4 0.00 N.S. 4.4 0.00 N.S. 3.1 0.00 N.S. 9.9 0.00 C 4.9 0.00 N.S.Alameda Co., CA–Federal–Lrg Contract # NS 5 1989–90 2.4 0.00 N.S. 4.4 0.00 N.S. 2.8 0.00 N.S. 9.6 0.00 C 4.8 0.00 N.S.
Albuquerque, NM $ SM/WOBE 1,116 1989–93 0.4 0.02 Under 25.6 0.44 Under 0.4 1.11 N.S. 0.6 1.38 N.S. 27.0 0.46 Under 5.1 0.38 UnderAlbuquerque, NM $ SM/WOBE—Empl. 1,116 1989–93 0.3 0.02 N.S. 23.6 0.48 Under 0.2 1.97 N.S. 0.4 2.08 Over 24.4 0.51 Under 3.5 0.56 UnderAlbuquerque, NM $ Survey—Interest 1,116 1989–93 0.0 NA NA 21.1 0.53 Under 0.4 1.01 N.S. 1.7 0.44 Under 23.3 0.53 Under 9.8 0.20 UnderAlbuquerque, NM $ Survey—Attempt 1,116 1989–93 0.0 NA NA 20.9 0.54 Under 0.4 1.10 N.S. 1.4 0.55 N.S. 22.7 0.55 Under 9.4 0.21 UnderAlbuquerque, NM $ Registered 1,116 1989–93 1.3 0.01 Under 16.9 0.66 Under 0.6 0.78 N.S. 3.5 0.22 Under 22.3 0.56 Under 9.9 0.20 Under
Albuquerque, NM $ SM/WOBE 473 1994–95 0.4 0.57 N.S. 25.6 0.35 Under 0.4 0.01 N.S. 0.6 2.72 Over 27.0 0.39 Under 5.1 0.39 UnderAlbuquerque, NM $ SM/WOBE—Empl. 473 1994–95 0.3 0.85 N.S. 23.6 0.38 Under 0.2 0.02 N.S. 0.4 4.09 Over 24.4 0.43 Under 3.5 0.58 N.S.Albuquerque, NM $ Survey—Interest 473 1994–95 0.0 NA NA 21.1 0.42 Under 0.4 0.01 N.S. 1.7 0.87 N.S. 23.3 0.46 Under 9.8 0.21 UnderAlbuquerque, NM $ Survey—Attempt 473 1994–95 0.0 NA NA 20.9 0.42 Under 0.4 0.01 N.S. 1.4 1.09 N.S. 22.7 0.47 Under 9.4 0.21 UnderAlbuquerque, NM $ Registered 473 1994–95 1.3 0.20 N.S. 16.9 0.53 Under 0.6 0.01 N.S. 3.5 0.42 Under 22.3 0.48 Under 9.9 0.20 Under
Asheville, NC $ SM/WOBE 153 1985–92 2.3 0.15 Under 0.3 0.53 N.S. 0.2 1.52 N.S. 2.8 0.28 C 5.2 0.03 Under
Boston–Exec Off of Envir Affairs $ SM/WOBE—Empl. 226 1977–81 0.6 0.67 NCBoston–Massport Authority $ SM/WOBE—Empl. NS 1969–78 0.6 0.04 NC 1.4 0.43 NC
Chicago–City $ Bidders list 197 1989 44.5 0.24 NC 6.6 0.21 NCChicago–City $ Bidders list 197 1989 44.5 0.64 NCChicago–City # Bidders list 197 1989 44.5 0.81 NC 6.6 0.70 NC
Cincinnati–All Bidders # Cert./Registered 1058 1990–91 6.2 0.98 N.S. 0.9 4.43 Over 0.9 2.38 Over 0.1 0.81 N.S.Cincinnati–All Bidders # Registered 1058 1990–91 26.0 0.54 Under 1.3 0.07 UnderCincinnati–CMSA # Cert./Registered 881 1990–91 6.4 1.04 N.S. 0.8 5.80 Over 1.0 2.39 Over 0.1 1.41 N.S.Cincinnati–CMSA # Registered 881 1990–91 26.2 0.56 Under 1.2 0.07 Under
Continued
Table A.3a. Evidence of Disparity in the Construction Industry
AFRICAN NATIVEBACKGROUND AMERICANS LATINOS ASIANS AMERICANS ALL MINORITIES WOMEN
# of Disp. Stat. Disp. Stat. Disp. Stat. Disp. Stat. Disp. Stat. Disp. Stat.Source Contracts Year Avail. Ratio Sig. Avail. Ratio Sig. Avail. Ratio Sig. Avail. Ratio Sig. Avail. Ratio Sig. Avail. Ratio Sig.

DO MINORITY-OWNED BUSINESSES GET A FAIR SHARE OF GOVERNMENT CONTRACTS?82
THE URBANINSTITUTE
Colu
mbu
s, O
H $
Mai
ling
list
NS
1990
–91
23.7
0.30
Unde
r10
.90.
23Un
der
Colu
mbu
s, O
H $
SM/W
OBE
NS
1990
–91
3.0
2.33
Over
4.8
0.52
Unde
r
Colu
mbu
s, O
H $
SM/W
OBE
155
1991
2.3
4.08
Over
0.5
0.67
N.S
.0.
30.
54N
.S.
3.1
3.17
Over
4.5
0.41
N.S
.Co
lum
bus,
OH
$SM
/WOB
E—Em
pl.
155
1991
3.8
2.47
Over
0.6
0.59
N.S
.0.
30.
51N
.S.
4.7
2.10
Over
5.0
0.36
N.S
.Co
lum
bus,
OH
$Su
rvey
—In
tere
st15
519
912.
53.
79Ov
er0.
31.
31N
.S.
0.4
0.00
N.S
.0.
50.
33N
.S.
3.5
2.77
Over
11.3
0.16
Unde
rCo
lum
bus,
OH
$Re
gist
ered
155
1991
11.2
0.83
N.S
.0.
70.
48N
.S.
3.0
0.00
Unde
r0.
70.
20N
.S.
16.0
0.61
Unde
r6.
00.
31Un
der
Colu
mbu
s, O
H $
SM/W
OBE
384
1992
2.3
0.62
N.S
.0.
50.
07N
.S.
0.3
4.11
Over
3.1
0.85
N.S
.4.
51.
49Ov
erCo
lum
bus,
OH
$SM
/WOB
E—Em
pl.
384
1992
3.8
0.37
Unde
r0.
60.
06N
.S.
0.3
3.92
Over
4.7
0.56
N.S
.5.
01.
33N
.S.
Colu
mbu
s, O
H $
Surv
ey—
Inte
rest
384
1992
2.5
0.57
N.S
.0.
30.
13N
.S.
0.4
0.16
N.S
.0.
52.
38N
.S.
3.5
0.74
N.S
.11
.30.
59Un
der
Colu
mbu
s, O
H $
Regi
ster
ed38
419
9211
.20.
13Un
der
0.7
0.05
N.S
.3.
00.
02Un
der
0.7
1.45
N.S
.16
.00.
16Un
der
6.0
1.12
N.S
.
Colu
mbu
s, O
H $
SM/W
OBE
108
1993
2.3
0.60
N.S
.0.
51.
44N
.S.
0.3
NC
NC
3.1
0.70
N.S
.4.
50.
61N
.S.
Colu
mbu
s, O
H $
SM/W
OBE—
Empl
.10
819
933.
80.
37N
.S.
0.6
1.28
N.S
.0.
3N
CN
C4.
70.
46N
.S.
5.0
0.55
N.S
.Co
lum
bus,
OH
$Su
rvey
—In
tere
st10
819
932.
50.
56N
.S.
0.3
2.83
N.S
.0.
4N
CN
C0.
50.
00N
.S.
3.5
0.61
N.S
.11
.30.
24Un
der
Colu
mbu
s, O
H $
Regi
ster
ed10
819
9311
.20.
12Un
der
0.7
1.03
N.S
.3.
0N
CN
C0.
70.
00N
.S.
16.0
0.13
Unde
r6.
00.
46N
.S.
Cont
ra C
osta
Co.
, CA–
Smal
l Con
tract
$SM
/WOB
E—Em
pl.
1235
1987
–88
1.4
0.11
Unde
r3.
70.
51Un
der
2.3
0.42
Unde
r7.
40.
41C
4.9
0.18
Unde
rCo
ntra
Cos
ta C
o., C
A–Sm
all C
ontra
ct #
SM/W
OBE—
Empl
.12
3519
87–8
81.
70.
14Un
der
1.1
0.29
Unde
r3.
50.
23Un
der
6.3
0.22
C5.
20.
29Un
der
Cont
ra C
osta
Co.
, CA–
Fed–
Lrg
Cont
ract
$SM
/WOB
E—Em
pl.
4819
89–9
01.
60.
00N
.S.
2.9
1.96
N.S
.1.
00.
00N
.S.
5.5
1.02
C5.
80.
00N
.S.
Cont
ra C
osta
Co.
, CA–
Fed–
Lrg
Cont
ract
#SM
/WOB
E—Em
pl.
4819
89–9
01.
70.
00N
.S.
4.1
4.05
N.S
.2.
10.
00N
.S.
8.0
2.10
C7.
70.
00N
.S.
Cont
ra C
osta
Co.
, CA–
Non
fed–
Lrg
Cont
$SM
/WOB
E—Em
pl.
7619
89–9
02.
50.
00N
.S.
5.2
0.05
N.S
.5.
91.
19N
.S.
13.6
0.54
C8.
40.
00N
.S.
Cont
ra C
osta
Co.
, CA–
Non
fed–
Lrg
Cont
#SM
/WOB
E—Em
pl.
7619
89–9
02.
40.
00N
.S.
4.6
1.22
N.S
.3.
71.
52N
.S.
10.6
1.04
C7.
40.
00N
.S.
Dade
Cou
nty,
FL–
Proc
urem
ent #
Regi
ster
ed33
1989
–91
13.0
2.08
NC
24.0
0.71
NC
1.0
0.00
NC
38.0
1.16
C9.
20.
18N
CDa
de C
ount
y, F
L–Pr
ocur
emen
t $Re
gist
ered
3319
89–9
113
.04.
83N
C24
.00.
21N
C1.
00.
00N
C38
.01.
79C
9.2
0.11
NC
Dade
Cou
nty,
FL–
Non
proc
urem
ent #
Regi
ster
ed48
1989
–91
13.0
0.48
NC
24.0
1.48
NC
1.0
0.00
NC
38.0
1.10
C9.
20.
00N
CDa
de C
ount
y, F
L–N
onpr
ocur
emen
t $Re
gist
ered
4819
89–9
113
.00.
02N
C24
.00.
53N
C1.
00.
00N
C38
.00.
34C
9.2
0.00
NC
Dalla
s–Ci
ty $
Vend
ors
list
NS
1990
–93
9.4
1.43
Over
3.7
2.62
Over
0.8
0.78
Unde
r0.
20.
75N
.S.
14.2
1.69
Over
1.9
2.91
Over
Dalla
s–PM
SA $
Vend
ors
list
NS
1990
–93
6.5
1.60
Over
4.5
2.05
Over
1.4
0.34
Unde
r0.
80.
36Un
der
13.1
1.55
Over
3.3
1.76
Over
Dalla
s/Fo
rt W
orth
Airp
ort $
SM/W
OBE
NS
1987
8.3
0.08
NC
5.4
0.07
NC
Dalla
s/Fo
rt W
orth
Airp
ort $
Surv
ey—
Inte
rest
NS
1987
12.4
0.06
NC
13.8
0.03
NC
Dalla
s/Fo
rt W
orth
Airp
ort $
Mai
ling
list
NS
1987
22.5
0.03
NC
9.1
0.01
NC
Dalla
s/Fo
rt W
orth
Airp
ort $
SM/W
OBE
106
1986
–87
2.2
2.05
NC
5.3
0.00
NC
0.7
0.00
NC
0.0
0.00
NC
8.3
0.58
NC
5.4
1.05
NC
Dalla
s/Fo
rt W
orth
Airp
ort $
Surv
ey—
Inte
rest
106
1986
–87
1.9
2.50
NC
6.5
0.00
NC
0.8
0.00
NC
2.9
0.00
NC
12.4
0.39
NC
13.8
0.41
NC
Dalla
s/Fo
rt W
orth
Airp
ort $
Mai
ling
list
106
1986
–87
10.6
0.44
NC
7.2
0.00
NC
1.4
0.00
NC
0.4
0.00
NC
22.5
0.21
NC
9.1
0.62
NC
Tabl
e A
.3a.
Evi
den
ce o
f D
isp
arit
y in
th
e C
onst
ruct
ion
In
du
stry
(C
onti
nu
ed)
AFRI
CAN
NAT
IVE
BACK
GROU
ND
AMER
ICAN
SLA
TIN
OSAS
IAN
SAM
ERIC
ANS
ALL
MIN
ORIT
IES
WOM
EN
# of
Di
sp.
Stat
.Di
sp.
Stat
.Di
sp.
Stat
.Di
sp.
Stat
.Di
sp.
Stat
.Di
sp.
Stat
.So
urce
Cont
ract
sYe
arAv
ail.
Ratio
Sig.
Avai
l.Ra
tioSi
g.Av
ail.
Ratio
Sig.
Avai
l.Ra
tioSi
g.Av
ail.
Ratio
Sig.
Avai
l.Ra
tioSi
g.
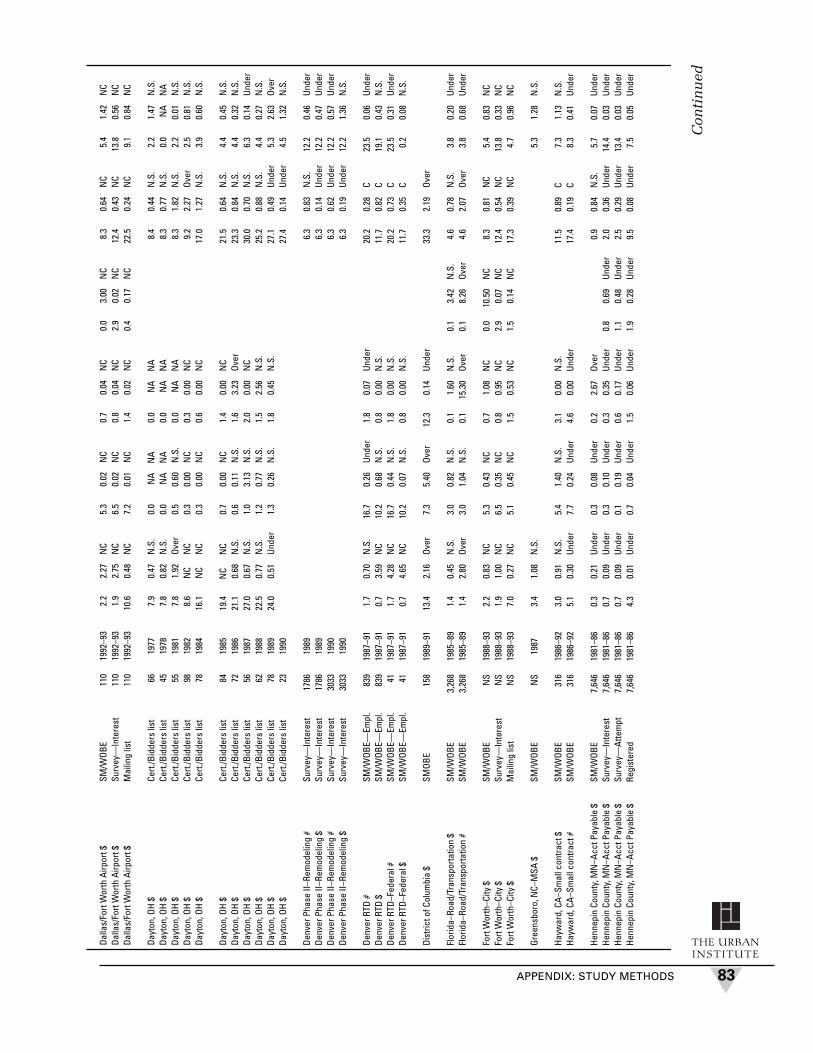
APPENDIX: STUDY METHODS
THE URBANINSTITUTE
83
Con
tin
ued
Dalla
s/Fo
rt W
orth
Airp
ort $
SM/W
OBE
110
1992
–93
2.2
2.27
NC
5.3
0.02
NC
0.7
0.04
NC
0.0
3.00
NC
8.3
0.64
NC
5.4
1.42
NC
Dalla
s/Fo
rt W
orth
Airp
ort $
Surv
ey—
Inte
rest
110
1992
–93
1.9
2.75
NC
6.5
0.02
NC
0.8
0.04
NC
2.9
0.02
NC
12.4
0.43
NC
13.8
0.56
NC
Dalla
s/Fo
rt W
orth
Airp
ort $
Mai
ling
list
110
1992
–93
10.6
0.48
NC
7.2
0.01
NC
1.4
0.02
NC
0.4
0.17
NC
22.5
0.24
NC
9.1
0.84
NC
Dayt
on, O
H $
Cert.
/Bid
ders
list
6619
777.
90.
47N
.S.
0.0
NA
NA
0.0
NA
NA
8.4
0.44
N.S
.2.
21.
47N
.S.
Dayt
on, O
H $
Cert.
/Bid
ders
list
4519
787.
80.
82N
.S.
0.0
NA
NA
0.0
NA
NA
8.3
0.77
N.S
.0.
0N
AN
ADa
yton
, OH
$Ce
rt./B
idde
rs li
st55
1981
7.8
1.92
Over
0.5
0.60
N.S
.0.
0N
AN
A8.
31.
82N
.S.
2.2
0.01
N.S
.Da
yton
, OH
$Ce
rt./B
idde
rs li
st98
1982
8.6
NC
NC
0.3
0.00
NC
0.3
0.00
NC
9.2
2.27
Over
2.5
0.81
N.S
.Da
yton
, OH
$Ce
rt./B
idde
rs li
st78
1984
16.1
NC
NC
0.3
0.00
NC
0.6
0.00
NC
17.0
1.27
N.S
.3.
90.
60N
.S.
Dayt
on, O
H $
Cert.
/Bid
ders
list
8419
8519
.4N
CN
C0.
70.
00N
C1.
40.
00N
C21
.50.
64N
.S.
4.4
0.45
N.S
.Da
yton
, OH
$Ce
rt./B
idde
rs li
st72
1986
21.1
0.68
N.S
.0.
60.
11N
.S.
1.6
3.23
Over
23.3
0.84
N.S
.4.
40.
32N
.S.
Dayt
on, O
H $
Cert.
/Bid
ders
list
5619
8727
.00.
67N
.S.
1.0
3.13
N.S
.2.
00.
00N
C30
.00.
70N
.S.
6.3
0.14
Unde
rDa
yton
, OH
$Ce
rt./B
idde
rs li
st62
1988
22.5
0.77
N.S
.1.
20.
77N
.S.
1.5
2.56
N.S
.25
.20.
88N
.S.
4.4
0.27
N.S
.Da
yton
, OH
$Ce
rt./B
idde
rs li
st78
1989
24.0
0.51
Unde
r1.
30.
26N
.S.
1.8
0.45
N.S
.27
.10.
49Un
der
5.3
2.63
Over
Dayt
on, O
H $
Cert.
/Bid
ders
list
2319
9027
.40.
14Un
der
4.5
1.32
N.S
.
Denv
er P
hase
II–R
emod
elin
g #
Surv
ey—
Inte
rest
1786
1989
6.3
0.83
N.S
.12
.20.
46Un
der
Denv
er P
hase
II–R
emod
elin
g $
Surv
ey—
Inte
rest
1786
1989
6.3
0.14
Unde
r12
.20.
47Un
der
Denv
er P
hase
II–R
emod
elin
g #
Surv
ey—
Inte
rest
3033
1990
6.3
0.62
Unde
r12
.20.
57Un
der
Denv
er P
hase
II–R
emod
elin
g $
Surv
ey—
Inte
rest
3033
1990
6.3
0.19
Unde
r12
.21.
36N
.S.
Denv
er R
TD #
SM/W
OBE—
Empl
.83
919
87–9
11.
70.
70N
.S.
16.7
0.26
Unde
r1.
80.
07Un
der
20.2
0.28
C23
.50.
06Un
der
Denv
er R
TD $
SM/W
OBE—
Empl
.83
919
87–9
10.
73.
59N
C10
.20.
68N
.S.
0.8
0.00
N.S
.11
.70.
82C
19.1
0.43
N.S
.De
nver
RTD
–Fed
eral
#SM
/WOB
E—Em
pl.
4119
87–9
11.
74.
28N
C16
.70.
44N
.S.
1.8
0.00
N.S
.20
.20.
73C
23.5
0.31
Unde
rDe
nver
RTD
–Fed
eral
$SM
/WOB
E—Em
pl.
4119
87–9
10.
74.
65N
C10
.20.
07N
.S.
0.8
0.00
N.S
.11
.70.
35C
0.2
0.08
N.S
.
Dist
rict o
f Col
umbi
a $
SMOB
E15
819
89–9
113
.42.
16Ov
er7.
35.
40Ov
er12
.30.
14Un
der
33.3
2.19
Over
Flor
ida–
Road
/Tra
nspo
rtatio
n $
SM/W
OBE
3,26
819
85–8
91.
40.
45N
.S.
3.0
0.82
N.S
.0.
11.
60N
.S.
0.1
3.42
N.S
.4.
60.
78N
.S.
3.8
0.20
Unde
rFl
orid
a–Ro
ad/T
rans
porta
tion
#SM
/WOB
E3,
268
1985
–89
1.4
2.80
Over
3.0
1.04
N.S
.0.
115
.30
Over
0.1
8.26
Over
4.6
2.07
Over
3.8
0.68
Unde
r
Fort
Wor
th–C
ity $
SM/W
OBE
NS
1988
–93
2.2
0.83
NC
5.3
0.43
NC
0.7
1.08
NC
0.0
10.5
0N
C8.
30.
81N
C5.
40.
83N
CFo
rt W
orth
–City
$Su
rvey
—In
tere
stN
S19
88–9
31.
91.
00N
C6.
50.
35N
C0.
80.
95N
C2.
90.
07N
C12
.40.
54N
C13
.80.
33N
CFo
rt W
orth
–City
$M
ailin
g lis
tN
S19
88–9
37.
00.
27N
C5.
10.
45N
C1.
50.
53N
C1.
50.
14N
C17
.30.
39N
C4.
70.
96N
C
Gree
nsbo
ro, N
C–M
SA $
SM/W
OBE
NS
1987
3.4
1.08
N.S
.5.
31.
28N
.S.
Hayw
ard,
CA–
Smal
l con
tract
$SM
/WOB
E31
619
86–9
23.
00.
91N
.S.
5.4
1.40
N.S
.3.
10.
00N
.S.
11.5
0.89
C7.
31.
13N
.S.
Hayw
ard,
CA–
Smal
l con
tract
#SM
/WOB
E31
619
86–9
25.
10.
30Un
der
7.7
0.24
Unde
r4.
60.
00Un
der
17.4
0.19
C8.
30.
41Un
der
Henn
epin
Cou
nty,
MN
–Acc
t Pay
able
$SM
/WOB
E7,
646
1981
–86
0.3
0.21
Unde
r0.
30.
08Un
der
0.2
2.67
Over
0.9
0.84
N.S
.5.
70.
07Un
der
Henn
epin
Cou
nty,
MN
–Acc
t Pay
able
$Su
rvey
—In
tere
st7,
646
1981
–86
0.7
0.09
Unde
r0.
30.
10Un
der
0.3
0.35
Unde
r0.
80.
69Un
der
2.0
0.36
Unde
r14
.40.
03Un
der
Henn
epin
Cou
nty,
MN
–Acc
t Pay
able
$Su
rvey
—At
tem
pt7,
646
1981
–86
0.7
0.09
Unde
r0.
10.
19Un
der
0.6
0.17
Unde
r1.
10.
48Un
der
2.5
0.29
Unde
r13
.40.
03Un
der
Henn
epin
Cou
nty,
MN
–Acc
t Pay
able
$Re
gist
ered
7,64
619
81–8
64.
30.
01Un
der
0.7
0.04
Unde
r1.
50.
06Un
der
1.9
0.28
Unde
r9.
50.
08Un
der
7.5
0.05
Unde
r

DO MINORITY-OWNED BUSINESSES GET A FAIR SHARE OF GOVERNMENT CONTRACTS?84
THE URBANINSTITUTE
Henn
epin
Cou
nty,
MN
–Acc
t Pay
able
$SM
/WOB
E3,
034
1987
–93
0.3
11.1
4Ov
er0.
30.
00Un
der
0.2
24.8
1Ov
er0.
910
.62
Over
5.7
0.18
Unde
rHe
nnep
in C
ount
y, M
N–A
cct P
ayab
le $
Surv
ey—
Inte
rest
3,03
419
87–9
30.
74.
85Ov
er0.
30.
00Un
der
0.3
22.3
7Ov
er0.
80.
01Un
der
2.0
4.61
Over
14.4
0.07
Unde
rHe
nnep
in C
ount
y, M
N–A
cct P
ayab
le $
Surv
ey—
Atte
mpt
3,03
419
87–9
30.
74.
87Ov
er0.
10.
00Un
der
0.6
10.5
3Ov
er1.
10.
01Un
der
2.5
3.70
Over
13.4
0.08
Unde
rHe
nnep
in C
ount
y, M
N–A
cct P
ayab
le $
Regi
ster
ed3,
034
1987
–93
4.3
0.79
Unde
r0.
70.
00Un
der
1.5
4.00
Over
1.9
0.00
Unde
r9.
50.
97N
.S.
7.5
0.14
Unde
r
Henn
epin
Cou
nty,
MN
–Prim
es&
Subs
$SM
/WOB
E31
1990
–91
0.3
18.2
9Ov
er0.
30.
00N
.S.
0.2
94.7
1Ov
er0.
932
.06
Over
5.7
0.03
N.S
.He
nnep
in C
ount
y, M
N–P
rimes
&Su
bs $
Surv
ey—
Inte
rest
3119
90–9
10.
77.
97Ov
er0.
30.
00N
.S.
0.3
85.5
2Ov
er0.
80.
00N
.S.
2.0
13.9
3Ov
er14
.40.
01Un
der
Henn
epin
Cou
nty,
MN
–Prim
es&
Subs
$Su
rvey
—At
tem
pt31
1990
–91
0.7
8.00
Over
0.1
0.00
N.S
.0.
640
.24
Over
1.1
0.00
N.S
.2.
511
.16
Over
13.4
0.01
Unde
rHe
nnep
in C
ount
y, M
N–P
rimes
&Su
bs $
Regi
ster
ed31
1990
–91
4.3
1.30
N.S
.0.
70.
00N
.S.
1.5
15.3
1Ov
er1.
90.
00N
.S.
9.5
2.94
Over
7.5
0.02
N.S
.
Henn
epin
Cou
nty,
MN
–Prim
es&
Subs
$SM
/WOB
E11
419
92–9
40.
39.
37Ov
er0.
35.
50Ov
er0.
264
.23
Over
0.9
23.1
5Ov
er5.
70.
83N
.S.
Henn
epin
Cou
nty,
MN
–Prim
es&
Subs
$Su
rvey
—In
tere
st11
419
92–9
40.
74.
08Ov
er0.
36.
96Ov
er0.
356
.98
Over
0.8
0.34
N.S
.2.
010
.06
Over
14.4
0.33
Unde
rHe
nnep
in C
ount
y, M
N–P
rimes
&Su
bs $
Surv
ey—
Atte
mpt
114
1992
–94
0.7
4.09
Over
0.1
13.0
9Ov
er0.
626
.81
Over
1.1
0.24
N.S
.2.
58.
06Ov
er13
.40.
35Un
der
Henn
epin
Cou
nty,
MN
–Prim
es&
Subs
$Re
gist
ered
114
1992
–94
4.3
0.67
N.S
.0.
72.
49N
.S.
1.5
10.2
0Ov
er1.
90.
14N
.S.
9.5
2.12
Over
7.5
0.62
N.S
.
Hous
ton
$Ce
rt./B
idde
rs li
st13
719
87–9
35.
30.
60Un
der
7.8
0.96
N.S
.1.
31.
82N
.S.
0.2
1.96
N.S
.14
.60.
92C
4.1
0.95
N.S
.
Jack
sonv
ille–
City
$Ce
rt./B
idde
rs li
stN
S19
8616
.80.
07Un
der
0.8
0.00
NC
1.0
0.00
NC
18.6
0.06
C5.
30.
23Un
der
Jack
sonv
ille–
City
$Ce
rt./B
idde
rs li
stN
S19
8715
.70.
08Un
der
0.7
0.00
NC
0.9
0.00
NC
17.3
0.07
C4.
92.
27N
.S.
Jack
sonv
ille–
City
$Ce
rt./B
idde
rs li
stN
S19
8813
.80.
10Un
der
0.6
0.01
N.S
.0.
80.
00N
C15
.20.
09C
4.3
0.16
Unde
rJa
ckso
nvill
e–Ci
ty $
Cert.
/Bid
ders
list
NS
1989
13.2
0.13
Unde
r0.
60.
17N
.S.
0.8
0.00
NC
14.6
0.12
C4.
10.
02Un
der
Jack
sonv
ille–
Elec
tric
Auth
ority
$Ce
rt./B
idde
rs li
stN
S19
8628
.00.
00N
C1.
30.
00N
C1.
60.
00N
C30
.90.
00C
8.8
0.01
Unde
rJa
ckso
nvill
e–El
ectri
c Au
thor
ity $
Cert.
/Bid
ders
list
NS
1987
23.4
0.00
NC
1.1
0.00
NC
1.4
0.00
NC
25.9
0.00
C7.
30.
00N
CJa
ckso
nvill
e–El
ectri
c Au
thor
ity $
Cert.
/Bid
ders
list
NS
1988
26.6
0.00
NC
1.2
0.00
NC
1.6
0.00
NC
29.4
0.00
C8.
40.
93N
.S.
Jack
sonv
ille–
Elec
tric
Auth
ority
$Ce
rt./B
idde
rs li
stN
S19
8935
.10.
00N
C1.
60.
00N
C2.
00.
00N
C38
.70.
00C
11.0
0.00
NC
Jack
sonv
ille–
Port
Auth
ority
$Ce
rt./B
idde
rs li
stN
S19
8634
.80.
00N
C12
.40.
00N
C1.
11.
01N
.S.
48.3
0.02
C20
.20.
19N
.S.
Jack
sonv
ille–
Port
Auth
ority
$Ce
rt./B
idde
rs li
stN
S19
8724
.40.
08Un
der
8.7
0.03
Unde
r0.
87.
14N
.S.
33.9
0.23
C14
.20.
29N
.S.
Jack
sonv
ille–
Port
Auth
ority
$Ce
rt./B
idde
rs li
stN
S19
8820
.40.
48N
.S.
7.2
0.35
N.S
.0.
716
.67
N.S
.28
.30.
85C
11.8
0.48
N.S
.Ja
ckso
nvill
e–Po
rt Au
thor
ity $
Cert.
/Bid
ders
list
NS
1989
17.8
0.15
Unde
r6.
30.
59N
.S.
0.6
0.00
NC
24.7
0.26
C10
.30.
43N
.S.
Jack
sonv
ille–
Scho
ol B
oard
$Ce
rt./B
idde
rs li
stN
S19
8632
.20.
01Un
der
1.8
0.00
NC
2.5
0.58
N.S
.36
.50.
05C
11.5
1.61
N.S
.Ja
ckso
nvill
e–Sc
hool
Boa
rd $
Cert.
/Bid
ders
list
NS
1987
26.1
0.08
Unde
r1.
40.
91N
.S.
2.0
0.00
NC
29.5
0.11
C9.
42.
08N
.S.
Jack
sonv
ille–
Scho
ol B
oard
$Ce
rt./B
idde
rs li
stN
S19
8816
.80.
04Un
der
0.9
1.05
N.S
.1.
31.
79N
.S.
19.0
0.21
C6.
00.
70N
.S.
Jack
sonv
ille–
Scho
ol B
oard
$Ce
rt./B
idde
rs li
stN
S19
8926
.80.
02Un
der
1.5
0.00
NC
2.0
0.13
N.S
.30
.30.
03C
9.6
0.01
Unde
r
Jeffe
rson
Cou
nty,
AL
#SM
/WOB
EN
S19
86–9
05.
715
.46
Over
0.2
0.00
Unde
r0.
10.
00Un
der
6.0
14.6
8C
6.0
0.00
Unde
r
Tabl
e A
.3a.
Evi
den
ce o
f D
isp
arit
y in
th
e C
onst
ruct
ion
In
du
stry
(C
onti
nu
ed)
AFRI
CAN
NAT
IVE
BACK
GROU
ND
AMER
ICAN
SLA
TIN
OSAS
IAN
SAM
ERIC
ANS
ALL
MIN
ORIT
IES
WOM
EN
# of
Disp
.St
at.
Disp
.St
at.
Disp
.St
at.
Disp
.St
at.
Disp
.St
at.
Disp
.St
at.
Sour
ceCo
ntra
cts
Year
Avai
l.Ra
tioSi
g.Av
ail.
Ratio
Sig.
Avai
l.Ra
tioSi
g.Av
ail.
Ratio
Sig.
Avai
l.Ra
tioSi
g.Av
ail.
Ratio
Sig.
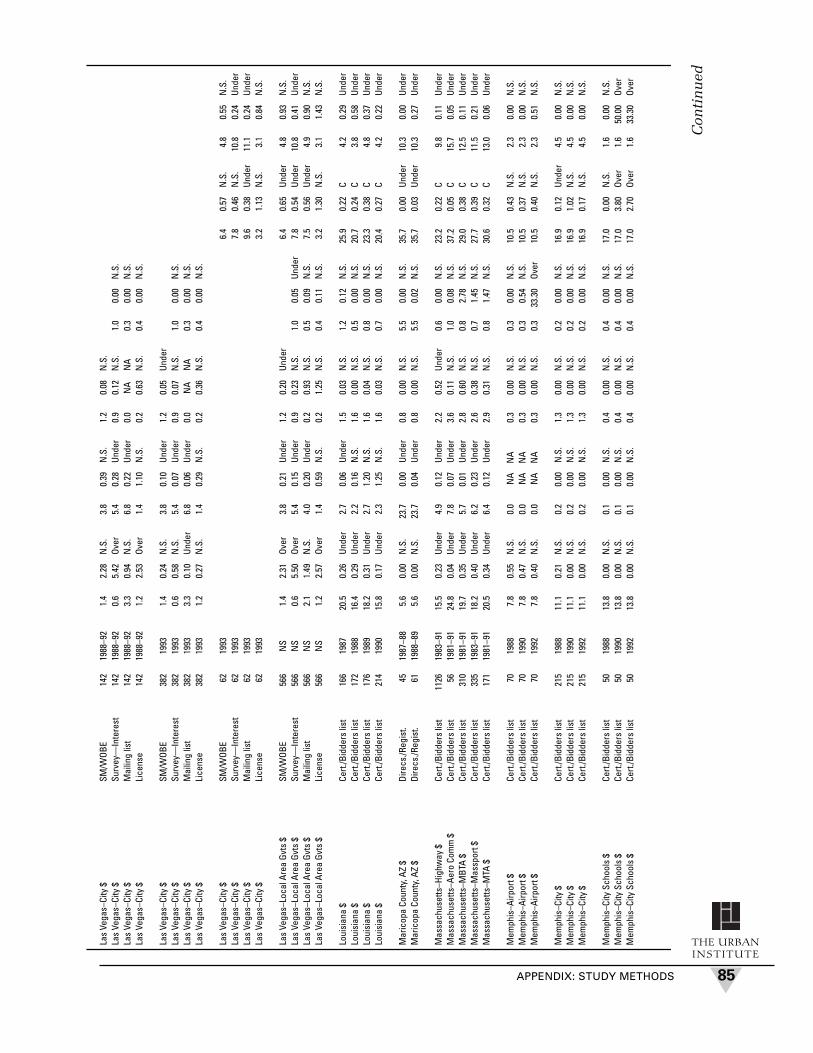
APPENDIX: STUDY METHODS
THE URBANINSTITUTE
85
Con
tin
ued
Las
Vega
s–Ci
ty $
SM/W
OBE
142
1988
–92
1.4
2.28
N.S
.3.
80.
39N
.S.
1.2
0.08
N.S
.La
s Ve
gas–
City
$Su
rvey
—In
tere
st14
219
88–9
20.
65.
42Ov
er5.
40.
28Un
der
0.9
0.12
N.S
.1.
00.
00N
.S.
Las
Vega
s–Ci
ty $
Mai
ling
list
142
1988
–92
3.3
0.94
N.S
.6.
80.
22Un
der
0.0
NA
NA
0.3
0.00
N.S
.La
s Ve
gas–
City
$Li
cens
e14
219
88–9
21.
22.
53Ov
er1.
41.
10N
.S.
0.2
0.63
N.S
.0.
40.
00N
.S.
Las
Vega
s–Ci
ty $
SM/W
OBE
382
1993
1.4
0.24
N.S
.3.
80.
10Un
der
1.2
0.05
Unde
rLa
s Ve
gas–
City
$Su
rvey
—In
tere
st38
219
930.
60.
58N
.S.
5.4
0.07
Unde
r0.
90.
07N
.S.
1.0
0.00
N.S
.La
s Ve
gas–
City
$M
ailin
g lis
t38
219
933.
30.
10Un
der
6.8
0.06
Unde
r0.
0N
AN
A0.
30.
00N
.S.
Las
Vega
s–Ci
ty $
Lice
nse
382
1993
1.2
0.27
N.S
.1.
40.
29N
.S.
0.2
0.36
N.S
.0.
40.
00N
.S.
Las
Vega
s–Ci
ty $
SM/W
OBE
6219
936.
40.
57N
.S.
4.8
0.55
N.S
.La
s Ve
gas–
City
$Su
rvey
—In
tere
st62
1993
7.8
0.46
N.S
.10
.80.
24Un
der
Las
Vega
s–Ci
ty $
Mai
ling
list
6219
939.
60.
38Un
der
11.1
0.24
Unde
rLa
s Ve
gas–
City
$Li
cens
e62
1993
3.2
1.13
N.S
.3.
10.
84N
.S.
Las
Vega
s–Lo
cal A
rea
Gvts
$SM
/WOB
E56
6N
S1.
42.
31Ov
er3.
80.
21Un
der
1.2
0.20
Unde
r6.
40.
65Un
der
4.8
0.93
N.S
.La
s Ve
gas–
Loca
l Are
a Gv
ts $
Surv
ey—
Inte
rest
566
NS
0.6
5.50
Over
5.4
0.15
Unde
r0.
90.
23N
.S.
1.0
0.05
Unde
r7.
80.
54Un
der
10.8
0.41
Unde
rLa
s Ve
gas–
Loca
l Are
a Gv
ts $
Mai
ling
list
566
NS
2.1
1.49
N.S
.4.
00.
20Un
der
0.2
0.93
N.S
.0.
50.
09N
.S.
7.5
0.56
Unde
r4.
90.
90N
.S.
Las
Vega
s–Lo
cal A
rea
Gvts
$Li
cens
e56
6N
S1.
22.
57Ov
er1.
40.
59N
.S.
0.2
1.25
N.S
.0.
40.
11N
.S.
3.2
1.30
N.S
.3.
11.
43N
.S.
Loui
sian
a $
Cert.
/Bid
ders
list
166
1987
20.5
0.26
Unde
r2.
70.
06Un
der
1.5
0.03
N.S
.1.
20.
12N
.S.
25.9
0.22
C4.
20.
29Un
der
Loui
sian
a $
Cert.
/Bid
ders
list
172
1988
16.4
0.29
Unde
r2.
20.
16N
.S.
1.6
0.00
N.S
.0.
50.
00N
.S.
20.7
0.24
C3.
80.
58Un
der
Loui
sian
a $
Cert.
/Bid
ders
list
176
1989
18.2
0.31
Unde
r2.
71.
20N
.S.
1.6
0.04
N.S
.0.
80.
00N
.S.
23.3
0.38
C4.
80.
37Un
der
Loui
sian
a $
Cert.
/Bid
ders
list
214
1990
15.8
0.17
Unde
r2.
31.
25N
.S.
1.6
0.03
N.S
.0.
70.
00N
.S.
20.4
0.27
C4.
20.
22Un
der
Mar
icop
a Co
unty
, AZ
$Di
recs
./Reg
ist.
4519
87–8
85.
60.
00N
.S.
23.7
0.00
Unde
r0.
80.
00N
.S.
5.5
0.00
N.S
.35
.70.
00Un
der
10.3
0.00
Unde
rM
aric
opa
Coun
ty, A
Z $
Dire
cs./R
egis
t.61
1988
–89
5.6
0.00
N.S
.23
.70.
04Un
der
0.8
0.00
N.S
.5.
50.
02N
.S.
35.7
0.03
Unde
r10
.30.
27Un
der
Mas
sach
uset
ts–H
ighw
ay $
Cert.
/Bid
ders
list
1126
1983
–91
15.5
0.23
Unde
r4.
90.
12Un
der
2.2
0.52
Unde
r0.
60.
00N
.S.
23.2
0.22
C9.
80.
11Un
der
Mas
sach
uset
ts–A
ero
Com
m $
Cert.
/Bid
ders
list
5619
81–9
124
.80.
04Un
der
7.8
0.07
Unde
r3.
60.
11N
.S.
1.0
0.08
N.S
.37
.20.
05C
15.7
0.05
Unde
rM
assa
chus
etts
–MBT
A $
Cert.
/Bid
ders
list
310
1981
–91
19.7
0.35
Unde
r5.
70.
01Un
der
2.8
0.60
N.S
.0.
82.
78N
.S.
29.0
0.38
C12
.50.
11Un
der
Mas
sach
uset
ts–M
assp
ort $
Cert.
/Bid
ders
list
335
1983
–91
18.2
0.40
Unde
r6.
20.
23Un
der
2.6
0.38
N.S
.0.
71.
45N
.S.
27.7
0.39
C11
.50.
21Un
der
Mas
sach
uset
ts–M
TA $
Cert.
/Bid
ders
list
171
1981
–91
20.5
0.34
Unde
r6.
40.
12Un
der
2.9
0.31
N.S
.0.
81.
47N
.S.
30.6
0.32
C13
.00.
06Un
der
Mem
phis
–Airp
ort $
Cert.
/Bid
ders
list
7019
887.
80.
55N
.S.
0.0
NA
NA
0.3
0.00
N.S
.0.
30.
00N
.S.
10.5
0.43
N.S
.2.
30.
00N
.S.
Mem
phis
–Airp
ort $
Cert.
/Bid
ders
list
7019
907.
80.
47N
.S.
0.0
NA
NA
0.3
0.00
N.S
.0.
30.
54N
.S.
10.5
0.37
N.S
.2.
30.
00N
.S.
Mem
phis
–Airp
ort $
Cert.
/Bid
ders
list
7019
927.
80.
40N
.S.
0.0
NA
NA
0.3
0.00
N.S
.0.
333
.30
Over
10.5
0.40
N.S
.2.
30.
51N
.S.
Mem
phis
–City
$Ce
rt./B
idde
rs li
st21
519
8811
.10.
21N
.S.
0.2
0.00
N.S
.1.
30.
00N
.S.
0.2
0.00
N.S
.16
.90.
12Un
der
4.5
0.00
N.S
.M
emph
is–C
ity $
Cert.
/Bid
ders
list
215
1990
11.1
0.00
N.S
.0.
20.
00N
.S.
1.3
0.00
N.S
.0.
20.
00N
.S.
16.9
1.02
N.S
.4.
50.
00N
.S.
Mem
phis
–City
$Ce
rt./B
idde
rs li
st21
519
9211
.10.
00N
.S.
0.2
0.00
N.S
.1.
30.
00N
.S.
0.2
0.00
N.S
.16
.90.
17N
.S.
4.5
0.00
N.S
.
Mem
phis
–City
Sch
ools
$Ce
rt./B
idde
rs li
st50
1988
13.8
0.00
N.S
.0.
10.
00N
.S.
0.4
0.00
N.S
.0.
40.
00N
.S.
17.0
0.00
N.S
.1.
60.
00N
.S.
Mem
phis
–City
Sch
ools
$Ce
rt./B
idde
rs li
st50
1990
13.8
0.00
N.S
.0.
10.
00N
.S.
0.4
0.00
N.S
.0.
40.
00N
.S.
17.0
3.80
Over
1.6
50.0
0Ov
erM
emph
is–C
ity S
choo
ls $
Cert.
/Bid
ders
list
5019
9213
.80.
00N
.S.
0.1
0.00
N.S
.0.
40.
00N
.S.
0.4
0.00
N.S
.17
.02.
70Ov
er1.
633
.30
Over

DO MINORITY-OWNED BUSINESSES GET A FAIR SHARE OF GOVERNMENT CONTRACTS?86
THE URBANINSTITUTE
Mem
phis
–Gas
,Wat
er,L
ight
$Ce
rt./B
idde
rs li
st46
1988
11.7
0.00
N.S
.0.
30.
00N
.S.
0.5
0.00
N.S
.0.
50.
00N
.S.
17.6
0.00
N.S
.3.
10.
00N
.S.
Mem
phis
–Gas
,Wat
er,L
ight
$Ce
rt./B
idde
rs li
st46
1990
11.7
0.20
N.S
.0.
311
.10
N.S
.0.
50.
00N
.S.
0.5
0.36
N.S
.17
.60.
36N
.S.
3.1
0.19
N.S
.M
emph
is–G
as,W
ater
,Lig
ht $
Cert.
/Bid
ders
list
4619
9211
.70.
81N
.S.
0.3
0.00
N.S
.0.
50.
00N
.S.
0.5
0.02
N.S
.17
.60.
55N
.S.
3.1
0.00
N.S
.
Mem
phis
–She
lby
Coun
ty $
Cert.
/Bid
ders
list
136
1988
19.1
4.50
Over
0.0
NA
NA
0.0
NA
NA
0.0
NA
NA
19.1
4.50
Over
0.0
0.00
NA
Mem
phis
–She
lby
Coun
ty $
Cert.
/Bid
ders
list
136
1990
19.1
0.17
N.S
.0.
0N
AN
A0.
0N
AN
A0.
0N
AN
A19
.10.
21N
.S.
0.0
0.00
NA
Mem
phis
–She
lby
Coun
ty $
Cert.
/Bid
ders
list
136
1992
19.1
0.01
N.S
.0.
0N
AN
A0.
0N
AN
A0.
0N
AN
A19
.10.
67Un
der
0.0
0.00
NA
Milw
auke
e–Ci
ty $
SM/W
OBE
406
1990
2.9
0.00
Unde
r0.
60.
00N
.S.
0.4
1.13
N.S
.3.
90.
10C
10.4
0.10
Unde
rM
ilwau
kee–
Coun
ty $
SM/W
OBE
731
1987
3.2
0.13
Unde
r0.
70.
66N
.S.
0.4
1.19
N.S
.4.
30.
31C
11.4
0.09
Unde
rM
ilwau
kee–
Coun
ty $
SM/W
OBE
639
1990
2.9
0.02
Unde
r0.
60.
65N
.S.
0.4
0.93
N.S
.3.
90.
21C
10.4
0.07
Unde
rM
ilwau
kee–
Publ
ic S
choo
ls $
SM/W
OBE
246
1990
2.9
0.02
N.S
.0.
62.
30N
.S.
0.4
0.03
N.S
.3.
90.
39C
10.4
0.20
N.S
.
Min
neap
olis
$SM
/WOB
E16
919
90–9
10.
30.
00Un
der
0.3
0.00
Unde
r0.
20.
00Un
der
0.9
0.00
Unde
r5.
70.
18Un
der
Min
neap
olis
$SM
/WOB
E—Em
pl.
169
1990
–91
0.2
0.00
Unde
r0.
20.
00Un
der
0.1
0.00
Unde
r0.
60.
00Un
der
7.2
0.15
Unde
rM
inne
apol
is $
Surv
ey—
Inte
rest
169
1990
–91
0.7
0.00
Unde
r0.
30.
00Un
der
0.3
0.00
Unde
r0.
80.
00Un
der
2.0
0.00
Unde
r14
.40.
07Un
der
Min
neap
olis
$Su
rvey
—At
tem
pt16
919
90–9
10.
80.
00Un
der
0.1
0.00
Unde
r0.
60.
00Un
der
1.1
0.00
Unde
r2.
60.
00Un
der
13.5
0.08
Unde
rM
inne
apol
is $
Regi
ster
ed16
919
90–9
10.
90.
00Un
der
0.2
0.00
Unde
r0.
70.
00Un
der
0.3
0.00
Unde
r2.
40.
00Un
der
3.7
0.28
Unde
r
Min
neap
olis
$SM
/WOB
E2,
089
1992
–94
0.3
0.44
N.S
.0.
30.
18Un
der
0.2
7.97
Over
0.9
2.82
Over
5.7
0.48
Unde
rM
inne
apol
is $
SM/W
OBE—
Empl
.2,
089
1992
–94
0.2
0.62
N.S
.0.
20.
30N
.S.
0.1
13.5
8Ov
er0.
64.
47Ov
er7.
20.
37Un
der
Min
neap
olis
$Su
rvey
—In
tere
st2,
089
1992
–94
0.7
0.19
Unde
r0.
30.
23N
.S.
0.3
7.25
Over
0.8
0.00
Unde
r2.
01.
24N
.S.
14.4
0.19
Unde
rM
inne
apol
is $
Surv
ey—
Atte
mpt
2,08
919
92–9
40.
80.
16Un
der
0.1
0.43
N.S
.0.
63.
41Ov
er1.
10.
00Un
der
2.6
0.94
N.S
.13
.50.
20Un
der
Min
neap
olis
$Re
gist
ered
2,08
919
92–9
40.
90.
14Un
der
0.2
0.28
N.S
.0.
72.
66Ov
er0.
30.
00Un
der
2.4
1.03
N.S
.3.
70.
73Un
der
Min
neap
olis
–Lar
ge C
ontra
ct $
SM/W
OBE
125
1990
–91
0.3
5.43
Over
0.3
3.36
N.S
.0.
238
.43
Over
0.9
13.5
9Ov
er5.
71.
53N
.S.
Min
neap
olis
–Lar
ge C
ontra
ct $
SM/W
OBE—
Empl
.12
519
90–9
10.
27.
70Ov
er0.
25.
63Ov
er0.
165
.45
Over
0.6
21.5
1Ov
er7.
21.
20N
.S.
Min
neap
olis
–Lar
ge C
ontra
ct $
Surv
ey—
Inte
rest
125
1990
–91
0.7
2.38
N.S
.0.
34.
28N
.S.
0.3
8.01
Over
0.8
8.97
Over
2.0
5.94
Over
14.4
0.60
N.S
.M
inne
apol
is–L
arge
Con
tract
$Su
rvey
—At
tem
pt12
519
90–9
10.
81.
99N
.S.
0.1
8.05
Over
0.6
3.77
Over
1.1
6.32
Over
2.6
4.51
Over
13.5
0.64
N.S
.M
inne
apol
is–L
arge
Con
tract
$Re
gist
ered
125
1990
–91
0.9
1.79
N.S
.0.
25.
12Ov
er0.
72.
95N
.S.
0.3
21.4
4Ov
er2.
44.
95Ov
er3.
72.
35Ov
er
Min
neap
olis
–Lar
ge C
ontra
ct $
SM/W
OBE
249
1992
–94
0.3
2.48
N.S
.0.
30.
04N
.S.
0.2
15.9
5Ov
er0.
95.
75Ov
er5.
71.
96Ov
erM
inne
apol
is–L
arge
Con
tract
$SM
/WOB
E—Em
pl.
249
1992
–94
0.2
3.52
N.S
.0.
20.
06N
.S.
0.1
27.1
7Ov
er0.
69.
10Ov
er7.
21.
54Ov
erM
inne
apol
is–L
arge
Con
tract
$Su
rvey
—In
tere
st24
919
92–9
40.
71.
09N
.S.
0.3
0.05
N.S
.0.
31.
32N
.S.
0.8
4.40
Over
2.0
2.52
Over
14.4
0.77
N.S
.M
inne
apol
is–L
arge
Con
tract
$Su
rvey
—At
tem
pt24
919
92–9
40.
80.
91N
.S.
0.1
0.09
N.S
.0.
60.
62N
.S.
1.1
3.10
Over
2.6
1.91
Over
13.5
0.82
N.S
.M
inne
apol
is–L
arge
Con
tract
$Re
gist
ered
249
1992
–94
0.9
0.82
N.S
.0.
20.
06N
.S.
0.7
0.48
N.S
.0.
310
.50
Over
2.4
2.10
Over
3.7
3.01
Over
Min
neap
olis
Com
m D
evel
Age
ncy
$SM
/WOB
E59
1990
–91
0.3
0.00
N.S
.0.
30.
00N
.S.
0.2
0.00
N.S
.0.
90.
00N
.S.
5.7
0.00
N.S
.M
inne
apol
is C
omm
Dev
el A
genc
y $
SM/W
OBE—
Empl
.59
1990
–91
0.2
0.00
N.S
.0.
20.
00N
.S.
0.2
0.00
N.S
.0.
60.
00N
.S.
7.5
0.00
Unde
rM
inne
apol
is C
omm
Dev
el A
genc
y $
Surv
ey—
Inte
rest
5919
90–9
10.
80.
00N
.S.
0.3
0.00
N.S
.0.
30.
00N
.S.
0.8
0.00
N.S
.2.
10.
00N
.S.
14.0
0.00
Unde
rM
inne
apol
is C
omm
Dev
el A
genc
y $
Surv
ey—
Atte
mpt
5919
90–9
10.
90.
00N
.S.
0.2
0.00
N.S
.0.
60.
00N
.S.
1.1
0.00
N.S
.2.
80.
00N
.S.
13.4
0.00
Unde
r
Tabl
e A
.3a.
Evi
den
ce o
f D
isp
arit
y in
th
e C
onst
ruct
ion
In
du
stry
(C
onti
nu
ed)
AFRI
CAN
NAT
IVE
BACK
GROU
ND
AMER
ICAN
SLA
TIN
OSAS
IAN
SAM
ERIC
ANS
ALL
MIN
ORIT
IES
WOM
EN
# of
Disp
.St
at.
Disp
.St
at.
Disp
.St
at.
Disp
.St
at.
Disp
.St
at.
Disp
.St
at.
Sour
ceCo
ntra
cts
Year
Avai
l.Ra
tioSi
g.Av
ail.
Ratio
Sig.
Avai
l.Ra
tioSi
g.Av
ail.
Ratio
Sig.
Avai
l.Ra
tioSi
g.Av
ail.
Ratio
Sig.

APPENDIX: STUDY METHODS
THE URBANINSTITUTE
87
Con
tin
ued
Min
neap
olis
Com
m D
evel
Age
ncy
$SM
/WOB
E11
919
92–9
40.
30.
00N
.S.
0.3
0.00
N.S
.0.
20.
01N
.S.
0.9
0.00
N.S
.5.
70.
07Un
der
Min
neap
olis
Com
m D
evel
Age
ncy
$SM
/WOB
E—Em
pl.
119
1992
–94
0.2
0.00
N.S
.0.
20.
00N
.S.
0.2
0.02
N.S
.0.
60.
00N
.S.
7.5
0.05
Unde
rM
inne
apol
is C
omm
Dev
el A
genc
y $
Surv
ey—
Inte
rest
119
1992
–94
0.8
0.00
N.S
.0.
30.
00N
.S.
0.3
0.01
N.S
.0.
80.
00N
.S.
2.1
0.00
N.S
.14
.00.
03Un
der
Min
neap
olis
Com
m D
evel
Age
ncy
$Su
rvey
—At
tem
pt11
919
92–9
40.
90.
00N
.S.
0.2
0.00
N.S
.0.
60.
00N
.S.
1.1
0.00
N.S
.2.
80.
00N
.S.
13.4
0.03
Unde
r
New
Mex
ico–
Fede
ral $
SM/W
OBE
1630
1990
–94
0.1
0.39
N.S
.9.
51.
22Ov
er0.
92.
67Ov
er1.
50.
81N
.S.
12.0
1.27
Over
5.1
0.18
Unde
rN
ew M
exic
o–Fe
dera
l $Su
rvey
—In
tere
st16
3019
90–9
40.
30.
13Un
der
20.4
0.57
Unde
r0.
64.
32Ov
er3.
20.
36Un
der
24.5
0.62
Unde
r5.
90.
16Un
der
New
Mex
ico–
Fede
ral $
Surv
ey—
Atte
mpt
1630
1990
–94
0.1
0.53
N.S
.22
.70.
51Un
der
1.1
2.12
Over
1.2
0.97
N.S
.25
.10.
60Un
der
3.8
0.27
Unde
r
New
Mex
ico–
Stat
e $
SM/W
OBE
814
1990
–94
0.1
1.83
N.S
.8.
11.
10N
.S.
0.9
2.44
Over
1.4
0.77
N.S
.10
.51.
17N
.S.
5.2
0.23
Unde
rN
ew M
exic
o–St
ate
$Su
rvey
—In
tere
st81
419
90–9
40.
30.
38N
.S.
19.6
0.45
Unde
r0.
63.
66Ov
er3.
30.
33Un
der
23.8
0.51
Unde
r5.
70.
20Un
der
New
Mex
ico–
Stat
e $
Surv
ey—
Atte
mpt
814
1990
–94
0.1
2.47
N.S
.22
.00.
40Un
der
1.2
1.74
Over
1.0
1.07
N.S
.24
.30.
50Un
der
3.4
0.32
Unde
r
New
Orle
ans
$SM
/WOB
E—Em
pl.
342
1986
–89
10.4
0.02
N.S
.2.
00.
08N
.S.
0.1
1.52
NC
12.5
0.03
N.S
.9.
60.
27N
.S.
New
Orle
ans
$SM
/WOB
E—Em
pl.
1,28
519
89–9
217
.20.
10Un
der
2.2
0.10
N.S
.0.
10.
14N
.S.
19.5
0.10
Unde
r16
.40.
17Un
der
New
Yor
k Ci
ty $
SM/W
OBE—
Empl
.28
6819
89–9
03.
90.
17Un
der
2.3
1.09
N.S
.6.
30.
14Un
der
12.5
0.32
C12
.80.
21Un
der
New
Yor
k Ci
ty #
SM/W
OBE—
Empl
.28
6819
89–9
05.
51.
16Ov
er3.
40.
57Un
der
6.9
0.36
Unde
r15
.80.
68C
13.0
0.40
Unde
rN
ew Y
ork
City
–Lar
ge C
ontra
cts
$SM
/WOB
E—Em
pl.
2090
1989
–90
3.9
0.16
Unde
r2.
31.
09N
.S.
6.3
0.14
Unde
r12
.50.
32C
12.8
0.21
Unde
rN
ew Y
ork
City
–Lar
ge C
ontra
cts
#SM
/WOB
E—Em
pl.
2090
1989
–90
5.5
0.61
Unde
r3.
40.
64Un
der
6.9
0.37
Unde
r15
.80.
51C
13.0
0.41
Unde
r
NYC
Hou
sing
$SM
/WOB
E—Em
pl.
2,54
019
88–9
26.
00.
49Un
der
3.7
0.64
N.S
.5.
00.
39Un
der
0.7
0.04
N.S
.15
.40.
47Un
der
12.6
0.30
Unde
rN
YC H
ousi
ng #
SM/W
OBE—
Empl
.2,
540
1988
–92
5.9
0.97
N.S
.3.
71.
33N
C5.
10.
93N
.S.
0.7
0.23
Unde
r15
.31.
01N
.S.
13.0
0.50
Unde
rN
YC H
ousi
ng–S
mal
l Con
tract
s $
SM/W
OBE—
Empl
.1,
640
1988
–92
5.7
0.42
Unde
r3.
63.
73N
C5.
90.
79N
.S.
0.8
0.00
Unde
r16
.11.
28N
C11
.90.
22Un
der
NYC
Hou
sing
–Sm
all C
ontra
cts
#SM
/WOB
E—Em
pl.
1,64
019
88–9
25.
60.
79Un
der
3.4
4.07
NC
5.8
1.50
NC
0.9
0.00
Unde
r15
.71.
72N
C11
.80.
24Un
der
New
Yor
k St
ate
$Bi
dder
s lis
tN
SFY
90–9
16.
80.
49Un
der
3.6
0.46
Unde
r1.
90.
59Un
der
0.7
2.46
Over
13.0
0.61
Unde
r9.
70.
39Un
der
Oakl
and–
Scho
ols
$Su
rvey
—In
tere
st19
0419
91–9
219
.10.
07Un
der
8.8
0.18
N.S
.4.
50.
04N
.S.
0.9
0.00
N.S
.33
.30.
09C
9.2
0.17
N.S
.Oa
klan
d–Sc
hool
s $
Surv
ey—
Inte
rest
2661
1992
–93
19.1
0.08
Unde
r8.
80.
30N
.S.
4.5
0.01
N.S
.0.
90.
00N
.S.
33.3
0.13
C9.
20.
16N
.S.
Oakl
and–
Scho
ols
$Su
rvey
—In
tere
st45
6519
91–9
319
.10.
07Un
der
8.8
0.25
Unde
r4.
50.
02Un
der
0.9
0.00
N.S
.33
.30.
11C
9.2
0.17
Unde
r
Oran
ge C
ount
y, F
L $
Cert.
/Bid
ders
list
5419
888.
70.
22N
.S.
3.1
3.29
N.S
.N
S0.
27N
.S.
NS
0.17
N.S
.4.
30.
33N
.S.
Oran
ge C
ount
y, F
L $
Cert.
/Bid
ders
list
6419
898.
70.
82N
.S.
3.1
2.06
N.S
.N
S0.
03N
.S.
NS
0.61
N.S
.4.
32.
65N
.S.
Oran
ge C
ount
y, F
L $
Cert.
/Bid
ders
list
7619
908.
70.
66N
.S.
3.1
2.81
N.S
.N
S0.
13N
.S.
NS
0.00
Unde
r4.
30.
40N
.S.
Oran
ge C
ount
y, F
L $
Cert.
/Bid
ders
list
5019
918.
70.
39N
.S.
3.1
2.03
N.S
.N
S1.
25N
.S.
NS
0.00
Unde
r4.
31.
23N
.S.
Oran
ge C
ount
y, F
L $
Cert.
/Bid
ders
list
9419
928.
70.
85N
.S.
3.1
3.13
N.S
.N
S0.
15N
.S.
NS
0.00
Unde
r4.
30.
93N
.S.
Oran
ge C
ount
y, F
L–Av
iatio
n Au
thor
ity $
Cert.
/Bid
ders
list
919
8721
.90.
82N
.S.
7.7
0.24
N.S
.N
S0.
16N
.S.
NS
0.00
Unde
r10
.70.
07N
.S.
Oran
ge C
ount
y, F
L–Av
iatio
n Au
thor
ity $
Cert.
/Bid
ders
list
919
8821
.90.
17N
.S.
7.7
1.48
N.S
.N
S0.
01N
.S.
NS
1.16
N.S
.10
.70.
68N
.S.
Oran
ge C
ount
y, F
L–Av
iatio
n Au
thor
ity $
Cert.
/Bid
ders
list
1819
8921
.90.
06N
.S.
7.7
0.05
N.S
.N
S1.
19N
.S.
NS
2.56
N.S
.10
.70.
24N
.S.
Oran
ge C
ount
y, F
L–Av
iatio
n Au
thor
ity $
Cert.
/Bid
ders
list
1519
9021
.90.
14N
.S.
7.7
0.56
N.S
.N
S0.
00Un
der
NS
0.00
Unde
r10
.71.
16N
.S.
Oran
ge C
ount
y, F
L–Av
iatio
n Au
thor
ity $
Cert.
/Bid
ders
list
4119
9121
.90.
06N
.S.
7.7
0.27
N.S
.N
S1.
61N
.S.
NS
0.30
N.S
.10
.70.
87N
.S.
Oran
ge C
ount
y, F
L–Av
iatio
n Au
thor
ity $
Cert.
/Bid
ders
list
3219
9221
.90.
05N
.S.
7.7
0.62
N.S
.N
S0.
00Un
der
NS
0.00
Unde
r10
.70.
86N
.S.

DO MINORITY-OWNED BUSINESSES GET A FAIR SHARE OF GOVERNMENT CONTRACTS?88
THE URBANINSTITUTE
Oran
ge C
o., F
L–Va
lenc
ia C
omm
Col
l $Ce
rt./B
idde
rs li
st19
1990
26.2
0.00
Unde
r9.
30.
00Un
der
NS
0.00
Unde
rN
S0.
00Un
der
12.8
0.00
Unde
rOr
ange
Co.
, FL–
Vale
ncia
Com
m C
oll $
Cert.
/Bid
ders
list
2319
9126
.20.
00Un
der
9.3
0.00
Unde
rN
S0.
00Un
der
NS
0.00
Unde
r12
.80.
00N
.S.
Oran
ge C
o., F
L–Va
lenc
ia C
omm
Col
l $Ce
rt./B
idde
rs li
st38
1992
26.2
0.00
Unde
r9.
30.
00Un
der
NS
0.00
Unde
rN
S0.
00Un
der
12.8
6.61
N.S
.
Oran
ge C
ount
y, F
L–Pu
blic
Sch
ools
$Ce
rt./B
idde
rs li
st23
1990
14.0
0.00
Unde
r4.
90.
06N
.S.
NS
0.00
Unde
rN
S0.
00Un
der
6.8
0.00
Unde
rOr
ange
Cou
nty,
FL–
Publ
ic S
choo
ls $
Cert.
/Bid
ders
list
8019
9114
.00.
01N
.S.
4.9
0.00
N.S
.N
S0.
00Un
der
NS
0.00
Unde
r6.
80.
00N
.S.
Oran
ge C
ount
y, F
L–Pu
blic
Sch
ools
$Ce
rt./B
idde
rs li
st10
319
9214
.00.
02N
.S.
4.9
0.05
N.S
.N
S0.
00Un
der
NS
0.09
Unde
r6.
80.
09N
.S.
Penn
sylv
ania
(SEP
TA)–
Lrg
Cont
r $SM
/WOB
E—Em
pl.
253
1988
–92
3.1
0.01
Unde
r0.
40.
00N
.S.
0.2
25.5
7N
C3.
81.
66N
C8.
80.
68N
.S.
Penn
sylv
ania
(SEP
TA)–
Lrg
Cont
r #SM
/WOB
E—Em
pl.
253
1988
–92
4.0
0.01
Unde
r0.
50.
00N
.S.
0.4
0.92
N.S
.5.
00.
16Un
der
9.0
1.30
N.S
.Pe
nnsy
lvan
ia (S
EPTA
)–Sm
l Con
tr $
SM/W
OBE—
Empl
.52
219
88–9
25.
81.
14N
C0.
80.
00N
.S.
0.7
0.00
N.S
.7.
30.
90N
.S.
9.7
1.30
NC
Penn
sylv
ania
(SEP
TA)–
Sml C
ontr
#SM
/WOB
E—Em
pl.
522
1988
–92
6.5
0.44
Unde
r0.
80.
23N
.S.
0.8
0.00
Unde
r8.
10.
38Un
der
10.0
0.81
N.S
.
Phoe
nix–
Men
$Re
gist
ered
2,30
2FY
87–9
32.
80.
07Un
der
5.8
0.15
Unde
r1.
30.
00Un
der
1.2
0.22
Unde
r12
.90.
12Un
der
Phoe
nix–
Wom
en $
Regi
ster
ed2,
302
FY87
–93
0.3
0.00
Unde
r1.
30.
00Un
der
0.0
NA
NA
0.0
NA
NA
2.0
0.01
Unde
r12
.40.
17Un
der
Phoe
nix–
Men
$Su
rvey
—In
tere
st2,
302
FY87
–93
0.4
0.53
N.S
.3.
50.
25Un
der
0.2
0.00
Unde
r0.
90.
27Un
der
5.0
0.32
Unde
rPh
oeni
x–W
omen
$Su
rvey
—In
tere
st2,
302
FY87
–93
0.1
0.00
N.S
.0.
90.
00Un
der
0.1
0.00
N.S
.0.
40.
00Un
der
1.6
0.01
Unde
r12
.60.
17Un
der
Phoe
nix–
Men
$M
ailin
g lis
t2,
302
FY87
–93
3.7
0.05
Unde
r3.
40.
26Un
der
0.5
0.00
Unde
r0.
70.
37Un
der
12.2
0.13
Unde
rPh
oeni
x–W
omen
$M
ailin
g lis
t2,
302
FY87
–93
0.3
0.00
Unde
r0.
90.
00Un
der
0.1
0.00
N.S
.0.
0N
AN
A2.
60.
00Un
der
10.3
0.21
Unde
rPh
oeni
x–M
en a
nd W
omen
$SM
/WOB
E2,
302
FY87
–93
0.5
0.41
N.S
.4.
10.
21Un
der
5.0
0.32
Unde
r5.
60.
39Un
der
Pim
a Co
unty
, AZ
$SM
/WOB
E95
1992
–94
0.4
0.00
N.S
.8.
40.
41Un
der
0.7
0.00
N.S
.9.
50.
37Un
der
5.3
2.28
NC
Pim
a Co
unty
, AZ
$Su
rvey
—In
tere
st95
1992
–94
0.4
0.00
N.S
.12
.40.
28Un
der
1.0
0.00
Unde
r0.
70.
00N
.S.
14.5
0.24
Unde
r9.
91.
21N
CPi
ma
Coun
ty, A
Z $
Mai
ling
list
9519
92–9
41.
20.
00Un
der
7.4
0.47
N.S
.0.
90.
00N
.S.
0.3
0.00
N.S
.9.
90.
35Un
der
9.5
1.27
NC
Pim
a Co
unty
, AZ
$Li
cens
e95
1992
–94
0.2
0.00
N.S
.5.
00.
70N
.S.
0.3
0.00
N.S
.0.
40.
00N
.S.
5.8
0.60
Unde
r4.
22.
86N
C
Port
Auth
ority
NY/
NJ
$Bi
d/Ve
nd1,
192
1988
–92
7.7
0.23
NC
3.6
0.10
NC
2.5
0.28
NC
0.2
3.55
NC
14.0
0.26
NC
2.4
0.22
NC
Port
Auth
ority
NY/
NJ
# Bi
d/Ve
nd1,
192
1988
–92
7.7
0.82
NC
3.6
0.76
NC
2.5
0.50
NC
0.2
0.40
NC
14.0
0.74
NC
2.4
0.70
NC
Port
Auth
ority
NY/
NJ
$Bi
d at
tem
pts
1,19
219
88–9
26.
00.
30N
C2.
90.
13N
C2.
80.
25N
C0.
18.
88N
C11
.80.
30N
C2.
30.
23N
CPo
rt Au
thor
ity N
Y/N
J #
Bid
atte
mpt
s1,
192
1988
–92
6.0
1.05
NC
2.9
0.93
NC
2.8
0.45
NC
0.1
1.00
NC
11.8
0.87
NC
2.3
0.72
NC
Port
Auth
ority
NY/
NJ–
SBE
Prog
$Bi
d at
tem
pts
7019
90–9
217
.01.
80N
C8.
61.
06N
C4.
11.
38N
C29
.51.
50N
C6.
40.
51N
CPo
rt Au
thor
ity N
Y/N
J–SB
E Pr
og #
Bid
atte
mpt
s70
1990
–92
17.0
1.68
NC
8.6
1.50
NC
4.1
1.05
NC
29.5
1.55
NC
6.4
0.45
NC
Ram
sey
Coun
ty, M
N–A
cct P
ayab
le $
SM/W
OBE
4,51
519
85–8
90.
30.
40Un
der
0.3
0.08
Unde
r0.
27.
99Ov
er0.
92.
73Ov
er5.
70.
28Un
der
Ram
sey
Coun
ty, M
N–A
cct P
ayab
le $
Surv
ey—
Inte
rest
4,51
519
85–8
90.
70.
17Un
der
0.3
0.10
Unde
r0.
30.
99N
.S.
0.8
2.08
Over
2.2
1.09
N.S
.14
.40.
11Un
der
Ram
sey
Coun
ty, M
N–A
cct P
ayab
le $
Surv
ey—
Atte
mpt
4,51
519
85–8
90.
70.
17Un
der
0.1
0.20
Unde
r0.
60.
47Un
der
1.1
1.47
Over
2.6
0.90
N.S
.13
.40.
12Un
der
Ram
sey
Coun
ty, M
N–A
cct P
ayab
le $
Regi
ster
ed4,
515
1985
–89
1.8
0.07
Unde
r0.
50.
05Un
der
1.3
0.20
Unde
r0.
62.
91Ov
er4.
80.
49Un
der
7.9
0.20
Unde
r
Ram
sey
Coun
ty, M
N–A
cct P
ayab
le $
SM/W
OBE
4,73
319
90–9
40.
30.
18Un
der
0.3
0.22
Unde
r0.
21.
68Ov
er0.
90.
60Un
der
5.7
0.59
Unde
rRa
mse
y Co
unty
, MN
–Acc
t Pay
able
$Su
rvey
—In
tere
st4,
733
1990
–94
0.7
0.08
Unde
r0.
30.
27Un
der
0.3
0.28
Unde
r0.
80.
41Un
der
2.2
0.24
Unde
r14
.40.
23Un
der
Ram
sey
Coun
ty, M
N–A
cct P
ayab
le $
Surv
ey—
Atte
mpt
4,73
319
90–9
40.
70.
08Un
der
0.1
0.51
N.S
.0.
60.
13Un
der
1.1
0.29
Unde
r2.
60.
20Un
der
13.4
0.25
Unde
rRa
mse
y Co
unty
, MN
–Acc
t Pay
able
$Re
gist
ered
4,73
319
90–9
41.
80.
03Un
der
0.5
0.14
Unde
r1.
30.
06Un
der
0.6
0.58
Unde
r4.
80.
11Un
der
7.9
0.42
Unde
r
Tabl
e A
.3a.
Evi
den
ce o
f D
isp
arit
y in
th
e C
onst
ruct
ion
In
du
stry
(C
onti
nu
ed)
AFRI
CAN
NAT
IVE
BACK
GROU
ND
AMER
ICAN
SLA
TIN
OSAS
IAN
SAM
ERIC
ANS
ALL
MIN
ORIT
IES
WOM
EN
# of
Disp
.St
at.
Disp
.St
at.
Disp
.St
at.
Disp
.St
at.
Disp
.St
at.
Disp
.St
at.
Sour
ceCo
ntra
cts
Year
Avai
l.Ra
tioSi
g.Av
ail.
Ratio
Sig.
Avai
l.Ra
tioSi
g.Av
ail.
Ratio
Sig.
Avai
l.Ra
tioSi
g.Av
ail.
Ratio
Sig.

APPENDIX: STUDY METHODS
THE URBANINSTITUTE
89
Con
tin
ued
Ram
sey
Coun
ty, M
N–P
rimes
& S
ubs
$SM
/WOB
E15
119
91–9
40.
31.
30N
.S.
0.3
0.25
N.S
.0.
23.
28N
.S.
0.9
1.44
N.S
.5.
71.
62N
.S.
Ram
sey
Coun
ty, M
N–P
rimes
& S
ubs
$Su
rvey
—In
tere
st15
119
91–9
40.
70.
57N
.S.
0.3
0.32
N.S
.0.
30.
05N
.S.
0.8
0.97
N.S
.2.
20.
58N
.S.
14.4
0.64
N.S
.Ra
mse
y Co
unty
, MN
–Prim
es &
Sub
s $
Surv
ey—
Atte
mpt
151
1991
–94
0.7
0.57
N.S
.0.
10.
60N
.S.
0.6
0.02
N.S
.1.
10.
68N
.S.
2.6
0.47
N.S
.13
.40.
68N
.S.
Ram
sey
Coun
ty, M
N–P
rimes
& S
ubs
$Re
gist
ered
151
1991
–94
1.8
0.23
N.S
.0.
50.
16N
.S.
1.3
0.01
N.S
.0.
61.
36N
.S.
4.8
0.26
Unde
r7.
91.
16N
.S.
Rich
mon
d, C
A $
Surv
ey—
Inte
rest
152
1990
–92
23.8
0.18
N.S
.11
.10.
54N
.S.
4.7
0.73
N.S
.1.
20.
08N
.S.
40.8
0.34
N.S
.10
.40.
09N
.S.
Sacr
amen
to $
Dire
cs./M
ailin
g lis
t47
1990
8.3
0.00
N.S
.18
.30.
00N
.S.
3.3
0.00
N.S
.1.
70.
00N
.S.
31.7
0.00
Unde
r16
.70.
00N
.S.
Sacr
amen
to $
Dire
cs./M
ailin
g lis
t51
1991
8.3
0.00
N.S
.18
.30.
00N
.S.
3.3
0.00
N.S
.1.
70.
00N
.S.
31.7
0.00
Unde
r16
.70.
06N
.S.
St. P
aul,
MN
$Re
gist
ered
401
1991
–94
1.8
0.77
N.S
.0.
50.
16N
.S.
1.3
0.15
N.S
.0.
61.
02N
.S.
4.8
0.45
Unde
r7.
90.
67N
.S.
St. P
aul,
MN
$Su
rvey
—In
tere
st40
119
91–9
40.
71.
93N
.S.
0.3
0.33
N.S
.0.
30.
72N
.S.
0.8
0.73
N.S
.2.
21.
01N
.S.
14.4
0.36
Unde
rSt
. Pau
l, M
N $
SM/W
OBE
401
1991
–94
0.3
4.42
Over
0.3
0.26
N.S
.0.
23.
22Ov
er0.
92.
51Ov
er5.
70.
93N
.S.
St. P
aul,
MN
–Sch
ool D
istri
ct 6
25 $
SM/W
OBE
178
1989
–91
0.3
0.21
N.S
.0.
35.
23Ov
er0.
21.
32N
.S.
0.9
3.13
Over
5.7
0.45
N.S
.St
. Pau
l, M
N–S
choo
l Dis
trict
625
$SM
/WOB
E—Em
pl.
178
1989
–91
0.2
0.32
N.S
.0.
28.
43Ov
er0.
12.
16N
.S.
0.6
4.92
Over
7.4
0.34
Unde
rSt
. Pau
l, M
N–S
choo
l Dis
trict
625
$Su
rvey
—In
tere
st17
819
89–9
10.
70.
09N
.S.
0.3
6.28
Over
0.3
0.73
N.S
.0.
70.
15N
.S.
2.2
1.24
N.S
.14
.90.
17Un
der
St. P
aul,
MN
–Sch
ool D
istri
ct 6
25 $
Surv
ey—
Atte
mpt
178
1989
–91
0.7
0.09
N.S
.0.
211
.66
Over
0.6
0.34
N.S
.1.
00.
11N
.S.
2.7
1.02
N.S
.13
.90.
18Un
der
St. P
aul,
MN
–Sch
ool D
istri
ct 6
25 $
SM/W
OBE
797
1992
–94
0.3
0.91
N.S
.0.
30.
88N
.S.
0.2
22.5
0Ov
er0.
96.
75Ov
er5.
71.
14N
.S.
St. P
aul,
MN
–Sch
ool D
istri
ct 6
25 $
SM/W
OBE—
Empl
.79
719
92–9
40.
21.
35N
.S.
0.2
1.42
N.S
.0.
136
.90
Over
0.6
10.6
1Ov
er7.
40.
87N
.S.
St. P
aul,
MN
–Sch
ool D
istri
ct 6
25 $
Surv
ey—
Inte
rest
797
1992
–94
0.7
0.38
N.S
.0.
31.
06N
.S.
0.3
18.9
3Ov
er0.
70.
13Un
der
2.2
2.67
Over
14.9
0.43
Unde
rSt
. Pau
l, M
N–S
choo
l Dis
trict
625
$Su
rvey
—At
tem
pt79
719
92–9
40.
70.
37N
.S.
0.2
1.96
N.S
.0.
68.
79Ov
er1.
00.
09Un
der
2.7
2.20
Over
13.9
0.46
Unde
r
St. P
eter
sbur
g, F
L $
Cert.
/Bid
ders
list
NS
1984
–85
15.3
0.06
Unde
r11
.70.
01Un
der
0.4
0.00
NC
0.4
0.00
NC
27.7
0.04
C13
.50.
01Un
der
St. P
eter
sbur
g, F
L $
Cert.
/Bid
ders
list
NS
1985
15.1
0.24
Unde
r 11
.60.
10Un
der
0.4
0.00
NC
0.4
0.00
NC
27.4
0.17
C13
.30.
08Un
der
St. P
eter
sbur
g, F
L $
Cert.
/Bid
ders
list
NS
1986
15.3
0.39
N.S
.11
.70.
18Un
der
0.4
0.00
NC
0.4
1.02
N.S
.27
.70.
31C
13.5
0.07
Unde
rSt
. Pet
ersb
urg,
FL
$Ce
rt./B
idde
rs li
stN
S19
8716
.10.
22Un
der
12.4
0.05
Unde
r0.
40.
00N
C0.
40.
00N
C29
.20.
14C
14.2
0.23
Unde
rSt
. Pet
ersb
urg,
FL
$Ce
rt./B
idde
rs li
stN
S19
8814
.50.
43N
.S.
11.2
0.14
Unde
r0.
30.
00N
C0.
30.
96N
.S.
26.4
0.31
C12
.80.
08Un
der
St. P
eter
sbur
g, F
L $
Cert.
/Bid
ders
list
NS
1989
18.6
0.27
Unde
r14
.30.
61N
.S.
0.4
0.00
NC
0.4
0.00
NC
33.8
0.41
C16
.50.
23Un
der
St. P
eter
sbur
g, F
L $
Cert.
/Bid
ders
list
NS
1990
18.6
0.00
Unde
r14
.30.
80N
.S.
0.4
0.00
NC
0.4
0.00
NC
33.8
0.34
C16
.50.
52N
.S.
San
Anto
nio–
Bexa
r Co.
–VIA
Met
ro T
rans
$Di
rect
orie
s27
1986
–90
1.7
0.00
N.S
.18
.10.
67N
.S.
1.1
0.00
N.S
.20
.90.
58C
9.3
2.75
N.S
.Sa
n An
toni
o–Be
xar C
o.–V
IA M
etro
Tra
ns #
Dire
ctor
ies
2719
86–9
01.
80.
00N
.S.
20.3
0.91
N.S
.1.
00.
00N
.S.
23.0
0.80
C10
.61.
05N
.S.
San
Anto
nio–
City
Wat
er B
oard
$Di
rect
orie
s60
1986
–90
1.6
0.00
N.S
.19
.30.
01Un
der
0.9
0.80
N.S
.21
.80.
04C
13.2
0.06
N.S
.Sa
n An
toni
o–Ci
ty W
ater
Boa
rd #
Dire
ctor
ies
6019
86–9
01.
50.
00N
.S.
19.8
0.08
Unde
r0.
91.
80N
.S.
22.3
0.15
C13
.50.
25Un
der
San
Anto
nio–
City
$Di
rect
orie
s49
919
86–8
71.
50.
00N
.S.
17.8
0.06
Unde
r1.
00.
00N
.S.
20.3
0.05
C12
.90.
32Un
der
San
Anto
nio–
City
#Di
rect
orie
s49
919
86–8
71.
50.
00Un
der
17.4
0.30
Unde
r1.
00.
00Un
der
19.9
0.26
C12
.00.
84N
.S.
San
Anto
nio–
City
$Di
rect
orie
s28
519
89–9
01.
60.
00N
.S.
18.1
0.26
Unde
r0.
90.
13N
.S.
20.6
0.23
C14
.30.
21Un
der
San
Anto
nio–
City
#Di
rect
orie
s28
519
89–9
01.
50.
00Un
der
17.8
0.81
N.S
.0.
91.
52N
.S.
20.2
0.78
C12
.60.
44Un
der
San
Jose
, CA–
Cons
truct
ion
$Ce
rt./B
idde
rs li
st18
419
87–8
94.
90.
08Un
der
17.9
0.11
N.S
.4.
60.
03N
.S.
0.1
0.00
N.S
.28
.80.
09Un
der
10.7
0.22
Unde
rSa
n Jo
se, C
A–Co
nstru
ctio
n #
Cert.
/Bid
ders
list
184
1987
–89
4.9
0.11
Unde
r17
.90.
51Un
der
4.6
0.46
Unde
r0.
10.
00N
.S.
28.8
0.43
Unde
r10
.70.
91N
.S.
Syra
cuse
, NY–
High
$Ce
rt./R
egis
tere
d82
219
82–9
08.
90.
92N
C1.
61.
69N
C1.
10.
18N
C1.
91.
16N
C12
.71.
17N
C6.
50.
42N
CSy
racu
se, N
Y–Lo
w $
Cert.
/Reg
iste
red
822
1982
–90
7.0
1.17
NC
1.3
2.08
NC
0.9
0.22
NC
1.4
1.57
NC
11.0
1.35
NC
5.7
0.47
NC

DO MINORITY-OWNED BUSINESSES GET A FAIR SHARE OF GOVERNMENT CONTRACTS?90
THE URBANINSTITUTE
Tam
pa $
Cert.
/Bid
ders
list
4719
863.
80.
67N
.S.
2.8
2.17
N.S
.1.
00.
00N
.S.
7.6
1.14
C3.
60.
04N
.S.
Tam
pa $
Cert.
/Reg
iste
red
4719
868.
10.
12Un
der
6.2
0.75
N.S
.2.
10.
00N
.S.
16.4
0.34
C4.
60.
02N
.S.
Tam
pa $
Cert.
/Bid
ders
list
7919
874.
21.
64N
.S.
2.9
2.38
N.S
.0.
60.
00N
.S.
7.7
1.79
C3.
90.
81N
.S.
Tam
pa $
Cert.
/Reg
iste
red
7919
879.
60.
71N
.S.
6.7
1.03
N.S
.1.
10.
00Un
der
17.4
0.79
C5.
60.
56N
.S.
Tam
pa $
Cert.
/Bid
ders
list
6319
885.
01.
54N
.S.
4.0
3.03
Over
0.7
0.37
N.S
.9.
72.
07C
4.1
0.24
N.S
.Ta
mpa
$Ce
rt./R
egis
tere
d63
1988
12.7
0.61
N.S
.11
.21.
10N
.S.
1.6
0.16
N.S
.25
.50.
80C
7.3
0.14
N.S
.
Tam
pa $
Cert.
/Bid
ders
list
2219
893.
70.
17N
.S.
4.1
1.59
N.S
.0.
50.
31N
.S.
8.3
0.88
C4.
30.
41N
.S.
Tam
pa $
Cert.
/Reg
iste
red
2219
898.
80.
07N
.S.
11.0
0.60
N.S
.0.
90.
17N
.S.
20.7
0.35
C7.
60.
23N
.S.
Tam
pa $
Cert.
/Bid
ders
list
6619
903.
70.
80N
.S.
4.1
1.85
N.S
.0.
50.
11N
.S.
8.2
1.28
C4.
30.
34N
.S.
Tam
pa $
Cert.
/Reg
iste
red
6619
908.
80.
34N
.S.
11.0
0.68
N.S
.0.
80.
06Un
der
20.7
0.51
C7.
60.
19Un
der
Tam
pa–E
xclu
ding
EPA
$Ce
rt./B
idde
rs li
st39
1986
3.8
0.93
N.S
.2.
81.
85N
.S.
1.0
0.00
N.S
.7.
61.
15C
3.6
0.06
N.S
.Ta
mpa
–Exc
ludi
ng E
PA $
Cert.
/Reg
iste
red
3919
868.
10.
17Un
der
6.2
0.64
N.S
.2.
10.
00N
.S.
16.4
0.33
C4.
60.
03N
.S.
Tam
pa–E
xclu
ding
EPA
$Ce
rt./B
idde
rs li
st78
1987
4.2
2.08
Over
2.9
2.78
N.S
.0.
60.
00N
.S.
7.7
2.18
C3.
91.
10N
.S.
Tam
pa–E
xclu
ding
EPA
$Ce
rt./R
egis
tere
d78
1987
9.6
0.90
N.S
.6.
71.
19N
.S.
1.1
0.00
N.S
.17
.40.
96C
5.6
0.77
N.S
.
Tam
pa–E
xclu
ding
EPA
$Ce
rt./B
idde
rs li
st54
1988
5.0
1.69
N.S
.4.
03.
57Ov
er0.
70.
46N
.S.
9.7
2.38
C4.
10.
28N
.S.
Tam
pa–E
xclu
ding
EPA
$Ce
rt./R
egis
tere
d54
1988
12.7
0.66
N.S
.11
.21.
28N
.S.
1.6
0.20
N.S
.25
.50.
91C
7.3
0.16
N.S
.
Tam
pa–E
xclu
ding
EPA
$Ce
rt./B
idde
rs li
st20
1989
3.7
0.74
N.S
.4.
12.
63N
.S.
0.5
0.00
N.S
.8.
31.
63C
4.3
1.20
N.S
.Ta
mpa
–Exc
ludi
ng E
PA $
Cert.
/Reg
iste
red
2019
898.
80.
31N
.S.
11.0
0.95
N.S
.0.
90.
00N
.S.
20.7
0.64
C7.
60.
68N
.S.
Tam
pa–E
xclu
ding
EPA
$Ce
rt./B
idde
rs li
st61
1990
3.7
0.50
N.S
.4.
11.
15N
.S.
0.5
0.19
N.S
.8.
30.
80C
4.3
0.54
N.S
.Ta
mpa
–Exc
ludi
ng E
PA $
Cert.
/Reg
iste
red
6119
908.
80.
21Un
der
11.0
0.43
N.S
.0.
90.
11Un
der
20.8
0.32
C7.
60.
31N
.S.
Texa
s $
SM/W
OBE—
Empl
.N
S9/
88–8
/91
1.5
0.01
N.S
.8.
20.
24N
.S.
0.2
0.48
N.S
.9.
90.
21N
.S.
5.6
0.89
N.S
.Te
xas
#SM
/WOB
E—Em
pl.
NS
9/88
–8/9
12.
50.
11Un
der
20.3
0.17
Unde
r1.
10.
26Un
der
23.8
0.16
Unde
r10
.50.
51Un
der
Texa
s $
SM/W
OBE—
Empl
.N
S9/
91–8
/93
1.6
0.03
N.S
.8.
40.
22Un
der
0.3
0.66
N.S
.10
.30.
21Un
der
5.7
0.99
N.S
.Te
xas
#SM
/WOB
E—Em
pl.
NS
9/91
–8/9
32.
50.
23Un
der
20.5
0.17
Unde
r1.
00.
23Un
der
24.0
0.18
Unde
r10
.50.
58Un
der
Tucs
on $
SM/W
OBE
361
1991
–94
0.4
0.38
N.S
.8.
41.
13N
.S.
0.7
0.93
N.S
.9.
51.
08N
.S.
5.3
1.14
N.S
.Tu
cson
$Su
rvey
—In
tere
st36
119
91–9
40.
40.
40N
.S.
12.4
0.77
N.S
.1.
00.
40N
.S.
0.7
0.36
N.S
.14
.50.
71N
.S.
9.9
0.61
N.S
.Tu
cson
$M
ailin
g lis
t36
119
91–9
40.
90.
19N
.S.
7.7
1.23
N.S
.1.
20.
31N
.S.
0.9
0.28
N.S
.10
.70.
96N
.S.
7.9
0.76
N.S
.Tu
cson
$Li
cens
e36
119
91–9
40.
21.
06N
.S.
5.0
1.92
N.S
.0.
31.
31N
.S.
0.4
0.59
N.S
.5.
81.
76N
.S.
4.2
0.69
N.S
.
Tabl
e A
.3a.
Evi
den
ce o
f D
isp
arit
y in
th
e C
onst
ruct
ion
In
du
stry
(C
onti
nu
ed)
AFRI
CAN
NAT
IVE
BACK
GROU
ND
AMER
ICAN
SLA
TIN
OSAS
IAN
SAM
ERIC
ANS
ALL
MIN
ORIT
IES
WOM
EN
# of
Disp
.St
at.
Disp
.St
at.
Disp
.St
at.
Disp
.St
at.
Disp
.St
at.
Disp
.St
at.
Sour
ceCo
ntra
cts
Year
Avai
l.Ra
tioSi
g.Av
ail.
Ratio
Sig.
Avai
l.Ra
tioSi
g.Av
ail.
Ratio
Sig.
Avai
l.Ra
tioSi
g.Av
ail.
Ratio
Sig.

APPENDIX: STUDY METHODS
THE URBANINSTITUTE
91
Con
tin
ued
SUB
CON
TRA
CTO
RS O
NLY
Alam
eda
Coun
ty, C
A–La
rge
Cont
ract
$N
S91
1985
–87
1.9
0.00
N.S
.4.
70.
46N
.S.
2.4
3.40
N.S
.9.
01.
15C
3.9
0.34
N.S
.Al
amed
a Co
unty
, CA–
Larg
e Co
ntra
ct #
NS
9119
85–8
71.
90.
00N
.S.
4.7
0.93
N.S
.2.
40.
89N
.S.
9.0
0.72
C4.
00.
81N
.S.
Alam
eda
Coun
ty, C
A–La
rge
Cont
ract
$N
S59
1989
–90
3.2
4.80
N.S
.5.
81.
30N
.S.
6.3
0.62
N.S
.15
.31.
75C
8.7
1.03
N.S
.Al
amed
a Co
unty
, CA–
Larg
e Co
ntra
ct #
NS
5919
89–9
04.
10.
80N
.S.
7.6
2.00
N.S
.6.
51.
04N
.S.
18.2
1.39
C9.
22.
03N
.S.
Alam
eda
Co.,
CA–F
eder
al–L
rg C
ontra
ct $
NS
2819
85–8
72.
01.
00N
.S.
5.1
1.30
N.S
.2.
40.
75N
.S.
9.5
1.10
C4.
01.
30N
.S.
Alam
eda
Co.,
CA–F
eder
al–L
rg C
ontra
ct #
NS
2819
85–8
71.
91.
80N
.S.
4.7
0.76
N.S
.2.
51.
40N
.S.
9.1
1.15
C3.
94.
50N
.S.
Alam
eda
Co.,
CA–F
eder
al–L
rg C
ontra
ct $
NS
819
89–9
04.
40.
00N
.S.
9.1
0.00
N.S
.11
.80.
91N
.S.
25.3
0.42
C13
.20.
15N
.S.
Alam
eda
Co.,
CA–F
eder
al–L
rg C
ontra
ct #
NS
819
89–9
04.
10.
00N
.S.
8.4
0.00
N.S
.10
.51.
18N
.S.
23.0
0.54
C12
.01.
03N
.S.
Cont
ra C
osta
Cou
nty,
CA–
Fede
ral $
SM/W
OBE—
Empl
.68
1985
–87
1.8
0.00
N.S
.4.
60.
29N
.S.
1.9
0.12
N.S
.8.
40.
19C
4.2
1.87
N.S
.Co
ntra
Cos
ta C
ount
y, C
A–Fe
dera
l #SM
/WOB
E—Em
pl.
6819
85–8
71.
60.
00N
.S.
4.3
1.02
N.S
.2.
10.
71N
.S.
8.0
0.73
C4.
24.
94N
.S.
Cont
ra C
osta
Cou
nty,
CA–
Fede
ral $
SM/W
OBE—
Empl
.36
1989
–90
2.6
4.21
N.S
.4.
80.
13N
.S.
3.9
5.23
N.S
.11
.32.
83C
7.8
2.94
N.S
.Co
ntra
Cos
ta C
ount
y, C
A–Fe
dera
l #SM
/WOB
E—Em
pl.
3619
89–9
02.
72.
03N
.S.
5.8
0.48
N.S
.4.
61.
20N
.S.
13.2
1.05
C9.
02.
16N
.S.
Cont
ra C
osta
Cou
nty,
CA–
Non
fede
ral $
SM/W
OBE—
Empl
.10
419
85–8
71.
70.
69N
.S.
4.6
0.12
N.S
.2.
13.
00N
.S.
8.4
0.96
C4.
60.
74N
.S.
Cont
ra C
osta
Cou
nty,
CA–
Non
fede
ral #
SM/W
OBE—
Empl
.10
419
85–8
71.
51.
28N
.S.
4.1
0.47
N.S
.2.
12.
78N
.S.
7.7
1.25
C4.
41.
53N
.S.
Cont
ra C
osta
Cou
nty,
CA–
Non
fede
ral $
SM/W
OBE—
Empl
.58
1989
–90
3.3
0.01
N.S
.6.
51.
14N
.S.
4.5
0.03
N.S
.14
.30.
53C
9.0
0.07
N.S
.Co
ntra
Cos
ta C
ount
y, C
A–N
onfe
dera
l #SM
/WOB
E—Em
pl.
5819
89–9
03.
10.
55N
.S.
6.4
0.81
N.S
.4.
60.
75N
.S.
14.1
0.73
C8.
90.
19N
.S.
Denv
er R
TD #
SM/W
OBE—
Empl
.12
519
87–9
11.
70.
00N
.S.
16.7
0.67
N.S
.1.
81.
37N
C20
.20.
67C
23.5
0.27
Unde
rDe
nver
RTD
$SM
/WOB
E—Em
pl.
125
1987
–91
0.7
0.00
N.S
.10
.21.
82N
C0.
81.
17N
C11
.71.
66C
19.1
0.41
N.S
.De
nver
RTD
–Con
stru
ctio
n Su
pplie
s #
SM/W
OBE—
Empl
.86
1987
–91
0.2
0.00
N.S
.0.
36.
84N
C0.
33.
52N
C0.
84.
20C
4.8
0.00
Unde
rDe
nver
RTD
–Con
stru
ctio
n Su
pplie
s $
SM/W
OBE—
Empl
.86
1987
–91
0.3
0.00
N.S
.1.
20.
01N
.S.
0.9
0.00
N.S
.2.
50.
01C
10.2
0.00
N.S
.
Flor
ida
Road
/Tra
nspo
rtatio
n $
SM/W
OBE
7,45
019
85–8
96.
31.
09N
.S.
16.1
0.70
Unde
r0.
71.
01N
.S.
0.3
14.8
6Ov
er23
.51.
01N
.S.
13.9
0.42
Unde
rFl
orid
a Ro
ad/T
rans
porta
tion
#SM
/WOB
E7,
450
1985
–89
6.3
1.52
Over
16.1
0.50
Unde
r0.
70.
67Un
der
0.3
13.3
2Ov
er23
.50.
96Un
der
13.9
1.11
Over
Las
Vega
s–Lo
cal A
rea
Gvts
$SM
/WOB
E52
7N
S1.
40.
00Un
der
3.8
0.39
Unde
r1.
20.
38N
.S.
6.4
0.30
Unde
r4.
81.
67Ov
erLa
s Ve
gas–
Loca
l Are
a Gv
ts $
Surv
ey—
Inte
rest
527
NS
0.6
0.00
N.S
.5.
40.
28Un
der
0.9
0.42
N.S
.1.
00.
09Un
der
7.8
0.25
Unde
r10
.80.
74Un
der
Las
Vega
s–Lo
cal A
rea
Gvts
$M
ailin
g lis
t52
7N
S3.
70.
00Un
der
4.4
0.34
Unde
r0.
70.
49N
.S.
0.7
0.12
N.S
.9.
60.
20Un
der
11.1
0.72
Unde
rLa
s Ve
gas–
Loca
l Are
a Gv
ts $
Lice
nse
527
NS
1.2
0.00
Unde
r1.
41.
09N
.S.
0.2
2.30
N.S
.0.
40.
21N
.S.
3.2
0.61
N.S
.3.
12.
58Ov
er
New
Mex
ico–
Fede
ral $
SM/W
OBE
1427
1990
–94
0.4
0.41
N.S
.21
.02.
11Ov
er1.
17.
98Ov
er1.
82.
47Ov
er24
.32.
37Ov
er4.
61.
02N
.S.
New
Mex
ico–
Fede
ral $
Surv
ey—
Inte
rest
1427
1990
–94
0.3
0.54
N.S
.27
.11.
63Ov
er0.
327
.62
Over
2.5
1.72
Over
30.2
1.90
Over
7.4
0.63
Unde
rN
ew M
exic
o–Fe
dera
l $Su
rvey
—At
tem
pt14
2719
90–9
40.
30.
56N
.S.
28.3
1.57
Over
0.3
28.6
2Ov
er2.
71.
59Ov
er31
.61.
82Ov
er6.
70.
70Un
der
New
Mex
ico–
Fede
ral #
SM/W
OBE
1427
1990
–94
0.4
0.17
Unde
r21
.02.
19Ov
er1.
13.
60Ov
er1.
83.
86Ov
er24
.32.
34Ov
er4.
62.
16Ov
erN
ew M
exic
o–Fe
dera
l #Su
rvey
—In
tere
st14
2719
90–9
40.
30.
22N
.S.
27.1
1.70
Over
0.3
12.4
5Ov
er2.
52.
70Ov
er30
.21.
88Ov
er7.
41.
34Ov
erN
ew M
exic
o–Fe
dera
l #Su
rvey
—At
tem
pt14
2719
90–9
40.
30.
23N
.S.
28.3
1.63
Over
0.3
12.9
0Ov
er2.
72.
49Ov
er31
.61.
80Ov
er6.
71.
49Ov
er
New
Mex
ico–
Stat
e $
SM/W
OBE
590
1990
–94
0.4
1.88
N.S
.21
.01.
37Ov
er1.
110
.13
Over
1.8
3.52
Over
24.3
1.93
Over
4.6
1.25
N.S
.N
ew M
exic
o–St
ate
$Su
rvey
—In
tere
st59
019
90–9
40.
32.
44Ov
er27
.11.
07N
.S.
0.3
35.0
5Ov
er2.
52.
46Ov
er30
.21.
55Ov
er7.
40.
78N
.S.
New
Mex
ico–
Stat
e $
Surv
ey—
Atte
mpt
590
1990
–94
0.3
2.53
Over
28.3
1.02
N.S
.0.
336
.32
Over
2.7
2.27
Over
31.6
1.48
Over
6.7
0.86
N.S
.

DO MINORITY-OWNED BUSINESSES GET A FAIR SHARE OF GOVERNMENT CONTRACTS?92
THE URBANINSTITUTE
New
Mex
ico–
Stat
e #
SM/W
OBE
590
1990
–94
0.4
1.24
N.S
.21
.02.
10Ov
er1.
13.
11Ov
er1.
81.
83Ov
er24
.32.
11Ov
er4.
61.
47Ov
erN
ew M
exic
o–St
ate
#Su
rvey
—In
tere
st59
019
90–9
40.
31.
62N
.S.
27.1
1.63
Over
0.3
10.7
6Ov
er2.
51.
28N
.S.
30.2
1.70
Over
7.4
0.92
N.S
.N
ew M
exic
o–St
ate
#Su
rvey
—At
tem
pt59
019
90–9
40.
31.
68N
.S.
28.3
1.57
Over
0.3
11.1
5Ov
er2.
71.
18N
.S.
31.6
1.62
Over
6.7
1.01
N.S
.
New
Orle
ans
$SM
/WOB
E—Em
pl.
NS
1989
–92
17.5
0.13
Unde
r3.
80.
00N
.S.
0.5
0.00
N.S
.21
.80.
10Un
der
15.1
0.29
Unde
r
New
Yor
k Ci
ty $
Surv
ey79
719
89–9
03.
90.
67N
.S.
2.3
1.18
N.S
.6.
30.
32Un
der
12.5
0.59
C12
.80.
40Un
der
New
Yor
k Ci
ty #
Surv
ey79
719
89–9
05.
50.
77N
.S.
3.5
1.30
N.S
.6.
90.
34Un
der
15.9
0.70
C13
.00.
45Un
der
NYC
Hou
sing
$SM
/WOB
E—Em
pl.
769
1988
–92
6.0
1.00
N.S
.3.
31.
85N
C4.
30.
66N
.S.
0.7
0.00
N.S
.14
.41.
04N
.S.
11.7
0.55
N.S
.N
YC H
ousi
ng #
SM/W
OBE—
Empl
.76
919
88–9
26.
50.
95N
.S.
4.0
0.89
N.S
.4.
90.
88N
.S.
0.7
0.00
Unde
r16
.10.
87N
.S.
12.4
0.54
Unde
r
Port
Auth
ority
NY/
NJ
$Bi
dder
s lis
tN
S19
88–9
27.
70.
38N
C3.
70.
85N
C2.
50.
25N
C0.
20.
30N
C14
.00.
48N
C2.
40.
33N
C
San
Anto
nio–
City
$Di
rect
orie
s76
119
86–8
71.
50.
02N
.S.
17.8
0.34
Unde
r1.
00.
30N
.S.
20.3
0.31
C12
.90.
06Un
der
San
Anto
nio–
City
#Di
rect
orie
s76
119
86–8
71.
50.
18Un
der
17.4
0.55
Unde
r1.
00.
13Un
der
19.9
0.50
C12
.00.
11Un
der
San
Anto
nio–
City
$Di
rect
orie
s41
219
89–9
01.
60.
12N
.S.
18.1
0.66
N.S
.0.
90.
00N
.S.
20.6
0.59
C14
.30.
18Un
der
San
Anto
nio–
City
#Di
rect
orie
s41
219
89–9
01.
50.
32N
.S.
17.8
0.83
N.S
.0.
90.
00Un
der
20.2
0.75
C12
.60.
52Un
der
San
Jose
, CA–
Cons
truct
ion
$Bi
dder
s lis
t59
019
87–8
94.
90.
10Un
der
17.9
0.88
N.S
.4.
61.
02N
.S.
0.1
4.70
Over
28.8
0.75
Unde
r10
.71.
90Un
der
San
Jose
, CA–
Cons
truct
ion
#Bi
dder
s lis
t59
019
87–8
94.
90.
41Un
der
17.9
1.10
N.S
.4.
61.
30Ov
er0.
11.
30N
.S.
28.8
0.98
N.S
.10
.71.
02N
.S.
Tam
pa $
Cert.
/Bid
ders
list
3919
863.
80.
36N
.S.
2.8
1.82
N.S
.1.
00.
00N
.S.
7.6
0.85
C3.
60.
04N
.S.
Tam
pa $
Cert.
/Reg
iste
red
3919
868.
10.
17Un
der
6.2
0.83
N.S
.2.
10.
00N
.S.
16.4
0.40
C4.
60.
03N
.S.
Tam
pa $
Cert.
/Bid
ders
list
7919
874.
21.
64N
.S.
2.9
2.27
N.S
.0.
60.
00N
.S.
7.7
1.75
C4.
50.
96N
.S.
Tam
pa $
Cert.
/Reg
iste
red
7919
879.
60.
66N
.S.
6.7
0.99
N.S
.1.
10.
00Un
der
17.4
0.74
C3.
90.
76N
.S.
Tam
pa $
Cert.
/Bid
ders
list
6319
885.
01.
54N
.S.
4.0
3.03
Over
0.7
0.37
N.S
.9.
72.
07C
Tam
pa $
Cert.
/Reg
iste
red
6319
8812
.70.
61N
.S.
11.2
1.09
N.S
.1.
60.
16N
.S.
25.5
0.79
C4.
50.
32Un
der
Tam
pa $
Cert.
/Bid
ders
list
2219
893.
70.
17N
.S.
4.1
1.52
N.S
.0.
50.
31N
.S.
8.3
0.84
C7.
30.
14N
.S.
Tam
pa $
Cert.
/Reg
iste
red
2219
898.
80.
07N
.S.
11.0
1.30
N.S
.0.
90.
17N
.S.
20.7
0.73
C
Tam
pa $
Cert.
/Bid
ders
list
6619
903.
70.
80N
.S.
4.1
1.02
N.S
.0.
50.
11N
.S.
8.2
0.87
C4.
30.
39N
.S.
Tam
pa $
Cert.
/Reg
iste
red
6619
908.
80.
34N
.S.
11.0
0.38
N.S
.0.
80.
06Un
der
20.7
0.35
C7.
60.
22N
.S.
Tam
pa–E
xclu
ding
EPA
$Ce
rt./B
idde
rs li
st31
1986
3.8
0.37
N.S
.2.
81.
20N
.S.
1.0
0.00
N.S
.7.
60.
63C
3.1
0.47
Unde
rTa
mpa
–Exc
ludi
ng E
PA $
Cert.
/Reg
iste
red
3119
868.
10.
17Un
der
6.2
0.55
N.S
.2.
10.
00N
.S.
16.4
0.29
C4.
30.
34N
.S.
Tabl
e A
.3a.
Evi
den
ce o
f D
isp
arit
y in
th
e C
onst
ruct
ion
In
du
stry
(C
onti
nu
ed)
AFRI
CAN
NAT
IVE
BACK
GROU
ND
AMER
ICAN
SLA
TIN
OSAS
IAN
SAM
ERIC
ANS
ALL
MIN
ORIT
IES
WOM
EN
# of
Disp
.St
at.
Disp
.St
at.
Disp
.St
at.
Disp
.St
at.
Disp
.St
at.
Disp
.St
at.
Sour
ceCo
ntra
cts
Year
Avai
l.Ra
tioSi
g.Av
ail.
Ratio
Sig.
Avai
l.Ra
tioSi
g.Av
ail.
Ratio
Sig.
Avai
l.Ra
tioSi
g.Av
ail.
Ratio
Sig.

APPENDIX: STUDY METHODS
THE URBANINSTITUTE
93
Tam
pa–E
xclu
ding
EPA
$Ce
rt./B
idde
rs li
st78
1987
4.2
2.04
N.S
.2.
92.
63Ov
er0.
60.
00N
.S.
7.7
2.10
CTa
mpa
–Exc
ludi
ng E
PA $
Cert.
/Reg
iste
red
7819
879.
60.
90N
.S.
6.7
1.12
N.S
.1.
10.
00N
.S.
17.4
0.93
C4.
50.
06N
.S.
Tam
pa–E
xclu
ding
EPA
$Ce
rt./B
idde
rs li
st54
1988
5.0
1.69
N.S
.4.
03.
57Ov
er0.
70.
46N
.S.
9.7
2.38
C4.
60.
04N
.S.
Tam
pa–E
xclu
ding
EPA
$Ce
rt./R
egis
tere
d54
1988
12.7
0.66
N.S
.11
.21.
27N
.S.
1.6
0.20
N.S
.25
.50.
90C
Tam
pa–E
xclu
ding
EPA
$Ce
rt./B
idde
rs li
st20
1989
3.7
0.74
N.S
.4.
12.
50N
.S.
0.5
0.00
N.S
.8.
31.
57C
3.9
1.04
N.S
.Ta
mpa
–Exc
ludi
ng E
PA $
Cert.
/Reg
iste
red
2019
898.
80.
31N
.S.
11.0
0.93
N.S
.0.
90.
00N
.S.
20.7
0.62
C5.
60.
61N
.S.
Tam
pa–E
xclu
ding
EPA
$Ce
rt./B
idde
rs li
st61
1990
3.7
0.50
N.S
.4.
10.
57N
.S.
0.5
0.19
N.S
.8.
30.
51C
4.5
0.38
N.S
.Ta
mpa
–Exc
ludi
ng E
PA $
Cert.
/Reg
iste
red
6119
908.
80.
21Un
der
11.0
0.21
N.S
.0.
90.
11N
.S.
20.8
0.21
C4.
10.
28N
.S.
Texa
s–DO
T $
SM/W
OBE—
Empl
.N
S9/
88–8
/91
2.1
0.16
N.S
.17
.40.
37N
.S.
0.7
2.17
N.S
.20
.10.
41N
.S.
8.2
1.69
N.S
.Te
xas–
DOT
#SM
/WOB
E—Em
pl.
NS
9/88
–8/9
12.
20.
27Un
der
18.3
0.28
Unde
r0.
80.
66N
.S.
21.2
0.29
Unde
r9.
92.
19Ov
erTe
xas–
DOT
$SM
/WOB
E—Em
pl.
NS
9/91
–8/9
32.
42.
81N
.S.
16.4
0.91
N.S
.0.
91.
31N
.S.
19.7
1.16
N.S
.8.
31.
68N
.S.
Texa
s–DO
T #
SM/W
OBE—
Empl
.N
S9/
91–8
/93
2.6
0.93
N.S
.15
.10.
38Un
der
0.8
1.36
N.S
.18
.50.
50Un
der
11.5
2.19
Over
Texa
s–5
agen
cies
#SM
/WOB
E—Em
pl.
~230
09/
88–8
/91
1.5
0.21
Unde
r10
.70.
27Un
der
0.9
0.37
N.S
.13
.00.
27Un
der
7.9
0.59
Unde
rTe
xas–
5 ag
enci
es #
SM/W
OBE—
Empl
.~1
500
9/91
–8/9
31.
40.
33Un
der
9.9
0.37
Unde
r0.
81.
21N
.S.
12.1
0.42
Unde
r7.
50.
67Un
der
Not
es: U
nle
ss o
ther
wis
e in
dic
ated
, “W
omen
” in
clu
des
min
orit
y w
omen
an
d “
All
Min
orit
ies”
doe
s n
ot i
ncl
ud
e w
hit
e w
omen
. A “
$” a
fter
th
e st
ud
y n
ame
ind
icat
es d
isp
arit
y re
fers
to
the
dol
lar
valu
e of
con
trac
ts a
war
ded
; a “
#” i
nd
icat
es d
isp
arit
y re
fers
to
the
nu
mbe
r of
con
trac
ts a
war
ded
. “U
nd
er”,
“O
ver”
, an
d “
N.S
.” i
n t
he
“Sta
t S
ig.”
col
um
n i
nd
icat
es s
tati
stic
ally
sig
nifi
can
t u
nd
eru
tili
zati
on, s
tati
stic
ally
sign
ific
ant
over
uti
liza
tion
, an
d n
ot s
ign
ific
antl
y d
iffe
ren
t fr
om o
ne,
res
pec
tive
ly. N
C s
tan
ds
for
stat
isti
cal
sign
ific
ance
not
cal
cula
ted
in
stu
dy.
C s
tan
ds
for
avai
labi
lity
an
d d
isp
arit
y ra
tio
calc
ula
ted
by
auth
ors.
“N
A”
stan
ds
for
no
avai
labi
lity
, th
eref
ore
can
not
cal
cula
te d
isp
arit
y ra
tio.
A b
lan
k in
dic
ates
stu
dy
did
not
rep
ort
this
figu
re.
Th
e av
aila
bili
ty m
easu
re “
SM
/WO
BE
”—E
mp
l on
ly i
ncl
ud
es fi
rms
wit
h p
aid
em
plo
yees
. See
als
o st
ud
y–sp
ecifi
c n
otes
at
end
of
tabl
e.

DO MINORITY-OWNED BUSINESSES GET A FAIR SHARE OF GOVERNMENT CONTRACTS?94
THE URBANINSTITUTE
Tabl
e A
.3b.
Evi
den
ce o
f D
isp
arit
y in
th
e G
ood
s In
du
stry
AFRI
CAN
NAT
IVE
BACK
GROU
ND
AMER
ICAN
SLA
TIN
OSAS
IAN
SAM
ERIC
ANS
ALL
MIN
ORIT
IES
WOM
EN
# of
Disp
.St
at.
Disp
.St
at.
Disp
.St
at.
Disp
.St
at.
Disp
.St
at.
Disp
.St
at.
Sour
ceCo
ntra
cts
Year
Avai
l.Ra
tioSi
g.Av
ail.
Ratio
Sig.
Avai
l.Ra
tioSi
g.Av
ail.
Ratio
Sig.
Avai
l.Ra
tioSi
g.Av
ail.
Ratio
Sig.
GOOD
SAl
amed
a Co
unty
, CA
$SM
/WOB
E22
,531
1987
–90
0.8
1.90
N.S
.1.
30.
23N
.S.
8.3
0.04
N.S
.10
.40.
21C
9.3
0.22
N.S
.Al
amed
a Co
unty
, CA
#SM
/WOB
E22
,531
1987
–90
1.2
1.80
N.S
.1.
40.
06Un
der
7.5
0.06
Unde
r10
.10.
27C
9.2
0.20
Unde
r
Albu
quer
que,
NM
$SM
/WOB
E11
5,48
719
89–9
30.
50.
05Un
der
11.5
0.59
Unde
r0.
90.
05Un
der
1.0
1.65
Over
14.0
0.63
Unde
r13
.50.
29Un
der
Albu
quer
que,
NM
$SM
/WOB
E—Em
pl.
115,
487
1989
–93
0.0
NA
NA
4.6
1.48
Over
0.1
0.47
Unde
r0.
118
.18
Over
4.8
1.86
Over
3.2
1.19
Over
Albu
quer
que,
NM
$Su
rvey
—In
tere
st11
5,48
719
89–9
30.
10.
19Un
der
16.5
0.41
Unde
r0.
80.
05Un
der
1.5
1.14
Over
19.0
0.47
Unde
r13
.40.
29Un
der
Albu
quer
que,
NM
$Su
rvey
—At
tem
pt11
5,48
719
89–9
30.
0N
AN
A14
.60.
46Un
der
1.0
0.05
Unde
r1.
01.
83Ov
er16
.50.
54Un
der
14.8
0.26
Unde
rAl
buqu
erqu
e, N
M $
Regi
ster
ed11
5,48
719
89–9
31.
30.
05Un
der
9.3
0.73
Unde
r1.
20.
04Un
der
2.8
0.62
Unde
r14
.80.
60Un
der
10.3
0.37
Unde
r
Albu
quer
que,
NM
$SM
/WOB
E37
,092
1994
–95
0.5
1.95
Over
11.5
0.52
Unde
r0.
90.
05Un
der
1.0
1.07
N.S
.14
.00.
59Un
der
13.5
0.30
Unde
rAl
buqu
erqu
e, N
M $
SM/W
OBE—
Empl
.37
,092
1994
–95
0.0
NA
NA
4.6
1.31
Over
0.1
0.52
Unde
r0.
111
.70
Over
4.8
1.74
Over
3.2
1.24
Over
Albu
quer
que,
NM
$Su
rvey
—In
tere
st37
,092
1994
–95
0.1
7.25
Over
16.5
0.36
Unde
r0.
80.
06Un
der
1.5
0.73
Unde
r19
.00.
44Un
der
13.4
0.30
Unde
rAl
buqu
erqu
e, N
M $
Surv
ey—
Atte
mpt
37,0
9219
94–9
50.
0N
AN
A14
.60.
41Un
der
1.0
0.05
Unde
r1.
01.
17Ov
er16
.50.
50Un
der
14.8
0.27
Unde
rAl
buqu
erqu
e, N
M $
Regi
ster
ed37
,092
1994
–95
1.3
0.76
Unde
r9.
30.
64Un
der
1.2
0.04
Unde
r2.
80.
40Un
der
14.8
0.56
Unde
r10
.30.
39Un
der
Ashe
ville
, NC
$SM
/WOB
E1,
438
1988
–92
2.5
0.11
Unde
r0.
20.
00Un
der
0.3
0.00
Unde
r3.
00.
09C
9.6
0.81
Unde
r
Chic
ago–
City
$Bi
dder
s lis
t1,
264
1989
21.5
0.68
NC
5.3
0.62
NC
Chic
ago–
City
#Bi
dder
s lis
t1,
264
1989
21.5
1.01
NC
5.3
1.20
NC
Cinc
inna
ti–Al
l Bid
ders
#Ce
rt./R
egis
tere
d12
619
1990
–91
1.1
2.40
Over
0.1
3.55
Over
0.2
8.42
Over
0.1
8.63
Over
Cinc
inna
ti–Al
l Bid
ders
#Re
gist
ered
1261
919
90–9
18.
00.
76Un
der
1.6
0.57
Unde
rCi
ncin
nati–
CMSA
#Ce
rt./R
egis
tere
d82
4319
90–9
11.
72.
10Ov
er0.
23.
26Ov
er0.
39.
40Ov
er0.
110
.83
Over
Cinc
inna
ti–CM
SA #
Regi
ster
ed82
4319
90–9
110
.00.
84Un
der
1.7
0.80
Unde
r
Colu
mbu
s, O
H $
Mai
ling
list
NS
1983
–91
8.7
0.17
Unde
r8.
10.
26Un
der
Colu
mbu
s, O
H $
SM/W
OBE
NS
1983
–91
2.8
0.54
Unde
r15
.90.
13Un
der
Colu
mbu
s, O
H $
SM/W
OBE
1055
019
91–9
31.
80.
42Un
der
0.3
1.59
Over
0.7
0.02
Unde
rSe
e As
ian
2.8
0.42
Unde
r13
.80.
13Un
der
Colu
mbu
s, O
H $
SM/W
OBE—
Empl
.10
550
1991
–93
0.3
2.51
Over
0.0
NA
NA
0.0
NA
NA
See
Asia
n0.
34.
05Ov
er1.
80.
98N
.S.
Colu
mbu
s, O
H $
Surv
ey—
Inte
rest
1055
019
91–9
30.
51.
46Ov
er0.
13.
41Ov
er0.
60.
03Un
der
0.5
0.00
Unde
r1.
80.
68Un
der
6.3
0.29
Unde
rCo
lum
bus,
OH
$Re
gist
ered
1055
019
91–9
34.
50.
16Un
der
0.6
0.76
N.S
.0.
60.
03Un
der
0.1
0.00
Unde
r5.
90.
20Un
der
4.5
0.41
Unde
r
Cont
ra C
osta
Cou
nty,
CA
$SM
/WOB
E—Em
pl.
7076
1987
–88
0.5
1.44
NC
1.0
0.08
N.S
.5.
80.
02Un
der
7.2
0.12
C6.
70.
24Un
der
Cont
ra C
osta
Cou
nty,
CA
#SM
/WOB
E—Em
pl.
7076
1987
–88
0.5
6.44
Over
1.0
0.36
Unde
r4.
20.
41Un
der
5.7
0.90
C6.
71.
15Ov
erCo
ntra
Cos
ta C
ount
y, C
A $
SM/W
OBE—
Empl
.80
7019
89–9
00.
61.
90N
C1.
30.
11N
.S.
8.7
0.05
Unde
r10
.60.
17C
9.6
0.22
Unde
rCo
ntra
Cos
ta C
ount
y, C
A #
SM/W
OBE—
Empl
.80
7019
89–9
00.
64.
98Ov
er1.
30.
47Un
der
6.4
0.26
Unde
r8.
30.
65C
9.5
0.70
Unde
r

THE URBANINSTITUTE
95
Con
tin
ued
Dade
Cou
nty,
FL–
Proc
urem
ent #
Regi
ster
ed37
119
89–9
16.
40.
75N
C13
.30.
53N
C1.
11.
55N
C20
.80.
65C
11.0
0.93
NC
Dade
Cou
nty,
FL–
Proc
urem
ent $
Regi
ster
ed37
119
89–9
16.
40.
56N
C13
.30.
12N
C1.
10.
91N
C20
.80.
30C
11.0
0.59
NC
Dalla
s–Ci
ty $
Vend
ors
list
NS
1990
–93
4.3
1.01
Over
1.5
1.63
Over
0.9
0.78
Unde
r0.
010
.02
Over
6.7
1.17
C2.
60.
81Un
der
Dalla
s–PM
SA $
Vend
ors
list
NS
1990
–93
2.9
0.70
Unde
r1.
30.
80Un
der
0.8
0.70
Unde
r0.
20.
93Un
der
5.2
0.73
C2.
41.
05Ov
er
Dalla
s/Fo
rt W
orth
Airp
ort $
SM/W
OBE
2,86
919
86–8
70.
92.
15N
C0.
80.
84N
C1.
70.
13N
C0.
115
.83
NC
3.6
1.14
NC
16.9
0.18
NC
Dalla
s/Fo
rt W
orth
Airp
ort $
Surv
ey—
Inte
rest
2,86
919
86–8
72.
10.
93N
C3.
30.
21N
C4.
40.
05N
C1.
90.
51N
C12
.00.
34N
C12
.70.
24N
CDa
llas/
Fort
Wor
th A
irpor
t $M
ailin
g lis
t2,
869
1986
–87
11.3
0.18
NC
5.9
0.12
NC
3.2
0.07
NC
2.1
0.46
NC
22.7
0.18
NC
15.6
0.19
NC
Dalla
s/Fo
rt W
orth
Airp
ort $
SM/W
OBE
2,41
419
92–9
30.
93.
92N
C0.
82.
54N
C1.
70.
36N
C0.
14.
50N
C3.
62.
02N
C16
.90.
17N
CDa
llas/
Fort
Wor
th A
irpor
t $Su
rvey
—In
tere
st2,
414
1992
–93
2.1
1.70
NC
3.3
0.64
NC
4.4
0.14
NC
1.9
0.15
NC
12.0
0.60
NC
12.7
0.23
NC
Dalla
s/Fo
rt W
orth
Airp
ort $
Mai
ling
list
2,41
419
92–9
311
.30.
32N
C5.
90.
36N
C3.
20.
19N
C2.
10.
13N
C22
.70.
32N
C15
.60.
19N
C
Dayt
on, O
H $
Cert.
/Bid
ders
list
NS
1984
11.8
0.11
Unde
r4.
00.
11Un
der
Dayt
on, O
H $
Cert.
/Bid
ders
list
NS
1985
12.9
0.21
Unde
r4.
20.
25Un
der
Dayt
on, O
H $
Cert.
/Bid
ders
list
NS
1986
14.2
0.19
Unde
r4.
20.
17Un
der
Dayt
on, O
H $
Cert.
/Bid
ders
list
NS
1987
15.8
0.24
Unde
r4.
50.
22Un
der
Dayt
on, O
H $
Cert.
/Bid
ders
list
NS
1988
16.9
0.16
Unde
r4.
60.
19Un
der
Dayt
on, O
H $
Cert.
/Bid
ders
list
NS
1989
16.4
0.11
Unde
r4.
50.
17Un
der
Dayt
on, O
H $
Cert.
/Bid
ders
list
NS
1990
16.5
0.13
Unde
r12
.20.
12Un
der
Denv
er P
hase
II #
Su
rvey
—In
tere
st30
3119
896.
31.
56N
.S.
18.5
0.56
Unde
rDe
nver
Pha
se II
$Su
rvey
—In
tere
st30
3119
896.
30.
89N
.S.
18.5
0.66
Unde
rDe
nver
Pha
se II
#
Surv
ey—
Inte
rest
4631
1990
6.3
1.32
N.S
.18
.50.
58Un
der
Denv
er P
hase
II $
Surv
ey—
Inte
rest
4631
1990
6.3
0.73
Unde
r18
.50.
83Un
der
Denv
er R
TD #
SM/W
OBE—
Empl
.25
,455
1987
–91
0.2
5.13
?0.
39.
15?
0.3
0.88
N.S
.0.
85.
08C
4.8
0.64
Unde
rDe
nver
RTD
$SM
/WOB
E—Em
pl.
25,4
5519
87–9
10.
31.
97?
1.2
0.80
N.S
.0.
90.
34N
.S.
2.5
0.77
C10
.20.
83N
.S.
Denv
er R
TD–F
eder
al #
SM/W
OBE—
Empl
.13
819
87–9
10.
29.
06?
0.3
8.53
?0.
30.
00N
.S.
0.8
5.24
C4.
80.
15Un
der
Denv
er R
TD–F
eder
al $
SM/W
OBE—
Empl
.13
819
87–9
10.
30.
17N
.S.
1.2
0.48
?0.
90.
00N
.S.
2.5
0.26
C10
.20.
20N
.S.
Dist
rict o
f Col
umbi
a $
SMOB
E41
519
89–9
14.
55.
96N
.S.
1.4
1.00
N.S
.12
.70.
02Un
der
18.6
1.57
N.S
.
Fort
Wor
th–C
ity $
SM/W
OBE
3,41
619
860.
90.
11N
C0.
80.
57N
C1.
70.
01N
C0.
11.
67N
C3.
60.
22N
C16
.90.
04N
CFo
rt W
orth
–City
$Su
rvey
—In
tere
st3,
416
1986
2.1
0.05
NC
3.3
0.14
NC
4.4
0.00
NC
1.9
0.05
NC
12.0
0.06
NC
12.7
0.06
NC
Fort
Wor
th–C
ity $
Mai
ling
list
3,41
619
861.
20.
08N
C0.
80.
62N
C0.
30.
03N
C0.
40.
24N
C3.
20.
24N
C2.
20.
34N
C
Fort
Wor
th–C
ity $
SM/W
OBE
3,95
419
92–9
30.
90.
18N
C0.
80.
20N
C1.
70.
01N
C0.
10.
33N
C3.
60.
15N
C16
.90.
04N
CFo
rt W
orth
–City
$Su
rvey
—In
tere
st3,
954
1992
–93
2.1
0.08
NC
3.3
0.05
NC
4.4
0.00
NC
1.9
0.01
NC
12.0
0.04
NC
12.7
0.06
NC
Fort
Wor
th–C
ity $
Mai
ling
list
3,95
419
92–9
31.
20.
14N
C0.
80.
22N
C0.
30.
06N
C0.
40.
05N
C3.
20.
17N
C2.
20.
34N
C
Fort
Wor
th–T
rans
porta
tion
$SM
/WOB
E1,
169
91–9
33.
61.
45Ov
er16
.90.
16Un
der
Fort
Wor
th–T
rans
porta
tion
#SM
/WOB
E1,
169
91–9
33.
60.
60Un
der
16.9
0.21
Unde
rFo
rt W
orth
–Tra
nspo
rtatio
n $
Surv
ey—
Inte
rest
1,16
991
–93
12.0
0.43
Unde
r12
.70.
21Un
der
Fort
Wor
th–T
rans
porta
tion
#Su
rvey
—In
tere
st1,
169
91–9
312
.00.
18Un
der
12.7
0.28
Unde
rFo
rt W
orth
–Tra
nspo
rtatio
n $
Mai
ling
list
1,16
991
–93
8.0
0.64
Unde
r3.
20.
86N
.S.
Fort
Wor
th–T
rans
porta
tion
#M
ailin
g lis
t1,
169
91–9
38.
00.
27Un
der
3.2
1.11
N.S
.
APPENDIX: STUDY METHODS
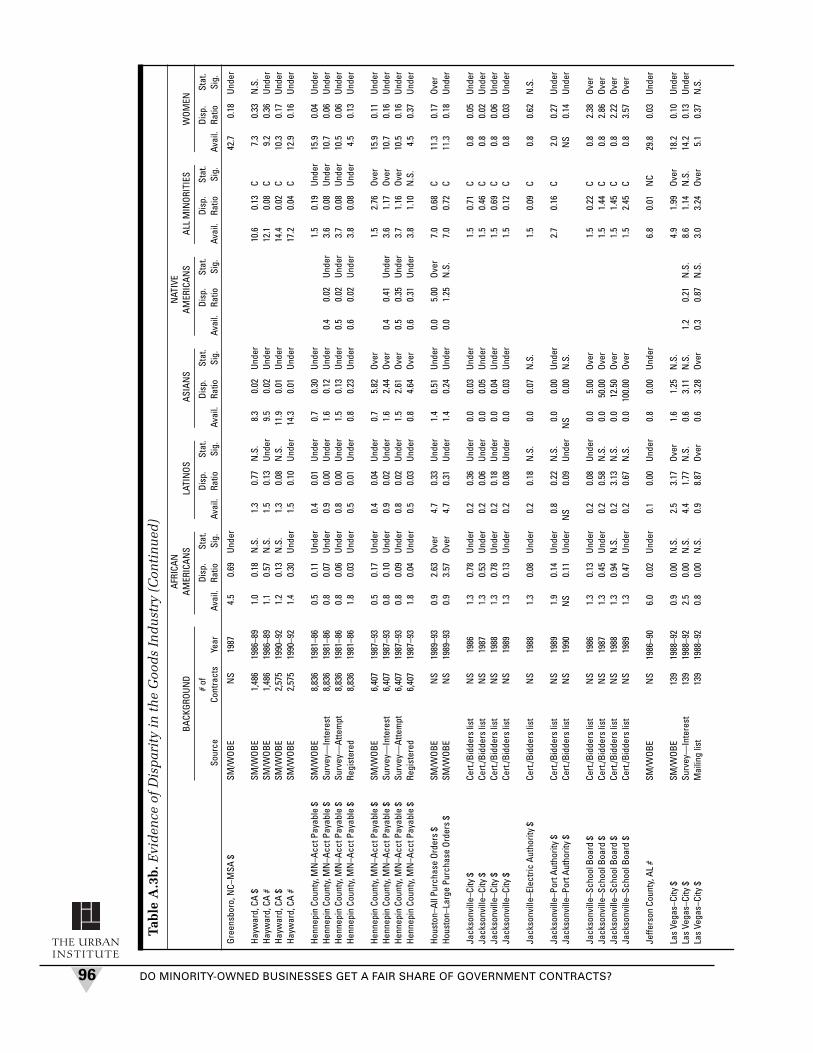
DO MINORITY-OWNED BUSINESSES GET A FAIR SHARE OF GOVERNMENT CONTRACTS?96
THE URBANINSTITUTE
Gree
nsbo
ro, N
C–M
SA $
SM/W
OBE
NS
1987
4.5
0.69
Unde
r42
.70.
18Un
der
Hayw
ard,
CA
$SM
/WOB
E1,
486
1986
–89
1.0
0.18
N.S
.1.
30.
77N
.S.
8.3
0.02
Unde
r10
.60.
13C
7.3
0.33
N.S
.Ha
ywar
d, C
A #
SM/W
OBE
1,48
619
86–8
91.
10.
57N
.S.
1.5
0.13
Unde
r9.
50.
02Un
der
12.1
0.08
C9.
20.
36Un
der
Hayw
ard,
CA
$SM
/WOB
E2,
575
1990
–92
1.2
0.13
N.S
.1.
30.
08N
.S.
11.9
0.01
Unde
r14
.40.
02C
10.3
0.17
Unde
rHa
ywar
d, C
A #
SM/W
OBE
2,57
519
90–9
21.
40.
30Un
der
1.5
0.10
Unde
r14
.30.
01Un
der
17.2
0.04
C12
.90.
16Un
der
Henn
epin
Cou
nty,
MN
–Acc
t Pay
able
$SM
/WOB
E8,
836
1981
–86
0.5
0.11
Unde
r0.
40.
01Un
der
0.7
0.30
Unde
r1.
50.
19Un
der
15.9
0.04
Unde
rHe
nnep
in C
ount
y, M
N–A
cct P
ayab
le $
Surv
ey—
Inte
rest
8,83
619
81–8
60.
80.
07Un
der
0.9
0.00
Unde
r1.
60.
12Un
der
0.4
0.02
Unde
r3.
60.
08Un
der
10.7
0.06
Unde
rHe
nnep
in C
ount
y, M
N–A
cct P
ayab
le $
Surv
ey—
Atte
mpt
8,83
619
81–8
60.
80.
06Un
der
0.8
0.00
Unde
r1.
50.
13Un
der
0.5
0.02
Unde
r3.
70.
08Un
der
10.5
0.06
Unde
rHe
nnep
in C
ount
y, M
N–A
cct P
ayab
le $
Regi
ster
ed8,
836
1981
–86
1.8
0.03
Unde
r0.
50.
01Un
der
0.8
0.23
Unde
r0.
60.
02Un
der
3.8
0.08
Unde
r4.
50.
13Un
der
Henn
epin
Cou
nty,
MN
–Acc
t Pay
able
$SM
/WOB
E6,
407
1987
–93
0.5
0.17
Unde
r0.
40.
04Un
der
0.7
5.82
Over
1.5
2.76
Over
15.9
0.11
Unde
rHe
nnep
in C
ount
y, M
N–A
cct P
ayab
le $
Surv
ey—
Inte
rest
6,40
719
87–9
30.
80.
10Un
der
0.9
0.02
Unde
r1.
62.
44Ov
er0.
40.
41Un
der
3.6
1.17
Over
10.7
0.16
Unde
rHe
nnep
in C
ount
y, M
N–A
cct P
ayab
le $
Surv
ey—
Atte
mpt
6,40
719
87–9
30.
80.
09Un
der
0.8
0.02
Unde
r1.
52.
61Ov
er0.
50.
35Un
der
3.7
1.16
Over
10.5
0.16
Unde
rHe
nnep
in C
ount
y, M
N–A
cct P
ayab
le $
Regi
ster
ed6,
407
1987
–93
1.8
0.04
Unde
r0.
50.
03Un
der
0.8
4.64
Over
0.6
0.31
Unde
r3.
81.
10N
.S.
4.5
0.37
Unde
r
Hous
ton–
All P
urch
ase
Orde
rs $
SM/W
OBE
NS
1989
–93
0.9
2.63
Over
4.7
0.33
Unde
r1.
40.
51Un
der
0.0
5.00
Over
7.0
0.68
C11
.30.
17Ov
erHo
usto
n–La
rge
Purc
hase
Ord
ers
$SM
/WOB
EN
S19
89–9
30.
93.
57Ov
er4.
70.
31Un
der
1.4
0.24
Unde
r0.
01.
25N
.S.
7.0
0.72
C11
.30.
18Un
der
Jack
sonv
ille–
City
$Ce
rt./B
idde
rs li
stN
S19
861.
30.
78Un
der
0.2
0.36
Unde
r0.
00.
03Un
der
1.5
0.71
C0.
80.
05Un
der
Jack
sonv
ille–
City
$Ce
rt./B
idde
rs li
stN
S19
871.
30.
53Un
der
0.2
0.06
Unde
r0.
00.
05Un
der
1.5
0.46
C0.
80.
02Un
der
Jack
sonv
ille–
City
$Ce
rt./B
idde
rs li
stN
S19
881.
30.
78Un
der
0.2
0.18
Unde
r0.
00.
04Un
der
1.5
0.69
C0.
80.
06Un
der
Jack
sonv
ille–
City
$Ce
rt./B
idde
rs li
stN
S19
891.
30.
13Un
der
0.2
0.08
Unde
r0.
00.
03Un
der
1.5
0.12
C0.
80.
03Un
der
Jack
sonv
ille–
Elec
tric
Auth
ority
$Ce
rt./B
idde
rs li
stN
S19
881.
30.
08Un
der
0.2
0.18
N.S
.0.
00.
07N
.S.
1.5
0.09
C0.
80.
62N
.S.
Jack
sonv
ille–
Port
Auth
ority
$Ce
rt./B
idde
rs li
stN
S19
891.
90.
14Un
der
0.8
0.22
N.S
.0.
00.
00Un
der
2.7
0.16
C2.
00.
27Un
der
Jack
sonv
ille–
Port
Auth
ority
$Ce
rt./B
idde
rs li
stN
S19
90N
S0.
11Un
der
NS
0.09
Unde
rN
S0.
00N
.S.
NS
0.14
Unde
r
Jack
sonv
ille–
Scho
ol B
oard
$Ce
rt./B
idde
rs li
stN
S19
861.
30.
13Un
der
0.2
0.08
Unde
r0.
05.
00Ov
er1.
50.
22C
0.8
2.38
Over
Jack
sonv
ille–
Scho
ol B
oard
$Ce
rt./B
idde
rs li
stN
S19
871.
30.
45Un
der
0.2
0.58
N.S
.0.
050
.00
Over
1.5
1.44
C0.
82.
86Ov
erJa
ckso
nvill
e–Sc
hool
Boa
rd $
Cert.
/Bid
ders
list
NS
1988
1.3
0.94
N.S
.0.
23.
13N
.S.
0.0
12.5
0Ov
er1.
51.
45C
0.8
2.22
Over
Jack
sonv
ille–
Scho
ol B
oard
$Ce
rt./B
idde
rs li
stN
S19
891.
30.
47Un
der
0.2
0.67
N.S
.0.
010
0.00
Over
1.5
2.45
C0.
83.
57Ov
er
Jeffe
rson
Cou
nty,
AL
#SM
/WOB
EN
S19
86–9
06.
00.
02Un
der
0.1
0.00
Unde
r0.
80.
00Un
der
6.8
0.01
NC
29.8
0.03
Unde
r
Las
Vega
s–Ci
ty $
SM/W
OBE
139
1988
–92
0.9
0.00
N.S
.2.
53.
17Ov
er1.
61.
25N
.S.
4.9
1.99
Over
18.2
0.10
Unde
rLa
s Ve
gas–
City
$Su
rvey
—In
tere
st13
919
88–9
22.
50.
00N
.S.
4.4
1.77
N.S
.0.
63.
11N
.S.
1.2
0.21
N.S
.8.
61.
14N
.S.
14.2
0.13
Unde
rLa
s Ve
gas–
City
$M
ailin
g lis
t13
919
88–9
20.
80.
00N
.S.
0.9
8.87
Over
0.6
3.28
Over
0.3
0.87
N.S
.3.
03.
24Ov
er5.
10.
37N
.S.
Tabl
e A
.3b.
Evi
den
ce o
f D
isp
arit
y in
th
e G
ood
s In
du
stry
(C
onti
nu
ed)
AFRI
CAN
NAT
IVE
BACK
GROU
ND
AMER
ICAN
SLA
TIN
OSAS
IAN
SAM
ERIC
ANS
ALL
MIN
ORIT
IES
WOM
EN
# of
Disp
.St
at.
Disp
.St
at.
Disp
.St
at.
Disp
.St
at.
Disp
.St
at.
Disp
.St
at.
Sour
ceCo
ntra
cts
Year
Avai
l.Ra
tioSi
g.Av
ail.
Ratio
Sig.
Avai
l.Ra
tioSi
g.Av
ail.
Ratio
Sig.
Avai
l.Ra
tioSi
g.Av
ail.
Ratio
Sig.

APPENDIX: STUDY METHODS
THE URBANINSTITUTE
97
Con
tin
ued
Las
Vega
s–Ci
ty $
SM/W
OBE
3,33
119
930.
91.
07N
.S.
2.5
0.36
Unde
r1.
61.
02N
.S.
4.9
0.70
Unde
r18
.20.
27Un
der
Las
Vega
s–Ci
ty $
Surv
ey—
Inte
rest
3,33
119
932.
50.
37Un
der
4.4
0.20
Unde
r0.
62.
24Ov
er1.
20.
33Un
der
8.6
0.40
Unde
r14
.20.
34Un
der
Las
Vega
s–Ci
ty $
Mai
ling
list
3,33
119
930.
81.
22N
.S.
0.9
1.00
N.S
.0.
62.
36Ov
er0.
31.
38N
.S.
3.0
1.15
N.S
.5.
10.
95N
.S.
Las
Vega
s–Lo
cal A
rea
Gvts
$SM
/WOB
E5,
683
1988
–92
0.9
0.21
Unde
r2.
50.
56Un
der
1.6
0.53
Unde
r4.
90.
59Un
der
18.2
0.13
Unde
rLa
s Ve
gas–
Loca
l Are
a Gv
ts $
Surv
ey—
Inte
rest
5,68
319
88–9
22.
50.
07Un
der
4.4
0.31
Unde
r0.
61.
41Ov
er1.
20.
04Un
der
8.6
0.34
Unde
r14
.20.
16Un
der
Las
Vega
s–Lo
cal A
rea
Gvts
$M
ailin
g lis
t5,
683
1988
–92
1.0
0.18
Unde
r1.
31.
05N
.S.
0.6
1.41
Over
0.4
0.14
Unde
r3.
70.
79Un
der
6.0
0.39
Unde
r
Las
Vega
s–Lo
cal A
rea
Gvts
$SM
/WOB
E23
,983
1990
–93
0.9
0.27
Unde
r2.
50.
24Un
der
1.6
0.37
Unde
r4.
90.
29Un
der
18.2
0.14
Unde
rLa
s Ve
gas–
Loca
l Are
a Gv
ts $
Surv
ey—
Inte
rest
23,9
8319
90–9
32.
50.
09Un
der
4.4
0.13
Unde
r0.
60.
96N
.S.
1.2
0.04
Unde
r8.
60.
17Un
der
14.2
0.18
Unde
rLa
s Ve
gas–
Loca
l Are
a Gv
ts $
Mai
ling
list
23,9
8319
90–9
31.
00.
23Un
der
1.3
0.45
Unde
r0.
60.
96N
.S.
0.4
0.13
Unde
r3.
70.
39Un
der
6.0
0.42
Unde
r
Mar
icop
a Co
unty
, AZ
$Di
recs
./Reg
ist.
8,04
819
87–8
85.
30.
00N
.S.
9.2
0.01
N.S
.1.
00.
37N
.S.
1.2
0.00
N.S
.16
.70.
03N
.S.
10.3
0.01
N.S
.M
aric
opa
Coun
ty, A
Z $
Dire
cs./R
egis
t.8,
281
1988
–89
5.3
0.03
N.S
.9.
20.
10N
.S.
1.0
0.00
N.S
.1.
20.
00N
.S.
16.7
0.07
N.S
.10
.30.
11N
.S.
Mar
ylan
d–Pr
imes
&Su
bs $
SM/W
OBE
241
1985
–89
1.0
0.70
NC
1.2
0.00
NC
7.5
0.27
NC
5.2
0.19
NC
Mar
ylan
d &
Env
irons
–Prim
es&
Subs
$SM
/WOB
E24
119
85–8
90.
60.
00N
C0.
60.
00N
C7.
00.
29N
C5.
70.
16N
C
Mar
ylan
d DO
T–Pr
imes
onl
y $
SM/W
OBE—
Empl
.N
SFY
91–9
32.
70.
34Un
der
0.5
1.30
N.S
.1.
52.
17N
.S.
4.7
1.04
N.S
.8.
60.
47Un
der
Mar
ylan
d DO
T–Pr
imes
and
sub
s $
SM/W
OBE—
Empl
.N
SFY
92–9
32.
70.
39N
C0.
50.
32N
C1.
50.
34N
C4.
70.
36N
C8.
60.
32Un
der
Mas
sach
uset
ts–M
BTA
$SM
/WOB
E77
319
81–9
10.
91.
45N
.S.
1.6
0.09
Unde
r0.
50.
78N
.S.
0.5
0.02
N.S
.3.
50.
53C
15.8
0.02
N.S
.M
assa
chus
etts
–MTA
$SM
/WOB
E28
719
81–9
10.
16.
25N
.S.
0.0
0.00
N.S
.0.
050
.00
N.S
.0.
00.
00N
.S.
0.2
10.5
5C
4.5
0.06
N.S
.
Mem
phis
–Airp
ort $
Cert.
/Bid
ders
list
3619
8824
.10.
00N
.S.
1.2
0.00
N.S
.1.
20.
00N
.S.
0.0
NA
NA
37.3
0.00
N.S
.10
.80.
00N
.S.
Mem
phis
–Airp
ort $
Cert.
/Bid
ders
list
3619
9024
.11.
30N
.S.
1.2
0.00
N.S
.1.
20.
00N
.S.
0.0
NA
NA
37.3
0.89
N.S
.10
.80.
00N
.S.
Mem
phis
–Airp
ort $
Cert.
/Bid
ders
list
3619
9224
.10.
00N
.S.
1.2
0.00
N.S
.1.
20.
00N
.S.
0.0
NA
NA
37.3
0.00
N.S
.10
.80.
00N
.S.
Mem
phis
–City
$Ce
rt./B
idde
rs li
st18
319
8829
.60.
19Un
der
1.6
0.00
N.S
.2.
30.
00N
.S.
1.0
0.00
N.S
.60
.20.
09Un
der
23.7
0.00
Unde
rM
emph
is–C
ity $
Cert.
/Bid
ders
list
183
1990
29.6
0.00
N.S
.1.
60.
00N
.S.
2.3
0.00
N.S
.1.
00.
00N
.S.
60.2
0.00
N.S
.23
.70.
00N
.S.
Mem
phis
–City
$Ce
rt./B
idde
rs li
st18
319
9229
.60.
00N
.S.
1.6
0.00
N.S
.2.
30.
00N
.S.
1.0
0.00
N.S
.60
.20.
00N
.S.
23.7
0.00
N.S
.
Mem
phis
–Gas
,Wat
er,L
ight
$Ce
rt./B
idde
rs li
st24
1988
29.6
0.01
N.S
.1.
60.
00N
.S.
2.3
0.28
N.S
.1.
00.
00N
.S.
60.2
0.03
Unde
r23
.70.
00N
.S.
Mem
phis
–Gas
,Wat
er,L
ight
$Ce
rt./B
idde
rs li
st24
1990
29.6
0.03
N.S
.1.
60.
00N
.S.
2.3
0.38
N.S
.1.
00.
00N
.S.
60.2
0.05
Unde
r23
.70.
00N
.S.
Mem
phis
–Gas
,Wat
er,L
ight
$Ce
rt./B
idde
rs li
st24
1992
29.6
0.80
N.S
.1.
60.
00N
.S.
2.3
0.41
N.S
.1.
00.
00N
.S.
60.2
0.41
N.S
.23
.70.
00N
.S.
Mem
phis
–She
lby
Coun
ty $
Cert.
/Bid
ders
list
147
1988
18.2
0.00
N.S
.0.
0N
AN
A0.
0N
AN
A0.
0N
AN
A18
.20.
00N
.S.
0.0
NA
NA
Mem
phis
–She
lby
Coun
ty $
Cert.
/Bid
ders
list
147
1990
18.2
0.56
N.S
.0.
0N
AN
A0.
0N
AN
A0.
0N
AN
A18
.20.
64Un
der
0.0
NA
NA
Mem
phis
–She
lby
Coun
ty $
Cert.
/Bid
ders
list
147
1992
18.2
0.09
Unde
r0.
0N
AN
A0.
0N
AN
A0.
0N
AN
A18
.20.
09Un
der
0.0
NA
NA
Mem
phis
–Tra
nspo
rtatio
n Au
thor
ity $
Cert.
/Bid
ders
list
2819
8819
.30.
00N
.S.
1.1
0.00
N.S
.3.
40.
00N
.S.
0.0
NA
NA
38.6
0.00
N.S
.38
.60.
00N
.S.
Mem
phis
–Tra
nspo
rtatio
n Au
thor
ity $
Cert.
/Bid
ders
list
2819
9019
.30.
18Un
der
1.1
0.00
N.S
.3.
40.
06Un
der
0.0
NA
NA
38.6
0.15
Unde
r38
.60.
17Un
der
Mem
phis
–Tra
nspo
rtatio
n Au
thor
ity $
Cert.
/Bid
ders
list
2819
9219
.30.
02Un
der
1.1
0.00
N.S
.3.
40.
00Un
der
0.0
NA
NA
38.6
0.03
Unde
r38
.60.
04Un
der
Min
neap
olis
$SM
/WOB
E31
519
90–9
10.
51.
04N
.S.
0.4
0.00
Unde
r0.
70.
08Un
der
1.5
0.35
Unde
r15
.90.
03Un
der
Min
neap
olis
$SM
/WOB
E—Em
pl.
315
1990
–91
0.2
2.80
N.S
.0.
10.
00Un
der
0.2
0.28
Unde
r0.
51.
18N
.S.
4.4
0.11
Unde
rM
inne
apol
is $
Surv
ey—
Inte
rest
315
1990
–91
0.8
0.63
N.S
.0.
90.
00Un
der
1.6
0.01
Unde
r0.
40.
11Un
der
3.6
0.15
Unde
r10
.70.
04Un
der
Min
neap
olis
$Su
rvey
—At
tem
pt31
519
90–9
10.
80.
57N
.S.
0.8
0.00
Unde
r1.
50.
01Un
der
0.5
0.09
Unde
r3.
70.
14Un
der
10.5
0.04
Unde
rM
inne
apol
is $
Regi
ster
ed31
519
90–9
10.
70.
68N
.S.
0.1
0.00
Unde
r0.
50.
02Un
der
0.2
0.21
Unde
r1.
70.
31Un
der
2.3
0.21
Unde
r

DO MINORITY-OWNED BUSINESSES GET A FAIR SHARE OF GOVERNMENT CONTRACTS?98
THE URBANINSTITUTE
Min
neap
olis
$SM
/WOB
E7,
635
1992
–94
0.5
0.22
Unde
r0.
40.
09Un
der
0.7
0.34
Unde
r1.
50.
24Un
der
15.9
0.12
Unde
rM
inne
apol
is $
SM/W
OBE—
Empl
.7,
635
1992
–94
0.2
0.59
N.S
.0.
10.
46N
.S.
0.2
1.14
N.S
.0.
50.
83N
.S.
4.4
0.45
Unde
rM
inne
apol
is $
Surv
ey—
Inte
rest
7,63
519
92–9
40.
80.
13Un
der
0.9
0.04
Unde
r1.
60.
12Un
der
0.4
0.11
Unde
r3.
60.
10Un
der
10.7
0.18
Unde
rM
inne
apol
is $
Surv
ey—
Atte
mpt
7,63
519
92–9
40.
80.
12Un
der
0.8
0.04
Unde
r1.
50.
13Un
der
0.5
0.09
Unde
r3.
70.
10Un
der
10.5
0.19
Unde
rM
inne
apol
is $
Regi
ster
ed7,
635
1992
–94
0.7
0.14
Unde
r0.
10.
28Un
der
0.5
0.36
Unde
r0.
20.
21Un
der
1.7
0.22
Unde
r2.
30.
87N
.S.
Min
neap
olis
Com
m D
evel
Age
ncy
$SM
/WOB
E7
1990
–91
0.5
0.00
N.S
.0.
40.
00N
.S.
0.7
0.00
N.S
.1.
50.
00N
.S.
15.9
0.00
N.S
.M
inne
apol
is C
omm
Dev
el A
genc
y $
SM/W
OBE—
Empl
.7
1990
–91
0.2
0.00
N.S
.0.
10.
00N
.S.
0.2
0.00
N.S
.0.
50.
00N
.S.
4.5
0.00
N.S
.M
inne
apol
is C
omm
Dev
el A
genc
y $
Surv
ey—
Inte
rest
719
90–9
10.
70.
00N
.S.
1.0
0.00
N.S
.2.
30.
00N
.S.
0.7
0.00
N.S
.4.
60.
00N
.S.
12.4
0.00
N.S
.M
inne
apol
is C
omm
Dev
el A
genc
y $
Surv
ey—
Atte
mpt
719
90–9
10.
80.
00N
.S.
0.8
0.00
N.S
.2.
30.
00N
.S.
0.8
0.00
N.S
.4.
60.
00N
.S.
12.5
0.00
N.S
.
Min
neap
olis
Com
m D
evel
Age
ncy
$SM
/WOB
E25
319
92–9
40.
50.
25N
.S.
0.4
0.00
N.S
.0.
70.
26N
.S.
1.5
0.26
N.S
.15
.90.
00Un
der
Min
neap
olis
Com
m D
evel
Age
ncy
$SM
/WOB
E—Em
pl.
253
1992
–94
0.2
0.70
N.S
.0.
10.
00N
.S.
0.2
0.87
N.S
.0.
50.
86N
.S.
4.5
0.00
Unde
rM
inne
apol
is C
omm
Dev
el A
genc
y $
Surv
ey—
Inte
rest
253
1992
–94
0.7
0.17
N.S
.1.
00.
00N
.S.
2.3
0.00
Unde
r0.
70.
28N
.S.
4.6
0.09
Unde
r12
.40.
00Un
der
Min
neap
olis
Com
m D
evel
Age
ncy
$Su
rvey
—At
tem
pt25
319
92–9
40.
80.
15N
.S.
0.8
0.00
N.S
.2.
30.
00Un
der
0.8
0.24
N.S
.4.
60.
09Un
der
12.5
0.00
Unde
r
New
Orle
ans
$SM
/WOB
E—Em
pl.
3,17
819
86–8
90.
99.
85N
C0.
90.
00N
.S.
1.2
0.05
N.S
.3.
02.
94N
C7.
31.
23N
CN
ew O
rlean
s $
SM/W
OBE—
Empl
.14
,428
1989
–92
1.1
2.32
NC
0.8
0.09
N.S
.1.
90.
14N
.S.
3.8
0.76
N.S
.10
.3
New
Yor
k Ci
ty $
SM/W
OBE—
Empl
.28
6819
89–9
00.
74.
00Ov
er1.
50.
55N
.S.
3.8
0.65
Unde
r6.
01.
04C
12.8
0.34
Unde
rN
ew Y
ork
City
#SM
/WOB
E—Em
pl.
2868
1989
–90
0.8
2.80
Over
1.3
1.80
Over
3.8
0.90
Unde
r5.
91.
35C
12.9
0.72
Unde
r
NYC
Hou
sing
$SM
/WOB
E—Em
pl.
22,7
1319
88–9
23.
90.
48N
.S.
2.1
0.72
N.S
.3.
30.
33Un
der
10.4
0.65
N.S
.12
.00.
18Un
der
NYC
Hou
sing
#SM
/WOB
E—Em
pl.
22,7
1319
88–9
21.
31.
34N
C1.
60.
86Un
der
2.7
0.74
Unde
r6.
90.
93Un
der
12.7
0.68
Unde
rN
YC H
ousi
ng–S
mal
l Pur
chas
es $
SM/W
OBE—
Empl
.75
,230
1988
–92
2.4
1.42
NC
2.5
2.10
NC
3.4
0.72
Unde
r9.
51.
26N
C14
.30.
45Un
der
NYC
Hou
sing
–Sm
all P
urch
ases
#SM
/WOB
E—Em
pl.
75,2
3019
88–9
21.
91.
39N
C2.
21.
94N
C3.
40.
63Un
der
8.8
1.13
NC
14.3
0.66
Unde
r
New
Yor
k St
ate
$Bi
dder
s lis
tN
SFY
90–9
15.
30.
10Un
der
2.7
0.23
Unde
r2.
30.
16Un
der
0.7
0.01
Unde
r11
.00.
14Un
der
14.3
0.10
Unde
r
Oakl
and–
Scho
ols
$Su
rvey
—In
tere
st80
7719
91–9
222
.20.
04Un
der
8.4
0.11
Unde
r12
.90.
13Un
der
2.1
0.00
Unde
r45
.50.
08C
12.6
0.22
Unde
rOa
klan
d–Sc
hool
s $
Surv
ey—
Inte
rest
9984
1992
–93
22.2
0.04
Unde
r8.
40.
06Un
der
12.9
0.28
Unde
r2.
10.
00Un
der
45.5
0.11
C12
.60.
38Un
der
Oakl
and–
Scho
ols
$Su
rvey
—In
tere
st18
061
1991
–93
22.2
0.04
Unde
r8.
40.
08Un
der
12.9
0.23
Unde
r2.
10.
00Un
der
45.5
0.10
C12
.60.
32Un
der
Oran
ge C
ount
y, F
L $
SM/W
OBE
3119
901.
30.
38N
.S.
2.3
0.13
N.S
.N
S0.
27N
.S.
NS
0.19
N.S
.20
.00.
01N
.S.
Oran
ge C
ount
y, F
L $
SM/W
OBE
6319
911.
30.
23N
.S.
2.3
0.09
N.S
.N
S0.
19N
.S.
NS
0.14
N.S
.20
.00.
02N
.S.
Oran
ge C
ount
y, F
L $
SM/W
OBE
7019
921.
30.
38N
.S.
2.3
0.13
N.S
.N
S0.
27N
.S.
NS
0.27
N.S
.20
.00.
04N
.S.
Oran
ge C
ount
y, F
L–Pu
blic
Sch
ools
$SM
/WOB
E11
1990
1.3
0.00
Unde
r2.
30.
00Un
der
NS
0.00
Unde
rN
S0.
00Un
der
20.0
0.00
Unde
rOr
ange
Cou
nty,
FL–
Publ
ic S
choo
ls $
SM/W
OBE
2919
911.
30.
00Un
der
2.3
0.00
Unde
rN
S0.
00Un
der
NS
0.00
Unde
r20
.00.
17N
.S.
Oran
ge C
ount
y, F
L–Pu
blic
Sch
ools
$SM
/WOB
E36
1992
1.3
0.00
Unde
r2.
30.
00Un
der
NS
0.00
Unde
rN
S0.
00Un
der
20.0
0.00
Unde
r
Tabl
e A
.3b.
Evi
den
ce o
f D
isp
arit
y in
th
e G
ood
s In
du
stry
(C
onti
nu
ed)
AFRI
CAN
NAT
IVE
BACK
GROU
ND
AMER
ICAN
SLA
TIN
OSAS
IAN
SAM
ERIC
ANS
ALL
MIN
ORIT
IES
WOM
EN
# of
Disp
.St
at.
Disp
.St
at.
Disp
.St
at.
Disp
.St
at.
Disp
.St
at.
Disp
.St
at.
Sour
ceCo
nrta
cts
Year
Avai
l.Ra
tioSi
g.Av
ail.
Ratio
Sig.
Avai
l.Ra
tioSi
g.Av
ail.
Ratio
Sig.
Avai
l.Ra
tioSi
g.Av
ail.
Ratio
Sig.

THE URBANINSTITUTE
99
Con
tin
ued
Oran
ge C
o., F
L–Va
lenc
ia C
omm
Col
l $SM
/WOB
E26
1990
1.3
0.00
Unde
r2.
30.
00Un
der
NS
0.00
Unde
rN
S0.
00Un
der
20.0
0.00
N.S
.Or
ange
Co.
, FL–
Vale
ncia
Com
m C
oll $
SM/W
OBE
4619
911.
30.
02N
.S.
2.3
0.01
N.S
.N
S0.
00Un
der
NS
0.00
Unde
r20
.00.
00Un
der
Oran
ge C
o., F
L–Va
lenc
ia C
omm
Col
l $SM
/WOB
E58
1992
1.3
0.00
Unde
r2.
30.
00Un
der
NS
0.00
Unde
rN
S0.
00Un
der
20.0
0.05
??
Penn
sylv
ania
(SEP
TA)–
Lrg
Cont
r $SM
/WOB
E—Em
pl.
1883
1988
–92
0.8
1.09
NC
0.2
0.81
N.S
.0.
71.
26N
C1.
71.
13N
C8.
80.
02N
.S.
Penn
sylv
ania
(SEP
TA)–
Lrg
Cont
r #SM
/WOB
E—Em
pl.
1883
1988
–92
0.7
0.70
N.S
.0.
21.
04N
.S.
0.7
0.55
N.S
.1.
60.
68N
.S.
7.5
0.94
N.S
.Pe
nnsy
lvan
ia (S
EPTA
)–Sm
l Con
tr $
SM/W
OBE—
Empl
.68
530
1988
–92
0.8
1.01
NC
0.2
3.08
NC
0.8
0.35
Unde
r1.
70.
96N
.S.
8.0
0.75
Unde
rPe
nnsy
lvan
ia (S
EPTA
)–Sm
l Con
tr #
SM/W
OBE—
Empl
.68
530
1988
–92
0.9
1.30
Over
0.2
4.21
Over
0.8
0.34
Unde
r2.
01.
23Ov
er9.
11.
04Ov
er
Phoe
nix–
Men
$Re
gist
ered
40,9
59FY
87–9
31.
70.
11Un
der
0.7
0.12
Unde
r0.
10.
36Un
der
0.1
0.08
Unde
r3.
20.
23Un
der
Phoe
nix–
Wom
en $
Regi
ster
ed40
,959
FY87
–93
0.3
0.00
Unde
r0.
50.
13Un
der
0.1
1.13
N.S
.0.
00.
00Un
der
1.0
0.19
Unde
r5.
60.
38Un
der
Phoe
nix–
Men
$Su
rvey
—In
tere
st40
,959
FY87
–93
0.3
0.55
Unde
r1.
40.
06Un
der
1.0
0.04
Unde
r0.
30.
03Un
der
3.2
0.22
Unde
rPh
oeni
x–W
omen
$Su
rvey
—In
tere
st40
,959
FY87
–93
0.1
0.00
Unde
r1.
00.
06Un
der
0.4
0.21
Unde
r0.
20.
00Un
der
1.8
0.11
Unde
r14
.40.
15Un
der
Phoe
nix–
Men
$M
ailin
g lis
t40
,959
FY87
–93
1.8
0.10
Unde
r1.
00.
09Un
der
0.2
0.25
Unde
r0.
30.
04Un
der
4.9
0.14
Unde
rPh
oeni
x–W
omen
$M
ailin
g lis
t40
,959
FY87
–93
0.0
0.00
Unde
r0.
40.
16Un
der
0.1
1.00
N.S
.0.
10.
00Un
der
1.1
0.18
Unde
r6.
60.
32Un
der
Phoe
nix–
Men
and
Wom
en $
SM/W
OBE
40,9
59FY
87–9
30.
30.
56Un
der
1.6
0.09
Unde
r2.
50.
36Un
der
17.9
0.12
Unde
r
Pim
a Co
unty
, AZ
$SM
/WOB
E3,
856
FY90
–93
0.3
0.23
N.S
.6.
30.
12Un
der
1.0
0.32
Unde
r7.
60.
15Un
der
15.0
0.42
Unde
rPi
ma
Coun
ty, A
Z $
Surv
ey—
Inte
rest
3,85
6FY
90–9
30.
70.
10Un
der
6.5
0.11
Unde
r0.
90.
07Un
der
0.5
0.50
N.S
.8.
60.
13Un
der
14.2
0.44
Unde
rPi
ma
Coun
ty, A
Z $
Mai
ling
list
3,85
6FY
90–9
30.
70.
09Un
der
2.3
0.32
Unde
r0.
60.
10Un
der
0.4
0.69
N.S
.4.
00.
28Un
der
6.9
0.92
N.S
.
Prin
ce G
eorg
e’s
Coun
ty, M
D $
Surv
ey12
200
1988
30.0
0.28
NC
Prin
ce G
eorg
e’s
Coun
ty, M
D #
Surv
ey12
200
1988
30.0
0.65
NC
Ram
sey
Coun
ty, M
N $
SM/W
OBE
11,5
2619
85–8
90.
51.
54Ov
er0.
40.
09Un
der
0.7
0.98
N.S
.1.
50.
94N
.S.
15.9
0.04
Unde
rRa
mse
y Co
unty
, MN
$Su
rvey
—In
tere
st11
,526
1985
–89
0.7
0.94
N.S
.0.
90.
04Un
der
1.6
0.41
Unde
r0.
40.
07Un
der
3.9
0.37
Unde
r10
.60.
06Un
der
Ram
sey
Coun
ty, M
N $
Surv
ey—
Atte
mpt
11,5
2619
85–8
90.
80.
85N
.S.
0.8
0.04
Unde
r1.
50.
44Un
der
0.5
0.06
Unde
r4.
00.
36Un
der
10.4
0.06
Unde
rRa
mse
y Co
unty
, MN
$Re
gist
ered
11,5
2619
85–8
91.
50.
47Un
der
0.6
0.06
Unde
r1.
00.
66Un
der
0.6
0.05
Unde
r4.
30.
34Un
der
6.3
0.10
Unde
r
Ram
sey
Coun
ty, M
N $
SM/W
OBE
13,6
7419
90–9
40.
50.
45Un
der
0.4
1.12
N.S
.0.
70.
94N
.S.
1.5
0.84
Unde
r15
.90.
05Un
der
Ram
sey
Coun
ty, M
N $
Surv
ey—
Inte
rest
13,6
7419
90–9
40.
70.
28Un
der
0.9
0.50
Unde
r1.
60.
41Un
der
0.4
0.01
Unde
r3.
90.
33Un
der
10.6
0.07
Unde
rRa
mse
y Co
unty
, MN
$Su
rvey
—At
tem
pt13
,674
1990
–94
0.8
0.25
Unde
r0.
80.
51Un
der
1.5
0.44
Unde
r0.
50.
01Un
der
4.0
0.32
Unde
r10
.40.
07Un
der
Ram
sey
Coun
ty, M
N $
Regi
ster
ed13
,674
1990
–94
1.5
0.14
Unde
r0.
60.
75Un
der
1.0
0.66
Unde
r0.
60.
01Un
der
4.3
0.30
Unde
r6.
30.
12Un
der
Rich
mon
d, C
A $
Surv
ey—
Inte
rest
1681
1990
–92
7.9
1.01
N.S
.8.
40.
02Un
der
7.1
0.07
Unde
r1.
30.
00N
.S.
24.8
0.35
Unde
r6.
90.
03Un
der
Sacr
amen
to $
Dire
cs./M
ailin
g lis
t58
7419
902.
60.
02Un
der
6.1
0.07
Unde
r4.
80.
23Un
der
0.4
0.77
N.S
.14
.00.
14Un
der
18.9
0.26
Unde
rSa
cram
ento
$Di
recs
./Mai
ling
list
7634
1991
2.6
0.10
Unde
r6.
10.
09Un
der
4.8
0.17
Unde
r0.
40.
77N
.S.
14.0
0.14
Unde
r18
.90.
13Un
der
St. P
aul,
MN
$Re
gist
ered
22,2
7219
90–9
41.
50.
16Un
der
0.6
0.20
Unde
r1.
00.
62Un
der
0.6
0.15
Unde
r4.
30.
25Un
der
6.3
0.31
Unde
rSt
. Pau
l, M
N $
Surv
ey—
Inte
rest
22,2
7219
90–9
40.
70.
32Un
der
0.9
0.13
Unde
r1.
60.
38Un
der
0.4
0.23
Unde
r3.
90.
27Un
der
10.6
0.18
Unde
rSt
. Pau
l, M
N $
SM/W
OBE
22,2
7219
90–9
40.
50.
52Un
der
0.4
0.29
Unde
r0.
71.
01N
.S.
1.5
0.70
Unde
r15
.90.
12Un
der
St. P
aul,
MN
–Sch
ool D
ist.
625
$SM
/WOB
E10
901
1988
–91
0.5
0.90
N.S
.0.
40.
03Un
der
0.7
1.90
Over
1.5
1.18
Over
15.9
0.14
Unde
rSt
. Pau
l, M
N–S
choo
l Dis
t. 62
5 $
SM/W
OBE—
Empl
.10
901
1988
–91
0.2
2.42
Over
0.1
0.18
Unde
r0.
26.
39Ov
er0.
54.
01Ov
er4.
40.
53Un
der
St. P
aul,
MN
–Sch
ool D
ist.
625
$Su
rvey
—In
tere
st10
901
1988
–91
0.8
0.55
Unde
r0.
90.
01Un
der
1.6
0.80
Unde
r0.
40.
12Un
der
3.9
0.46
Unde
r10
.70.
22Un
der
St. P
aul,
MN
–Sch
ool D
ist.
625
$Su
rvey
—At
tem
pt10
901
1988
–91
0.8
0.49
Unde
r0.
80.
02Un
der
1.5
0.86
N.S
.0.
50.
10Un
der
4.0
0.45
Unde
r10
.40.
22Un
der
APPENDIX: STUDY METHODS

DO MINORITY-OWNED BUSINESSES GET A FAIR SHARE OF GOVERNMENT CONTRACTS?100
THE URBANINSTITUTE
St. P
aul,
MN
–Sch
ool D
ist.
625
$SM
/WOB
E13
007
1992
–94
0.5
0.49
Unde
r0.
40.
19Un
der
0.7
0.91
N.S
.1.
50.
63Un
der
15.9
0.15
Unde
rSt
. Pau
l, M
N–S
choo
l Dis
t. 62
5 $
SM/W
OBE—
Empl
.13
007
1992
–94
0.2
1.32
N.S
.0.
11.
01N
.S.
0.2
3.07
Over
0.5
2.16
Over
4.4
0.54
Unde
rSt
. Pau
l, M
N–S
choo
l Dis
t. 62
5 $
Surv
ey—
Inte
rest
1300
719
92–9
40.
80.
30Un
der
0.9
0.09
Unde
r1.
60.
39Un
der
0.4
0.03
Unde
r3.
90.
25Un
der
10.7
0.22
Unde
rSt
. Pau
l, M
N–S
choo
l Dis
t. 62
5 $
Surv
ey—
Atte
mpt
1300
719
92–9
40.
80.
27Un
der
0.8
0.09
Unde
r1.
50.
42Un
der
0.5
0.02
Unde
r4.
00.
24Un
der
10.4
0.23
Unde
r
San
Anto
nio–
Bexa
r Co.
–VIA
Met
ro T
rans
$Di
rect
orie
s21
,269
1986
–90
1.4
0.23
N.S
.14
.20.
37Un
der
0.9
0.53
N.S
.16
.50.
37C
12.9
0.46
Unde
rSa
n An
toni
o–Be
xar C
o.–V
IA M
etro
Tra
ns #
Dire
ctor
ies
21,2
6919
86–9
00.
91.
24Ov
er14
.40.
66Un
der
1.0
0.54
Unde
r16
.30.
69C
12.1
0.77
Unde
rSa
n An
toni
o–Ci
ty W
ater
Boa
rd $
Dire
ctor
ies
349
1986
–90
0.9
3.21
N.S
.13
.40.
47N
.S.
0.8
0.18
N.S
.15
.10.
62C
12.9
0.34
Unde
rSa
n An
toni
o–Ci
ty W
ater
Boa
rd #
Dire
ctor
ies
349
1986
–90
1.0
0.84
N.S
.13
.90.
60Un
der
0.9
1.34
N.S
.15
.80.
65C
11.5
0.72
N.S
.Sa
n An
toni
o–Ci
ty $
Dire
ctor
ies
13,0
2619
86–8
71.
05.
26Ov
er16
.10.
49N
.S.
0.9
1.29
N.S
.18
.00.
80C
9.4
1.21
N.S
.Sa
n An
toni
o–Ci
ty #
Dire
ctor
ies
13,0
2619
86–8
71.
00.
22Un
der
14.6
1.22
Over
1.0
0.73
Unde
r16
.61.
13C
12.2
1.13
Over
San
Anto
nio–
City
$Di
rect
orie
s11
,508
1989
–90
1.1
0.30
N.S
.16
.11.
82Ov
er1.
10.
55N
.S.
18.3
1.66
C9.
51.
18N
.S.
San
Anto
nio–
City
#Di
rect
orie
s11
,508
1989
–90
1.0
1.47
Over
14.2
1.21
Over
1.0
0.52
Unde
r16
.21.
18C
11.9
1.07
Over
San
Jose
, CA–
Proc
urem
ent &
Pro
f Ser
v $
Surv
ey—
Inte
rest
1387
1990
–93
6.2
0.06
Unde
r10
.50.
13Un
der
12.2
0.15
Unde
r0.
50.
65N
.S.
29.4
0.13
C13
.70.
45Un
der
Tam
pa $
Cert.
/Bid
ders
list
12,5
0719
883.
80.
11Un
der
3.9
0.03
Unde
r1.
10.
00Un
der
8.8
0.06
C12
.40.
05Un
der
Tam
pa $
Cert.
/Reg
iste
red
12,5
0719
881.
70.
24Un
der
1.1
0.10
Unde
r0.
30.
00Un
der
3.1
0.17
C1.
30.
49Un
der
Tam
pa $
Cert.
/Bid
ders
list
12,9
8419
893.
30.
08Un
der
4.1
0.03
Unde
r1.
20.
02Un
der
8.6
0.05
C12
.50.
04Un
der
Tam
pa $
Cert.
/Reg
iste
red
12,9
8419
891.
00.
26Un
der
1.3
0.11
Unde
r0.
30.
07Un
der
2.6
0.16
C1.
50.
36Un
der
Tam
pa $
Cert.
/Bid
ders
list
9,13
819
903.
30.
04Un
der
4.1
0.03
Unde
rn/
p0.
00Un
der
45.5
0.01
Unde
rTa
mpa
$Ce
rt./R
egis
tere
d9,
138
1990
1.0
0.14
Unde
r1.
30.
11Un
der
n/p
0.00
Unde
r5.
50.
11Un
der
Texa
s $
SM/W
OBE—
Empl
.N
S9/
88–8
/91
0.8
0.88
N.S
.2.
90.
62Un
der
1.2
0.51
N.S
.4.
90.
64Un
der
7.5
0.63
Unde
rTe
xas
#SM
/WOB
E—Em
pl.
NS
9/88
–8/9
11.
10.
36Un
der
5.3
0.45
Unde
r1.
30.
39Un
der
7.6
0.43
Unde
r10
.30.
55Un
der
Texa
s $
SM/W
OBE—
Empl
.N
S9/
91–8
/93
0.8
0.33
Unde
r3.
10.
56Un
der
1.1
1.75
N.S
.5.
00.
79N
.S.
7.6
0.78
Unde
rTe
xas
#SM
/WOB
E—Em
pl.
NS
9/91
–8/9
31.
10.
44Un
der
5.8
0.46
Unde
r1.
40.
53Un
der
8.3
0.47
Unde
r10
.80.
57Un
der
Tucs
on $
SM/W
OBE
2160
1991
–94
0.3
0.53
N.S
.6.
30.
09Un
der
1.0
0.16
N.S
.7.
60.
12Un
der
15.0
0.26
Unde
rTu
cson
$Su
rvey
—In
tere
st21
6019
91–9
40.
70.
24Un
der
6.5
0.08
Unde
r0.
90.
07N
.S.
0.5
0.20
N.S
.8.
60.
10Un
der
14.2
0.28
Unde
rTu
cson
$M
ailin
g lis
t21
6019
91–9
40.
70.
25N
.S.
3.0
0.18
Unde
r0.
90.
06Un
der
0.7
0.15
Unde
r5.
30.
17Un
der
7.3
0.54
Unde
r
Not
es: U
nle
ss o
ther
wis
e in
dic
ated
, “W
omen
” in
clu
des
min
orit
y w
omen
an
d “
All
Min
orit
ies”
doe
s n
ot i
ncl
ud
e w
hit
e w
omen
. A “
$” a
fter
th
e st
ud
y n
ame
ind
icat
es d
isp
arit
y re
fers
to
the
dol
lar
valu
e of
con
trac
ts a
war
ded
; a “
#” i
nd
icat
es d
isp
arit
y re
fers
to
the
nu
mbe
r of
con
trac
ts a
war
ded
. “U
nd
er”,
“O
ver”
, an
d “
N.S
.” i
n t
he
“Sta
t S
ig.”
col
um
n i
nd
icat
es s
tati
stic
ally
sig
nifi
can
t u
nd
eru
tili
zati
on, s
tati
stic
ally
sign
ific
ant
over
uti
liza
tion
, an
d n
ot s
ign
ific
antl
y d
iffe
ren
t fr
om o
ne,
res
pec
tive
ly. N
C s
tan
ds
for
stat
isti
cal
sign
ific
ance
not
cal
cula
ted
in
stu
dy.
C s
tan
ds
for
avai
labi
lity
an
d d
isp
arit
y ra
tio
calc
ula
ted
by
auth
ors.
NA
sta
nd
s fo
r n
o av
aila
bili
ty, t
her
efor
e ca
nn
ot c
alcu
late
dis
par
ity
rati
o. A
bla
nk
ind
icat
es s
tud
y d
id n
ot r
epor
t th
is fi
gure
.T
he
avai
labi
lity
mea
sure
“S
M/W
OB
E—
Em
pl”
on
ly i
ncl
ud
es fi
rms
wit
h p
aid
em
plo
yees
. S
ee a
lso
stu
dy-
spec
ific
not
es a
t en
d o
f ta
ble.
”
Tabl
e A
.3b.
Evi
den
ce o
f D
isp
arit
y in
th
e G
ood
s In
du
stry
(C
onti
nu
ed)
AFRI
CAN
NAT
IVE
BACK
GROU
ND
AMER
ICAN
SLA
TIN
OSAS
IAN
SAM
ERIC
ANS
ALL
MIN
ORIT
IES
WOM
EN
# of
Disp
.St
at.
Disp
.St
at.
Disp
.St
at.
Disp
.St
at.
Disp
.St
at.
Disp
.St
at.
Sour
ceCo
ntra
cts
Year
Avai
l.Ra
tioSi
g.Av
ail.
Ratio
Sig.
Avai
l.Ra
tioSi
g.Av
ail.
Ratio
Sig.
Avai
l.Ra
tioSi
g.Av
ail.
Ratio
Sig.

TH
E U
RB
AN
INS
TIT
UT
E
101
Continued
Table A.3c. Evidence of Disparity in the Professional Services Industry
AFRICAN NATIVEBACKGROUND AMERICANS LATINOS ASIANS AMERICANS ALL MINORITIES WOMEN
# of Disp. Stat. Disp. Stat. Disp. Stat. Disp. Stat. Disp. Stat. Disp. Stat.Source Contractors Year Avail. Ratio Sig. Avail. Ratio Sig. Avail. Ratio Sig. Avail. Ratio Sig. Avail. Ratio Sig. Avail. Ratio Sig.
PROFESSIONAL SERVICES
Alameda County, CA–Large Contract $ SM/WOBE 426 1987–90 4.5 2.70 N.S. 2.3 0.51 N.S. 5.6 0.73 N.S. 12.4 1.40 C 21.3 0.79 N.S.Alameda County, CA–Large Contract # SM/WOBE 426 1987–90 4.3 1.10 N.S. 2.4 0.88 N.S. 6.3 0.67 N.S. 13.0 0.85 C 19.3 1.71 N.S.
Alameda County, CA–Small Contract $ SM/WOBE 10,685 1987–90 4.4 1.20 N.S. 2.9 0.29 N.S. 10.7 0.11 N.S. 18.0 0.41 C 27.1 0.30 N.S.Alameda County, CA–Small Contract # SM/WOBE 10,685 1987–90 5.6 1.00 N.S. 5.4 0.13 Under 13.1 0.13 Under 24.1 0.33 C 22.7 0.24 Under
Albuquerque, NM–Prof Design $ SM/WOBE 1,182 1989–93 0.0 NA NA 5.1 3.25 Over 0.4 0.91 N.S. 0.8 0.00 Under 6.3 2.70 Over 4.3 0.43 UnderAlbuquerque, NM–Prof Design $ Survey—Interest 1,182 1989–93 0.0 NA NA 10.7 1.54 Over 1.3 0.27 Under 6.0 0.00 Under 18.1 0.94 N.S. 6.7 0.28 UnderAlbuquerque, NM–Prof Design $ Survey—Attempt 1,182 1989–93 0.0 NA NA 9.5 1.75 Over 2.1 0.17 Under 3.2 0.00 Under 14.7 1.15 Over 6.3 0.29 UnderAlbuquerque, NM–Prof Design $ Registered 1,182 1989–93 2.5 0.00 Under 16.6 1.00 N.S. 2.1 0.17 Under 3.4 0.00 Under 24.5 0.69 Under 13.6 0.14 UnderAlbuquerque, NM–Prof Design $ CIP Bidders list 1,182 1989–93 0.0 NA NA 12.2 1.36 Over 2.2 0.17 Under 1.4 0.00 Under 15.8 1.07 N.S. 7.2 0.26 UnderAlbuquerque, NM–Prof Design $ Case Study 1,182 1989–93 0.0 NA NA 12.9 1.28 Over 1.8 0.20 Under 0.2 0.00 N.S. 14.9 1.14 Over 3.9 0.47 Under
Albuquerque, NM–Prof Design $ SM/WOBE 197 1994–95 0.0 NA NA 5.1 2.27 Over 0.4 8.18 Over 0.8 0.00 N.S. 6.3 2.35 Over 4.3 0.43 N.S.Albuquerque, NM–Prof Design $ Survey—Interest 197 1994–95 0.0 NA NA 10.7 1.08 N.S. 1.3 2.39 Over 6.0 0.00 Under 18.1 0.81 N.S. 6.7 0.28 UnderAlbuquerque, NM–Prof Design $ Survey—Attempt 197 1994–95 0.0 NA NA 9.5 1.22 N.S. 2.1 1.52 N.S. 3.2 0.00 Under 14.7 1.00 N.S. 6.3 0.29 UnderAlbuquerque, NM–Prof Design $ Registered 197 1994–95 2.5 0.00 Under 16.6 0.70 N.S. 2.1 1.53 N.S. 3.4 0.00 Under 24.5 0.60 Under 13.6 0.14 UnderAlbuquerque, NM–Prof Design $ CIP Bidders list 197 1994–95 0.0 NA NA 12.2 0.94 N.S. 2.2 1.49 N.S. 1.4 0.00 N.S. 15.8 0.93 N.S. 7.2 0.26 UnderAlbuquerque, NM–Prof Design $ Case Study 197 1994–95 0.0 NA NA 12.9 0.89 N.S. 1.8 1.82 N.S. 0.2 0.00 N.S. 14.9 0.99 N.S. 3.9 0.47 N.S.
Albuquerque, NM–Other Prof Service $ SM/WOBE 909 1989–93 0.3 0.98 N.S. 4.9 0.03 Under 0.2 0.00 N.S. 0.3 0.00 N.S. 5.6 0.07 Under 6.5 0.25 UnderAlbuquerque, NM–Other Prof Service $ Survey—Interest 909 1989–93 1.1 0.22 Under 14.5 0.01 Under 1.4 0.00 Under 1.1 0.00 Under 18.2 0.02 Under 15.1 0.11 UnderAlbuquerque, NM–Other Prof Service $ Survey—Attempt 909 1989–93 0.0 NA NA 12.6 0.01 Under 1.5 0.00 Under 0.7 0.00 Under 14.8 0.03 Under 19.3 0.08 UnderAlbuquerque, NM–Other Prof Service $ Registered 909 1989–93 2.6 0.10 Under 8.2 0.02 Under 1.6 0.00 Under 1.8 0.00 Under 14.3 0.03 Under 12.4 0.13 Under
Albuquerque, NM–Other Prof Service $ SM/WOBE 339 1994–95 0.3 0.00 N.S. 4.9 0.11 Under 0.2 0.15 N.S. 0.3 0.00 N.S. 5.6 0.10 Under 6.5 0.72 N.S.Albuquerque, NM–Other Prof Service $ Survey—Interest 339 1994–95 1.1 0.00 Under 14.5 0.04 Under 1.4 0.02 Under 1.1 0.00 Under 18.2 0.03 Under 15.1 0.31 UnderAlbuquerque, NM–Other Prof Service $ Survey—Attempt 339 1994–95 0.0 NA NA 12.6 0.04 Under 1.5 0.02 Under 0.7 0.00 N.S. 14.8 0.04 Under 19.3 0.24 UnderAlbuquerque, NM–Other Prof Service $ Registered 339 1994–95 2.6 0.00 Under 8.2 0.07 Under 1.6 0.02 Under 1.8 0.00 Under 14.3 0.04 Under 12.4 0.37 Under
Cincinnati–All Bidders # Cert./Registered 1245 1990–91 5.7 0.21 Under 2.1 0.11 Under 1.0 0.57 N.S. 0.5 0.00 N.S.Cincinnati–All Bidders # Registered 1245 1990–91 31.5 0.15 Under 6.7 0.08 UnderCincinnati–CMSA # Cert./Registered 1205 1990–91 6.1 0.20 Under 2.2 0.11 Under 0.9 0.63 N.S. 0.6 0.00 N.S.Cincinnati–CMSA # Registered 1205 1990–91 31.9 0.15 Under 7.2 0.08 Under
AP
PE
ND
IX: S
TU
DY
ME
TH
OD
S

DO MINORITY-OWNED BUSINESSES GET A FAIR SHARE OF GOVERNMENT CONTRACTS?102
THE URBANINSTITUTE
Cont
ra C
osta
Cou
nty,
CA
$SM
/WOB
E—Em
pl.
6769
1987
–89
3.7
0.43
Unde
r4.
60.
20Un
der
7.8
0.11
Unde
r16
.00.
21C
23.2
0.21
Unde
rCo
ntra
Cos
ta C
ount
y, C
A #
SM/W
OBE—
Empl
.67
6919
87–8
93.
90.
22Un
der
5.2
0.15
Unde
r7.
90.
11Un
der
17.1
0.15
C22
.30.
28Un
der
Cont
ra C
osta
Cou
nty,
CA
$SM
/WOB
E—Em
pl.
2166
1989
–90
6.0
0.04
N.S
.6.
20.
07N
.S.
11.8
0.29
N.S
.23
.90.
17C
43.5
0.18
Unde
rCo
ntra
Cos
ta C
ount
y, C
A #
SM/W
OBE—
Empl
.21
6619
89–9
05.
30.
11Un
der
5.6
0.07
Unde
r11
.10.
09Un
der
22.0
0.09
C34
.20.
24Un
der
Dalla
s–Ci
ty–A
rch
& E
ng $
Vend
ors
list
NS
1990
–93
7.8
1.05
Over
6.6
2.76
Over
1.9
0.87
Unde
r0.
0N
AN
A16
.31.
73C
6.1
0.13
Unde
rDa
llas–
City
–Oth
er P
rof S
ervi
ce $
Vend
ors
list
NS
1990
–93
8.0
0.22
Unde
r4.
91.
35Ov
er1.
30.
26Un
der
0.2
0.01
Unde
r14
.30.
61C
6.8
0.19
Unde
rDa
llas–
PMSA
–Arc
h &
Eng
$Ve
ndor
s lis
tN
S19
90–9
36.
50.
81Un
der
6.2
1.76
Over
3.4
0.73
Unde
r0.
32.
47Ov
er16
.41.
19C
7.6
0.29
Unde
rDa
llas–
PMSA
–Oth
er P
rof S
ervi
ce $
Vend
ors
list
NS
1990
–93
6.0
0.35
Unde
r3.
41.
01Ov
er2.
30.
39Un
der
0.3
0.69
Unde
r11
.90.
55C
6.0
0.44
Unde
r
Dalla
s/Fo
rt W
orth
Airp
ort $
SM/W
OBE
NS
1987
9.3
1.97
NC
11.2
0.00
NC
Dalla
s/Fo
rt W
orth
Airp
ort $
SM/W
OBE
NS
1988
–92
20.5
1.63
NC
Denv
er R
TD #
SM/W
OBE—
Empl
.22
8219
87–9
12.
80.
68Un
der
4.4
0.96
N.S
.4.
00.
23Un
der
11.2
0.63
C35
.00.
14Un
der
Denv
er R
TD $
SM/W
OBE—
Empl
.22
8219
87–9
11.
60.
63N
.S.
2.5
0.88
N.S
.2.
22.
08?
6.3
1.24
C23
.80.
38N
.S.
Denv
er R
TD–F
eder
al #
SM/W
OBE—
Empl
.49
1987
–91
2.8
0.00
N.S
.4.
40.
92N
.S.
4.0
2.05
?11
.21.
09C
35.0
0.17
Unde
rDe
nver
RTD
–Fed
eral
$SM
/WOB
E—Em
pl.
4919
87–9
11.
60.
00N
.S.
2.5
0.07
N.S
.2.
22.
23?
6.3
0.81
C23
.80.
03N
.S.
Flor
ida–
Road
/Tra
nspo
rtatio
n–Pr
imes
$SM
/WOB
E1,
022
1985
–89
1.4
0.09
N.S
.8.
01.
64Ov
er2.
60.
00Un
der
0.0
0.00
N.S
.12
.11.
10N
.S.
25.2
0.00
Unde
rFl
orid
a–Ro
ad/T
rans
porta
tion–
Prim
es #
SM/W
OBE
1,02
219
85–8
91.
40.
14Un
der
8.0
1.13
N.S
.2.
60.
04Un
der
0.0
0.00
N.S
.12
.10.
77Un
der
25.2
0.00
Unde
rFl
orid
a–Ro
ad/T
rans
porta
tion–
Subs
$SM
/WOB
E29
819
85–8
91.
40.
00N
.S.
8.0
0.25
N.S
.2.
60.
00N
.S.
0.0
0.00
N.S
.12
.10.
17Un
der
25.2
0.00
Unde
rFl
orid
a–Ro
ad/T
rans
porta
tion–
Subs
#SM
/WOB
E29
819
85–8
91.
40.
00Un
der
8.0
0.29
Unde
r2.
60.
25Un
der
0.0
0.00
N.S
.12
.10.
25Un
der
25.2
0.00
Unde
rFo
rt W
orth
–City
$Su
rvey
—In
tere
stN
S19
88–9
33.
00.
98N
.S.
2.8
2.11
Over
1.7
1.97
Over
1.3
1.48
Over
9.3
1.54
Over
11.2
0.10
Unde
rFo
rt W
orth
–City
$M
ailin
g lis
tN
S19
88–9
33.
20.
91N
C2.
22.
69N
C1.
22.
74N
C1.
01.
91N
C8.
61.
65N
C4.
70.
24N
C
Fort
Wor
th–T
rans
porta
tion
$Su
rvey
—In
tere
st10
319
91–9
313
.10.
00Un
der
10.7
0.61
Unde
rFo
rt W
orth
–Tra
nspo
rtatio
n #
Surv
ey—
Inte
rest
103
1991
–93
13.1
0.07
Unde
r10
.70.
64Un
der
Fort
Wor
th–T
rans
porta
tion
$M
ailin
g lis
t10
319
91–9
35.
60.
00N
.S.
2.4
2.72
N.S
.Fo
rt W
orth
–Tra
nspo
rtatio
n #
Mai
ling
list
103
1991
–93
5.6
0.17
N.S
.2.
42.
83N
.S.
Gree
nsbo
ro, N
C–M
SA $
SM/W
OBE
NS
1987
6.8
2.30
Over
25.7
0.16
Unde
r
Hayw
ard,
CA
$SM
/WOB
E3,
939
1986
–92
3.4
0.57
N.S
.5.
90.
01N
.S.
12.5
0.21
Unde
r21
.80.
21C
17.5
0.05
Unde
rHa
ywar
d, C
A #
SM/W
OBE
3,93
919
86–9
25.
80.
12Un
der
8.4
0.02
Unde
r15
.40.
06Un
der
29.6
0.06
C26
.70.
03Un
der
Henn
epin
Cou
nty,
MN
–Acc
t Pay
able
$Su
rvey
—In
tere
st1,
332
1981
–86
1.6
0.00
Unde
r0.
40.
00Un
der
0.9
0.00
Unde
r1.
00.
00Un
der
4.0
0.00
Unde
r15
.30.
06Un
der
Henn
epin
Cou
nty,
MN
–Acc
t Pay
able
$Su
rvey
—At
tem
pt1,
332
1981
–86
2.1
0.00
Unde
r0.
70.
00Un
der
1.1
0.00
Unde
r0.
70.
00Un
der
4.6
0.00
Unde
r16
.10.
06Un
der
Henn
epin
Cou
nty,
MN
–Acc
t Pay
able
$Su
rvey
—In
tere
st1,
425
1987
–93
1.6
0.12
Unde
r0.
40.
26N
.S.
0.9
0.18
Unde
r1.
00.
02Un
der
4.0
0.12
Unde
r15
.30.
08Un
der
Henn
epin
Cou
nty,
MN
–Acc
t Pay
able
$Su
rvey
—At
tem
pt1,
425
1987
–93
2.1
0.09
Unde
r0.
70.
16Un
der
1.1
0.15
Unde
r0.
70.
03Un
der
4.6
0.11
Unde
r16
.10.
08Un
der
Tabl
e A
.3c.
Evi
den
ce o
f D
isp
arit
y in
th
e P
rofe
ssio
nal
Ser
vice
s In
du
stry
(C
onti
nu
ed)
AFRI
CAN
NAT
IVE
BACK
GROU
ND
AMER
ICAN
SLA
TIN
OSAS
IAN
SAM
ERIC
ANS
ALL
MIN
ORIT
IES
WOM
EN
# of
Disp
.St
at.
Disp
.St
at.
Disp
.St
at.
Disp
.St
at.
Disp
.St
at.
Disp
.St
at.
Sour
ceCo
ntra
cts
Year
Avai
l.Ra
tioSi
g.Av
ail.
Ratio
Sig.
Avai
l.Ra
tioSi
g.Av
ail.
Ratio
Sig.
Avai
l.Ra
tioSi
g.Av
ail.
Ratio
Sig.

THE URBANINSTITUTE
103
Con
tin
ued
Hous
ton–
Arch
& E
ng $
Cert.
/Bid
ders
list
NS
1986
–93
4.7
1.61
Over
8.0
1.25
Over
10.8
0.72
Unde
r1.
10.
96N
.S.
24.7
1.08
C3.
60.
94N
.S.
Hous
ton–
Othe
r Pro
f Ser
vice
$SM
/WOB
E18
619
86–9
38.
53.
57Ov
er4.
40.
40Un
der
4.5
0.51
Unde
r0.
03.
03Ov
er17
.41.
98C
16.3
0.34
Unde
r
Jack
sonv
ille–
City
$Ce
rt./B
idde
rs li
stN
S19
864.
90.
02Un
der
2.4
0.79
N.S
.3.
70.
00N
C12
.80.
15Un
der
1.8
0.00
NC
Jack
sonv
ille–
City
$Ce
rt./B
idde
rs li
stN
S19
874.
60.
00N
C2.
30.
60N
.S.
3.5
0.00
NC
12.1
0.11
Unde
r1.
70.
00N
CJa
ckso
nvill
e–Ci
ty $
Cert.
/Bid
ders
list
NS
1988
4.6
0.00
NC
2.3
0.86
N.S
.3.
50.
27N
.S.
12.1
0.24
Unde
r1.
70.
00N
CA
Jack
sonv
ille–
City
$Ce
rt./B
idde
rs li
stN
S19
894.
60.
45N
.S.
2.3
2.50
N.S
.3.
50.
33N
.S.
12.1
0.74
N.S
.1.
70.
00N
C
Jack
sonv
ille–
Elec
tric
Auth
ority
$Ce
rt./B
idde
rs li
stN
S19
864.
90.
00N
C2.
40.
00N
C3.
70.
00N
CN
S0.
00N
C1.
80.
00N
CJa
ckso
nvill
e–El
ectri
c Au
thor
ity $
Cert.
/Bid
ders
list
NS
1987
4.6
0.00
NC
2.3
0.00
NC
3.5
0.00
NC
NS
0.00
NC
1.7
0.00
NC
Jack
sonv
ille–
Elec
tric
Auth
ority
$Ce
rt./B
idde
rs li
stN
S19
884.
60.
00N
C2.
30.
00N
C3.
50.
00N
CN
S0.
00N
C1.
70.
00N
CJa
ckso
nvill
e–El
ectri
c Au
thor
ity $
Cert.
/Bid
ders
list
NS
1989
4.6
0.00
NC
2.3
0.00
NC
3.5
0.00
NC
NS
0.00
NC
1.7
0.00
NC
Jack
sonv
ille–
Port
Auth
ority
$Ce
rt./B
idde
rs li
stN
S19
866.
40.
00N
C14
.90.
00N
C2.
10.
00N
C44
.70.
00N
C21
.30.
00N
CJa
ckso
nvill
e–Po
rt Au
thor
ity $
Cert.
/Bid
ders
list
NS
1987
9.1
0.00
N.S
.21
.20.
00N
C3.
00.
00N
C63
.60.
00Un
der
30.3
0.00
NC
Jack
sonv
ille–
Port
Auth
ority
$Ce
rt./B
idde
rs li
stN
S19
889.
40.
06N
.S.
21.9
0.06
N.S
.3.
10.
06N
.S.
65.7
0.03
Unde
r31
.30.
01Un
der
Jack
sonv
ille–
Port
Auth
ority
$Ce
rt./B
idde
rs li
stN
S19
898.
10.
00N
C18
.90.
28N
.S.
2.7
0.00
NC
56.7
0.09
Unde
r27
.00.
00N
C
Jack
sonv
ille–
Scho
ol B
oard
$Ce
rt./B
idde
rs li
stN
S19
865.
70.
00N
C5.
20.
88N
.S.
3.4
10.0
0N
.S.
NS
2.22
N.S
.3.
40.
00N
CJa
ckso
nvill
e–Sc
hool
Boa
rd $
Cert.
/Bid
ders
list
NS
1987
5.5
0.81
N.S
.4.
90.
65N
.S.
3.3
0.00
NC
NS
0.45
N.S
.3.
30.
00N
CJa
ckso
nvill
e–Sc
hool
Boa
rd $
Cert.
/Bid
ders
list
NS
1988
5.5
0.84
N.S
.4.
90.
64N
.S.
3.3
0.00
NC
NS
0.46
N.S
.3.
30.
00N
CJa
ckso
nvill
e–Sc
hool
Boa
rd $
Cert.
/Bid
ders
list
NS
1989
5.5
0.41
N.S
.4.
90.
00N
C3.
30.
00N
CN
S0.
13Un
der
3.3
0.00
NC
Jeffe
rson
Cou
nty,
AL
#SM
/WOB
EN
S19
86–9
06.
01.
40Ov
er0.
50.
00Un
der
0.9
0.00
Unde
r7.
32.
62N
C32
.80.
16Un
der
Las
Vega
s–Ci
ty $
Surv
ey—
Inte
rest
167
1988
–92
1.6
0.00
N.S
.3.
10.
53N
.S.
2.4
0.00
Unde
r0.
52.
36N
.S.
7.6
0.41
Unde
r10
.70.
11Un
der
Las
Vega
s–Ci
ty $
Mai
ling
list
167
1988
–92
1.6
0.00
N.S
.1.
31.
30N
.S.
0.5
0.00
N.S
.0.
61.
92N
.S.
5.6
0.56
N.S
.3.
90.
32N
.S.
Las
Vega
s–Ci
ty $
Surv
ey—
Inte
rest
952
1993
1.6
0.20
Unde
r3.
10.
28Un
der
2.4
0.04
Unde
r0.
57.
37Ov
er7.
60.
68Un
der
10.7
0.17
Unde
rLa
s Ve
gas–
City
$M
ailin
g lis
t95
219
931.
60.
20Un
der
1.3
0.68
N.S
.0.
50.
18N
.S.
0.6
6.00
Over
5.6
0.92
N.S
.3.
90.
49Un
der
Las
Vega
s–Lo
cal A
rea
Gvts
$Su
rvey
—In
tere
st1,
268
1988
–92
1.6
0.00
Unde
r3.
10.
78N
.S.
2.4
0.13
Unde
r0.
50.
65N
.S.
7.6
0.41
Unde
r10
.70.
05Un
der
Las
Vega
s–Lo
cal A
rea
Gvts
$M
ailin
g lis
t1,
268
1988
–92
2.3
0.00
Unde
r2.
70.
90N
.S.
0.8
0.37
Unde
r0.
80.
41N
.S.
7.6
0.41
Unde
r4.
10.
14Un
der
Las
Vega
s–Lo
cal A
rea
Gvts
$Su
rvey
—In
tere
st3,
248
1990
–93
1.6
0.11
Unde
r3.
10.
60Un
der
2.4
0.46
Unde
r0.
50.
82N
.S.
7.6
0.48
Unde
r10
.70.
11Un
der
Las
Vega
s–Lo
cal A
rea
Gvts
$M
ailin
g lis
t3,
248
1990
–93
2.3
0.07
Unde
r2.
70.
69Un
der
0.8
1.31
N.S
.0.
80.
52Un
der
7.6
0.48
Unde
r4.
10.
27Un
der
Mar
icop
a Co
unty
, AZ
$Di
recs
./Reg
ist.
5819
87–8
83.
60.
00N
.S.
8.9
1.23
N.S
.10
.60.
41N
.S.
4.7
0.00
N.S
.27
.90.
58N
.S.
13.4
0.03
Unde
rM
aric
opa
Coun
ty, A
Z $
Dire
cs./R
egis
t.10
219
88–8
93.
60.
00N
.S.
8.9
0.60
N.S
.10
.60.
50N
.S.
4.7
0.00
N.S
.27
.90.
41N
.S.
13.4
0.00
N.S
.
Mar
ylan
d DO
T–Ar
ch &
Eng
$Se
lf–em
ploy
edN
SFY
91–9
32.
60.
31N
.S.
1.0
0.21
N.S
.2.
31.
36N
.S.
5.9
0.70
N.S
.9.
00.
08N
.S.
Mar
ylan
d DO
T–Ar
ch &
Eng
$Se
lf–em
ploy
edN
SFY
92–9
32.
61.
55N
C1.
01.
85N
C2.
32.
18N
C5.
91.
85N
C9.
00.
35N
C
Mas
sach
uset
ts–E
OTC
$SM
/WOB
E45
1981
–91
1.0
0.00
N.S
.0.
50.
00N
.S.
0.3
0.00
N.S
.0.
30.
00N
.S.
2.2
0.00
C20
.30.
06N
.S.
Mas
sach
uset
ts–M
assH
ighw
ay $
SM/W
OBE
2719
83–9
11.
05.
88Ov
er0.
50.
00N
.S.
0.3
0.00
N.S
.0.
30.
00N
.S.
2.2
2.64
C20
.30.
00N
.S.
Mas
sach
uset
ts–M
assH
ighw
ay A
&E
$Ce
rt./B
idde
rs li
st18
1983
–91
8.6
0.00
N.S
.2.
70.
00N
.S.
12.3
0.21
N.S
.0.
40.
00N
.S.
24.0
0.11
C16
.30.
00N
.S.
Mas
sach
uset
ts–M
ass
Aero
Com
m. $
SM/W
OBE
2819
81–9
11.
00.
00N
.S.
0.5
0.00
N.S
.0.
30.
00N
.S.
0.3
0.00
N.S
.2.
20.
00C
20.3
0.18
Unde
r
APPENDIX: STUDY METHODS
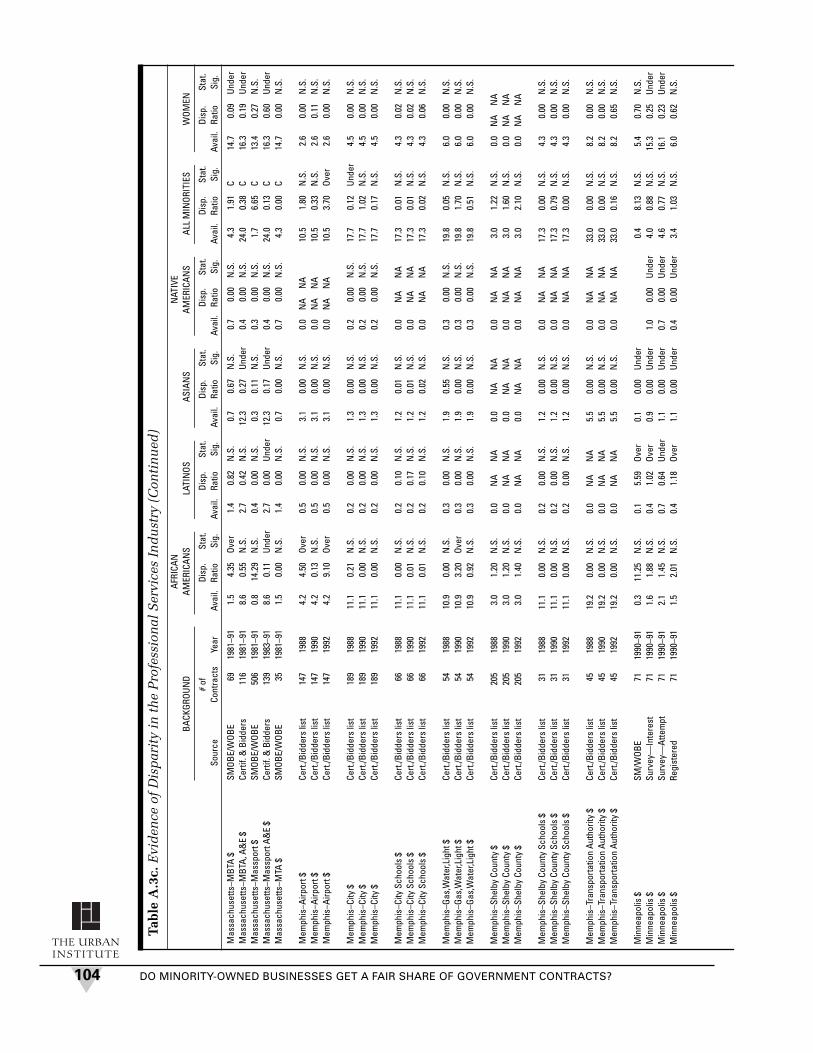
DO MINORITY-OWNED BUSINESSES GET A FAIR SHARE OF GOVERNMENT CONTRACTS?104
THE URBANINSTITUTE
Mas
sach
uset
ts–M
BTA
$SM
OBE/
WOB
E69
1981
–91
1.5
4.35
Over
1.4
0.82
N.S
.0.
70.
67N
.S.
0.7
0.00
N.S
.4.
31.
91C
14.7
0.09
Unde
rM
assa
chus
etts
–MBT
A, A
&E
$Ce
rtif.
& B
idde
rs11
619
81–9
18.
60.
55N
.S.
2.7
0.42
N.S
.12
.30.
27Un
der
0.4
0.00
N.S
.24
.00.
38C
16.3
0.19
Unde
rM
assa
chus
etts
–Mas
spor
t $SM
OBE/
WOB
E50
619
81–9
10.
814
.29
N.S
.0.
40.
00N
.S.
0.3
0.11
N.S
.0.
30.
00N
.S.
1.7
6.65
C13
.40.
27N
.S.
Mas
sach
uset
ts–M
assp
ort A
&E
$Ce
rtif.
& B
idde
rs13
919
83–9
18.
60.
11Un
der
2.7
0.00
Unde
r12
.30.
17Un
der
0.4
0.00
N.S
.24
.00.
13C
16.3
0.60
Unde
rM
assa
chus
etts
–MTA
$SM
OBE/
WOB
E35
1981
–91
1.5
0.00
N.S
.1.
40.
00N
.S.
0.7
0.00
N.S
.0.
70.
00N
.S.
4.3
0.00
C14
.70.
00N
.S.
Mem
phis
–Airp
ort $
Cert.
/Bid
ders
list
147
1988
4.2
4.50
Over
0.5
0.00
N.S
.3.
10.
00N
.S.
0.0
NA
NA
10.5
1.80
N.S
.2.
60.
00N
.S.
Mem
phis
–Airp
ort $
Cert.
/Bid
ders
list
147
1990
4.2
0.13
N.S
.0.
50.
00N
.S.
3.1
0.00
N.S
.0.
0N
AN
A10
.50.
33N
.S.
2.6
0.11
N.S
.M
emph
is–A
irpor
t $Ce
rt./B
idde
rs li
st14
719
924.
29.
10Ov
er0.
50.
00N
.S.
3.1
0.00
N.S
.0.
0N
AN
A10
.53.
70Ov
er2.
60.
00N
.S.
Mem
phis
–City
$Ce
rt./B
idde
rs li
st18
919
8811
.10.
21N
.S.
0.2
0.00
N.S
.1.
30.
00N
.S.
0.2
0.00
N.S
.17
.70.
12Un
der
4.5
0.00
N.S
.M
emph
is–C
ity $
Cert.
/Bid
ders
list
189
1990
11.1
0.00
N.S
.0.
20.
00N
.S.
1.3
0.00
N.S
.0.
20.
00N
.S.
17.7
1.02
N.S
.4.
50.
00N
.S.
Mem
phis
–City
$Ce
rt./B
idde
rs li
st18
919
9211
.10.
00N
.S.
0.2
0.00
N.S
.1.
30.
00N
.S.
0.2
0.00
N.S
.17
.70.
17N
.S.
4.5
0.00
N.S
.
Mem
phis
–City
Sch
ools
$Ce
rt./B
idde
rs li
st66
1988
11.1
0.00
N.S
.0.
20.
10N
.S.
1.2
0.01
N.S
.0.
0N
AN
A17
.30.
01N
.S.
4.3
0.02
N.S
.M
emph
is–C
ity S
choo
ls $
Cert.
/Bid
ders
list
6619
9011
.10.
01N
.S.
0.2
0.17
N.S
.1.
20.
01N
.S.
0.0
NA
NA
17.3
0.01
N.S
.4.
30.
02N
.S.
Mem
phis
–City
Sch
ools
$Ce
rt./B
idde
rs li
st66
1992
11.1
0.01
N.S
.0.
20.
10N
.S.
1.2
0.02
N.S
.0.
0N
AN
A17
.30.
02N
.S.
4.3
0.06
N.S
.
Mem
phis
–Gas
,Wat
er,L
ight
$Ce
rt./B
idde
rs li
st54
1988
10.9
0.00
N.S
.0.
30.
00N
.S.
1.9
0.55
N.S
.0.
30.
00N
.S.
19.8
0.05
N.S
.6.
00.
00N
.S.
Mem
phis
–Gas
,Wat
er,L
ight
$Ce
rt./B
idde
rs li
st54
1990
10.9
3.20
Over
0.3
0.00
N.S
.1.
90.
00N
.S.
0.3
0.00
N.S
.19
.81.
70N
.S.
6.0
0.00
N.S
.M
emph
is–G
as,W
ater
,Lig
ht $
Cert.
/Bid
ders
list
5419
9210
.90.
92N
.S.
0.3
0.00
N.S
.1.
90.
00N
.S.
0.3
0.00
N.S
.19
.80.
51N
.S.
6.0
0.00
N.S
.
Mem
phis
–She
lby
Coun
ty $
Cert.
/Bid
ders
list
205
1988
3.0
1.20
N.S
.0.
0N
AN
A0.
0N
AN
A0.
0N
AN
A3.
01.
22N
.S.
0.0
NA
NA
Mem
phis
–She
lby
Coun
ty $
Cert.
/Bid
ders
list
205
1990
3.0
1.20
N.S
.0.
0N
AN
A0.
0N
AN
A0.
0N
AN
A3.
01.
60N
.S.
0.0
NA
NA
Mem
phis
–She
lby
Coun
ty $
Cert.
/Bid
ders
list
205
1992
3.0
1.40
N.S
.0.
0N
AN
A0.
0N
AN
A0.
0N
AN
A3.
02.
10N
.S.
0.0
NA
NA
Mem
phis
–She
lby
Coun
ty S
choo
ls $
Cert.
/Bid
ders
list
3119
8811
.10.
00N
.S.
0.2
0.00
N.S
.1.
20.
00N
.S.
0.0
NA
NA
17.3
0.00
N.S
.4.
30.
00N
.S.
Mem
phis
–She
lby
Coun
ty S
choo
ls $
Cert.
/Bid
ders
list
3119
9011
.10.
00N
.S.
0.2
0.00
N.S
.1.
20.
00N
.S.
0.0
NA
NA
17.3
0.79
N.S
.4.
30.
00N
.S.
Mem
phis
–She
lby
Coun
ty S
choo
ls $
Cert.
/Bid
ders
list
3119
9211
.10.
00N
.S.
0.2
0.00
N.S
.1.
20.
00N
.S.
0.0
NA
NA
17.3
0.00
N.S
.4.
30.
00N
.S.
Mem
phis
–Tra
nspo
rtatio
n Au
thor
ity $
Cert.
/Bid
ders
list
4519
8819
.20.
00N
.S.
0.0
NA
NA
5.5
0.00
N.S
.0.
0N
AN
A33
.00.
00N
.S.
8.2
0.00
N.S
.M
emph
is–T
rans
porta
tion
Auth
ority
$Ce
rt./B
idde
rs li
st45
1990
19.2
0.00
N.S
.0.
0N
AN
A5.
50.
00N
.S.
0.0
NA
NA
33.0
0.00
N.S
.8.
20.
00N
.S.
Mem
phis
–Tra
nspo
rtatio
n Au
thor
ity $
Cert.
/Bid
ders
list
4519
9219
.20.
00N
.S.
0.0
NA
NA
5.5
0.00
N.S
.0.
0N
AN
A33
.00.
16N
.S.
8.2
0.65
N.S
.
Min
neap
olis
$SM
/WOB
E71
1990
–91
0.3
11.2
5N
.S.
0.1
5.59
Over
0.1
0.00
Unde
r0.
48.
13N
.S.
5.4
0.70
N.S
.M
inne
apol
is $
Surv
ey—
Inte
rest
7119
90–9
11.
61.
88N
.S.
0.4
1.02
Over
0.9
0.00
Unde
r1.
00.
00Un
der
4.0
0.88
N.S
.15
.30.
25Un
der
Min
neap
olis
$Su
rvey
—At
tem
pt71
1990
–91
2.1
1.45
N.S
.0.
70.
64Un
der
1.1
0.00
Unde
r0.
70.
00Un
der
4.6
0.77
N.S
.16
.10.
23Un
der
Min
neap
olis
$Re
gist
ered
7119
90–9
11.
52.
01N
.S.
0.4
1.18
Over
1.1
0.00
Unde
r0.
40.
00Un
der
3.4
1.03
N.S
.6.
00.
62N
.S.
Tabl
e A
.3c.
Evi
den
ce o
f D
isp
arit
y in
th
e P
rofe
ssio
nal
Ser
vice
s In
du
stry
(C
onti
nu
ed)
AFRI
CAN
NAT
IVE
BACK
GROU
ND
AMER
ICAN
SLA
TIN
OSAS
IAN
SAM
ERIC
ANS
ALL
MIN
ORIT
IES
WOM
EN
# of
Disp
.St
at.
Disp
.St
at.
Disp
.St
at.
Disp
.St
at.
Disp
.St
at.
Disp
.St
at.
Sour
ceCo
ntra
cts
Year
Avai
l.Ra
tioSi
g.Av
ail.
Ratio
Sig.
Avai
l.Ra
tioSi
g.Av
ail.
Ratio
Sig.
Avai
l.Ra
tioSi
g.Av
ail.
Ratio
Sig.

THE URBANINSTITUTE
105
Con
tin
ued
Min
neap
olis
$SM
/WOB
E1,
230
1992
–94
0.3
2.58
Over
0.1
2.48
N.S
.0.
11.
68N
.S.
0.4
2.39
Over
5.4
0.68
Unde
rM
inne
apol
is $
Surv
ey—
Inte
rest
1,23
019
92–9
41.
60.
43Un
der
0.4
0.45
N.S
.0.
90.
10Un
der
1.0
0.05
Unde
r4.
00.
26Un
der
15.3
0.24
Unde
rM
inne
apol
is $
Surv
ey—
Atte
mpt
1,23
019
92–9
42.
10.
33Un
der
0.7
0.28
Unde
r1.
10.
08Un
der
0.7
0.07
Unde
r4.
60.
23Un
der
16.1
0.23
Unde
rM
inne
apol
is $
Regi
ster
ed1,
230
1992
–94
1.5
0.46
Unde
r0.
40.
53N
.S.
1.1
0.08
Unde
r0.
40.
12N
.S.
3.4
0.30
Unde
r6.
00.
60Un
der
Min
neap
olis
Com
m D
evel
Age
ncy
$SM
/WOB
E96
1990
–91
0.3
0.00
N.S
.0.
10.
00N
.S.
0.1
12.1
9Ov
er0.
42.
24N
.S.
5.4
1.67
N.S
.M
inne
apol
is C
omm
Dev
el A
genc
y $
Surv
ey—
Inte
rest
9619
90–9
11.
60.
00N
.S.
0.4
0.00
N.S
.0.
90.
97N
.S.
1.0
0.10
N.S
.4.
00.
24N
.S.
15.3
0.59
N.S
.M
inne
apol
is C
omm
Dev
el A
genc
y $
Surv
ey—
Atte
mpt
9619
90–9
12.
10.
00N
.S.
0.7
0.00
N.S
.1.
10.
81N
.S.
0.7
0.15
N.S
.4.
60.
21N
.S.
16.1
0.56
N.S
.M
inne
apol
is C
omm
Dev
el A
genc
y $
Regi
ster
ed96
1990
–91
0.0
0.0
3.7
0.23
N.S
.0.
0N
AN
A3.
70.
26N
.S.
5.6
1.61
N.S
.
Min
neap
olis
Com
m D
evel
Age
ncy
$SM
/WOB
E29
719
92–9
40.
30.
00N
.S.
0.1
0.00
N.S
.0.
11.
63N
.S.
0.4
0.30
N.S
.5.
40.
99N
.S.
Min
neap
olis
Com
m D
evel
Age
ncy
$Su
rvey
—In
tere
st29
719
92–9
41.
60.
00Un
der
0.4
0.00
N.S
.0.
90.
15N
.S.
1.0
0.00
N.S
.4.
00.
03Un
der
15.3
0.35
Unde
rM
inne
apol
is C
omm
Dev
el A
genc
y $
Surv
ey—
Atte
mpt
297
1992
–94
2.1
0.00
Unde
r0.
70.
00N
.S.
1.1
0.12
N.S
.0.
70.
00N
.S.
4.6
0.03
Unde
r16
.10.
33Un
der
Min
neap
olis
Com
m D
evel
Age
ncy
$Re
gist
ered
297
1992
–94
0.0
NA
NA
0.0
NA
NA
3.7
0.03
Unde
r0.
0N
AN
A3.
70.
03Un
der
5.6
0.95
N.S
.
New
Mex
ico
$SM
/WOB
E22
319
89–9
40.
0N
AN
A5.
01.
63Ov
er0.
325
.74
Over
0.4
0.00
N.S
.5.
72.
66Ov
er4.
80.
27Un
der
New
Mex
ico
$Su
rvey
—In
tere
st22
319
89–9
43.
00.
00Un
der
20.2
0.40
Unde
r1.
64.
47Ov
er3.
40.
00Un
der
28.2
0.53
Unde
r6.
30.
20Un
der
New
Mex
ico
$Su
rvey
—At
tem
pt22
319
89–9
43.
20.
00Un
der
18.9
0.43
Unde
r1.
93.
71Ov
er2.
20.
00Un
der
26.2
0.58
Unde
r6.
90.
19Un
der
NYC
Hou
sing
$SM
/WOB
E—Em
pl.
1,05
119
88–9
21.
92.
55N
.S.
1.1
2.73
NC
2.8
1.36
NC
0.1
34.1
7N
C6.
02.
64N
C17
.20.
48N
.S.
NYC
Hou
sing
#SM
/WOB
E—Em
pl.
1,05
119
88–9
23.
00.
70N
.S.
1.6
0.97
N.S
.2.
41.
47N
C0.
25.
28N
C7.
11.
17N
C14
.80.
25Un
der
Oakl
and–
Scho
ols
$Su
rvey
—In
tere
st13
5519
91–9
233
.40.
15Un
der
7.4
0.92
N.S
.18
.10.
29Un
der
0.7
0.00
N.S
.59
.50.
28C
21.1
0.00
Unde
rOa
klan
d–Sc
hool
s $
Surv
ey—
Inte
rest
1205
1992
–93
33.4
0.07
Unde
r7.
40.
61N
.S.
18.1
0.07
Unde
r0.
70.
00N
.S.
59.5
0.13
C21
.10.
00Un
der
Oakl
and–
Scho
ols
$Su
rvey
—In
tere
st25
6019
91–9
333
.40.
09Un
der
7.4
0.70
N.S
.18
.10.
13Un
der
0.7
0.00
N.S
.59
.50.
18C
21.1
0.00
Unde
r
Oran
ge C
ount
y, F
L $
SM/W
OBE
1519
903.
30.
42N
.S.
4.1
0.01
N.S
.1.
00.
90N
.S.
NS
0.00
Unde
r36
.50.
04N
.S.
Oran
ge C
ount
y, F
L $
SM/W
OBE
3619
913.
32.
30N
.S.
4.1
0.17
N.S
.0.
710
.00
N.S
.0.
80.
05N
.S.
36.5
0.13
N.S
.Or
ange
Cou
nty,
FL
$SM
/WOB
E56
1992
3.3
4.12
N.S
.4.
10.
37N
.S.
NS
0.00
Unde
rN
S0.
00Un
der
36.5
0.43
N.S
.
Oran
ge C
ount
y, F
L–Pu
blic
Sch
ools
$SM
/WOB
E5
1990
3.3
0.00
Unde
r4.
10.
00Un
der
0.8
0.71
N.S
.N
S0.
00Un
der
36.5
0.11
N.S
.Or
ange
Cou
nty,
FL–
Publ
ic S
choo
ls $
SM/W
OBE
1819
913.
30.
00Un
der
4.1
2.39
N.S
.N
S0.
00Un
der
NS
??Un
der
36.5
0.00
Unde
rOr
ange
Cou
nty,
FL–
Publ
ic S
choo
ls $
SM/W
OBE
819
923.
30.
00Un
der
4.1
0.00
Unde
rN
S0.
00Un
der
NS
0.00
Unde
r36
.50.
72N
.S.
Phoe
nix–
Arch
& E
ng–M
en $
Regi
ster
ed1,
348
FY87
–93
3.5
0.52
Unde
r5.
50.
17Un
der
8.7
0.23
Unde
r1.
20.
22Un
der
20.5
0.26
Unde
rPh
oeni
x–Ar
ch &
Eng
–Wom
en $
Regi
ster
ed1,
348
FY87
–93
0.4
0.08
Unde
r1.
20.
15Un
der
0.0
NA
NA
0.0
NA
NA
1.6
0.13
Unde
r15
.00.
04Un
der
Phoe
nix–
Arch
& E
ng–M
en $
Surv
ey—
Inte
rest
1,34
8FY
87–9
30.
53.
73Un
der
3.2
0.28
Unde
r2.
01.
00N
.S.
1.2
0.21
Unde
r8.
20.
65Un
der
Phoe
nix–
Arch
& E
ng–W
omen
$Su
rvey
—In
tere
st1,
348
FY87
–93
0.0
NA
NA
0.3
0.72
N.S
.0.
0N
AN
A0.
0N
AN
A0.
30.
84N
.S.
6.4
0.10
Unde
rPh
oeni
x–Ar
ch &
Eng
–Men
$M
ailin
g lis
t1,
348
FY87
–93
3.1
0.59
Unde
r2.
90.
31Un
der
0.7
2.91
Over
0.6
0.45
N.S
.9.
90.
53Un
der
Phoe
nix–
Arch
& E
ng–W
omen
$M
ailin
g lis
t1,
348
FY87
–93
0.2
0.16
N.S
.0.
90.
21Un
der
0.0
NA
NA
0.0
NA
NA
2.5
0.08
Unde
r12
.00.
05Un
der
Phoe
nix–
Othe
r Pro
f Ser
vice
–Men
$Re
gist
ered
3,57
3FY
87–9
33.
90.
37Un
der
2.6
0.24
Unde
r2.
40.
05Un
der
0.9
0.02
Unde
r10
.90.
23Un
der
Phoe
nix–
Othe
r Pro
f Ser
vice
–Wom
en $
Regi
ster
ed3,
573
FY87
–93
1.5
0.00
Unde
r1.
50.
20Un
der
0.6
0.00
Unde
r0.
20.
00Un
der
3.8
0.08
Unde
r22
.70.
05Un
der
Phoe
nix–
Othe
r Pro
f Ser
vice
–Men
$Su
rvey
—In
tere
st3,
573
FY87
–93
1.0
1.40
Over
2.8
0.23
Unde
r0.
90.
15Un
der
0.2
0.12
Unde
r5.
20.
48Un
der
Phoe
nix–
Othe
r Pro
f Ser
vice
–Wom
en $
Surv
ey—
Inte
rest
3,57
3FY
87–9
30.
0N
AN
A0.
50.
58N
.S.
0.0
NA
NA
0.0
NA
NA
0.9
0.35
Unde
r12
.60.
09Un
der
Phoe
nix–
Othe
r Pro
f Ser
vice
–Men
$M
ailin
g lis
t3,
573
FY87
–93
2.8
0.51
Unde
r1.
70.
36Un
der
1.1
0.11
Unde
r0.
0N
AN
A6.
80.
36Un
dePh
oeni
x–Ot
her P
rof S
ervi
ce–W
omen
$M
ailin
g lis
t3,
573
FY87
–93
0.6
0.00
Unde
r2.
30.
13Un
der
0.0
NA
NA
0.0
NA
NA
2.8
0.11
Unde
r11
.40.
10Un
der
APPENDIX: STUDY METHODS
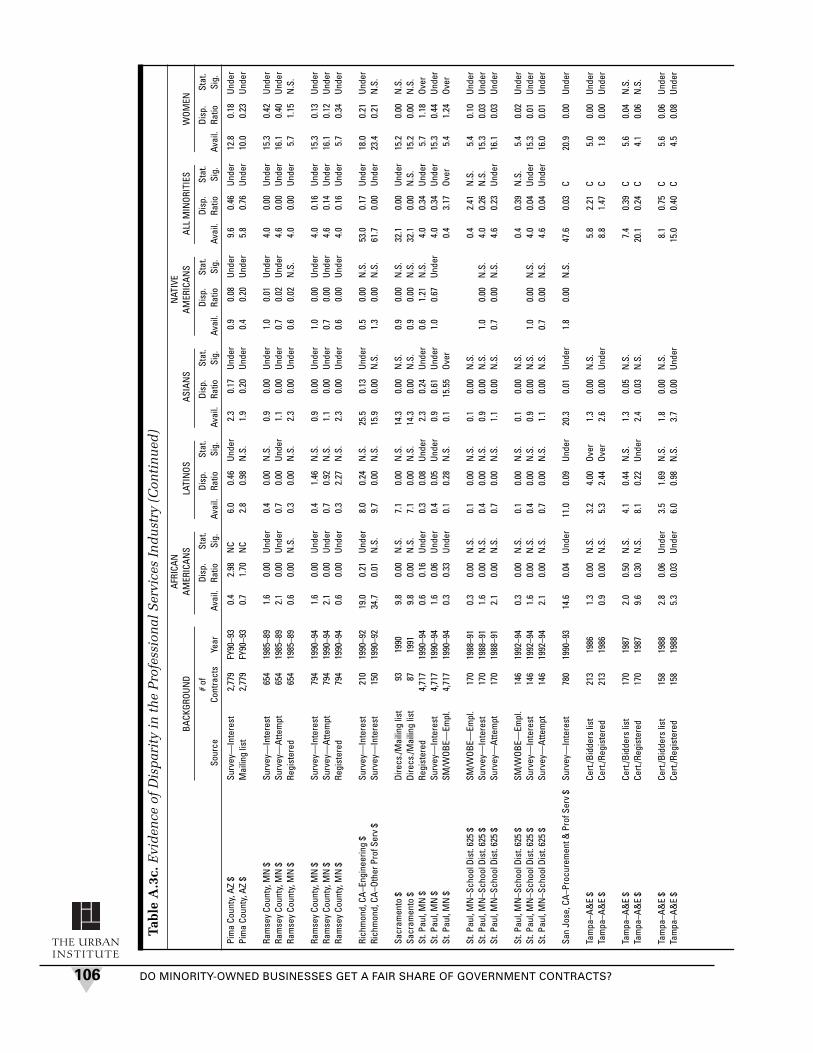
DO MINORITY-OWNED BUSINESSES GET A FAIR SHARE OF GOVERNMENT CONTRACTS?106
THE URBANINSTITUTE
Pim
a Co
unty
, AZ
$Su
rvey
—In
tere
st2,
779
FY90
–93
0.4
2.98
NC
6.0
0.46
Unde
r2.
30.
17Un
der
0.9
0.08
Unde
r9.
60.
46Un
der
12.8
0.18
Unde
rPi
ma
Coun
ty, A
Z $
Mai
ling
list
2,77
9FY
90–9
30.
71.
70N
C2.
80.
98N
.S.
1.9
0.20
Unde
r0.
40.
20Un
der
5.8
0.76
Unde
r10
.00.
23Un
der
Ram
sey
Coun
ty, M
N $
Surv
ey—
Inte
rest
654
1985
–89
1.6
0.00
Unde
r0.
40.
00N
.S.
0.9
0.00
Unde
r1.
00.
01Un
der
4.0
0.00
Unde
r15
.30.
42Un
der
Ram
sey
Coun
ty, M
N $
Surv
ey—
Atte
mpt
654
1985
–89
2.1
0.00
Unde
r0.
70.
00Un
der
1.1
0.00
Unde
r0.
70.
02Un
der
4.6
0.00
Unde
r16
.10.
40Un
der
Ram
sey
Coun
ty, M
N $
Regi
ster
ed65
419
85–8
90.
60.
00N
.S.
0.3
0.00
N.S
.2.
30.
00Un
der
0.6
0.02
N.S
.4.
00.
00Un
der
5.7
1.15
N.S
.
Ram
sey
Coun
ty, M
N $
Surv
ey—
Inte
rest
794
1990
–94
1.6
0.00
Unde
r0.
41.
46N
.S.
0.9
0.00
Unde
r1.
00.
00Un
der
4.0
0.16
Unde
r15
.30.
13Un
der
Ram
sey
Coun
ty, M
N $
Surv
ey—
Atte
mpt
794
1990
–94
2.1
0.00
Unde
r0.
70.
92N
.S.
1.1
0.00
Unde
r0.
70.
00Un
der
4.6
0.14
Unde
r16
.10.
12Un
der
Ram
sey
Coun
ty, M
N $
Regi
ster
ed79
419
90–9
40.
60.
00Un
der
0.3
2.27
N.S
.2.
30.
00Un
der
0.6
0.00
Unde
r4.
00.
16Un
der
5.7
0.34
Unde
r
Rich
mon
d, C
A–En
gine
erin
g $
Surv
ey—
Inte
rest
210
1990
–92
19.0
0.21
Unde
r8.
00.
24N
.S.
25.5
0.13
Unde
r0.
50.
00N
.S.
53.0
0.17
Unde
r18
.00.
21Un
der
Rich
mon
d, C
A–Ot
her P
rof S
erv
$Su
rvey
—In
tere
st15
019
90–9
234
.70.
01N
.S.
9.7
0.00
N.S
.15
.90.
00N
.S.
1.3
0.00
N.S
.61
.70.
00Un
der
23.4
0.21
N.S
.
Sacr
amen
to $
Dire
cs./M
ailin
g lis
t93
1990
9.8
0.00
N.S
.7.
10.
00N
.S.
14.3
0.00
N.S
.0.
90.
00N
.S.
32.1
0.00
Unde
r15
.20.
00N
.S.
Sacr
amen
to $
Dire
cs./M
ailin
g lis
t87
1991
9.8
0.00
N.S
.7.
10.
00N
.S.
14.3
0.00
N.S
.0.
90.
00N
.S.
32.1
0.00
N.S
.15
.20.
00N
.S.
St. P
aul,
MN
$Re
gist
ered
4,71
719
90–9
40.
60.
16Un
der
0.3
0.08
Unde
r2.
30.
24Un
der
0.6
1.21
N.S
.4.
00.
34Un
der
5.7
1.18
Over
St. P
aul,
MN
$Su
rvey
—In
tere
st4,
717
1990
–94
1.6
0.06
Unde
r0.
40.
05Un
der
0.9
0.61
Unde
r1.
00.
67Un
der
4.0
0.34
Unde
r15
.30.
44Un
der
St. P
aul,
MN
$SM
/WOB
E—Em
pl.
4,71
719
90–9
40.
30.
33Un
der
0.1
0.28
N.S
.0.
115
.55
Over
0.4
3.17
Over
5.4
1.24
Over
St. P
aul,
MN
–Sch
ool D
ist.
625
$SM
/WOB
E—Em
pl.
170
1988
–91
0.3
0.00
N.S
.0.
10.
00N
.S.
0.1
0.00
N.S
.0.
42.
41N
.S.
5.4
0.10
Unde
rSt
. Pau
l, M
N–S
choo
l Dis
t. 62
5 $
Surv
ey—
Inte
rest
170
1988
–91
1.6
0.00
N.S
.0.
40.
00N
.S.
0.9
0.00
N.S
.1.
00.
00N
.S.
4.0
0.26
N.S
.15
.30.
03Un
der
St. P
aul,
MN
–Sch
ool D
ist.
625
$Su
rvey
—At
tem
pt17
019
88–9
12.
10.
00N
.S.
0.7
0.00
N.S
.1.
10.
00N
.S.
0.7
0.00
N.S
.4.
60.
23Un
der
16.1
0.03
Unde
r
St. P
aul,
MN
–Sch
ool D
ist.
625
$SM
/WOB
E—Em
pl.
146
1992
–94
0.3
0.00
N.S
.0.
10.
00N
.S.
0.1
0.00
N.S
.0.
40.
39N
.S.
5.4
0.02
Unde
rSt
. Pau
l, M
N–S
choo
l Dis
t. 62
5 $
Surv
ey—
Inte
rest
146
1992
–94
1.6
0.00
N.S
.0.
40.
00N
.S.
0.9
0.00
N.S
.1.
00.
00N
.S.
4.0
0.04
Unde
r15
.30.
01Un
der
St. P
aul,
MN
–Sch
ool D
ist.
625
$Su
rvey
—At
tem
pt14
619
92–9
42.
10.
00N
.S.
0.7
0.00
N.S
.1.
10.
00N
.S.
0.7
0.00
N.S
.4.
60.
04Un
der
16.0
0.01
Unde
r
San
Jose
, CA–
Proc
urem
ent &
Pro
f Ser
v $
Surv
ey—
Inte
rest
780
1990
–93
14.6
0.04
Unde
r11
.00.
09Un
der
20.3
0.01
Unde
r1.
80.
00N
.S.
47.6
0.03
C20
.90.
00Un
der
Tam
pa–A
&E
$Ce
rt./B
idde
rs li
st21
319
861.
30.
00N
.S.
3.2
4.00
Over
1.3
0.00
N.S
.5.
82.
21C
5.0
0.00
Unde
rTa
mpa
–A&
E $
Cert.
/Reg
iste
red
213
1986
0.9
0.00
N.S
.5.
32.
44Ov
er2.
60.
00Un
der
8.8
1.47
C1.
80.
00Un
der
Tam
pa–A
&E
$Ce
rt./B
idde
rs li
st17
019
872.
00.
50N
.S.
4.1
0.44
N.S
.1.
30.
05N
.S.
7.4
0.39
C5.
60.
04N
.S.
Tam
pa–A
&E
$Ce
rt./R
egis
tere
d17
019
879.
60.
30N
.S.
8.1
0.22
Unde
r2.
40.
03N
.S.
20.1
0.24
C4.
10.
06N
.S.
Tam
pa–A
&E
$Ce
rt./B
idde
rs li
st15
819
882.
80.
06Un
der
3.5
1.69
N.S
.1.
80.
00N
.S.
8.1
0.75
C5.
60.
06Un
der
Tam
pa–A
&E
$Ce
rt./R
egis
tere
d15
819
885.
30.
03Un
der
6.0
0.98
N.S
.3.
70.
00Un
der
15.0
0.40
C4.
50.
08Un
der
Tabl
e A
.3c.
Evi
den
ce o
f D
isp
arit
y in
th
e P
rofe
ssio
nal
Ser
vice
s In
du
stry
(C
onti
nu
ed)
AFRI
CAN
NAT
IVE
BACK
GROU
ND
AMER
ICAN
SLA
TIN
OSAS
IAN
SAM
ERIC
ANS
ALL
MIN
ORIT
IES
WOM
EN
# of
Disp
.St
at.
Disp
.St
at.
Disp
.St
at.
Disp
.St
at.
Disp
.St
at.
Disp
.St
at.
Sour
ceCo
ntra
cts
Year
Avai
l.Ra
tioSi
g.Av
ail.
Ratio
Sig.
Avai
l.Ra
tioSi
g.Av
ail.
Ratio
Sig.
Avai
l.Ra
tioSi
g.Av
ail.
Ratio
Sig.

THE URBANINSTITUTE
107
Tam
pa–A
&E
$Ce
rt./B
idde
rs li
st15
719
891.
80.
00N
.S.
3.8
2.56
Over
2.5
0.00
Unde
r8.
11.
20C
5.8
0.03
Unde
rTa
mpa
–A&
E $
Cert.
/Reg
iste
red
156
1989
2.3
0.00
N.S
.7.
01.
41N
.S.
6.3
0.00
N.S
.15
.60.
63C
5.5
0.03
Unde
r
Texa
s $
SM/W
OBE—
Empl
.N
S9/
88–8
/91
1.4
0.47
N.S
.5.
00.
44N
.S.
1.8
1.51
N.S
.8.
20.
68N
.S.
11.5
0.10
Unde
rTe
xas
#SM
/WOB
E—Em
pl.
NS
9/88
–8/9
11.
30.
41Un
der
6.3
0.20
Unde
r3.
40.
14Un
der
11.0
0.20
Unde
r10
.20.
06Un
der
Texa
s $
SM/W
OBE—
Empl
.N
S9/
91–8
/93
1.4
0.40
N.S
.5.
10.
36N
.S.
1.9
2.75
N.S
.8.
40.
91N
.S.
11.6
0.34
Unde
rTe
xas
#SM
/WOB
E—Em
pl.
NS
9/91
–8/9
31.
30.
45Un
der
6.5
0.21
Unde
r3.
50.
14Un
der
11.3
0.21
Unde
r10
.10.
07Un
der
Tucs
on $
Surv
ey—
Inte
rest
1386
1991
–94
0.4
1.38
N.S
.6.
00.
98N
.S.
2.3
0.10
Unde
r0.
90.
03Un
der
9.6
0.70
Unde
r12
.80.
19Un
der
Tucs
on $
Mai
ling
list
1386
1991
–94
1.0
0.57
N.S
.5.
41.
09N
.S.
2.4
0.10
Unde
r0.
70.
05Un
der
9.4
0.72
Unde
r8.
30.
29Un
der
Not
es: “
Un
less
oth
erw
ise
ind
icat
ed, “
Wom
en”
incl
ud
es m
inor
ity
wom
en a
nd
“A
ll M
inor
itie
s” d
oes
not
in
clu
de
wh
ite
wom
en.
A “
$” a
fter
th
e st
ud
y n
ame
ind
icat
es d
isp
arit
y re
fers
to
the
dol
lar
valu
e of
con
trac
ts a
war
ded
; a “
#” i
nd
icat
es d
isp
arit
y re
fers
to
the
nu
mbe
r of
con
trac
ts a
war
ded
. “U
nd
er”,
“O
ver”
, an
d “
N.S
.” i
n t
he
“Sta
t S
ig.”
col
um
n i
nd
icat
es s
tati
stic
ally
sig
nifi
can
t u
nd
eru
tili
zati
on, s
tati
stic
ally
sign
ifica
nt o
veru
tili
zati
on, a
nd
not
sig
nifi
can
tly
dif
fere
nt f
rom
on
e, r
esp
ecti
vely
. “N
C”
stan
ds
for
stat
isti
cal s
ign
ifica
nce
not
cal
cula
ted
in s
tud
y. C
sta
nd
s fo
r av
aila
bili
ty a
nd
dis
par
ity
rati
o ca
lcu
late
d b
y au
thor
s.N
A s
tan
ds
for
no
avai
labi
lity
, th
eref
ore
can
not
cal
cula
te d
isp
arit
y ra
tio.
A b
lan
k in
dic
ates
stu
dy
did
not
rep
ort
this
figu
re.
Th
e av
aila
bili
ty m
easu
re “
SM
/WO
BE
—E
mp
l” o
nly
in
clu
des
firm
s w
ith
pai
d e
mp
loye
es. S
ee a
lso
stu
dy-
spec
ific
not
es a
t en
d o
f ta
ble.
APPENDIX: STUDY METHODS

DO MINORITY-OWNED BUSINESSES GET A FAIR SHARE OF GOVERNMENT CONTRACTS?108
THE URBANINSTITUTE
Tabl
e A
.3d
. Evi
den
ce o
f D
isp
arit
y in
th
e O
ther
Ser
vice
s In
du
stry
AFRI
CAN
NAT
IVE
BACK
GROU
ND
AMER
ICAN
SLA
TIN
OSAS
IAN
SAM
ERIC
ANS
ALL
MIN
ORIT
IES
WOM
EN
# of
Disp
.St
at.
Disp
.St
at.
Disp
.St
at.
Disp
.St
at.
Disp
.St
at.
Disp
.St
at.
Sour
ceCo
ntra
cts
Year
Avai
l.Ra
tioSi
g.Av
ail.
Ratio
Sig.
Avai
l.Ra
tioSi
g.Av
ail.
Ratio
Sig.
Avai
l.Ra
tioSi
g.Av
ail.
Ratio
Sig.
OTHE
R SE
RVIC
ES
Albu
quer
que,
NM
$SM
/WOB
E13
,179
1989
–93
0.8
0.02
Unde
r17
.40.
56Un
der
0.7
0.29
Unde
r0.
90.
60Un
der
19.7
0.53
Unde
r8.
42.
36Ov
erAl
buqu
erqu
e, N
M $
Surv
ey—
Inte
rest
13,1
7919
89–9
31.
90.
01Un
der
25.0
0.39
Unde
r0.
21.
14N
.S.
1.5
0.35
Unde
r28
.50.
37Un
der
16.5
1.20
Over
Albu
quer
que,
NM
$Su
rvey
—At
tem
pt13
,179
1989
–93
1.3
0.01
Unde
r25
.00.
39Un
der
0.6
0.31
Unde
r1.
30.
43Un
der
28.1
0.37
Unde
r16
.61.
20Ov
erAl
buqu
erqu
e, N
M $
Regi
ster
ed13
,179
1989
–93
2.2
0.01
Unde
r14
.20.
69Un
der
1.2
0.16
Unde
r2.
90.
18Un
der
20.6
0.51
Unde
r13
.71.
44Ov
erAl
buqu
erqu
e, N
M $
SM/W
OBE
4,86
519
94–9
50.
80.
05Un
der
17.4
0.23
Unde
r0.
70.
09Un
der
0.9
0.84
N.S
.19
.70.
26Un
der
8.4
0.64
Unde
rAl
buqu
erqu
e, N
M $
Surv
ey—
Inte
rest
4,86
519
94–9
51.
90.
02Un
der
25.0
0.16
Unde
r0.
20.
36N
.S.
1.5
0.48
Unde
r28
.50.
18Un
der
16.5
0.33
Unde
rAl
buqu
erqu
e, N
M $
Surv
ey—
Atte
mpt
4,86
519
94–9
51.
30.
03Un
der
25.0
0.16
Unde
r0.
60.
10Un
der
1.3
0.59
Unde
r28
.10.
18Un
der
16.6
0.33
Unde
rAl
buqu
erqu
e, N
M $
Regi
ster
ed4,
865
1994
–95
2.2
0.02
Unde
r14
.20.
28Un
der
1.2
0.05
Unde
r2.
90.
25Un
der
20.6
0.25
Unde
r13
.70.
39Un
der
Chic
ago–
City
$Bi
dder
s lis
t96
519
8941
.10.
31N
C10
.40.
15N
CCh
icag
o–Ci
ty #
Bidd
ers
list
965
1989
41.1
0.86
NC
10.4
0.87
NC
Colu
mbu
s, O
H $
Mai
ling
list
NS
1983
–91
14.3
0.29
Unde
r11
.80.
24Un
der
Colu
mbu
s, O
H $
SM/W
OBE
NS
1983
–91
5.4
0.78
Unde
r34
.60.
08Un
der
Colu
mbu
s, O
H $
SM/W
OBE
4009
1991
–93
4.1
0.67
Unde
r0.
40.
18Un
der
1.1
3.14
Over
5.6
1.13
N.S
.32
.80.
24Un
der
Colu
mbu
s, O
H $
SM/W
OBE—
Empl
.40
0919
91–9
32.
01.
38Ov
er0.
30.
29Un
der
0.3
10.1
5Ov
er2.
62.
44Ov
er6.
71.
16Ov
erCo
lum
bus,
OH
$Su
rvey
—In
tere
st40
0919
91–9
32.
81.
00Pa
rity
0.5
0.15
Unde
r1.
42.
41Ov
er0.
60.
00Un
der
5.3
1.20
Over
6.5
1.19
Over
Colu
mbu
s, O
H $
Regi
ster
ed40
0919
91–9
38.
30.
34Un
der
0.7
0.10
Unde
r2.
01.
75Ov
er0.
30.
00Un
der
11.5
0.55
Unde
r5.
91.
32Ov
er
Dade
Cou
nty,
FL–
Proc
urem
ent #
Regi
ster
ed40
519
89–9
18.
90.
67N
C12
.30.
99N
C1.
50.
00N
C22
.70.
80C
11.7
0.74
NC
Dade
Cou
nty,
FL–
Proc
urem
ent $
Regi
ster
ed40
519
89–9
18.
90.
33N
C12
.30.
62N
C1.
50.
00N
C22
.70.
46C
11.7
0.59
NC
Dade
Cou
nty,
FL–
Non
proc
urem
ent #
Regi
ster
ed52
1989
–91
8.9
0.43
NC
12.3
2.35
NC
1.5
0.00
NC
22.7
1.44
C11
.70.
00N
CDa
de C
ount
y, F
L–N
onpr
ocur
emen
t $Re
gist
ered
5219
89–9
18.
90.
96N
C12
.33.
33N
C1.
50.
00N
C22
.72.
18C
11.7
0.00
NC
Dalla
s–Ci
ty $
Vend
ors
list
NS
1990
–93
6.1
0.16
Unde
r3.
00.
55Un
der
0.8
0.55
Unde
r0.
10.
00Un
der
12.1
0.06
C4.
31.
12Ov
erDa
llas–
PMSA
$Ve
ndor
s lis
tN
S19
90–9
34.
80.
17Un
der
2.4
0.29
Unde
r0.
90.
56Un
der
0.2
0.30
Unde
r12
.10.
06C
4.0
1.40
Over
Dalla
s/Fo
rt W
orth
Airp
ort $
SM/W
OBE
473
1986
–87
4.2
0.05
NC
3.2
0.12
NC
2.6
0.00
NC
0.1
0.00
NC
10.0
0.09
NC
35.2
0.09
NC
Dalla
s/Fo
rt W
orth
Airp
ort $
Surv
ey—
Inte
rest
473
1986
–87
4.0
0.06
NC
4.9
0.08
NC
2.3
0.00
NC
1.6
0.00
NC
13.1
0.07
NC
10.7
0.29
NC
Dalla
s/Fo
rt W
orth
Airp
ort $
Mai
ling
list
473
1986
–87
10.8
0.02
NC
8.7
0.04
NC
6.9
0.00
NC
0.9
0.00
NC
28.9
0.03
NC
13.7
0.22
NC
Dalla
s/Fo
rt W
orth
Airp
ort $
SM/W
OBE
385
1992
–93
4.2
0.13
NC
3.2
0.03
NC
2.6
0.20
NC
0.1
0.00
NC
10.0
0.12
NC
35.2
0.00
NC
Dalla
s/Fo
rt W
orth
Airp
ort $
Surv
ey—
Inte
rest
385
1992
–93
4.0
0.14
NC
4.9
0.02
NC
2.3
0.22
NC
1.6
0.00
NC
13.1
0.09
NC
10.7
0.00
NC
Dalla
s/Fo
rt W
orth
Airp
ort $
Mai
ling
list
385
1992
–93
10.8
0.05
NC
8.7
0.01
NC
6.9
0.07
NC
0.9
0.00
NC
28.9
0.04
NC
13.7
0.00
NC

THE URBANINSTITUTE
109
Con
tin
ued
Denv
er P
hase
II #
Su
rvey
—In
tere
st18
319
8910
.51.
10N
.S.
9.1
0.78
N.S
.De
nver
Pha
se II
$Su
rvey
—In
tere
st18
319
8910
.51.
99N
.S.
9.1
0.13
Unde
rDe
nver
Pha
se II
#
Surv
ey—
Inte
rest
254
1990
11.6
0.65
N.S
.11
.00.
43Un
der
Denv
er P
hase
II $
Surv
ey—
Inte
rest
254
1990
11.6
1.77
N.S
.11
.00.
05Un
der
Dist
rict o
f Col
umbi
a $
SMOB
E1,
258
1989
–91
7.3
1.82
N.S
.1.
81.
44N
.S.
5.0
0.10
N.S
.14
.02.
43N
.S.
Fort
Wor
th–C
ity $
Surv
ey—
Inte
rest
983
1986
4.8
0.03
NC
6.8
0.11
NC
2.9
0.24
NC
1.8
0.02
NC
16.7
0.13
NC
10.2
0.03
NC
Fort
Wor
th–C
ity $
Mai
ling
list
983
1986
2.5
0.06
NC
1.6
0.46
NC
0.4
1.75
NC
0.6
0.07
NC
6.1
0.36
NC
2.8
0.10
NC
Fort
Wor
th–C
ity $
Surv
ey—
Inte
rest
3,15
119
92–9
34.
80.
25N
C6.
80.
09N
C2.
90.
09N
C1.
80.
13N
C16
.70.
14N
C10
.20.
21N
CFo
rt W
orth
–City
$M
ailin
g lis
t3,
151
1992
–93
2.5
0.47
NC
1.6
0.37
NC
0.4
0.65
NC
0.6
0.42
NC
6.1
0.38
NC
2.8
0.77
NC
Fort
Wor
th–T
rans
porta
tion
$Su
rvey
—In
tere
st53
619
91–9
316
.70.
31Un
der
10.2
1.65
Over
Fort
Wor
th–T
rans
porta
tion
#Su
rvey
—In
tere
st53
619
91–9
316
.70.
42Un
der
10.2
0.39
Unde
rFo
rt W
orth
–Tra
nspo
rtatio
n $
Mai
ling
list
536
1991
–93
6.6
0.77
N.S
.3.
35.
07N
.S.
Fort
Wor
th–T
rans
porta
tion
#M
ailin
g lis
t53
619
91–9
36.
61.
07N
.S.
3.3
1.18
N.S
.
Henn
epin
Cou
nty,
MN
–Acc
t Pay
able
$Su
rvey
—In
tere
st5,
295
1981
–86
0.9
0.44
Unde
r0.
50.
02Un
der
1.3
0.04
Unde
r0.
40.
12Un
der
3.2
0.16
Unde
r16
.10.
04Un
der
Henn
epin
Cou
nty,
MN
–Acc
t Pay
able
$Su
rvey
—At
tem
pt5,
295
1981
–86
1.6
0.26
Unde
r0.
40.
03Un
der
1.9
0.03
Unde
r0.
90.
05Un
der
4.7
0.11
Unde
r13
.80.
05Un
der
Henn
epin
Cou
nty,
MN
–Acc
t Pay
able
$Re
gist
ered
5,29
519
81–8
64.
10.
10Un
der
0.7
0.02
Unde
r2.
10.
03Un
der
0.2
0.32
N.S
.7.
20.
07Un
der
5.3
0.12
Unde
r
Henn
epin
Cou
nty,
MN
–Acc
t Pay
able
$Su
rvey
—In
tere
st4,
866
1987
–93
0.9
0.69
Unde
r0.
50.
12Un
der
1.3
0.03
Unde
r0.
40.
19Un
der
3.2
0.26
Unde
r16
.10.
08Un
der
Henn
epin
Cou
nty,
MN
–Acc
t Pay
able
$Su
rvey
—At
tem
pt4,
866
1987
–93
1.6
0.41
Unde
r0.
40.
15Un
der
1.9
0.02
Unde
r0.
90.
09Un
der
4.7
0.18
Unde
r13
.80.
09Un
der
Henn
epin
Cou
nty,
MN
–Acc
t Pay
able
$Re
gist
ered
4,86
619
87–9
34.
10.
16Un
der
0.7
0.09
Unde
r2.
10.
02Un
der
0.2
0.52
N.S
.7.
20.
11Un
der
5.3
0.23
Unde
r
Henn
epin
Co,
MN
–Acc
t Pay
–Soc
Ser
v $
Surv
ey—
Inte
rest
3,09
319
87–9
37.
10.
34Un
der
0.0
0.0
0.0
7.1
0.43
Unde
r42
.90.
65Un
der
Henn
epin
Co,
MN
–Acc
t Pay
–Soc
Ser
v $
Surv
ey—
Atte
mpt
3,09
319
87–9
30.
00.
00.
00.
00.
055
.60.
50Un
der
Henn
epin
Co,
MN
–Acc
t Pay
–Soc
Ser
v $
Regi
ster
ed3,
093
1987
–93
1.7
1.48
Over
0.3
0.07
Unde
r1.
10.
54Un
der
0.0
3.0
1.01
N.S
.11
.62.
39Ov
er
Jeffe
rson
Cou
nty,
AL
#SM
/WOB
EN
S19
86–9
09.
02.
04Ov
er0.
30.
00Un
der
0.3
0.00
Unde
r9.
64.
41N
C34
.80.
02Un
der
Las
Vega
s–Ci
ty $
Surv
ey—
Inte
rest
138
1988
–92
2.4
2.27
Over
7.6
0.25
Unde
r3.
50.
00Un
der
1.2
0.00
N.S
.14
.60.
50Un
der
18.1
0.22
Unde
rLa
s Ve
gas–
City
$M
ailin
g lis
t13
819
88–9
22.
52.
17Ov
er2.
00.
94N
.S.
0.4
0.00
N.S
.0.
20.
00N
.S.
5.7
1.28
N.S
.5.
40.
73N
.S.
Las
Vega
s–Ci
ty $
Surv
ey—
Inte
rest
1,34
219
932.
41.
06N
.S.
7.6
0.06
Unde
r3.
50.
00Un
der
1.2
0.00
Unde
r14
.60.
21Un
der
18.1
0.70
Unde
rLa
s Ve
gas–
City
$M
ailin
g lis
t1,
342
1993
2.5
1.01
N.S
.2.
00.
21Un
der
0.4
0.00
Unde
r0.
20.
00N
.S.
5.7
0.53
Unde
r5.
42.
33Ov
er
Las
Vega
s–Lo
cal A
rea
Gvts
$Su
rvey
—In
tere
st2,
340
1988
–92
2.4
1.03
N.S
.7.
60.
14Un
der
3.5
0.09
Unde
r1.
20.
02Un
der
14.6
0.27
Unde
r18
.10.
33Un
der
Las
Vega
s–Lo
cal A
rea
Gvts
$M
ailin
g lis
t2,
340
1988
–92
2.8
0.86
N.S
.2.
20.
46Un
der
0.5
0.69
N.S
.0.
20.
11N
.S.
6.3
0.62
Unde
r7.
00.
87N
.S.
Las
Vega
s–Lo
cal A
rea
Gvts
$Su
rvey
—In
tere
st10
,504
1990
–93
2.4
0.29
Unde
r7.
60.
26Un
der
3.5
0.03
Unde
r1.
20.
05Un
der
14.6
0.21
Unde
r18
.10.
32Un
der
Las
Vega
s–Lo
cal A
rea
Gvts
$M
ailin
g lis
t10
,504
1990
–93
2.8
0.24
Unde
r2.
20.
87N
.S.
0.5
0.22
Unde
r0.
20.
33Un
der
6.3
0.49
Unde
r7.
00.
84Un
der
APPENDIX: STUDY METHODS

DO MINORITY-OWNED BUSINESSES GET A FAIR SHARE OF GOVERNMENT CONTRACTS?110
THE URBANINSTITUTE
Tabl
e A
.3d
. Evi
den
ce o
f D
isp
arit
y in
th
e O
ther
Ser
vice
s In
du
stry
(C
onti
nu
ed)
AFRI
CAN
NAT
IVE
BACK
GROU
ND
AMER
ICAN
SLA
TIN
OSAS
IAN
SAM
ERIC
ANS
ALL
MIN
ORIT
IES
WOM
EN
# of
Disp
.St
at.
Disp
.St
at.
Disp
.St
at.
Disp
.St
at.
Disp
.St
at.
Disp
.St
at.
Sour
ceCo
ntra
cts
Year
Avai
l.Ra
tioSi
g.Av
ail.
Ratio
Sig.
Avai
l.Ra
tioSi
g.Av
ail.
Ratio
Sig.
Avai
l.Ra
tioSi
g.Av
ail.
Ratio
Sig.
Mar
ylan
d–Pr
imes
&Su
bs $
SM/W
OBE
142
1985
–89
1.5
1.53
NC
1.0
1.30
NC
8.4
0.89
NC
5.4
0.46
NC
Mar
ylan
d &
Env
irons
–Prim
es&
Subs
$SM
/WOB
E14
219
85–8
91.
12.
00N
C0.
52.
20N
C7.
20.
90N
C5.
30.
40N
C
Mar
ylan
d DO
T–Pr
imes
onl
y $
SM/W
OBE—
Empl
.N
SFY
91–9
38.
70.
44Un
der
0.9
2.02
N.S
.2.
61.
02N
.S.
12.1
0.68
N.S
.15
.70.
08N
.S.
Mar
ylan
d DO
T–Pr
imes
and
sub
s $
SM/W
OBE—
Empl
.N
SFY
92–9
38.
70.
52N
C0.
90.
18N
C2.
62.
18N
C12
.11.
85N
C15
.70.
35N
C
Min
neap
olis
$SM
/WOB
E13
219
90–9
10.
60.
00Un
der
0.4
0.00
Unde
r0.
51.
70N
.S.
1.5
11.1
9Ov
er9.
90.
07Un
der
Min
neap
olis
$Su
rvey
—In
tere
st13
219
90–9
10.
90.
00Un
der
0.5
0.00
Unde
r1.
30.
69N
.S.
0.4
0.00
Unde
r3.
25.
29Ov
er16
.10.
04Un
der
Min
neap
olis
$Su
rvey
—At
tem
pt13
219
90–9
11.
60.
00Un
der
0.4
0.00
Unde
r1.
90.
50N
.S.
0.9
0.00
Unde
r4.
73.
60Ov
er13
.80.
05Un
der
Min
neap
olis
$Re
gist
ered
132
1990
–91
1.6
0.00
Unde
r0.
10.
00Un
der
0.7
1.26
N.S
.0.
50.
00Un
der
3.0
5.65
Over
3.6
0.19
Unde
r
Min
neap
olis
$SM
/WOB
E3,
735
1992
–94
0.6
0.38
Unde
r0.
40.
00Un
der
0.5
0.65
N.S
.1.
50.
39Un
der
9.9
2.99
Over
Min
neap
olis
$Su
rvey
—In
tere
st3,
735
1992
–94
0.9
0.24
Unde
r0.
50.
00Un
der
1.3
0.15
Unde
r0.
40.
38Un
der
3.2
0.19
Unde
r16
.11.
84Ov
erM
inne
apol
is $
Surv
ey—
Atte
mpt
3,73
519
92–9
41.
60.
14Un
der
0.4
0.00
Unde
r1.
90.
11Un
der
0.9
0.18
Unde
r4.
70.
13Un
der
13.8
2.13
Over
Min
neap
olis
$Re
gist
ered
3,73
519
92–9
41.
60.
14Un
der
0.1
0.01
N.S
.0.
70.
27Un
der
0.5
0.34
Unde
r3.
00.
20Un
der
3.6
8.28
Over
Min
neap
olis
Com
m D
evel
Age
ncy
$SM
/WOB
E27
1990
–91
0.7
6.82
Over
0.5
0.00
N.S
.0.
60.
00N
.S.
1.8
2.72
N.S
.10
.40.
77N
.S.
Min
neap
olis
Com
m D
evel
Age
ncy
$Su
rvey
—In
tere
st27
1990
–91
0.9
5.13
Over
0.5
0.00
N.S
.1.
30.
00N
.S.
0.4
0.00
N.S
.3.
21.
49N
.S.
16.1
0.50
N.S
.M
inne
apol
is C
omm
Dev
el A
genc
y $
Surv
ey—
Atte
mpt
2719
90–9
11.
63.
04N
.S.
0.4
0.00
N.S
.1.
90.
00N
.S.
0.9
0.00
N.S
.4.
81.
01N
.S.
13.8
0.58
N.S
.
Min
neap
olis
Com
m D
evel
Age
ncy
$SM
/WOB
E47
319
92–9
40.
70.
20N
.S.
0.5
0.20
N.S
.0.
67.
18Ov
er1.
82.
63Ov
er10
.40.
05Un
der
Min
neap
olis
Com
m D
evel
Age
ncy
$Su
rvey
—In
tere
st47
319
92–9
40.
90.
15N
.S.
0.5
0.17
N.S
.1.
32.
32Ov
er0.
43.
26Ov
er3.
21.
45N
.S.
16.1
0.03
Unde
rM
inne
apol
is C
omm
Dev
el A
genc
y $
Surv
ey—
Atte
mpt
473
1992
–94
1.6
0.09
Unde
r0.
40.
21N
.S.
1.9
1.66
Over
0.9
1.52
N.S
.4.
80.
98N
.S.
13.8
0.04
Unde
r
New
Orle
ans
$SM
/WOB
E—Em
pl.
1,61
919
86–8
93.
82.
46N
C1.
00.
10N
.S.
0.6
0.92
N.S
.5.
31.
86N
C9.
10.
33N
.S.
New
Orle
ans
$SM
/WOB
E—Em
pl.
6,50
919
89–9
24.
71.
78N
C0.
80.
15N
.S.
0.8
1.66
NC
6.3
1.56
NC
12.3
0.19
Unde
r
New
Yor
k Ci
ty $
SM/W
OBE—
Empl
.50
112
1989
–90
3.5
0.41
Unde
r2.
60.
66N
.S.
3.8
0.29
Unde
r9.
90.
43C
19.3
0.12
Unde
rN
ew Y
ork
City
#SM
/WOB
E—Em
pl.
5011
219
89–9
05.
10.
56Un
der
5.2
0.40
Unde
r3.
81.
02Un
der
14.1
0.62
C19
.20.
19N
.S.
New
Yor
k St
ate
$Bi
dder
s lis
tN
SFY
90–9
15.
30.
03Un
der
2.7
0.16
Unde
r2.
32.
08Ov
er0.
70.
06Un
der
11.0
0.49
Unde
r14
.30.
09Un
der
Penn
sylv
ania
(SEP
TA)–
Lrg
Cont
r $SM
/WOB
E—Em
pl.
491
1988
–92
2.0
0.23
N.S
.0.
40.
10N
.S.
1.6
0.00
N.S
.4.
00.
13N
.S.
12.6
0.39
N.S
.Pe
nnsy
lvan
ia (S
EPTA
)–Lr
g Co
ntr #
SM/W
OBE—
Empl
.49
119
88–9
23.
10.
26Un
der
0.5
1.74
Over
1.3
0.00
Unde
r4.
90.
33Un
der
16.5
0.42
Unde
r
Penn
sylv
ania
(SEP
TA)–
Sml C
ontr
$SM
/WOB
E—Em
pl.
9449
1988
–92
1.8
0.41
Unde
r0.
51.
09N
.S.
1.1
0.08
Unde
r3.
40.
40Un
der
13.0
0.96
N.S
.
Penn
sylv
ania
(SEP
TA)–
Sml C
ontr
#SM
/WOB
E—Em
pl.
9449
1988
–92
2.5
0.38
Unde
r0.
50.
75N
.S.
1.3
0.02
Unde
r4.
40.
32Un
der
13.9
1.05
Over

THE URBANINSTITUTE
111
Con
tin
ued
Phoe
nix–
Men
$Re
gist
ered
12,8
83FY
87–9
33.
50.
24Un
der
2.0
0.28
Unde
r0.
60.
07Un
der
0.2
0.17
Unde
r7.
00.
28Un
der
Phoe
nix–
Wom
en $
Regi
ster
ed12
,883
FY87
–93
0.5
0.00
Unde
r1.
00.
47Un
der
0.2
0.00
Unde
r0.
20.
00Un
der
2.2
0.24
Unde
r12
.20.
17Un
der
Phoe
nix–
Men
$Su
rvey
—In
tere
st12
,883
FY87
–93
0.7
1.28
Over
3.6
0.15
Unde
r0.
30.
13Un
der
0.4
0.08
Unde
r5.
20.
38Un
der
Phoe
nix–
Wom
en $
Surv
ey—
Inte
rest
12,8
83FY
87–9
30.
10.
00Un
der
1.0
0.46
Unde
r0.
30.
00Un
der
0.1
0.00
Unde
r1.
90.
28Un
der
17.1
0.12
Unde
rPh
oeni
x–M
en $
Mai
ling
list
12,8
83FY
87–9
32.
70.
31Un
der
2.0
0.27
Unde
r0.
30.
12Un
der
0.1
0.27
Unde
r7.
10.
28Un
der
Phoe
nix–
Wom
en $
Mai
ling
list
12,8
83FY
87–9
30.
10.
00N
.S.
0.9
0.56
Unde
r0.
20.
00Un
der
0.1
0.00
Unde
r1.
90.
28Un
der
9.8
0.21
Unde
r
Pim
a Co
unty
, AZ
$Su
rvey
—In
tere
st2,
140
FY90
–93
1.4
0.45
Unde
r8.
50.
15Un
der
1.0
0.07
Unde
r0.
70.
01Un
der
11.6
0.17
Unde
r16
.90.
09Un
der
Pim
a Co
unty
, AZ
$M
ailin
g lis
t2,
140
FY90
–93
1.3
0.52
N.S
.4.
00.
32Un
der
0.9
0.08
Unde
r0.
50.
02Un
der
6.7
0.30
Unde
r8.
60.
17Un
der
Prin
ce G
eorg
e’s
Coun
ty, M
D $
Surv
ey31
8219
8857
.00.
16N
CPr
ince
Geo
rge’
s Co
unty
, MD
#Su
rvey
3182
1988
57.0
0.27
NC
Ram
sey
Coun
ty, M
N $
Surv
ey—
Inte
rest
7,54
619
85–8
90.
90.
64Un
der
0.1
0.25
Unde
r1.
30.
54Un
der
0.4
0.64
Unde
r3.
30.
50Un
der
16.0
0.05
Unde
rRa
mse
y Co
unty
, MN
$Su
rvey
—At
tem
pt7,
546
1985
–89
1.6
0.38
Unde
r0.
40.
08Un
der
1.9
0.39
Unde
r0.
90.
30Un
der
4.8
0.35
Unde
r13
.80.
06Un
der
Ram
sey
Coun
ty, M
N $
Regi
ster
ed7,
546
1985
–89
3.4
0.18
Unde
r0.
60.
05Un
der
2.0
0.36
Unde
r0.
60.
40Un
der
7.8
0.21
Unde
r11
.50.
07Un
der
Ram
sey
Coun
ty, M
N $
Surv
ey—
Inte
rest
7,35
219
90–9
40.
90.
73Un
der
0.1
0.12
Unde
r1.
30.
45Un
der
0.4
0.19
Unde
r3.
30.
43Un
der
16.0
0.06
Unde
rRa
mse
y Co
unty
, MN
$Su
rvey
—At
tem
pt7,
352
1990
–94
1.6
0.44
Unde
r0.
40.
04Un
der
1.9
0.32
Unde
r0.
90.
09Un
der
4.8
0.29
Unde
r13
.80.
07Un
der
Ram
sey
Coun
ty, M
N $
Regi
ster
ed7,
352
1990
–94
3.4
0.20
Unde
r0.
60.
03Un
der
2.0
0.30
Unde
r0.
60.
12Un
der
7.8
0.18
Unde
r11
.50.
08Un
der
Sacr
amen
to $
Dire
cs./M
ailin
g lis
t60
1990
9.5
0.00
N.S
.19
.10.
00N
.S.
9.5
0.00
N.S
.38
.10.
00N
.S.
19.1
0.01
N.S
.Sa
cram
ento
$Di
recs
./Mai
ling
list
5319
919.
50.
00N
.S.
19.1
0.00
N.S
.9.
50.
00N
.S.
38.1
0.00
Unde
r19
.10.
00N
.S.
St. P
aul,
MN
$Re
gist
ered
10,7
2919
90–9
43.
40.
08Un
der
0.6
0.02
Unde
r2.
00.
38Un
der
0.6
0.93
N.S
.7.
80.
21Un
der
11.5
0.27
Unde
rSt
. Pau
l, M
N $
Surv
ey—
Inte
rest
10,7
2919
90–9
40.
90.
28Un
der
0.1
0.10
Unde
r1.
30.
58Un
der
0.4
1.47
Over
3.3
0.50
Unde
r16
.00.
19Un
der
St. P
aul,
MN
$SM
/WOB
E—Em
pl.
10,7
2919
90–9
40.
60.
44Un
der
0.4
0.04
Unde
r0.
52.
50Ov
er1.
51.
09N
.S.
9.9
0.31
Unde
r
St. P
aul,
MN
–Sch
ool D
ist.
625
$SM
/WOB
E—Em
pl.
1936
1988
–91
0.6
1.36
N.S
.0.
40.
00Un
der
0.5
0.18
Unde
r1.
50.
59Un
der
9.9
0.06
Unde
rSt
. Pau
l, M
N–S
choo
l Dis
t. 62
5 $
Surv
ey—
Inte
rest
1936
1988
–91
1.0
0.85
N.S
.0.
10.
01N
.S.
1.4
0.04
Unde
r0.
30.
12Un
der
3.3
0.28
Unde
r16
.30.
04Un
der
St. P
aul,
MN
–Sch
ool D
ist.
625
$Su
rvey
—At
tem
pt19
3619
88–9
11.
60.
50Un
der
0.4
0.00
Unde
r1.
90.
03Un
der
0.7
0.06
Unde
r4.
80.
19Un
der
14.1
0.04
Unde
r
St. P
aul,
MN
–Sch
ool D
ist.
625
$SM
/WOB
E—Em
pl.
4022
1992
–94
0.6
0.52
Unde
r0.
40.
05Un
der
0.5
0.40
Unde
r1.
50.
36Un
der
9.9
0.16
Unde
rSt
. Pau
l, M
N–S
choo
l Dis
t. 62
5 $
Surv
ey—
Inte
rest
4022
1992
–94
1.0
0.32
Unde
r0.
10.
13Un
der
1.4
0.06
Unde
r0.
30.
40Un
der
3.3
0.17
Unde
r16
.30.
10Un
der
St. P
aul,
MN
–Sch
ool D
ist.
625
$Su
rvey
—At
tem
pt40
2219
92–9
41.
60.
19Un
der
0.4
0.04
Unde
r1.
90.
04Un
der
0.7
0.19
Unde
r4.
80.
11Un
der
14.1
0.11
Unde
r
San
Anto
nio–
Bexa
r Co.
–VIA
Met
ro T
rans
$Di
rect
orie
s38
719
86–9
01.
80.
00N
.S.
9.7
0.08
N.S
.0.
60.
00N
.S.
12.1
0.06
C8.
90.
05N
.S.
San
Anto
nio–
Bexa
r Co.
–VIA
Met
ro T
rans
#Di
rect
orie
s38
719
86–9
02.
50.
00Un
der
13.8
0.09
Unde
r1.
30.
00Un
der
17.6
0.07
C17
.20.
12Un
der
San
Anto
nio–
City
Wat
er B
oard
$Di
rect
orie
s64
1986
–90
2.9
0.00
N.S
.14
.40.
04N
.S.
1.2
0.00
N.S
.18
.50.
03C
17.3
0.01
N.S
.
San
Anto
nio–
City
Wat
er B
oard
#Di
rect
orie
s64
1986
–90
2.8
0.00
N.S
.14
.40.
11Un
der
1.3
0.00
N.S
.18
.50.
09C
17.6
0.09
Unde
r
San
Anto
nio–
City
$Di
rect
orie
s90
519
86–8
70.
21.
65N
.S.
8.6
1.13
N.S
.0.
018
7.00
Over
8.8
1.57
C21
.60.
15Un
der
San
Anto
nio–
City
#Di
rect
orie
s90
519
86–8
70.
14.
13Ov
er8.
41.
85Ov
er0.
011
8.75
Over
8.5
2.42
C22
.30.
32Un
der
APPENDIX: STUDY METHODS

DO MINORITY-OWNED BUSINESSES GET A FAIR SHARE OF GOVERNMENT CONTRACTS?112
THE URBANINSTITUTE
Tabl
e A
.3d
. Evi
den
ce o
f D
isp
arit
y in
th
e O
ther
Ser
vice
s In
du
stry
(C
onti
nu
ed)
AFRI
CAN
NAT
IVE
BACK
GROU
ND
AMER
ICAN
SLA
TIN
OSAS
IAN
SAM
ERIC
ANS
ALL
MIN
ORIT
IES
WOM
EN
# of
Disp
.St
at.
Disp
.St
at.
Disp
.St
at.
Disp
.St
at.
Disp
.St
at.
Disp
.St
at.
Sour
ceCo
ntra
cts
Year
Avai
l.Ra
tioSi
g.Av
ail.
Ratio
Sig.
Avai
l.Ra
tioSi
g.Av
ail.
Ratio
Sig.
Avai
l.Ra
tioSi
g.Av
ail.
Ratio
Sig.
San
Anto
nio–
City
$Di
rect
orie
s60
619
89–9
00.
111
.63
Over
8.0
2.45
Over
0.0
95.0
0Ov
er8.
22.
90C
22.5
0.36
Unde
rSa
n An
toni
o–Ci
ty #
Dire
ctor
ies
606
1989
–90
0.1
15.3
6Ov
er8.
32.
25Ov
er0.
168
.83
Over
8.5
2.88
C22
.10.
43Un
der
Texa
s $
SM/W
OBE—
Empl
.N
S9/
88–8
/91
3.3
0.25
Unde
r8.
20.
14Un
der
2.3
0.09
Unde
r13
.80.
16Un
der
16.6
0.32
Unde
rTe
xas
#SM
/WOB
E—Em
pl.
NS
9/88
–8/9
12.
40.
18Un
der
9.8
0.36
Unde
r1.
80.
18Un
der
14.0
0.31
Unde
r16
.70.
59Un
der
Texa
s $
SM/W
OBE—
Empl
.N
S9/
91–8
/93
3.5
0.23
N.S
.9.
90.
22Un
der
2.3
0.45
N.S
.15
.70.
25Un
der
17.3
0.33
Unde
rTe
xas
#SM
/WOB
E—Em
pl.
NS
9/91
–8/9
32.
40.
27Un
der
10.2
0.37
Unde
r1.
80.
26Un
der
14.4
0.34
Unde
r17
.00.
59Un
der
Tucs
on $
Surv
ey—
Inte
rest
746
1991
–94
1.4
1.11
N.S
.8.
50.
32Un
der
1.0
0.11
N.S
.0.
70.
25N
.S.
11.6
0.40
Unde
r16
.90.
75Un
der
Tucs
on $
Mai
ling
list
746
1991
–94
1.3
1.23
N.S
.4.
50.
61Un
der
1.3
0.08
Unde
r0.
70.
24N
.S.
7.8
0.59
Unde
r9.
81.
29N
C
Not
es: U
nles
s ot
herw
ise
indi
cate
d, “
Wom
en”
incl
udes
min
ority
wom
en a
nd “
All M
inor
ities
” do
es n
ot in
clud
e w
hite
wom
en.
A “$
” af
ter t
he s
tudy
nam
e in
dica
tes
disp
arity
refe
rs to
the
dolla
r val
ue o
f con
tract
s aw
arde
d; a
“#”
indi
-ca
tes
disp
arity
refe
rs to
the
num
ber o
f con
tract
s aw
arde
d. “
Unde
r”, “
Over
”, a
nd “
Not
Sig
.” in
the
“Sta
t Sig
.” c
olum
n in
dica
tes
stat
istic
ally
sig
nific
ant u
nder
utili
zatio
n, s
tatis
tical
ly s
igni
fican
t ove
rutil
izatio
n, a
nd n
ot s
igni
fican
tly d
iffer
ent
from
one
, res
pect
ivel
y. N
C st
ands
for s
tatis
tical
sig
nific
ance
not
cal
cula
ted
in s
tudy
. C
stan
ds fo
r ava
ilabi
lity
and
disp
arity
ratio
cal
cula
ted
by a
utho
rs.
NA
stan
ds fo
r no
avai
labi
lity,
ther
efor
e ca
nnot
cal
cula
te d
ispa
rity
ratio
. A
blan
k in
di-
cate
s st
udy
did
not r
epor
t thi
s fig
ure.
Th
e av
aila
bilit
y m
easu
re “
SM/W
OBE–
Empl
” on
ly in
clud
es fi
rms
with
pai
d em
ploy
ees.
See
als
o st
udy–
spec
ific
note
s at
end
of t
able
.

Notes to Table A.3Evidence of Disparity
Alameda County, CA: Only construction contracts over $25,000 are ana-lyzed. Only professional service contracts over $25,000 are reported. Figures forAsians include Native Americans. For large contracts, the measure of overallconstruction utilization allocates the total dollars awarded to the race/ethnic-ity of the prime contractor, and may therefore overstate disparity.
Albuquerque: The availability measure “CIP Bidders list” is a separate bid-ders list of professional design firms maintained by the city’s CapitalImprovement Program.
Asheville, NC: “Goods” includes all purchase orders. Eighty-eight percentof all expenditures are for goods. “Asians” includes Native Americans andother minorities.
Boston Metro Area: This study was commissioned by the City of Boston, theBoston Public Housing Authority, and the Water and Sewer Commission, butthe agencies examined were state agencies. For the Executive Office ofEnvironmental Affairs, the measure of overall construction utilization allo-cates the total dollars awarded to the race/ethnicity of the prime contractor, andmay therefore overstate disparity.
Chicago—City: Number of contracts listed is actually number of firmsreceiving contracts, which underestimates number of contracts. “WBEs”includes white women only.
Cincinnati: The availability source “Bidders list: C” uses only certifiedMBEs; “Bidders list: C&N” uses certified and non-certified, self-reported MBEs.“Goods” includes supplies and other contractual services. The measure of over-all construction utilization allocates the total dollars awarded to the race/eth-nicity of the prime contractor, and may therefore overstate disparity.
Columbus, OH: “Asians” includes Native Americans for all SM/WOBE mea-sures. “Other Services” includes both professional and non-professional ser-vices. For pre-1991 years, “Women” includes minority women; for later years,only white women are included. For pre-1991 years, SM/WOBE data areadjusted for C-corporations; for later years, SM/WOBE data are adjusted for C-corporations and undercount of Hispanics and Asians.
Contra Costa County, CA: Small contracts are those less than $25,000. “AllMinorities” category includes WBEs. The measure of overall construction uti-lization allocates the total dollars awarded to the race/ethnicity of the primecontractor, and may therefore overstate disparity.
Dade County, FL: Study does not include firms that are not “gender/ethnicidentified,” and thus overstates minority utilization. “Asians” category includesAsians and other minorities. “Other Services” includes both professional andnon-professional services. “Women” includes only white women.
APPENDIX: STUDY METHODS
THE URBANINSTITUTE
113
Dallas: “All Minorities” category includes WBEs. “Women” includes onlywhite women.
Dallas/Fort Worth Airport: Number of contracts listed are actually numberof firms receiving contracts, an underestimate of number of contracts. For the1988–1992 figures, the number listed under the “MBE” heading includes allWBEs. The study performs statistical significance tests at the 95 percent confi-dence level, but does not indicate which of the results pass this test. “OtherServices” category includes professional and non-professional services.
Dayton, OH: “Goods” includes both goods and services. Study did not testfor statistical significance when utilization was zero.
Denver—Phase II: “Other Services” includes both professional and non-professional services. “Construction” includes contracts identified by thestudy authors as “remodeling.”
Denver—Regional Transportation District: “Asians” includes NativeAmericans and other minorities. “Women” includes minority and whitewomen. SM/WOBE data are adjusted for growth and undercount of Hispanicsand Asians, and weighted geographically. Only firms with a payroll are considered.
Florida: WBE utilization is measured for white women, while availability ismeasured for all women. The measure of overall construction utilization allo-cates the total dollars awarded to the race/ethnicity of the prime contractor, andmay therefore overstate disparity.
Fort Worth—City: Number of contracts listed is actually number of firmsreceiving contracts, which is an underestimate of number of contracts. Thestudy performs statistical significance tests at the 95 percent confidence level,but does not indicate which of the results pass this test. It states simply that 118of the 128 measures for all minorities and all women, and 109 of the 128 mea-sures for specific racial/ethnic groups, showed statistically significant under-utilization.
Fort Worth—Transportation: Number of contracts listed is actually num-ber of firms receiving contracts, which is an underestimate of number of con-tracts. WBE numbers include only white women. The measure of overall con-struction utilization allocates the total dollars awarded to the race/ethnicity ofthe prime contractor, and may therefore overstate disparity.
Greensboro: Figures for “Goods” refer only to retail trade.
Hayward, CA: “Construction” is contracts under $100,000 and all contracts.The “Asian” category includes Native Americans.
Hennepin County, MN: For SM/WOBE measures of availability, “Asians”includes Native Americans. “All Minorities” includes firms of unspecifiedminority status. “Women” includes only white women. SM/WOBE data areadjusted for C-corporations and undercount of Hispanics, Asians, and NativeAmericans.
DO MINORITY-OWNED BUSINESSES GET A FAIR SHARE OF GOVERNMENT CONTRACTS?114
THE URBANINSTITUTE

Houston: Houston purchase orders totaled $690 million during the studyperiod. Large purchase orders totaled $292 million. Houston architecture andengineering contracts totaled $363 million.
Jacksonville: “Asians” includes Native Americans. “All Minorities” includesall women. “Goods” category includes goods and services (all purchasing).
Jefferson County, AL: “Women” includes minority and white women.SM/WOBE data are adjusted for growth.
Louisiana: “Asians” includes Pacific Islanders. “Women” includes whitewomen only.
Maricopa County, AZ: “Professional Services” includes only architectureand engineering. “Goods” also includes services other than health services andarchitecture and engineering.
Maryland: “Asians” includes Native Americans and other minorities.“Other Services” includes professional and non-professional services.
Maryland—Department of Transportation: “Professional Services” onlyincludes architecture and engineering. “Asians” category includes NativeAmericans and other minorities. Maryland contracts totaled $4.6 billion.
Massachusetts: “Goods” includes goods and services. The study did not testfor statistical significance when utilization was zero.
Memphis: Some of the agencies/localities for which the Memphis studyreported figures are not included in the table because of the small number ofcontracts. “Goods” includes non-professional services. “Asian” categoryincludes Pacific Islanders.
Milwaukee: The “All Minorities” category includes women. “Asians” alsoincludes Native Americans. Figures for professional services and goods are pre-sented in the study, but these are not presented in the table because they are toodisaggregated (at 2-digit SIC code level).
Minneapolis: The “Asian” category includes Native Americans and otherminorities for availability measures based on SM/WOBE data. Small contractsare those less than $100,000. Large contracts are over $100,000. Except for theanalysis of large contracts only, the measure of overall construction utilizationallocates the total dollars awarded to the race/ethnicity of the prime contrac-tor, and may therefore overstate disparity.
New Mexico: “Women” includes only white women. SM/WOBE availabil-ity refers to firms in the highway construction industry only. Only a subset ofthe measures of availability are shown. “Professional Services” includes onlyprofessional design and engineering.
New Orleans: WBEs are included in the “All Minorities” category. Thestudy tested only whether disparity ratios less than 1 were statistically signifi-cant. Ratios greater than 1 are labeled NC. The “Other Services” category
APPENDIX: STUDY METHODS
THE URBANINSTITUTE
115

includes professional and non-professional services. The measure of overallconstruction utilization allocates the total dollars awarded to the race/ethnic-ity of the prime contractor, and may therefore overstate disparity.
New York City: “Asians” includes other minorities. Federally funded con-tracts are not included. Figures for subcontracts are construction subcontractorsused by construction contracts; other subcontracts are excluded. The number of“Goods” subcontracts used by construction firms was 1,466, almost twice thefigure for construction subcontracts. Large contracts include only those over$2,500. “Other Services” includes professional and non-professional services.
New York City Housing Authority: Women are included in the “AllMinorities” category. “Asian” category may include Native Americans. Thestudy also includes numbers for Hasidic Jews, which are not shown. The“Goods” category includes only small purchases. Under the “Construction” cat-egory the measure “small contracts” includes only “tile and paint.” The studytested only whether disparity ratios less than 1 were statistically significant.Ratios greater than 1 are labeled NC. The measure of overall construction uti-lization allocates the total dollars awarded to the race/ethnicity of the primecontractor, and may therefore overstate disparity.
New York State: Contract and procurement dollars in FY90–91 totaledroughly $4 billion (more than 800,000 orders).
Oakland—School District: “Women” includes only white women.
Pennsylvania (SEPTA): SEPTA stands for “Southeastern PennsylvaniaTransportation Authority.” Large contracts are only those over $10,000; smallcontracts are under $10,000. “Other Services” includes professional and non-professional services. The study only tested whether disparity ratios less than 1were statistically significant. Ratios greater than 1 are labeled NC. The mea-sure of overall construction utilization allocates the total dollars awarded to therace/ethnicity of the prime contractor, and may therefore overstate disparity.
Phoenix: “All Minorities” includes other minority groups not shown here.
Pima County, AZ: The study tested only whether disparity ratios less than1 were statistically significant. Ratios greater than 1 are labeled NC. The “Asian”category includes Native Americans and other minorities for availability mea-sures based on SM/WOBE data.
Port Authority NY/NJ: The “Bid Attempts” measure allows for multiplebids from one firm. “Asians” includes Pacific Islanders. “Women” includesonly WBEs owned by white women. The measure of overall construction uti-lization allocates the total dollars awarded to the race/ethnicity of the primecontractor, and may therefore overstate disparity.
Prince George’s County, MD: “Other Services” includes both professionaland non-professional services. Study did not calculate statistical significance.
Ramsey County, MN: For SM/WOBE measures of availability, “Asians”includes Native Americans. “All Minorities” includes minority firms of unspec-
DO MINORITY-OWNED BUSINESSES GET A FAIR SHARE OF GOVERNMENT CONTRACTS?116
THE URBANINSTITUTE

ified minority status. “Women” includes only white women. SM/WOBE dataare adjusted for C-corporations and undercount of Hispanics, Asians, andNative Americans.
Richmond, CA: “Women” includes only white women.
Sacramento: “Women” includes only white women. “Other Services”includes only the maintenance industry. The measure of overall constructionutilization allocates the total dollars awarded to the race/ethnicity of the primecontractor, and may therefore overstate disparity.
San Antonio: The “Other Services” category includes professional and non-professional services. The measure of overall construction utilization allocatesthe total dollars awarded to the race/ethnicity of the prime contractor, and maytherefore overstate disparity.
San Jose—Procurement and Professional Services: “Women” includes onlywhite women.
St. Paul: The “Asian” category includes Native Americans and otherminorities for availability measures based on SM/WOBE data. “Other Services”includes all services except architecture and engineering.
St. Paul—School District: For SM/WOBE measures of availability, “Asians”includes Native Americans. “Women” includes only white women. SM/WOBEdata are adjusted for C-corporations and undercount of Hispanics, Asians, andNative Americans.
St. Petersburg: Federal funds were excluded in 1984 and part of 1985.
Syracuse, NY: “Women” includes both minority and white women. Thestudy did not calculate statistical significance. The study presents both highand low estimates of availability of minority-owned firms.
Tampa, FL: The study calculates figures with and without EPA dollars inan attempt to identify the effect of the federal set-aside program. “Asians”includes Asians and other minorities.
Texas: Contracts totaled $14.5 billion with 190,000 vendors. Department ofTransportation contracts totaled $6.6 billion. Construction subcontracts includeinformation from five agencies. The measure of overall construction utiliza-tion allocates the total dollars awarded to the race/ethnicity of the prime con-tractor, and may therefore overstate disparity. The “Asians” category includesNative Americans and other minorities. Number of contracts listed is actuallynumber of firms receiving contracts, which underestimates number of contracts.
Tucson: Number of contracts listed is actually number of firms receivingcontracts, an underestimate of number of contracts.
Washington, D.C: “Other Services” includes both professional and non-pro-fessional services.
APPENDIX: STUDY METHODS
THE URBANINSTITUTE
117

About the Authors
María Enchautegui is a labor economist and senior research associatewithin the Urban Institute’s Population Studies Center.
Michael Fix is a principal research associate and attorney within theInstitute’s Population Studies Center, where he directs the Immigrant PolicyProgram.
Pamela Loprest is an economist and senior research associate within theUrban Institute’s Income and Benefits Policy Center. She served as the projectmanager for the study.
Sarah C. von der Lippe is a private attorney and consultant in Washington,D.C., specializing in civil rights policy and law.
Douglas Wissoker is an economist and senior research associate within theUrban Institute’s Human Resources Policy Center.


