Embed Size (px)
Citation preview

IZA DP No. 1434
Do Migrants Get Good Jobs?New Migrant Settlement in Australia
P. N. (Raja) JunankarStéphane Mahuteau
DI
SC
US
SI
ON
P
AP
ER
S
ER
IE
S
Forschungsinstitut
zur Zukunft der Arbeit
Institute for the Study
of Labor
December 2004

Do Migrants Get Good Jobs?
New Migrant Settlement in Australia
P. N. (Raja) Junankar University of Western Sydney
and IZA Bonn
Stéphane Mahuteau University of Western Sydney
Discussion Paper No. 1434 December 2004
IZA
P.O. Box 7240 53072 Bonn
Germany
Phone: +49-228-3894-0 Fax: +49-228-3894-180
Email: [email protected]
Any opinions expressed here are those of the author(s) and not those of the institute. Research disseminated by IZA may include views on policy, but the institute itself takes no institutional policy positions. The Institute for the Study of Labor (IZA) in Bonn is a local and virtual international research center and a place of communication between science, politics and business. IZA is an independent nonprofit company supported by Deutsche Post World Net. The center is associated with the University of Bonn and offers a stimulating research environment through its research networks, research support, and visitors and doctoral programs. IZA engages in (i) original and internationally competitive research in all fields of labor economics, (ii) development of policy concepts, and (iii) dissemination of research results and concepts to the interested public. IZA Discussion Papers often represent preliminary work and are circulated to encourage discussion. Citation of such a paper should account for its provisional character. A revised version may be available directly from the author.

IZA Discussion Paper No. 1434 December 2004
ABSTRACT
Do Migrants Get Good Jobs? New Migrant Settlement in Australia ∗
This paper investigates the ease with which recent immigrants to Australia from different countries and with different visa categories enter employment at an appropriate level to their prior education and experience in the source country. Unlike most of the earlier research in this field that studied the labour market status of migrants (probabilities of employment, or unemployment, or participation, or wage equation) this paper focuses on the quality of job that the migrant obtains on arrival in Australia. We provide alternative definitions of what is a good job in terms of objective and subjective criteria. The paper uses two sets of the Longitudinal Survey of Immigrants to Australia data: the first cohort that arrived in 1993-95 and the second cohort that arrived in 1999-2000. In particular we would study how changes in social security legislation in 1997, (two year waiting period for eligibility for benefits) affected the quality of job held by new migrants. In comparing the behaviour of migrants in the labour market with and without access to social security benefits we would study whether migrants are more likely to accept bad jobs after the legislative changes. The paper uses bivariate probit models to estimate the probabilities of holding a good job in terms of the usual human capital and demographic variables (including the visa category for entry into Australia). Our results suggest that the policy change had a positive impact on the probability to find a job but a negative impact to hold a good job. JEL Classification: J61, J68, C25 Keywords: immigrants, immigrant policies, job satisfaction, good jobs, labour market
outcomes, bivariate probit Corresponding author: P.N. (Raja) Junankar School of Economics and Finance University of Western Sydney Campbelltown Campus Locked Bag 1797 Penrith South DC NSW 1797 Australia Email: [email protected]
∗ We would like to thank the University of Western Sydney for providing us with a research grant for the early stages of this research. We also thank the Australian Research Council for a Discovery grant to continue this research. An earlier version of this paper was presented to the Australian Labour Market Research Workshop at Adelaide, February 19-20 2004. We would like to thank our discussant Professor Bruce Chapman and other participants for helpful comments.

1. Introduction This paper investigates the ease with which recent immigrants to Australia from different countries and with different visa categories enter employment at an appropriate level to their prior education and experience in the source country. Unlike most of the earlier research in this field that studied the labour market status of migrants (probabilities of employment, or unemployment, or participation) this paper focuses on the quality of job that the migrant obtains on arrival in Australia. We provide alternative definitions of what is a good job in terms of objective and subjective criteria. The paper uses two sets of the Longitudinal Survey of Immigrants to Australia data: the first cohort that arrived in 1993-95 and the second cohort that arrived in 1999-2000. In particular we would study how changes in social security legislation in 1997, (two year waiting period for eligibility for benefits) affected the quality of job held by new migrants. In comparing the behaviour of migrants in the labour market with and without access to social security benefits we would study whether migrants are more likely to accept bad jobs after the legislative changes. The paper uses bivariate probit models to estimate the probabilities of accepting a good job in terms of the usual human capital and demographic variables (including the visa category for entry into Australia). In this paper we focus on the Principal Applicants, that is the person who is granted a visa to enter Australia who may bring along their spouse and dependent children. The Longitudinal Surveys of Immigrants to Australia provide a rich source of data to analyse the settlement issues of new migrants in Australia. There have been two cohorts for whom data have been collected by the Department of Immigration, Multicultural and Indigenous Affairs (as it is now called). The first cohort entered Australia between September 1993 and August 1995 and the second cohort entered between September 1999 and August 2000. The first cohort was interviewed three times: 6 months after arrival (Wave 1), 18 months after arrival (Wave 2), and 42 months after arrival (Wave 3). The second cohort was interviewed only twice: 6 months after arrival (Wave 1) and 18 months after arrival (Wave 2). The first cohort consisted of 6,960 primary applicants and their spouses and the second cohort consisted of 4,181 primary applicants and their spouses1. In the first cohort there were 5192 Principal Applicants (43.03 % female) and in the second cohort there were 3124 Principal Applicants (45.84 % female). This paper focuses on the labour market behaviour of Principal Applicants only. Between the two cohorts there were several significant policy changes that probably affected the composition of the migrant intake and their behaviour after entering Australia. In particular, there were several changes in the selection procedure for entering Australia that, in effect, made it more difficult for family members to enter, a tightening of the points test and the English language test, and a decrease in the humanitarian (refugee) category. These changes are discussed in detail in Cobb-Clark (2003). These changes are likely to have affected the quality of migrants in terms of their human capital characteristics. In other words, the second cohort of the LSIA are not strictly speaking comparable to the first cohort. The tightening up of entry conditions for family migrants could have affected the quality of potential applicants,
1 Further details can be found in Cobb-Clark (2001).

2
especially if they came from cultures where an extended family is an important social group. Would you move to a country where you were unable to bring your ailing old-age parents? Another important change that took place was the eligibility for unemployment and other social security benefits. For the first cohort, migrants had a waiting period of six months before they became eligible for social security benefits (excluding the humanitarian category of migrants who had access to all benefits without a waiting period). For the second cohort, the waiting period had been increased to two years as well as the tightening up of procedures for access to these benefits. These changes are likely to have affected the decisions of the potential migrants on whether to apply to migrate to Australia. In addition, once they entered Australia the lack of access to social security benefits may affect the labour market behaviour of these migrants by influencing their reservation wage. Some of these issues are discussed in Cobb-Clark (2003) and in Richardson et al. (2001, 2002). These papers compare the first LSIA cohort with the first wave of the second LSIA cohort and come to the conclusion that the migrants are more likely to be employed in the second cohort compared to the first cohort, that they are less likely to be unemployed, etc. and suggest that this is due to a combination of the tightening up of the selection criteria between the two cohorts and because of the limited access to social security benefits for the second cohort. Our paper is novel in that it is interested in studying the quality of job new migrants obtain on entering the Australian labour market. Given these changes to social security we would expect a new migrant to accept almost any job in the first instance and then look for better jobs as they acquired further information about the labour market. In other words, we would expect new migrants to have a higher probability of accepting a “bad job”, a higher job mobility (more job changes), as well as an attempt to move from “bad jobs” to “good jobs”. Unlike most earlier work in this field that looks at wages or labour market status of migrants, we focus on the quality of the job that the migrant holds. In particular, we use different definitions of what we call a good or bad job based on either objective characteristics or on subjective characteristics. In particular, we say that a migrant is in a good job if s/he meets the following objective conditions: firstly, that they are using their existing qualifications in their current job, and that their occupational ranking is the same or better. The subjective definition we use is that: s/he likes their job, wants to stay in the same job, and holds only one job. In this paper we simply focus on the probability of a migrant holding a good job based on their previous qualifications, English language ability, their visa status, some demographic characteristics, and a State unemployment index to capture any aggregate demand effects. It should be noted that unemployment rates were very high when the first cohort entered the labour market (although unemployment was falling fairly sharply) but were much lower when the second cohort entered the labour market (and unemployment was falling slowly). This is illustrated in Figure 1 below. Given that the labour market was stronger when the second cohort of migrants entered we would expect much better labour market outcomes even without the changes to social

3
security legislation. Further, the tightening up of selection procedures should have improved the quality of migrants and hence increased their employment probabilities.
Figure 1 Seasonally adjusted Male and Female Unemployment Rates
Male and Female Unemployment Rates, s.a.
4.0
5.0
6.0
7.0
8.0
9.0
10.0
11.0
12.0
Mar
-93
Jul-9
3
Nov
-93
Mar
-94
Jul-9
4
Nov
-94
Mar
-95
Jul-9
5
Nov
-95
Mar
-96
Jul-9
6
Nov
-96
Mar
-97
Jul-9
7
Nov
-97
Mar
-98
Jul-9
8
Nov
-98
Mar
-99
Jul-9
9
Nov
-99
Mar
-00
Jul-0
0
Nov
-00
Mar
-01
Jul-0
1
Nov
-01
Mar
-02
Jul-0
2
Nov
-02
Mar
-03
Male UR (%, sa)Female UR (%, sa)
Source: ABS, DX data.
2. How did the new migrants fare in Australia As mentioned earlier, in this paper we focus on Principal Applicants in the two cohorts, LSIA 1 and LSIA 2. (Note: All the data presented below are for the samples that we are using and have not been weighted by the sample weights to provide population estimates. As such the summary statistics presented here are not comparable to the data presented in Cobb-Clark, 2003, or in Richardson et al., 2001, 2002). Another reason for differences between our results and theirs is that we are focussing simply on Principal Applicants, while they analyse Principal Applicants and their spouses. Let us look at some key characteristics of the migrants in LSIA 1 and LSIA 2. If we look at the migrants by visa category (Table 1) we see that there is an increase in the Business category, and an increase in the Independent category, a small decrease in Family migrants, and a fall in the Humanitarian category.
Table 1 Migrants by Visa Category
LSIA 1 LSIA 2 Business 3.44% 5.79% Family 65.33% 62.18% Humanitarian 14.12% 7.44% Independent 17.12% 24.59% Total 100% 100%
Source: LSIA, DIMIA

4
If we look at a country breakdown of migrants in LSIA 1 and 2 we observe that the proportion in each cohort for the following groups of countries increased: Oceania, Middle East, North East Asia (which includes China and Hong Kong), South Asia, and Africa. We would expect the British, Irish, and the North Americans to find employment easily in the Australian context (some of them may have been appointed under the Employer Nomination Scheme, ENS). Figure 2 provides a simple graphical comparison. Note that we have used weighted data for Figures 2 and 3.
Figure 2 Composition of Migrants by Source Country
Composition of the Migrants, Cohort 1
AMERN3.58%
ASIAS9.61%
ASIANE13.66%
ASIASE21.74%
MDLEAST9.84%
EUROEAST4.67%
EUROPWN3.89%
EUROPSTH8.71%
UKRI15.27%
OCEAN2.48%
AFRICA4.75%
AMERCS1.78%
Composition of the Migrants, Cohort 2
AMERCS1.30%
AFRICA8.53%
OCEAN2.96%
UKRI14.66%
EUROPSTH7.07%
EUROPWN3.66%
EUROEAST3.06%
MDLEAST10.35%
ASIASE18.14%
ASIANE16.23%
ASIAS10.60%
AMERN3.43%
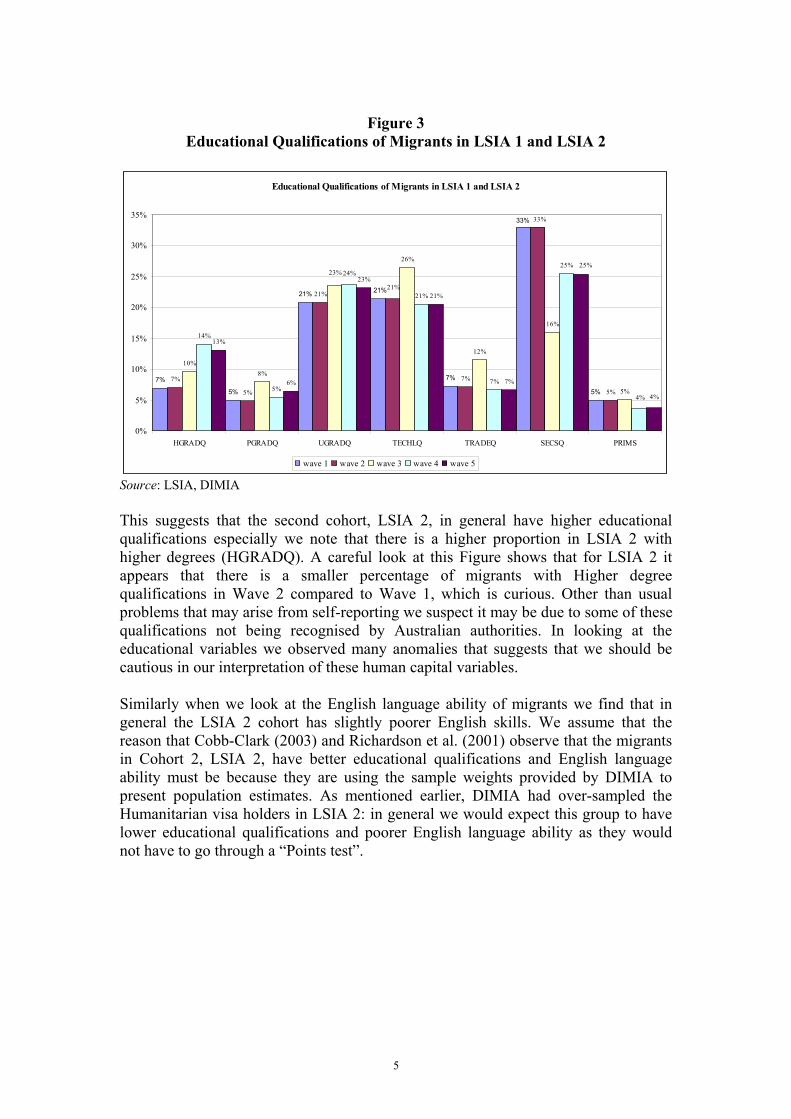
Source: LSIA, DIMIA If we now turn to some human capital characteristics of the migrants in LSIA 1 and LSIA 2 we observe that for the LSIA 2 had (in general) better education levels compared to the LSIA 1. This is shown in Figure 3 below. In Figure 3 we provide some information about the educational qualifications of new migrants. The figure shows the percentage of the sample for each Wave of LSIA 1 and LSIA 2 that have their highest qualification as a Post graduate Diploma (PGRADQ), Higher Degree (HGRADQ), Undergraduate degree (UGRADQ), Technical/Professional Qualification (TECHLQ), Trade Qualification (TRADEQ), Secondary School Qualification (SECSQ), and Primary School (PRIMS).
5
Figure 3
Educational Qualifications of Migrants in LSIA 1 and LSIA 2
Educational Qualifications of Migrants in LSIA 1 and LSIA 2
7%
5%
21%
7%
5%
7%
5%
21%
7%
5%
10%8%
26%
12%
16%
5%
14%
5%
21%
7%
25%
13%
6%
23%
21%
7%
33%
21%
33%
21%
23% 24%
4% 4%
25%
0%
5%
10%
15%
20%
25%
30%
35%
HGRADQ PGRADQ UGRADQ TECHLQ TRADEQ SECSQ PRIMS
wave 1 wave 2 wave 3 wave 4 wave 5
Source: LSIA, DIMIA This suggests that the second cohort, LSIA 2, in general have higher educational qualifications especially we note that there is a higher proportion in LSIA 2 with higher degrees (HGRADQ). A careful look at this Figure shows that for LSIA 2 it appears that there is a smaller percentage of migrants with Higher degree qualifications in Wave 2 compared to Wave 1, which is curious. Other than usual problems that may arise from self-reporting we suspect it may be due to some of these qualifications not being recognised by Australian authorities. In looking at the educational variables we observed many anomalies that suggests that we should be cautious in our interpretation of these human capital variables. Similarly when we look at the English language ability of migrants we find that in general the LSIA 2 cohort has slightly poorer English skills. We assume that the reason that Cobb-Clark (2003) and Richardson et al. (2001) observe that the migrants in Cohort 2, LSIA 2, have better educational qualifications and English language ability must be because they are using the sample weights provided by DIMIA to present population estimates. As mentioned earlier, DIMIA had over-sampled the Humanitarian visa holders in LSIA 2: in general we would expect this group to have lower educational qualifications and poorer English language ability as they would not have to go through a “Points test”.

6
Table 2 Labour Market Status, LSIA 1 and LSIA 2
cohort 1 cohort 2
In Former Country In Aust In Former
Country In Aust
Participation 74.36% 57.92% 77.53% 62.31%
Percentage employed 71.18% 35.28% 75.49% 51.14%
Wage and Salary earners 57.42% 31.83% 62.35% 45.80%
Percentage unemployed 3.18% 22.63% 2.04% 11.18%
Source: LSIA, DIMIA Notes: The data refer to Principal Applicants for their employment status in Wave 1 (that is six months after arrival in Australia) while the data in their former country is self-reported about their status prior to arrival at some undefined time. Table 2 clearly shows that migrants in Cohort 2 had higher participation rates, higher employment rates (and lower unemployment rates), and a higher percentage was wage and salary earners.
Table 3 Changes in Labour Force Status, LSIA 1 and LSIA 2
Wage and
Salary earners
Business Other Employed Unemployed Student Inactive
% change % change % change % change % change % change
LSIA1 W1 31.83 2.97 0.48 22.63 16.21 25.87
LSIA1 W2 42.84 34.57 4.93 66.02 0.84 73.62 13.94 -38.41 13.57 -16.27 23.88 -7.68
LSIA1 W3 48.44 13.08 6.40 29.98 0.13 -84.38 10.33 -25.89 6.74 -50.34 27.95 17.04
LSIA2 W1 45.80 5.05 0.29 11.18 15.15 22.53
LSIA2 W2 53.55 16.92 8.42 66.93 0.26 -9.76 7.2 -35.6 8.09 -46.6 22.48 -0.26
Source: LSIA, DIMIA It is interesting to see the progression of migrants over time: although there are more wage and salary earners at the beginning of Cohort 2 compared to Cohort 1, the increase is greater from the first Wave to the second Wave for Cohort 1. Similarly, although there are more migrants who are running a business in Cohort 2 compared to Cohort 1, there is a bigger increase for Cohort 1. This is interesting given that the labour market was worse for the first Cohort, LSIA 1 than LSIA 2. Again, given that the government had tightened up access to benefits between LSIA 1 and LSIA 2, the increases in wage and salary earners (and business migrants) was much greater for LSIA 1. Unemployment fell to a greater extent in LSIA 1 compared to LSIA 2 even though the labour market was much stronger for the second cohort.
7
3. What is a good job? In this section we put forward a simple model to determine whether a labour market participant enters into a good job. In general we would expect all individuals to want to hold a good job, however, many of them may be unsuccessful in their attempts either because they do not have the appropriate qualifications, or because of a high level of competition for the limited number of good jobs available, or because the participants have not been successful in their search for a good job because of a lack of information of the local labour market. In more formal terms whether a person is successful in getting a good job depends partly on their supply side efforts and the number of similar workers offering their services in the job market and on the demand for their skills and qualifications. Before we can proceed we need to define what we mean by a good job. Obviously what is a good job for someone with plumbing qualifications is different from someone with medical qualifications. Again, people’s tastes differ: one person may like a job near their home even though it has a lower income or has longer working hours. What we are trying to illustrate is that there are objective criteria we could use to determine what is a good job (e.g. are you using your prior qualifications in your existing job?). Alternatively, we could use subjective criteria: are you happy with your current job? Let us postulate that an individual is trying to maximise his/her utility, see Blau (1991), Hwang et al. (1998). The utility that a person gets from a job obviously depends on the income from that job (as that provides for all the goods and services that a person would like to consume). However, the utility an individual receives from a job also depends on how long the working week is, whether it requires shift work at “unsocial” hours, whether the workplace is friendly, to what extent the worker is allowed to work “autonomously” (that is without a boss breathing down their back), the level of job security, and access to generous superannuation schemes, etc. An issue that may be important to some workers may be the access to further training, either “on the job” training, or off the job training. There are trade offs: a higher income may compensate some individuals for (say) shift work. These issues about the quality of the job in terms of various characteristics have been discussed in the Industrial Relations and Sociology literature. Following Hwang et al. (1998) we assume that a job has two aspects that determine the value to the worker searching for a job: firstly, the wage rate (w), and secondly a bundle of job characteristics (x). Hwang et al. assume a simple linear (separable) function:
v = w + h(x) where h is a quasi concave function of x. Under certain assumptions they show that it is possible to get a distribution function of job values, F(v) and workers maximise their present values by selecting a reservation value, v*, (analogous to a reservation wage in simple search theory). Workers accept any job offer that has v ≥ v*. In our econometric analysis we follow this approach and suggest that changes in the social security benefit eligibility would affect (lower) the migrant’s reservation value of the job. In our analysis we allow for different aspects of the job to be included in x, and then create a simple dichotomic variable for a good job.
A recent paper by Andrew Clark (1998) provides an interesting discussion where he lists a range of characteristics that make a good job. He points out that in surveys of workers in OECD countries, that hours of work and wages are ranked almost at the

8
bottom of a list of what they consider as important in a job. The characteristics that he lists as important in defining a good job are: pay, hours of work, future promotion prospects, how hard or difficult the job is, the job content (interest, prestige, and independence), and interpersonal relationships. It is fairly obvious that if people are dissatisfied with their job they are more likely to quit, see Akerlof, Rose and Yellen (1988). Obviously everyone would like a good job. However, for various reasons they cannot all be successful. Clearly, someone with good educational qualifications, some prior work experience, and adequate resources (in terms of savings or access to social security benefits) can afford to wait longer during the search for a good job (or more formally, they have a higher reservation job quality). Another variable that is important in job search is the access to an informal network of friends, family, former work colleagues, etc. There is much evidence from labour market surveys that a large proportion of jobs are found through these informal networks. New migrants, unless they have some family already in Australia, are at a disadvantage compared to the “natives” (Australian born). Another important issue that would affect the quality of jobs offered to an individual (say controlling for their human capital) would be the state of the labour market. When unemployment is high workers have less bargaining power and hence may have to accept a poorer quality job. Similarly, new migrants may (due to inadequate knowledge of the local labour market) accept a poor quality job but then decide to look for a higher quality job. Hence, some indicator of job satisfaction provides us with evidence on the subjective valuation of the job by the worker. If we look at some descriptive statistics on the distribution of migrants with good jobs (defined in an objective way) we see that Business visa and Independent visa migrants have good jobs while very few of the family and refugee migrants have good jobs. Business migrants in LSIA 2 Wave 1 appear to have fewer good jobs while Independent and family migrants have more good jobs. This improvement may be due to the fact that the selection was tighter and the labour market was stronger. The change between LSIA 2 Waves 1 and 2 are curious!
Figure 4 Distribution of Good Jobs (Objective) by Visa Category
Descriptive statistics: Good Job (object ive) per visa category and wave
0%
10%
20%
30%
40%
50%
60%
70%
GJ1 GJ1 GJ1 GJ1 GJ1
visabiz visafam visaindp visaref

9
If we now turn to the subjective measure of good jobs we see essentially the same distribution. The Business migrants have fewer good jobs in LSIA 2 compared to LSIA 1 in Wave 1. However, Independent migrants have more good jobs in LSIA 2 than in LSIA 1 in Wave 1.
Figure 5 Distribution of Good Job (Subjective) by Visa Category
Descriptive statistics: Good Job (subjective) per visa category and wave
0%
10%
20%
30%
40%
50%
60%
70%
GJ1 GJ1 GJ1 GJ1 GJ1
visabiz visafam visaindp visaref
4. Some Preliminary Results In this paper we begin by first carrying out bivariate Probit estimations on the probability of a migrant holding a good job allowing for whether the migrant participates in the labour market. Henceforth we use the word “participate” to mean that the person is actively participating in the labour market but is not unemployed. In other words, the person is either employed, self-employed, or is a business owner. We use two different definitions of what is a good job: Objective Definition:
(a) the migrant is regularly using their existing qualifications from their home country in the job; and
(b) their occupational ranking (using ASCO, 1 digit coding) is the same as or better than in their occupation in their former country.
Subjective Definition
(a) the migrant likes (loves) their job; and (b) the migrants wants to remain in that job; and (c) they hold only one job.
These definitions were used to carry out bivariate probit estimates on the first Wave of LSIA 1 and LSIA 2. The first stage of the estimation is a “participation” equation (note we mean is not unemployed and participating) that is based on age, age squared, country of origin, participation in the former country, level of education, state, english proficiency. We also control for refugee status, and adde a cohort dummy (COHORT=1 for LSIA 2).

10
We observe a migrant’s job quality (subjective and objective) only if s/he participates in the labour force. Besides, we suspect that the decision to participate in the labour force and the actual quality of the job held in Australia may somehow be correlated. In other words, we cannot assume that the population of migrants reporting having a good job is randomly drawn from whole population of migrants. The model can then be described as follows:
'1 1 1 1i i iz xβ ε= + , 1 1 11 if 0, 0 otherwisei i iy z y= > =
'2 2 2 2i i iz xβ ε= + , 2 2 21 if 0, 0 otherwisei i iy z y= > =
With, 1iy ( 2iy ), the dichotomous (observed) variable, taking value 1 if the migrant has a “good job” in Australia (participates in the labour market in Australia); 1iz ( 2iz ), the corresponding latent variables; 1ix ( 2ix ), the set of independent variables thought to affect the probability to obtain a good job (the probability to participate in the labour force in Australia); 1iε ( 2iε ) the vectors of disturbances. 1iy and 1ix are observed only when 2iy =1, the migrant “participates” in the labour force in Australia. The two disturbances may be correlated and assumed to have a bivariate normal distribution with correlation coefficient (to be estimated) ρ:
1 2( , ) (0,0,1,1, )i i BVNε ε ρ
We estimate the probability for a migrant to obtain a good job given that s/he participates in the labour force:
( ) ( )' '1 2 1 1 1 2 2 2Pr 1 1 Pri i i i i i i iy y x xε β ε β= = = > − > −
The log likelihood to be maximized with respect to the parameters of the model is given by:
2 1 2 1 2
' ' ' ' '2 1 1 2 2 2 1 1 2 2 2 2
1, 1 1, 0 0log , , log , , logi i i i i
y y y y yLogL x x x x xβ β ρ β β ρ β
= = = = =
= Φ + Φ − − − Φ − ∑ ∑ ∑ where [ ]2 ...Φ stands for the bivariate normal CDF2 and [ ]...Φ stands for the Normal CDF. The following tables (table 4 and 5)3 give the maximum likelihood estimates of the two models. The first set of columns give the results of the first equation, namely the determinants of the probability to have a job in Australia. Three equations are tested, one on all migrants, another on the sample restricted to female and the last on the sample restricted on males. The second set of columns gives the estimates for the probability to hold a good job in Australia, with the same three distinction between all migrants, females and males.
2 The estimations are carried out with the software Limdep 8.00/Nlogit 2.00 which uses a 15 points Gauss-Laguerre quadrature for approximating the bivariate normal CDF. 3 The appendix lists all variable used in the estimations along with their meaning.
11
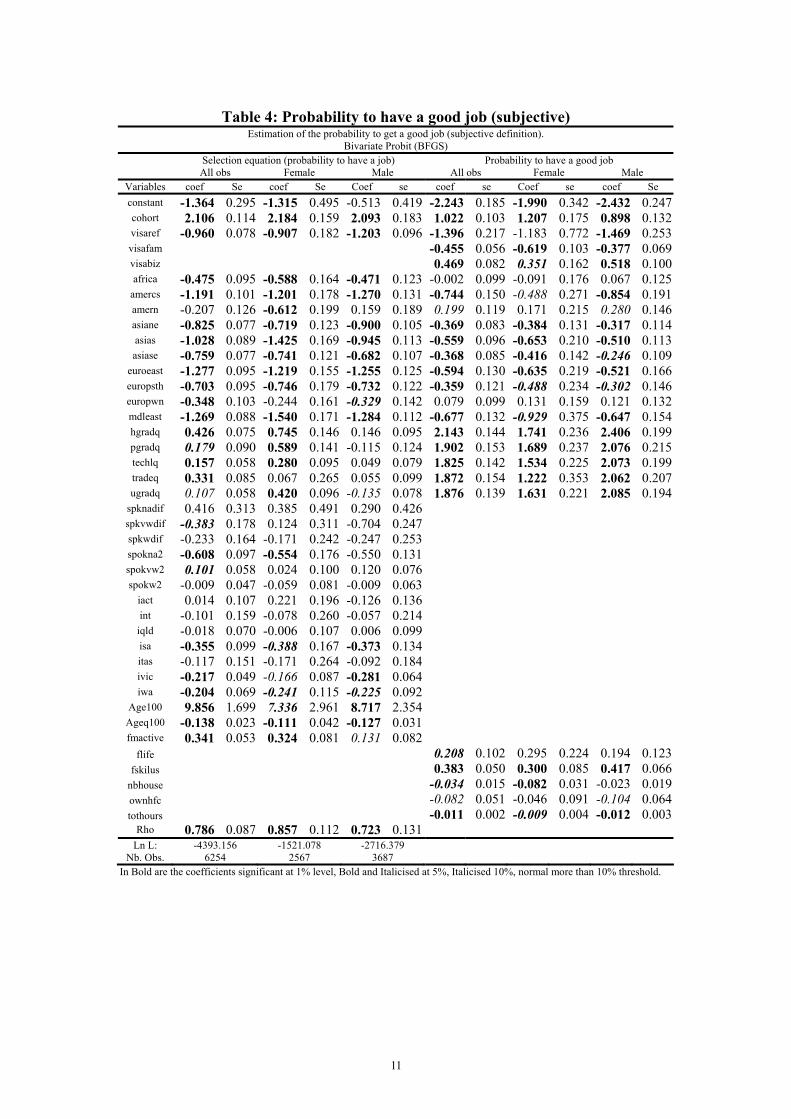
Table 4: Probability to have a good job (subjective)
Estimation of the probability to get a good job (subjective definition). Bivariate Probit (BFGS)
Selection equation (probability to have a job) Probability to have a good job All obs Female Male All obs Female Male
Variables coef Se coef Se Coef se coef se Coef se coef Se constant -1.364 0.295 -1.315 0.495 -0.513 0.419 -2.243 0.185 -1.990 0.342 -2.432 0.247cohort 2.106 0.114 2.184 0.159 2.093 0.183 1.022 0.103 1.207 0.175 0.898 0.132visaref -0.960 0.078 -0.907 0.182 -1.203 0.096 -1.396 0.217 -1.183 0.772 -1.469 0.253visafam -0.455 0.056 -0.619 0.103 -0.377 0.069visabiz 0.469 0.082 0.351 0.162 0.518 0.100africa -0.475 0.095 -0.588 0.164 -0.471 0.123 -0.002 0.099 -0.091 0.176 0.067 0.125
amercs -1.191 0.101 -1.201 0.178 -1.270 0.131 -0.744 0.150 -0.488 0.271 -0.854 0.191amern -0.207 0.126 -0.612 0.199 0.159 0.189 0.199 0.119 0.171 0.215 0.280 0.146asiane -0.825 0.077 -0.719 0.123 -0.900 0.105 -0.369 0.083 -0.384 0.131 -0.317 0.114asias -1.028 0.089 -1.425 0.169 -0.945 0.113 -0.559 0.096 -0.653 0.210 -0.510 0.113asiase -0.759 0.077 -0.741 0.121 -0.682 0.107 -0.368 0.085 -0.416 0.142 -0.246 0.109
euroeast -1.277 0.095 -1.219 0.155 -1.255 0.125 -0.594 0.130 -0.635 0.219 -0.521 0.166europsth -0.703 0.095 -0.746 0.179 -0.732 0.122 -0.359 0.121 -0.488 0.234 -0.302 0.146europwn -0.348 0.103 -0.244 0.161 -0.329 0.142 0.079 0.099 0.131 0.159 0.121 0.132mdleast -1.269 0.088 -1.540 0.171 -1.284 0.112 -0.677 0.132 -0.929 0.375 -0.647 0.154hgradq 0.426 0.075 0.745 0.146 0.146 0.095 2.143 0.144 1.741 0.236 2.406 0.199pgradq 0.179 0.090 0.589 0.141 -0.115 0.124 1.902 0.153 1.689 0.237 2.076 0.215techlq 0.157 0.058 0.280 0.095 0.049 0.079 1.825 0.142 1.534 0.225 2.073 0.199tradeq 0.331 0.085 0.067 0.265 0.055 0.099 1.872 0.154 1.222 0.353 2.062 0.207ugradq 0.107 0.058 0.420 0.096 -0.135 0.078 1.876 0.139 1.631 0.221 2.085 0.194
spknadif 0.416 0.313 0.385 0.491 0.290 0.426 spkvwdif -0.383 0.178 0.124 0.311 -0.704 0.247 spkwdif -0.233 0.164 -0.171 0.242 -0.247 0.253 spokna2 -0.608 0.097 -0.554 0.176 -0.550 0.131 spokvw2 0.101 0.058 0.024 0.100 0.120 0.076 spokw2 -0.009 0.047 -0.059 0.081 -0.009 0.063
iact 0.014 0.107 0.221 0.196 -0.126 0.136 int -0.101 0.159 -0.078 0.260 -0.057 0.214
iqld -0.018 0.070 -0.006 0.107 0.006 0.099 isa -0.355 0.099 -0.388 0.167 -0.373 0.134 itas -0.117 0.151 -0.171 0.264 -0.092 0.184 ivic -0.217 0.049 -0.166 0.087 -0.281 0.064 iwa -0.204 0.069 -0.241 0.115 -0.225 0.092
Age100 9.856 1.699 7.336 2.961 8.717 2.354 Ageq100 -0.138 0.023 -0.111 0.042 -0.127 0.031 fmactive 0.341 0.053 0.324 0.081 0.131 0.082
flife 0.208 0.102 0.295 0.224 0.194 0.123fskilus 0.383 0.050 0.300 0.085 0.417 0.066
nbhouse -0.034 0.015 -0.082 0.031 -0.023 0.019ownhfc -0.082 0.051 -0.046 0.091 -0.104 0.064tothours -0.011 0.002 -0.009 0.004 -0.012 0.003
Rho 0.786 0.087 0.857 0.112 0.723 0.131 Ln L: -4393.156 -1521.078 -2716.379
Nb. Obs. 6254 2567 3687 In Bold are the coefficients significant at 1% level, Bold and Italicised at 5%, Italicised 10%, normal more than 10% threshold.

12
Table 5: Probability to have a good job (objective)
Estimation of the probability to get a good job (objective definition). Bivariate Probit (BFGS)
Selection equation (probability to have a job) Probability to have a good job All obs Female Male All obs Female Male
Variables Coef se coef se Coef se coef se coef se coef se constant -1.578 0.309 -1.507 0.516 -0.603 0.421 0.163 0.156 0.642 0.298 -0.394 0.161cohort 2.098 0.116 2.187 0.160 2.074 0.182 -0.436 0.128 -0.612 0.238 0.180 0.149visaref -0.952 0.078 -0.912 0.182 -1.238 0.095 -0.468 0.216 -0.047 0.519 -1.125 0.211visafam -0.362 0.061 -0.583 0.115 -0.287 0.071visabiz 0.414 0.076 0.268 0.161 0.432 0.090africa -0.459 0.097 -0.513 0.168 -0.495 0.123 -0.166 0.0990 -0.116 0.197 -0.290 0.111
amercs -1.188 0.102 -1.163 0.184 -1.279 0.132 -0.178 0.151 -0.480 0.260 -0.459 0.175amern -0.198 0.129 -0.492 0.199 0.124 0.191 0.234 0.114 0.377 0.216 0.164 0.135asiane -0.795 0.079 -0.659 0.126 -0.920 0.105 -0.146 0.092 -0.264 0.153 -0.397 0.112asias -1.014 0.091 -1.374 0.174 -0.959 0.114 -0.305 0.111 0.084 0.241 -0.636 0.114asiase -0.733 0.078 -0.679 0.124 -0.712 0.108 -0.329 0.095 -0.338 0.161 -0.547 0.109
euroeast -1.226 0.096 -1.142 0.159 -1.270 0.126 -0.001 0.146 -0.282 0.265 -0.322 0.178europsth -0.673 0.097 -0.648 0.185 -0.721 0.122 -0.167 0.114 -0.564 0.253 -0.231 0.131europwn -0.332 0.104 -0.174 0.163 -0.354 0.142 0.005 0.095 -0.013 0.160 -0.098 0.119mdleast -1.238 0.089 -1.462 0.168 -1.287 0.112 -0.174 0.152 -1.034 0.559 -0.565 0.152hgradq 0.428 0.077 0.720 0.149 0.176 0.096 -0.077 0.095 -0.087 0.178 0.035 0.110pgradq 0.178 0.092 0.510 0.149 -0.069 0.123 -0.092 0.106 -0.039 0.181 -0.087 0.130techlq 0.128 0.058 0.247 0.098 0.054 0.079 -0.238 0.080 0.047 0.146 -0.316 0.098tradeq 0.309 0.086 0.161 0.255 0.084 0.099 -0.086 0.103 -0.405 0.340 0.003 0.113ugradq 0.100 0.059 0.388 0.097 -0.119 0.078 -0.194 0.079 -0.207 0.141 -0.179 0.097
spknadif 0.379 0.317 0.236 0.505 0.280 0.439 spkvwdif -0.391 0.182 0.084 0.315 -0.737 0.251 spkwdif -0.264 0.170 -0.236 0.251 -0.225 0.252 spokna2 -0.591 0.098 -0.528 0.175 -0.591 0.134 spokvw2 0.122 0.061 0.064 0.105 0.104 0.079 spokw2 -0.058 0.051 -0.074 0.086 -0.012 0.064
iact -0.064 0.120 0.213 0.205 -0.135 0.141 int -0.118 0.165 -0.079 0.278 -0.118 0.221
iqld 0.022 0.071 0.067 0.108 0.034 0.097 isa -0.431 0.109 -0.460 0.179 -0.434 0.138 itas -0.050 0.152 -0.067 0.266 -0.142 0.193 ivic -0.226 0.052 -0.194 0.094 -0.299 0.066 iwa -0.178 0.072 -0.253 0.124 -0.230 0.094
age100 10.883 1.786 8.056 3.094 10.166 2.373 ageq100 -0.153 0.024 -0.124 0.044 -0.146 0.031 fmactive 0.400 0.059 0.401 0.092 -0.048 0.078
flife 0.2098 0.0949 0.128 0.195 0.235 0.106fskilus 0.5984 0.0557 0.502 0.100 0.606 0.069
nbhouse -
0.0121 0.0143 -0.006 0.027 -0.013 0.017ownhfc 0.1367 0.0528 -0.044 0.100 0.201 0.062tothours 0.0027 0.0022 0.003 0.004 0.001 0.003
Rho -0.364 0.124 -0.459 0.198 0.560 0.147 Ln L: -4723.259 -1597.248 -2956.573
Nb. Obs. 6254 2567 3687 In Bold are the coefficients significant at 1% level, Bold and Italicised at 5%, Italicised 10%, normal more than 10% threshold. 4.1 Probability to be employed in Australia. Whichever the definition chosen, in the first equation (probability to find a job in Australia) we control for the migrants’ language abilities, their country of origin, their level of education, the state they live in, and so on.

13
Given the multi-cultural nature of Australia and provided that certain nationalities are more represented and organised than others, we expect some categories of migrants to overcome their relative disadvantage upon arrival in Australia by benefiting from network effects in their community. All estimates for country of origin are expressed as reference to being originally from the United Kingdom and Ireland. Where migrants lack of knowledge of the Australian labour market as well as language abilities, we can expect them to relate to residents of same nationality; even more so that the policy has been tightened. A difference-in-difference4 analysis on the country of origin shows that on all counts, the former country does not affect the probability to find a job as much for the second cohort migrants than for the first cohort. This result gives a clue that migrants who arrived after the policy change rely more on the nationality network effect. Indeed, since no social benefits are available for the second cohort migrants, they will tend to regroup with other people from the same country who migrated earlier in Australia rather than spending time investigating the traditional Australian market. Further, it seems that whatever the good job definition, the migrants whose country of origin has only relatively recently populated Australia are less likely to find a job, comparatively to other, better implanted, nationalities providing a better network. Likewise, migrants are not equal with regards to finding a job, depending on whether they came to Australia as refugees or not. Refugees’ are significantly worse off both in terms of getting a job and holding a good job. As regards to language abilities, we would expect migrants from non-English speaking background and who do not speak English to be less successful in their job search. On the opposite, those with a good practice of English should be more likely to find a job. However, the results we obtain for language abilities come as supportive of our nationality network effect hypothesis. Indeed, it seems that only the extreme degree of language abilities (not speaking English at all and speaking English very well) are significant and of the expected sign, negative for the non-speaking and positive for those who speak well (variables spokna2 and spokvw2). The reinforcement of the nationality network effect, suspected from the estimates of the country of origin, comes apparent in the difference in difference results for the language abilities. Speaking very well English is not so important any longer for those migrants who came in Australia after the policy change (variable spkvwdif). Not surprisingly, migrants having a university degree as compared to leaving school straight from HSC are more likely to find a job (variables Hgrad, Pgradq, Techlq, Tradeq and Ugradq). However, it seems that the level of education is more important for female migrants than for males. Oddly, having an undergraduate degree seems to have a negative influence on the male migrants’ employability as compared to leaving school earlier. This later results is not as strange as it seems at first glance. Indeed, as we have already mentioned, the network constituted by the national community absorbs part of the migrants into the labour force. However, the jobs offered through this network are generally less skilled jobs and do not require the migrants to have much higher education. Unskilled migrants or those who have technical qualifications have a large probability to find their job through the network and have almost no
4 By difference in difference, we mean that we have estimated the average difference in the estimated coefficients between cohorts. For clarity purposes, we have not displayed the results for the country of origin. However, we left the language ability difference in difference estimates in the tables: variables spknadif, spkvwdif, spkwdif. They are simply spokna2 * cohort, spokvw2 * cohort and spokw2 * cohort. The coefficients obtained for those variables tell us the difference between the coefficient estimated value in cohort 1 and its estimated value in cohort 2.

14
chance to get a job on the traditional Australian market. As migrants’ general education is higher, their probability to be absorbed by the nationality network decreases and their probability to get hired in the traditional Australian labour market increases but probably not as much to compensate their relative unemployability in the network. Only migrants with a much higher level of education can fully compete on the traditional Australian labour market even though they still have a disadvantage in terms of information and so on. This explains why one may find negative signs for higher levels of education that are not technical. As for the migrants’ age, the results give a typical quadratic form to the effect of the age on the probability to find a job. Besides, we incorporated dummies for states of residence (with the reference being the state of New South Whales, the most populated of Australia) in order to catch the differences in terms of unemployment rate among states. Migrants living in South Australia, Victoria and Western Australia are less likely to find a job as compared to those who live in New South Whales. Finally, the likelihood of getting a job in Australia is increased if the migrants actually held a job in their former country, even more so if the migrants are female (variable Fmactive). The results of the first equation corroborates earlier results obtained notably by Cobb-Clark (2003) in that migrants arriving after the policy change are more employable, even after controlling for the above mentioned characteristics (variable Cohort). 4.2 Probability to get a good job in Australia. The estimations exhibit some interesting results regarding the impact of the policy change on the probability to have a good job. If one focuses on the subjective definition of the good job first, one can notice that the coefficient for cohort is significant and positive. According to this estimate then, migrants who found a job in Australia are more likely to report that they have found a good job if they arrived after the policy change than before. At first glance, this result would sound counter intuitive since we could expect that migrants are now more likely to accept whichever proposed job, whether good or bad because of the increased financial pressure imposed by the new policy. If such pressure exists, migrants should lower they ‘reservation job quality’ but should, at the same time, reckon that their job is not entirely satisfying. Alternatively, we can wonder if, given the additional financial pressure, the migrants may consider themselves lucky enough to have gotten a job, then reporting a good job more easily. Given the results obtained for the objective definition of good jobs, this latter explanation should probably be preferred. Indeed, when one concentrates on objective attributes of the jobs, the effect of the policy change turns out to be negative. Consequently, migrants find lower quality jobs after the policy change but tend to report that they are happy with their jobs and do not wish to quit it. Moreover, the observed discrepancy between the two definitions’ estimates for cohort gives us a clue that the ‘quality’ of the migrants has not changed significantly after the policy change. Had we found a positive sign for the cohort estimate in the objective definition of good jobs as we did in the subjective definition, we would have had to conclude that the second cohort migrants are a self-selected group of better quality migrants, being able to find better jobs easier. The observed opposite signs clearly suggest that it is not the case. Like for the first equation, the results show that the migrants are not equal with regards to the visa status under which they came to Australia. Indeed, refugees and migrants who came under a family reunion status are less likely to find a good job as

15
compared to migrants who have an independent status (point system, skill visa), whether one looks at the estimates of the objective or subjective definition. As regards to the country of origin, the results are similar to those found in the first equation. Migrants whose country of origin corresponds to a population that has been implanted in Australia for a longer time or represent a larger proportion of the migrants population are more likely to find a good job (subjective or objective). The results obtained for the education variables are rather disturbing. If one focuses on the subjective definition, the education variables have the expected sign. Migrants having completed whichever tertiary education are more likely to find a good job than those who left school at secondary level. However, it seems that the level of education does not matter in the estimations of the objective definition. The estimates are even negative for the migrants who have a technical degree. This result is probably due to the fact that some migrants have difficulties in getting the degrees they obtained in their country recognised in Australia. Moreover, this later result corroborates what we said earlier about the impact of the level of education on the comparative probabilities to be hired by the nationality network versus being hired in the traditional Australian labour market. The number of people composing the migrant’s household impacts on the quality of the job found in Australia (variable Nbhouse). The larger the household, the less likely the migrant holds or reports holding a good job. A larger family puts more strain on the principal applicant. S/he is likely to lower his/her reservation quality quickly after arrival in Australia, accepting whichever proposed job in order to meet the basic needs of the family. The estimations show that migrants who used to own their dwelling in their former country and were able to meet their basic needs are more likely to find a good job in Australia (objective definition). The results for these two variables are quite interesting in that they show another discrepancy between the objective and subjective definition. Basically, migrants who used to own their dwelling in their former country are migrants who probably had relatively good jobs in their country, hence the positive sign in the objective definition. However, the sign turns out to be negative for this variable ion the subjective definition. Here, migrants who owned their place in their former country compare their current situation with what they had and are more likely to report that they have a bad job. Finally the estimations show that if the migrant was using his/her qualifications in the source country, s/he is more likely to find a good job, both reportedly and objectively. The number of hours worked per week only impacts on the probability to report a good job (subjective definition) but not on the objective probability to have a good job.

16
6. Conclusions In this paper we have explored the entry of migrants into the Australian labour market by using econometric techniques (bivariate probit estimation) to analyse two cohorts of migrants, LSIA 1 and LSIA 2. Most of the earlier work has studied the labour market behaviour of migrants in terms of participation in the Australian labour market, or employment (unemployment) probabilities, or incomes earned. Our paper is distinctive in that we focus on the quality of jobs held by migrants. We defined a good job by using objective and subjective criteria. In particular, we defined a good job objectively as where the migrant employs their educational qualifications in the current job, and on a similar rank in the occupational ladder. A subjective definintion was in terms of satisfaction with the job held and not wanting to move jobs. After a short discussion of the changes that had taken place affecting the selection criteria for migrants and the access to social security benefits we provided some descriptive information using the sample data. We then used bivariate probit estimation techniques that allowed for endogenous participation decisions influencing the quality of the job held. We found that in general that there was a significant difference between the first and second cohorts: the LSIA 2 cohort was less likely to hold a good job after controlling for education, visa category, etc. This is an important finding since the labour market was much stronger for the LSIA 2 cohort and as such we would expect them to get better jobs. Further, since the second cohort was selected by using stricter entry criteria we would expect them to be “higher quality” people and hence to hold better jobs. There are several issues that we have not explored as yet and this is a report on work in progress.
17
References
Acemoglu, Daron (2001) “Good Jobs versus Bad Jobs”, Journal of Labor Economics, 19(1), 1-21.
Akerlof, G.A., A.K. Rose, and J.L. Yellen (1988) “Job Switching and Job Satisfaction in the US Labor Market”, Brookings Papers on Economic Activity, 2, 495-582.
Baker, M. & F. Robertson (1995) Qualifications Recognition and Employment Outcomes of Recent Immigrants to Australia, AGPS, Canberra.
Baltagi, B.H. (1995) Econometric Analysis of Panel Data, John Wiley and Sons, Chichester.
Beggs, J.J. & B.J. Chapman (1988) “Immigrant wage adjustment in Australia: cross-section and time-series estimates”, Economic Record, 64, 161-167.
Beggs, J.J. & B.J. Chapman (1990) “Search efficiency, skill transferability and immigrant relative unemployment rates in Australia”, Applied Economics, 22 (2), 249-260.
Blau, D.M. (1991) “Search for Nonwage Job Characteristics: A Test of the Reservation Wage Hypothesis”, Journal of Labor Economics, 9 (2), 186-205.
Borjas, G.J. (1999) “The Economic Analysis of Immigration”, Chapter 28 in Handbook of Labor Economics Vol. 3A, edited by O.C. Ashenfelter and D. Card, North-Holland, Elsevier, Amsterdam.
Butler J. & R. Moffitt, (1982), “A computationally Efficient Quadrature Procedure for the One Factor Multinomial Probit Model”, Econometrica, 50, pp. 761-764.
Chamberlain, G., (1984), “Panel Data.” In Z. Griliches & M. Intriligator, eds., Handbook of Econometrics, North Holland, Elsevier, Amsterdam.
Chapman and Miller (1985), “An Appraisal of Immigrants’ Labour Market Performance in Australia” in M. E. Poole, P. R. de Lacey and B. S. (eds.), Australia in Transition: Culture and Life Possibilities, Harcourt Brace Jovanovich, Sydney. Randhawa
Chapman, B. and R.R. Iredale (1993) "Immigrant Qualifications: Recognition and Relative Wage Outcomes", International Migration Review, 27 (2), 359-387.
Clark, A. (1998) “What makes a good job? Evidence from OECD countries”, Centre d’economique d’Orleans, 1998 26.
Clark, A.E. (2001) “What really matters in a job? Hedonic measurement using quit data”, Labour Economics, 8, 223-242.
Cobb-Clark, Deborah (2003) “Public Policy and the labor market adjustment of new immigrants to Australia”, Journal of Population Economics, 16, 655-681.
Cobb-Clark, Deborah (2001) “The Longitudinal Survey of Immigrants to Australia”, Australian Economic Review, 34 (4), 467-477.

18
Cobb-Clark, D.A. (2000) "Do Selection Criteria Make a Difference? Visa Category and the Labour Market Status of Immigrants to Australia", Economic Record, 76 (232), 15-31.
Daniel, C. and Catherine Sofer (1998) “Bargaining, Compensating Wage Differentials, and Dualism of the Labor Market: Theory and Evidence for France”, Journal of Labour Economics, 16 (3), 546-575.
Department of Immigration and Multicultural Affairs (1999) Longitudinal Survey of Immigrants to Australia, User Documentation for August 1999 Release of Unit Record Data, Waves 1-3, Canberra.
Doiron, D, and W.C. Riddell (1994) “The Impact of Unionization on Male-Female Earnings Differences in Canada”, Journal of Human Resources, 29 (2), 504-534.
Flatau, P., R. Petridis & G. Wood (1995) Immigrants and Invisible Underemployment, AGPS, Canberra.
Foster, L., A. Marshall and L. S. Williams (1991), Discrimination Against Immigrant Workers in Australia, AGPS, Canberra.
Greene, W. H. (1990), Econometric Analysis, Macmillan, New York.
Hwang, J, D.T. Mortensen, and W. R. Reed (1998) “Hedonic Wages and Labor Market Search”, Journal of Labor Economics, 16 (4), 815-847.
Heckman, J.J., R.J. Lalonde, and J.A. Smith (1999) “The Economics and Econometrics of Active Labor Market Programs”, Chapter 31 in Handbook of Labor Economics Vol. 3A, edited by O.C. Ashenfelter and D. Card, North-Holland, Elsevier, Amsterdam.
Iredale, R. & I. Nivison-Smith (1995) Immigrants’ Experience of Qualifications’ Recognition and Employment, AGPS, Canberra.
Junankar, P.N., David Pope & Glenn Withers (1998) “Immigration and the Australian Macroeconomy: Perspective and Prospective”, Australian Economic Review, December 31 (4), 435-444.
Junankar, P.N., S. Paul, and Wahida Yasmeen (2001) “Are Asian Migrants Discriminated in the Labour Market? A Case Study of Australia”, Paper presented to the Far Eastern Meeting of the Econometrics Society, Kobe, Japan.
Matyas L. & P. Sevestre, ed., (1996), The Econometrics of Panel Data: A Handbook of the Theory with Applications, Second Edition. Advanced Studies in Theoretical and Applied Econometrics, vol. 33, Kluwer Academic, Dordrecht.
McDonald, J.T. & C. Worswick (1999) “The Earnings of Immigrant Men in Australia: Assimilation, Cohort and Macroeconomic Conditions”, Economic Record, 1999, 75 (228), 49-62
Miller, P. W. (1986) "Immigrant Unemployment in the First Year of Australian Labour Market Activity", Economic Record, Vol. 62, 82-87.

19
O’Loughlin, T. and I. Watson (1997) Loyalty is a One Way Street: NESB Immigrants and Long-Term Unemployment, ACIRRT, Sydney.
Richardson, Sue, Frances Robertson, and Diana Ilsley (2001) The Labour Force Experience of New Migrants, National Institute of Labour Studies, Flinders University, Adelaide, Commonwealth of Australia, Canberra.
Richardson, Sue, Lauren Miller-Lewis, Phong Ngo, and Diana Ilsley (2002) The Settlement Experiences of New Migrants, National Institute of Labour Studies, Flinders University, Adelaide, Commonwealth of Australia, Canberra.
Snower, Dennis J. (1994) “The Low-Skill, Bad-Job Trap”, Birkbeck College Discussion Papers in Economics, 14/94.
VandenHeuevel, A. and M. Wooden (2000) “Immigrants’ Labour Market Experiences in the Early Settlement Years”, Australian Bulletin of Labour, 26 (1), 59-69.
Will, Louise (1997) Australian Non-English Speaking Background Immigrants’ Income Adjustment, unpublished Ph.D., Australian National University, Canberra.
Williams, L. S., J. Murphy and C. Brooks (1997) Initial Labour Market Experiences of Immigrants, Results from the Longitudinal Survey of Immigrants to Australia, Department of Immigration and Multicultural Affairs, AGPS, Canberra.
Wooden, M. (1994) “The labour market experience of immigrants”, in Australian Immigration: A Survey of the Issues by M. Wooden, R. Holton, G. Hugo, and J. Sloan, Canberra: AGPS.

20
Appendix: List of the variables used in the estimations and their meaning.
Variable Meaning cohort Cohort dummy, takes value 1 if the migrant arrived after the policy change visaref Migrant arrived with refugee status visafam Migrant arrived under family reunion visa, spouse visa and so on. visabiz Migrant arrived under business visa africa Migrant’s country of origin is in Africa
amercs Migrant’s country of origin is in Central or South America amern Migrant’s country of origin is North America, including Canada asiane Migrant’s country of origin is in North East Asia (China, Koreas, etc…) asias Migrant’s country of origin is in South Asia (India, Sri Lanka, etc…) asiase Migrant’s country of origin is in South East Asia
euroeast Migrant’s country of origin is in Eastern Europe (former Soviet block countries) europsth Migrant’s country of origin is in South Europe (including former Yougoslavia) europwn Migrant’s country of origin is in Western Europe
mdleast Migrant’s country of origin is in Middle East (Israel, Syria, Jordan, Egypt, Irak, Lebanon, etc…)
hgradq Migrant’s highest level of qualification is a Higher degree pgradq Migrant’s highest level of qualification is a post graduate degree techlq Migrant’s highest level of qualification is a technical qualification tradeq Migrant’s highest level of qualification is a trade and commerce qualification ugradq Migrant’s highest level of qualification is undergraduate
spokna2 The migrant doesn’t speak English at all spokvw2 The migrant speaks English very well spokw2 The migrant speaks English well spknadif Spokna2 * cohort spkvwdif Spokvw2 * cohort spkwdif Spokw2 *cohort
iact The migrant lives in Australian Capital Territory state int The migrant lives in the Northern Territories iqld The migrant lives in the state of Queensland isa The migrant lives in the state of South Australia itas The migrant lives in Tasmania ivic The migrant lives in the state of Victoria iwa The migrant lives in the state of Western Australia
age100 Migrant’s age divided by 100 ageq100 Migrant’s age squared divided by 100
fmactive The migrant was participating to the labour force in his/her former country and was not unemployed in the last 12 months before migrating
flife In the 12 months before migrating, the migrant was able to meet his/her basic needs
fskilus her former country, the migrant was using his qualifications in his/her main
activity. nbhouse Number of people composing the migrant’s household
ownhfc In the former country, the migrant was owning his/her dwelling or was still paying for it
tothours Total number of hours worked per week

21
Special note on underlying theory of estimation used for calculating weights in the LSIA database as reported by the DIMIA: “The method used in calculating the estimation weights is not the method used under classical statistical theory. Classic theory is based on a respondent’s probability of selection in the sample, and would lead to the same weights being used for preliminary and final data. Because of the complexities of sample selection, calculating weights based on probabilities of selection is intractable. Partly because of this, it was decided to use an alternative theory for calculation of estimation weights. The alternative theory used is known as Bayesian theory of estimation. When applied to estimation from a sample, the essence of this theory is that there is a given sample that is to represent a given population, and the best link between the sample and the population is determined”. User Documentation provided by DIMIA.