Embed Size (px)
Citation preview

N. GREGORY MANKIW Massachusetts Institute of Technology
LAWRENCE H. SUMMERS Harvard University
Do Long-Term Interest Rates Overreact to Short-Term Interest Rates?
THE TERM STRUCTURE of interest rates has been extensively studied by economists. It is of interest to financial economists because of its close connection with the pricing of bonds of different maturities. More important, understanding the term structure of interest rates is also critical to the evaluation of the effects of alternative macroeconomic policies. For example, it is widely believed that the monetary authority can most directly control short-term interest rates, but that aggregate demand depends primarily on long-term interest rates. ' If this conviction is correct, the monetary transmission mechanism relies on the behavior of the term structure of interest rates.
During the first few months of 1984 the yield curve has been very steep by historical standards. The yield on twenty-year bonds has been about 300 basis points above the yield on three-month Treasury bills. Only rarely have such large spreads been observed in the past.2 The yield curve is widely interpreted as reflecting market participants' conviction that interest rates will rise over the next several years under
1. For example, in the simple IS-LM model of Richard H. Clarida and Benjamin M. Friedman, the short rate enters the LM curve but the long rate enters the IS curve. Clarida and Friedman, "Why Have Short-Term Interest Rates Been So High?" BPEA, 2:1983, pp. 553-78.
2. The average spread between twenty-year bond yields and three-month bill yields over the past two decades is 96 basis points; the standard deviation is 136 basis points. The average since October 1979 is 110; the standard deviation is 206.
223

224 Brookings Papers on Economic Activity, 1:1984
the pressure of large federal deficits. It is sometimes even suggested that because of such expectational effects, prospective federal deficits are exerting a dampening effect on the current level of economic activity. These arguments presume that long rates reflect market expectations of future short rates. In this paper, we examine this view of the yield curve.
Most work on the term structure is based on some variant of the expectations hypothesis. This hypothesis holds that the long-term inter- est rate is a weighted average of present and expected future short-term interest rates. An approximately equivalent form of the hypothesis holds that the expected one-period holding returns on bonds of all maturities are the same or differ by constant risk premiums.3 Unfortunately, many investigators using various techniques and data sets reject the joint hypothesis of rational expectations and the expectations theory of the term structure.4
This failure of interest rates to move as the theory predicts is not a new phenomenon. In 1938 Frederick R. Macaulay wrote, "To preserve the theoretical relationship between present long term and future short term interest rates, the 'yields' of bonds of the highest grades shouldfall during a period in which short term rates are higher than the yields of the bonds and rise during a period in which short term rates are lower. Now experience is more nearly the opposite.'"5 As we show below, the test of the expectations theory derived under the assumption of rational expectations is exactly the test Macaulay suggested almost fifty years ago. Moreover, the behavior of long rates in the recent period that we
3. The approximate nature of the equivalence is discussed extensively by John Cox, John Ingersoll, and Stephen Ross, "A Re-examination of Traditional Hypotheses about the Term Structure of Interest Rates," Journal of Finance, vol. 36 (September 1981), pp. 769-99. As demonstrated by Robert J. Shiller, John Y. Campbell, and Kermit L. Schoenholtz, "Forward Rates and Future Policy: Interpreting the Term Structure of Interest Rates," BPEA, 1:1983, pp. 173-217, the equivalence is exact after linearization.
4. There are many recent examples. David S. Jones and V. Vance Roley, in their "Rational Expectations and the Expectations Model of the Term Structure: A Test Using Weekly Data," Journal of Monetary Economics, vol. 12 (September 1983), pp. 453-65, perform regression tests on the holding returns on T-bills of different maturities. Robert J. Shiller, in "The Volatility of Long-Term Interest Rates and Expectations Models of the Term Structure," Journal of Political Economy, vol. 87 (December 1979), pp. 1190-1219, uses six different data sets to perform volatility tests on American and British interest rates. Shiller, Campbell, and Schoenholtz, in their "Forward Rates," find that long-term interest rates have almost no predictive power for future short-term interest rates.
5. Macaulay, Some Theoretical Problems Suggested by the Movements of Interest Rates, Bond Yields, and Stock Prices in the United States Since 1856 (National Bureau of Economic Research, 1938), p. 33.

N. Gregory Mankiw and Lawrence H. Summers 225
examine is also "nearly the opposite" from that implied by the theory. While statistical rejections of the expectations theory are ubiquitous,
previous research has not made clear the substantive significance of the failure of the theory. One problem with interpreting previous test results is the absence of an economically meaningful alternative hypothesis. In this paper, we embed the expectations theory of the term structure within two wider classes of hypotheses. This permits us tojudge whether the empirical deviation from the expectations hypothesis is substantively important.
The first class of hypotheses includes a quantitative expression of the notion that the long rate responds "too much" to the contemporaneous short rate. This excess-sensitivity hypothesis is suggested by work on the volatility of long-term interest rates. Since the long rate is, under the expectations hypothesis, a weighted average of expected future short rates, the long rate should vary less than the short rate. Robert Shiller examines this smoothing property of the expectations hypothesis and finds that long rates are too volatile to be consistent with the theory.6 The excess-sensitivity hypothesis we examine here is one possible explanation for this excess volatility.
The excess-sensitivity hypothesis is also suggested by evidence that the response of interest rates to money supply announcements is similar at all maturities, even though standard theories suggest that the response of long rates should be much more attenuated. Moreover, this view appears to be widely held among participants in the bond market, where it is conventional wisdom that "long rates follow short rates." This hypothesis is also implicit in the popular claim that financial markets "overreact" to news or are in some sense "myopic."
Whether long rates are excessively sensitive to short rates has important implications for macroeconomic policy. Excess sensitivity, for example, would increase the potency of monetary policy. A reduction in short rates would have a greater impact on long rates than under the expectations hypothesis. Such an expansionary action by the Federal Reserve would therefore have a greater impact on aggregate demand.
To our surprise, the results of our tests decisively reject the notion that long rates are overly sensitive to current short rates. The results, taken literally, imply that current interest rates have a much lower (sometimes negative) weight than theory would suggest so that expected future short rates exert a disproportionate influence on long-term rates.
6. Shiller, "Volatility."

226 Brookings Papers on Economic Activity, 1:1984
This literal interpretation of the results, however, does not seem satis- factory. Alternatively, the results may reflect the failure of the assump- tion that market forecasts of future interest rates represent rational expectations. In particular, the estimates may indicate that market participants place too little weight on the current short rate in forecasting future rates. These conclusions appear robust, with similar results obtained from analyses of yields on short-term and long-term bonds and three-month and six-month Treasury bills.
Having found that the excess-sensitivity hypothesis cannot explain the term structure, we examine whether the hypothesis of a variable liquidity premium can illuminate the failure of the expectations theory. The results suggest that, at least at the short end of the term structure, the expectations theory is not very useful in explaining the spread between long-term and short-term interest rates. In particular, only one fourth of the variation in the spread between six-month and three-month Treasury bill yields is attributable to expected movements in short rates. The remainder is attributable to movements in what are tautologically labeled liquidity premiums. Large and highly variable liquidity premi- ums, especially within the very short end of the maturity spectrum, are not easy to understand.
Excess Sensitivity
To consider the hypothesis that long rates overreact to short rates, we examine first the behavior of twenty-year bonds and three-month bills and then the behavior of six-month and three-month bills.
LONG RATES AND SHORT RATES
Let rt be the one-period yield and Rt be the yield on a consol, an infinitely lived bond paying a fixed coupon each period. We consider the following general equation relating long rates to rationally expected short rates:
(1) Rt = 0 + (l-y) , yk Etrt+k, k=O
where 0 < y < 1. The variable Et denotes the rational expectation

N. Gregory Mankiw and Lawrence H. Summers 227
conditional on information available at time t. The term 0 is the risk or liquidity premium. For now, we assume 0 is constant; later in the paper, we consider the possibility that the risk premium changes through time.
The expectations theory of the term structure imposes restrictions on y which can be approximated by y = 1/(1 + R*), whereR* is the average interest rate. For values of y lower than this, greater weight is given to the contemporaneous short rate than is consistent with the expectations theory. The alternative hypothesis of excess sensitivity can arise if agents place too little weight on rationally expected future short rates- that is, too small a y.
Equation 1 is easily transformed into a simple regression test of the model. Note that equation 1 implies
(2) yRt, = yO + (l-y) , yk+?1 Ert+k- k = I
Subtract equation 2 from equation 1 to obtain
(3) Rt- yRt+ = (l-,y)O + (1-,y)rt- Et+,-
where
et+ I = ( -y) E yk(Et +, rt+k - Etrt+ k) k = I
The term Et+, reflects new information about future short rates that becomes available between time t and time t + 1. Algebraic manipulation of equation 3 yields
(4) R++, - Rt = ( 51)+ ( 7) (R, - rt) + E+ I
Equation 4 provides a simple test of expectations theory as a special case of equation 1.
Ordinary least squares produces consistent estimates only if the error term in the regression is uncorrelated with the variables on the right- hand side. The assumption of rational expectations implies that this condition is satisfied in equation 4. The error term t+ I measures the "news" that arrived between time t and time t + 1. The right-hand variable, (Rt - rt), is known at time t. If expectations are rationally formed, news should not be predictable from known information. In this

228 Brookings Papers on Economic Activity, 1:1984
case, rational expectations imply that (Rt - rt) and E, I are uncorrelated, and we can thus estimate equation 4 using ordinary least squares.
Depending on the value of y, equation 4 can represent either the standard expectations theory of the term structure or the possibility of excess sensitivity of long rates to current short rates. Under the expec- tations hypothesis, the coefficient on (Rt - rt) is R*, that is, roughly 0.02.7 If excess sensitivity of long rates to short rates explains the failure of the expectations hypothesis, the estimated coefficient should exceed R*, implying an estimate of y below 1/(1 + R*).
The logic of equation 4 is fairly intuitive. Ignoring the risk premium, equation 1 states that the long rate is a weighted average of short rates, with more recent short rates given greater weight than more distant ones. If Rt is greater than rt, then the short rate must be rising. The next period's long rate, Rt,1, must be higher than the current period's because it gives greater weight to the higher future short rates. Thus, according to both the expectations theory and the excess-sensitivity hypothesis, when the current long rate exceeds the current short rate, the long rate will (on average) rise.
We can give equation 4 another intuitive interpretation. The holding- period return on long bonds is approximately
Rt_ (Rt+ I - Rt) - R*
The first term in this expression is the coupon yield, while the second term is the capital gain or loss attributable to changes in the long rate. If we regress this holding return, less the short rate, on available informa- tion, we learn whether there are exploitable profit opportunities. Reject- ing the null hypothesis that the coefficient in equation 4 is R* is equivalent to finding statistically significant profit opportunities.
If markets were myopic, placing greater weight on today's short rate than the expectations theory predicts, then when the short rate is high relative to the long rate, the long rate would nonetheless be "too" high and the price of a long bond "too" low. Holding long-term bonds would be a profitable strategy. This would imply that, when regressing the
7. With quarterly data, the appropriate R* for the theory is the mean quarterly interest rate, which with our sample is 0.019. The regressions in the paper use interest rates as percentage points at annual rates; but this choice affects the constant terms and not the slope coefficients.

N. Gregory Mankiw and Lawrence H. Summers 229
excess holding return on the spread, we would obtain a negative coefficient. Finding a negative coefficient in this regression is precisely equivalent to estimating a coefficient in equation 4 greater than R*.
Equation 4, and thus equation 1, is a consequence of a variety of models of asset returns; for example, it follows from the now-popular "consumption beta" model of asset returns. If all the relevant variables in this model are jointly log-normal and homoskedastic, then the model implies that excess returns cannot be forecasted.8 In other words, except for a constant term that depends on variances and covariances, there are no expected profit opportunities in this model. Any empirical failure of this proposition implies either that the consumption-beta theory is wrong or that the relevant variances and covariances change through time.9
Table 1 presents estimates of equation 4 using U.S. quarterly data from 1963:1 to 1983:4, with interest rates expressed as percentage points at annual rates. The variable R, is the yield at the first week of the quarter on Treasury securities of a constant maturity of twenty years, and r, is the yield on three-month Treasury bills.
The coefficient on the spread (R, - r,) has the wrong sign for the expectations theory. Regression 1-1 is the ordinary least squares esti- mate using the entire sample. The null hypothesis that the slope coeffi- cient is 0.02 is rejected at the 5 percent level using a one-tailed test. Since the coefficient is negative, the hypothesis that it is larger than 0.02 is also rejected. Thus, we reject both the standard expectations theory of the term structure and the hypothesis of excess sensitivity of long rates to current short rates.
In October 1979 the Federal Reserve changed its operating procedure and began relying more on the targeting of monetary aggregates and less on the targeting of interest rates. One might suspect that this change in the policy rule altered the relationship between interest rates of different maturities. In fact, an examination of the residuals from regression 1-1
8. See Lars Peter Hansen and Kenneth J. Singleton, "Stochastic Consumption, Risk Aversion, and the Temporal Behavior of Asset Returns," Journal of Political Economy, vol. 91 (April 1983), pp. 249-65. This is strictly true only after linearization; that is, we are approximating log(1 + r) as r.
9. For a discussion of this point, see Robert J. Shiller, "Consumption, Asset Markets, and Macroeconomic Fluctuations," in Karl Brunner and Allan H. Meltzer, eds., Economic Policy in a World of Change, Carnegie-Rochester Conference Series on Public Policy, vol. 17 (Amsterdam: North-Holland, 1982), pp. 203-38.

230 Brookings Papers on Economic Activity, 1:1984
Table 1. Regressions for the Change in Long-Term Rates, Selected Periods, 1963:1 to 1983:4a
Regression and estimation period
Independent 1-1 1-2 1-3 1J4b
variable 1963:1-1983:4 1963:1-1979:2 1979.3-1983:4 1963:1-1983:4
Constant 0.18 0.11 0.29 0.13 (0.09) (0.05) (0.34) (0.06)
(R, - r,) - 0.086 - 0.041 -0.136 - 0.055 (0.055) (0.034) (0.166) (0.040)
Summary statistic Durbin-Watson 2.49 2.31 2.59 2.41 Standard error
of estimate 0.64 0.30 1.32 0.40
Source: Equation 4, estimated with data from the Board of Governors of the Federal Reserve System. a. The dependent variable is R,+ I - R,. The variable R, is the yield on Treasury securities of a constant maturity
of 20 years, and r, is the yield on three-month Treasury bills, both at the first week of each quarter. Variables are expressed as annual rates in percentage points. Standard errors are in parentheses.
b. The regression weights the subsamples 1963:1-1979:2 and 1979:3-1983:4 differently (weighted least squares) to allow for much greater residual variance in the second subsample.
indicates substantial heteroskedasticity coinciding with this change in monetary regime. After the change in October 1979, the residual variance is much greater.
In regressions 1-2 and 1-3 we split the sample to examine whether the change in policy rule affected the relation between long rates and short rates. The estimates suggest there has been no shift in this relation; the coefficient has the incorrect sign in both subsamples. The hypothesis that it is 0.02 is rejected for the earlier period. It is not rejected for the latter period, because there are many fewer observations and much greater residual variance. The residuals from the split samples appear Gaussian. In particular, an examination of the third and fourth moments indicates no skewness nor unusual kurtosis that might lead one to distrust the reported standard errors. The rejection of the theory for the first subsample appears statistically sound. Moreover, the point estimate for the second subsample indicates that the theory has worked no better since 1979. 10
10. The change in the Federal Reserve's operating procedures in 1979 roughly coincides with the growing use of futures markets in Treasury bills. While one might have expected that the availability of futures markets would, by facilitating "yield curve arbitrage," improve the performance of the expectations hypothesis, the point estimates suggest otherwise.

N. Gregory Mankiw and Lawrence H. Summers 231
Regression 1-4 uses the entire sample but weights the two subsamples to correct for the heteroskedasticity. The weight is the reciprocal of the root-mean-squared residual from equation 1. Again, the coefficient is negative, and the null hypothesis that it is 0.02 or larger is rejected at the 5 percent level. The data support neither the expectations hypothesis nor the excess-sensitivity hypothesis.
These empirical results cannot be interpreted within the context of equation 1; equation 1 is valid only if -y is between zero and one. The coefficient estimates taken literally, however, imply that y is greater than one. Nonetheless, we are left with the conclusion that myopia explains neither the excess volatility of long-term interest rates nor the other statistical evidence against the expectations theory.
While our results imply that an investor could, on average, make money by taking advantage of the failure of the expectations theory, the risks involved are very large. For example, with long and short rates at about 13 percent and 10 percent respectively, the profitable strategy suggested by regression 1-4 is to go short in three-month Treasury bills and to use the proceeds to buy twenty-year bonds. The estimates indicate that a $1,000 investment of this sort would yield an expected profit of $12 in three months, less any transactions costs.'1 Such an investment, however, is very risky. At the level of uncertainty observed since 1979, the standard deviation of this $12 profit is $165. The probability that this strategy would actually produce a loss exceeds 45 percent. Thus, the failure of the expectations theory does not imply the presence of relatively riskless profit opportunities.
Potential problems with sample selection and data mining always make the evaluation of statistical results difficult. For example, one might argue that our results are attributable to an unusual sequence of inflation surprises over our sample period. A standard practice is to check the validity of the conclusion on an independent data set. One can view our regressions as just such a validity check. As noted, Macaulay was aware that long rates do not move as the theory predicts. Moreover, he made his observation many years before the beginning of our data set. Furthermore, Shiller reports estimates of a regression equation
11. The expected profit is R, - (R,+, - R,)/R* - r,. Dividing the constant term in regression 1-4 by 400 to correspond to quarterly interest rates expressed as decimals, the expected quarterly profit per dollar is given by
R, - [-O.055(R, - r,) + 0.000325]/0.02 - r,.

232 Brookings Papers on Economic Activity, 1:1984
parallel to equation 4 for six different data sets covering a variety of different sample periods and interest rates. 12 In five of the six cases, the estimated slope coefficient is negative, and in the sixth it is close to zero. In all cases, his results are consistent with our finding that the failure of the expectations theory cannot be related to excess sensitivity of the long rate. The results in table 1 are not merely an artifact of recent experience but appear to be an empirical regularity.
SHORT RATES AND SHORTER RATES
There are a number of potential objections to testing the expectations hypothesis using long-term rates. The linear approximation on which the derivation depends may be an unsatisfactory approximation for such long-term yields. It is also possible that there is significant segmentation between the short-term and long-term bonds markets, as investors may have distinct "preferred habitats." In such a situation, expectations could be rational at the same time that the expectations theory of the term structure would not hold. We can address both of these objections by examining yields only at the short end of the term structure. Moreover, the use of short-term instruments obviates the need to model expectations over a long horizon, making possible the examination of a broader range of issues. This section therefore develops tests of term structure hypotheses similar to those in the preceding section but applied to three-month and six-month Treasury bills.
Let rt be the one-period yield and r(6) be the two-period yield. We consider this class of hypotheses:
(5) r 6)= 0 + Art + (1-X)Etrt+1.
For pure discount bonds, the expectations hypothesis posits that A = ?/2.
In this case, the yield from holding a two-period bond equals the expected yield from holding two one-period bonds in sequence plus a constant risk premium. Under the alternative hypothesis that the longer rate, r(6), is excessively sensitive to the short rate, r, the current short rate receives greater weight than under the expectations theory. That is, the excess-sensitivity hypothesis implies A > ?/2.
12. Shiller, "Volatility." The data sets Shiller uses extend back to 1919 for the United States and to 1824 for the United Kingdom. All his data sets end before 1978. As we point out above, recent data appear to confirm the historical pattern.

N. Gregory Mankiw and Lawrence H. Summers 233
We can explicitly derive the excess-sensitivity model for one- and two-period bills under the assumption that expectations are partly myopic. Let us suppose that the expectations theory of the term structure holds but with expectations that are not necessarily rational. That is,
(6) r(6) = 0 + ?/2 rt + ?/2 re
where rt + I is the market expectation of r,+ 1. Let us also suppose that the market expectations adapt only partially to the rational expectation of the future rate:
(7) re+ = wrt + (1-w)Etrt+1.
If X = 0, expectations are purely rational. If w = 1, expectations are purely myopic. Combining equations 6 and 7, we obtain
(8) r 6) = 0 + ( w
rt + ( 2w ) Er,+1.
Equation 8 is identical to equation 5, where A = (1 + w)/2. If expectations are partly myopic (w > 0), then A > 1/2 and the two-period yield is excessively sensitive to the one-period yield.
We now wish to manipulate equation 5 to derive a test of the model. As before, the properties of rational expectations permit such a test. We first write the realized value r,+ I as the sum of the expected value Etr,+ I and news Et+ 1:
(9) rt+1 = Etrt+1 + Et+j.
We now combine equations 5 and 9. Simple algebraic rearrangement yields
0 _
(10) (r +1 - r 6)) - - + (ri6) - rt) + Et+j.
As discussed above in connection with equation 4, the error term Et+j is uncorrelated with the variable on the right-hand side because (ri6) - rt) is known at time t. Hence, we can estimate equation 10 using ordinary least squares.
Equation 10 provides another simple test of the standard expectations theory and the excess-sensitivity model. Under the expectations theory, the coefficient on (ri6) - rt) is one because A = 1/2. If there is excess sensitivity, this estimated coefficient should exceed one, implying A >

234 Brookings Papers on Economic Activity, 1:1984
?/2. Thus, as in the previous subsection, a simple ordinary least squares regression is capable of measuring the excess sensitivity of the longer- term rate to the current short rate.
Equation 10 is also intuitive. Ignoring the risk premium, equation 5 implies that the two-period rate is a weighted average of the two consecutive one-period rates. Therefore, when the current longer rate is above the current short rate, the current longer rate should be below next period's short rate. A regression of (r,+ I - rt ) on (r(6) - rt) should yield a positive coefficient.
We can write equation 10 in two other equivalent ways. First, by adding (ri6) - rt) to both sides of the equation, we obtain a regression of (rt - rt) on (r,6) - rt). This new equation relates the change in short rates to the spread. Second, by subtracting (r,6) - r,) from both sides of equation 10, we obtain a regression of [rt - (2r,6) - rt+ 1)] on (ri6) - rt). Under the null hypothesis that A = 1/2, the coefficient in this regression is zero. This second equivalent form has a natural interpretation. Since (2r(6) - r,+ 1) is the one-period holding return on a two-period instrument, the variable on the left-hand side is the difference in holding return between short and longer instruments. Under the expectations theory, this excess return cannot be forecasted. The failure to find a zero coefficient in this regression or (equivalently) a coefficient of one in equation 10 indicates the existence of expected profit opportunities.
If markets were myopic, then when the short rate is high relative to the longer rate, the longer rate would nonetheless be "too" high, and the price of a longer instrument would be "too" low. Longer instruments would thus be profitable when the short rate is relatively high. A regression of excess return [rt - (2rt - r,+ 1)] on the spread (r (6) - rt) would yield a positive coefficient. Finding a positive coefficient in this regression is exactly equivalent to estimating A > /2 in equation 10.
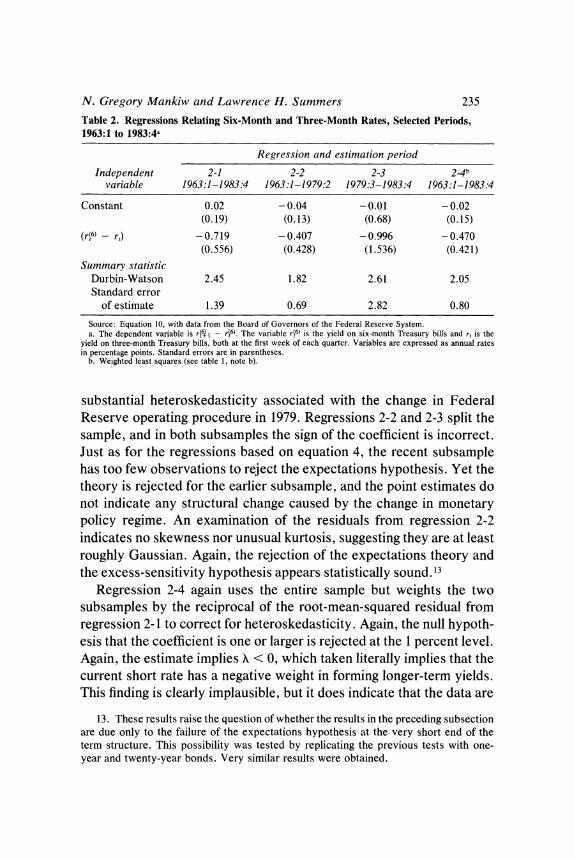
Table 2 shows estimates of equation 10 with U.S. quarterly data from 1963:1 to 1983:4. The yield at the first week of the quarter on six-month Treasury bills is rt,6 and the yield on three-month bills is r,.
The coefficient on the spread has the wrong sign. Regression 2-1 is the ordinary least squares estimate for the entire sample. The null hypothesis that the coefficient is one is rejected at the 1 percent level. The parameter estimates, taken literally, imply insufficient rather than excessive sensitivity of longer-term interest rates to short yields.
The residuals in regression 2-1, like those of regression 1-1, indicate
N. Gregory Mankiw and Lawrence H. Summers 235
Table 2. Regressions Relating Six-Month and Three-Month Rates, Selected Periods, 1963:1 to 1983:4a
Regression and estimation period
Independent 2-1 2-2 2-3 2-4b variable 1963:1-1983:4 1963:1-1979:2 1979:3-1983:4 1963:1-1983 :4
Constant 0.02 -0.04 -0.01 - 0.02 (0.19) (0.13) (0.68) (0.15)
(r'61 - r,) -0.719 - 0.407 - 0.996 -0.470 (0.556) (0.428) (1.536) (0.421)
Summary statistic Durbin-Watson 2.45 1.82 2.61 2.05 Standard error
of estimate 1.39 0.69 2.82 0.80
Source: Equation 10, with data from the Board of Governors of the Federal Reserve System. a. The dependent variable is ri60 I - ri6). The variable ri6) is the yield on six-month Treasury bills and rt is the
yield on three-month Treasury bills, both at the first week of each quarter. Variables are expressed as annual rates in percentage points. Standard errors are in parentheses.
b. Weighted least squares (see table 1, note b).
substantial heteroskedasticity associated with the change in Federal Reserve operating procedure in 1979. Regressions 2-2 and 2-3 split the sample, and in both subsamples the sign of the coefficient is incorrect. Just as for the regressions based on equation 4, the recent subsample has too few observations to reject the expectations hypothesis. Yet the theory is rejected for the earlier subsample, and the point estimates do not indicate any structural change caused by the change in monetary policy regime. An examination of the residuals from regression 2-2 indicates no skewness nor unusual kurtosis, suggesting they are at least roughly Gaussian. Again, the rejection of the expectations theory and the excess-sensitivity hypothesis appears statistically sound. 13
Regression 2-4 again uses the entire sample but weights the two subsamples by the reciprocal of the root-mean-squared residual from regression 2-1 to correct for heteroskedasticity. Again, the null hypoth- esis that the coefficient is one or larger is rejected at the 1 percent level. Again, the estimate implies X < 0, which taken literally implies that the current short rate has a negative weight in forming longer-term yields. This finding is clearly implausible, but it does indicate that the data are
13. These results raise the question of whether the results in the preceding subsection are due only to the failure of the expectations hypothesis at the very short end of the term structure. This possibility was tested by replicating the previous tests with one- year and twenty-year bonds. Very similar results were obtained.

236 Brookings Papers on Economic Activity, 1:1984
consistent neither with the expectations hypothesis nor with the excess- sensitivity hypothesis. 14
As already noted, the excess-sensitivity model for one- and two- period bills is equivalent to a model in which expectations are partly myopic. The estimate in regression 2-4 implies A is - 0.89 and w is - 2.8. Thus, in the myopic expectations interpretation of the model, the market expectation gives a negative weight to the current short rate and an excessively large weight to the rational expectation. This interpretation of the results is again implausible. It does indicate, however, that the failure of the expectations theory cannot be easily explained by an appeal to naive expectation formation.
Observers of financial markets often comment that these markets are myopic. The empirical results in both subsections decisively reject a simple quantitative expression of this view. The implausibility of the results suggests that equations 1 and 8 are not satisfactory models of the term structure. Taken at face value, the results imply that the market is hyperopic: the market gives too little weight to the current rate and too much weight to the expected future rate or its determinants.
A parallel phenomenon has been observed in the stock market. Shiller finds that when current dividends are high relative to the current price, the holding return on the stock market is high."5 Using an argument similar to that used with regard to equation 1, this suggests that the market gives too little weight to contemporaneous dividends. Similarly, Sanjoy Basu shows with cross-sectional data that when a company's current earnings are high relative to its price, the company's stock will on average outperform the market. 16 Again, the market price appears to
14. David Wilcox has recently performed regression 2-4 using weekly data, correcting for the implied moving-average error. He obtains a slope coefficient of - 0.040, with a standard error of 0.385. He also examines the quarterly samples beginning at different weeks in the quarter. For each subsample, the slope estimate is well below one, although for some subsamples a coefficient of one could not be rejected. Wilcox, "Linear and Nonlinear Tests of the Expectations Hypothesis in the Treasury Bill Market" (Massa- chusetts Institute of Technology, 19,84).
15. Robert J. Shiller, "Do Stock Prices Move Too Much to be Justified by Subsequent Changes in Dividends?" American Economic Review, vol. 71 (June 1981), pp. 421-36.
16. S. Basu, "Investment Performance of Common Stocks in Relation to Their Price-Earnings Ratio: A Test of the Efficient Markets Hypothesis," Journal of Finance, vol. 32 (June 1977), pp. 663-82, and Sanjoy Basu, "The Relationship Between Earnings' Yields, Market Value and Return for NYSE Common Stocks: Further Evidence," Journal of Financial Economics, vol. 12 (June 1983), pp. 129-56.

N. Gregory Mankiw and Lawrence H. Summers 237
give too little weight to contemporaneous earnings. Thus none of these violations of the efficient-markets hypothesis is consistent with the alternative hypothesis of myopia.
AN ALTERNATIVE MODEL OF OVERREACTION
As explained above, the excess-sensitivity hypothesis that we have examined and rejected is equivalent to a model in which investors irrationally place too large a weight on the current short rate in forecasting future short rates. Although this formulation appears to be a natural model of "irrational" expectations, it is not the only possible one. We next consider another plausible model of overreaction in which, instead of placing too large a weight on the level of the current short rate, investors place too large a weight on the news contained in the current short rate.
Let us again suppose that the expectations theory holds:
(ll) ri6) = 0 + ~~~~~~~~~~~~~~~~~~~~~~~~~~~~~~~~~1/2 r, + V/2 rte+
where rte+ Iis the market expectation of r,+ 1. Let vt be the news, arriving in period t, concerning the path of short rates; in particular, we consider the news contained in an innovation in the current short rate. Let us consider the possibility that investors overreact to this news in forming their expectations, so that their expectations are given by
(12) re+ = Etrt+ 1 + 4 v,,
where Etrt+I is the rational expectation. If 0 = 0, then the market expectation is rational. If + > 0, then the market overreacts to the current news about short rates.
Algebraic manipulation of equations 11 and 12 produces an equation similar to the one we estimate above:
(13) rt - r6) -20 + (r(6) - r,) - 4vV + Et+l.
Equation 13 is like equation 10 (when A = ?/2, reflecting rational expectations) with an additional term: the innovation in the short rate. 17
17. Note that under the null hypothesis the news term equals the following period's residual (that is, v, = ,). Our estimation strategy, however, does not exploit this fact.

238 Brookings Papers on Economic Activity, 1:1984
This alternative model of overreaction suggests a different regression test. 18
To investigate this alternative model, we must obtain a measure of the innovation in short rates. To do this, we model the short rate as a third-order autoregressive process, although other specifications appear to produce similar results. Estimation of this process for the period 1963:4 to 1983:4 yields
(14) rt = 0.60 + 0.64r, - 0.02rt-2 + 0.30r, 3 + Vt,
(0.37) (0.11) (0.13) (0.11) _ Durbin-Watson = 1.86 Standard error of estimate = 1.30 R2 = 0.81
where numbers in parentheses are standard errors. We use the residuals from this regression as measures of the innovation in the short rate, vt.
Estimation of equation 13 with the heteroskedasticity correction produces the following result:
(15) rt+l - r = - 0.05 - 0.40 (r,6) - r,) + 0.03 vt. (0.13) (0.44) (0. 1 1)
Durbin-Watson = 2.04 Standard error of estimate = 0.79
Thus, contrary to the implications of this alternative model of overreac- tion, the innovation has a positive and insignificant coefficient. More- over, the coefficient on the spread remains negative and significantly different from one.
If we impose the restriction that the coefficient on the spread is one, as implied by equation 13, the results are no more supportive of the model. We find
(16) rt+l
- r-6) - 0.36 + 1.0(ri6) - r,) + 0.12v,.
(0.09) (0. 1 1) Durbin-Watson = 1.96 Standard error of estimate = 0.83
Again, the coefficient on the innovation has the wrong sign. The data do not appear consistent with the view that investors place too much weight on recent news in forecasting future short rates. 19
18. This test is analogous to the test of the permanent income hypothesis suggested by Marjorie A. Flavin, "The Adjustment of Consumption to Changing Expectations about Future Income," Journal of Political Economy, vol. 89 (October 1981), pp. 974- 1009.
19. An analogous test can be derived for the case of short-term bills and long-term bonds. The results were again not supportive of this alternative model of overreaction.

N. Gregory Mankiw and Lawrence H. Summers 239
Variable Liquidity Premiums
The previous section demonstrates the failure of the expectations theory of the term structure. The alternative hypothesis, that longer rates respond too much to short rates, cannot explain the rejection. The purpose of this section is to show in another way that the failure is substantively significant.
Consider the following slight modification of the expectations theory for one- and two-period bills:
(17) r(6)= 0, + /2 r, + 1/2 E,r,+.
In this formulation, the long rate ri6) differs from an average of the current and future short rates by the term Ot. Our test above assumes Ot is constant. In this section we make the less-restrictive assumption that Ot is uncorrelated with short rates.
The term Ot can be interpreted in two ways. First, we can view Ot as a time-varying liquidity premium representing the extra compensation required to induce a lender to hold the longer-term instrument. Edward Kane finds, based upon surveys of the expectations of market partici- pants, that liquidity premiums are positive and time varying.20 Note that once it is extended to include a time-varying liquidity premium, the expectations theory becomes almost vacuous. The liquidity premium is a deus ex machina. Without an explicit theory of why there is such a premium and why it varies, it has no function but tautologically to rescue the theory. Nonetheless, if such fluctuations are small relative to the observed movement in longer rates, the expectations theory may still be useful. By contrast, if fluctuations in the liquidity premium account for a large fraction of the variance in the slope of the yield curve, then the expectations theory fails to provide a useful guide for understanding these fluctuations. Estimating the extent of variations in the liquidity premium thus provides a way of evaluating the power of the expectations theory as a vehicle for understanding the term structure of interest rates.
A second interpretation of the term Ot is as a measure of the extent to which the market fails to produce the "right" longer rate given current
20. Edward J. Kane, "Nested Tests of Alternative Term-Structure Theories," Review of Economics and Statistics, vol. 65 (February 1983), pp. 115-23.
240 Brookings Papers on Economic Activity, 1:1984
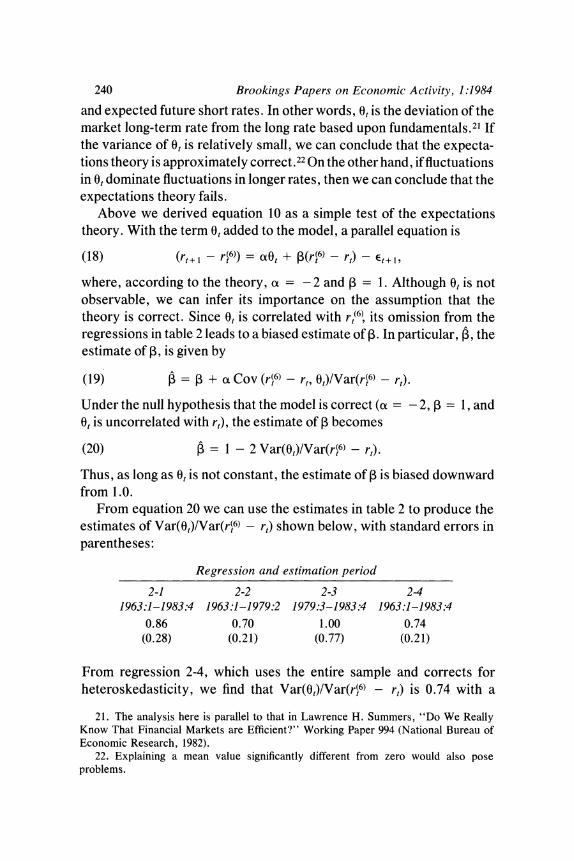
and expected future short rates. In other words, Ot is the deviation of the market long-term rate from the long rate based upon fundamentals.2' If the variance of Ot is relatively small, we can conclude that the expecta- tions theory is approximately correct.22 On the other hand, if fluctuations in 0, dominate fluctuations in longer rates, then we can conclude that the expectations theory fails.
Above we derived equation 10 as a simple test of the expectations theory. With the term 0O added to the model, a parallel equation is
(18) (rt+ - r )) = ao0, + I3(r 61 - r,) -etl
where, according to the theory, a = - 2 and I = 1. Although Ot is not observable, we can infer its importance on the assumption that the theory is correct. Since Ot is correlated with r 6(, its omission from the regressions in table 2 leads to a biased estimate of P. In particular, ', the estimate of P, is given by
(19) = 3 + a Cov (r,6) - r,, 0,)/Var(r,6) - r,).
Under the null hypothesis that the model is correct (a = -2, a = 1, and Ot is uncorrelated with r,), the estimate of P becomes
(20) = 1 - 2 Var(0,)/Var(r(6) - r,).
Thus, as long as Ot is not constant, the estimate of 1 is biased downward from 1.0.
From equation 20 we can use the estimates in table 2 to produce the estimates of Var(0,)/Var(r(6) - r,) shown below, with standard errors in parentheses:
Regression and estimation period
2-1 2-2 2-3 24 1963:1-1983:4 1963:1-1979:2 1979:3-1983:4 1963:1-1983:4
0.86 0.70 1.00 0.74 (0.28) (0.21) (0.77) (0.21)
From regression 2-4, which uses the entire sample and corrects for heteroskedasticity, we find that Var(0,)/Var(r,6) - r,) is 0.74 with a
21. The analysis here is parallel to that in Lawrence H. Summers, "Do We Really Know That Financial Markets are Efficient?" Working Paper 994 (National Bureau of Economic Research, 1982).
22. Explaining a mean value significantly different from zero would also pose problems.

N. Gregory Mankiw and Lawrence H. Summers 241
standard error of 0.21 . This ratio has a natural interpretation. Maintaining our assumption that 0, is uncorrelated with short rates, equation 8 implies
(21) Var(r(6) - r,) = Var(O,) + 1/4 Var(Etr,+I - rt).
The variance of the spread between longer and short rates is thus decomposed into the variance in expected changes in short rates and Var(O,). This decomposition implies that expected changes in the short rate account for only 26 percent of the variance in the spread between the six-month and three-month Treasury bills. We can reject the null hypothesis that Var(O,) = 0, but we cannot reject the null hypothesis that expected changes in the short rate account for none of the variance in the spread between three-month and six-month bills.
It is important to note that, although this unexplained liquidity premium Ot appears central to the spread between six-month and three- month rates, it is relatively unimportant to the level of six-month rates. We can decompose the variance in the six-month rate as follows:
(22) Var(ri6)) = Var(O,) + Var(rt) + ?/4Var(E,rt+- rt) + Cov(rt, Etr,+I - rt).
Simple calculation demonstrates that Var(r,6)) is much larger than Var(O,). In particular, Var(r,)/Var(r(6)) is 1.05, while Var(O,)/Var(r 6)) is only 0.01. Thus, although Ot is critical to (r,6) - r,), its importance to understanding ri6) is much less.23
Conclusions
The data decisively reject, both statistically and substantively, the expectations hypothesis regarding the term structure of interest rates. The alternative hypothesis that long rates are overly sensitive to short rates is also decisively rejected. The expectations theory can be modified to include an unexplained random liquidity premium, but then expected interest rate movements account for only a small part of the variance in the spread between interest rates of different maturities. Most of the
23. The reason for this is that both short and long rates are highly autocorrelated, and thus the variance of r,6' is much greater than the variance of (r,6) - r). For example, suppose that r, followed an AR(1) process with parameter 0.8 and that the expectations hypothesis held exactly. Then we can show that Var(r,6) - r,) would be 1 percent of Var(r(6)). Introducing a random liquidity premium increases both variances equally and thus increases Var(r(6) - r,) proportionally more.

242 Brookings Papers on Economic Activity, 1:1984
changes in the slope of the yield curve reflect these changing liquidity premiums or expectations that do not satisfy the standard postulates of rationality.
These results suggest the importance of developing models capable of explaining fluctuating liquidity premiums.24 Presumably this would involve recognizing in some way the heterogeneous liquidity positions of different economic agents. The results also raise important questions about the monetary transmission mechanism. If, as usually thought, spending decisions and capital-asset valuations depend primarily on long-term rates, monetary policy may operate by changing liquidity premiums as well as by affecting short rates. Although many question the effectiveness of open market operations directed at shifting the yield curve, such as "Operation Twist," the issue is difficult to evaluate without a fuller understanding of the determinants of liquidity premiums. The failure of the expectations hypothesis does make more plausible the view that the supplies of assets of different maturities influence yields.25 However, it is difficult to understand why these effects would be important in the market for three-month and six-month bills.
Our negative results provide an additional reason for uncertainty in predicting the effects exerted on financial markets by alternative mone- tary and fiscal policies; the results suggest that estimating the impact of such policies on future short-term rates is not likely to be a good guide to predicting their impact on long-term rates or asset valuations. These effects may depend more on liquidity premiums than on expectations. Without a satisfactory theory of liquidity premiums, predicting the effect of policies on the shape of the yield curve is almost impossible.
24. For work along these lines, see Zvi Bodie, Alex Kane, and Robert McDonald, "Why are Real Interest Rates So High?" Working Paper 1141 (National Bureau of Economic Research, 1983).
25. For a discussion of this type of effect, see Benjamin M. Friedman, "Financial Flow Variables and the Short-Run Determination of Long-Term Interest Rates," Journal of Political Economy, vol. 85 (August 1977), pp. 661-89.
Comments and Discussion
Laurence Weiss: Mankiw and Summers reexamine the evidence per- taining to the expectations hypothesis of the term structure to see if previous failures of this theory can be "explained" by an alternative view that markets "overreact" to short rates. To the authors' evident surprise they find this alternative unenlightening and leave the failure of this theory as an unresolved puzzle.
The paper consists of two regression tests of the hypothesis that expected holding-period returns on bonds of different maturities are equal, except for perhaps a time-invariant risk or liquidity premium. Under this hypothesis, the expected change in both short and long rates should be positively related to the slope of the current-yield curve, the difference between current long and short yields. Comparison of yields on twenty-year bonds and three-month Treasury bills shows that there is an anomalous (although statistically insignificant) negative relationship between the slope of the yield curve and expected changes in the long rate. At the short end of the yield curve the theory does slightly better. Comparison of yields between six- and three-month T-bills shows that when the six-month rate is above the three-month rate there is a slight (although again insignificant) tendency for the future rate to rise. How- ever, the magnitude of this effect is statistically less than that predicted by the theory. The authors deem these results a "substantive" failure of the theory.
The authors fall short of concluding that the term structure contains no information relevant for predicting future short rates. Fama has recently investigated the informational content of the term structure at the very short end of the maturity spectrum (one to six months).1
1. Eugene E. Fama, "The Information in the Term Structure" (University of Chicago, 1983).
243
244 Brookings Papers on Economic Activity, 1:1984
Comparison of changes in future spot rates with the difference between implicit forward rates and current spot rates shows that the term structure can predict changes in the one-month rate one month ahead. A regression of changes in'the one-month rate on the difference between the forward and spot rates produces a coefficient of 0.46 (standard error = 0.07) over the entire sample period 1959-82, with similar results holding over various subperiods as well. However, this coefficient is less than the predicted value of one from the pure expectations hypothesis, and the R2 of this regression is only 0.13. Beyond a one-month horizon, Fama finds essentially no information for predicting changes in the one-month rate, and at every time horizon a naive forecast that the spot rate will remain unchanged dominates (in a mean square error sense) a forecast that future spot rates equal current forward rates.
The finding that future short rates are more closely related to current short rates than to implicit forward rates is another way of stating the major findings of Mankiw and Summers. To oversimplify a bit, short rates are close to a random walk, which implies, from the pure expecta- tions hypothesis, that long rates should equal short rates. To the extent that long rates fail to move one for one with short rates one might conclude that long rates "underreact" to the current short rate.
The rejection of the theory over the sample period covered in this paper appears related to an equally puzzling phenomenon of recent history-the dismal performance of long-term bonds. Ibbotson and Sinquefield report that from 1963 to 1981 the (geometric) average of the holding-period returns of long-term bonds has been just 2.4 percent, far short of those on short bonds (6.2 percent) or common stocks (6.6 percent).2 By way of comparison, from 1925 to 1963, long bonds averaged 2.6 percent per year while short bonds returned just 1.4 percent. Apparently this historical episode has been dominated by unanticipated rises in expected inflation rates. Periods when the yield curve departs from its gentle upward slope (1966, 1969, 1974, 1979-81) have been generally associated with unexpected inflation and high short-term rates, which were apparently believed to be more temporary than subsequent events bore out.
In short, if one has to find a pattern of expectational errors to salvage
2. Roger E. Ibbotson and Rex A. Sinquefield, Stocks, Bonds, Bills, and Inflation: The Past and the Future (Charlottesville, Va.: Financial Analysts Research Foundation, 1983).

N. Gregory Mankiw and Lawrence H. Summers 245
the expectations hypothesis and explain the dominance of short over long bonds during this period, then this explanation does not seem to me to be farfetched. Of course, introducing expectational errors as free parameters to explain the data is not a good practice, but in the absence of a credible alternative explanation, it will have to suffice.
However, as the authors point out, these results appear robust across many different historical episodes. I cannot say whether my explanation of recent U.S. experience can account for these other results.
I might also add that the authors overstate the importance of the expectations hypothesis for understanding the role of monetary policy. They claim that "it is widely believed that the monetary authority can most directly control short-term interest rates, but that aggregate demand depends primarily on long-term interest rates." Although this view is perhaps consistent with conventional Keynesian analysis, I know of no empirical support for either proposition. From Christopher Sims's work it is clear that short rates are most closely related to business cycle phenomena, and my own work with Robert Litterman suggests that monetary policy cannot affect (or more modestly, has not affected) ex ante real short rates. In short, the expectations hypothesis is not the weak link in what is "widely believed" to be true about the monetary transmission mechanism.
General Discussion
Albert Wojnilower suggested that it was the Treasury's failure to adjust the supplies of debt of different maturities that permitted the observed anomalies in the yield structure that were identified as errors in the expectations theory. The theory presumes that arbitragers will make the theory work. But when the issuer, with virtually unlimited issuing ability, does not adjust supply in response to relative yields on securities of different maturities, discrepancies from the term structure predicted by the theory may persist. Benjamin Friedman added that models he and others had developed and estimated showed that the relative supplies of long- and short-term government debt help explain the yield spread and that the failure of the pure expectations theory of the term structure left open the possibility of a role for debt-management policy by the Treasury. Barry Bosworth countered that the profit opportunities indicated by the authors were so small that they in no way

246 Brookings Papers on Economic Activity, 1:1984
rejected the hypothesis that capital markets were essentially perfect and arbitrage successful among securities of different maturity. Friedman responded that the arbitrage between securities of widely differing maturities was likely to be quite limited because their risk properties were so different.
Friedman noted that the failure of the expectations theory to predict the relation between three-month and six-month interest rates could not be readily salvaged by explanations, such as the relative supplies of bonds and bills or varying risk differentials, that might work for the relations between bond rates and short rates. This suggested that expectations were systematically wrong over long periods of time, a result that was supported by survey data. However, Robert Hall consid- ered the authors' evidence on expectations as inconclusive, drawing an analogy between his own work on consumption and income and their finding that the movement between long and short rates is not explained primarily by expectations. He observed that if long rates and short rates move a lot and largely move together, just as consumption and income do, the difference between long and short rates is so small that it is not a dependable variable in a regression. In the presence of other factors affecting the term structure, this makes it difficult to infer the underlying relation between short and long rates from regressions such as the authors' and therefore difficult to test whether the expectation theory is violated.
Several participants offered suggestions for exploring the deviations from the expectations theory that are otherwise tautologically identified as a time-varying risk premium. Alan Blinder suggested incorporating into the term structure equation a direct measure of risk, such as the spread between interest rates on government and Baa corporate securi- ties or the volatility of bond prices or of short-term interest rates. Robert Gordon urged a broad view of what developments might impact long- and short-term rates differentially and thereby affect the risk premium. The term structure could be affected not just by unexpected inflation, as Weiss had suggested, but by surprises in output or other economic developments or by institutional changes in the country's financial structure. Edmund Phelps suggested putting in a range of economic variables to see if there was anything systematic about the irrationality implied by the paper's results. He reasoned that certain kinds of surprises may have led systematically to overpredictions or underpredictions of

N. Gregory Mankiw and Lawrence H. Summers 247
effects on longer-term rates. Charles Schultze believed the authors' findings might reflect a general tendency of people to overcorrect their previous views about the future on the basis of the latest information they receive. Even if the yield curve eventually tends toward the prediction of the expectations theory, the initial overreaction of the yield curve to news could generate the results observed by Mankiw and Summers.