Embed Size (px)
Citation preview

16-11 | November 10, 2016
Do Higher Capital Standards Always Reduce Bank Risk? The Impact of the Basel Leverage Ratio on the U.S. Triparty Repo Market
Meraj Allahrakha Office of Financial Research [email protected]
Jill Cetina Office of Financial Research [email protected]
Benjamin Munyan Office of Financial Research [email protected]
The Office of Financial Research (OFR) Working Paper Series allows members of the OFR staff and their coauthors to disseminate preliminary research findings in a format intended to generate discussion and critical comments. Papers in the OFR Working Paper Series are works in progress and subject to revision. Views and opinions expressed are those of the authors and do not necessarily represent official positions or policy of the OFR or the Department of the Treasury. Comments and suggestions for improvements are welcome and should be directed to the authors. OFR working papers may be quoted without additional permission.

1
OFR Working Paper
Do Higher Capital Standards Always Reduce Bank Risk? The Impact of the Basel Leverage Ratio on the U.S. Triparty Repo Market
By Meraj Allahrakha,a Jill Cetina,a and Benjamin Munyana,b
November 10, 2016
Abstract
While simpler than risk-based capital requirements, the leverage ratio may encourage bank risk-taking. This paper examines the activity of broker-dealers affiliated with bank holding companies (BHCs) and broker-dealers not affiliated with BHCs in the repurchase agreement (repo) market to test whether this may be occurring. Using data on the triparty repo market, the paper arrives at three findings. First, following the 2012 introduction of the supplementary leverage ratio (SLR), broker-dealer affiliates of BHCs decreased their repo borrowing but increased their use of repo backed by more price-volatile collateral. Second, the paper finds that regardless of whether a U.S. BHC-affiliated broker-dealer parent is above or below the SLR requirement, the announcement of the SLR rule has disincentivized those dealers affiliated with BHCs from borrowing in triparty repo. Finally, the paper finds an increase in the number of active nonbank-affiliated dealers in certain asset classes of triparty repo since the 2012 introduction of the supplementary leverage ratio. This suggests risks may be shifting outside the banking sector.
Keywords: Banking, leverage ratio, heightened prudential regulation, repurchase agreement, global systemically important banks
JEL classifications: G28, G21, G23
Meraj Allahrakha ([email protected]) and Jill Cetina ([email protected]), are at the Office of Financial Research. Benjamin Munyan ([email protected]) is at the Office of Financial Research and Vanderbilt University, Owen Graduate School of Management.
The views expressed in this paper are those of the authors alone and do not necessarily reflect those of the Office of Financial Research or the U.S. Department of the Treasury. We thank Haelim Anderson, Daniel Barth, Charles Calomiris, Paul Glasserman, Kevin Sheppard, and Sumudu Watugala for useful comments. The authors take responsibility for any errors and welcome comments and suggestions.

2
1. Introduction
Capital requirements have been center stage in the international overhaul of banking regulation. The safety and soundness of large internationally active banks is cited1 as one of the top concerns to domestic and global regulatory bodies, yet there is no consensus on the costs, benefits, and effects of increased bank capital requirements. In this paper, we investigate the effects of one new capital regulation, the Basel III leverage ratio, on the U.S. repurchase agreement (repo) market and how those effects differ between broker-dealers affiliated with bank holding companies (BHCs) affected by the rule and broker-dealers affiliated with nonbank firms.
The global financial crisis of 2007-09 resulted in numerous changes in the international financial landscape. In particular, it gave birth to a new international framework for bank regulation that seeks to address vulnerabilities that were realized during the crisis. The Basel Committee on Banking Supervision (Basel Committee) introduced several reform measures, known as Basel III, which increased both the quality and quantity of bank capital and introduced regulatory requirements for banks’ short- and long-term funding profiles.
Basel III increased banks’ required risk-weighted capital ratios, and redefined what would be considered regulatory capital. These reforms also introduced the first global leverage ratio standard. A leverage ratio is a simpler form of a capital standard as it eliminates the use of risk weights to determine how much capital a bank may need to hold for different activities. This new Basel leverage ratio is also unique because it takes into account a much wider scope than simply a bank’s on-balance-sheet assets, the traditional denominator for regulatory leverage ratios. The inclusion of off-balance-sheet credit commitments, potential future exposure of derivatives, and other exposures significantly increases the scope of capital requirements.
We present results that suggest that the supplementary leverage ratio (SLR), the U.S. implementation of the Basel III leverage ratio, may act as the binding capital requirement for some large U.S. banks, rather than the backstop role that the U.S. leverage ratio had played earlier. We analyze the use and composition of the triparty repo market where broker-dealer subsidiaries of BHCs obtain short-term financing in exchange for collateral. These transactions are included in the total exposure measure of the Basel III leverage ratio and are therefore subject to capital requirements. Our research also includes broker-dealers that are not subsidiaries of BHCs and not subject to the SLR, allowing us to exploit the differences in behavior following the announcement of the new regulation in a difference-in-differences type of analysis. Because repo activity is a low profit margin business, we hypothesize that there could be a change in broker-dealer behavior in response to the imposition of consolidated
1 See Federal Reserve Chair Janet Yellen: www.federalreserve.gov/newsevents/speech/yellen20150303a.htm; Basel Committee on Banking Supervision: www.bis.org/publ/bcbs230.pdf; Federal Deposit Insurance Corporation’s Doreen Eberley: www.fdic.gov/news/news/speeches/spfeb0915.html; and Federal Reserve Governor Daniel Tarullo: www.federalreserve.gov/newsevents/testimony/tarullo20130214a.pdf .
3
leverage ratio requirements for parents of bank-affiliated broker-dealers. While other researchers, including Duffie (2016), also have advanced this hypothesis, we are able to test this empirically.
In addition, since dealers use triparty repo to fund asset positions acquired from market-making and other dealer activities (Baklanova, Copeland and McCaughrin 2015), a requirement to hold additional capital against these positions could incentivize BHC-affiliated broker-dealers to hold higher-return and riskier assets on their balance sheets. We find that following the introduction of the SLR, broker-dealer subsidiaries of U.S. BHCs subject to the new standard decreased their use of agency mortgage-backed securities (MBS) and increased their use of equities as collateral in triparty repo markets. We also find an increase in the number of nonbank dealers participating in the agency MBS class of triparty funding — an indication of activity migrating from the banking sector to the nonbank sector. This change in repo activity may have unintended implications for the liquidity of the agency MBS market.
Additionally, this change in repo activity may have unintended implications for a bank’s funding risk. Specifically, while Copeland, Martin, and Walker (2014) find Lehman Brothers did not experience an increase in haircuts in triparty repo in the period preceding its failure, the firm did experience a precipitous fall in its triparty repo volumes.2 As described in the court examiner’s report on Lehman’s bankruptcy, Fidelity, a large triparty repo investor, requested back its cash (Valukas (2010)). As discussed in Copeland, Martin, and Walker (2014), Lehman Brothers may have been forced to finance its securities in the centrally cleared General Collateral Financing (GCF) repo market or sell them.3 However, the centrally cleared GCF repo service accepts only government securities as collateral. Thus, it is possible that a greater use of repo backed by non-government securities as collateral may reduce the stability of BHC-affiliated broker-dealers’ funding by limiting their ability to migrate their triparty repo financing to centrally cleared repo venues in stress.
Our work is directly related to ongoing regulatory and policy debates surrounding capital adequacy, short-term funding markets, and financial regulation. In April 2016, the Group of Central Bank Governors and Heads of Supervision discussed a potential add-on to the Basel III leverage ratio for global systemically important banks (G-SIBs). While the Basel III leverage ratio was intended to reinforce risk-based requirements as a backstop from potential misspecifications in the risk-based capital standard,4 it is, at least for some banks, the binding
2 While the authors also find no evidence that investors increased haircuts or reduced repo lending to other dealers in response to changes in these dealers’ CDS-implied measures of credit risk, the sample period in question incudes the period following Lehman’s default during which the Federal Reserve launched two special credit facilities aimed at stabilizing funding to primary dealers, the Primary Dealer Credit Facility and the Term Securities Lending Facility. As the aim of the Federal Reserve was to stabilize confidence through these programs, these results equally could be interpreted as an affirmation that official sector interventions were effective as opposed to indicative that triparty repo funding can be expected to remain stable in the face of rising counterparty credit risk. 3 Lehman’s case may suggest that the blind brokered nature of centrally cleared repo as well as the mitigation of bilateral counterparty credit risk can enhance the stability of centrally cleared repo for firms experiencing credit stress. 4 See Basel III leverage ratio framework document, page 4, at www.bis.org/publ/bcbs251.pdf .

4
requirement. Our results shed light on the potential effects of increasing non-risk-based measures of capital adequacy.
This paper also informs the policy discussion on the interactions between two aspects of Basel III reform: short-term liquidity standards and the leverage ratio. U.S. liquidity regulations (the liquidity coverage ratio) require bank holding companies to hold high quality liquid assets (mainly Treasuries and agencies) equal to net cash outflows over a 30-day stress period. Our results indicate that BHC-affiliated dealers subject to the SLR are incentivized to do more repo against more price-volatile collateral such as equities. This may work against the intent of liquidity regulation.
This paper also informs the conversation surrounding credit substitution and migration of financial intermediation to the nonbank sector. We find that while BHC-affiliated broker-dealers are reducing their agency-backed borrowing, nonbank dealers are increasing volumes. Although nonbank dealers have grown in numbers and increased their participation in agency-backed borrowing, no new capital rules have been introduced for nonbank broker-dealers since the crisis.
In Section 2 of the paper, we briefly review the related literature and discuss bank capital regulatory standards. Section 3 describes the data and methodology, and we introduce three phases of hypotheses. Section 4 explains results for three hypotheses: the impact on BHC-affiliated dealers bound by the new regulation, the impact overall on all BHC dealers, and the effect of the regulation on nonbank dealers not subject to the SLR. We conclude in Section 5 with a summary of results and potential policy relevance.
2. Background of the Financial Regulatory Environment
Since the global financial crisis, many academic and popular works have been written about risks in the banking system and revisions to the regulatory framework. The banking industry received much attention in the aftermath because it was supported with government funds, although other parts of the U.S. financial sector also received support. As will be discussed in the subsequent section on bank capital standards, bank supervisors’ preferred tool continues to be regulatory capital requirements. Increased risk-based capital requirements have been shown to have non-homogenous responses, according to the academic literature.
2.1 Related Literature
Berrospide and Edge (2009) use an empirical model to estimate changes in bank loan growth from increased capital ratios and capital shortfalls, yet they find that economic factors and changes in risk appetite play more important roles than regulatory constraints. They propose the possibility that risk-based capital ratios may not represent the true capital position of a bank, a possibility that is investigated in our paper using a non-risk-weighted measure of a capital ratio.

5
Francis and Osborne (2010) show a positive relationship between bank capital and bank lending, as holding more capital puts banks in a better position to sustain losses so they can afford to lend more. They conclude it is unclear to what degree capital requirements are even binding. Mariathasan and Merrouche (2014) find that in response to increased capital requirements, banks may increase risk-taking and conceal it from supervisors.
Kiema and Jokivuolle (2014) analyze whether leverage ratio constraints (like that of Basel III) lead to greater levels of financial stability. They calibrate a simple tractable theoretical model where banks optimally take riskier positions when capital requirements are increased across the board, as in the leverage ratio. Our paper finds empirical evidence of this structural model. We find that banks subject to the leverage ratio substitute from less risky funding positions in short-term funding markets to riskier and more price-volatile funding.
Our paper is also related to the literature on credit substitution and migration of intermediation from banks to nonbanks. Hanson, Kashyap, and Stein (2011) examine heightened capital requirements on large financial institutions and find modest increases in bank lending rates. However, they argue that because of the nature of financial services competition, a migration to nonbank credit intermediation is incentivized. Our results on nonbank entrants into the triparty repo market support their claim. Aiyar, Calomiris, and Wieladek (2014) show that given changes in bank capital requirements that are bank-specific, responses to bank lending and credit supply depend on whether a bank is domestic or a branch of a foreign bank. They use confidential Bank of England data in a type of natural experiment on bank-specific capital requirements and associated responses by identifying branches of foreign banks not subject to the enhanced capital requirements. In other words, regulation leaks and there is credit substitution from covered institutions to noncovered ones. We find that in response to tighter leverage requirements, affected bank holding companies do decrease short-term funding activity backed by government securities, and that this activity moves to broker-dealers that are not bank affiliates and not subject to the same regulatory constraints.
Banerjee and Mio (2015) estimate the effect of new liquidity regulation on UK banks imposed by the Financial Service Authority. The UK supervisor implemented this new regulation with some banks and exempted others, creating another type of natural experiment with a control group, allowing those researchers to estimate the effect of liquidity regulation on bank balance sheets. Our analysis follows a similar setup, in that dealers that are subsidiaries of bank holding companies are subject to the new leverage ratio requirement, while nonbank affiliated dealers are not.
This paper is also tied to the literature on the efficiency and cost of bank capital. As capital regulation increases, banks must allocate and price internal funds optimally. Gropp and Heider (2010) find banks are no different than nonfinancial firms in choosing their capital levels because capital levels are an endogenous decision and regulatory limits or ratios are not binding for all firms. Admati et al (2013) and the “narrow banking” literature propose that raising bank equity is not expensive, and banks are easily able to build their balance sheets because capital is cheap.

6
However, we find that a non-risk-based capital requirement can be binding and affect behavior even once banks become compliant.
This paper ties into the current stream of papers on the interplay between liquidity and capital requirements. Berger and Bouwman (2009) find that large banks increase liquidity creation with higher capital levels. Calomiris, Heider, and Hoerova (2014) view liquidity and capital as imperfect substitutes as far as signaling to depositors and shareholders. Acharya, Mehran, and Thakor (2015) describe a mode of capital regulation that is regulatory and a special capital account that must be invested in safe assets, i.e., a liquidity requirement. We find that introducing non-risk-weighted capital requirements could inadvertently increase liquidity risk in certain segments of a large bank holding company’s balance sheet.
Finally, this paper complements other work on the shadow banking sector, repo markets, and the effects of regulation. Munyan (2015) uses triparty repo market data to show attempts at window dressing by U.S. broker-dealers affiliated with foreign banks at quarter-end. Boyarchenko, Eisenbach, and Shachar (2015) study the GCF repo market and find new bank regulations may have induced some dealers to reduce their downgrade trading, a practice in which dealers deliver Treasuries as collateral and receive MBS collateral in return.
2.2 History of Bank Capital Standards and the Supplementary Leverage Ratio
It is useful to situate the adoption of the SLR by the Basel Committee in a broader historical context before discussing the specifics of the adoption of that regulation as part of the post-crisis bank regulatory response, known as Basel III. Prior to the Great Depression, capital to deposit ratios generally were used by regulators to assess U.S. banks’ liquidity. Following the Great Depression, the regulatory focus shifted to measures of bank solvency, centered on a leverage ratio, a capital to total asset ratio. Alfriend (1988) indicates banks’ substantial purchases of government securities during World War II resulted in the development and adoption of new regulatory risk-based capital standards in the U.S. However, from the early 1960s until 1981, Alfriend indicates that there was a lack of consensus among U.S. federal banking regulators about the appropriate approach to determining bank capital requirements. U.S. federal bank regulators re-introduced a leverage ratio requirement. Regulators, however, soon were concerned that this leverage ratio failed to differentiate among risks. A U.S. leverage ratio requirement remained but work on an international risk-weighted capital standard moved forward.
In 1990, U.S. bank regulators implemented Basel I, international risk-weighted capital requirements. Basel I established standardized risk weights for bank assets and required banks to hold more capital to back riskier positions. Thus, all U.S. banks again were required to use a standard set of risk weights. Soon after the introduction of Basel I, regulators noticed that firms

7
started to take risk within risk weight buckets and sought a more risk-sensitive approach to capital regulation.
Basel II was first published in 2004 and allowed banks to choose from three approaches to estimating credit risk (standardized, internal ratings-based, and advanced internal ratings-based). Prior to the 2007-09 crisis, other Basel Committee member countries had adopted Basel II, which permitted their banks to determine risk weights and capital requirements through the use of internal models. While these models were subject to regulatory scrutiny, concerns emerged about model governance and possible gaming. For example, the Basel Committee’s fundamental review of the trading book demonstrates regulatory concern about the accuracy and rigor of banks’ internal models. Mariathasan and Marrouche (2014) find evidence of risk-weight manipulation under the internal risk-based modelling approach among weakly capitalized banks, and Behn et al. (2014) find German banks’ model-based approaches tend to underpredict probabilities of default.
In 2007, the crisis struck as U.S. regulators were transitioning large U.S. banks to the advanced internal ratings approach. Following the crisis, Congress passed the Dodd-Frank Wall Street Reform and Consumer Protection Act. The act included a section known as the Collins amendment requiring the standardized approach to serve as the minimum or a floor for all U.S. banks’ risk-based capital requirements. Today, large U.S. banks’ risk-weighted asset density — their risk-weighted assets divided by total assets — is notably higher than most of their international peers. That is, the implementation of Basel II has left some other countries’ banking systems highly levered.
The post-crisis architects of Basel III wanted to address some of the perceived inadequacies of the risk-based capital standard under Basel II. Revisions were made to the risk-based capital standard under Basel III. As famously noted by Andrew Haldane (2012), this caused the risk-based capital framework to balloon to over 600 pages and raised concerns about the growing complexity of the rule. A new component of Basel III was a simple measure of capital, the supplementary leverage ratio (SLR). This standard sets a minimum level of tier 1 capital as a percent total non-risk weighted exposures. Many regulators and analysts champion the simplicity of this standard in contrast to the complexity and potential model risk associated with risk-based capital in Basel II. However, at over 200 pages in length, the SLR is not quite as simple as it may initially appear. Also, more fundamentally, as we analyze in the following sections of this paper, this regulatory simplicity may come with a cost in terms of lack of risk sensitivity.
In the remaining portion of this section, we describe the U.S. implementation of the Basel III leverage ratio. A timeline of relevant proposed and finalized international and U.S. regulations is displayed in Table 1.
Supplementary Leverage Ratio
International and U.S. bank regulators sought to strengthen the prudential framework for banks in light of weaknesses the 2007-09 crisis revealed in the banking sector. Given concerns about

8
the potential for misspecification of risk weights under the standardized approach and potential model risks associated with the advanced approach, the Basel Committee and U.S. regulators strengthened the leverage ratio. This simpler capital standard is based on total exposures, which are all weighted 100 percent — including assets that receive lower and often zero risk weights for the calculation of risk-based capital ratios. It was first introduced in the United States in June 2012 along with new proposed regulatory capital rules.
Table 1. U.S. and International Regulations
Date Regulatory Body Summary of Action
December 16, 2010
Basel Committee on Banking Supervision
Issued Basel III framework that introduces new capital ratios, capital conservation buffers, liquidity requirements and liquidity coverage ratio, net stable funding ratio, and Basel leverage ratio
June 7, 2012 U.S. regulators Proposed rule on new capital framework for large bank holding companies, including first discussion of supplementary leverage ratio
June 26, 2013 Basel Committee on Banking Supervision
Issued consultative document on leverage ratio
July 2, 2013 U.S. regulators Finalized rule on supplementary leverage ratio, and proposed enhanced supplementary leverage ratio
January 12, 2014 Basel Committee on Banking Supervision
Issued Basel III leverage ratio with endorsement from Group of Central Bank Governors and Heads of Supervision, and included some changes to exposure measure
April 8, 2014 U.S. regulators Finalized rule on enhanced supplementary leverage ratio for the largest U.S. bank holding companies
September 3, 2014
U.S. regulators Revised denominator to supplementary leverage ratio, and use of daily and quarter-end averages
April 25, 2016 Basel Committee on Banking Supervision
Requested comments on merits of an additional global systemically important bank (G-SIB) requirement as either a higher minimum or a buffer requirement
Sources: Basel Committee on Banking Supervision, Federal Register
In addition to redefining and increasing common equity and tier 1 risk-based capital requirements, U.S. bank regulators followed the Basel Committee guidance by increasing the minimum leverage ratio to 4 percent, from 3 percent, for all banks. The ratio is measured as tier 1 capital divided by average consolidated assets. In addition, since the leverage ratio considers only on-balance-sheet assets, the Basel Committee introduced the “Basel III Leverage Ratio.” This ratio is calculated as tier 1 capital divided by total exposures, including some off-balance-

9
sheet assets and derivative exposures. The U.S. implementation of the Basel III leverage ratio is the SLR and requires banks to hold tier 1 capital equivalent to 3 percent of total exposures. The supplementary leverage ratio applies only to large, complex financial institutions that use the advanced approaches capital rules — banking organizations with $250 billion or more in total consolidated assets or $10 billion in on-balance-sheet foreign exposures.
The numerator of the supplementary leverage ratio is tier 1 capital, which is broken into two parts: common equity tier 1 and additional tier 1 capital. Common equity tier 1 consists of common stock, retained earnings, accumulated other comprehensive income, and common equity minority interest (Federal Reserve Board, Federal Deposit Insurance Corporation and Office of the Comptroller of the Currency 2012). Additional tier 1 capital includes noncumulative perpetual preferred stock and related surplus, tier 1 minority interest (that is not included in common equity tier 1), and any other instruments that qualify as tier 1 prior to 2010. A final rule issued by the Federal Deposit Insurance Corporation, Office of the Comptroller of the Currency, and Federal Reserve detail many adjustments and subtractions from these main categories, but for the purpose of this paper we use common equity tier 1 capital as commonly understood bank equity.
The denominator of the supplementary leverage ratio is total exposures. That is defined as the sum of on-balance-sheet assets; derivatives’ potential future exposure and replacement cost less offsets; repo-style transactions; and repo exposure when acting as an agent, less any reduction due to netting agreements.5 This measure is considerably higher than looking simply at total on-balance-sheet assets. Allahrakha, Glasserman, and Young (2015) show that for the largest top-tier U.S. banks, total exposures are 44 percent greater than total assets and 27 percent greater for all large U.S. banks. As this denominator increases, a bank’s SLR falls.
The SLR was first introduced in a June 2012 proposed rule. The rule was finalized in July 2013, although revisions continued through September 2014 as the Basel Committee made further adjustments to the denominator in its Basel III Leverage Ratio. Market participants raised concerns about how to measure total exposures, and this led to revisions, both at the Basel Committee and in updated final rules issued by U.S. regulatory agencies. U.S. banks that are subject to the supplementary leverage ratio began disclosing and reporting their ratios in 2015, and must be in compliance by 2018. While regulators always give banks a phase-in or transition period for new regulatory requirements, banks may feel pressure from equity analysts and shareholders to bring forward their compliance with new regulatory standards.
Enhanced Supplementary Leverage Ratio
The Enhanced Supplementary Leverage Ratio (eSLR) is an additional component of the capital regulatory policy. The eSLR was proposed by U.S. regulators in July 2013 to enhance the
5 See Basel III leverage ratio framework and disclosure requirements (page 12) at www.bis.org/publ/bcbs270.pdf.

10
prudential standards for very large U.S. banks, effectively the G-SIBs. The enhancement is a capital buffer above the 3 percent supplementary leverage ratio to a minimum of 5 percent of tier 1 capital divided by total exposures for a covered bank holding company. In addition, any insured depository institution that is a subsidiary of a G-SIB must maintain a minimum of 6 percent to pay out unrestricted bonuses and dividends.
The formula for the eSLR and the supplementary leverage ratio is identical. What differs between the two regulatory requirements is the scope of banks that are covered and the minimum requirement. The eSLR is applied only to the largest, most complex U.S. bank holding companies, those with assets of at least $700 billion or with assets in custody of at least $10 trillion, and all their insured banking subsidiaries. As of 2016, eight U.S. bank holding companies fit this description. These same banks have been identified by the Basel Committee as G-SIBs. U.S. bank regulatory agencies along with global regulators believe that these additional standards and capital requirements will not only strengthen the individual firms, but also reduce contagion should a shock amplify throughout the financial system.
The eSLR interim final rule has gone through the same revisions to the denominator of the leverage ratio as the supplementary leverage ratio, and the final rule was published in May 2014. As with the supplementary leverage ratio, eSLR reporting began a phase-in period in 2015 and requirements become fully effective in 2018.
More recently, in April 2016, the Basel Committee sought input on the question of whether G-SIBs should be subject to additional leverage ratio requirements.6 Specific questions included whether a higher minimum leverage ratio requirement would be useful or whether a buffer requirement, akin to the G-SIB risk-based capital ratio add-on, should be considered. The Basel Committee also sought input on whether this requirement should be fixed or scaled to G-SIBs’ higher loss absorbency requirement, as is done under the risk-based capital add-on for G-SIBs.
Liquidity Coverage Ratio
The liquidity coverage ratio and net stable funding ratio were also proposed in the December 2010 Basel III framework, but we find that their effect on repo activity is not immediately clear.
The U.S. implementation of the liquidity coverage ratio requires a banking organization to hold unencumbered high-quality liquid assets (HQLA) that exceed its expected net cash outflows over a 30-day stress period. A covered BHC’s ratio must be equal to or greater than one. A BHC’s cash outflows include its broker-dealer subsidiary’s use of repo.
While seemingly simple, the LCR rule is quite complicated. It is important to recognize there are multiple layers to the concept of HQLA embedded in the standard. First, there are assets that
6 See www.bis.org/bcbs/publ/d365.pdf

11
qualify as HQLA. Additionally, to qualify as eligible, HQLA assets must meet certain operational requirements including that the assets be unencumbered and under the control of the treasury function.7 This implies that for assets to qualify as HQLA, the assets cannot be financed in repo and must be available to the bank’s treasury function to liquidate. Finally, there is a bank’s HQLA amount, which reflects additional adjustments to a bank’s HQLA from the complex dual cap formula in the standard on the composition of a BHC’s buffer assets.8
As Table 2 illustrates, the LCR applies the same outflow rates to secured funding transactions in the denominator as it applies haircuts to collateral backing maturing repo in the numerator.
Table 2. Summary of LCR Haircuts and Outflow Rates for Certain HQLA Qualifying Asset Classes
U.S. Treasuries Agency debentures and MBS
Eligible corporates and equities
HQLA haircut 0% 15% 50%
Secured funding outflow rate
0% 15% 50%
Source: Authors’ analysis of the U.S. final LCR rule
Thus, when a BHC is using repo to liquefy itself and its liquidity coverage ratio is near one, repo transactions have no impact on the firm’s liquidity coverage ratio irrespective of the collateral used.9 By contrast, when a BHC is using repo to fund a security holding, its liquidity coverage ratio would only reflect the outflows associated with maturing secured funding as the collateral would not meet the operational requirements of HQLA. This implies the LCR creates a disincentive for covered BHCs to fund less liquid HQLA in repo because it increases their outflows in the LCR’s denominator under the standard. In either case, the LCR does not appear to create incentives for BHCs to increase their repo backed by more price-volatile assets, such as equities.
Net Stable Funding Ratio
The net stable funding ratio looks at a bank’s structural liquidity needs over a one-year horizon. It affects repo in that U.S. bank holding company-affiliated dealers that lend, rather than borrow cash in a repo transaction (therefore receiving rather than pledging collateral in the transaction), must themselves find stable funding against that loan.
7 See section 22, pg. 61530 of the U.S. final rule implementing the LCR. www.gpo.gov/fdsys/pkg/FR-2014-10-10/pdf/2014-22520.pdf 8 See Cetina and Gleason (2015) for examples of how the LCR’s HQLA caps work. 9 See Cetina and Gleason (2015) for illustrations of nonlinearities that can arise from a bank’s incremental secured funding transactions when its LCR is above or below one.

12
In practice, dealers often practice “matched-book” repo financing, in which they lend cash in repo, receive securities as collateral, and finance that loan by rehypothecating or repledging the collateral and borrowing cash in a second repo transaction with a different counterparty. Modifications to the net stable funding ratio since its initial announcement have reduced the amount of required stable funding to 10 percent of the value of a repo loan, down from 50 percent. Dealers that practice matched book repo financing can essentially source 90 percent of their funding by rehypothecating collateral.
One feature to note about the U.S. triparty repo market is that there is no rehypothecation once collateral enters this market. However, dealers may choose to borrow in triparty repo by rehypothecating collateral from their matched book activity, allowing us to observe that side of the transaction. The net stable funding ratio might conceivably disincentivize matched book repo activity by affected dealers, which would result in lower repo borrowing for those dealers across all collateral types. Therefore, evidence that dealers choose to increase their repo backed by equities would be contrary to a purely net stable funding ratio-driven change in dealer activity.
3. Data and Methodology 3.1 Scope of Market Data Public aggregated data available on the Federal Reserve Bank of New York’s website indicate that from 2010 to 2014, triparty repo volumes remained fairly constant at around $1.7 trillion per day, down from the $2.6 trillion peak in 2008 when the data collection began. While much of this funding is backed by high quality Fedwire-eligible collateral, such as U.S. Treasuries and agency MBS, the value of equities pledged in triparty repo rose from $70 billion to $160 billion over the 2010 to 2015 period. As a result, the share of triparty repo with equities as collateral reached over 10 percent in 2015.
The increased use of more price-volatile collateral was of interest from a financial stability perspective because large changes in the price of the underlying collateral could lead to rapidly changing haircuts, less rollover, and potential asset fire sales. Based on these observations, concerns about U.S. stock market valuation, and the changing landscape of international bank capital regulation, we took a deeper look at the triparty repo market during this time period.
In this paper, we make use of confidential regulatory data on all daily triparty repo borrowing activity by U.S. dealers. The daily transaction summaries are collected by the Federal Reserve Bank of New York from the two triparty repo custodians, Bank of New York Mellon Corp. and JPMorgan Chase & Co., which together comprise the entire triparty repo market. Triparty repo data collection began July 1, 2008, but we truncate our sample to begin Jan. 1, 2010 to remove the effect of bank mergers and failures and the disruption of the financial crisis. We also remove data five days prior to the quarter end and two days post the quarter end in light of financial statement window dressing identified in prior work (Munyan, 2015).

13
The dataset from Jan. 4, 2010, to Dec. 31, 2014, contains information from broker-dealers affiliated with the U.S. bank holding companies required to comply with the supplementary leverage ratio and broker-dealers affiliated with U.S. bank holding companies that are not subject to the ratio. The dataset also includes supplementary broker-dealers affiliated with foreign bank holding companies, and nonbank-affiliated broker-dealers. Our sample has 78 dealers that collectively borrow an average of $1.66 trillion each day in triparty repo. The average dealer in our dataset borrows $32.3 billion and the median dealer borrows $5.03 billion.10
The data sample contains repo borrowing for each dealer, noting the amount of collateral pledged in each of 14 different categories. Aggregate repo borrowing by collateral type at the start and end of our sample is shown in Table 3. Due to the presence of window dressing by dealers as documented in Munyan (2015), which temporarily reduces the repo backed by Fed-eligible collateral (Treasuries and agency securities) in the days around a quarter-end, we report quarter averages excluding the five days preceding and two days following a quarter-end. The values in Table 3 are average amounts from Q1 2010 through Q1 2012, and from Q1 2013 through Q4 2014 for an average dealer in a given category.
Figure 1. Triparty Repo Volume by Dealer Type ($ billions)
$100 Billion $200 Billion $300 Billion $400 Billion $500 Billion $600 Billion $700 Billion $800 Billion $900 Billion
$1,000 Billion
Jan-
2010
Jun-
2010
Nov
-201
0
Apr-
2011
Sep-
2011
Feb-
2012
Jul-2
012
Dec
-201
2
May
-201
3
Oct
-201
3
Mar
-201
4
Aug-
2014
SLR Bank Dealers Nonbank Dealers
Note: The parent bank holding company of an SLR Bank Dealer must comply with the supplementary leverage ratio requirement.
Sources: Federal Reserve Board of Governors, authors’ analysis
10 Note that not all dealers borrow in the triparty repo market every day. The average dealer borrowing we report is only for days on which a dealer is active in the market, i.e. conditional on their borrowing being greater than zero.

14
Table 3. Average U.S. BHC-Affiliated and Nonaffiliated Dealers’ Repo and Associated Collateral ($ millions)
All Dealers
U.S. BHC Dealers Below SLR Threshold in 2012 Q2
U.S. BHC Dealers Already Above SLR Threshold in
2012 Q2
2010 Q1 - 2012 Q1 (Pre-SLR Announcement)
2013 Q1 - 2014 Q4 (Post-SLR Announcement)
2010 Q1 - 2012 Q1
2013 Q1 - 2014 Q4
2010 Q1 - 2012 Q1
2013 Q1 - 2014 Q4
Repo borrowing backed by:
All Collateral (Mean) $ 39,522.39 $ 27,142.99 $ 114,612.60 $ 105,613.40 $ 96,770.45 $ 74,155.86
(Median) $ 5,927.94 $ 5,025.70 $ 121,778.10 $ 120,960.20 $ 119,103.40 $ 70,205.76
(Std. Dev.) ($61,803.65) ($43,606.01) ($39,763.87) ($43,712.71) ($82,479.4) ($58,695.33)
Treasuries $ 12,764.41 $ 9,711.55 $35,023.59 $ 32,911.37 $ 14,946.68 $ 16,845.84
$ 1,202.53 $ 569.59 $ 36,811.72 $ 35,094.10 $ 18,157.45 $ 12,552.23
($22,583.38) ($16,363.42) ($16,446.77) ($16,263.95) ($13,275.09) ($15,712.77)
Agency Mortgage-backed Securities $ 13,177.44 $ 9,033.52 $ 36,849.37 $ 27,830.18 $ 42,265.31 $ 31,172.96
$ 2,294.93 $ 1,854.18 $ 37,579.52 $ 27,529.24 $ 47,009.39 $ 23,364.36
($21,885.53) ($15,316.30) ($17,430.68) ($18,031.24) ($40,085.18) ($25,756.79)
Equities and Corporate Bonds $ 4,206.20 $ 3,442.18 $ 11,765.16 $ 20,407.70 $ 11,617.58 $ 10,532.99
$143.78 $ 107.36 $ 10,332.01 $ 24498.59 $ 12,611.53 $ 10,210.26
($7,916.18) ($6,912.28) ($5,987.01) ($12,287.62) ($9,449.89) ($7,893.63)
Note: The parent bank holding company of an SLR BHC Dealer must be required to comply with the supplementary leverage ratio requirement in order to be included in the above and below SLR categories in Table 3.
Sources: Federal Reserve Board of Governors, authors’ analysis

15
Figure 2. Percent of Triparty Repo Using Government Securities Collateral
40%45%50%55%60%65%70%75%80%85%90%
Jan-
2010
May
-201
0
Sep-
2010
Jan-
2011
May
-201
1
Sep-
2011
Jan-
2012
May
-201
2
Sep-
2012
Jan-
2013
May
-201
3
Sep-
2013
Jan-
2014
May
-201
4
Sep-
2014
SLR Bank Dealers Nonbank Dealers
June 7, 2012: Proposed Rule
Note: The parent bank holding company of an SLR Bank Dealer must comply with the supplementary leverage ratio requirement.
Sources: Federal Reserve Board of Governors, authors’ analysis
Figure 3. Percent of Triparty Repo Using Equity Collateral
0%
5%
10%
15%
20%
25%
Jan-
2010
May
-201
0
Sep-
2010
Jan-
2011
May
-201
1
Sep-
2011
Jan-
2012
May
-201
2
Sep-
2012
Jan-
2013
May
-201
3
Sep-
2013
Jan-
2014
May
-201
4
Sep-
2014
SLR Bank Dealers Nonbank Dealers
June 7, 2012: Proposed Rule
Note: The parent bank holding company of an SLR Bank Dealer must comply with the supplementary leverage ratio requirement.
Sources: Federal Reserve Board of Governors, authors’ analysis

16
3.2: Determining Date of Treatment
We believe our dataset provides a sufficient measure of dealer-level market behavior for our study, but the date of a potential treatment (the supplementary leverage ratio policy) is not immediately clear. The U.S. SLR draft rule was first announced June 7, 2012, but not finalized until July 2013. The rule did not begin to take effect until Jan. 1, 2015. During this same period, the eSLR was also proposed and finalized. There may have been initial uncertainty among market participants about the prospects of these rules being implemented, or about the appropriate time to adjust their business strategies. Additionally, other rules such as the liquidity coverage ratio were announced during the same period. It is not obvious at which date broker-dealers affiliated with bank holding companies may have begun to alter their behavior.
To determine the timing of an unknown structural break in dealer behavior, we use a Quandt likelihood ratio test (Stock and Watson 2003) to examine aggregate repo activity in the triparty repo market. The likelihood score of each date being the time of a structural break in the behavior of the aggregate triparty repo market, where the horizontal line at a value of 3.66 is the 95 percent critical value, is displayed in Figure 4. The likelihood score peaks in the fall of 2012, crossing the 5 percent threshold on Nov. 30, 2012.
Figure 4. Testing for an Unknown Breakpoint Date in Repo Borrowing Backed by All Collateral Types
0
0.5
1
1.5
2
2.5
3
3.5
4
4.5
QLR Score for Daily Triparty Repo Borrowing Backed By All Collateral
Sources: Federal Reserve Board of Governors, authors’ analysis
17
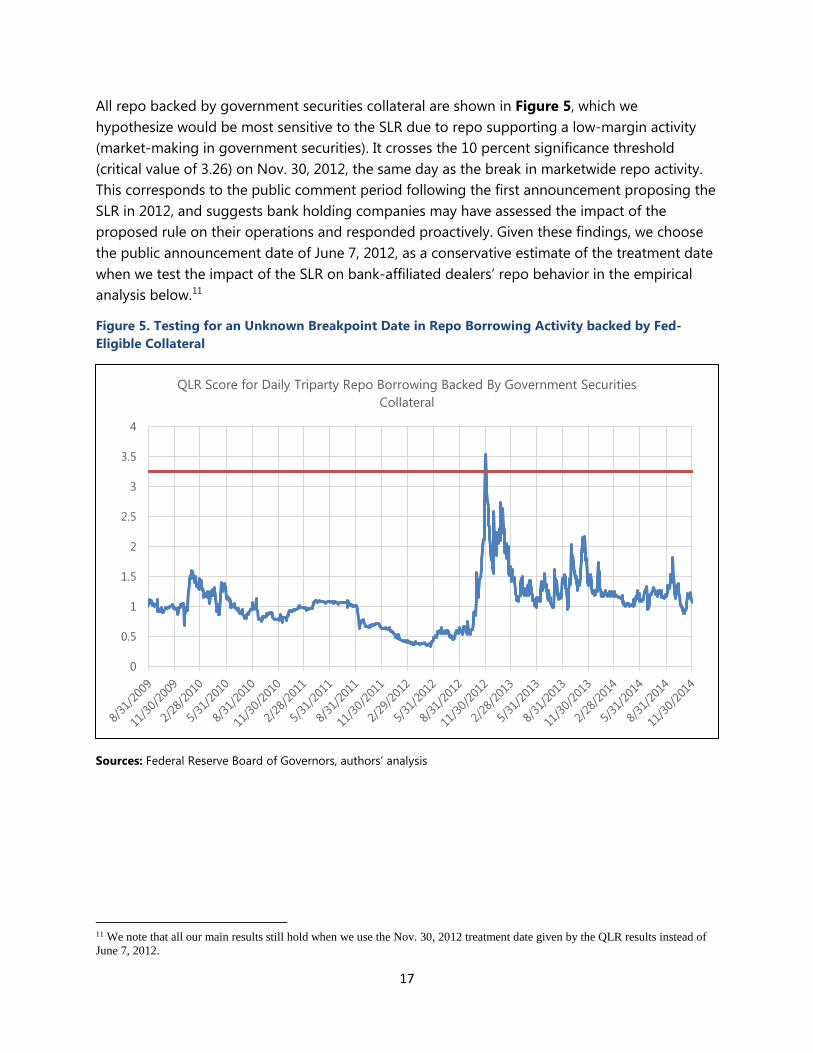
All repo backed by government securities collateral are shown in Figure 5, which we hypothesize would be most sensitive to the SLR due to repo supporting a low-margin activity (market-making in government securities). It crosses the 10 percent significance threshold (critical value of 3.26) on Nov. 30, 2012, the same day as the break in marketwide repo activity. This corresponds to the public comment period following the first announcement proposing the SLR in 2012, and suggests bank holding companies may have assessed the impact of the proposed rule on their operations and responded proactively. Given these findings, we choose the public announcement date of June 7, 2012, as a conservative estimate of the treatment date when we test the impact of the SLR on bank-affiliated dealers’ repo behavior in the empirical analysis below.11
Figure 5. Testing for an Unknown Breakpoint Date in Repo Borrowing Activity backed by Fed-Eligible Collateral
0
0.5
1
1.5
2
2.5
3
3.5
4
QLR Score for Daily Triparty Repo Borrowing Backed By Government Securities Collateral
Sources: Federal Reserve Board of Governors, authors’ analysis
11 We note that all our main results still hold when we use the Nov. 30, 2012 treatment date given by the QLR results instead of June 7, 2012.

18
3.3: Determining Dealer-Specific Level of Treatment
The SLR requirement applies across an entire bank holding company. We assume that any effect on a bank holding company’s behavior from the June 7, 2012, proposal of the SLR should be transmitted to its dealer subsidiary. Further, we assume that the size of the SLR’s effect on an affiliated dealer’s behavior should be proportional to the degree that the parent is below or above the consolidated ratio requirement. A dealer with a parent that is significantly below the proposed 3 percent SLR requirement may respond by reducing overall assets (reflected by a drop in repo financing) and increasing the proportion of risky assets remaining. A dealer with a parent that is significantly above the consolidated requirement may respond less, and in the opposite direction. Our measure of the level of treatment each dealer experiences is the difference between its bank holding company parent’s consolidated SLR and the announced requirement of 3 percent plus a 0.5 percent buffer.12 We assume that nonbank-affiliated dealers are not directly affected by the SLR, and foreign bank-affiliated dealers are affected differently.
We estimate what the consolidated SLR would have been for each bank parent of an affiliated broker-dealer near the time of the June 2012 draft rule announcement, using publicly available financial data. For dealers with U.S. parents, we use quarterly Form Y-9C filings, including off-balance sheet derivative positions and contingent liabilities. For dealers with foreign parents, we use data from Bankscope. We follow the SLR draft rule’s text to calculate an approximate value for each ratio.
To validate our approach for estimating the SLR, we use Form Y-15 filings and Pillar 1-related disclosures for individual banks from 2015 and Q4 2014, which report a bank’s SLR calculation, and compare that to our SLR estimate based on data from either Form Y-9C filings or Bankscope. Figure 6 shows this comparison. Visual inspection clearly shows that the estimated measure is strongly positively correlated with the banks’ own reported SLR, and regressing the reported ratio on the estimated balance sheet-based ratio calculation gives an R2 of 80 percent, with significance at the 1 percent level. The residual disagreement between our internal calculation of SLRs and the banks’ reported ratios is likely due to our assumptions about how many off-balance-sheet items can be netted down because they are centrally cleared or subject to master netting agreements, which can vary both across banks and within a bank over time, but which we cannot observe. Given this finding for 2015 and Q4 2014, we believe our 2012 balance-sheet-based SLR calculations are a reasonable estimate for how close each bank-affiliated dealer would actually be to the ratio requirement.
12 It is reasonable to assume that banks will seek to exceed the statutory requirement by at least some margin to avoid the chance of slipping below statutory requirements and facing costly enforcement actions. Our results are still significant when we allow the buffer to fall from 0.5 percent to 0 percent, or rise to 1 percent.

19
Figure 6. 2014 Q4 Supplementary Leverage Ratios Reported by Banks vs Estimates
R² = 0.8471R² = 0.4882
0%
2%
4%
6%
8%
10%
12%
0% 2% 4% 6% 8% 10% 12%
Bank
's O
wn
Repo
rted
SLR
SLR Estimate from Balance Sheet Data
US BHCs Foreign
Sources: Authors’ estimates from Federal Reserve Form Y-9C filings and bank holding company pillar 3 disclosures
3.4: Empirical Specification We estimate the effect of the SLR on dealer activity using a difference-in-differences analysis. Our dependent variable is the day t amount of triparty repo financing received by a dealer i. We will look at this financing amount for the dealer in aggregate, as well as separately by four major types of collateral being financed — Treasuries, agency MBS, equities, and corporate bonds. We consider Treasuries and agency MBS to be less price volatile, and thus “safe” collateral. We consider equities and corporate bonds to be riskier, or more price-volatile collateral.
The independent variables we use in the first stage of the analysis include:
𝟙𝟙𝑺𝑺𝑺𝑺𝑺𝑺 𝑨𝑨𝑨𝑨𝑨𝑨𝑨𝑨𝑨𝑨𝑨𝑨𝑨𝑨𝑨𝑨𝑨𝑨,𝒕𝒕: a dummy variable that equals one beginning on the June 7, 2012, announcement date for the U.S. SLR draft rule.
US SLR Bank Above Threshold: a piecewise variable that assesses how binding the supplementary leverage ratio policy would be for BHC i, and is calculated as
𝑈𝑈𝑈𝑈 𝑈𝑈𝑆𝑆𝑆𝑆 𝐵𝐵𝐵𝐵𝐵𝐵𝐵𝐵 𝐴𝐴𝐴𝐴𝐴𝐴𝐴𝐴𝐴𝐴 𝑇𝑇ℎ𝑟𝑟𝐴𝐴𝑟𝑟ℎ𝐴𝐴𝑜𝑜𝑜𝑜𝑖𝑖,𝑡𝑡 = −1 ∗ min(0, 3.5− 𝑈𝑈𝑆𝑆𝑆𝑆𝑖𝑖) ∗ 𝟙𝟙𝑆𝑆𝑆𝑆𝑆𝑆 𝐴𝐴𝐴𝐴𝐴𝐴𝐴𝐴𝐴𝐴𝐴𝐴𝐴𝐴𝐴𝐴𝐴𝐴,𝑡𝑡 ,∀𝑖𝑖 ∈ {𝑈𝑈𝑈𝑈 𝑈𝑈𝑆𝑆𝑆𝑆 𝐵𝐵𝐵𝐵𝐵𝐵𝐵𝐵𝑟𝑟}
where SLRi is the estimated SLR of dealer i’s U.S. SLR bank holding company (BHC) parent as of Q2 2012. When a BHC is above the 3.5 percent threshold plus buffer, we model a negative

20
sensitivity to the new regulatory standard once it’s announced and multiply it by negative 1— i.e. the value of 𝑈𝑈𝑈𝑈 𝑈𝑈𝑆𝑆𝑆𝑆 𝐵𝐵𝐵𝐵𝐵𝐵𝐵𝐵 𝐴𝐴𝐴𝐴𝐴𝐴𝐴𝐴𝐴𝐴 𝑇𝑇ℎ𝑟𝑟𝐴𝐴𝑟𝑟ℎ𝐴𝐴𝑜𝑜𝑜𝑜 is above 0. When the BHC’s estimated SLR is below 3.5 percent, when dealer i’s parent company is not a U.S. SLR BHC, or before the SLR rule was announced on June 7, 2012, this variable’s value is equal to 0.
US SLR Bank Below Threshold: By contrast, when a BHC is below the threshold and buffer the SLR is binding, we have a positive sensitivity that is equal to the BHC’s compliance gap, i.e.:
𝑈𝑈𝑈𝑈 𝑈𝑈𝑆𝑆𝑆𝑆 𝐵𝐵𝐵𝐵𝐵𝐵𝐵𝐵 𝐵𝐵𝐴𝐴𝑜𝑜𝐴𝐴𝐵𝐵 𝑇𝑇ℎ𝑟𝑟𝐴𝐴𝑟𝑟ℎ𝐴𝐴𝑜𝑜𝑜𝑜𝑖𝑖,𝑡𝑡 = max(0, 3.5 − 𝑈𝑈𝑆𝑆𝑆𝑆𝑖𝑖) ∗ 𝑈𝑈𝑆𝑆𝑆𝑆_𝐴𝐴𝐵𝐵𝐵𝐵𝐴𝐴𝐴𝐴𝐵𝐵𝐴𝐴𝐴𝐴𝑜𝑜𝑡𝑡 ,∀𝑖𝑖 ∈ {𝑈𝑈𝑈𝑈 𝑈𝑈𝑆𝑆𝑆𝑆 𝐵𝐵𝐵𝐵𝐵𝐵𝐵𝐵𝑟𝑟}
When our estimate of a BHC’s SLR is greater than 3.5 percent, when dealer i’s parent company is not a covered U.S. SLR BHC, or the SLR has not yet been announced, this variable’s value is 0. When the BHC’s estimated SLR is below 3.5 percent, this variable’s value is positive. The intuition behind this variable is that banks which were significantly below the threshold would be more likely to materially alter their activity to raise their SLR, and even banks that were just barely meeting the 3 percent threshold requirement may choose to make relatively smaller changes in activity that would raise their SLR to achieve a buffer, similar to how banks target regulatory capital ratios above the regulatory requirement.
US SLR Sensitivity Control: a control variable which is a time-varying estimate of the level of compliance or non-compliance of a dealer’s parent U.S. BHC, calculated as
𝑈𝑈𝑈𝑈 𝑈𝑈𝑆𝑆𝑆𝑆 𝑈𝑈𝐴𝐴𝐵𝐵𝑟𝑟𝑖𝑖𝑆𝑆𝑖𝑖𝐴𝐴𝑖𝑖𝑆𝑆𝑆𝑆 𝐶𝐶𝐴𝐴𝐵𝐵𝑆𝑆𝑟𝑟𝐴𝐴𝑜𝑜𝑖𝑖,𝑡𝑡 = 3.5− 𝑈𝑈𝑆𝑆𝑆𝑆𝑖𝑖,𝑡𝑡 ,∀𝑖𝑖 ∈ {𝑈𝑈𝑈𝑈 𝑈𝑈𝑆𝑆𝑆𝑆 𝐵𝐵𝐵𝐵𝐵𝐵𝐵𝐵𝑟𝑟}
where each day t the SLR for BHC i is a linear interpolation of our SLR estimate for that BHC at the adjacent quarter-ends, to account for the fact that BHCs’ SLR values change each quarter.
Our variables FBO Above Threshold, FBO Below Threshold, and FBO Sensitivity Control are constructed in the same manner as the U.S. SLR variables, but for dealers whose parents are foreign banking organizations (FBO). Section 165 of the Dodd-Frank Act requires FBOs with $50 billion or more in U.S. non-branch assets to establish intermediate holding companies in the United States, which would be subject to the SLR. Therefore, FBOs may alter their activity in anticipation of being subject to the SLR requirement at the level of their intermediate holding company. We then use our estimated SLR for the entire FBO as a proxy for the sensitivity of that dealer to the policy announcement.
Nonbank X Announcement is an interaction term, which considers potential effects from the implementation of the SLR on nonbank-affiliated broker-dealers’ repo market behavior, and is calculated as
𝑁𝑁𝐴𝐴𝐵𝐵𝐴𝐴𝐵𝐵𝐵𝐵𝐵𝐵 𝑋𝑋 𝐴𝐴𝐵𝐵𝐵𝐵𝐴𝐴𝐴𝐴𝐵𝐵𝐴𝐴𝐴𝐴𝐴𝐴𝐴𝐴𝐵𝐵𝑆𝑆𝑖𝑖,𝑡𝑡 = 1𝐴𝐴𝐴𝐴𝐴𝐴𝑛𝑛𝑛𝑛𝐴𝐴𝑛𝑛 ∗ 𝑈𝑈𝑆𝑆𝑆𝑆_𝐴𝐴𝐵𝐵𝐵𝐵𝐴𝐴𝐴𝐴𝐵𝐵𝐴𝐴𝐴𝐴𝑜𝑜𝑡𝑡
We use the level of the Chicago Board Options Exchange’s Volatility (VIX) Index and the S&P 500 Index as controls to address potential cyclical changes in broker-dealers’ risk appetite in response to capital market conditions. Both reflect implied market volatility and economic

21
activity that could be potential drivers of bank behavior due to value-at-risk considerations. We additionally control for calendar quarter and dealer fixed effects.
Our total model of dealer i’s change in repo activity at date t, using collateral type j is therefore:
Δ𝑆𝑆𝐴𝐴𝑅𝑅𝐴𝐴 𝐹𝐹𝑖𝑖𝐵𝐵𝐵𝐵𝐵𝐵𝐴𝐴𝑖𝑖𝐵𝐵𝐹𝐹𝑖𝑖,𝑗𝑗,𝑡𝑡= 𝛼𝛼𝑗𝑗 + 𝛽𝛽1,𝑗𝑗 ∗ 𝟙𝟙𝑆𝑆𝑆𝑆𝑆𝑆 𝑃𝑃𝐴𝐴𝑃𝑃𝑖𝑖𝐴𝐴𝑃𝑃 𝐴𝐴𝐴𝐴𝐴𝐴𝐴𝐴𝐴𝐴𝐴𝐴𝐴𝐴𝐴𝐴𝐴𝐴,𝑡𝑡 + 𝛽𝛽2,𝑗𝑗 ∗ 𝑈𝑈𝑈𝑈 𝑈𝑈𝑆𝑆𝑆𝑆 𝐵𝐵𝐵𝐵𝐵𝐵𝐵𝐵 𝐴𝐴𝐴𝐴𝐴𝐴𝐴𝐴𝐴𝐴 𝑇𝑇ℎ𝑟𝑟𝐴𝐴𝑟𝑟ℎ𝐴𝐴𝑜𝑜𝑜𝑜𝑖𝑖,𝑡𝑡 + 𝛽𝛽3,𝑗𝑗∗ 𝑈𝑈𝑈𝑈 𝑈𝑈𝑆𝑆𝑆𝑆 𝐵𝐵𝐵𝐵𝐵𝐵𝐵𝐵 𝐵𝐵𝐴𝐴𝑜𝑜𝐴𝐴𝐵𝐵 𝑇𝑇ℎ𝑟𝑟𝐴𝐴𝑟𝑟ℎ𝐴𝐴𝑜𝑜𝑜𝑜𝑖𝑖,𝑡𝑡 + 𝛽𝛽4,𝑗𝑗 ∗ 𝑈𝑈𝑈𝑈 𝑈𝑈𝑆𝑆𝑆𝑆 𝐶𝐶𝐴𝐴𝐵𝐵𝑆𝑆𝑟𝑟𝐴𝐴𝑜𝑜𝑖𝑖,𝑡𝑡 + 𝛽𝛽5,𝑗𝑗∗ 𝐹𝐹𝐵𝐵𝐹𝐹 𝐴𝐴𝐴𝐴𝐴𝐴𝐴𝐴𝐴𝐴 𝑇𝑇ℎ𝑟𝑟𝐴𝐴𝑟𝑟ℎ𝐴𝐴𝑜𝑜𝑜𝑜𝑖𝑖,𝑡𝑡 + 𝛽𝛽6,𝑗𝑗 ∗ 𝐹𝐹𝐵𝐵𝐹𝐹 𝐵𝐵𝐴𝐴𝑜𝑜𝐴𝐴𝐵𝐵 𝑇𝑇ℎ𝑟𝑟𝐴𝐴𝑟𝑟ℎ𝐴𝐴𝑜𝑜𝑜𝑜𝑖𝑖,𝑡𝑡 + 𝛽𝛽7,𝑗𝑗∗ 𝐹𝐹𝐵𝐵𝐹𝐹 𝑈𝑈𝑆𝑆𝑆𝑆 𝐶𝐶𝐴𝐴𝐵𝐵𝑆𝑆𝑟𝑟𝐴𝐴𝑜𝑜𝑖𝑖,𝑡𝑡 + 𝛽𝛽8,𝑗𝑗 ∗ 𝟙𝟙𝑆𝑆𝑆𝑆𝑆𝑆 𝑃𝑃𝐴𝐴𝑃𝑃𝑖𝑖𝐴𝐴𝑃𝑃 𝐴𝐴𝐴𝐴𝐴𝐴𝐴𝐴𝐴𝐴𝐴𝐴𝐴𝐴𝐴𝐴𝐴𝐴,𝑡𝑡 ∗ 𝟙𝟙𝑁𝑁𝐴𝐴𝐴𝐴𝑛𝑛𝑛𝑛𝐴𝐴𝑛𝑛,𝑖𝑖 + 𝑋𝑋𝑡𝑡,𝑗𝑗 + 𝑌𝑌𝑖𝑖,𝑗𝑗 + 𝑍𝑍𝑄𝑄,𝑗𝑗+ 𝜀𝜀𝑖𝑖,𝑗𝑗,𝑡𝑡
3.5: Hypothesis Development
We hypothesize that the SLR will have a negative effect, as measured by total repo financing, on activity by U.S. bank-affiliated dealers whose parent bank is below the SLR threshold we described. This is because the dealer may face pressure from its parent bank to reduce assets (reducing the need for repo financing) to decrease the total exposures in the denominator of the SLR formula, which is one way of increasing the bank parent’s SLR.
H1: 𝛽𝛽3,𝑡𝑡𝐴𝐴𝑡𝑡𝑛𝑛𝑃𝑃 𝑟𝑟𝐴𝐴𝑟𝑟𝐴𝐴 < 0
We further conjecture that the SLR will cause U.S. BHC-affiliated dealers whose parent banks are above the threshold will either maintain the same level of activity, or even increase their activity as measured by total repo financing. This is because the SLR requirement is not binding on the bank holding company, so the dealer may maintain or even increase assets (increasing the need for repo financing) without bringing the parent bank below regulatory compliance.
H2:
𝛽𝛽2,𝑡𝑡𝐴𝐴𝑡𝑡𝑛𝑛𝑃𝑃 𝑟𝑟𝐴𝐴𝑟𝑟𝐴𝐴 ≥ 0
Because the SLR gives a risk-insensitive treatment to all of a bank’s assets, we hypothesize that dealers will adjust the risk composition of their repo activity by decreasing repo borrowing backed by safe collateral (Treasuries, and especially agency MBS, which confer less regulatory benefits for the LCR than Treasuries), and increasing repo backed by riskier collateral such as equities, when their parent bank is below the SLR threshold. We further expect that dealers whose parent bank is above the SLR threshold will behave in the opposite direction, although perhaps to a lesser degree.

22
H3:
𝛽𝛽2,𝑗𝑗 ≥ 0 ∀𝑗𝑗 ∈ {𝑇𝑇𝑟𝑟𝐴𝐴𝐵𝐵𝑟𝑟𝐴𝐴𝑟𝑟𝑖𝑖𝐴𝐴𝑟𝑟,𝐴𝐴𝐹𝐹𝐴𝐴𝐵𝐵𝐴𝐴𝑆𝑆 𝑀𝑀𝐵𝐵𝑈𝑈}
𝛽𝛽2,𝑛𝑛 ≤ 0 ∀𝐵𝐵 ∈ {𝐸𝐸𝐸𝐸𝐴𝐴𝑖𝑖𝑆𝑆𝑖𝑖𝐴𝐴𝑟𝑟,𝐶𝐶𝐴𝐴𝑟𝑟𝑅𝑅𝐴𝐴𝑟𝑟𝐵𝐵𝑆𝑆𝐴𝐴 𝐵𝐵𝐴𝐴𝐵𝐵𝑜𝑜𝑟𝑟}
𝛽𝛽3,𝑗𝑗 < 0 ∀𝑗𝑗 ∈ {𝑇𝑇𝑟𝑟𝐴𝐴𝐵𝐵𝑟𝑟𝐴𝐴𝑟𝑟𝑖𝑖𝐴𝐴𝑟𝑟,𝐴𝐴𝐹𝐹𝐴𝐴𝐵𝐵𝐴𝐴𝑆𝑆 𝑀𝑀𝐵𝐵𝑈𝑈}
𝛽𝛽3,𝑛𝑛 > 0 ∀𝐵𝐵 ∈ {𝐸𝐸𝐸𝐸𝐴𝐴𝑖𝑖𝑆𝑆𝑖𝑖𝐴𝐴𝑟𝑟,𝐶𝐶𝐴𝐴𝑟𝑟𝑅𝑅𝐴𝐴𝑟𝑟𝐵𝐵𝑆𝑆𝐴𝐴 𝐵𝐵𝐴𝐴𝐵𝐵𝑜𝑜𝑟𝑟}
�𝛽𝛽2,𝑗𝑗� < �𝛽𝛽3,𝑗𝑗� ∀𝑗𝑗 ∈ {𝑇𝑇𝑟𝑟𝐴𝐴𝐵𝐵𝑟𝑟𝐴𝐴𝑟𝑟𝑖𝑖𝐴𝐴𝑟𝑟,𝐴𝐴𝐹𝐹𝐴𝐴𝐵𝐵𝐴𝐴𝑆𝑆 𝑀𝑀𝐵𝐵𝑈𝑈,𝐸𝐸𝐸𝐸𝐴𝐴𝑖𝑖𝑆𝑆𝑖𝑖𝐴𝐴𝑟𝑟,𝐶𝐶𝐴𝐴𝑟𝑟𝑅𝑅𝐴𝐴𝑟𝑟𝐵𝐵𝑆𝑆𝐴𝐴 𝐵𝐵𝐴𝐴𝐵𝐵𝑜𝑜𝑟𝑟}
All dealers affiliated with FBOs in the U.S. triparty repo market are required by the Dodd-Frank Act’s Section 165 to establish an intermediate holding company, which would then face the SLR limit. Foreign banks will likely anticipate this and therefore respond in similar ways as U.S. BHCs.
However, it is possible that the SLR we estimate for the foreign banks as a whole is not representative of the SLR for the U.S.-only portion of their operations. Our SLR estimate is a somewhat noisy (but defensible) approximation of what the SLR would be for a bank holding company. Our SLR estimate for FBOs is a much more uncertain proxy for what the SLR would be for their U.S. intermediate bank holding company.
H4:
𝛽𝛽5,𝑗𝑗 ≥ 0 ∀𝑗𝑗 ∈ {𝑇𝑇𝑟𝑟𝐴𝐴𝐵𝐵𝑟𝑟𝐴𝐴𝑟𝑟𝑖𝑖𝐴𝐴𝑟𝑟,𝐴𝐴𝐹𝐹𝐴𝐴𝐵𝐵𝐴𝐴𝑆𝑆 𝑀𝑀𝐵𝐵𝑈𝑈}
𝛽𝛽5,𝑛𝑛 ≤ 0 ∀𝐵𝐵 ∈ {𝐸𝐸𝐸𝐸𝐴𝐴𝑖𝑖𝑆𝑆𝑖𝑖𝐴𝐴𝑟𝑟,𝐶𝐶𝐴𝐴𝑟𝑟𝑅𝑅𝐴𝐴𝑟𝑟𝐵𝐵𝑆𝑆𝐴𝐴 𝐵𝐵𝐴𝐴𝐵𝐵𝑜𝑜𝑟𝑟}
𝛽𝛽6,𝑗𝑗 < 0 ∀𝑗𝑗 ∈ {𝑇𝑇𝑟𝑟𝐴𝐴𝐵𝐵𝑟𝑟𝐴𝐴𝑟𝑟𝑖𝑖𝐴𝐴𝑟𝑟,𝐴𝐴𝐹𝐹𝐴𝐴𝐵𝐵𝐴𝐴𝑆𝑆 𝑀𝑀𝐵𝐵𝑈𝑈}
𝛽𝛽6,𝑛𝑛 > 0 ∀𝐵𝐵 ∈ {𝐸𝐸𝐸𝐸𝐴𝐴𝑖𝑖𝑆𝑆𝑖𝑖𝐴𝐴𝑟𝑟,𝐶𝐶𝐴𝐴𝑟𝑟𝑅𝑅𝐴𝐴𝑟𝑟𝐵𝐵𝑆𝑆𝐴𝐴 𝐵𝐵𝐴𝐴𝐵𝐵𝑜𝑜𝑟𝑟}
�𝛽𝛽5,𝑗𝑗� < �𝛽𝛽6,𝑗𝑗� ∀𝑗𝑗 ∈ {𝑇𝑇𝑟𝑟𝐴𝐴𝐵𝐵𝑟𝑟𝐴𝐴𝑟𝑟𝑖𝑖𝐴𝐴𝑟𝑟,𝐴𝐴𝐹𝐹𝐴𝐴𝐵𝐵𝐴𝐴𝑆𝑆 𝑀𝑀𝐵𝐵𝑈𝑈,𝐸𝐸𝐸𝐸𝐴𝐴𝑖𝑖𝑆𝑆𝑖𝑖𝐴𝐴𝑟𝑟,𝐶𝐶𝐴𝐴𝑟𝑟𝑅𝑅𝐴𝐴𝑟𝑟𝐵𝐵𝑆𝑆𝐴𝐴 𝐵𝐵𝐴𝐴𝐵𝐵𝑜𝑜𝑟𝑟}
Dealers that are not affiliated with banks and dealers affiliated with non-advanced approach banks are not subject to the SLR, and they comprise the “untreated” portion of our sample. We choose to look at the repo activity of dealers not affiliated with banks (“nonbank dealers”) specifically, because their parent company is also not bound by bank regulations. This provides insight into the marketwide equilibrium effects of the SLR.

23
In a competitive market where certain dealers are constrained by new regulation and other dealers are not, we expect the unconstrained dealers to benefit. Specifically, since our hypotheses H1 and H3 state that dealers whose parent bank is below the SLR threshold may reduce their repo borrowing (especially backed by Treasuries and agency MBS) and increase repo borrowing backed by equities or corporate bonds, we expect unconstrained dealers to react in the opposite direction.
H
5:
𝛽𝛽8,𝑗𝑗 > 0 ∀𝑗𝑗 ∈ {𝑆𝑆𝐴𝐴𝑆𝑆𝐵𝐵𝑜𝑜 𝑟𝑟𝐴𝐴𝑅𝑅𝐴𝐴,𝑇𝑇𝑟𝑟𝐴𝐴𝐵𝐵𝑟𝑟𝐴𝐴𝑟𝑟𝑖𝑖𝐴𝐴𝑟𝑟,𝐴𝐴𝐹𝐹𝐴𝐴𝐵𝐵𝐴𝐴𝑆𝑆 𝑀𝑀𝐵𝐵𝑈𝑈}
𝛽𝛽8,𝑛𝑛 < 0 ∀𝐵𝐵 ∈ {𝐸𝐸𝐸𝐸𝐴𝐴𝑖𝑖𝑆𝑆𝑖𝑖𝐴𝐴𝑟𝑟,𝐶𝐶𝐴𝐴𝑟𝑟𝑅𝑅𝐴𝐴𝑟𝑟𝐵𝐵𝑆𝑆𝐴𝐴 𝐵𝐵𝐴𝐴𝐵𝐵𝑜𝑜𝑟𝑟}
We consider the effects of SLR adoption in three phases. In the first phase of analysis, we evaluate the transitional impacts of the adoption of the supplementary leverage ratio and its effects on BHC and non-BHC affiliated broker-dealer behavior. In a subsequent phase of the analysis, we evaluate whether these effects are continuous and diminish as BHC-affiliated broker-dealers become compliant. This second phase contributes to our understanding of bank incentives. Specifically, we are interested in evaluating whether BHC-affiliated broker-dealers’ activities are only influenced by regulatory compliance, which is akin to a threshold effect, or whether cost of capital considerations resulting from funds transfer pricing in the BHC — a continuous effect — influence firms’ behavior. This is relevant to evaluating the medium- to long-run economic costs of bank capital standards. It also is relevant to understanding how banks and their affiliates may respond to shocks that adversely impact their regulatory ratios and thereby amplify risks (Cetina 2015). Finally, we consider whether the supplementary leverage ratio has had any lasting effect on repo market structure. We examine the Herfindahl–Hirschman Index of repo borrowing by non-BHC affiliated dealers to measure repo market concentration before and after the draft rule announcement.
Given that we are using high-frequency (daily) data, we control for heteroskedasticity using Huber-White sandwich estimators to estimate standard errors that are robust to cross-sectional heteroskedasticity and within-panel (serial) correlation. We note the data exhibit serial autocorrelation, so we run our analysis on changes in levels of repo borrowing and allow for an AR(1) term as well. We do not use any empirical specification using changes in logs, because when we examine the residuals from such a regression we find significant fat tails in the distribution, making changes in logs an unsuitable model for the assumptions of ordinary least squares (OLS). As a later robustness check to control for the significant heterogeneity in the size of repo borrowing among dealers, we re-run our analysis using daily changes in dealer-level portfolio compositions (e.g. percent of dealer i’s repo borrowing backed by agency MBS) as the dependent variable instead of changes in levels and find our results are still supported.

24
4. Results 4.1: Transitional Impact of SLR on Bank and Nonbank-Affiliated Broker-Dealer Repo Market Behavior
As already discussed, the June 2012 announcement of the SLR proposal could incentivize behavior changes by broker-dealers affiliated with bank holding companies whose activities are covered by the heightened standard. We find notably different trends between the broker-dealer groups consistent with the SLR affecting bank-affiliated broker-dealers’ incentives, and behavior in the repo market. These findings are similar to those of another OFR working paper (Munyan, 2015) that identified the leverage ratio as a potential driver of quarter-end deleveraging of government securities in the triparty repo market by U.S. broker-dealer affiliates of foreign banking organizations.
We report the marginal contribution to R2 from our independent variables of interest after the effects of our macro controls and quarter- and dealer-fixed effects. The marginal R2 is very low due to the high frequency nature of the data, since our long-term trend from the effect of the SLR should have little explanatory power for variations at the daily frequency. The central concern of this analysis is the statistical significance of the individual coefficients, when correcting for heteroskedasticity using robust standard errors.
As can be seen in Table 4 below, this model suggests a strong response from broker-dealers affiliated with U.S. banks subject to the SLR that are below the 3.5 percent threshold (requirement plus assumed buffer) in terms of their aggregate repo borrowing following the proposal of the SLR rule. The coefficient for US SLR Bank Below Threshold, 𝛽𝛽3,𝑡𝑡𝐴𝐴𝑡𝑡𝑛𝑛𝑃𝑃 𝑟𝑟𝐴𝐴𝑟𝑟𝐴𝐴 is negative and significant. Its economic interpretation is that a dealer whose parent is a U.S. bank subject to the SLR requirement, with an estimated ratio value of 2.5 percent (i.e. 1 percent below our 3.5 percent threshold), will reduce its total repo borrowing by $297.9 million per day after the rule is proposed until our sample ends Dec. 31, 2014. If the estimated ratio value as of Q2 2012 was instead 3 percent, our model predicts the dealer would reduce its total repo borrowing by $148.5 million per day. This supports hypothesis H1.
For dealers of U.S. banks that are already above the SLR requirement plus an assumed buffer as of Q2 2012, we find no statistically significant change to total repo borrowing. This suggests an asymmetric effect of the ratio on dealers whose parents are above, versus below, the requirement, and is consistent with hypothesis H2.
The coefficients on repo borrowing backed by safe assets for dealers affiliated with U.S. parents subject to the ratio that are below the 3.5 percent threshold as of Q2 2012, 𝛽𝛽3,𝑇𝑇𝑟𝑟𝐴𝐴𝑛𝑛𝑇𝑇𝐴𝐴𝑟𝑟𝑖𝑖𝐴𝐴𝑇𝑇 and

25
𝛽𝛽3,𝐴𝐴𝐴𝐴𝐴𝐴𝐴𝐴𝐴𝐴𝑃𝑃 𝑀𝑀𝑀𝑀𝑆𝑆, are also negative, and both economically and statistically significant. The coefficients on risky assets, 𝛽𝛽3,𝐸𝐸𝐸𝐸𝐴𝐴𝑖𝑖𝑡𝑡𝑖𝑖𝐴𝐴𝑇𝑇 and 𝛽𝛽3,𝐶𝐶𝐴𝐴𝑟𝑟𝑟𝑟𝐴𝐴𝑟𝑟𝑛𝑛𝑡𝑡𝐴𝐴 𝑀𝑀𝐴𝐴𝐴𝐴𝐴𝐴𝑇𝑇, are positive and significant, though smaller than the coefficients for safe assets. We do not find a significant change to repo borrowing in any individual asset class for dealers with U.S. parents that were above the SLR threshold, again suggesting an asymmetric effect of the ratio. Together, these results suggest that even though dealers constrained by the ratio reduced their total repo borrowing, they actively increased the risk profile of the remaining assets, while dealers above the ratio threshold did not respond significantly, supporting hypothesis H3. For dealers with foreign bank parents, we find that if the parent’s SLR was below the 3.5 percent threshold, a dealer significantly decreased its repo borrowing, both in total and in repo backed by safe collateral (Treasuries and agency MBS). If the foreign bank parent’s ratio was above the 3.5 percent threshold, the dealer significantly increased its total repo borrowing, and this increase was in repo backed by safe collateral. The coefficients 𝛽𝛽5,𝑗𝑗 and 𝛽𝛽6,𝑗𝑗 indicate an opposite but asymmetric effect from the ratio requirement on banks that were above versus below the compliance threshold for total repo and for safe collateral,13 which is consistent with hypothesis H4, but we don’t find any significant effect on these dealers’ repo backed by the two riskier collateral types. When looking at nonbank dealers, we find little evidence of a response to the June 2012 announcement of the proposed SLR. The coefficient 𝛽𝛽8,𝑈𝑈.𝑆𝑆. 𝑇𝑇𝑟𝑟𝐴𝐴𝑛𝑛𝑇𝑇𝐴𝐴𝑟𝑟𝑖𝑖𝐴𝐴𝑇𝑇 is marginally significant at the 10 percent level, but 𝛽𝛽8,𝑗𝑗 is not significant for total repo borrowing and for repo backed by all other collateral types, althought the signs are as predicted. Therefore we do not claim much support for hypothesis H5 under this specification.
An immediate concern with the specification in Table 4 is that while the SLR announcement may have been unanticipated at least in terms of what assets would be counted or how high the ratio would be, once the ratio was announced banks would endogenously respond by taking actions that change their ratio. In other words, although the ratio “treatment” may have exogenously shocked dealer behavior when it was announced in the summer of 2012, a dealer’s bank parent is choosing its future level of treatment each quarter as it takes actions to improve its SLR.
It seems reasonable to expect that a dealer whose parent bank is well below the SLR requirement would respond strongly to the rule during a transition period, but as the parent’s ratio increases over time and the compliance gap closes, a dealer’s behavior can change more gradually. For this reason, we change our SLR treatment variables, US Bank Above/Below Threshold and FBO Above/Below Threshold, to vary over time after the announcement date. We linearly interpolate the dealer’s bank parent compliance gap each day between quarters after the June 7, 2012, announcement date. Inasmuch as this inference of a daily ratio gap is a noisy
13 It is worth noting again here that our results are robust to setting this threshold at 3 percent, 3.5 percent, or 4 percent.

26
Table 4. Supplementary Leverage Ratio (SLR) Effect on Dealer Repo Behavior
(1) (2) (3) (4) (5) Daily Change in Repo Borrowing Backed By:
All Collateral (Total Repo)
U.S. Treasury Securities
Agency MBS Equities Corporate Bonds
𝟙𝟙SLR Policy Announced,t 30.19*** 6.285 19.28*** -1.134 -1.008
(10.67) (6.621) (6.919) (1.427) (1.532)
US SLR Bank Above -0.332 -1.271 3.996 -1.053 0.556 Threshold
(5.022) (4.660) (4.524) (1.049) (1.047)
US SLR Bank Below -297.9*** -101.7* -232.2*** 62.87*** 2.827* Threshold
(75.05) (52.72) (25.99) (13.37) (1.614)
US SLR Controlt 10.75 12.87 19.40 -10.60 -5.939***
(25.26) (23.22) (19.69) (10.51) (1.675)
FBO Above Threshold 31.83*** 24.09*** 5.915*** 0.261 0.524
(2.370) (1.742) (1.768) (0.388) (0.394)
FBO Below Threshold -108.8** -26.67** -63.05** -2.635 2.683
(47.34) (12.75) (31.52) (2.074) (1.820)
FBO SLR Controlt 12.84*** 6.199** 9.359*** -0.0429 -0.115
(4.819) (2.518) (2.754) (0.595) (0.539)
𝟙𝟙SLR Policy Announced,t 12.41 4.599 16.41* -2.096 -2.082 x 𝟙𝟙Nonbank,i
(11.76) (6.805) (8.338) (1.517) (1.575)
Constant -0.715 3.375 -2.137 -1.029 -0.189 (5.911) (3.348) (4.675) (1.599) (0.469) Observations 57,169 57,169 57,169 57,169 57,169 Marginal R-squared 0.000 0.000 0.000 0.001 0.000 Number of Dealers 78 78 78 78 78 AR Term 1 1 1 1 1 Dealer FE Y Y Y Y Y Quarter-Year FE Y Y Y Y Y Macro Controls Y Y Y Y Y
Robust standard errors in parentheses *** p<0.01, ** p<0.05, * p<0.1
First-Differenced Dependent Variable and Lags
Source: Authors’ analysis

27
estimate of the true compliance gap, we believe that noise should bias the analysis against finding a significant result. We reflect this change by adding time t subscripts to these variables.
In Table 5, we present the results from this more dynamic model, where dealer responses to the SLR are allowed to vary over time as their parent bank’s SLR compliance gap changes. We find dealers with U.S. parents below the 3.5 percent threshold on a given day significantly reduce total repo borrowing, decrease repo borrowing backed by agency MBS, and increase repo borrowing backed by equities, which is again consistent with hypotheses H1 and H3. We do not find any significant effect for these dealers on their repo borrowing backed by Treasuries, or when their estimated ratio is above the threshold, which we had predicted with hypotheses H2 and H3.
For dealers with foreign parents, our analysis loses much of its statistical significance, but we still find some weak evidence that parents constrained by the SLR reduce total repo borrowing and repo backed by agency MBS, and modestly increase repo backed by corporate bonds. Dealers with foreign parents that exceed the SLR threshold on a particular day t increase their repo backed by Treasuries, but we do not find other statistically significant changes for these dealers, giving partial support for hypothesis H4.
Nonbank dealers’ treatment does not change in this model, and they still increase their total repo borrowing and their repo borrowing backed by agency MBS, a safe collateral type. Their change in repo borrowing backed by Treasuries is positive, but not statistically significant, and their change in repo backed by more price volatile, risky collateral (equities and corporate bonds) is negative but not significant. We believe this is consistent with hypothesis H5, that nonbank dealers respond in the opposite direction of the dealers whose bank parents are constrained by the SLR.

28
Table 5: Supplementary Leverage Ratio (SLR) Effect on Dealer Repo Behavior, with Time-Varying Above/Below Threshold Measure (1) (2) (3) (4) (5) Daily Change in Repo Borrowing Backed By:
All Collateral (Total Repo)
U.S. Treasury Securities
Agency MBS Equities Corporate Bonds
𝟙𝟙SLR Policy Announced,t 0.200 -1.318 3.806 -0.0407 -1.310
(14.74) (8.913) (7.908) (2.327) (1.365)
US SLR Bank Above 16.57 4.827 10.85 -1.531 0.223 Thresholdt
(11.31) (5.191) (7.310) (1.206) (0.604)
US SLR Bank Below -376.7*** -133.8 -259.7*** 61.20*** -0.560 Thresholdt
(103.9) (126.9) (19.54) (16.98) (8.171)
US SLR Controlt 45.02 25.60 44.10 -17.07 -6.442***
(50.10) (29.01) (38.14) (13.89) (1.954)
FBO Above Thresholdt 5.249 19.26*** -7.112 -0.0631 -0.797
(9.834) (5.157) (5.990) (0.868) (0.923)
FBO Below Thresholdt -92.75* -28.57 -59.85* -2.254 4.534*
(54.17) (24.90) (34.70) (5.014) (2.377)
FBO SLR Controlt 24.26** 3.980 17.69** 0.222 0.553
(11.96) (6.518) (7.167) (0.956) (1.099)
𝟙𝟙SLR Policy Announced,t 42.39*** 12.20 31.88*** -3.189 -1.779 x 𝟙𝟙Nonbank,i
(15.55) (9.050) (9.175) (2.384) (1.413)
Constant 3.436 5.484 0.594 -1.883 -0.298 (8.449) (4.153) (6.658) (2.073) (0.466) Observations 57,169 57,169 57,169 57,169 57,169 Marginal R-squared 0.000 0.000 0.000 0.000 0.000 Number of Dealers 78 78 78 78 78 AR Term 1 1 1 1 1 Dealer FE Y Y Y Y Y Quarter-Year FE Y Y Y Y Y Macro Controls Y Y Y Y Y
Robust standard errors in parentheses *** p<0.01, ** p<0.05, * p<0.1
First-Differenced Dependent Variable and Lags Dynamic Phase 1, Robust OLS
Source: Authors’ analysis

29
4.2: Long-run Effect of SLR on Dealer Repo Activity
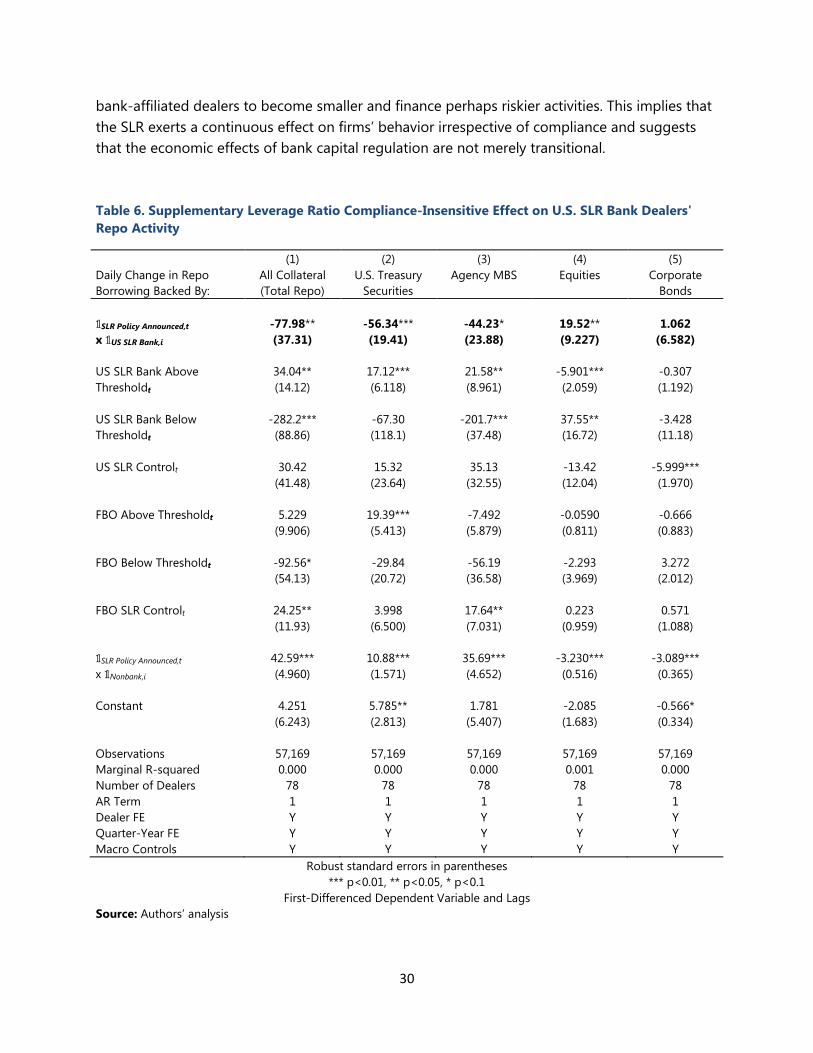
For this second phase of the analysis, we seek to disentangle whether bank-affiliated broker-dealers’ repo activities are influenced by the SLR only during a transitional phase while moving towards regulatory compliance, or whether there are longer-term, compliance-insensitive, capital considerations that discourage them from doing repo backed by government securities, and encourage them toward activities requiring the financing of riskier collateral.
We test this by modifying our original pre/post treatment dummy, 𝟙𝟙SLR Policy Announced,t to examine the pre/post effect of the SLR treatment on U.S. BHC-affiliated dealers relative to other dealers, by multiplying the dummy by another indicator variable which equals 1 if the dealer’s parent is a U.S. bank subject to the SLR, i.e. 𝟙𝟙SLR Policy Announced,t x 𝟙𝟙US SLR Bank,i. We make a new hypothesis, which is that all dealers with a U.S. bank parent subject to the ratio will reduce their total repo borrowing, and increase the risk composition of their repo collateral, relative to other dealers.
H6: 𝛽𝛽�1,𝑗𝑗 ≤ 0 ∀𝑗𝑗 ∈ {𝑇𝑇𝐴𝐴𝑆𝑆𝐵𝐵𝑜𝑜 𝑆𝑆𝐴𝐴𝑅𝑅𝐴𝐴,𝑇𝑇𝑟𝑟𝐴𝐴𝐵𝐵𝑟𝑟𝐴𝐴𝑟𝑟𝑖𝑖𝐴𝐴𝑟𝑟,𝐴𝐴𝐹𝐹𝐴𝐴𝐵𝐵𝐴𝐴𝑆𝑆 𝑀𝑀𝐵𝐵𝑈𝑈}
𝛽𝛽�1,𝑛𝑛 ≥ 0 ∀𝐵𝐵 ∈ {𝐸𝐸𝐸𝐸𝐴𝐴𝑖𝑖𝑆𝑆𝑖𝑖𝐴𝐴𝑟𝑟,𝐶𝐶𝐴𝐴𝑟𝑟𝑅𝑅𝐴𝐴𝑟𝑟𝐵𝐵𝑆𝑆𝐴𝐴 𝐵𝐵𝐴𝐴𝐵𝐵𝑜𝑜𝑟𝑟},
where we denote 𝛽𝛽�1,𝑗𝑗 with a ~ to distinguish it from our original specification. Our results using this new specification are presented in Table 6, where we again also allow the level of treatment to vary over time as a dealer’s parent SLR changes.
We find significant support for our hypothesis H6: relative to other dealers, bank-affiliated dealers reduce their total repo borrowing by $77 million per day after the announcement of the proposed SLR rule. Repo backed by Treasuries and agency MBS falls by $56 million and $44 million per day, respectively, and repo backed by equities rises by $19.5 million per day, regardless of whether the parent’s consolidated SLR is above or below the SLR requirement.
Among dealers with U.S. bank parents subject to the SLR and above our 3.5 percent SLR threshold at date t, we find that total repo borrowing and repo backed by safe collateral increases. Repo backed by equities falls, which partially offsets the compliance-insensitive effect of SLR that pressures these dealers to become smaller and hold riskier collateral. Dealers with U.S. bank parent SLR values below the threshold continue to have an asymmetrically stronger response to the regulation, consistent with our earlier models.
A hypothetical dealer with a U.S bank parent whose SLR at date t is estimated to be 4.5 percent would be expected to reduce total repo by $43.9 million that day, but still increase their repo backed by equities by $13.6 million. If that SLR estimate were instead only 2.5 percent, we’d expect a drop in total repo by $360.2 million that day, and $57.1 million more repo borrowing backed by equities. Our interpretation of this result is that the SLR has incentivized all U.S. SLR
30
bank-affiliated dealers to become smaller and finance perhaps riskier activities. This implies that the SLR exerts a continuous effect on firms’ behavior irrespective of compliance and suggests that the economic effects of bank capital regulation are not merely transitional.
Table 6. Supplementary Leverage Ratio Compliance-Insensitive Effect on U.S. SLR Bank Dealers' Repo Activity
(1) (2) (3) (4) (5) Daily Change in Repo Borrowing Backed By:
All Collateral (Total Repo)
U.S. Treasury Securities
Agency MBS Equities Corporate Bonds
𝟙𝟙SLR Policy Announced,t -77.98** -56.34*** -44.23* 19.52** 1.062 x 𝟙𝟙US SLR Bank,i
(37.31) (19.41) (23.88) (9.227) (6.582)
US SLR Bank Above 34.04** 17.12*** 21.58** -5.901*** -0.307 Thresholdt
(14.12) (6.118) (8.961) (2.059) (1.192)
US SLR Bank Below -282.2*** -67.30 -201.7*** 37.55** -3.428 Thresholdt
(88.86) (118.1) (37.48) (16.72) (11.18)
US SLR Controlt 30.42 15.32 35.13 -13.42 -5.999***
(41.48) (23.64) (32.55) (12.04) (1.970)
FBO Above Thresholdt 5.229 19.39*** -7.492 -0.0590 -0.666
(9.906) (5.413) (5.879) (0.811) (0.883)
FBO Below Thresholdt -92.56* -29.84 -56.19 -2.293 3.272
(54.13) (20.72) (36.58) (3.969) (2.012)
FBO SLR Controlt 24.25** 3.998 17.64** 0.223 0.571
(11.93) (6.500) (7.031) (0.959) (1.088)
𝟙𝟙SLR Policy Announced,t 42.59*** 10.88*** 35.69*** -3.230*** -3.089*** x 𝟙𝟙Nonbank,i
(4.960) (1.571) (4.652) (0.516) (0.365)
Constant 4.251 5.785** 1.781 -2.085 -0.566* (6.243) (2.813) (5.407) (1.683) (0.334) Observations 57,169 57,169 57,169 57,169 57,169 Marginal R-squared 0.000 0.000 0.000 0.001 0.000 Number of Dealers 78 78 78 78 78 AR Term 1 1 1 1 1 Dealer FE Y Y Y Y Y Quarter-Year FE Y Y Y Y Y Macro Controls Y Y Y Y Y
Robust standard errors in parentheses *** p<0.01, ** p<0.05, * p<0.1
First-Differenced Dependent Variable and Lags Source: Authors’ analysis

31
Among dealers with a foreign bank parent, we find only weak evidence now for our earlier hypothesis H4. Dealers whose foreign parent SLR is above the threshold at date t seem to increase their repo backed by Treasuries, but there is no effect on total repo borrowing or repo backed by agency MBS, equities, or corporate bonds. Dealers whose foreign parent SLR is below the 3.5 percent threshold have a negative coefficient on their total repo borrowing, but it is only significant at the 10 percent level and is just one-third the economic size of the effect we find for dealers with U.S. parents below the threshold.
We do find strong support for our hypothesis H5 in this model: dealers with nonbank parents increase their total repo borrowing by $42.6 million each day, backed by Treasuries and agency MBS, and reduce their repo activity backed by equities and corporate bonds after the announcement of the SLR. The coefficients reported in Table 6 are all significant at the 1 percent level for this row.
4.3: Impact of SLR on Triparty Repo Market Concentration and Nonbank-Affiliated Dealer Entry
This final phase of the analysis considers a different question: the extent to which the introduction of the SLR has changed the structure of the triparty repo market with respect to market concentration and the entrance of nonbank broker-dealers. In columns (1)-(3) of Table 7, we calculate the Herfindahl–Hirschman Index of repo borrowing by dealers to measure repo market concentration. We find that in repo borrowing backed by either agency MBS collateral or equity collateral, market concentration falls, consistent with nonbank broker-dealer entry. In looking at triparty repo market volume in column (1), we again see a decline in market concentration after the SLR was announced. Moreover, we find in columns (4)-(7) that the number of nonbank dealers borrowing in repo has increased, especially nonbank dealers borrowing using agency MBS as collateral. This is consistent with entry by nonbank dealers to fill the market gap created by SLR-affected bank dealers.
Although not presented here, when we extend this analysis through 2016 we continue to find a statistically significant but smaller effect on nonbank-affiliated dealer entry in the triparty repo market, even as we estimate that all BHC-affiliated broker-dealers were compliant with the SLR by Q4 2014. This suggests that the leverage ratio’s introduction has had a lasting impact on triparty repo market structure.

32
Table 7. First-Differenced Dependent Variable and Lags, Dealers with > $10 Billion Average Daily Repo Borrowing
(1) (2) (3) (4) (5) (6) (7) VARIABLES HHI
(All Repo) HHI
(Agency MBS)
HHI (Equities)
Number of Participating
Nonbank Dealers
Number of Participating
Nonbank Dealers in Treasuries
Number of Participating
Nonbank Dealers in Agency MBS
Number of Participating
Nonbank Dealers in Equities
SLR -0.0149*** -0.0157*** -0.0173*** 5.899*** 0.514*** 2.881*** 0.0679*** Announced
(4.75e-05) (8.74e-05) (0.000169) (0.0447) (0.0433) (0.0469) (0.0186)
Constant 0.0760*** 0.0799*** 0.127*** 18.49*** 8.281*** 8.328*** 1.542*** (4.56e-05) (8.54e-05) (0.000162) (0.0445) (0.0331) (0.0340) (0.0145) Observations 64,858 64,858 64,858 64,858 64,858 64,858 64,858 R-squared 0.664 0.399 0.174 0.270 0.002 0.053 0.000
Robust standard errors in parentheses *** p<0.01, ** p<0.05, * p<0.1
Source: Authors’ analysis
5. Conclusion
Since the crisis, regulators have strengthened the leverage ratio — a minimum capital level for banks relative to their total assets and exposures without regard to the riskiness or composition of assets — as a backstop to risk-based capital requirements that may be subject to misspecification or model risk.
One potential unintended consequence of a more stringent leverage ratio is that it may encourage bank holding companies and their affiliated broker-dealers to shed low-return and low-risk positions in favor of higher-return and higher-risk positions. This paper examines the repo market activity of broker-dealers affiliated with BHCs and broker-dealers not affiliated with BHCs to ascertain whether there is evidence of this occurring. In theory, the SLR could incentivize broker-dealers affiliated with banks subject to the SLR to: (1) reduce their activity in the repo market; (2) reduce their use of lower risk collateral, such as government securities, to back repo; and (3) increase their use of more price volatile collateral, such as equities. This change in behavior is of potential concern for three reasons. First, it may have the unintended effect of reducing liquidity in the agency MBS market. Second, it is possible that a greater use of repo backed by non-government securities collateral may reduce the stability of BHC-affiliated broker-dealers’ repo funding by limiting their ability to migrate their triparty financing to blind-brokered and centrally cleared repo venues in times of stress. Finally, it may encourage non-affiliated broker-dealers to play a large role in the repo market even as their regulatory regime has changed little post crisis.

33
Using data on the triparty repo market, the paper finds strong evidence of a threshold effect for bank-affiliated broker-dealers that were below the SLR at the time the proposed ratio was announced in June 2012. These firms subsequently reduced their use of repo backed by agency MBS and increased their repo backed by more price-volatile equity collateral. Higher capital requirements for banks are often assumed to unequivocally reduce their risk of failure. However, this research suggests that the leverage ratio as a risk-insensitive capital standard may encourage firms to increase the risk profile of their remaining activities. The signs on the regression coefficients are consistent with a SLR-driven story, rather than resulting from the liquidity coverage ratio or net stable funding ratio. These results are relevant to ongoing policy discussions internationally about potentially increasing leverage ratio requirements for G-SIBs.
Additionally, we find evidence that regardless of whether a U.S. BHC-affiliated broker-dealer parent is above or below the SLR requirement, the announcement of this rule has disincentivized those dealers affiliated with BHCs from borrowing in triparty repo, particularly using Treasuries and agency MBS as collateral, and incentivized them to use riskier equity collateral.
Finally, the paper finds evidence of nonbank affiliated broker-dealers entering the repo market following the announcement of the SLR. Thus, the activity and importance of nonbank-affiliated broker-dealers in the triparty repo market appears to be growing in response to more stringent BHC capital standards that affect bank-affiliated dealers through consolidation. This finding is persistent and may suggest the need to revisit regulatory requirements for broker-dealers, which have been subject to little change since the 2007-09 crisis, to prevent a buildup of risks in nonbank-affiliated broker-dealers.
34
References Acharya, Viral V, Hamid Mehran, and Anjan Thakor. 2015. "Caught between Scylla and
Charybdis? Regulating bank leverage when there is rent seeking and risk shifting." Review of Corporate Finance Studies.
Admati, Anat R, Peter M DeMarzo, Martin F Hellwig, and Paul C Pfleiderer. 2013. "Fallacies, irrelevant facts, and myths in the discussion of capital regulation: Why bank equity is not socially expensive." Max Planck Institute for Research on Collective Goods 23.
Adrian, Tobias, and Hyun Song Shin. 2010. "Liquidity and leverage." Journal of Financial Intermediation 418-437.
Aiyar, Shekhar S, Charles W Calomiris, and Tomasz Wieladek. 2014. "Identifying channels of credit substitution when bank capital requirements are varied." Economic Policy 29 (77): 45-77.
Aiyar, Shekhar, Charles W Calomiris, and Tomasz Wieladek. 2014. "Does Macro-Prudential Regulation Leak? Evidence from a UK Policy Experiment." Journal of Money, Credit and Banking (Wiley Online Library) 46 (s1): 181-214.
Aiyar, Shekhar, Charles W Calomiris, John Hooley, Yevgeniya Korniyenko, and Tomasz Wieladek. 2014. "The international transmission of bank capital requirements: Evidence from the UK." Journal of Financial Economics (Elsevier) 113 (3): 368-382.
Alfriend, Malcolm C. 1988. "International Risk-Based Capital Standard: History and Explanation." Federal Reserve Bank of Richmond Economic Review 74 (6): 28-34.
Allahrakha, Meraj, Paul Glasserman, and H Peyton Young. 2015. "Systemic Importance Indicators for 33 U.S. Bank Holding Companies: An Overview of Recent Data," Office of Financial Research Brief no. 15-01.
Baklanova, Viktoria, Adam Copeland, and Rebecca McCaughrin. 2015. "Reference Guide to U.S. Repo and Securities Lending Markets." Office of Financial Research Working Paper no. 15-17.
Banerjee, Ryan, and Hitoshi Mio. 2015. "The Impact of Liquidity Regulation on Banks." Bank of England Working Paper.
Behn, Markus, Rainer Haselmann, and Vikrant Vig. 2014. "Risk weights, lending, and financial stability: Limits to model-based capital regulation." Kiel und Hamburg: ZBW - Deutsche Zentralbibliothek fur Wirtschaftswissenschaften, Leibniz-Informationszentrum Wirtschaft.
Berger, Allen, and Christa Bouwman. 2009. "Bank liquidity creation." Review of Financial Studies 22 (9): 3779-3837.

35
Berrospide, Jose M, and Rochelle M Edge. 2009. Linkages between the financial and real sectors: bank credit and capital over the crisis. Unpublished manuscript. Board of Governors of the Federal Reserve System, Washington (October 16).
Bertrand, Marianne, Esther Duflo, and Sendhil Mullainathan. 2004. "How Much Should We Trust Differences-in-Differences Estimates?" Quarterly Journal of Economics (MIT Press) 119 (1): 249-275.
Bonner, Clemens. 2012. "Liquidity Regulation, Funding Costs and Corporate Lending." (De Nederlandsche Bank Working Paper).
Bonner, Clemens. 2016. "Preferential regulatory treatment and banks’ demand for government bonds." Journal of Money, Credit and Banking.
Bonner, Clemens, and Sylvester CW Eijffinger. 2015. "The impact of liquidity regulation on bank intermediation." Review of Finance (Oxford University Press).
Borio, Claudio, and Haibin Zhu. 2012. "Capital regulation, risk-taking and monetary policy: a missing link in the transmission mechanism?" Journal of Financial Stability (Elsevier) 8 (4): 236-251.
Boyarchenko, Nina, Or Shachar, and Thomas Eisenbach. 2015. "Have Dealers' Strategies in the GCF Repo Market Changed?" Liberty Street Economics. July 20.
Calomiris, Charles, Florian Heider, and Marie Hoerova. 2014. "A theory of bank liquidity requirements." Columbia Business School Research Paper.
Cameron, A Colin, J. B. Gelbach, and Douglas L Miller. 2012. "Robust Inference with multiway clustering." Journal of Business & Economic Statistics.
Cetina, Jill. 2015. "Incorporating Liquidity Shocks and Feedbacks in Bank Stress Tests." Office of Financial Research Brief 15-06.
Cetina, Jill, and Katherine Gleason. 2015. "The Difficult Business of Measuring Banks' Liquidity." Office of Financial Research Working Paper no. 15-20.
Cohen, Benjamin H. 2013. "How have banks adjusted to higher capital requirements?" BIS Quarterly Review, September.
Cohen, Benjamin H, and Michela Scatigna. 2015. "Banks and capital requirements: channels of adjustment." Journal of Banking & Finance (Elsevier).
Conley, Timothy G, and Christopher R Taber. 2011. "Inference with “difference in differences” with a small number of policy changes." The Review of Economics and Statistics (MIT Press) 93 (1): 113-125.
Copeland, Adam, Antoine Martin, and Michael Walker. 2014. "Repo Runs: Evidence from the Tri-party Repo Market." Journal of Finance.

36
Demirguc-Kunt, Asli, and Harry Huizinga. 2010. "Bank activity and funding strategies: The impact on risk and returns." Journal of Financial Economics (Elsevier) 98 (3): 626-650.
Duffie, Darrell. 2016. "Financial regulatory reform after the crisis: An assessment." Stanford University Working Paper.
Federal Reserve Board, Federal Deposit Insurance Corporation, and Office of the Comptroller of the Currency. 2012. Regulatory Capital Rules: Regulatory Capital, Implementation of Basel III, Minimum Regulatory Capital Ratios, Capital Adequacy, Transition Provisions, and Prompt Corrective Action. Vol. 77. Federal Register 52810.
Francis, William B, and Matthew Osborne. 2010. "On the Behavior and Determinants of Risk-Based Capital Ratios: Revisiting the Evidence from UK Banking Institutions*." International Review of Finance (Wiley Online Library) 10 (4): 485-518.
Gauthier, Celine, Alfred Lehar, and Moez Souissi. 2012. "Macroprudential capital requirements and systemic risk." Journal of Financial Intermediation (Elsevier) 21 (4): 594-618.
Gertler, Mark. 2010. "Banking crises and real Activity: Identifying the Linkages." International Journal of Central Banking 6 (4).
Gorton, Gary B, and Andrew Winton. 2014. "Liquidity Provision, Bank Capital, and the Macroeconomy." Available at SSRN.
Gropp, Reint, and Florian Heider. 2010. "The determinants of bank capital structure*." Review of Finance (Oxford University Press).
Haldane, Andrew. 2012. "The Dog and Frisbee," speech at the Federal Reserve Bank of Kansas City's Economic Policy Symposium, Jackson Hole, Wyoming.
Hanson, Samuel G, Anil K Kashyap, and Jeremy C Stein. 2011. "A Macroprudential Approach to Financial Regulation." The Journal of Economic Perspectives (American Economic Association) 25 (1): 3.
Kashyap, Anil K, Jeremy C Stein, and Samuel Hanson. 2010. "An analysis of the impact of ‘substantially heightened’capital requirements on large financial institutions." Booth School of Business, University of Chicago.
Kashyap, Anil K, Raghuram Rajan, and Jeremy C Stein. 2008. "Rethinking capital regulation." Proceedings of the Federal Reserve Bank of Kansas City's Economic Policy Symposium, Jackson Hole, Wyoming. 431-471.
Kiema, Ilkka, and Esa Jokivuolle. 2014. "Does a leverage ratio requirement increase bank stability?" Journal of Banking & Finance (Elsevier) 39: 240-254.
Kisin, Roni, and Asaf Manela. 2015. "The shadow cost of bank capital requirements." Available at SSRN 2280453.

37
Laeven, Luc, and Ross Levine. 2009. "Bank governance, regulation and risk taking." Journal of Financial Economics (Elsevier) 93 (2): 259-275.
Mariathasan, Mike, and Ouarda Merrouche. 2014. "The manipulation of Basel risk-weights." Journal of Financial Intermediation (Elsevier) 23 (3): 300-321.
Munyan, Benjamin. 2015. "Regulatory Arbitrage in Repo Markets." Office of Financial Research Working Paper no. 15-22.
Stock, James, and Mark Watson. 2003. ""Forecasting Output and Inflation: The Role of Asset Prices." Journal of Economic Literature XLI: 788-829.
Swanson, Eric T, and John C Williams. 2014. "Measuring the Effect of the Zero Lower Bound on Medium-and Longer-Term Interest Rates." The American Economic Review (American Economic Association) 104 (10): 3154-3185.
Valukas, Anton R. 2010. "Lehman Brothers Holdings Inc. Chapter 11 Proceedings Examiner’s Report." U.S. Bankruptcy Court for the Southern District of New York, Jenner and Block LLP.
Van den Heuvel, Skander J. 2008. "The welfare cost of bank capital requirements." Journal of Monetary Economics (Elsevier) 55 (2): 298-320.
VanHoose, David. 2007. "Theories of bank behavior under capital regulation." Journal of Banking & Finance (Elsevier) 31 (12): 3680-3697.

38
Appendix
Table 8. Supplementary Leverage Ratio Longer-Term Effect on Changes in Dealer Repo Portfolio Composition
(1) (2) (3) (4) (5) Daily Change in Repo Borrowing Backed By:
All Collateral (Total Repo)
U.S. Treasury Securities (%)
Agency MBS (%)
Equities (%)
Corporate Bonds (%)
𝟙𝟙SLR Policy Announced,t -28.71 -0.000384** 0.000414*** 0.000154** -0.000181*** x 𝟙𝟙US SLR Bank,i
(26.13) (0.000174) (0.000117) (6.83e-05) (5.37e-05)
US SLR Bank Below -340.4*** 3.96e-05 -0.00128*** 0.000343** 0.000333*** Thresholdt
(83.67) (0.000594) (0.000376) (0.000149) (6.26e-05)
US SLR Controlt 17.60 6.88e-05 0.000370*** -7.66e-05 -0.000229***
(39.03) (0.000212) (0.000118) (9.62e-05) (4.17e-05)
FBO Below Thresholdt -93.71* -0.000137 9.12e-05 -6.29e-05 -1.91e-05
(52.90) (0.000206) (0.000297) (8.80e-05) (2.48e-05)
FBO SLR Controlt 28.02*** 8.73e-05** 5.22e-05 8.95e-06 -2.08e-05
(4.568) (3.36e-05) (3.22e-05) (6.86e-06) (2.66e-05)
𝟙𝟙SLR Policy Announced,t 42.59*** 1.63e-05 0.000206 -7.92e-05*** -9.04e-05* x 𝟙𝟙Nonbank,i
(4.960) (0.000235) (0.000262) (2.15e-05) (5.18e-05)
Constant 2.286 4.04e-05 -2.31e-05 -8.62e-07 -1.12e-06 (7.220) (6.34e-05) (6.92e-05) (1.74e-05) (1.50e-05) Observations 57,169 57,169 57,169 57,169 57,169 Marginal R-squared 0.000 0.000 0.000 0.000 0.000 Number of Dealers 78 78 78 78 78 AR Term 1 1 1 1 1 Dealer FE Y Y Y Y Y Quarter-Year FE Y Y Y Y Y Macro Controls Y Y Y Y Y
Robust standard errors in parentheses *** p<0.01, ** p<0.05, * p<0.1
First-Differenced Dependent Variable and Lags Dynamic One-Sided Treatment, Steady State (Phase 2)
PORTFOLIO COMPOSITION (Columns 2-5)
Source: Authors’ analysis

39
Changes in Levels regression residuals

40
Changes in Logs regression residuals – note fat tails


![Triparty Collateral Management - ecb.europa.eu · Harmonisation proposal under consideration [TBC]. 11 Rejection of Decrease Instruction There is a need to implement harmonised messaging](https://img.dokumen.tips/doc/110x75/5d665a4488c993613a8b56bd/triparty-collateral-management-ecb-harmonisation-proposal-under-consideration.jpg)


