Embed Size (px)
Citation preview

Purdue UniversityPurdue e-Pubs
RCHE Publications Regenstrief Center for Healthcare Engineering
8-1-2008
Do GPOs Promote or Stifle Competition inHealthcare-Product Supply Chains?Qiaohai HuPurdue Krannert School of Management, West Lafayette, IN
Leroy B. SchwarzPurdue Krannert School of Management, West Lafayette, IN; Regenstrief Center for Healthcare Engineering, Purdue University,West Lafayette, IN
Follow this and additional works at: http://docs.lib.purdue.edu/rche_rp
This document has been made available through Purdue e-Pubs, a service of the Purdue University Libraries. Please contact [email protected] foradditional information.
Hu, Qiaohai and Schwarz, Leroy B., "Do GPOs Promote or Stifle Competition in Healthcare-Product Supply Chains?" (2008). RCHEPublications. Paper 55.http://docs.lib.purdue.edu/rche_rp/55

Do GPOs Promote or Stifle Competition inHealthcare-Product Supply Chains?
Qiaohai (Joice) Hu • Leroy B. Schwarz •Purdue Krannert School of Management, West Lafayette, IN 47906, USA
[email protected] • [email protected] •
This paper uses economic modeling to examine the controversial role that Group Purchas-ing Organizations (GPOs) play in the supply chains for healthcare products. Among thecontroversies, perhaps the most fundamental one is whether or not GPO-contracted pricesare the lowest available. However, the fiercest controversy is around the “Contract Admin-istration Fees (CAFs)” that GPOs charge to manufacturers. We examine these and othercontroversies using a Hotelling duopoly model. Among our conclusions: GPOs increase com-petition between manufacturers and lower prices for healthcare providers. However, GPOsreduce manufacturers’ incentives to innovate. We also demonstrate that the existence oflower off-contract prices is not, per se, evidence of anticompetitive behavior on the part ofGPOs. Indeed, we demonstrate that, under certain circumstances, the presence of a GPOlowers off-contract prices. We also examine the consequences of eliminating the “safe harbor”provisions, and conclude that it would not affect any party’s profits or costs.
1. Introduction
GPOs play a very significant - and very controversial - role in the supply chains for healthcare
products. A 2005 study conducted for the Health Industry Group Purchasing Association
(HIGPA) reported that 72-80% of every healthcare dollar (in an acute care setting) is ac-
quired through group purchasing.1 More recently, Burns and Lee (2008) reported that nearly
85% of hospitals route 50% or more of their commodity-item spending through GPOs, and
80% of hospitals route 50% or more of their pharmaceutical spending through GPOs.
Moreover, GPO purchasing power is highly concentrated: According to a 2003 GAO
study2, the seven largest GPOs account for over 85% of hospital purchases made through
GPO contracts, and the two largest GPOs account for approximately two-thirds of total
1Muse & Associates: “A Cost Savings and Marketplace Analysis of the Healthcare Group PurchasingIndustry.”
2GPO Report (GAO-03-998T, July 16, 2003) Statement for the Record by Marjorie Kanof, Director,Health care-Clinical and Military Health Care Issues.
1
GPO purchasing volume for all medical products. In 2007, Modern Healthcare reported that
the largest GPO, Novation, contracted for over 2, 400 hospitals and 30, 000 alternative sites,
with 2006 purchasing volume of over $ 33 Billion.
What makes the role of GPOs controversial is neither the significance of the role they
play in healthcare-product supply chains nor the concentration of their purchasing power,
per se. Instead, the controversies involve the fees they charge to manufacturers, some of the
business practices they employ, and, ultimately, whether GPOs promote or stifle competition
in the markets for healthcare products.
In this paper we briefly describe the role of GPOs in healthcare-product supply chains
and summarize some of the criticisms about them. Then, we examine these criticisms using
a Hotelling model. Our analysis concludes that healthcare GPOs promote competition in
some ways but stifle competition in others.
Group purchasing organizations (GPOs) negotiate the prices that their “provider-members”
pay for products they purchase “on contract”, either direct from manufacturers or through
healthcare-product distributors. The rationale for healthcare providers to belonging to a
GPO is that they will incur lower total cost of ownership (TCOO) by purchasing “on con-
tract” through a GPO than they might obtain for themselves. In our analysis, we represent
the TCOO as the purchasing costs of product plus the overhead costs, i.e., the “contracting”
costs associated with their procurement. GPOs position themselves to offer lower TCOO
through a combination of product expertise over a wide range of products and the combined
buying power of their members.
GPOs earn revenue from several sources: Contract Administration Fees (CAFs) charged
to manufacturers, membership fees charged to provider-members, administrative fees charged
to distributors authorized to distribute products to provider-members on-contract, and mis-
cellaneous fees for services. The most common, most significant, and most controversial
source of GPO revenue is the Contract Administration Fee (CAF). This is a revenue-sharing
mechanism, nominally set at 3% of each manufacturer’s contracted sales.
Although revenue-sharing contracts are commonly used elsewhere (e.g., real estate, mu-
tual funds), such revenue-sharing in healthcare had been specifically outlawed under the
“anti-kickback” statute of the Social Security Act. However, in 1987, partly to facilitate the
growth of GPOs, the Social Security Act was amended to create “safe-harbor provisions”
that protect healthcare GPOs from prosecution under the anti-kickback statute. In brief,
these provisions require GPOs to limit CAFs to an average of 3% or, in the case of excep-
2
tions, to inform members of the amount or percentage of any CAFs in excess of 3%, the
products to which they apply, and the manufacturers who receive them.
Many of the criticisms about healthcare GPOs are linked to CAFs. For example, manu-
facturers complain that they are forced to charge higher prices for all products - whether they
are sold on or off contract - in order to recover the CAFs they pay to GPOs for on-contract
sales. Others assert that the elimination of the “safe-harbor” provisions, which allow GPOs
to charge CAFs to manufacturers, would either yield large cost savings to providers and/or
payers. Here are two excerpts.
“The elimination of the safe harbor would be revenue neutral under the most
conservative assumptions; and would generate large savings for the federal gov-
ernment under more realistic assumptions.”3
According to Sethi (2006),
“Based on our analysis of the total revenue generated by the GPOs, their
operating margins, and a careful assessment of their expenses, it is estimated
that GPOs generate excess annual revenue in the range of $5 billion to $6 billion,
which legitimately belongs to their member hospitals since they are the ones who
actually paid for it.”
Another criticism about GPOs revolves around whether or not GPOs’ on-contract prices
are, in fact, the lowest prices available. A pilot study on GPO4 prices conducted for the
US Senate Subcommittee on Antitrust, Competition, and Business and Consumer Rights
concluded that a hospital’s use of a GPO contract did not guarantee that the hospital saved
money: GPOs’ prices were not always lower but often higher than prices paid by hospitals
negotiating with vendors directly.
Another criticism about GPOs is that they pose a barrier to entry for small firms.5 Yet
another is about product innovation and quality; i.e., that the contract relationship between
GPOs and manufacturers blocks or slows the introduction of newer, better products. One of
many such examples is the Masimo case. Masimo, a maker of pulse oximeters did not have
contracts with Premier ro Novation (two of the largest GPOs) because both have awarded
3www.criterioneconomics.com/pubs4GAO report (GAO-02-690T, April 30,2002) Group Purchasing Organizations: Pilot Study Suggests
Large Buying Groups Do Not Always Offer Hospitals Lower Prices.5GAO report(GAP-03-998T, July 16,2003) Group Purchasing Organizations: Use of Contracting
Processes and Strategies to Award Contracts for Medical-Surgical Products.
3

“sole source” contract to Necllor. Thus hospitals were given strong incentives to purchase
from Nellcor although Masimo’s product was considered by doctors to be a better product
than Nellcor’s. In March 2005, a jury awarded Masimo Corp. $140 million in damages in
a dispute over a loyalty discount offered by the leading manufacturer of pulse oximeters,
Nellcor, although the case remains in litigation.6
The GPO industry takes these criticisms seriously, and has responded with a series of
commissioned reports and white papers, arguing that GPOs reduce prices and are procom-
petitive. More recently, Burns and Lee (2008) conducted an independent survey of GPO
members and conclude that GPOs do help contain rising health care costs by reducing prod-
uct prices in two ways: (1) through pooled purchasing leverage of hospitals buying products
on nationwide contracts and (2) through the establishment of price ceilings in these contracts
beneath which hospitals negotiate on their own.
To date, the “cases” either for and against GPOs have been based either on surveys or
macro-economic scenario analysis. Using these as background, in what follows we develop
and analyze several economic duopoly models involving GPOs, manufacturers, and providers
to address the controversial roles of the GPO. Our analysis leads to the following insights
into the controversial roles of the GPOs:
• The existence of a GPO increases competition between the manufacturers and lowersprices for healthcare providers.
• Asymmetry in providers’ preference for similar products does not affect the resultssummarized above;.
• The GPO lowers the manufacturers’ incentive to innovate their products.
• If the manufacturers could choose to sell on-contract or off-contract, then at equilib-rium, two cases can arise: both sell on-contract, or one manufacturer sells on-contract
and the other sells off-contract. In the latter case, the off-contract price might be lower
than the on-contract price.
• Eliminating CAFs and having providers pay for GPOs’ contracting services would haveno effect on any party’s profit or costs.
6http://www.nellcor.com/legal/antitrust.aspx
4

The remainder of this paper is organized as follows: §2 introduces related literature,§3 presents the basic model, §4 studies whether the presence of the GPO lowers the prices,§5 endogenizes the manufacturers’ decision on whether to sell off-contract or on-contract.§6 explores whether the presence of GPO promotes or hinders product innovation, and §7examines whether removing the “safe harbor” provisions improves’ any party’s, profits or
costs. Finally, §8 summarizes and concludes.
2. Literature
By forming a purchasing group, the dispersed buyers can act strategically in negotiating
with manufacturers and therefore achieve better prices. The forming of the GPO enables the
GPOs or the manufacturers to employ three types of common contracts: exclusive dealing,
nonlinear pricing, or revenue sharing.
One strand of economics literature examines the effects of competition among man-
ufacturers when buyers form a GPO to commit to purchasing exclusively from one of the
manufacturers. O’Brien and Shaffer (1997) show that buyers can obtain lower prices through
both nonlinear pricing and sole sourcing, which intensify competition between the rival sup-
pliers. Dana (2003) extends O’Brien and Shaffer (1997) by endogenizing the decisions of
buyers to form groups. He shows that if the GPO commits to purchasing exclusively from
one supplier, then the buyers obtain a lower price, one that is equal to the suppliers’ mar-
ginal costs. Marvel and Yang (2008) study a similar problem, assuming that: (1) the GPO’s
interests are aligned with the buyers and thus seeks to minimize the buyers’ total purchasing
costs; and, that (2) the sellers have the bargaining power, offering take-or-leave it nonlinear
pricing tariffs to the GPO. Different from Dana (2003), their GPO cannot identify individ-
ual providers’ utility value. They demonstrate that the competition-intensifying effect of the
nonlinear tariff, not the GPO’s bargaining power, lowers the GPO’s purchasing price since
the sellers have the bargaining power in their model.
However, none of the above papers address the CAFs, i.e., the revenue-sharing contracts
that are used by healthcare GPOs. Our models include CAFs, and one of the questions we
examine is whether or not the “safe harbor” provisions that allow them, should be eliminated.
Like Marvel and Yang (2008), we employ the Hotelling model. However, in recognition
of the purchasing power of healthcare GPOs, we model the GPO as the Stackelberg leader.
Like Marvel and Yang (2008), we show that the GPO intensifies the competition between
5

the rival manufacturers, and, therefore, lowers prices. In addition, our model captures the
transaction efficiency enabled by GPOs: an important rationale for the existence of GPOs
in U.S. healthcare supply chain. As Marvel and Yang (2008), we prove that asymmetry
in preferences doe not affect the price advantage of the GPO. However, because of the
bargaining power is in the GPO instead of in the manufacturers, the manufacturers’ profits
in our models are smaller than those in Marvel and Yang (2008); and as a result, the
providers’ costs in our model are smaller than those in Marvel and Yang (2008).
We draw the opposite conclusion from Marvel and Yang (2008) on the effect of the
GPOs on innovation: we conclude that the presence of the GPO stifles the manufacturers’
incentives to innovate. This contrasting result is caused by the different power structurer
that we assume. In Marvel and Yang (2008), the manufacturers employ nonlinear pricing
to negotiate with the GPO, thereby acting as the Stackelberg leader. O’Brien and Shaffer
(1997) and Dana (2003) also model the GPO as the leader.
The scope of GPOs is not limited to healthcare supply chain. For example, grocery,
furniture retailers and hospitality all purchase through GPOs to improve their bargaining
powers and thereby to save purchasing costs. However, different from healthcare industry
where demand is inelastic to prices, members of these GPOs compete with each other, and
therefore, the total market size depends on competing members’ prices. As a result, whether
forming a GPO benefits its member also depends on the demand price elasticity. Assuming
that a monopoly manufacturer who offers a linear quantity discount to competing retailers,
Chen and Roma (2008) identify the conditions under which a GPO will form.
Wang, Jiang and Shen (2004), who study channel performance under revenue-sharing-
based consignment selling, is loosely related to our paper. In a single manufacturer-retailer
setting, the manufacturer determines selling price and quantity, and the retailer who incurs
partial channel distribution costs charges a share of sales revenue. They characterize channel
performance under multiplicative and additive demand functions.
3. The Model
We employ the Hotelling model of horizontal differentiation. Two manufacturers offer com-
peting but not identical products. A continnum of healthcare providers are distributed
uniformly with density 1 along the interval [0, 1], with manufacturer 1 located at the 0 point
and manufacturer 2 located at the 1 point. All providers are assumed to be willing to pay
6
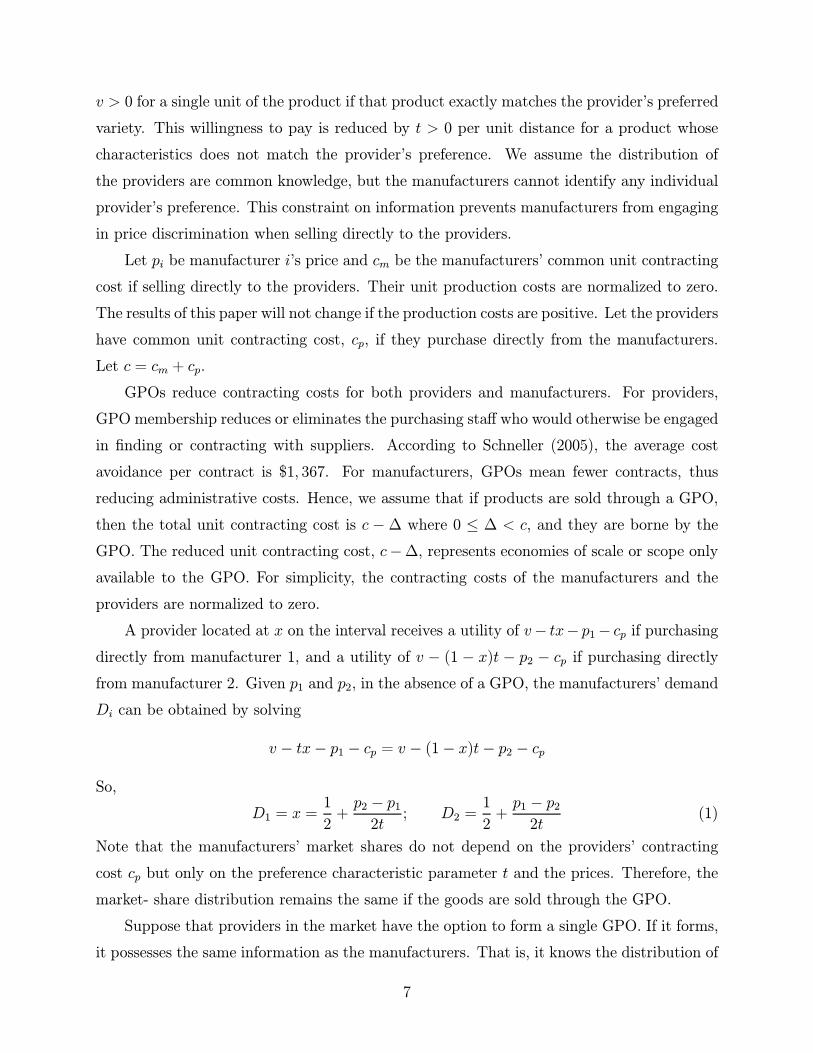
v > 0 for a single unit of the product if that product exactly matches the provider’s preferred
variety. This willingness to pay is reduced by t > 0 per unit distance for a product whose
characteristics does not match the provider’s preference. We assume the distribution of
the providers are common knowledge, but the manufacturers cannot identify any individual
provider’s preference. This constraint on information prevents manufacturers from engaging
in price discrimination when selling directly to the providers.
Let pi be manufacturer i’s price and cm be the manufacturers’ common unit contracting
cost if selling directly to the providers. Their unit production costs are normalized to zero.
The results of this paper will not change if the production costs are positive. Let the providers
have common unit contracting cost, cp, if they purchase directly from the manufacturers.
Let c = cm + cp.
GPOs reduce contracting costs for both providers and manufacturers. For providers,
GPO membership reduces or eliminates the purchasing staff who would otherwise be engaged
in finding or contracting with suppliers. According to Schneller (2005), the average cost
avoidance per contract is $1, 367. For manufacturers, GPOs mean fewer contracts, thus
reducing administrative costs. Hence, we assume that if products are sold through a GPO,
then the total unit contracting cost is c −∆ where 0 ≤ ∆ < c, and they are borne by the
GPO. The reduced unit contracting cost, c−∆, represents economies of scale or scope onlyavailable to the GPO. For simplicity, the contracting costs of the manufacturers and the
providers are normalized to zero.
A provider located at x on the interval receives a utility of v− tx− p1− cp if purchasingdirectly from manufacturer 1, and a utility of v − (1 − x)t − p2 − cp if purchasing directlyfrom manufacturer 2. Given p1 and p2, in the absence of a GPO, the manufacturers’ demand
Di can be obtained by solving
v − tx− p1 − cp = v − (1− x)t− p2 − cp
So,
D1 = x =1
2+p2 − p12t
; D2 =1
2+p1 − p22t
(1)
Note that the manufacturers’ market shares do not depend on the providers’ contracting
cost cp but only on the preference characteristic parameter t and the prices. Therefore, the
market- share distribution remains the same if the goods are sold through the GPO.
Suppose that providers in the market have the option to form a single GPO. If it forms,
it possesses the same information as the manufacturers. That is, it knows the distribution of
7

its members’ preference but does not know each member’s individual preference. The GPO
incurs unit contracting cost c − ∆, described above; and it is in a position to offer a take-or-leave-it contract to each manufacturer. The contract stipulates a contract administrative
fee (CAF): for each unit of product that is sold at price pi, manufacturer i receives λipi and
the GPO receives (1 − λi)pi where 0 < λi < 1. If the manufacturers decline the offer, the
game is over, and they receive zero profit. If they accept the offer, then they engage in a
pricing game, each getting a share of the market and sales revenue. We assume that the
GPO’s interest is aligned with the providers’ interest, thus expecting revenue just enough to
cover its costs. If the GPO expects a certain level of return on its costs, we indicate, later
in the analysis, how it can be accommodated.
If the providers do not form a GPO and purchase directly from the manufacturers,
then the contracting costs cm and cp are borne by the manufactures and the providers,
respectively. The manufacturers engage in pricing game and receive 100 % of the revenues
from their respective share of market.
4. Do GPOs Yield Lower Prices?
4.1 Symmetric Preference
We first assume that two identical manufacturers compete for business from the providers,
each located at the two end points of the interval [0, 1] of the Hotelling model. We will
examine and compare the equilibrium prices with and without the GPO.
4.1.1 Direct Purchase
In the absence of the GPO, manufacturer i chooses pi to maximize its profit,
(pi − cm)Di = (pi − cm)(12+pj − pi2t
) (i, j = 1, 2; i = j)
The FOC (first order condition) of above equation with respect to pi yields
t+ (pj − pi)− (pi − cm) = 0
Therefore, at equilibrium, p1∗ = p2∗ = p∗ = t+ cm, D1 = D2 = 1/2, and each manufacturer
earns π1∗ = π2∗ = π∗ = t/2. In order to ensure full market coverage, the provider located at
the center of the unit interval must have a nonnegative utility at the equilibrium. That is,
v − p∗ − cp − t/2 ≥ 0, which is equivalent to v ≥ 3t/2 + c.
8

Let s∗ be the providers’ total costs under direct purchase. Then
s∗ =x
0
(p1 + cp − v + t )d +1−x
0
(p2 + cp − v + t )d
= 21/2
0
(t+ c+ t )d
= 5t/4 + c− vThe first component represents the utility loss of buying a less desirable product, the second
term is the total channel contracting costs, and the last term is the utility gain of obtaining
the products. So the contracting costs are all borne by the providers in the absence of the
GPO. The total channel surplus is
−s∗ + 2π∗ = v − t/4− c
The following lemma summarizes the result.
Lemma 1. In the absence of the GPO, at equilibrium,
(a) Each manufacturer sells to 1/2 of the market at price t+ cm and earns t/2.
(b) The providers total costs are 5t/4 + c− v.
(c) The total channel surplus is v − t/4− c.
The selling price is increasing in cm, a well-known result that unit production costs
soften Betrand-Nash competition under linear pricing.
4.1.2 Purchase Through the GPO
We now show that if the providers form a GPO who offers a contract to each manufacturer, all
the channel contracting costs are transferred to the manufacturers; and so the manufacturers
compete with each other as if their contracting costs were zero. Let superscript ‘G’ represent
that products are sold through the GPO. Let λi the manufacturer i’s CAF, and πGi be
manufacturer i’s profit from selling its product through the GPO. In the duopoly game,
manufacturer i chooses pi to maximize
πGi = λipiDi = λipi(1
2+pj − pi2t
) (2)
The FOC of (2) with respect to pi yields
t+ pj − 2pi = 0
9

So p1∗ = p2∗ = pG∗ = t and D1 = D2 = 1/2.
In order for the GPO to break-even,
pG∗ (1− λ)− (cm + cp −∆) = 0 (3)
must hold. So
λi = [pG∗ − (cm + cp −∆)]/pG∗ = [t− c+∆)]/t
Note that if the GPO requires a return of r on its costs, c−∆, then λi = [t−(1+r)(c−∆)]/t.Note that in order to ensure λi > 0, which guarantees a nonnegative profit for each
manufacturer, t > c−∆. Substituting λi into (2) yields
πG1∗ = πG2∗ = πG∗ =p1λi2= [t− (c−∆)]/2
The providers’ aggregated costs are
sG∗ =x
0
(p1 + t − v)d +1−x
0
(p2 + t − v)d = 21/2
0
(t+ t )d = 5t/4− v
The total channel surplus is
−sG∗ + 2πG∗ = v − t/4− (c−∆)
Let θ = c−∆. The result are summarized as follows.
Lemma 2. In the presence of the GPO, at equilibrium,
(a) Each manufacturer sells to 1/2 of the market at the price t and earns (t− θ)/2.
(b) The providers’ total purchasing costs are 5t/4− v.
(c) The total channel profit is v − t/4− θ.
It is well known that production costs, here contracting costs, soften the Bertrand-Nash
competition with linear prices. The CAF contract, under which the manufactures obtain λ∗
share of revenue, induces the manufacturers to compete as if their contracting costs were
zero, thus lowering the equilibrium price to t/2.
10

4.1.3 Comparison
Comparing the equilibrium points with GPO and without GPO leads to the following con-
clusions.
Proposition 1. In the presence of the GPO, at equilibrium,
(a) Each manufacturer’s price decreases by cm, and its profit decreases by θ/2;
(b) The providers’ total costs decrease by c;
(c) The total channel surplus increases by ∆.
We have assumed that the GPO’s interests are completely aligned with the providers’,
thus expecting zero return. If the GPO expects some level of profit, our model can accom-
modate this change in two ways. First, the right side of (3) can be replaced by a positive
number as aforementioned. In other words, the GPO would charge each manufacturer a
larger CAF. The equilibrium price will not change since it is independent of λi. Neither will
the providers’ purchasing costs. Second, because the GPO reduces the providers’ cost by c,
the GPO could charge the providers a fixed fee in the form of membership fee. Some GPOs
do so. As long as the total membership fees are lower than c, the providers still benefit from
the presence of the GPO. Thus they have incentives to form the GPO.
4.2 Asymmetric Preference
In many setting, providers’ preferences for the products are asymmetric. Physicians may
prefer one manufacturer’s product to the other’s. Some established manufacturers may have
longer relationship with providers, thus having “brand” advantage over its competitors.
Manufacturers may also employ marketing strategies to shift or reshape providers’ prefer-
ences. To capture such situations, we now generalize our models to deal with cases wherein
providers’ preferences are shifted in favor of one of the two competing manufacturers.
As in §4.1, the providers remain uniformly distributed over the unit interval, but theirwillingness to pay for the product of one of the manufacturers, taken arbitrarily to be manu-
facturer 1, is increased by a factor δ > 0. Manufacturer 1 can be seen as the more established
firm, while manufacturer 2 is a new entrant. So v+δ is the reservation price for manufacturer
1’s product for a provider located at x = 0.
11
As in the previous subsection, the market share can be derived as follows: a provider
located at x on the unit interval is indifferent to buying a product from either manufacturer,
v + δ − tx− cp − p1 = v − (1− x)t− cp − p2 (4)
so
D1(p1, p2) = x =1
2+p2 − p1 + δ
2t
D2(p1, p2) = 1− x = 1
2+p1 − p2 − δ
2t
If the providers purchase through a GPO, then cp disappears from both sides of (4). Hence,
the market-share distribution remains the same.
4.2.1 Direct Purchase
If the providers purchase directly from the manufacturers, each manufacturer i chooses pi to
maximize its expected profit.
π1 = D1(p1 − cm) = 1
2+p2 − p1 + δ
2t(p1 − cm) (5)
π2 = D2(p2 − cm) = (12+p1 − p2 − δ
2t)(p2 − cm) (6)
Solving the FOCs of above equations with respect to p1 and p2, respectively, yields equilib-
rium prices
p1∗ = t+ cm + δ/3 p2∗ = t+ cm − δ/3 (7)
So the equilibrium market shares are
D1 = x =1
2+
δ
6tD2 = 1− x = 1
2− δ
6t(8)
Hence, for manufacturer 2 to obtain a market share, δ < 3t. The manufacturers’ expected
profits at equilibrium are
π1∗ =(3t+ δ)2
18tπ2∗ =
(3t− δ)2
18t
The favored manufacturer charges a higher price and obtains a larger market share and,
therefore, makes greater profit than its rival. The manufacturers’ total profits are
t+δ2
9t
12

The providers’ total costs are
s∗ =x
0
(p1 + t + cp − v − δ)d +1−x
0
(p2 + t + cp − v)d
=
12+ δ6t
0
(t+ c+δ
3+ t )d +
12− δ6t
0
(t+ c− δ
3+ t )d
=5t
4+5δ2
36t+ c− v
The total channel surplus is
π1∗ + π2∗ − s∗ = v − t4− δ2
36t− c
The results are summarized as follows.
Lemma 3. In the absence of the GPO, at equilibrium,
(a) Manufacturer 1 sells to 12+ δ
6tof the market at the price t+ cm + δ/3 and earns (3t+δ)2
18t.
(b) Manufacturer 2 sells to 12− δ
6tof the market at the price t+ cm− δ/3 and earns (3t−δ)2
18t.
(c) The providers’ total costs are 5t4+ 5δ2
36t+ c− v.
(d) The channel total surplus are v − t4− δ2
36t− c.
Compared with the symmetric game without GPO, the providers’ costs increase by
5δ2/(36t), manufacturer 1’s profit increases by δ/3 + δ2/(18t), and manufacturer 2’s profit
decreases by δ/3 − δ2/(18t). The profit gain of manufacturer 1 is due to its competitive
advantage against manufacturer 2 because of the increase of the providers’ willingness to
pay for its product. Surprisingly, the total channel surplus decreases by δ2/(36t) compared
with the symmetric game without the GPO.
4.2.2 Purchase Through the GPO
Suppose that the providers form a GPO, who offers a take-or-leave-it CAF contract to
each manufacturer. Let λi be manufacturer i’s share of its own sales revenue. Then the
manufacture’s expected profits are
πG1 = λ1p11
2+p2 − p1 + δ
2t(9)
πG2 = λ2p21
2+p1 − p2 − δ
2t(10)
13

Solving the FOCs with respect to pi yields
pG1∗ = t+ δ/3 pG2∗ = t− δ/3 (11)
So the equilibrium prices do not depend on the revenue shares but only on t and δ. The
market share distribution remains the same as (8).
For the GPO to break-even, the following equation must hold
[(1− λ1)pG1∗ − θ]D1 + [(1− λ2)p
G2∗ − θ]D2 = 0 (12)
Since under δ < 3t, each manufacturer takes a positive share of the market. The GPO can
offer a different or the same share of revenue to the manufacturers. We will first assume that
the GPO offers a different revenue share to the manufacturers.
In addition, as in §4.1.2, if the GPO expects a certain level of return, (12) implies that itcan raise λ1 and λ2 to extract profit from the manufacturers, provided that each manufacturer
continues to earn a profit. The equilibrium prices and the providers’ purchasing costs will not
be affected. Additionally, as we will show below, the GPO reduces the providers’ purchasing
costs. Therefore, the GPO can earn a profit by charging the providers’ fixed fees that are
smaller than the cost savings.
Different CAFs
Here we assume that the GPO charges different CAFs on the manufacturers. Since
under δ < 3t, each manufacturer takes a positive market share, i.e., D1 > 0 and D2 > 0.
Thus for (12) to hold, the following must also hold
λ1 =pG1∗ − θ
pG1∗= 1− 3θ
3t+ δ
λ2 =pG2∗ − θ
pG2∗= 1− 3θ
3t− δ
Observe that1− λ11− λ2
=p2∗p1∗
So the proportion of the GPO’s revenue shares from the manufacturers’ revenue is the recip-
rocal of their selling prices. That is, the GPO collects a lower share of revenues from the
favored manufacturer who sells at a higher price. Moreover, for λ2 > 0, 3(t− θ) > δ.
The manufacturers’ expected profits at equilibrium are
πG1∗ =(3t+ δ)2
18t1− 3θ
3t+ δ(13)
πG2∗ =(3t− δ)2
18t1− 3θ
3t− δ(14)
14

Each manufacturer makes less profit than if the GPO is not formed. The two manufacturers’
total expected profits are
πG1∗ + πG2∗ = t+δ2
9t− θ
which decreases by θ than that without the GPO.
Uniform CAFs
Here we assume that the GPO offers the same CAF to each manufacturer. Since the
equilibrium prices and market-share distribution are independent of the revenue shares,
letting λ1 = λ2 = λ in (12) leads to
1− λ =9tθ
9t2 + δ2
Therefore, the manufacturers’ expect profits at equilibrium are
π̃1G =
(3t+ δ)2
18tλ =
(3t+ δ)2
18t1− 9tθ
9t2 + δ2(15)
π̃2G =
(3t− δ)2
18tλ =
(3t− δ)2
18t1− 9tθ
9t2 + δ2(16)
Comparison
Interestingly, the total profits of the manufacturers are the same under each CAF scheme
proposed above.
π̃1G + π̃2
G = πG1∗ + πG2∗ = t+δ2
9t− θ
To compare π̃1G and πG1∗, one only needs to compare the second term in the square brackets
of (13) and (15).9tθ
9t2 + δ23t+ δ
3θ=9t2 + 3tδ
9t2 + δ2> 1
because 3t > δ. Therefore, π̃1G < πG1∗. Since the total profit of the manufacturers’ profits
are the same, manufacturer 1 is worse off under the uniform CAFs, manufacturer 2 must
be better off. Hence, if the manufacturers have options to choose between the two schemes,
manufacturer 1 would favor the differentiated CAF scheme over the uniform CAF scheme.
Under the differentiated CAFs, manufacturer 1 obtains a larger share of the revenue than
its competitor. However, the uniform CAF scheme forces manufacturer 1 to share the gain
from its more favorable product with its competitor.
Because the manufacturers’ total profits and the selling prices are the same under either
15

scheme, the providers’ total purchasing costs are also the same.
sG∗ =x
0
(p1 + t − v − δ)d +1−x
0
(p2 + t − v)d
=
12+ δ6t
0
(t− δ
3− v − δ + t )d +
12+ δ6t
0
(t− δ
3+ t − v)d
=5t
4− δ
2− δ2
36t− v
The providers’ traveling costs are the same as those without the GPO. However, the providers
who purchase from manufacturer 1 obtain an additional utility of δ2+ δ2
36tbecause manufac-
turer 1’s product is more appealing.
The total channel surplus under either CAF scheme is
πG1∗ + πG2∗ − sG∗ = v −t
4+5δ2
36t− θ +
δ
2
Thus, in the absence of the GPO, the channel surplus decreases as δ increases. Our results
are summarized as follows.
Lemma 4. If the providers purchase products through the GPO , the asymmetric duopoly
has the following equilibrium.
(a) Under either CAF scheme, manufacturer 1 sells to 12+ δ
6tof the market at the price
t+ δ3, manufacture 2 sells to 1
2− δ
6tof the market at the price t− δ
3.
(b) Under the differentiated CAF scheme, manufacturer 1’s profit is (3t+δ)2
18t(1 − 3θ
3t+δ) and
manufacturer 2’s profit is (3t−δ)218t
(1− 3θ3t−δ ); under the uniform CAF scheme, manufac-
turer 1’s profit is (3t+δ)2
18t(1− 9tθ
9t2+δ2) and manufacturer 2’s profit is (3t−δ)2
18t(1− 9tθ
9t2+δ2);
(c) The providers’ total cost is 5t4− δ
2− δ2
36t− v under either scheme;
(d) The channel’s total surplus under either scheme is v − t4+ 5δ2
36t+ δ
2− θ.
4.2.3 Comparison
So, purchasing through the GPO reduces the providers’ total purchasing cost by δ/2 +
δ2/(6t) + c. In contrast, in the symmetric game, the GPO reduces the providers’ costs by
c. Hence, the preference difference between the manufacturers’ products further intensifies
the competition between the manufacturers and, therefore, further reduces the providers’
16

purchasing costs in the presence of the GPO. The presence of the GPO improves the channel
surplus by
πG1∗ + πG2∗ − sG∗ − (π1∗ + π2∗ − s∗) = δ2
6t+δ
2+∆
Hence, even if ∆ = 0, the channel surplus is greater with the GPO than without it. The
increasing rate of the surplus increases as δ increases. If δ = 0, then the channel profit is
improved by ∆, the same as that in the symmetric duopoly. Hence, the symmetric duopoly
can be treated as a special case of the asymmetric one. The results are summarized as
follows.
Proposition 2. Compared to the equilibrium without the GPO,
(a) Under either CAF scheme, the manufacturers’ market shares are the same as those
without the GPO. However, selling price decreases by cm;
(b) Under the differentiated CAF scheme, manufacturer 1’s profit decreases by θ2+ θδ
6t, and
manufacturer 2’s profit decreases by θ2− θδ
6t;
(c) Under the uniform CAF scheme, manufacturer 1’s profit decreases by θ2+ 3tδθ
9t2+δ2, and
manufacturer 2’s decreases by θ2− 3tδθ
9t2+δ2;
(d) The manufacturers’ total profits decrease by θ under either scheme.
(e) Manufacturer 1 prefers the differentiated CAF scheme to the uniform one,while the op-
posite holds for manufacturer 2. The providers are indifferent between the two schemes;
(f) The providers’ costs decrease by c+ δ2+ δ2
36tunder either scheme;
(g) The total channel surplus increases by δ2
6t+ δ
2+∆ under either scheme.
Whether the GPO is present or not, the manufacturers’ total profits increase at the
rate 2δ9tas δ increases. Although the increase of utility of manufacturer 1’s product allows
it to charge a higher price for those providers who favor its product, the presence of the
GPO unambiguously lowers the providers’ purchasing prices and each manufacturer’s profit.
The favored manufacturer’s profit decreases by a smaller margin than those of less favored
competitor.
The comparison of the manufacturers’ profits also implies that the GPO makes the
prospect of an entry less attractive, assuming that manufacturer 2 is a new entrant who is
17

still building preferences for its product. As the weaker rival in the market, it charges a
lower price and obtains a smaller market share. And the introduction of the GPO further
reduces its profit, thus creating a more intimidating environment than in the symmetric case
analyzed in §4.1.The presence of the GPO lowers the manufacturers’ total profits by θ, a constant inde-
pendent of δ. Thus, one may conjecture that if δ is endogenized, the presence of the GPO
at best will not change, if not lower, the value of δ at equilibrium. This conjecture leads us
to examine the innovation game in §6.
5. Sell On or Off Contract?
Suppose now that each manufacturer is , first, able to choose to sell through the GPO or
directly to the providers. Then, at the second stage, the manufacturers engage in pricing
competition. Three cases arise: both sell off-contract; both sell on-contract, or one of the
manufacturers, taken arbitrarily to be manufacturer 1, sells off-contract and manufacturer
2 sells on-contract. The first two cases have been examined in §4.1. We now examine thethird case: manufacturer 1 sells off-contract and manufacturer 2 sells on-contract.
The market-share distribution is obtained by solving
v − p1 − tx− cp = v − p2 − (1− x)t
The left side of above equation is the surplus of the provider located at x if buying from
manufacturer 1 and its right side is its surplus if buying from manufacturer 2. Note that
buying directly from manufacturer 1 incurs unit contracting costs cp, while buying through
the GPO does not. So
D1 = x =1
2+p2 − p1 − cp
2tD2 = 1− x = 1
2− p2 − p1 − cp
2t(17)
Manufacturer 1’s profit is
π1 = (p1 − cm) 1
2+p2 − p1 − cp
2t
Manufacturer 2’s profit is
πG2 = (p2 − θ)1
2− p2 − p1 − cp
2t
18

5.1 Off-Contract Price v.s. On-Contract Price
The FOCs of the profit functions with respect to the prices yield
p1∗ = t+2cm − cp
3
pG2∗ = t+c
3
Recall that in the case in which both manufacturers sell through the GPO, each manu-
facturer charges price t. Here, manufacturer 1’s decision to sell direct results in manufacturer
2’ price unambiguously increasing by c3, while manufacturer 1’s price is lower than t if and
only if 2cm < cp. Moreover, the off-contract price p1∗ is lower than the on-contract price p2∗
if cm < 2cp.
A comparison of the equilibrium prices is very revealing. If both manufacturers sell
through the GPO, then the manufacturers are forced to compete as if their contracting costs
were zero, which lowers the equilibrium prices to t (which is independent of the unit contract-
ing costs, cm and cp). However, if one manufacturer sells directly, both cm and cp affect the
equilibrium prices. Manufacturer 1’s contracting costs soften the pricing competition, with
manufacturer 1’s price increasing at the constant rate 2/3 relative to cm and its rival’s price
increasing at the lower rate, 1/3. The provider’s contracting cost cp drives manufacturer 1
to lower its price at the constant rate 1/3. Responding strategically, manufacturer 2 raises
its price at the rate 1/3 with respect to cp.
Substituting p1∗ and p2∗ into (17) yields
D1 = x∗ =
1
2− c
6tD2 = 1− x∗ = 1
2+c
6t
Note that manufacturer 1’s market share shrinks compared with the case in which each
manufacturer sells through the GPO or the case in which neither does. To ensure man-
ufacturer 1 a positive market share requires that 3t > c. The manufacturers’ profits at
equilibrium are
π1∗ =(3t− c)218t
(18)
πG2∗ =1
18t(3t+∆)(3t+ c) >
t
2(19)
19

The providers’ total costs are
x
0
(p1 + cp − v + t )d +1−x
0
(p2 − v + t )d
=
12− c6t
0
t+2
3c+ t − v d +
12+ c6t
0
t+1
3c+ t − v d
=5t
4+1
2c− 1
36tc2 − v
The total channel surplus is
π1∗ + πG2∗ − (5t
4+1
2c− 1
36tc2 − v)
= v − t4− 2c3+c2
12t+∆
6+∆c
18t
Recall, from Lemma 2 that if both manufacturers sell on-contract, the total channel surplus
is v − t4− θ.
By Lemma 1, the equilibrium prices without the GPO are p1 = p2 = t + cm, and the
providers’ total costs are 5t/4+cm+cp−v. Hence, the GPO lowers the providers’ purchasingcosts if and only if
t
4− c2− c2
36t=
1
36t[3(t− c)2 − 10c2] < 0
where c = cm + cp. Solving the inequality yields t < (√103+ 1)c. The conclusions are
summarized as follows.
Proposition 3. If one manufacturer sells directly, while its competitor sells through the
GPO, then at equilibrium,
(a) The off-contract price is lower than the on-contract price if cm < 2cp.
(b) The presence of the GPO lowers the providers’ total purchasing costs if and only if
tc<√103.
Recall that the criticism about GPO pricing is bolstered by the evidence that on-contract
prices are not necessarily the lowest available; indeed, off-contract prices are sometimes lower.
We have shown here that off-contract price could be lower than on-contract price. However,
if so, this is because of the GPO. Without the GPO, the off-contract price would be higher.
20

Offcontract
On contract
Off contractOn contract
Offcontract
On contract
Off contractOn contract
Manufacturer 1
Manufacturer 2
⎟⎠⎞
⎜⎝⎛ −−
2 ,
2θθ tt
⎟⎠⎞
⎜⎝⎛
2 ,
2tt
⎟⎟⎠
⎞⎜⎜⎝
⎛ Δ++−ttct
tct
18)3)(3(,
18)3( 2
⎟⎟⎠
⎞⎜⎜⎝
⎛ −Δ++tct
ttct
18)3(,
18)3)(3( 2
Table 1: Selling on-contract or off-contract
5.2 Is Selling On-Contract Better?
In this subsection we demonstrate that if the manufacturers are able to choose to sell on or off
contract, then only two equilibria exist: Either both sell on-contract or one sells on-contract
and the other sells off-contract. We also show that the total profits of the manufacturers are
larger in the latter case.
Using Lemmas 1 and 2 an Proposition 4, the first stage game: selling off contract or
on-contract can be expressed by a 2× 2 matrix where c = cm + cp.If, for each manufacturer, selling on-contract is the best response, given that the com-
peting manufacturer sells on-contract, then the symmetric equilibrium arises: both manu-
facturers sell on-contract. Equivalently, using Table 1, the following inequality must hold.
t− θ
2> (
t
2+c2
18t− c3)
which can be simplified as
∆ >c2
18t+2c
3(20)
For the asymmetric equilibrium to arise, the following two equalities must hold:
∆ <c2
18t+2c
3(21)
and(3t+ c)(3t+∆)
18t>t− θ
2
which always holds.
The equilibrium in which both manufacturers sell off-contract cannot arise because
(3t− c)218t
− t2< 0
21

due to c < 3t. Above inequality also implies that the direct selling manufacturer 1’s profit is
lower when its competitor sells on-contract than when the competitor also sells off-contract.
Using (18) and (19), the manufacturers’ total profits in the asymmetric equilibrium are
t− c6+∆
6= t− θ
6
From Lemma 2, in the equilibrium at which both manufacturers sell on-contract, their to-
tal profits are t − θ. Hence, the manufacturers’ total profit is greater in the asymmetric
equilibrium than in the symmetric one.
Note that Since ∆ < c and t > c/3, so it is more likely that (20) will not hold. In
particular, if ∆ < 2c/3, then (20) does not hold for certainty. And as a result, only the
asymmetric equilibrium can arise.
Proposition 4. If each manufacturer can choose to sell off-contract or on-contract, at equi-
librium,
(a) If ∆ > c2
18t+ 2c
3, the asymmetric equilibrium arises in which one manufacturer sells
on-contract, the other sells off-contract.
(b) Otherwise, both manufacturers will choose to sell through the GPO.
(c) The total profits of the manufacturers are greater in the asymmetric equilibrium than
those in the symmetric equilibrium in which both sell on-contract.
The results provide the following insights into the controversies about on and off contract
buying. First, the presence of GPOs lowers off-contract price. Second, off-contract buying
is not, in and of itself, evidence that GPOs are anti-competitive. Instead, this represents an
equilibrium that maximizes the manufacturers’ total profits.
6. Do GPOs Help Or Hinder Innovation?
One of the charges against GPOs is that they stifle innovation by putting new products in
a disadvantaged competitive position. Here we will examine whether the presence of GPO
promotes or stifles innovation.
Our analysis proceeds as in §4.2 except here we endogenize v1 and v2. Suppose that thebase value of both manufacturer’s product to a provider is v, but each manufacturer can
choose to increase the base value by δi at a cost c(δi), where c(·) is increasing and strictlyconvex. So vi = v + δi. Each manufacturer chooses δi first and then sets its price.
22

6.1 Direct Purchase
Working backward, we will first obtain the pricing subgame, and then the equilibrium of the
innovation game. The equilibrium prices are similar to (7), with δ being replaced by δ1 − δ2for p1 and −δ being replaced by δ2 − δ1,
pi = t+ cm +δi − δj3
(i, j = 1, 2; i = j)
and using (8), manufacturer i’s market share is
Di(pi, pj) =1
2+pj − pi + δi − δj
2t=1
2+δi − δj6t
(i, j = 1, 2; i = j)
Using (5) and (6), manufacturer i’s expected profit is
πi =(3t+ δi − δj)
2
18t− c(δi) (i, j = 1, 2; i = j) (22)
The FOC of (22) with respect to δi yields
1
3+δi − δj9t
= c (δi) (23)
In the symmetric equilibrium, δ∗1 = δ∗2 = δ∗. So at the equilibrium of the innovation game,
1
3= c (δ∗)
6.2 Purchase Through the GPO
Using (9) and (10), the equilibrium prices are
pi = t+δi − δj3
and the market shares do not change with the presence of the GPO. So
Di =1
2+δi − δj6t
We have proved that in §4.2 that the manufacturer whose product is more appealing prefersthe differentiated CAFs to the uniform CAFs. For the GPO to break-even,
λi = 1− θ
t+δi−δj3
23

So manufacturer i’s expected profit is
πGi = λipi1
2+pj − pi + δi − δj
2t− c(δi)
= λi t+δi − δj3
1
2+δi − δj6t
− c(δi)
= t+δi − δj3− θ
1
2+δi − δj6t
− c(δi)
The FOC of πGi with respect to δi yields
1
3+δi − δj9t
− θ
6t= c (δi)
In a symmetric equilibrium, δG1∗ = δG2∗ = δG∗ , where δG∗ satisfies
1
3− θ
6t= c (δG∗ )
So c (δG∗ ) ≤ c (δ∗).The strict convexity of c(·) yields δG∗ ≤ δ∗. For the symmetric equilibrium, the same δG∗
can be achieved if the GPO employs the uniform CAF scheme. Therefore, the introduction
of a GPO does dampen demand-enhancing activities, whether it is promotion or product
innovation.
Proposition 5. Selling through the GPO lowers the manufacturers’ incentives to innovate.
Some theoretical models concur with our results. Inderst and Wey (2003) argue that
buyers’ purchase group dampens a seller’s incentive to innovate, although in a later paper,
Inderst and Wey (2005), the authors obtain the opposite conclusion.
7. Should “Safe Harbor” Provisions for GPOs be Elim-
inated?
In this section we examine the most controversial issue of all: whether or not the “safe
harbor” provisions, which permit GPOs to charge CAFs should be withdrawn, thereby
eliminating CAFs.
We assume that GPOs would continue to exist because of the contracting efficiencies
they provide, but that their providers member would pay the CAFs.
24

Let λ be the CAF charged to the providers. All other settings are the same as in §4.1.Then the market- share distribution can be determined as follows:
p1 + λ1p1 + tx = p2 + λp2 + t(1− x)
Hence,
D1 = x =1
2+(1 + λ)(p2 − p1)
2tD2 = 1− x = 1
2− (1 + λ)(p2 − p1)
2t
And manufacturer 1’s profit is
p1x = p11
2+(1 + λ)(p2 − p1)
2t
Its FOC condition is1
2+(1 + λ)(p2 − p1)
2t− p11 + λ
2t= 0
Let pG0 be the equilibrium price, then
pG0 =t
1 + λ=
t
1 + θpG0
< t
if λ > 0. Solving above equation leads to
pG0 = t− θ λ =θ
t− θ
For λ < 1, t > 2θ. Note that for every unit of the product that the providers purchase, their
actual unit costs are (1 + λ)p = t.
Hence, the providers’ total purchasing costs are the same as those in §4.2, i.e., 5t/4− v.Each manufacturer sells to one half of the market at the price t − θ, but it does not
need to pay the CAFs to the GPO. As a result, it also earns (t − θ)/2, the same as its
counterpart in §4.2. One can also verify that shifting the CAF from the manufacturers to
the providers will induce a lower level of innovation-promotion than if the CAF is charged
to the manufacturers. Hence, merely shifting the CAF does not alter any party’s profit or
costs.
8. Summary
Our models have demonstrated that purchasing through GPOs lower prices for providers.
The price advantage generated by the GPO for the providers arises from two sources: the
25

buying power of the GPO and the intensified competition between the manufacturers cre-
ated by the CAFs. Asymmetry in preference does not alter the price advantage, with the
manufacturer whose product is more appealing obtaining a larger market share and selling
at a higher price. It is worth noting that if the manufacturers’ costs are asymmetric, the
conclusions above remain valid because by Lemma 4, neither the equilibrium prices nor the
market share distribution depends on the manufacturers’ costs.
In addition, we have demonstrated that if the manufacturers could choose to sell through
a GPO or directly, then at equilibrium, two cases occur: both sell through the GPO, or one
sells through the GPO and the other sells directly. Moreover, we find that the presence of
the GPO can cause the off-contract price to be lower than on-contract price.
Despite its price advantages, the presence of the GPO lowers the manufacturers’ incen-
tives to innovate.
Moreover, eliminating “Safe Harbor” provision will not change any party’s profit or cost.
Neither will it resolved the innovation dampening effect of the GPO.
References
Burns, L. R. and Lee, J. A.: 2008, Hospital purchasing alliances: Utilization, services, and
performance, Health Care Management Review 33, 203—215.
Chen, R. R. and Roma, P.: 2008, Group-buying of competing retailers, Working paper.
University of California at Davis.
Dana, J.: 2003, Buyer groups as strategic commitments, Working paper. Northwestern Uni-
versity.
Inderst, R. and Wey, C.: 2003, Bargaining, mergers, and technology choice in bilaterally
oligopolistic indutries, RAND Journal of Economics 34-1, 1—19.
Inderst, R. and Wey, C.: 2005, How strong buyers spur upstream innovation, DIW Berlin
(German Institute for Economic Research) discussion paper 524.
Marvel, H. P. and Yang, H.: 2008, Group purchasing, nonlinear tariffs, and oligopoly, Forth-
coming, International Journal of Industrial Organization.
26

O’Brien, D. P. and Shaffer, G.: 1997, Nonlinear supply contracts, exclusive dealing, and
equilibrium market foreclosure, Journal of Economics & Management Strategy 64, 755—
785.
Schneller, E. S.: 2005, The value of group purchasing in the heathecare supply chain, Arizona
State University, School of Health Management and Policy.
Sethi, S. P.: 2006, Group purchasing organizations: An evaluation of their effectiveness
in providing services to hospitals and their patients, Report No. ICCA-2006.G-01,
www.ICCA-corporatedaccountability.org.
Wang, Y., Jiang, L. and Shen, Z. J.: 2004, Channel performance under consignment contract
with revenue sharing, Management Science 50, 34—37.
27