Embed Size (px)
Citation preview

University of South FloridaScholar Commons
Graduate Theses and Dissertations Graduate School
2-12-2008
Do DIBELS Nonsense Word Fluency ScoresPredict SAT-10 Reading Scores in First Grade? AComparison of Boys and Girls in Reading FirstSchoolsDiane E. NapierUniversity of South Florida
Follow this and additional works at: https://scholarcommons.usf.edu/etd
Part of the American Studies Commons
This Ed. Specalist is brought to you for free and open access by the Graduate School at Scholar Commons. It has been accepted for inclusion inGraduate Theses and Dissertations by an authorized administrator of Scholar Commons. For more information, please [email protected].
Scholar Commons CitationNapier, Diane E., "Do DIBELS Nonsense Word Fluency Scores Predict SAT-10 Reading Scores in First Grade? A Comparison of Boysand Girls in Reading First Schools" (2008). Graduate Theses and Dissertations.https://scholarcommons.usf.edu/etd/423

Do DIBELS Nonsense Word Fluency Scores Predict SAT-10 Reading Scores in
First Grade? A Comparison of Boys and Girls in Reading First Schools
by
Diane E. Napier
A thesis submitted in partial fulfillment
of the requirements for the degree of Education Specialist
Department of School Psychology College of Education
University of South Florida
Co-Major Professor: Kelly A. Powell-Smith, Ph.D. Co-Major Professor: Linda M. Raffaele Mendez, Ph.D.
Professor: Robert F. Dedrick, Ph. D.
Date of Approval: February 12th, 2008
Keywords: formative assessment, gender, differential prediction, bias, reading, nonsense word fluency, SAT-10
© Copyright 2008, Diane E. Napier
Acknowledgements
This project could not have been completed without the support of a
dedicated group of individuals. I am extremely grateful to my professors: Dr.
Kelly Powell-Smith, Dr. Linda Raffaele-Mendez and Dr. Robert Dedrick for their
support with this research. In particular, I thank Dr. Kelly Powell-Smith, who not
only inspired the research, but also gave considerable support with advice on
references, edits and feedback from beginning through to completion of this
research. I would also like to thank the Pasco County School District for their
interest in this project, in particular Amelia Van Name Larson, District Supervisor
for School Psychologists, and also Tammy Berryhill, Principal at Mittye P. Locke
Elementary School, who not only allowed me the time to defend this project
during my Internship year, but who also showed me the relevance of good
research in our current schooling system. Finally, I also acknowledge the
emotional support of my onsite internship supervisor, Tara Davis, M.A., who
encouraged me to continue with the project by acknowledging its importance in
my new role as a school psychologist.

i
Table of Contents
List of Tables iii Abstract v Chapter One: Introduction 1 Overview of Proposed Study 8 Chapter Two: Review of the Literature 11 The Importance of Reading 11 No Child Left Behind 14 DIBELS in Florida 17 Differential Prediction and Bias in Assessments 21 Conceptual Models of Differential Prediction 22 An Empirical Model: Omitted Variables 24 Bias 26 Bias Affecting Civil Law 29 Methodological Measurement of Bias 31 Bias in Curriculum-Based Measurement 32 Ethnic Bias 33 Gender Bias 36 Socioeconomic Status (SES) Bias 40 Previous Research on DIBELS 41 Research using DIBELS as Formative Assessments 42 Research on Reliability, Validity and Predictability of DIBELS 46 Research on Progress Monitoring with DIBELS 48 Nonsense Word Fluency (NWF) 52 NWF as a Diagnostic Problem-solving Tool 52 Reliability, Validity, and Predictability of NWF 55 NWF as a Curriculum and Instruction Evaluation Tool 58 The Current Study 63 Research Questions 64 Chapter Three: Method 66 Reading First 66 Participants and Setting 68 Instrumentation 70 NWF 70 Stanford-10 (SAT-10) 71

ii
Procedure 72 Training of Data Collectors 72 Administration, Scoring and Interpretation of Measures 73 Confidentiality 73 Data Analysis 74 Chapter Four: Results 78 Descriptive Statistics 78 Multiple Regression Analysis 82 Multiple Regression Analysis Examining Gender 82 Multiple Regression Analysis Examining Ethnicity 87 Multiple Regression Analysis Examining the Interaction between Gender and Ethnicity 93 R2 Change Statistics 96 Chapter Five: Discussion 103 Summary of Findings 103 Gender 104 Ethnicity 105 Risk Levels 108 Maturation Effects 109 Testing Conditions 109 Threats to External Validity 110 Population Validity 110 Ecological Validity 112 Implications for Practice and Research 112 Directions for Future Research 114 References 116 Appendix 132 Appendix A: Sample NWF probe 133

iii
List of Tables
Table 1 Descriptive Statistics of Population 69 Table 2 Comparison of Sample to US Census 2000 70 Table 3 Descriptive Statistics of NWF by Group 80 Table 4 Descriptive Statistics of SAT-10 Reading Comprehension by
Group 81 Table 5 Distribution of Risk Groups for each Demographic Group 82 Table 6 Partial Correlation Coefficients between NWF-1 and SAT-10 after controlling for Reduced/Free lunch programs 83 Table 7 Estimated Coefficients for Regression on SAT-10, including
Gender Interaction Terms 84 Table 8 R2 Change for Regression on SAT-10, including Gender
Interaction Terms 85 Table 9 R2 Change for Regression on SAT-10 for High Risk students,
including Gender Interaction Terms 87 Table 10 R2 Change for Regression on SAT-10 for Moderate Risk students, Including Gender Interaction Terms 87 Table 11 R2 Change for Regression on SAT-10 for Low-Risk and Above-
Average Students including Gender Interaction Terms 88 Table 12 Estimated Coefficients for Regression on SAT-10 including
Ethnicity Interaction Terms 89
iv
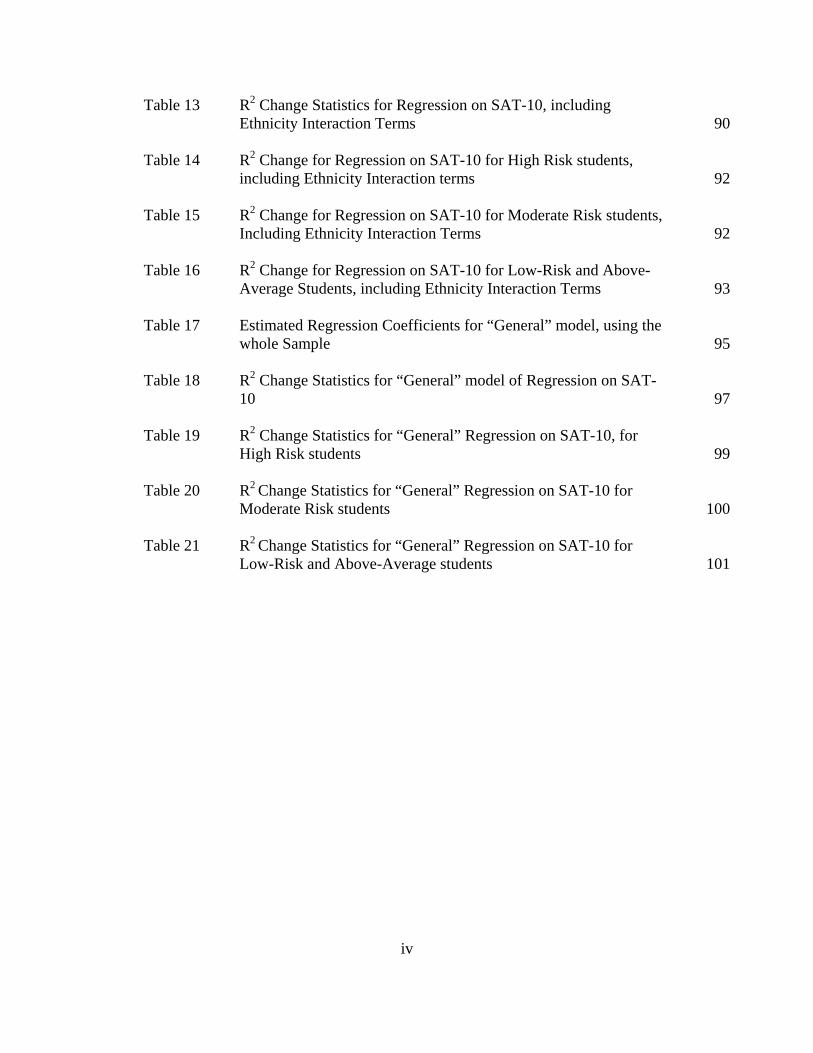
Table 13 R2 Change Statistics for Regression on SAT-10, including Ethnicity Interaction Terms 90
Table 14 R2 Change for Regression on SAT-10 for High Risk students, including Ethnicity Interaction terms 92 Table 15 R2 Change for Regression on SAT-10 for Moderate Risk students, Including Ethnicity Interaction Terms 92 Table 16 R2 Change for Regression on SAT-10 for Low-Risk and Above-
Average Students, including Ethnicity Interaction Terms 93 Table 17 Estimated Regression Coefficients for “General” model, using the
whole Sample 95 Table 18 R2 Change Statistics for “General” model of Regression on SAT-
10 97 Table 19 R2 Change Statistics for “General” Regression on SAT-10, for
High Risk students 99 Table 20 R2 Change Statistics for “General” Regression on SAT-10 for
Moderate Risk students 100 Table 21 R2 Change Statistics for “General” Regression on SAT-10 for
Low-Risk and Above-Average students 101

v
Do DIBELS Nonsense Word Fluency Scores Predict SAT-10 Scores in First
Grade? A Comparison of Boys and Girls in Reading First Schools
Diane E. Napier
ABSTRACT
The purpose of this study was to examine the efficacy of DIBELS Nonsense Word
Fluency Scores in the fall of first grade as a predictor of SAT-10 results. A
comparison of boys and girls, three ethnic groups (Caucasian, Hispanic, African-
American), and three different reading risk groups were examined using multiple
regression analyses. Analysis of data from a total of 27,000 participants from a
cohort of Reading First schools in 2003/2004 confirmed Nonsense Word Fluency
scores in the fall of first grade to be a significant predictor of the SAT-10 reading
scores in the spring. Differences found between and within groups were
determined very small when Cohen’s effect size was calculated. These results
support for the use of Nonsense Word Fluency as a valid and useful early literacy
assessment tool for determining which children likely need early additional
reading instructional support in order to be successful readers.

1
Chapter One
Introduction
Recent research by the National Research Council (1998) found large
achievement gaps in reading between minority groups and Caucasian children,
with an overrepresentation of minority children in special education for reading
problems. The President’s Commission on Excellence in Special Education
(PCESE) (Office of Special Education and Rehabilitative Services [OSERS],
2002) reported that up to 40% of all children served through special education
were merely deficient in exposure to adequate reading instruction, which gave
evidence for inadequate reading instruction. In other words, nearly half of the
children in special education programs in U.S. schools are there because of poor
reading performance due in part to ineffective reading instruction.
Because of the number of children struggling to achieve mastery with basic
literacy skills, there has been considerable research to explain reasons for skill
deficits in prerequisite skills that help enable reading (National Research Council,
1998). Concerns about providing education that promotes effective skill
acquisition for early and continued literacy have been driven by societal demands
for increased academic achievement, parental expectations that schools should
teach every child to read, and government mandates (Rashotte, MacPhee, &
2
Torgesen, 2001). Support for this need to improve reading instruction in schools
has been provided by the final report from the President’s Commission on
Excellence in Special Education (Office of Special Education and Rehabilitative
Services, 2002). Pressure to improve the standard of literacy across the nation has
influenced many areas of school functioning – from teacher training at the
building level, to timetable changes for 90 minute reading slots, and now to
extended curriculum products to support reading skill development.
On January 8th, 2002, President George W. Bush signed into law the No
Child Left Behind Act of 2001 (NCLB, 2001). The purpose of No Child Left
Behind was to use federal law to help bring about stronger accountability for
schools with one goal being to close the achievement gap between disadvantaged,
minority, and majority students. This law has time frames that require schools to
report the achievement of their children disaggregated not only by grade levels
but also by a breakdown of the different demographic groups within the school
including variables such as ethnicity, learning disabilities, and socioeconomic
status. The results are reported to the district level and then to the national level.
Schools are now under pressure to close achievement gaps between various
demographic groups to meet adequate yearly progress (AYP) goals. This
information may be used to determine the level of funding schools receive the
following year.
Scientifically Based Reading Research (SBRR) has led educators to alter
curricula to incorporate 5 Big Ideas shown to be critical early literacy skills:
Phonemic Awareness, Alphabetic Principle, Fluency, Vocabulary, and

3
Comprehension. Considerable research supports the 5 Big Ideas (NRP, 2000;
Armbruster, Lehr, & Osborn, 2001), the component skills in early literacy
acquisition that are now taught in schools as part of a literacy period.
Reading First schools are required to provide a minimum of 90 minutes
of reading instruction every day in grades K-3. All Reading First schools across
the country follow a format of direct instruction followed by independent
seatwork and small group reading activities (NCLB, 2001). The aim is to have
every child progress according to his/her developmental level and to provide extra
curriculum support for children not reaching benchmark normative standards.
Because of the new focus on literacy, schools are encouraged to identify factors
that help children succeed so they can provide intervention at an early stage to any
group that is at any risk of failure to achieve benchmark standards.
In Florida, beginning in the fall of first grade, children are screened with the
Dynamic Indicators of Basic Early Literacy Skills (DIBELS) (Good et al., 2001),
and their scores are sent to the district offices, who forward the information to the
Florida Center for Reading Research. The benchmarks for this assessment
determine which of four levels of risk a child’s performance falls within for
determining the probability of future reading success. The children with very low
scores are determined to be ‘at high risk’ for future reading failure. Once ‘at risk’
children are identified, the school has the opportunity to provide further
instruction specifically to help them close the achievement gap between them and
their peers. The aim of the early screening measures is to provide a way of

4
identifying children before they fail high stakes state reading achievement tests in
third grade and to give them a better opportunity to stay on track academically.
DIBELS is comprised of a range of literacy assessment tools. For
example, the measures include reading passages to determine oral reading fluency
rates that can be administered across all elementary school grade levels. There are
six early literacy assessment tools to determine proficiency in early literacy skills:
Letter Naming Fluency (LNF), Initial Sound Fluency (ISF), Phonemic
Segmentation Fluency (PSF), Nonsense Word Fluency (NWF), Word Use
Fluency (WUF), and Retell Fluency (RTF). These research-based assessments
measure different skills and are sensitive to change over short periods of time. At
present, Florida uses ISF, PSF, LNF, and NWF from preschool through first grade
for benchmark formative assessments. Oral Reading Fluency (ORF) measures are
used from the winter semester of first grade upwards.
With the emphasis on measuring achievement, there have always been
concerns with respect to bias. Is the test the children are required to take biased
for any one group more than another? Over the years, there has been considerable
public interest in bias of tests, especially with regard to ethnicity, gender, and
socioeconomic status. There are several important concepts that concern the
validity of using formative assessments to predict future test outcomes: bias,
differential prediction, and predictive validity. Each of these terms explains
results obtained by tests differently. Bias is a systematic measurement error that is
commonly associated with items or factors in a test that are more specific to one
population than another (e.g., the verbal and semantic knowledge in IQ tests).

5
Differential prediction, however, refers to a score predicting a future outcome
measure score differently for different populations. Predictive validity refers to
the ability of the first measure to correlate significantly with an outcome measure
along a criterion dimension the test is designed to measure. A common statistical
tool to determine these criterion and predictive validity and possible bias is
regression analysis. In regression analysis, a slope and intercept value is
calculated for each group, and equity between slopes is discussed with regard to
the outcome measure to determine the efficacy of the predictor tool.
Bias is an important concept when examining test performance because, if
bias exists, there will be an over-prediction or under-prediction of children
identified for early reading failure. Bias refers to the same score meaning
something different for one population than another. Cole and Moss (1993) define
bias as “differential validity of a given interpretation of a test score for any
definable, relevant subgroup of test takers” (Cole & Moss, 1993, p.205).
Differential prediction means one initial score will predict, via linear
regression, a different outcome score for one demographic group compared to
another for any given criterion measure (Cleary, 1968). Typically, with
differential prediction, the prediction under or over-predicts the criterion
performance for different groups (e.g the performance of a minority group may be
overpredicted) (Shields, Konold & Glutting, 2004). Criterion bias refers to
differences in group prediction when the intercept or the slope, determined by the
regression analysis, is different for different groups. Intercept differences suggest
one group is consistently over or under-predicted. Predictive bias can also be seen

6
with slope differences when the regression lines between the majority and the
minority groups are not parallel. Regression analysis can determine if an over or
under-prediction of outcome achievement exists for any group (Shields et al.,
2004). Validity coefficients can also be used to examine predictive validity. If the
validity coefficient is significantly higher for one group than another group,
differential predictive validity is determined (Young, 1994).
Examining curriculum-based measurement (CBM) tools for slope bias,
differential prediction and/or predictive validity is important because the
emphasis on measuring success in literacy is determined by test scores with linear
outputs. Educators need assurance that different populations are being accurately
assessed. They also need confidence that the tests used not only measure current
performance accurately, but will help identify target groups (e.g., children with
high risk status) to help guide educational resources and instruction. With a linear
score definition, cut off scores are determined for eligibility to passing, failing, or
being considered ‘at risk.’ It is, therefore, important to identify the correct
children in each category so they can receive the education they need to gain
mastery of literacy skills. If schools succeed in identifying the populations that
need extra reading instruction correctly, they will be able to then provide the
appropriate delivery of tiered intervention necessary to try to close achievement
gaps for adequate yearly progress (AYP). Secondly, if children identified as ‘at
risk’ for reading failure succeed equally well on outcome measure assessments,
then the time, money, and resources invested in the interventions to help them
will have paid off for everyone concerned. Teachers will have helped close

7
achievement gaps as part of NLCB accountability, and children will benefit from
their increase in current performance and prediction of future grade-level
curriculum achievement. Because NCLB has mandated the closure of
achievement gaps, DIBELS measures are now used in many general education
first grade classes for progress monitoring children with Academic Improvement
Plans (AIP’s) , Individual Educational Plans (IEP’s), and Progress Monitoring
Plans (PMP’s) in reading, as well as all children in Reading First schools.
However, little research to date has been conducted for differential prediction of
DIBELS measures for diverse populations.
A few studies on CBM have examined racial and ethnic bias for CBM
(Kranzler, 1999; Hintze et al., 2002; Klein & Jimmerson, 2005). Despite earlier
concerns of ethnic bias in testing and curriculum measures, Klein et al., (2005),
found that once socioeconomic factors were controlled, there were no significant
differences between the ethnic groups.
Gender is commonly researched as a factor influencing children’s
academic performance. Gender differences in academic performance have been
attributed to poor behavior by boys, (Prochnow et al., 2001), as well as concerns
about gender bias in curriculum (AAUW, 1992). There is no evidence to date of
gender bias in outcome tests, but when multiple factors are analyzed at the same
time, gender is one of many considerations (Klein et al., 2005). This study is
interested in examining gender as a variable that may affect differential
prediction, because there is evidence of boys having more referrals for reading
disability groups and also having more behavior problems (Mendez, Mihalas, &
8
Hardesty, 2006), which may suggest their rate of learning and slope of prediction
line may be different when compared to girls.
Socioeconomic status (SES) too has become a focus of research, with
evidence for its transactional influence of variables affecting home environment,
home-language spoken, achievement in school (Klein & Jimmerson, 2005),
income and race (Hixson & McGlinchey, 2004), and differences in teacher ratings
of children’s self-efficacy (Mashburn et al., 2006). The results of research have
guided literacy reform models in high poverty areas in order to promote good
instruction so that achievement levels of the children can be raised to meet grade
level proficiencies (Tivnan & Hemphill, 2005).
Overview of the Study
This study explored differential prediction for gender and ethnicity in the
DIBELS Nonsense Word Fluency (NWF) measures currently used in Florida in
first grade. DIBELS NWF is administered in the fall of first grade and measures
the alphabetic principle (i.e., both the knowledge of common letter sound
correspondences and the ability to blend these sounds together into words)
(Kaminksi & Good, 1996). Benchmarks for DIBELS NWF are one piece of
information available from the DIBELS measures that may be used determine a
child’s risk level for success in future high stakes reading outcome tests. In the
spring of first grade, the Stanford Achievement Test 10th Edition (Harcourt
Assessment Inc., 2006) is used as an outcome assessment. This study examined
the predictive validity of the DIBELS NWF assessment for the SAT-10 Reading
Comprehension portion and examine whether differential prediction occurs for

9
various subgroups (e.g., male vs. female or high vs. low SES). This research is
important because very little research has explored the issues of differential
prediction based on gender or ethnicity in any of the DIBELS measures, and
NWF is increasingly being used across the United States as a formative
assessment.
Differential prediction is problematic because if one score predicts differently
for one group than another, the validity of one score to predict a future result
across different populations could be challenged. This is an important concept in
formative assessment because the purpose of assessment is to guide educational
practice, teaching and resources to target those children in need of extra support
with an intervention. If a cutoff score predicts an outcome measure assessment
incorrectly it means that resources will be over or under allocated and the results
will not therefore generate the best outcomes. It is important, therefore to examine
cutoff scores for differential prediction validity to assure educators of the
populations identified as in need of support according to the risk levels identified.
This study examined differential prediction by analyzing the regression
slopes and intercepts of the populations stratified first by gender and then by
ethnicity on the DIBELS fall NWF scores of the Reading First schools to
determine if there are any differences in the prediction of the SAT-10 reading
comprehension achievement results in the late spring of the same academic year.
The analysis provides new information to the literature currently published on
DIBELS measures as well as new information on whether there are any gender or
SES differences in the predictive determination of DIBELS towards SAT-10 in

10
first grade. Because both DIBELS and SAT-10 are widely-used tests in
educational settings, the information gained from this study informs educators,
school psychologists, and policy makers as to the efficacy of DIBELS as a
predictor measure generalized across diverse populations with one set of
benchmarks for all children. With confidence that the benchmarks function
equally well across populations, we can be more confident that the billions of
federal dollars being allocated and dispersed to schools to improve literacy
standards can be justified, and accountability to tax payers, policy makers,
educators, teachers and school psychologists will support NCLB.
The research questions addressed in this study were:
1. Do NWF scores in fall of first grade predict SAT-10 reading
comprehension achievement equally well for boys and girls as a whole
sample, and also within three risk group categories?
2. Do NWF scores in the fall of first grade predict SAT-10 reading
comprehension achievement equally well for different ethnic groups as a
whole sample, and also within three risk group categories?
3. Is there an interaction between gender and ethnicity in the prediction of
SAT-10 reading comprehension achievement scores from NWF scores as
a whole sample, and also within three risk group categories??

11
Chapter Two
Review of the Literature
The Importance of Reading
Reading is a critical skill that serves a gate-keeping role to academic
achievement in elementary school, high school, and college education in our
western society. Literacy opens the door to a wide number of employment
opportunities, and this, in turn, provides individuals with financial independence.
Because of the fundamental importance of literacy in our society, reading and
writing are taught in schools from kindergarten through 12th grade.
Currently, there are serious concerns over low levels of literacy
achievement across the nation. The National Center for Educational Statistics
(NCES, 2005) noted that 5% of the adult population (about 11 million people) is
“nonliterate” and found that there has been little change over the past decade in
prose (narrative and social) literacy. The Organization for Economic Cooperation
and Development (OECD, 2003) published a study titled Learning a Living: First
Results of the Adult Literacy and Life Skills Survey (ALL) in which adult literacy
rates were measured in both prose and document (factual and declarative
knowledge) literacy. These assessments measured adults’ prose, document, and
quantitative (mathematical) literacy skills. Prose literacy items were made up of
continuous text (formed of sentences into paragraphs). Document literacy items

12
were made up of non-continuous text (tables, schedules, charts and graphs, or
other text that had clearly defined rows and columns). Quantitative literacy is
knowledge of skills required to apply arithmetic operations, either alone or
sequentially to numbers embedded in printed materials – such as balancing a
checkbook, calculating a tip, completing an order form, or determining an amount
of interest on a loan from an advertisement.
The purpose of the OECD study was to examine skill acquisition and loss
in adults as a result of early initial education and skills learned in schools. ALL is
the direct successor to the International Literacy Survey (IALS), which was
conducted in three phases (1994-1998) and 20 nations, including the United
States. The ALL report (OECD, 2003) is meant to assist educators and individuals
in decision-making roles to improve the quality of education by addressing skill
deficits that negatively impact individuals and lead to social exclusion and
inequality. The study described adults as people who were 16 years of age and
older living in households or prisons. When examining the levels of prose,
document, and quantitative literacy achievement in education from 1992 to 2003,
four groups of people were identified: those who had less than a high school
education, those who had graduated from high school, college graduates, and
those with post graduate studies or degrees. The report found that although
literacy increased with the completion of more education, across every category
of adults, there was a decline in literary scores from 1992 to 2003. Those adults in
graduate studies and post-graduate degrees declined the most, losing up to 13
points in prose and 17 points in quantitative literacy achievement since the last

13
assessment in 1992. When examining ethnicity factors, White adults maintained
similar scores in prose and document literacy, but rose 9 points in quantitative
achievement. African-American scores improved across all dimensions, but
Hispanic adults were lower in every aspect – down 18 points in prose and 14
points in document literacy achievement.
In addition to these assessments of adult literacy, the Institute of Education
Sciences (IES) conducted an assessment of young adult literacy in the United
States in 1985, an assessment of jobseekers in 1991, a National Adult Literacy
Survey (NALS) in 1992, and a follow-up to NALS, the National Assessment of
Adult Literacy (NAAL) in 2003. Of 11 million adults assessed, the NAAL (2003)
reported that 7 million adults could not answer simple test questions because of
illiteracy. Fourteen percent (approximately 30 million adults) of the population
was ‘Below Basic’ levels, which meant they had no more than simple and
concrete literacy skills. Several population groups were over-represented in the
‘Below Basic’ level. For instance, 55% of adults with Below Basic Skills in prose
literacy did not graduate from high school compared to fifteen percent of adults in
the general population.
Because of the number of both adult illiterates and children leaving school
without basic literacy competence, there are growing concerns that the curriculum
and methods of teaching reading in the school system are failing the population.
The failure to achieve competence was especially noticed in minority and
disadvantaged populations, resulting in widening achievement gaps between
Caucasian children and other minority groups (Kao & Tienda, 1995). Reading

14
instruction has become a national concern, with researchers examining both the
content and methods of school curriculum (National Research Council, 1998;
Colon & Kranzler, 2006).
No Child Left Behind
A major educational reform made history on January 8th, 2002 when
President Bush signed into law the No Child Left Behind Act of 2001 (NCLB,
2001). The purpose of No Child Left Behind was to use the federal law to help
bring about stronger accountability for schools with the aim of closing the
achievement gap between disadvantaged, minority, and other students.
Because of the low standards of literacy across the adult population in the
United States, the No Child Left Behind Act (NCLB, 2001) has made educational
reform designed to close achievement gaps, increase school achievement, and
increase school accountability. As part of accountability, the law mandates
provisions for goals for every child to make the grade on state-defined education
standards by the end of the 2013/14 school year. To fulfill accountability
expectations, every state has adopted progress monitoring tools to measure their
performance against internal (statewide) and external (national) standards. States
are required to report student achievement disaggregated by named subgroups so
the performance of groups within the whole system can be monitored for progress
(U.S. Dept. of Education, 2004).
To ensure that systematic changes to improve literacy are adopted, a focus
of NCLB is to put schools under pressure to raise the achievement of all children,
especially those with the lowest academic levels. Beginning with the 2002-03

15
school year, NCLB required states to set targets for schools and districts to make
adequate yearly progress towards this goal (AYP). Those schools who do not
meet this requirement for two consecutive years are identified as needing
improvement, and various strategies are available to provide further support to
them. The National Assessment of Educational Progress (NAEP), part of the
Institute of Educational Statistics (IES), provides analysis of assessments across
states and examines national trends for baseline indicators and trend lines. An
emphasis on data collection and requirement to improve children’s performance
on accountability measures in reading and math has shaped state laws, and
currently it is mandatory in Florida for students’ reading skills to be assessed
beginning in kindergarten and continuing at a minimum through 3rd grade.
To support the growing concerns, research initiatives by the National
Research Council triggered a vast array of curriculum-based analyses to provide
information into the most successful methods of promoting literacy acquisition
(NRC, 1998). The NCR named five ‘big ideas’ in reading: phonemic awareness,
alphabetic principle (phonics), fluency with connected text, vocabulary, and
comprehension. Phonemic awareness is a metalinguistic skill that enables the
explicit attendance to the phonological structure of spoken words, rather than the
meaning or syntactic role of the word in the sentence (NRC, 1998). It is the
ability to hear and manipulate sounds in words and involves auditory processing
skills. Examples of phonemic awareness skills include: blending of sounds (e.g.
/mmm/ + /ooooo/ + /p/ = mop), and segmentation ( IDEA, 2002). Segmentation
allows the listener to identify individual initial sound isolations (e.g., /m/ is the

16
first sound in ‘mop’), ending sound isolations (e.g., /p/ is the last sound in ‘mop’),
and complete segmentation (the sounds in ‘mop’ are: /m/+ /o/ + /p/).
Alphabetic principle (phonics) is the ability to associate sounds with
letters. It requires an understanding that spoken language can be broken into
separate strings of words, phonemes and syllables represented graphically by
letter units. Fluency is the automatic ability to decipher letter-sounds and read
words effortlessly, and represents a stage when decoding skills have become
automatic. Fluency enables readers to then focus their attention on
comprehending the meaning of the text. Vocabulary is the ability to understand
words in receptive language, and also retrieve and use words from memory using
expressive language. An average student in grade 3-12 is likely to learn
approximately 3,000 new vocabulary words each year (Nagy & Anderson, 1984).
Comprehension is the interaction between the reader’s prior knowledge and the
text being read. Comprehension refers to the meaning the reader synthesizes from
the text. Comprehension skills include strategies such as summarizing, predicting,
and monitoring (NRC, 1998). These 5 core skills, now called the 5 Big Ideas in
reading curriculum (NRP, 2000) have now become a framework for identifying,
evaluating, and promoting literacy instruction and assessment (NRP, 2000).
The NCLB Act also significantly increased funding for two new literacy
initiatives – Reading First and Early Reading First. Both of these programs are
aimed at helping children achieve reading proficiency by the end of third grade.
Both are voluntary programs to help states and local education agencies use
scientifically-based reading research to improve reading instruction for the young.

17
Reading First, in particular, is designed to help states and educators use
scientifically proven reading programs within all general education classes up to
grade 3 (Torgesen, 2006).
The purpose of the drive behind this literacy reform movement is to
identify children early who are at risk of future reading failure so they can receive
extra support and effective early instruction to promote their success (Education
Commission of the States, 2003-4). Recent assessments by The National
Assessment of Educational Progress (NAEP, 1997) identified 40% of fourth
graders, 30% of eighth graders, and 25% of twelfth graders as reading below
grade level. The percentage is higher in schools that have a large population of
students receiving free or reduced lunches (Snow, Burns, & Griffin, 1998).
Because new mandates under NCLB put considerable emphasis on accountability,
a focus on assessments and screening measures for early identification of children
who have not achieved benchmark standards at their grade level has become
standard across the United States.
DIBELS in Florida
In the Florida, educatators are now mandated to give universal screening
assessments to children from first grade upwards with standardized measures
from the Dynamic Indicators of Basic Early Literacy Skills (DIBELS). DIBELS
(Good et al., 2001) have seven early literacy measures; five are used in Florida:
Phoneme Segmentation Fluency (PSF), Initial Sound Fluency (ISF), Letter
Naming Fluency (LNF), and Nonsense Word Fluency (NWF), and Oral Reading
Fluency (ORF). Phoneme Segmentation Fluency addresses competence in

18
phonemic awareness, which is the ability to verbally isolate sounds heard in
words into different phoneme units. Initial Sound Fluency refers to the ability to
identify the first sound or sounds of a spoken word. Letter Naming Fluency
measures the child’s ability to correctly say the name of a letter presented in either
lower or upper case print. Nonsense Word Fluency measures the rate at which a
child can decode nonsense vowel consonant (VC) and consonant vowel consonant
(CVC) words. The child is allowed to sound out the nonsense words as individual
letter-sound correspondences or blend them to ‘read’ a nonsense word. The oral
reading fluency probes consist of grade appropriate passages of text that the child
is asked to read aloud to an examiner. The student is allowed one-minute to read
and for the score is the number of words correctly read in one minute. The
examiner makes notes on his/ her protocol as to the errors the child makes, so that
both quantitative and qualitative analysis of the child’s performance can occur.
All the early literacy probes are timed and a total score for each can be compared
to benchmarks for minimal grade level competency.
All of the DIBELS standardized benchmarks given identify whether a
score a child receives is ‘above average,’ ‘low risk,’ ‘moderate risk,’ or ‘high risk’
for future reading failure, which is a statement about the likelihood or probability
of meeting the next benchmark. Kaminski, Cummings, Powell-Smith, and Good
(2008) describe how the benchmarks were determined and what they mean. The
cutoff scores are determined by a ROC Curve analysis which identifies the
probability of a child attaining the next benchmark goal in literacy achievement.
The cutoff scores are based on scores in which 20% or less of the children failed

19
to achieve the next benchmark, and then subsequently will be at risk of not
achieving benchmark levels on the future reading assessments. DIBELS uses the
term benchmark when the children’s scores give them an 80% or higher chance of
meeting future literacy goals. The term ‘strategic’ defines the middle group of
children who have a 50% chance of achieving the next benchmark. ‘Intensive’
risk level represents those children who have a less than 20% chance of achieving
the next benchmark, and these children are in the ‘High risk’ category. Using the
DIBELS measures enables educators to identify children with these formative
assessment measures, and enables informed decisions with respect to what
curricular or instructional modifications might be needed to prevent future reading
failure.
With the new mandates on universal screening of children and NCLB,
educators are pressed to learn how to administer the new assessments and then
interpret the results in a meaningful way with regard to strategic teaching. It has
become very important to use the assessments as tools to accurately identify
children who may be ‘at risk’ for future reading failure. Florida, for example,
requires children to pass the Florida Comprehensive Achievement Test (FCAT),
taken in spring of third grade, with a level 3 as a prerequisite entry for 4th grade.
Children who score Level 1 on the FCAT will likely be retained in third grade.
Some conditional provisions exist to permit Level 1 students to be promoted to
Grade 4 if a good reason can excuse poor performance or if they perform better
on an accepted alternative standardized outcome measure.

20
Retention in grade 3 is a serious problem as not only do children perhaps
never catch up with their peer group (e.g., the Matthew effect) (Stanovich, 1986),
but it is also an indication of a building failure to achieve reading competence
among every student in the general educational system. Schools that do fail AYP
two consecutive years must develop a plan for improvement. Other consequences
occur if AYP is not met in three years, such as offering students at the school
alternate placements and free tuition outside of the regular school day (US Dept.
Education, 2007). Reading achievement scores have become political data which
are now gatekeepers to AYP and schools being graded (A-F) and receiving
financial rewards or financial penalties (NCLB 2002). Therefore, with an
educational system under reform to achieve higher academic results, and with the
current mandates with frequent assessments, the focus falls on the value of the
scores achieved in the assessments. Scores from both DIBELS and the FCAT are
compared to benchmark standards. In particular, the DIBELS scores are critical in
identifying which children need extra support to catch up on deficient skills
before they fail later high stakes tests in third grade. The use of DIBELS is
important. With the increasing use of early literacy assessments, DIBELS are not
intended to inform the educators of mastery of one particular content of a reading
curriculum (e.g., all 26 letter sound correspondences), but DIBELS are designed
to enable frequent progress monitoring of early literacy skills with variations of
individual probes, so that learning progress can be tracked over time. This is
important, as primarily they are for formative assessment – to guide educators as
to which groups of children need extra support on specific literacy skills, and also

21
to track individual children’s achievement to ensure future reading success.
Although DIBELS have high validity as predictive measures (Castillo, 2005), the
primary purpose is to guide instruction, and identify needs. For instance, if a
group of children are all identified as “High risk”, school personnel can make
administrative decisions about how to provide time within the schedule for this
group to receive extra instruction. Formative assessments therefore can not only
help guide instruction and school level decisions concerning resources, but can
also help administrators shape their staff allocation and schedules in measurable
ways towards accountability in closing the achievement gaps which have been
identified.
For this reason, it is crucial that the measures correctly identify the
population that is ‘at risk’ and that cut off scores do not over-predict or under-
predict reading failure of the population examined. It is not sufficient to only
consider criterion validity or predictive validity of a test, but also whether tests
predict differently for various subpopulations or groups. Differential prediction
would suggest that further investigation into the measures might be needed to rule
out bias.
Differential Prediction and Bias in Assessments
The concern of the accuracy of test and assessment measures has been
circulating in educational contexts for many years, because it is important for tests
to be considered fair. There are two concepts that are important to consider when
judging the efficacy of a test or assessment, firstly – differential prediction which
refers to systematic error occurring in the accuracy of prediction between the

22
predictor and the outcome measure for two or more groups (Demptster, 2001),
and secondly bias – which refers to confidence that the test, including items in it,
is not biased against any population for one reason or another (Reynolds, 1990).
Differential prediction, alternately called predictive bias, has been a long-
standing concern with tests, and especially the race and gender subgroups of the
population (Sackett, Laczo, and Lippe, 2003). Differential prediction is
commonly assessed using a regression model and refers to a finding of a
significant difference in the regression equations for two groups, which can be
indicated by either differences in slopes, intercepts, or both (Johnson, Carter,
Davison, and Oliver, 2001).
Conceptual models of differential prediction. Differential prediction (DP)
can be examined from several distinct methodologies. The first is a subgroup
analysis, also called bi-variate analysis (Bartlett, Bobko, Mosier, & Hannan,
1978), which examines the differences of slope and intercept found of different
subgroups when using a predictor test for an outcome measure (Dempster, 2001).
These types of analysis have frequently been used in the study of intelligence tests
in efforts to investigate possible racial bias (Bartlett et al., 1978).
The second methodology is the predictability of individuals. Ghisielli
(1956: 1960a, 1960b) determined it is possible to use a single test as a predictor
for an outcome measure test later in time for one individual. His research
demonstrated the efficacy of using a single predictor test for a given individual
against an outcome measure. Ghiselli discussed how individuals vary in their
individual scores with regard to accuracy of their predictor test results

23
determining the outcome score accurately. He described how some individuals
have similar standard scores on prediction and criterion variables,but some have
larger variations. These differences suggest alternate predictability tests could
provide additional information to generate more accurate confidence intervals
around the score achieved. This could help guide decisions depending on the
scores (Dempster, 2001)
The third methodology is moderation, and the study of moderator
variables. Qualitative moderator variables could include gender or race, and
quantitative variables such as a level of reward that affects the strength or
relationship between the predictor and the outcome measure (Baron & Kenny,
1986). A moderator variable is different from a mediator variable. A mediator
variable accounts for the association described between a predictor and outcome
measure, whereas a moderator variable impacts on the association. Zedeck et al.
(1971) suggested that the differences in findings between different prediction
methodologies could be the results of difficulties comparing quantitative and
qualitative techniques. In moderated regression analysis, the moderator variable is
treated as a quantitative variable, whereas with differential predictability and sub-
group analysis, the moderator variables are treated qualitatively and nonlinearity
is ignored (Dempster, 2001).
Therefore, conceptual differences in the regression analysis used are
important to discuss when examining issues relating to the assessment of a test.
In addition, there are empirical concerns which address how the math in the
statistical analysis can give correct results, but misleading answers when

24
limitations of the research design are not sufficiently described (Sackett, Laczo, &
Lippe, 2003).
An Empirical problem: Omitted variables. Apart from conceptual
differences, there are also empirical problems with differential prediction which
relate to the identification or omission of relevant variables in the regression
equation. Just because difference in slopes or intercept values can be determined
using regression analysis does not mean the results can truly explain bias if it is
found, because of the way regression analysis shares variance between variables.
This problem only occurs under a specific set of circumstances. A poorly fitting
model with a larger error term is created by an omitted variable which is
correlated with the criterion variable, but not with the predictor variable (Johnson,
Carter, Davison, & Oliver, 2001). In these circumstances, the regression
coefficients for the predictor variable are not biased by the omission of the
variable. However, if the omitted variable is correlated with both the criterion and
the predictor variables, the coefficients for the predictor variable could be biased.
To give an example of this problem: if only two true variables existed, for
instance effort and gender, and they were entered into a regression equation
examining the prediction of achievement, the variance of scores proportioned for
each factor would be given in a R2result. If hypothetically in this instance no
differences were found in slope or intercept, a regression line for effort and
achievement, and also gender and achievement could be demonstrated, and no
bias might be determined. However, if there was really a variable omitted, such as
socioeconomic class, which correlated highly with the criterion measure of

25
achievement and also a predictor variable of effort, the regression equation would
not be able to proportion any variance to this variable, because it is omitted, and
the variance caused by socio-economic class would be included in the R2 for the
variable of effort because of their high correlation with each other. Now, if a
regression analysis was run, with only two variables again – effort and gender, the
effort regression line would appear biased, whereas if it were run with three
variables: gender, socioeconomic class and effort, the results may determine no
bias in effort, but bias by socioeconomic class, and a different summary could be
drawn.
For this reason, the way statistical analysis are run, and the results
generated from them are important to discuss, so the results can be fairly
determined. In this study, the data included a wide range of variables, from which
two have been selected for analysis of differential prediction: race and gender,
while a third socioeconomic status is held constant. If the results in this study find
any differential prediction based on the entering of these variables, and determine
bias, when really there is an important variable omitted, such as language spoken
at home, the findings from the results will appear biased and the accuracy of the
analysis could be questioned, because really it is a missing or omitted variable
problem. Care in interpretation therefore is crucial, as there are social and political
repercussions when a test or assessment measure is considered biased for any
reason. Considerable work has been published on the determination of bias, and
also on the consequent social effect of a test being determined biased.
26
Bias
In 1978, Flaugher published a paper discussing ‘The Many Definitions of
Test Bias,’ in which he discussed the importance of questioning precisely the kind
of bias for which a test is being examined. His paper discussed issues related to
achievement testing and suggested that a low score could reflect either
accomplishment or the ‘capacity’ to accomplish. His paper supported the concept
of bias. However, he expressed concern that minority groups who performed
poorly on measures felt that the tests resulted in an inaccurate portrayal of their
ability. He discussed test bias as a reflection of the differences in means between
the achievements of two groups towards ‘a desirable goal.’ He described how test
bias could be examined as a single-group or differential group validity, for
instance with regard to minority groups. In addition, test bias could refer to the
content of the test, referring to items on a test that are ‘unfair’ to certain
populations. Notably, the selection criterion model for ‘fairness,’ which could be
used to determine whether a test was fair or not, was important to consider when
discussing selection procedures.
The Einhorn and Bass model (1976) and the Cleary model (1965) endorse
what can be considered a ‘double standards’ philosophy for majority and
minority groups, as candidates who scored the same score on a test would be
“treated differently because of their ethnic identity” (Flaugher, 1978). McNemar’s
(1975) work suggested that higher requirements for minority groups should be
required to prevent over-prediction, as with differential prediction there is an
over-prediction on minority groups, based on other personal factors not included

27
in prediction equations such as noncognitive personal adjustment issues (Young,
1994). Differential prediction in tests is infrequently identified, but when it is,
typically it is found to work in favor of the minority group, when their score is
less than the mean for the majority group (Weiss & Prifitera, 1995) – but not in
their favor when their score is above the mean as with Asian-American children’s
IQ performance (Stone, 1992). Secondly, when the regression lines in regression
analysis are not running parallel to each other, the group with the higher criterion
score is under-predicted (Shields et al., 2004).
Lastly, Flaugher (1978) suggested that there is criterion bias in tests. He
elaborated that when using predictor tests and outcome criterion tests, reliability
between the two tests is usually based on the mean differences between, for
instance, minority and majority groups. However, when discussing results - the
mean difference, interpreted as bias, is usually awarded to the predictor test -
when really it could be assigned to either or both the predictor and outcome
criterion test because the difference is shared between them both. Finally,
Flaugher mentioned ‘atmosphere’ bias – where different groups, such as gender or
ethnic populations, react differently to a test emotionally, and this impacts their
scores. The important points he raised are still current today.
Reynolds (1990) wrote about problems with bias in psychological
assessments with regard to how they impacted on civil law. He cited the 1969
annual general meeting of Black Psychologists who were upholding a parent’s
choice to resist psychological testing to determine eligibility for placement of
African American children in special educational classes. Reynolds summarized
28
six main concerns related to test bias expressed by ethnic minorities as being:
inappropriate content (children not exposed to the curriculum), inappropriate
standardization sample (underrepresented normative reference group), examiner
and language bias (white standard English), inequitable social consequences
(disproportionate representation of ethnic minorities in special education classes),
measurement of different constructs (e.g., an IQ test taken by an ethnic minority
may only measure the degree to which they have adopted the majority culture),
and differential predictive validity (tests may more accurately predict outcomes
for middle class white children). The determination of a test being biased is not
because the test generates invalid scores but because determinations and cut-off
scores from the test may disproportionately disadvantage a population of the test-
takers by failing to take into account other factors which may influence their
achievement and account for variance in the predictive validity of the score the
group has achieved (Young, 1994)
There are, therefore, many different forms of test bias. In an article by
Huebner (1990) school psychologists were found to be biased in their assessment
of children dependent on the referral concern. School psychologists who received
Learning Disability (LD) referrals were likely to diagnose the child as LD in
comparison to psychologists who received the same sample simulated report, but
were told the referral was gifted, who diagnosed gifted. Issues surrounding bias,
conformational bias, and factors that contribute towards bias continue to be
important to educators today, as this directly impacts special education
29
placements, federal dollars for funding, as well as the children who will have a
‘label’ during their formative years.
Bias affecting civil law. Civil law cases have reflected arguments raised
for many years, and questions related to ‘fairness’ and/or bias still affect children
of color. Ferri and Connor (2005, 2005a) describe the historical segregation of
African American and White children in school system and delays to
desegregation in the Southern states until the courts intervened in the 1960’s.
When desegregation was enforced, districts were entitled to place children in
“appropriate” settings for educational service delivery, and IQ testing was used to
determine eligibility for special education. In addition, an increase of special
education classes was made to accommodate the greater numbers of African-
American students who were to be integrated into the school system. In
Washington D.C. in 1955-1956, the number of white students in special education
was 3%, whereas the number of African American students enrolled in special
education classes was 77% (Ferri & Connor, 2005a). As a result of what was
considered widespread institutionalized prejudice against minority groups, civil
lawsuits began to challenge the status of the children identified as learning
disabled and question the use of the IQ test as a valid qualifier for African
American children for special educational placement (Diana v. State Board of
Education, 1970). Further lawsuits such as Larry P. v. Riles in 1979 resulted in
rulings in which the presiding judge decided IQ tests could not be administered to
African-American children in the state of California to determine placement in
special education classes. This ruling was intended to rectify the
30
overrepresentation of African-American children in special education classes. The
judge discussed the IQ test as being unfair because it determined the cutoff of <70
to represent functional retardation despite the fact that a difference was found for
normal performance for African-American children and white children. The social
IQ of an African-American child was considered ‘normal’ at 70, although within
the white population of children, this represented retardation. Newsweek, July
27th, 1987, reported on a case where a letter was sent to the home of an African-
American child, who was not performing well in school, which stated the school
would like to give a battery of psycho-educational assessments for special
education qualification but because the child was ‘Black’ they would not be
proceeding. The school was not prepared to go against a ruling made by US
District Court Judge Robert Peckam which stated that IQ tests are racially and
culturally biased. He ordered that to protect Black children against unfair
discrimination, no African-American student in California, regardless of academic
record, economic status or a parent's wishes, could be given an IQ test. This later
created difficulties for African-American children who were not eligible for
special services because they were not able to participate in the required
assessments that enabled eligibility (Baker, 1987).
The entire concept of one cut-off score for mental retardation has been
troublesome. In 1959, the American Association on Mental Deficiency (AAMD)
set the lower cut off score at 85. This was overturned in 1973 because half of the
African-American population tested fell beneath this figure, and the score was
lowered one standard deviation to <70. The Larry P. v. Riles (1979) court case

31
ruled that IQ tests were not valid for African-Americans because African-
American school children and their parents successfully argued that IQ tests were
biased and culturally loaded. Consequently, the state of California altered their
policies used to determine special educational placement, and in 1971, a statewide
ban on intelligence quotient (IQ) tests for use with Black students in California,
was enacted. In 1994, a federal appeals court ruled against the ban, because this
barred eligibility to special education via traditionally accepted assessments
(Pamela Lewis v. New Haven School District, 1994). However, the California
Department of Education is still upholding the ban.
The seriousness of bias and determination of bias affects policies, school
administrators, school psychologists, and test makers, and affects the
determination of the content validity of the tests, the population sampling in their
trials from which the standardized scores are determined, and the validity
coefficients for test trials. Issues related to bias therefore affect all standardized
test makers, achievement tests, and government policies (e.g., NCLB, which
requires schools to report the achievement of their students disaggregated into
ethnic and demographic groups, NCLB, 2001).
Methodological measurement of bias. Measurement of test bias takes
different forms. Item bias refers to analysis of the individual question content. A
second form is a methodological statistical analysis, such as regression analysis,
which can examine scores for trends and differences. Regression analysis
generates a slope for predictive validity or a regression line that determines the
trend line of a given set of scores (e.g., in a scatter plot). There are different kinds

32
of regressions that can be performed on data, and each has unique qualities. A
simple linear regression examines one relationship between one variable and one
criterion. A hierarchical regression examines the unique contribution each
variable makes in a given order, so that variance can be attributed proportionately
to each variable. There are many different forms of regression equation modeling.
The choice of regression model used will affect the proportion of Type 1
(rejecting a true null hypothesis) and Type II (failing to reject a false null
hypothesis) errors made, as well as the significance factor of the results. If a
regression analysis reveals different slopes for different groups, and a significant
difference is found between the differences, a measure is considered potentially
biased. However, as discussed in differential prediction, results of regressions can
be misleading if there are omitted variables that are affecting the results. For this
reason, if any form of bias is found with a statistical tool, it is important to
examine the evidence further to determine which factors present or not present
may be influencing the results.
Bias in curriculum-based measurement. To date, little research has
examined bias in curriculum-based measurement (CBM). A web-based search in
EBSCO host on October 25th, 2006 produced only 4 results for a search on ‘bias
and CBM’: Wilkie (2002), Evans-Hampton, Skinner, and Henington (2002),
Hintze, Callahan III, Mathews, Williams, and Tobin (2002), and Kranzler, Miller,
and Jordan (1999). A similar search in OVID on March 18th, 2007 produced only
309,521 results for bias, 1154 results for CBM, and 129 results for ‘bias and
CBM.’ However, of these only five were directly relevant to this research in bias

33
in reading assessments: Evans-Hampton, Skinner, Henington, Sims, and
McDaniel (2002) Hintze, Callahan, Matthews, Williams, and Tobin (2002); Knoff
and Dean (1994); and Kranzler, Miller, and Jordan (1999).
Ethnic bias. Kranzler et al. (1999) were the first to publish research on
bias in CBM. Their research examined racial and ethnic bias in curriculum-based
measurement of reading. Kranzler et al. used simultaneous multiple regression
lines on grades 2 through 5 and measured performance across different ethnicity
groups. They found that the slope lines overestimated the reading achievement of
African- American students at grades 4 and 5 but underestimated the achievement
of Caucasian students. They found no differences in slope or intercept at grades 2
and 3. Kranzler et al. concluded CBM failed to demonstrate unbiased indication
of performance. However, Hintze et al. (2002) have described several limitations
with their research. Firstly, they used a theoretical model that combined the
influence of developmental levels, because different CBM passages were
administered for different grade levels, and this precluded a comparison between
grades. Secondly, because they used separate passages they were not able to
combine the results. They used simultaneous regression analysis, and were unable
to make one prediction model. Thirdly, as separate regressions were run at each
age, a critical developmental indicator was omitted from the analysis. In addition,
varying sample sizes across groups caused unusual variances in results and made
the likelihood of Type 1 error greater. Finally, Kranzler et al. did not account for
socioeconomic status as a variable.

34
Evans-Hampton et al. (2002) examined situational bias in covert and overt
timing during math CBM assessments with African American and Caucasian
students. They described situational bias to be when the testing conditions
differently affected the performance of diverse groups. The results found that
although accuracy increased during conspicuous timing conditions, there was no
interaction between ethnicity and timing condition.
Hintze et al. (2002) examined oral reading fluency and the prediction of
reading comprehension in African American and Caucasian elementary school
children. A series of hierarchical multiple regressions analysis found that there
were no ethnic differences in over-prediction or under-prediction once age, sex,
and SES were controlled. Hintze et al. (2002) examined ethnic bias in reading
comprehension scores with African-American and Caucasian students and used a
regression model which controlled for SES. Once SES was controlled, they found
no significant difference in the slope of the regression lines between the two
ethnic groups, suggesting there were no differences in prediction. However, the
proportion of variance explained in the R2 varied between the two groups and was
significantly higher (better at explaining the variance in test scores) for the
African-American population than it was for the Caucasian students. This study is
interesting because it presents findings contrary to a study published in the
Journal of Black Psychology (Bell & Clark, 1998).
Bell and Clark (1998) found that African-American children had better
recall and comprehension on stories that reflected African-American themes.
However, as the Bell and Clark (1998) study did not compare the recall

35
performance of African-American and Caucasian children, and only used African-
American children, their results can not determine to what extent the non-African-
American stories produce biased results for either group. This result is interesting,
because the outcome measures used in the Bell and Clark research are reading
comprehension tests. This study suggests that the social content within the reading
comprehension can affect recall with African-American children, and their
performance can vary as a result of the materials they read. Although the study
does not relate to bias in the use of CBM, it shows the diversity of research and
interest in the topic of bias, ethnicity and performance. The implications of this
research are that passages selected for CBM research should be selected with a
respect for diversity of culture.
More recently, research has examined CBM probes for gender bias
(Wilkie, 2002). One hundred ninety 5th and 6th grade students were administered
three CBM reading probes and the Terra Nova standardized achievement test.
Hierarchical multiple regression analysis was used to assess the possibility of
either slope or intercept differences. The results of the multiple regression
analysis showed no evidence of differential prediction for either gender or SES.
Their findings suggest that CBM reading probes are a valid predictor of reading
achievement regardless of gender or SES.
Multiple variables of race and SES also have been examined (McGlinchey
& Hixson, 2004). McGlinchey and Hixson (2004) examined whether oral reading
fluency scores differentially predicted achievement performance on state reading
assessments across different socioeconomic and ethnic groups. The results

36
indicated that there were intercept differences when predicting the state reading
test using the oral reading fluency scores. Results showed that the test scores of
the African-American and low-income students were over-predicted, while the
scores of the Caucasian and higher-income students were under-predicted.
Gender bias. There is considerable evidence of gender-related concerns in
education. Nationally, boys are reported to have less success within the
academic system, as evidenced by decreasing male enrollment on college
campuses over the last 30 years (Tyre, 2006). Boys are also more likely than girls
to be referred for special educational assessments because of their difficulties in
the classroom. Freeman (2005) reported that in 1999, 12.5% of boys were
identified as learning disabled versus 6.6% of girls, and 3.8% of boys compared
to 1.9% of girls were identified with an emotional disability (Raffaele Mendez,
Mihalas, and Hardesty, 2006).
Prochnow, Tunmer, Chapman and Greaney (2001) examined gender
differences in reading achievement but found that there were no significant
differences between performances of boys and girls on outcome measures,
although boys were identified for reading remediation twice as often as girls The
New Zealand Education Review Office (ERO) concluded that boys and girls
learned and responded in different ways and achieved best results with different
teaching styles (Prochnow, Tunmer, Chapman, & Greaney, 2001). Although no
early differences in gender achievement were found, later differences did emerge,
and were thought to reflect the tendency of boys to engage more frequently in
behaviors that impede learning. Evidence for this idea is found in other studies
37
indicating that boys are more disruptive, aggressive, and inattentive than girls
(Bussing, Zima, Belin & Forness, 1998), and are more frequently referred for
difficult or challenging behaviors (Kauffman, 1977).
In a study by Klein and Jimmerson (2005), mean differences were found
in performance between girls and boys in second grade, with girls achieving
significantly higher scores. Their study examined reading fluency probes for bias
for gender, and found no evidence of bias for gender or ethnicity. Only one
significant group mean difference was found for gender at the second grade level,
and this difference was not replicated in other grade levels. The findings
suggested that oral reading fluency assessments predict equally across both
genders for reading proficiency.
MacMillan (2000) examined the accuracy of simultaneous measurement
of reading growth for gender and age-related effects using a many-faceted Rasch
model applied to CBM reading scores. The study examined a sample of 1691
students from grades two to seven, randomly selected within grades from 53
elementary schools. The number of students in each grade were approximately
equal. All students completed reading and writing tasks, and a many-faceted
Rasch model was used to investigate reading growth, gender differences, relative
age differences and reading probe difficulties. Patterns of results were examined
across grades. Results showed an indication of growth in reading fluency within
each grade, but a decrease in rate occurs in both grades two and three. The
statistical gender differences found in this study amounted to an average of
approximately two months across all grades, but represented a small effect size.

38
He concluded there were consistent differences favoring girls, but only equivalent
to one month’s growth. MacMillan noted that for gender across grades in schools,
a weighted mean result across grades would represent an accurate description of
elementary school gender effects in reading performance, and that separate
qualifications for gender should not be used as explanations for achievement by
teachers or parents.
Chiu and McBride-Chang (2006) found support for gender differences in
reading achievement across 45 countries. In a meta-analysis of data prepared by
the Organization for Economic Cooperation and Development, within their
program for International Student Assessment (OECD-PISA), double blind trials
of reading achievement and assessment frameworks were examined. Reading
achievement was modeled using measures of gender, SES, number of books at
home, and enjoyment in reading. All indexes including SES were standardized to
a mean of 0 across the OECD countries with a standard deviation of 1. Results
showed that girls outperformed boys in every country, with the exception of
Romania and Peru. This demonstrated the gender phenomenon is not isolated to
one country, despite differences in languages between countries. The variance
apportioned for gender was small, .14, but significant. The research suggested
explanatory models for the results should seek answers from three domains:
country, school, and student. Although the most variance was attributed to gender
differences, other variables included pleasure in reading. Girls’ enjoyment of
reading correlated with their higher performance. Thus, variance in reading
achievement might also occur as a result of the context in which reading is taught

39
and learned. In summary, the gender differences may in part be attributed to
cultural differences (Knopik, Alarcon, & DeFries, 1998).
Clearly, research supports evidence for gender differences but limited
research has been conducted on gender bias and no research on bias on children’s
first grade performance in reading. A search on Sage Full text CSA Illumina on
October 25th, 2006, revealed 3,561 results for all publications in ‘gender and
bias,’ with 2544 publications in peer-reviewed journals. It is interesting to note
that, despite the number of gender studies, none related to CBM. A separate
search for ‘reading achievement, bias, and gender’ produced a result of 31 peer
reviewed articles. These included two on CBM, one of which was an analysis of
the effect of CBM reading measures and reading achievement in fifth-grade
students and discussed how student differences in interpretation of instructions
could affect a trade-off between scores in accuracy and production (Colon,
Proesel, & Kranzler, 2006). One other article evaluated the use of CBM in
reading as a predictor for achievement in reading Hebrew (Kaminitz-Berkooz, &
Shapiro, 2005), but gender issues were not specifically addressed. The researchers
also did not specifically address any bias issues but confirmed the sensitivity of
ORF assessments in progress monitoring. Their results revealed significantly
lower scores from children receiving special help for reading to those children in
general education. It was found that ORF was applicable to evaluating children
who were learning to read in Hebrew and that the one minute accuracy versus
production assessment of the ORF measure is a valid indicator of current reading
performance (Kaminitz-Berkooz & Shapiro, 2005).

40
Socioeconomic status (SES) bias. A search on Sage Full Text CSA
Illumina on October 26th, 2006 produced 1,197 results for ‘socioeconomic status
and bias.’ Interestingly enough, when the search was narrowed to ‘socioeconomic
and bias and CBM,’ only two results remained: McGlinchy and Hixson (2004),
and a second on the applicability of CBM on measuring reading performance in
reading Hebrew by children from grades 1-5 in Israel (the Klein & Jimmerson
article did not show on this search). The McGlinchy and Hixson research has
already been discussed. The Kaminitz-Berkooz and Shapiro (2005) did not
specifically address bias in SES but controlled for this by only selecting schools
for the study which had populations from average SES households. The article
noted that bias in ethnicity need not be taken into account when developmental
levels in children are considered and concluded that CBM is a valid measurement
tool regardless of SES or ethnicity.
Klein and Jimmerson (2005) examined ethnic, gender, language and SES
bias in oral reading fluency (ORF) probes. Their results determined that it is a
combination of factors that significantly shapes results to contribute to intercept
differences. Overall, they found home language to be the strongest factor
influencing results when examining the score results of Hispanic children’s
performance in comparison to Caucasian children. Analysis of the influence of
SES in conjunction with home language usage across different grade levels
revealed no significant findings of slope differences as a function of SES and
home language. Notably, their study showed that once SES was controlled, there
were no significant slope differences in achievement, between any of the ethnic
41
groups sampled although intercept differences did exist. Their results showed that
when using a common regression equation, oral reading fluency measures over-
predicted the reading proficiency (as measured by SAT-9 Total Reading) of
Hispanic students whose home language was Spanish. Additionally, that the
scores of Caucasian students whose home language was English were under-
predicted.
Because Klein and Jimmerson used a regression model which yielded
intercept differences but similar slopes, they reported no bias between any groups
on performance of the measures. However, criterion-bias or differences were
evident because the intercepts were different for each group. Shields et al. (2004)
noted in their research that in regression equations, criterion-related bias exists
whenever intercept differences are present in a regression analysis, as one group
will be systematically either under or over-predicted. Therefore, when examining
the literature on bias, it is important to clarify what form of bias is being
examined, or ruled out, and note that although one form of bias may not be
evident, another form of bias may yet exist.
Previous research on DIBELS
There is considerable research on the Dynamic Indicators of Basic Early
Literacy Skills (DIBELS) to examine their use in the problem-solving role of
using assessment to guide instruction. The problem-solving aspect of tiered
delivery to general and special education requires tools that demonstrate accurate
and reliable results, can be compared to criterion constructs, have good predictive
validity, and can be used for frequent progress monitoring, and subsequent

42
evaluation of curriculum, instruction and effectiveness of intervention (US
Department of Education, Technical Assistance Paper 12740, 2006).
A database web search on DIBELS in EBSCO on March 20th, 2007
produced 28 results, of which 18 were dissertations, and 10 peer-reviewed
journals. The research spanned across three main categories: the use of DIBELS
measures as part of a problem-solving and formative assessment (e.g., Elliott,
Huai & Roach, 2007; Coyne & Harn, 2006; Elliott, Lee, & Tollefson, 2001; Good
& Kaminski, 1996); the reliability and validity, including predictive validity of
DIBELS measures (e.g., Roberts, Good, & Corcoran, 2005; Hintze, Ryan, &
Stoner, 2003); and the use of DIBELS as progress monitoring tools (e.g.,
Register, 2004; Kamps, Wills, Greenwood, Thorne, Lazo, Crockett, Akers, &
Swaagart, 2003; Haagar, & Windmueller, 2001).
Research using DIBELS for formative assessments. The research articles
reviewed in this section were listed on the EBSCO search on DIBELS. Elliott,
Huai, and Roach (2007) researched the efficacy of using DIBELS and the Brief
Academic Competence Evaluation Screening System (BACESS; Elliott &
DiPerna, 2003) measures as screening tools in early elementary years for
assessing academic enabling behaviors in key areas, and concluded future
directions for functional screening should now be directed toward preschool
children to facilitate early interventions. The article featured a discussion of two
forms of early screening measures: BACESS and DIBELS, a comparison of their
cut-off scores, and reliability to predict future reading achievement. Elliott et al.
were impressed with the treatment utility of DIBELS, and its ability to predict

43
early reading achievement, for instance, being able to differentiate kindergarten
children for reading readiness. Both instruments were identified as having good
sensitivity indexes for identifying children with reading or related academic
difficulties. However, both instruments were also found to have poor specificity
indexes, and over-identified children with reading problems when they did not
have them. The importance of informative preschool screening for academic and
social behaviors was discussed with regard to guiding interventions and planning
instruction, to enable children with weaker skills to be identified for remedial and
intensive instruction to repair and prevent further deficit skills.
Coyne & Harn (2006) wrote an empirical article examining the use of four
DIBELS measures for use by school psychologists to help with assessment of
early literacy skills b: (a) screening, (b) diagnosis, (c) progress monitoring, and
(d) student outcomes. This set of assessment decisions is consistent with the
National Reading First Assessment Committee’s conclusion (Kame’enui, 2002)
that school-wide assessments should include the measurement of skills by data-
based screening, diagnosis, progress monitoring, and student outcomes. Their
study supported the use of DIBELS to facilitate educative and administrative
decisions, and encouraged school psychologists to take an active role in using
data to make informed and timely strategic decisions. Although their article
promoted the functional assessment process, they did not review any limitations
in the current educational systems which may hinder the use of functional
assessment – such as teacher resistance, funding, or system-level changes
necessary for implementing a problem-solving system using universal screening.

44
Elliott, Lee and Tollesfon (2001) examined a battery of DIBELS
measures: Letter Naming, Sound Naming, Initial Phoneme Awareness, and
Phoneme Segmentation. These four measures, then referred to as the DIBELS-M,
were assessed using the Woodcock Johnson Pyscho-Educational Achievement
Battery Revised (WJ-R, Woodcock and Johnson, 1989, 1990); the Test of
Phonological Awareness – Kindergarten form ( TOPA; Torgeson & Byrant,
1994); and the Kaufmann Brief Intelligence Test (K-BIT, Kaufman & Kaufman,
1990). Seventy-five kindergarten children from three elementary schools
participated in the research. The DIBELS-M were assessed as predictor measures
for three achievement measures, a teacher-rating scale and an intelligence test.
Students were tested every two weeks individually, and the results were analyzed
using regression analysis. Three types of reliability estimates were computed:
interrater reliability, test-retest reliability, and alternate forms of reliability. They
found good evidence of reliability and validity correspondence between the
measures (.80 or higher) in identifying children in need of intervention, a
correspondence between pre-reading skills, and a significant prediction of all
criterion achievement measures. In addition, the relationships between the
DIBELS-M measures and four achievement measures were analyzed using
hierarchical regression analyses. The partial correlation coefficients between the
Fluency Composite and the achievement measures after ability had been
accounted for were significant. Their results confirmed other research by Daly,
Wright, Kelly & Martens (1997) by finding strong correlations between the
DIBELS-M and the Woodcock-Johnson Skills Cluster and a relationship between
45
pre-reading and math fluency development in young children. They supported the
end of year benchmarks for DIBELS measures, but mentioned a need for more
early benchmarks for the fall of first grade to facilitate more time for
interventions. The use of DIBELS measures to promote systematic assessment of
young children was supported to enable educators to help identify children at risk
for future reading failure so that they might be provided with additional
instruction. A limitation of the study is that it did not identify any relationship
between identification of children with at-risk deficits, or the curriculum with
which they were instructed. Although the researchers promoted the use of
DIBELS in kindergarten to facilitate an earlier identification of remediation for
problems, there was no mention of the average length of time any group of
children spent at any one fluency level, or how much instruction might be needed
to remedy the gaps between risk levels. It would have been helpful to know how
much literacy instruction the children were receiving in this study, so that the
predictive relationship of the assessment could be generalized to other groups.
Good and Kaminski (1996) demonstrated the use of DIBELS as part of a
functional assessment to guide instruction and make pro-active preventive
intervention decisions using a case study as an example. Their study clearly
linked the use of DIBELS to the recommended use of a problem solving approach
to educational and administrative decision making via: problem identification,
analysis, intervention, and evaluation, and this practical system of identifying
children’s needs is still current today. Kaminski, Cummings, Powell-Smith, and
Good (2008) have since authored a chapter which explicitly guides the reader

46
through the process of using DIBELS measures for formative assessment to guide
instruction, progress monitor and also evaluate the effectiveness of instruction.
There are case histories and empirical examples. The reader is reminded that the
function of DIBELS is not to provide a goal in the assessment itself, but to
provide a tool for active decision making to respond to needs of individual
children or classes to help meet individual current and future expectations.
An interesting development in the research on DIBELS is the dissertation
by Greer (2006) that investigated the relationship between DIBELS PSF and
NWF and Piagetian developmental stages. Greer used Chi square and regression
analyses to determine a positive relationship between NWF, PSF and the part-
whole reasoning stage in Piaget’s developmental theory. His research on 39
kindergarten children found evidence of a developmental curve for phoneme
segmentation. Limitations of the study included the sample size, but the concept
of linking benchmark assessments to a developmental core construct is a new
development in DIBELS research.
Research on reliability, validity and predictive validity of DIBELS. There
are two recent studies which examine the reliability, validity and predictive
validity of DIBELS measures. Roberts, Good and Corcoran (2005) discussed the
importance of using an oral reading fluency measure to help understand children’s
fluency development. Their research used the Vital Indicators of Progress (VIP),
developed by Dr. Roland Good at the University of Oregon, are part of the
Voyager Universal Literacy (VUL) program. The VIP are an alternate form of the
DIBELS. First graders from six schools participated in a battery of tests, 90%
47
were African-American and all received free or reduced-price lunches. The
research concluded the VIP had good reliability (.89 for one passage), and (.96 for
three passages) and would provide an excellent alternative screening tool. The
alternate form of the retell fluency ranged from .57 to .90. For students who were
of concern, retests had an excellent reliability (r=.92). The results of this study
provided support for DIBELS early literacy assessments. Limitations of the
research include minimal accounting of the difficulty of administering the test, or
limitations of training people to give the assessments. With the current demand
for school psychologists to perform evaluations, there was limited discussion on
how the results of the assessment could guide instruction.
Hintze, Ryan, and Stoner (2003) examined the DIBELS validity using the
Comprehensive Test of Phonological Processing (CTOPP). In a random selection
of 86 kindergarten children from a sample of 161, with 93% Caucasian, the Initial
Sound Fluency (ISF), Letter Naming Fluency (LNF), and Phonemic Segmentation
Fluency (PSF) measures were administered in a counterbalanced experimental
design to predict the CTOPP outcome measure. Moderate to strong correlations
were found, and the article discussed the implications of the large number of true
positive children DIBELS identified, compared to the smaller number of false
positives. It was recommended that children who were screened and identified
with DIBELS should also be assessed with other sources of information. The use
of low cut-off scores to help determine allocation of teaching and resources for
maximum chance of succeeding on future High Stakes tests were discussed as an

48
implication of current benchmarks. A limitation of the research was a lack of
ethnic diversity, as their sample did not match the current US census for 2003.
Research on progress monitoring with DIBELS. Many studies support
DIBELS as part of an assessment program, however the following three research
articles support the efficacy of DIBELS as a progress monitoring tool. Progress
monitoring is important because of current changes in education accountability
which requires schools to monitor children’s response to general education and
intervention. The following studies demonstrate the use of DIBELS as an
assessment tool which is sensitive to change in children’s performance, which can
be used to help guide decisions about the efficacy of the instruction.
Register (2004) used DIBELS to help progress monitor changes in early
literacy skills after receiving a music intervention. The purpose of the study was
to research the effects of two competing interventions designed to promote
reading skills: music therapy and a television broadcast “Between the Lions,”
which is targeted for kindergarten children. The 86 participants were from a low
socioeconomic background in Northwest Florida. Children were randomly
assigned to one of four conditions, including a control group. Measurements
included DIBELS measures, three subtests of the Test of Early Reading Ability-
3rd edition. (TERA-3). Teachers perceptions pre and post test were also measured
with surveys, and on and off-task behaviors of children were monitored between
conditions. Results of the seven subtests for early literacy were varied. The
Music/Video and Music-Only groups achieved the highest mean score differences
from pre to post test on four of the subtests. The children in the Video-Only group

49
achieved higher scores on the phoneme segmentation portion of the DIBELS than
children in the Music/Video group. Register found strong correlations for LNF
and ISF and the total raw scores with the Test of Early Reading Ability – 3rd
Edition (TERA). Off-task behaviors improved and higher scores on phonemic
awareness were reported. The study confirmed that music increased children’s
on-task behaviors, and supported the need for further investigation into enhancing
curricula for students from low socioeconomic backgrounds. The sensitivity of
DIBELS to monitor student progress in an early literacy skill of phonemic
awareness was instrumental in this research to help assess the efficacy of
instruction received.
It is important that screening tools are effective with a variety of
populations. Benchmarks determined by test developers need careful attention to
ensure their efficacy with diverse population groups. The following study by
Kamps et al. (2003) is important because it assessed the efficacy of using
DIBELS measures in screening children from culturally diverse backgrounds and
low socioeconomic status. The purpose of the study was to monitor growth
longitudinally over a 3-year period in early reading performance of students from
kindergarten through second grade. The 380 participating children were
monitored for performance during a reading curriculum intervention. The research
questions included determining the proportion of children identified as at risk
using Systematic Screening for Behavioral Disorders (SSBD) and DIBELS
(Letter Naming and Nonsense Word Fluency) measures, examination of
trajectories of growth to see if there was correspondence between difference

50
measures, the influence on performance of different curricula, and interactions
between risk level identified and curriculum provided. Seven-hundred thirty
students participated in the study. Multiple gating screening mechanisms were
used including behavior screening measures and academic screening procedures.
The results confirmed that early screening for behavior and academic risks can be
reliably conducted in urban elementary schools, and the DIBELS measures were
found to empirically confirm a reading trajectory toward reading proficiency.
DIBELS scores also reflected changes resulting from different curriculum, and
confirmed that primary level reading curriculum can impact performance.
Limitations of the study included the low percentage of returned parental consent
forms, and further replication of the study with other samples was recommended.
A second limitation is that systematic measurement of the curriculum content,
delivery of the curriculum, or teacher effectiveness were not featured. It is
difficult to control for these kinds of differences in a naturalistic setting. However,
the utility of DIBELS as an integral part of progress monitoring curriculum and
intervention effectiveness was demonstrated.
The use of DIBELS for progress monitoring has also been documented
with English Language learners. This is important because of the diversity in the
student population in the United States, and the influence that speaking a second
or other language at home has on children’s reading development. Haagar and
Windmueller (2001) used DIBELS to help evaluate the effectiveness of student
and teacher outcomes of early literacy skill progress following an intervention for
English Language Learners and LD children in regular education. Their sample
51
included 335 students, most (98%) of whom were Hispanic. These students were
monitored with Word Use Sentence Fluency (WSF), PSF, NWF, ORF, and LNF.
The testing completed three times a year revealed significant numbers of children
fell below benchmark expectations. Results showed that first graders made
upward growth in each skill area, but met benchmark levels later on a later
timeframe than expected. The extent to which NWF, as a measure of alphabetic
principle, predicted later Oral Reading Fluency (ORF) at mid year and end of year
was also evaluated. The trendline demonstrated that NWF was predictive of ORF,
but not all students who achieved benchmarks on NWF also achieved this on
ORF. In addition, the use of intervention effectiveness was evaluated. Teachers
reported that DIBELS were very effective because it provided them with
immediate feedback on student performance. Using the results of the DIBELS
measures enabled them to restructure the class focus in planning and instruction to
meet the needs of the class better. Specific examples of the effect of using data
from DIBELS included regrouping children by risk levels, and implementing
workshops for special instruction to target deficit skills. This is particularly
important when documenting student performance and outcomes in the increased
current climate of accountability. Problems delivering interventions in a school
system that does not facilitate bilingual education were discussed, especially the
importance of teacher professional development. Limitations of the research
include a lack of clarity about the statistical analysis used, and also lack of details
about the curriculum the children were instructed in. Although students with
learning disabilities and English language learning children were mentioned as

52
having similar ‘at risk’ problems, differences were not accounted for, and
distinctions between the two groups were unclear with regard to
recommendations. Limitations of progress monitoring children whose first
language is not English were not comprehensively outlined. Nevertheless, the use
of DIBELS measures for these populations as an accurate prediction for future
reading achievement was clearly demonstrated.
Nonsense Word Fluency
Nonsense Word Fluency, one of the DIBELS subtests which measures
alphabetic principle has been featured in a growing body of research. First of all,
there continues to be support for NWF as a problem-solving screening and
progress monitoring tool essential in progress monitoring early literacy, secondly
there is further evidence of the reliability, validity and predictive validity of NWF
for various outcomes, and finally there is evidence supporting the use of NWF as
a tool in evaluation of instruction and curriculum. Studies to support these
qualities will be reviewed in the following section.
NWF as a problem-solving tool. Healy, Vanderwood, and Edelston
(2006) researched the use of NWF as one of the progress monitoring tools of a
group of first grade children to help determine the Tier of intervention they
needed, and to evaluate the critical assumption in response to intervention (RtI)
that English language learners (ELL) can benefit from intensive structured
instruction. The importance of using an early literacy assessment tool was
discussed as an integral feature of the problem-solving, and also RtI approach to
determine eligibility for special education (Gresham & Witt, 1997). The study

53
was interested in examining the use of the RtI model with ELL students to
determine who needs additional intensive services. Two-hundred fifty-nine
children were screened in a low socioeconomic urban school setting, and 25
students who obtained less than mastery (receiving scores of 30 or below the 25%
level, AIMSweb 2004) were selected for the study, and 15 were in the final
sample. Children were progress monitored while receiving a phonological
intervention two times a week for 30 minutes. A single case AB design was
implemented, with a token economy behavior support system where children
could receive a prize in exchange for stars obtained during intervention sessions.
Of one cohort of first graders, fifteen children screened were identified as in need
of Tier Two intervention, and three went to Tier Three. Of the fifteen children
who received Tier Two intervention, twelve were later able to return to Tier One,
based on successful implementation of an intervention using a token economy
system. The data from this study lend support to using RtI, and PSF and NWF as
assessment tools within the problem-solving model of 3-Tiered service delivery
for English Language Learners. The importance of this research was both to
indicate that the RtI model was effective with identifying and intervening with
ELL children, but also to determine that by monitoring the children’s responses to
intervention, the school psychologist’s time could be more effectively used.
Reschly (2000) described the typical school psychologist as spending 50% of the
day testing, with only 20% of their day conducting direct interventions. In this
study, only three hours per week were spent implementing and evaluating an

54
intervention with the lowest performing children in one school, yielding only
three children who needed special services.
This aspect of using early literacy screeners as part of a RtI model for
educational assessments is important. Another study by Good, Simmons, and
Kame’enui (2001) researched the decision making utility of a continuum of
fluency-based indicators of foundational reading skills for third grade children for
predicting reading outcomes. Their research highlighted the value of DIBELS as
prevention-orientated assessments, helping schools achieve accountability by
using the measures to evaluate instruction. Four cohorts of children from K-3
participated in assessments and the benchmarks were evaluated by percentages of
students achieving them. Scatterplots were used to describe zones of performance.
Ninety percent of the children reached the benchmark goals for first grade, and
these scores were called Zone A. Of 70% of the students receiving a score below
30, only 7% achieved benchmark scores in the following grade. Children
identified in zones B and C had less chance of meeting further benchmarks. The
scores of the children in zone D had the least likelihood of success, and did not
reach benchmark by grade 2. The concept of DIBELS guiding instruction is based
on identifying those children who need extra interventions to stay on track for
benchmarks, and the different predictive validities of different levels of scoring is
relevant to this study which will be examining NWF scores for differential
prediction. Limitations of the study include lack of longitudinal monitoring of the
progress of the children identified, and also lack of ability to confirm treatment
integrity with curriculum delivery, in that different schools across districts may

55
implement the curriculum differently. A concern raised is that the end goal
children achieve is not determined by the initial entry scores they achieve on early
screening measures. The study confirmed the utility of using NWF to inform
instructional decisions, and supported current findings that early identification can
give educators the time to implement necessary and effective interventions to help
improve reading outcomes for all children.
Reliability, validity, and predictive validity studies with NWF. An
important consideration in early assessment tools is that the United States has a
diverse culture with some groups speaking English as a second language. It is
therefore important to examine the extent to which a predictor tool serves a
population that has English as a second or other language. Spanish speaking
students are among the fastest growing community in the United States, and
typically have reading achievement that is lower than Caucasian students
(National Center for Educational Statistics). For this reason, research that explores
the effectiveness of assessment tools with the Spanish speaking children is
important, and not only helps identify variables that contribute to learning to read,
but also helps identify which children need early intervention. Lopez (2001)
examined the role of phonological awareness and other pre-reading skills
including letter knowledge and letter sound correspondence. There were 97
participants who were students in a Bilingual Education (BE) program, and 59
students who received instruction for English as a second language with a Second
Language Program (ESL). Students prereading skills were tested with three
measures: Phoneme Segmentation Fluency (PSF), Letter Naming Fluency (LNF),

56
and Nonsense Word Fluency (NWF). A regression analysis used a combination of
the Reading-Curriculum Based Measurement (R-CBM) and the Woodcock
Johnson or Woodcock Munoz. LNF was found to be the better predictor for both
the ESL and BE groups, explaining 42% and 40% of the variance respectively.
NWF was found to be the best predictor for the Bilingual Education (BE) group,
explaining 47% of the variance of scores when examining the WJ-3 Woodcock
Munoz for BE. These results support the use of NWF as a predictor assessment to
guide instruction and early identification of children at risk of future reading
failure.
In addition to examine the efficacy of an assessment for diverse language
speakers, the use of information from tests has been explored. Good, Baker, and
Peyton (2007) examined the role of initial NWF score and NWF slope of progress
for predicting end of the year DIBELS ORF and found the slope to be an
important predictor. There were two samples in this study. One was from the
Oregon Reading First Data Base (OR) and included 2172 children from Oregon’s
Reading First schools who were monitored for first grade outcomes. The second
sample was from the DIBELS Data System (DDS) which had 358,032
participants, of which 32, 044 students from the first grade in the 2001-2002
school year were selected (Good, Baker, & Peyton, 2007). NWF assessments
were given by trained reading specialists, teachers and coaches during the
benchmark assessment periods in the school year. Progress monitoring data were
also collected according to each of the 34 schools’ policy on individual
monitoring. This study gave explicit details about calculating the slope of

57
children’s performance by calculating the rate of progress between two
assessment periods. This equation creates a prediction for the trendline of the
child’s progress, and helps determine if the child is responding to instruction at a
rate sufficient to close any achievement gaps. Results from the study suggest that
not only is the initial score or intercept point important when considering a child’s
performance, but their rate of progress and response to intervention is critical as
well. Rates of progress and slopes of performance need to be timely, and
facilitate the closure of achievement gaps between risk groups. By monitoring
both the risk level and also the slope of the child’s performance, data can support
whether a child is sufficiently responsive to education to increase or decrease the
tier of support they are receiving. Nonsense Word Fluency is thus not only
sensitive to small changes, but using data to plot progress, administrators have
accountability for educational decisions which guide instruction. A challenge to
this kind of field research is to determine the integrity of the teaching and
intervention delivery when assessing the impact on slope and score performances.
Although Fuchs, Fuchs, and Compton (2004) found NWF less reliable and less
predictive of end of year results than the Word Identification subtest of the
Woodcock Reading Mastery Test-Revised, the Good, Baker, and Peyton (2007)
article demonstrated that the data collected from NWF assessments could provide
reliable predictive data. Accountability for children’s progress needs to
demonstrate how the child is performing against the peer norm group, and also
frequent progress monitoring to determine response to intervention. NWF is
designed with many alternate form assessments and trained staff can collect the

58
data. The Woodcock Reading Mastery subtests are not designed for frequent use,
and are not designed to be given by reading specialists and teachers frequently.
Thus, the efficacy of NWF because of its design, and predictive information with
regard to both risk assessment and also slope of learning are supported by the
Good, Baker and Peyton article.
Rouse and Fantuzzo (2006) examined the predictive validity of 3 DIBELS
subtests: LNF, PSF, and NWF. In a random selection of 330 kindergarten children
from a cohort of 14,803 children, bivariate correlations and simultaneous
regressions found significant overall relationships between DIBELS subtests and
first-grade reading. More than half (51%) of the variance was explained. Their
population did not match the current US census, as the sample included 55%
African-American and 17% Caucasian. However, the study did find significant
predictive relationships with their population. A limitation of the study is no other
grade levels were researched. Future research should address these issues at other
grade levels.
NWF as a curriculum and instruction evaluation tool. In the last decade, NWF
(as have all the DIBELS measures) has increasingly been researched as a tool for
guiding instruction and evaluating its effectiveness within the Response to
Intervention model of educational delivery. Children in the special education
population are a group that need careful monitoring to demonstrate the extra
instruction they are being given is resulting in learning growth. It is critically
important that assessment tools are able to provide evidence of their
achievements, their growth over time, and provide the data to support

59
instructional decisions. Wehby, Barton-Arwood, Lane and Cooley (2003)
assessed a comprehensive reading program on the social and academic behavior
of a group of children with emotional and behavioral disorders and measured
improvement in all areas with NWF. However, this improvement did not show on
standardized scores. This demonstrated the utility of NWF as a progress
monitoring tool for exceptional children because NWF is designed to be more
sensitive to small changes in performance than norm-referenced global
achievement tests. These results supported the use of NWF for children in special
education that need to be monitored over time.
Wehby, Lane and Falk (2005) have also assessed curriculum efficacy with
NWF. Curriculum efficacy is important because educators have choices with
regard to which curriculum and intervention they provide to children. Wehby et
al. examined the effects of the Scott-Foresman Reading Program on four
kindergarten special education children who were identified with emotional and
behavioral disorders (EBD). After implementation of this, university-trained
research assistants implemented the Phonological Awareness Training for
Reading Program (PATR). A multiple baseline design was used to evaluate the
impact of the programs on the students. Assessment measures used to monitor
progress were NWF, ISF and LNF. Moderate and inconsistent improvements in
reading skills were found in the children, and the implications for classroom use
of the programs were discussed. The important aspect of this research study is that
not only can NWF monitor children’s performance, but it can also help provide
data to assess efficacy of instruction, programs, and teaching.

60
Fuchs, Fuchs, and Compton (2004) compared progress monitoring first
grade children with either NWF or Word Identification Fluency (WIF). Their
sample included 151 at-risk children from eight schools in the Southeast of the
USA. Each student was monitored once a week for seven weeks, and twice a
week for 13 weeks. Their progress was measured on both the WIF subtest of the
Woodcock Reading Mastery test, and also NWF. They found the WIF to have
better concurrent and predictive validity for fall to spring status with regard to
both achievement and progress monitoring slopes. They discussed the limitations
of NWF being that students with different skills of reading individual sounds, or
blending CVC together get equal credit. Secondly, that the CVC nonwords did not
include knowledge of double vowel blends, irregular blends, the final “e” rule
which can change the vowel sound within a word, a lack of multi-syllabic words,
and other morphologically-based examples or irregular English pronounciations.
This study discussed the importance of predictive validity for both criterion and
slope for progress monitoring and expressed concerns about the accuracy of
NWF’s performance. Accurate progress monitoring is important as part of the
evaluation of curriculum and efficacy of instruction. Limitations of this study
were that it was a small heterogenous sample (all the children were ‘at risk’), and
it was suggested that results may be different with a larger population with a
wider spread of ability range. Other limitations of the study include lack of detail
about initial scores, as children with different beginning scores may have different
slopes for learning. Other limitations include the non-comparability between the
tests with regard to the content they are assessing. WIF assesses sight vocabulary,

61
which requires a previous knowledge base. NWF is a more pure assessment of the
alphabetic principle– previous knowledge of alphabetic principle is tested, but
sight word knowledge does not interfere. Therefore, the predictive validity
between the two measures is determined by a different set of skills. For
assessments to be equally compared, they should be measuring the same
construct.
Not only can children’s performance or a curriculum be evaluated, but
research has also used NWF to assess the instructional setting. Children identified
as at risk are taught both in classroom settings, and also in small-group
instruction. A study conducted by Samanich (2004) examined the efficacy of a
direct, small-group instruction for pre-reading kindergartener’s who were
identified with poor phonemic awareness. Participants received eight, ten or
twelve weeks in total of three half-hour weekly intervention sessions. The effects
were monitored across subjects using a multiple-baseline design. DIBELS NWF
and PSF, and pre- and post-test standard scores from the Letter-Word recognition
Test of the Woodcock-Johnson Psycho-Educational Battery (3rd ed) were also
compared. It was determined that students who participated in an intervention for
phonemic awareness made significantly more progress in letter and word
recognition than those who had not. The efficacy of small group instruction in
explicit phonemic awareness and letter-sound recognition was supported, as the
assessment tools provided data confirming the children’s response to instruction.
Another study with older children by Barton-Arwood (2003)
demonstrated the efficacy of a reading intervention in a PALS classroom. Six
62
third grade students in self-contained special education school identified with
reading and behavioral deficits were participants in a reading instruction group
intervention. The instruction was given daily using the Horizons Fast Track A-B
reading program in conjunction with Peer Assisted Learning Stategies. Reading
and behavior were monitored. Outcome results of the study indicated that
although changes in total inappropriate behaviors were not directly related to the
reading intervention, attending to task behaviors were improved. This study
assessed reading improvement performance with changes in NWF and ORF.
Finally, Benner (2003) provides further support for the use of NWF as an
assessment tool for examining the effects of early literacy intervention
kindergarten children identified as having emotional and behavior disorders
(EBD). Thirty-six kindergarten children at risk of EBD participated in this study.
Children were randomly assigned to a control or intervention condition, and those
in the intervention experimental group received 10-15 minutes extra early literacy
support daily. The children were evaluated with the Comprehensive Test of
Phonological Processing (CTOPP) and DIBELS measures, including NWF. The
mean differences between the children in the control and experimental group were
determined significantly significant with both interventions, with large effect sizes
for the CTOPP (1.35 and 1.10) and the DIBELS Initial Sound Fluency (1.50),
NWF (1.38), and Letter Naming Fluency (0.86). NWF had the highest effect size,
which supports its use in the field with children within general education and
those with exceptionalities.

63
NWF is therefore demonstrated to be a versatile tool with different
populations of children, ranging from general education to special education, from
kindergarteners through to the third grade students in this study. It is useful to
have an assessment measure that can monitor performance over time, so that
children’s skills can be evaluated with regard to progress towards common
educational benchmarks.
The Current Study
Because of the increasing use of NWF as part of mandatory formative
assessment in Florida, and also increasing use of NWF to progress monitor
children’s performance, and evaluate instruction and curriculum it is very
important there is confidence determining the accuracy of the data it yields. This
research will examine the NWF measure for differential prediction between
groups. To date no research on this has been published. Previous studies have
examined the predictive validity, but not examined any differentiation for either
gender or ethnicity. The research will use gender and SES as variables because
there is considerable evidence that these factors may affect achievement.
Ethnicity is being examined as a variable, because although previous research
found no ethnic differences in minority groups once SES was controlled, (Klein &
Jimmerson, 2005), it was suggested the findings may have occurred because
ethnicity and home-language were dichotomized as variables and this procedure
masked their significance. This study aims to examine the prediction of Reading
Component of the SAT-10 by NWF for both boys and girls from diverse
socioeconomic backgrounds so that an accurate identification of children with

64
reading skill deficits can be identified and targeted for remedial interventions.
Such a study is important so that children who need assistance in mastering early
literacy skills can be accurately identified and provided with additional
instructional support in a proactive manner. Accuracy in identification of children
with skill deficits is important as instruction costs both time and money, and
accountability is required for using federal funds to support the focus on literacy.
The current study will provide educators, school psychologists, administrators,
and policy makers with information that will support accountability for tests now
mandated in the state of Florida.
Research Questions. The current study has three research questions:
4. Do NWF scores in fall of first grade predict SAT-10 achievement equally
well for boys and girls as a whole sample, and also within the three risk
group categories?
5. Do NWF scores in the fall of first grade predict SAT-10 achievement
equally well for different ethnic groups as a whole sample, and also
within three risk group categories?
6. Is there an interaction between gender and ethnicity in the prediction of
SAT-10 achievement scores from NWF scores as a whole sample, and
also within three risk group categories??
This study seeks to investigate the issue of differences in predicting SAT-
10 Reading Comprehension scores from NWF scores. If slope and/or intercept
differences are found, it may suggest that the benchmarks measured by the

65
DIBELS NWF need to be re-evaluated and adjusted for subgroup differences.
Additional research would be necessary before making such a decision.

66
Chapter Three
Method
This research is an analysis of data collected from the first cohort of all the
Reading First schools in Florida in 2003/04. The data were reported to, and
released by the Florida Center for Reading Research (FCRR) for research
purposes. Hierarchical regression was used to determine the accuracy of the fall
NWF scores in predicting spring of first grade Reading Comprehension portion of
the SAT-10 achievement test scores. The research aim was to determine if the
Nonsense Word Fluency assessment for predicted the Stanford Achievement Test
– Edition 10 (SAT-10) similarly for groups defined by different risk level, gender,
and ethnicity.
Reading First
All of the Reading First schools were selected for this study because it is
mandatory for them to give DIBELS assessments in the fall and the SAT-10 in the
spring. Reading First schools have preset requirements with regard to poverty
needs, and have a greater number of low socioeconomic status students than other
schools. Data on Reading First schools showed that 77% of students in these
schools received free or reduced price school lunches (Torgeson, 2006). The data
for this study were archival data collected by the FCRR.
The federal requirements for eligibility as a Reading First school include
specific requirements for instruction, assessments, professional development, and

67
leadership. Reading First schools are required to participate in specific data
collection activities as a condition for receiving funding from this program. In
Florida, Reading First schools must submit progress monitoring data to FCRR
four times per year and outcome measures once per year. Their participation in
state and federal evaluations of Reading First is mandatory. Florida conducts a
rigorous evaluation of reading outcomes and instructional programs in schools
and districts that receive Reading First support. All districts that receive funds
from Reading First are required to participate in this evaluation, which involves
the use of common progress monitoring and reading outcome measures. It also
requires districts to respond to surveys about implementation processes and to
participate in site visits. This part of the evaluation is coordinated through FCRR
which is housed at Florida State University.
A Reading First grant provides money for professional development,
curriculum materials, early assessments, and classroom and school libraries.
Twenty percent (20%) of the funds are used at the state level, with the rest going
to the school directly. The funding provides approximately $300 per student (K-
3), which is intended to pay for a reading coach in each school.
FCRR collects four types of data from Reading First schools in Florida:
1) student performance data, which includes scores on screening and progress
monitoring measures as well as end of year outcome measures; 2) site visit data
from 10% of Reading First schools (a different sample each year), which includes
direct classroom observations of the content and quality of instruction and
interview data with teachers, coaches, and principals concerning the reading

68
program/instruction in their school, and issues they have encountered in
implementing Reading First requirements; 3) coaches log data, which includes
quantitative analyses of the time spent on various types of coaching activities as
well as comments about the nature of coaching activities; and 4) survey data from
the school level implementation survey, which includes information from
principals about the activities they have engaged in as a result of their Reading
First grants.
The student performance data belong to the state of Florida, and it is housed in
FCRR’s database for the purpose of generating reports to the schools, districts,
regions, and state level personnel participating in Reading First.
Participants and Setting
The participants in this study were the cohort of children in first grade in
all the Reading First schools in Florida in the school year 2003/04. Table 1
shows some descriptive statistics for the population across different ethnic,
gender, and free and reduced lunch groups. The ethnic groups of American-
Indian, Asian and Multi were removed from the data set because their
proportional representation was less than 6% of the total sample; this decision
allowed the research to focus on the three dominant groups living in the United
States currently (Caucasian, African-American, and Hispanic). Table 2 shows
how the ethnicity of the sample in this research compares to the US census from
2002. The data included in this set used the NWF at time 1 in the fall of first
grade, the SAT-10 results in Spring, gender, ethnicity, and free and reduced lunch
information to determine prediction accuracy.

Table 1
Descriptive Statistics for Population
Category
Number of participants in
this current study
Original FCRR data set of
participants from Reading First Schools
sample
Percentage of current sample
Percentage of complete
Reading First data set
Participants Schools 323 323 100 100 Students 27405 29042 100 100 Ethnicity: Caucasian 11876 11876 43.3 40.9 African-America
9477 9477 34.6 32.6
Hispanic 6052 6052 22.1 20.8 Asian - 369 1.3 American- Indian
- 88 0.3
Multi - 1174 4 Gender groups
Male 14167 14984 51.7 51.6 Female 13238 14057 48.3 48.4 Lunch: Free and reduced
Total group No 7192 7730 26.2 26.6 Yes 19945 21026 72.8 72.4
69

70
Table 2
Comparison of Sample to US Census 2000 Caucasian African-American Hispanic This sample 43.3% 34.6% 22.1% US Census 2002 75.1% 12.3% 12.5%
Instrumentation
The Dynamic Indicators of Basic Early Literacy Skills (DIBELS)
Nonsense Word Fluency (NWF) and Sanford Achievement Tests – Edition 10
(SAT-10) measures are mandatory for all Reading First schools. NWF is used as a
benchmark assessment, and the SAT-10 is a nationally-normed standardized
reading achievement measure.
NWF: All of the DIBELS measures assess fluency (i.e., accuracy and rate)
with critical early literacy skills. DIBELS Nonsense Word Fluency (NWF) is a
fluency-based measure of the alphabetic principle. Administration of NWF is
standardized and involves a one-minute timed probe where a child is asked to read
as many nonsense words or letter-sound correspondences as he or she is able. The
probe is fluency based and enables a child to either blend the sounds together or
articulate them individually. The total number of correct letter-sounds identified is
recorded as the NWF score. There are benchmarks for performance throughout the
year. Research has demonstrated the predictive validity of NWF for performance
on certain outcome measures later in the year. The NWF assessments use a risk
category to define achievement and risk of failure to achieve subsequent literacy
goals (Good, Baker, & Peyton, in press). In this study, students’ scores of 0-12 at
71
the beginning of first grade are in the high-risk category. Students who achieved
scores of 13-24 are in the moderate risk category. Students who achieved scores
above 25 were grouped into a joint low-risk and above-average category. The
reason to join the low-risk and above-average risk groups together for the
regression analysis was because these children would not be identified for
differentiated curriculum or intervention. The NWF measures have a test-retest
reliability of .90 in kindergarten, and .87 in first grade (Good III, Baker, & Peyton,
in press). Good et al. (2001) report the concurrent criterion-validity of DIBELS
NWF with the Woodcock-Johnson Psycho-Educational Battery-Revised readiness
cluster as .36 in January and .59 in February of first grade. Good et al. (2001) also
reported the predictive validity of DIBELS NWF in January of first grade with (a)
CBM ORF in May of first grade as being .82, (b) CBM ORF in May of second
grade is .60, and the (c) Woodcock-Johnson Psycho-Educational Battery total
reading cluster score as .66.
Cultural sensitivity is addressed in the administration of the DIBELS
NWF. The instructions mention that different dialects of American-English are in
use across the country, and for this reason some letters like “X” and “Q” are not
used, and some other letters are used only in initial sound position. An example is
given of vowels and the sound that is expected for a correct score. Examiners who
assess the children will have been trained to be sensitive to cultural and regional
variations of letter-sound dialects.
Stanford-10 (SAT-10). Stanford-10 (SAT-10) was designed by Harcourt
Brace and is used as an outcome reading achievement assessment. This reading

72
test is administered at the end of first grade and is a standardized reading
comprehension portion of the outcome assessment measure. In this study, only the
results from the reading comprehension portion of the exam were used. The SAT-
10 provides a lexical and percentile score of a child’s individual performance to
determine reading level, and has a methodological reliability of .93-.97 (Harcourt,
2006).
The reading comprehension portion of the SAT-10 is a published norm-
referenced test that asks students to read text passages and then answer literal and
inferential questions. Only reading comprehension was used in this study. Scores
were reported as scale scores and percentiles. According to Carney (2004) internal
consistency estimates for the subtests of the SAT-10 as a whole ranged from the
mid .80s to .90s. Alternate forms reliability estimates ranged from .53 to .93 with
most in the .80s. No data on test-retest reliability are reported in the technical
manual. Evidence of concurrent validity includes correlations ranging from .70s
to .80s between the SAT-10 and SAT-9 (Carney, 2004). Correlations with the
Otis-Lennon School Ability Test, Version 8 ranged between .40s to .60s (Morse,
2004).
Procedure
Training of data collectors. The data were collected by persons trained in
the administration of NWF and SAT-10 tests. All DIBELS examiners were trained
by personnel from FCRR or those district level personnel who had been trained by
FCRR to train others in administration and scoring of DIBELS.

73
Administration, scoring, and interpretation of measures. The DIBELS
NWF was individually administered to students by assessment team members. The
SAT-10 was administered by class teachers who were previously trained and
certified on standardized administration procedures. The results for DIBELS were
collected and sent to the Progress Monitoring and Reporting Network (PMRN) at
FCRR for analysis. The PMRN is Florida’s web-based data-management system
for the recording, storing, and reporting of student gains in reading. Assessment
data are entered three times a year, and only teachers and administrators with
authorization passcodes can enter the system to view scores. The assessment
frames provide intervals for growth in skill, and are designed to help guide
instruction by identifying children at risk who need intervention. FCRR report
back to the school with score summaries. The SAT-10 was mailed in a secure –
inter district mail bag and was scored by Harcourt personnel so there is no
opportunity for bias by teachers at the school.
Confidentiality.
The data in this study were obtained from FCRR in compliance with their
policy for accessing data from the PMRN for research. To obtain approval for
access to these data, investigators must submit a written request that describes: 1)
the overall purpose of the research project; 2) the specific questions to be
addressed; 3) the type of data that needs to be accessed; and 4) the potential
publication outlet or audience for the research report. For data access requests that
are approved, the director designates a staff member within FCRR to generate a
specific query against the data base or provide the data analysis required to

74
address the questions in the research proposal. Designated staff at FCRR will
work with investigators to insure that queries are phrased properly to insure only
the data needed to answer specific questions are identified. In addition, all
identifying numbers of the individual children were removed from the data by the
researcher prior to conducting analyses.
Data Analysis
The analysis of data in this research study involves the use of various
descriptive statistics to examine and describe the dependent variables, such as the
mean score for the boys and girls for each of (a) DIBELS NWF and (b) SAT-10
Reading Comprehension portion. In addition, correlations between the scores of
NWF and SAT-10 Reading Comprehension portion were examined to determine if
a significant relationship exists. Analyses were used to compare the predictive
validity of NWF for determining future SAT-10 scores by gender, ethnicity, and
risk-level. In all analyses, free and reduced lunch status was controlled.
The analysis was designed to address the following research questions:
1. Do NWF scores in the fall of first grade predict SAT-10 Reading
Comprehension achievement equally well for boys and girls as a whole sample,
and also within three risk group categories?
Analysis: A hierarchical linear regression was conducted with NWF and SAT-10
results being analyzed using SPSS. The alpha level for this analysis was p<.05.
The dependent variable in this regression was SAT-10 Reading Comprehension
score. The variables that were added at each step of the hierarchical regression
were:

• Step 1: NWF Score and Free and Reduced Lunch status.
• Step 2: Gender
• Step 3: Interaction term (Gender X NWF Score)
Variable “Free and Reduced Lunch status” was included to control for the
impact of socioeconomic factors on the SAT-10 Reading Comprehension score.
To assess whether the relationship between NWF and SAT-10 Reading
Comprehension scores varied by gender, the p value associated with the
coefficient of the interaction term (Gender X NWF Score) was examined. If the
coefficient was significantly different from zero, this would imply that the
relationship between NWF and SAT-10 was significantly different for males and
females.
The additional variance explained by the inclusion of the interaction term
(Gender X NWF Score) was assessed through the change in R2 statistic and the
associated effect size, as measured by Cohen’s 2f . This analysis was carried out
to assess the practical significance of the results, as the large sample size could
cause small or trivial effects to be significant.
This procedure was carried out for the sample as a whole and then
separately for each NWF-based risk group. Risk groups were defined as follows:
high risk (NWF scores 0-12), moderate risk (NWF scores 13-24) and low risk
(NWF scores 25 +).
75
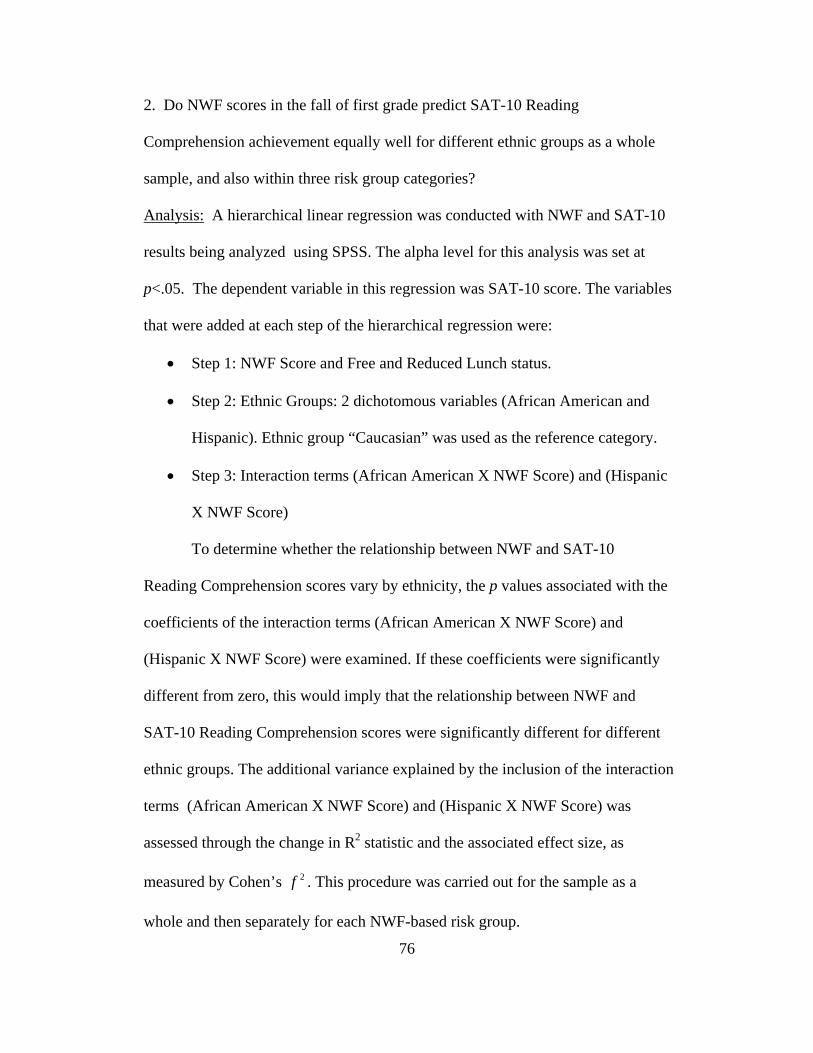
2. Do NWF scores in the fall of first grade predict SAT-10 Reading
Comprehension achievement equally well for different ethnic groups as a whole
sample, and also within three risk group categories?
Analysis: A hierarchical linear regression was conducted with NWF and SAT-10
results being analyzed using SPSS. The alpha level for this analysis was set at
p<.05. The dependent variable in this regression was SAT-10 score. The variables
that were added at each step of the hierarchical regression were:
• Step 1: NWF Score and Free and Reduced Lunch status.
• Step 2: Ethnic Groups: 2 dichotomous variables (African American and
Hispanic). Ethnic group “Caucasian” was used as the reference category.
• Step 3: Interaction terms (African American X NWF Score) and (Hispanic
X NWF Score)
To determine whether the relationship between NWF and SAT-10
Reading Comprehension scores vary by ethnicity, the p values associated with the
coefficients of the interaction terms (African American X NWF Score) and
(Hispanic X NWF Score) were examined. If these coefficients were significantly
different from zero, this would imply that the relationship between NWF and
SAT-10 Reading Comprehension scores were significantly different for different
ethnic groups. The additional variance explained by the inclusion of the interaction
terms (African American X NWF Score) and (Hispanic X NWF Score) was
assessed through the change in R2 statistic and the associated effect size, as
measured by Cohen’s 2f . This procedure was carried out for the sample as a
whole and then separately for each NWF-based risk group.
76

77
3. Is there an interaction between gender and ethnicity in the prediction of SAT-10
Reading Comprehension achievement scores from NWF scores as a whole sample,
and also within the risk groups?
Analysis: A hierarchical linear regression was conducted with NWF and SAT-10
Reading Comprehension results being analyzed using SPSS. The alpha level for
this analysis was set at p<.05. The dependent variable in this regression was SAT-
10 score. The variables that were added at each step of the hierarchical regression
were:
• Step 1: NWF Score and Free and Reduced Lunch status.
• Step 2: Gender
• Step 3: Ethnic Groups
• Step 4: : Interaction term (Gender X NWF Score)
• Step 5: Interaction terms (African American X NWF Score) and (Hispanic
X NWF Score)
• Step 6: Interaction terms (African American X Gender) and (Hispanic X
Gender)
• Step 7: Interaction terms (African American X Gender X NWF Score) and
(Hispanic X Gender X NWF Score)
To assess whether there was a significant interaction of gender and
ethnicity in the relationship between NWF and SAT-10, the p values associated
with the coefficient of the interaction terms (African American X Gender X NWF
Score) and (Hispanic X Gender X NWF Score) were examined. If these

coefficients were significantly different from zero, this would imply that the
relationship between NWF and SAT-10 Reading Comprehension scores was
significantly different for different gender-ethnicity groups. The additional
variance explained by the inclusion of the interaction terms (African American X
Gender X NWF Score) and (Hispanic X Gender X NWF Score) was assessed
through the change in R2 statistic and the associated effect size, as measured by
Cohen’s 2f . This procedure was carried out for the sample as a whole and then
separately for each NWF-based risk group.
78

79
Chapter Four
Results
In this chapter, the findings for the research questions are presented. The
objective of the present study was to determine whether the relationship between
NWF and SAT-10 Reading Comprehension scores was significantly different
across different subgroups, which were defined by gender, ethnicity, and risk (in
terms of NWF scores). Multiple linear regression analysis, which included
interaction terms, was used to estimate the relationship between NWF and SAT
for each group, and R2 change estimates were calculated to determine the
magnitude of the difference of the slopes among subgroups. Descriptive statistics
for the sample are presented first, followed by results of the regression models.
Descriptive statistics
Table 3 shows descriptive statistics for the first NWF fall benchmark
scores and Table 4 shows descriptive statistics for SAT-10 scores, across
subgroups defined by gender, ethnic composition, and participation in free lunch
programs.
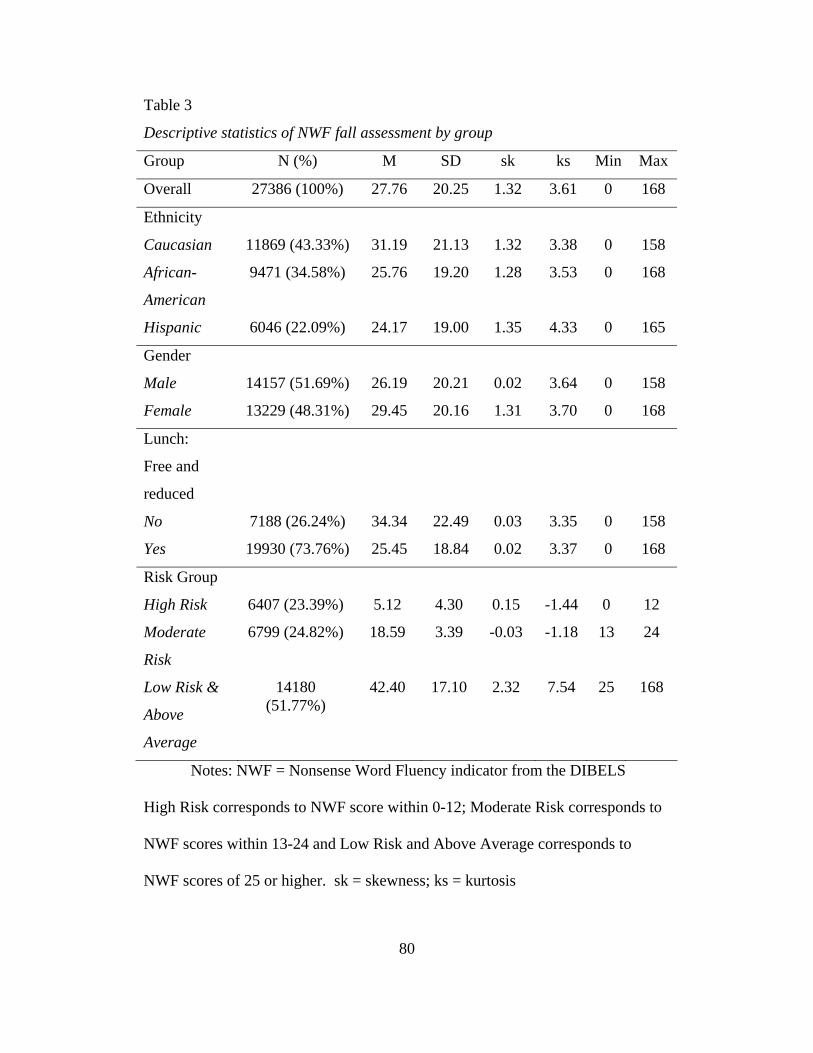
80
Table 3
Descriptive statistics of NWF fall assessment by group
Group N (%) M SD sk ks Min Max
Overall 27386 (100%) 27.76 20.25 1.32 3.61 0 168
Ethnicity
Caucasian 11869 (43.33%) 31.19 21.13 1.32 3.38 0 158
African-
American
9471 (34.58%) 25.76 19.20 1.28 3.53 0 168
Hispanic 6046 (22.09%) 24.17 19.00 1.35 4.33 0 165
Gender
Male 14157 (51.69%) 26.19 20.21 0.02 3.64 0 158
Female 13229 (48.31%) 29.45 20.16 1.31 3.70 0 168
Lunch:
Free and
reduced
No 7188 (26.24%) 34.34 22.49 0.03 3.35 0 158
Yes 19930 (73.76%) 25.45 18.84 0.02 3.37 0 168
Risk Group
High Risk 6407 (23.39%) 5.12 4.30 0.15 -1.44 0 12
Moderate
Risk
6799 (24.82%) 18.59 3.39 -0.03 -1.18 13 24
Low Risk &
Above
Average
14180 (51.77%)
42.40 17.10 2.32 7.54 25 168
Notes: NWF = Nonsense Word Fluency indicator from the DIBELS
High Risk corresponds to NWF score within 0-12; Moderate Risk corresponds to
NWF scores within 13-24 and Low Risk and Above Average corresponds to
NWF scores of 25 or higher. sk = skewness; ks = kurtosis

81
Table 4
Descriptive statistics of SAT-10 reading comprehension by group
Group N M SD sk ks Min Max
Overall 26378 (100%) 550.18 49.58 0.22 -0.45 351 667
Ethnicity
Caucasian 11535 (43.72%) 560.16 51.7 0.08 -0.61 415 667
African-
American
9022 (34.20%) 542.19 46.37 0.26 -0.28 351 667
Hispanic 5821 (22.08%) 542.79 46.45 0.30 -0.29 415 667
Gender
Male 13586 (51.50%) 543.94 49.24 0.02 -0.39 351 667
Female 12729 (48.50%) 556.81 49.07 0.17 -0.48 415 667
Lunch:
Free and
reduced
No 7046 (26.71%) 569.09 50.45 0.03 -0.58 415 667
Yes 19263 (73.29%) 543.33 47.42 0.28 -0.31 351 667
Risk Group
High Risk 5987 (22.69%) 508.51 37.65 0.71 0.58 351 667
Moderate
Risk
6571 (24.91%) 537.04 39.62 0.40 0.12 423 667
Low Risk &
Above
Average
13802 (52.4%) 574.55 43.61 0.11 -0.37 405 667
As can be gleaned from Tables 3 and 4, Caucasians tend to score higher on
both the NWF (Caucasian M = 31.19) and SAT (Caucasian M = 560.16) than both
African-Americans (with mean scores of 542.19 and 25.76, respectively) and

82
Hispanics (with mean score of 542.79 and 24.17, respectively). Similarly, females
tend to earn higher scores on both tests (NWF M = 29.45, SAT M = 556.81) than
males (NWF M = 26.19, SAT M = 543.94). Students on free or reduced lunch
programs tend to obtain lower scores (with NWF M = 25.45, SAT M = 543.33)
than students who do not participate in these programs (NWF M = 34.34, SAT M
= 569.09). Finally, 52.35% of students were in the “Low Risk & Above Average”
group, 24.92% were in the “Moderate Risk” group and 22.71% of students were
in the “High Risk” group.
Table 5 reports the percentage of students within each demographic group
that belong to each risk group. Within the High Risk group, 61.18% of students
were male. Moreover, the most common ethnicity among High Risk students was
African American (39.78%), followed by Caucasians (33.49%) and Hispanics
(26.73%).
Table 5
Distribution of risk groups for each demographic group
Risk Group based on NWF Males CaucasiansAfrican
Americans Hispanics High Risk 61.18% 33.49% 39.78% 26.73% Moderate Risk 51.54% 42.22% 35.33% 22.45% Low Risk & Above Average 47.36% 48.95% 31.29% 19.76%
Finally, the correlation coefficients between NWF-1 and SAT-10 are
reported for each demographic and risk group in Table 6. These values are partial
correlation coefficients, using “eligibility for Free/Reduced lunch programs” as a
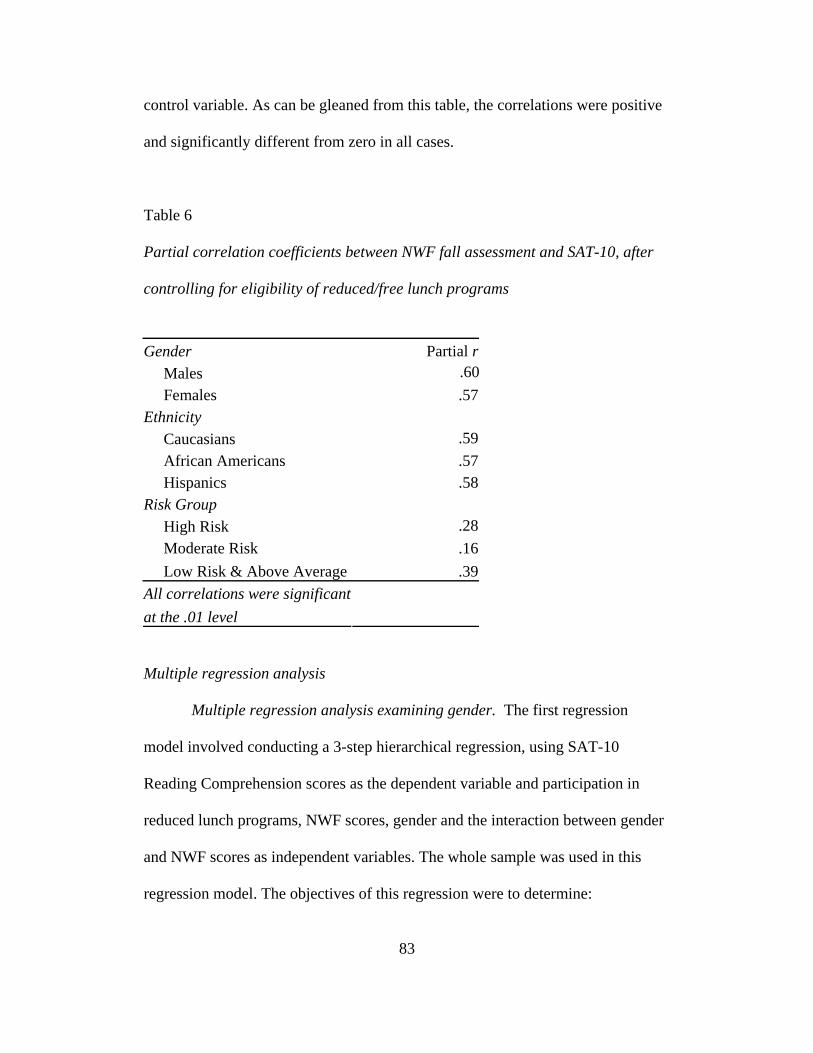
83
control variable. As can be gleaned from this table, the correlations were positive
and significantly different from zero in all cases.
Table 6
Partial correlation coefficients between NWF fall assessment and SAT-10, after
controlling for eligibility of reduced/free lunch programs
Gender Partial r Males .60 Females .57Ethnicity Caucasians .59 African Americans .57 Hispanics .58Risk Group High Risk .28 Moderate Risk .16 Low Risk & Above Average .39All correlations were significantat the .01 level
Multiple regression analysis
Multiple regression analysis examining gender. The first regression
model involved conducting a 3-step hierarchical regression, using SAT-10
Reading Comprehension scores as the dependent variable and participation in
reduced lunch programs, NWF scores, gender and the interaction between gender
and NWF scores as independent variables. The whole sample was used in this
regression model. The objectives of this regression were to determine:

84
1) What is the relation between NWF scores and SAT-10 Reading
Comprehension scores after controlling for student participation in
reduced/free lunch?
2) Does the relationship between NWF and SAT-10 Reading
Comprehension scores differ for male and female students?
Results of this regression are presented in Table 7. Estimated R2 changes
are reported in Table 8.
Table 7
Estimated coefficients for regression on SAT-10, including gender interaction
terms (n = 26290)
b Std. Error Beta t Sig. Step 1 (Constant) 519.92 0.63 829.24 <.01 NWF 1.42 0.01 0.12 117.25 <.01 Reduced Lunch -13.14 0.55 -0.58 -23.67 <.01 Step 2 (Constant) 516.41 0.65 790.03 <.01 NWF 1.41 0.01 0.12 116.15 <.01 Reduced Lunch -13.36 0.55 -0.57 -24.22 <.01 Female 8.56 0.48 0.09 17.80 <.01 Step 3 (Constant) 515.60 0.72 715.68 <.01 NWF 1.44 0.02 0.12 86.14 <.01 Reduced Lunch -13.37 0.55 -0.59 -24.23 <.01 Female 10.35 0.82 0.10 12.56 <.01 Female X NWF -0.06 0.02 -0.03 -2.67 .01

85
Table 8
R2 change for regression on SAT-10, including gender interaction terms (n =
26300)
Change Statistics
Step R Square R2 Change F Change df1 df2 p value 1 .38 .38 7993.84 2 26288 <.01 2 .39 .01 316.91 1 26287 <.01 3 .39 .00 7.14 1 26286 .01
Note: Step 1 includes NWF and Reduced Lunch as independent variables.
Step 2 includes NWF, Reduced Lunch and Female as independent variables. Step
3 includes NWF, Reduced Lunch, Female and Female X NWF as independent
variables.
Results from Step 1 of the model show two expected relationships: there is
a negative relationship between participation in reduced or free lunch programs (b
= -13.14, p < .01) and SAT-10 Reading Comprehension scores; and there’s a
positive correlation between NWF and SAT-10 Reading Comprehension scores (b
= 1.42, p < .01). This result implies that, for the sample as a whole (i.e., without
segmenting it into subpopulations), an extra point in the NWF is related to an
average 1.42-point increase in the SAT-10 Reading Comprehension score. As can
be gleaned from Table 8, the model in Step 1 has an R2 of .38, suggesting that
38% of the variance in the SAT-10 Reading Comprehension is explained by that
model.
Results from Step 3 show that the slope of the relationship between NWF
and SAT-10 Reading Comprehension scores is statistically different for males and

females. The coefficient for the Female x NWF Score interaction (b = -0.06, p =
.01) suggests that the relationship between NWF and SAT-10 Reading
Comprehension scores is significantly different for males and for females.
However, because the sample size was so large, the practical significance of the
interaction also was examined by determining the change in R2 when the (Female
x NWF Score) interaction was added to the model. The R2 from the model in Step
3 was .39. The change in R2 at Step 3 was lower than .01, which implies an Effect
Size . Therefore, although the slopes for males and females appear to be
significantly different, the interaction term (Female x NWF Score) added almost
no explanatory power to the model, suggesting that the difference between males
and females in terms of the relationship between NWF and SAT-10 Reading
Comprehension is not very important.
2 .01f <
This model was also estimated for each risk subgroup. Tables 9, 10 and 11
report the R2 change statistics from the regression model including gender
interaction terms, for each of these subgroups.
86
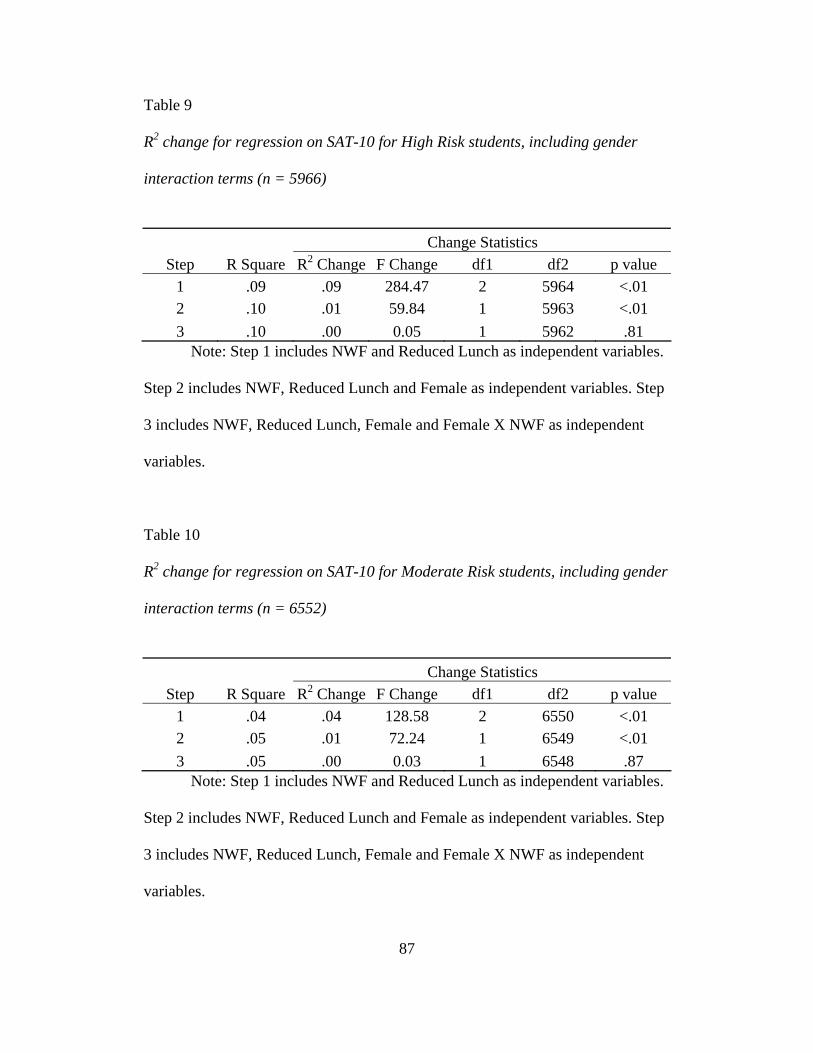
87
Table 9
R2 change for regression on SAT-10 for High Risk students, including gender
interaction terms (n = 5966)
Change Statistics
Step R Square R2 Change F Change df1 df2 p value 1 .09 .09 284.47 2 5964 <.01 2 .10 .01 59.84 1 5963 <.01 3 .10 .00 0.05 1 5962 .81
Note: Step 1 includes NWF and Reduced Lunch as independent variables.
Step 2 includes NWF, Reduced Lunch and Female as independent variables. Step
3 includes NWF, Reduced Lunch, Female and Female X NWF as independent
variables.
Table 10
R2 change for regression on SAT-10 for Moderate Risk students, including gender
interaction terms (n = 6552)
Change Statistics
Step R Square R2 Change F Change df1 df2 p value 1 .04 .04 128.58 2 6550 <.01 2 .05 .01 72.24 1 6549 <.01 3 .05 .00 0.03 1 6548 .87
Note: Step 1 includes NWF and Reduced Lunch as independent variables.
Step 2 includes NWF, Reduced Lunch and Female as independent variables. Step
3 includes NWF, Reduced Lunch, Female and Female X NWF as independent
variables.

88
Table 11
R2 Change for Regression on SAT-10 for Low Risk and Above Average students,
including gender interaction terms (n = 13770)
Change Statistics
Step R Square R2 Change F Change df1 df2 p value 1 .19 .19 1641.56 2 13768 <.01 2 .20 .01 135.25 1 13767 <.01 3 .20 .00 0.19 1 13766 .66
Note: Step 1 includes NWF and Reduced Lunch as independent variables.
Step 2 includes NWF, Reduced Lunch and Female as independent variables. Step
3 includes NWF, Reduced Lunch, Female and Female X NWF as independent
variables.
As can be gleaned from Tables 9, 10 and 11, when analyzing each risk
subgroup separately, the explanatory power added by the inclusion of the
interaction term between gender and NWF-1 was not significantly different from
zero at the .05 level. Therefore, we did not find support for the hypothesis that the
relationship between NWF-1 and SAT-10 Reading Comprehension varies by
gender when considering each risk group separately.
Multiple regression analysis examining ethnicity. The second analysis
involved conducting a 3-step hierarchical linear regression model, using SAT
scores as the dependent variable and participation in reduced lunch programs,
NWF scores, ethnicity and the interaction between ethnicity and NWF scores as
independent variables. In this case, the objective was to determine whether there
were any differences in the relationship between NWF and SAT for the three

89
ethnic groups considered in this study. We started by estimating the regression
coefficients for the whole sample. Results of this estimation are presented in
Table 12, and R2 change statistics are presented in Table 13.
Table 12
Estimated Coefficients for Regression on SAT-10, Including Ethnicity Interaction
Terms (n = 26290)
b Std. Error Beta t Sig.
1 (Constant) 519.92 0.63 829.24 <.01 NWF 1.42 0.01 0.58 117.25 <.01 Reduced Lunch -13.14 0.55 -0.12 -23.67 <.01
2 (Constant) 521.36 0.64 809.56 <.01 NWF 1.42 0.01 0.58 116.50 <.01 Reduced Lunch -10.75 0.60 -0.10 -17.85 <.01 African Amer. -6.40 0.59 -0.06 -10.80 <.01 Hispanic -3.59 0.67 -0.03 -5.39 <.01
3 (Constant) 520.56 0.76 681.97 <.01 NWF 1.44 0.02 0.59 82.69 <.01 Reduced Lunch -10.69 0.60 -0.10 -17.72 <.01 African Amer. -4.54 0.97 -0.04 -4.69 <.01 Hispanic -3.04 1.07 -0.02 -2.83 .01 Afr. Am. X NWF -0.07 0.03 -0.02 -2.43 .01
Hispanic X NWF -0.02 0.03 -0.01 -0.50 .61

90
Table 13
R2 change statistics for regression on SAT-10, including ethnicity interaction
terms (n = 26320)
Change Statistics
Step R Square R2 Change F Change df1 df2 p value 1 .38 .38 7993.84 2 26288 <.01 2 .38 .00 58.39 2 26286 <.01 3 .38 .00 3.02 2 26284 .05
Note: Step 1 includes NWF and Reduced Lunch as independent variables.
Step 2 includes NWF, Reduced Lunch, African American and Hispanic as
independent variables. Step 3 includes NWF, Reduced Lunch, African American,
Hispanic, African American X NWF and Hispanic X NWF as independent
variables.
Clearly, results from the model at Step 1 are equivalent to those at Step 1
from the previous model (the one for Gender), since they also show the
relationship between SAT-10 Reading Comprehension, NWF-1 and participation
in lunch programs for the whole sample. Results of Step 3 from this model show
how the slopes for the relationship between NWF-1 and SAT-10 Reading
Comprehension vary across different ethnic groups. In this case, “Caucasian” was
used as the reference category. The interaction between “African American” and
NWF Scores (b = -0.07, p = .01) was significant, suggesting that the relationship
between NWF and SAT scores is significantly different for African Americans
and Caucasians. On the other hand, the (Hispanics x NWF Score) interaction term
was not significant at the .05 level (p = .61), which suggests that the slope of the

relationship between NWF and SAT scores are not significantly different for
Hispanics and Caucasians.
As described in the previous section, due to the large sample size, the
practical significance of the interactions was examined by determining the change
in R2 when the (African American x NWF Score) and (Hispanic x NWF Score)
interactions were added to the model. The R2 from the model in Step 3 was .38.
The change in R2 at Step 3 was lower than .01, which implies an Effect Size
. Therefore, although the slopes for African Americans and Caucasians
appear to be significantly different, the interaction term (African Americans x
NWF Score) added virtually no explanatory power to the model, suggesting that
the difference between African Americans and Caucasians in terms of the
relationship between NWF and SAT is not very important.
2 .01f <
This model was also estimated for each risk subgroup. Tables 14, 15 and
16 report the R2 change statistics from the regression model including gender
interaction terms, for each of these subgroups.
91
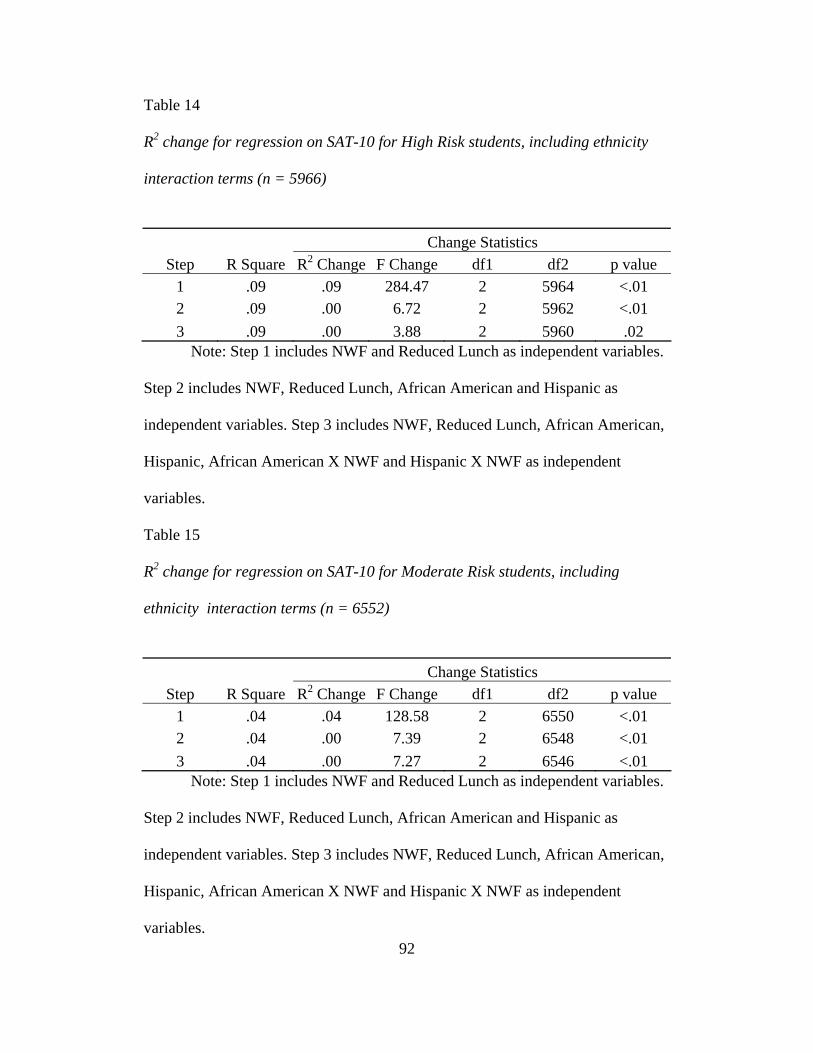
92
Table 14
R2 change for regression on SAT-10 for High Risk students, including ethnicity
interaction terms (n = 5966)
Change Statistics
Step R Square R2 Change F Change df1 df2 p value 1 .09 .09 284.47 2 5964 <.01 2 .09 .00 6.72 2 5962 <.01 3 .09 .00 3.88 2 5960 .02
Note: Step 1 includes NWF and Reduced Lunch as independent variables.
Step 2 includes NWF, Reduced Lunch, African American and Hispanic as
independent variables. Step 3 includes NWF, Reduced Lunch, African American,
Hispanic, African American X NWF and Hispanic X NWF as independent
variables.
Table 15
R2 change for regression on SAT-10 for Moderate Risk students, including
ethnicity interaction terms (n = 6552)
Change Statistics
Step R Square R2 Change F Change df1 df2 p value 1 .04 .04 128.58 2 6550 <.01 2 .04 .00 7.39 2 6548 <.01 3 .04 .00 7.27 2 6546 <.01
Note: Step 1 includes NWF and Reduced Lunch as independent variables.
Step 2 includes NWF, Reduced Lunch, African American and Hispanic as
independent variables. Step 3 includes NWF, Reduced Lunch, African American,
Hispanic, African American X NWF and Hispanic X NWF as independent
variables.
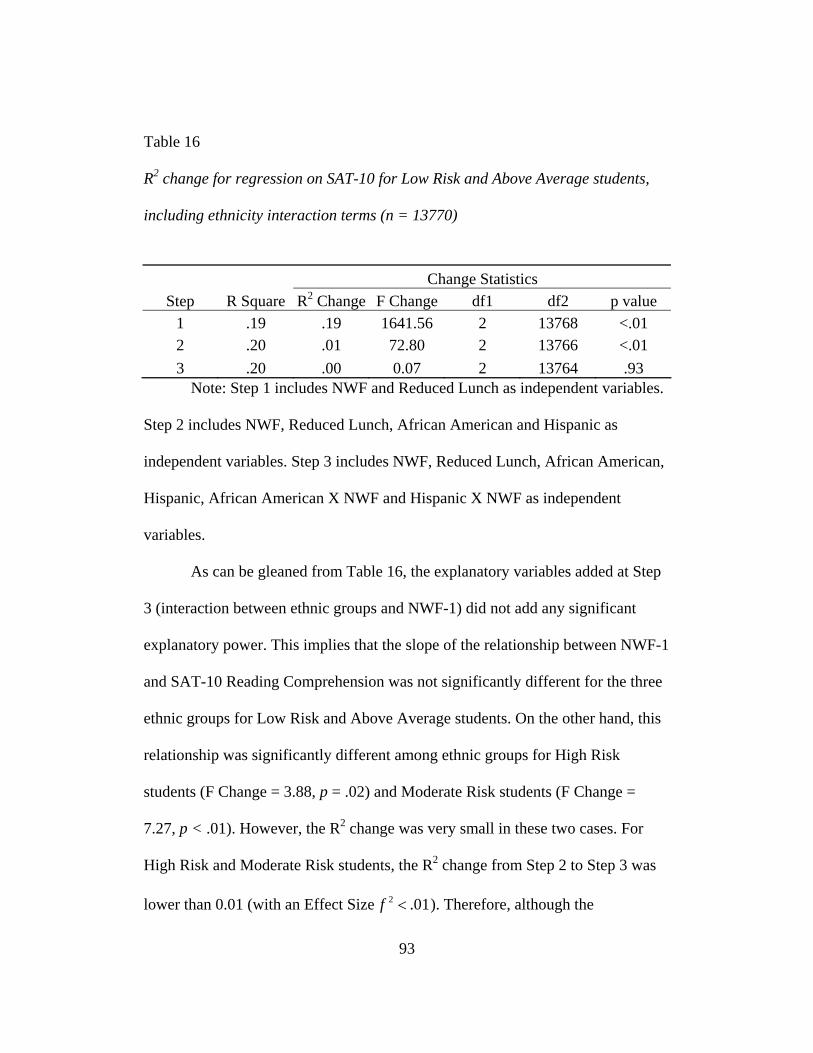
Table 16
R2 change for regression on SAT-10 for Low Risk and Above Average students,
including ethnicity interaction terms (n = 13770)
Change Statistics
Step R Square R2 Change F Change df1 df2 p value 1 .19 .19 1641.56 2 13768 <.01 2 .20 .01 72.80 2 13766 <.01 3 .20 .00 0.07 2 13764 .93
Note: Step 1 includes NWF and Reduced Lunch as independent variables.
Step 2 includes NWF, Reduced Lunch, African American and Hispanic as
independent variables. Step 3 includes NWF, Reduced Lunch, African American,
Hispanic, African American X NWF and Hispanic X NWF as independent
variables.
As can be gleaned from Table 16, the explanatory variables added at Step
3 (interaction between ethnic groups and NWF-1) did not add any significant
explanatory power. This implies that the slope of the relationship between NWF-1
and SAT-10 Reading Comprehension was not significantly different for the three
ethnic groups for Low Risk and Above Average students. On the other hand, this
relationship was significantly different among ethnic groups for High Risk
students (F Change = 3.88, p = .02) and Moderate Risk students (F Change =
7.27, p < .01). However, the R2 change was very small in these two cases. For
High Risk and Moderate Risk students, the R2 change from Step 2 to Step 3 was
lower than 0.01 (with an Effect Size ). Therefore, although the 2 .01f <
93

94
relationship between NWF-1 and SAT-10 Reading Comprehension varied
significantly by ethnicity for Moderate and High Risk students, this variation
appears to be of little practical significance based on effect size,
Multiple regression analysis examining the interaction between gender
and ethnicity. The third analysis involved estimation a 7-step hierarchical
regression model using SAT-10 Reading Comprehension scores as the dependent
variable and participation in reduced lunch programs, NWF-1 scores, gender,
ethnicity, and all interactions among NWF-1 scores, gender and ethnicity. In this
case, the objective was to determine if there was any interaction between gender
and ethnicity in terms of the relationship between NWF-1 and SAT-10 scores. As
in the previous models, the interactions between gender, ethnicity and NWF-1
scores were included in the last step of the model, and R2 change statistics were
used to determine whether these terms added any explanatory power to the model.
Results of the regression for the whole sample are presented in Table 17, and R2
change statistics are presented in Table 18.
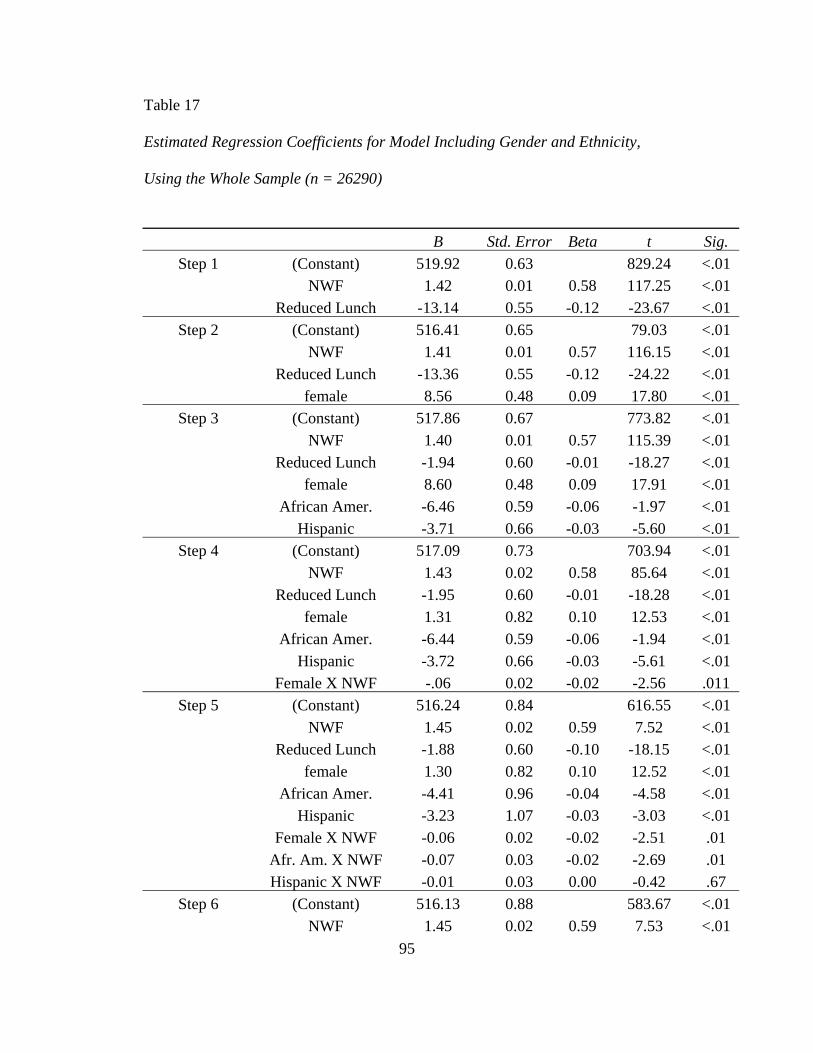
95
Table 17
Estimated Regression Coefficients for Model Including Gender and Ethnicity,
Using the Whole Sample (n = 26290)
B Std. Error Beta t Sig.
Step 1 (Constant) 519.92 0.63 829.24 <.01 NWF 1.42 0.01 0.58 117.25 <.01 Reduced Lunch -13.14 0.55 -0.12 -23.67 <.01
Step 2 (Constant) 516.41 0.65 79.03 <.01 NWF 1.41 0.01 0.57 116.15 <.01 Reduced Lunch -13.36 0.55 -0.12 -24.22 <.01 female 8.56 0.48 0.09 17.80 <.01
Step 3 (Constant) 517.86 0.67 773.82 <.01 NWF 1.40 0.01 0.57 115.39 <.01 Reduced Lunch -1.94 0.60 -0.01 -18.27 <.01 female 8.60 0.48 0.09 17.91 <.01 African Amer. -6.46 0.59 -0.06 -1.97 <.01 Hispanic -3.71 0.66 -0.03 -5.60 <.01
Step 4 (Constant) 517.09 0.73 703.94 <.01 NWF 1.43 0.02 0.58 85.64 <.01 Reduced Lunch -1.95 0.60 -0.01 -18.28 <.01 female 1.31 0.82 0.10 12.53 <.01 African Amer. -6.44 0.59 -0.06 -1.94 <.01 Hispanic -3.72 0.66 -0.03 -5.61 <.01 Female X NWF -.06 0.02 -0.02 -2.56 .011
Step 5 (Constant) 516.24 0.84 616.55 <.01 NWF 1.45 0.02 0.59 7.52 <.01 Reduced Lunch -1.88 0.60 -0.10 -18.15 <.01 female 1.30 0.82 0.10 12.52 <.01 African Amer. -4.41 0.96 -0.04 -4.58 <.01 Hispanic -3.23 1.07 -0.03 -3.03 <.01 Female X NWF -0.06 0.02 -0.02 -2.51 .01 Afr. Am. X NWF -0.07 0.03 -0.02 -2.69 .01 Hispanic X NWF -0.01 0.03 0.00 -0.42 .67
Step 6 (Constant) 516.13 0.88 583.67 <.01 NWF 1.45 0.02 0.59 7.53 <.01
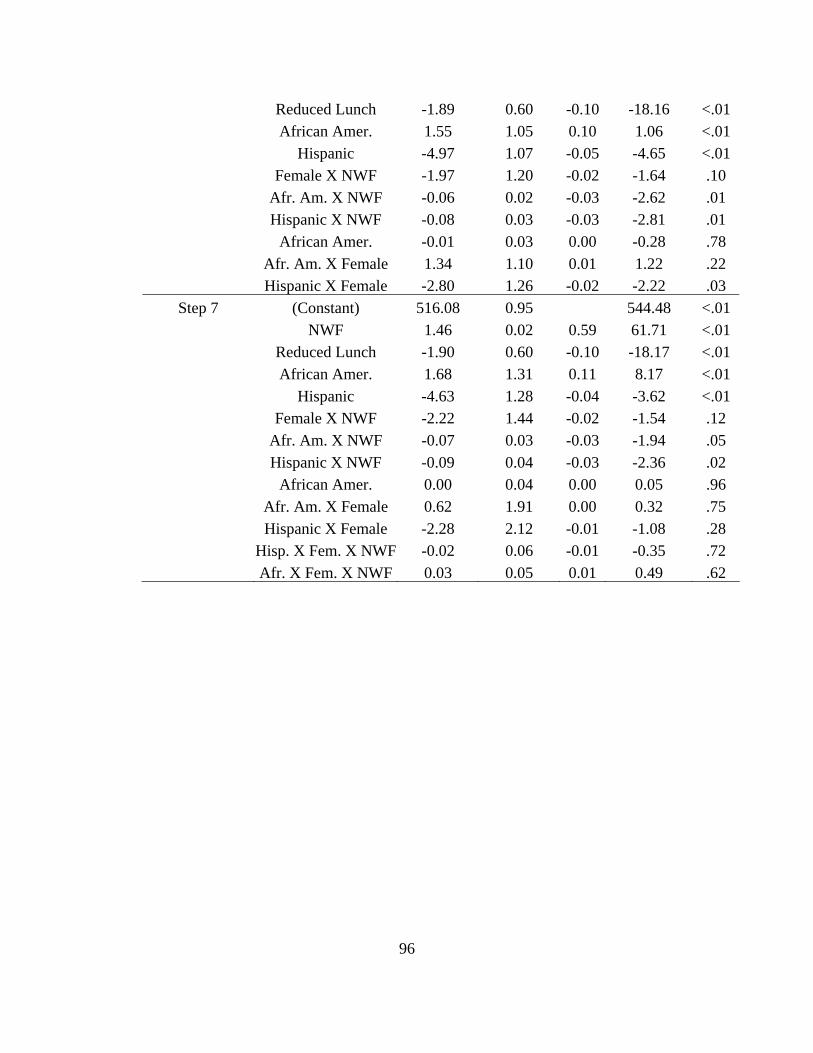
96
Reduced Lunch -1.89 0.60 -0.10 -18.16 <.01 African Amer. 1.55 1.05 0.10 1.06 <.01 Hispanic -4.97 1.07 -0.05 -4.65 <.01 Female X NWF -1.97 1.20 -0.02 -1.64 .10 Afr. Am. X NWF -0.06 0.02 -0.03 -2.62 .01 Hispanic X NWF -0.08 0.03 -0.03 -2.81 .01 African Amer. -0.01 0.03 0.00 -0.28 .78 Afr. Am. X Female 1.34 1.10 0.01 1.22 .22 Hispanic X Female -2.80 1.26 -0.02 -2.22 .03
Step 7 (Constant) 516.08 0.95 544.48 <.01 NWF 1.46 0.02 0.59 61.71 <.01 Reduced Lunch -1.90 0.60 -0.10 -18.17 <.01 African Amer. 1.68 1.31 0.11 8.17 <.01 Hispanic -4.63 1.28 -0.04 -3.62 <.01 Female X NWF -2.22 1.44 -0.02 -1.54 .12 Afr. Am. X NWF -0.07 0.03 -0.03 -1.94 .05 Hispanic X NWF -0.09 0.04 -0.03 -2.36 .02 African Amer. 0.00 0.04 0.00 0.05 .96 Afr. Am. X Female 0.62 1.91 0.00 0.32 .75 Hispanic X Female -2.28 2.12 -0.01 -1.08 .28 Hisp. X Fem. X NWF -0.02 0.06 -0.01 -0.35 .72 Afr. X Fem. X NWF 0.03 0.05 0.01 0.49 .62

97
Table 18
R2 change statistics Regression Model on SAT-10 Including Gender and Ethnicity
Change Statistics
Step R Square R2 Change F Change df1 df2 p value 1 .38 .38 7993.84 2 26288 <.01 2 .39 .01 316.92 1 26287 <.01 3 .39 .00 6.33 2 26285 <.01 4 .39 .00 6.55 1 26284 .01 5 .39 .00 3.74 2 26282 .02 6 .39 .00 5.04 2 26280 .01 7 .39 .00 0.27 2 26278 .76
Note: Step 1 included NWF and Reduced Lunch as independent variables.
Step 2 included Female in addition to the independent variables as Step 1. Step 3
included African American and Hispanic in addition to the independent variables
as Step 2. Step 4 included Female X NWF in addition to the independent
variables as Step 3. Step 5 included African American X NWF and Hispanic X
NWF in addition to the independent variables as Step 4. Step 6 included African
American X Female and Hispanic X Female in addition to the independent
variables as Step 5. Step 7 included Hispanic X Female X NWF and African
American X Female X NWF in addition to the independent variables as Step 6.
As can be gleaned from Table 17, the interaction terms for gender,
ethnicity and NWF were not significantly different from zero at the .05 level,
suggesting that there were no significant interactions between gender and
ethnicity in terms of the relationship between SAT-10 Reading Comprehension
and NWF-1.

98
R2 Change Statistics
These results were confirmed by the R2 change statistics shown in Table
18. At Step 7, when the analyzed interaction terms were included, the R2 change
was lower than .01. Moreover, these variables did not add any significant
explanatory power, as evidenced by the p value = .76 for the F Change statistic.
Therefore, for the sample as a whole, there was no evidence of interactions
between gender and ethnicity in the relationship between SAT-10 Reading
Comprehension and NWF-1. This analysis was repeated for each of the risk
groups. R2 change statistics for these analyses are presented in Tables 19, 20 and
21.

99
Table 19
R2 change statistics regression model on SAT-10 including gender and ethnicity,
for High Risk students (n = 5966)
Change Statistics
Step R Square R2 Change F Change df1 df2 p value 1 0.09 0.09 284.47 2 5964 <0.01 2 0.10 0.01 59.84 1 5963 <0.01 3 0.10 0.00 5.68 2 5961 <0.01 4 0.10 0.00 0.11 1 5960 0.74 5 0.10 0.00 3.67 2 5958 0.02 6 0.10 0.00 2.03 2 5956 0.13 7 0.10 0.00 1.95 2 5954 0.14
Note: Step 1 included NWF and Reduced Lunch as independent variables.
Step 2 included Female in addition to the independent variables as Step 1. Step 3
included African American and Hispanic in addition to the independent variables
as Step 2. Step 4 included Female X NWF in addition to the independent
variables as Step 3. Step 5 included African American X NWF and Hispanic X
NWF in addition to the independent variables as Step 4. Step 6 included African
American X Female and Hispanic X Female in addition to the independent
variables as Step 5. Step 7 included Hispanic X Female X NWF and African
American X Female X NWF in addition to the independent variables as Step 6.

100
Table 20
R2 change statistics regression model on SAT-10 including gender and ethnicity,
for Moderate Risk students (n = 6552)
Change Statistics
Step R Square R2 Change F Change df1 df2 p value 1 0.04 0.04 128.58 2 6550 <0.01 2 0.05 0.01 72.25 1 6549 <0.01 3 0.05 0.00 7.73 2 6547 <0.01 4 0.05 0.00 0.02 1 6546 0.90 5 0.05 0.00 7.21 2 6544 <0.01 6 0.05 0.00 1.07 2 6542 0.34 7 0.05 0.00 0.62 2 6540 0.54
Note: Step 1 included NWF and Reduced Lunch as independent variables.
Step 2 included Female in addition to the independent variables as Step 1. Step 3
included African American and Hispanic in addition to the independent variables
as Step 2. Step 4 included Female X NWF in addition to the independent
variables as Step 3. Step 5 included African American X NWF and Hispanic X
NWF in addition to the independent variables as Step 4. Step 6 included African
American X Female and Hispanic X Female in addition to the independent
variables as Step 5. Step 7 included Hispanic X Female X NWF and African
American X Female X NWF in addition to the independent variables as Step 6.

101
Table 21
R2 change statistics regression model on SAT-10 including gender and ethnicity,
for Low Risk and Above Average students (n = 13770)
Change Statistics
Step R Square R2 Change F Change df1 df2 p value 1 0.19 0.19 1641.56 2 13768 <0.01 2 0.20 0.01 135.25 1 13767 <0.01 3 0.21 0.01 74.29 2 13765 <0.01 4 0.21 0.00 0.03 1 13764 0.85 5 0.21 0.00 0.19 2 13762 0.82 6 0.21 0.00 2.70 2 13760 0.07 7 0.21 0.00 0.71 2 13758 0.49
Note: Step 1 included NWF and Reduced Lunch as independent variables.
Step 2 included Female in addition to the independent variables as Step 1. Step 3
included African American and Hispanic in addition to the independent variables
as Step 2. Step 4 included Female X NWF in addition to the independent
variables as Step 3. Step 5 included African American X NWF and Hispanic X
NWF in addition to the independent variables as Step 4. Step 6 included African
American X Female and Hispanic X Female in addition to the independent
variables as Step 5. Step 7 included Hispanic X Female X NWF and African
American X Female X NWF in addition to the independent variables as Step 6.
As can be gleaned from Tables 19, 20 and 21, when analyzing each risk
subgroup separately, the explanatory power added from the variables included in
Step 7 (the interaction terms between gender, ethnicity and NWF-1) was not
significantly different from zero at the 0.05 level. Therefore, we did not find
102
support of the hypothesis that there are significant interactions between gender
and ethnicity in the relationship between NWF-1 and SAT-10 Reading
Comprehension when considering each risk group separately.

103
Chapter Five
Discussion
The purpose of this study was to examine the validity of the NWF scores
in the fall of first grade as a predictor of SAT-10 reading outcomes in the spring of
first grade in Reading First schools. In particular, differential prediction by
gender, ethnicity, and risk level was examined. In this chapter the findings are
compared to previously reported research, and discussed with regard to
implications for practice and future research. Limitations of this study are also
addressed.
Summary of Findings
Analysis of the data revealed several facts. Firstly, when the “overall”
slope for the relationship between NWF-1 and SAT-10 Reading Comprehension
scores was calculated, a regression coefficient of 1.41 was found. Secondly, a
significant difference in achievement of NWF-1 and SAT-10 Reading
Comprehension scores was noted between socioeconomic groups (p < .001).
Students participating in the federal free or reduced lunch program were found to
perform more poorly on both tests than those not participating in those programs.
This finding supports a growing body of research citing socio-economic status as
an important variable in educational research (Evans, 2004; Klein & Jimerson,
2005). Specifically, Evans (2004) cited many reasons to explain the poorer

104
performance of economically disadvantaged children including: low–income
children are read to less frequently, watch more TV, have less access to books and
computers, live in noisier homes due to reduced living space, and are exposed to
more environmental pathogens. Klein and Jimmerson (2005) found that
significant differences in reading fluency levels varied widely between free,
reduced and regular lunch groups and studies that dichotomize the lunch variables
are common in educational research. Because these studies demonstrated the
importance of socio-economic status as a variable, in this study all the analyses
between groups were controlled for participation in the free and reduced lunch
program so that differences found were attributable to the primary independent
variables of gender, ethnicity and risk levels.
Gender
With regard to group trends, females tended to score significantly higher
on both tests than males (p<.001). This finding is consistent with previous
research (Klein & Jimerson, 2005; Prochnow, Tunmer, Chapman, & Greaney,
2001; Raffaele-Mendez, Mihalas, & Hardesty, 2006; Tyre, 2006) that found girls
tend to outperform boys in reading, and that this effect is a world-wide
phenomenon (Chu & McBride, 2006). However, very little explanatory power
was added to the model by adding gender into the regression. This finding is
consistent with previous research by Klein and Jimmerson, (2005) in which the
oral reading differences were not biased for gender. In this study, although the
NWF X Gender interaction was statistically significant, when the effect size was
taken into account, the interaction did not appear to add any extra explanatory

105
power. This finding is very important when determining the fairness, lack of bias,
and predictive validity of DIBELS NWF for SAT-10 Reading Comprehension
outcomes. It also indicates that the NWF scores predict equally well for both
gender groups. However this study did not address long term outcomes for either
gender group, so the predictive validity is only assured between the Fall
administration of NWF and the Spring administration of the reading portion of the
SAT-10 in first grade.
Ethnicity
Caucasians tended to score significantly higher on the SAT and NWF than
Hispanics or African Americans (p<.001). African-Americans also scored
significantly higher than the Hispanic students in this sample. Also the interaction
between African-American and NWF-1 when predicting SAT-10 Reading
Comprehension scores was significant (p< .015). The slopes for the relationship
between NWF taken in the Fall and the SAT-10 Reading Comprehension varied
across different ethnic groups. The interaction between African-American and
NWF scores was significant (p<.01). However, the interaction between Hispanics
for NWF and SAT scores was not significantly different. However, when this
difference in slopes was examined for functional importance and adding
explanation to the model, the effect size was less of .01, which is minimal, and
virtually adds no explanatory power to the model. This suggests that the
difference between African-Americans and Caucasians in terms of the
relationship between NWF and SAT-10 Reading Comprehension is not very
important.

106
This finding supports previous research comparing different ethnic
groups’ performance on reading achievement (Hixson & McGlinchey, 2004;
Kranzler, Miller, & Jordan, 1999.). Klein and Kranzler, Miller, and Jordan
(1999) found differences between 4th and 5th grade levels with intercept
differences for race and ethnicity, and intercept and slope bias at Grade 5.
Specifically, their study found significantly lower scores of African-American
students than Caucasians on CBM reading and California Achievement Test
(CAT) Reading Comprehension subtests in all grades with the exception of the
Reading Comprehension measure in grade 2. Kranzler reported that scores on the
CBM measures over-predicted scores for African-American students on the CAT
Reading Comprehension test especially at Grades 4 and 5, while under-estimating
the achievement of Caucasians. This finding was in part attributed to differential
intercepts found for the differing ethnic/racial groups. In particular, the results of
the analysis revealed that bias effects were different for each grade level
examined. Bias effects for racial and ethnic differences were not significant at
Grade 2, but at Grade 3 they were. Grade 4 and 5 had the highest significant
differences between the Caucasian and African-American intercepts. At Grade 4
the intercept for Caucasians was 77.16 points higher than that for the African-
Americans, which was equated to a 1.13 SD difference for ethnic/racial factors.
For Grade 5, gender and racial bias were indicated, with the intercept for
Caucasians significantly higher (52.19 points) than African-Americans. The
intercept for boys and girls was also significantly different at this grade level,
being significantly higher for girls. Also, the slopes differed for each gender at

107
this grade level. Kranzler et al reported the boys’ slopes to be ‘relatively flat and
insignificant,’ while the girls’ slope was ‘positive and substantial.’ These findings
suggested differences for both gender and racial/ethnicity factors with CBM,
especially at 4th and 5th grade levels.
Alternatively, Hixson and McGlinchey (2004) found that correlations
between the CBM ORF scores and the Michigan Educational Assessment
Program (MEAP) did not differ significantly for Caucasians, African-Americans,
paid lunch, or those who participated in the free-and reduced lunch program.
Correlations between the ORF and the Michigan Achievement Test 7th Edition
(MAT-7) were significantly different for Caucasians and African-Americans
(p<.001). Significant differences were found in the intercept between the two
groups. However, when simultaneous multiple regression was used to assess the
significant contribution of the variables, the R2 changed from .63 to .64 for the
racial group analysis, and therefore it was concluded that no significant additional
variance was explained by adding racial group to the prediction of the MEAP
scores. This finding is consistent with previous research by Klein and Jimerson
(2005) who also did not find slope differences with respect to ethnicity when SES
was controlled, as well as with the findings of the current study.
The current study therefore suggests that the relationship between SAT-
10 Reading Comprehension and NWF-1 is sufficiently similar across ethnic
groups.

108
Risk Levels
No significant differences were found in prediction by risk level, once
effect size was calculated, supporting similarity of prediction for SAT-10 across
the different risk groups. Specifically, the overall findings were that when each
risk subgroup was analyzed separately, the explanatory power added by the
inclusion of the interaction was not statistically significant. Also, no significant
interactions between gender and ethnicity were evident when considering each
risk group.
The results of this study are important because they indicate that
psychometrically different predictions of SAT-10 Reading Comprehension
outcomes from initial NWF scores do not occur based on gender, three ethnicity
groups (African American, Caucasian, and Hispanic), nor risk levels. This
information is of practical significance because it implies fair determination of
which children are identified as ‘at risk’ of future reading failure based on initial
NWF scores. Such results may also extend to the use of NWF for not only helping
determine which children need additional support early, but also for monitoring
progress and determining response to intervention.
Limitations
Predictive Validity
Correlations between NWF-1 and SAT-10 Reading Comprehension ranged
between .16 and .60 and the variance explained by NWF-1 (.37) in the
hierarchical model was significant at p<.001. Although NWF-1 contributes
explanatory information regarding a child’s performance, it explained 37% of

109
variance, suggesting other missing variables may also significantly determine or
correlate with SAT-10 Reading Comprehension performance. Regression analysis
is a correlational analysis reflecting the degree of relationship between variables
of interest, not an analysis of cause. Because we cannot conclude that NWF-1
performance is causally related to SAT-10 Reading Comprehension score, the
following limitations are those which affected the data collection and implications
from the analyses.
Maturation effects. Maturation is considered a theoretical threat to the
internal validity of this study because we know the predictor and outcome
measures were taken months apart and the effect of maturation cannot be
controlled, as we cannot prevent this. Yet, maturation is a normal part of school
naturalistic research, and is reflected in increasing goal difficulty over time.
Nevertheless, the NWF measure has been designed and validated for repeated
measurement, for progress monitoring, and previous research has cited the
strengths of its’ overall reliability (Good et al., in press) with test-retest reliability
data collected on kindergarten and first grade children.
Testing conditions. The second issue pertains to the fact that an existing data
set was used and the researcher had no control over checking the accuracy and
reliability of testing. Although it is standard practice with DIBELS assessments
that the examiners are specially trained in test administration, the researcher has
no information concerning the amount of training the examiners who collected
this information had. For instance, if there was a long gap between their training
and their examining of children, possibly they may have made errors in marking
110
the protocols. The problems of systematic versus random error have been
minimized as much as possible in the collection of this data set. All examiners
were trained in DIBELS administration to reduce systematic error in
administration. However, random human error could still occur. Inaccurate
scoring could introduce error into the results (an internal validity issue). In all test
situations, there is always a degree of human error, which will in some way
confound the scores, and although rigorous training tries to standardize
administrations, the possibility of error will always be present when marked by
people, and therefore it must be mentioned as an internal validity issue.
Threats to External Validity
External validity refers to the extent to which a study can be generalized
(applied) beyond the sample. To be specific, external validity refers to the degree
to which the findings may be generalized to other populations (population
validity) and other settings (ecological validity) (Del Seigle, 2007). In this study
population validity is worth discussing because the participating children attended
Reading First schools. These schools are representative of a generally lower SES
demographic and higher educational risk than the overall population of general
educational children.
Population validity. The results gleaned from this study may only directly
represent the Reading First population. Specifically, the regression coefficients,
and proportion of variance explained by SES may be confounded by the nature of
the population that attends Reading First schools. That there were differences
found in the regression lines or slopes across the groups may need further

111
research to determine probable cause, as this research was a correlational
analyses. Although previous research cites the link between poverty and
achievement over time in the school system (Evans, 2005; Mathis, 2005; Ramirez
& Carpenter, 2005), poverty and low SES were controlled for in this study’s
analysis, and not investigated as a causal effect.
Another aspect of a threat to the population validity within this sample is
the identification of population groups by ethnicity. Within a multi-cultural
society, there are inter-racial, bi-ethnic marriages and children whose parents’
genealogy represents diversity. Concepts of race and ethnicity as distinguishing
factors between groups have been challenged by scholars within the field of
Critical Race theory as representing a socio-cultural construct (Lawrence, 1993;
Smedley, 1999). In this study, parents of participants self-selected the race
category for their child, but these data should be interpreted cautiously. Although
“mixed” ethnicity was a choice available, in current American society, a child with
any percentage of Hispanic or African-American lineage is not currently
considered Caucasian, regardless the color of their skin, or language spoken at
home. This study found differences between different ethnic groups, however, as
ethnicity was a self-determined variable, and percentages of “mixed” ethnicity
were not examined, the dissemination of the results varying by ethnicity should be
addressed with caution for the reasons explained. Although a main effect was
observed with the regression lines, when the effect size was calculated, the
differences were not of educational significance. This supported the interaction

112
effect showing ethnicity produced little explanation to the model, after controlling
for SES.
Ecological validity. Ecological validity refers to the extent to which the
results of research “can be generalized from the set of environmental conditions
created by the researcher to other environmental conditions (settings and
conditions) (Seigle, 2007). In this study, the sample was drawn from all the
Reading First schools in Florida, and these schools have specific guidelines they
must follow regarding the nature of reading curriculum and instruction. These
guidelines are designed to promote reading skills. These schools also receive
special funding to support reading instruction. Thus, caution should be excercized
in generalizing the results to other educational establishments.
Implications for Practice and Research
With legislative changes (e.g., IDEA, NCLB), greater opportunity now
exists for school psychologists to use a problem-solving or outcomes-driven,
response to intervention approach to identifying and evaluating those children who
may need special educational services. Children who are not successful in general
education with a Tier one curriculum and/or intervention may be identified as in
need of additional instructional support through screening tools like the DIBELS
NWF. However, the predictive validity of screening tools is critical to the first step
of the outcomes-driven model, identifying the need for support. Thus, tools that
differentially predict performance could be problematic. If there were problems in
identifying risk status for any population, the effectiveness of a Tier One screening
tool, and subsequent progress monitoring tool could be jeopardized. The results of
113
this research found no significant differential prediction of SAT-10 Reading
Comprehension scores in the spring based upon NWF score in the fall with respect
to either gender or ethnicity. This finding is important for educators because
measures used to identify children’s achievement need to be culturally sensitive
and unbiased. It is important to examine differential prediction in our current
society because educators encounter increasingly diverse populations and diverse
abilities. It is important that schools use measures that do not result in differential
outcomes for different populations, to ensure that children who truly need
intervention are identified in an accurate and timely manner, so educators can
provide the necessary instructional support to close achievement gaps.
Implications of these findings support the growing interest in identifying
children at risk early in their schooling so there is time to implement research-
based methods to help close achievement gaps and boost the literacy skills of the
nation at large. This study found support for the use of DIBELS NWF for
identifying students at-risk for reading failure. No significantly different
prediction was found between sub-groups of the sample selected from the
population. However, this study did not examine longer-term (i.e., across more
than one year) effects of having a high or moderate risk score in first grade. With
current interest in reading assessment and intervention, and federal government
recognition of the problems of the traditional IQ-achievement model, there is
growing interest in the use of assessments like CBM and DIBELS to support the
identification of students with learning disabilities within an RTI service delivery
model (Nelson & Machek, 2007).

114
The finding of no significantly different prediction facilitates test
administration and score interpretation across schools and districts. It is important
that decision making in schools is consistent, so administrators determine future
educational plans without over or under-identifying children at risk, and
potentially misallocating resources. Subsequently, because NWF did not predict
differentially for various subgroups in this study, it is likely a useful aide in the
early identification of students at risk for reading difficulties across populations.
However, NWF alone is not a comprehensive assessment tool for determining
reading success probabilities. As with any test used to screen students, results
should be interpreted as a statement about probabilities. Thus, some identification
of false-positives – children who are identified at risk of future reading failure,
who will outperform the prediction and pass within normal score limits—will
occur. In part, such a finding is likely due to the effectiveness of intervening
instruction that occurs between the time of screening and the time of outcome
assessment.
Directions for Future Research
Further research could replicate the study with a different population to
examine trends. Additional research can examine other assessment tools that can
determine other literacy skill deficits. NWF only measures one core component
of early literacy skills—the alphabetic principle. Further, NWF does not address
more advanced alphabetic principle skills such as recognition of double vowels,
double consonants, or common suffixes and prefixes. Because there is a gap
between the alphabetic principle skills measured by NWF and the skills measured

115
by ORF, there is room for alternative assessments to identify other literacy skills
which are in need of remediation to support identification of learning goals for ‘at
risk’ readers.
Another suggestion for future research would be to examine which
proportion of children still remain in high risk categories across time in the first
three years of elementary school, especially as Florida has a retention policy for
anyone who fails the FCAT in grade 3. It would be interesting to be able to report
an effect size of movement from high risk to moderate risk or low risk groups
based on intervention, natural maturation of children, and any other variable (e.g.,
change in SES status, one parent family, health or influence of home language).
However, the difficulties of assessing and maintaining treatment integrity across
naturalistic environments is a factor which could make such a study very difficult
to conduct.
This research adds to the body of literature on NWF, gender and ethnicity.
Once results were controlled for SES, very little additional variance was
explained by either gender or ethnicity. Further research may be recommended to
support the use of one set of benchmark scores to help determine risk levels, as
this study did not examine cut-off scores; however this research has confirmed a
strong link between the use of DIBELS NWF and the outcome result of the SAT-
10 Reading Comprehension scores. The lack of differential prediction between
and across subgroups in this sample suggests that NWF is suitable to use with
diverse populations in Reading First schools in Florida.

116
References
AIMSweb (2004). AIMSweb growth tables. Retrieved May 17, 2007, from
http://www.aimsweb.com/norms.
American Association of University Women (AAUW) (1992). How schools
shortchange girls: A study of major findings on girls and education.
Washington, DC: AAUW Educational Foundation.
Armbruster, B., Lehr, F., Osborn, J. (2001). Put reading first: the research
building blocks for teaching children to read. Center for the Improvement
of Early Reading Achievement (CIERA), National Institute for Literacy,
MD.
Kaminski, R. A., Good, R. H., III, Baker, D., Cummings, K, Dufour-Martel, C.,
Fleming, K., Knutson, N., Powell-Smith,K., Wallin, J. (2006). Position
paper on use of DIBELS for system-wide accountability decisions. The
Dynamic Measurement Group.
Baker, J. M. (1987). Battling the IQ-test ban double discrimination. Newsweek,
0028-9604, July 27th, v.11. p 53 (1)
Baron, R. M., & Kenny, D. A. (1986). The moderator-variable distinction in
social psychological research: Conceptual, strategic, and statistical
considerations. Journal of Personality and Social Psychology, 51, 1173-
1182
Barton-Arwod, S.M (2003). Reading instruction for elementary-age students with

117
emotional and behavioral disorders: Academic and behavioral outcomes.
Dissertation Abstracts International Section A: Humanities and Social
Sciences 64, (3-A) 856.
Bartlett, C.J., Bobko, P., Mosier, S.B., & Hannan, R. (1978). Testing for fairness
with a moderated multiple regression strategy: An alternative to
differential analysis. Personnel Psychology, 31, 233-241
Bass, A.R. (1976). The Equal-risk model. American Psychologist, 31, (8), 611-
612
Bell, Y.R., Clark, T.R. (1998). Culturally relevant reading material as related to
comprehension and recall in African American children. Journal of Black
Psychology, 24, (4), 455-475
Benner, G.J. (2003). The investigation of the effects of an intensive early literacy
support program on the phonological processing skills of kindergarten
children at-risk of emotional and behavioral disorders. Dissertation
Abstracts, Humanities and Social Sciences 64 (5-A), 1596
Bussing, R., Zima, B.T., Belin, T.R., & Forness, S. (1998). Children who qualify
for LD and SED programs: Do they differ in level of ADHD symptoms
and comorbid psychiatric conditions? Behavior Disorders, 23, 85-97
Calhoon, M.B., Al Otaiba, S., & Greenberg, D. (2006). Improving reading skills
in predominantly Hispanic Title 1 first-grade classrooms: the promise of
peer-assisted learning strategies. Learning Disabilities Research and
Practice, 2 (4) 261-272

118
Carney, B.N. (2004). Review of the Stanford Achievement Test, Tenth Edition.
Buros Mental Measurements Yearbook. University of Nebraska: Buros
Institute.
Castillo, J., M. (2005) The predictive validity of four reading fluency measures on
a standard outcome assessment. Unpublished thesis, University of South
Florida
Chiu, M.M., & McBride-Chang, C. (2006) Gender, context and reading: A
comparison of students in 43 Countries, Scientific Studies in Reading, 10
(4) 331-362
Cleary, T. A. (1965). An individual differences model for structural equations,
Dissertation Abstracts, 25(11), 1965. pp. 6750-6751. release date
19650601, accession number: 1965-13257-001
Cleary, T. A. (1968). Prediction of grades of Negro and White students in
integrated colleges. Journal of Educational Measurement, 5, 118-124.
Cole, N. S., & Moss, P. A. (1993). Bias in Test Use. In R.L. Linn (Eds.),
Educational measurement, third edition (pp. 201-220). Phoenix, AZ: The
Oryx Press.
Colon, E. P., Kranzler, J. H. (2006). Effective Instructions on Curriculum-Based
Measurement of Reading. Journal of Psychoeducational Assessment,
24,(4),318-328
Coyne, m. D., Harn., B. A. (2006). Promoting Beginning Reading Success
Through Meaningful Assessment of Early Literacy Skills. Psychology in
the Schools, Vol. 43, (1), 33-43.

119
Dempster, R.J. (2001). Understanding errors in risk assessment: the application of
differential prediction methodology, Simon Fraser University
Diana v. State Board of Education (1970). Retrieved Dec.19, 2006 from,
http://questia.com/PM.qst?a=o&se=gglsc&d=5009958603&er=deny.
Education Commission of the States (1996). The Progress of Education
Reform, 1996. Denver. Education Commission of the States.
Elliott, S. N.; Huai, N.; Roach, A. T. (2007). Universal and early screening for
educational difficulties. Journal of School Psychology, 45,(2) 137-161
Elliott, J., Lee, S., Tollefson, N. (2001). A reliability and validity study of the
Dynamic Indicators of Basic Early Literacy Skills-Modified, School
Psychology Review, 30 (1) 33-49.
Evans, G. W. (2004). The Environment of Childhood Poverty, American
Psychological Association, 59, (2) 77-92
Evans-Hampton, T. N.; Skinner, C. H.; Henington, C.; Sims, S.P.; McDaniel, E.
(2002). An investigation of situational bias: Conspicuous and covert
timing during curriculum-based measurement of mathematics across
African-American and Caucasian students. School Psychology Review,
Vol 31(4), 529-539.
Evans, R. (2005). Reframing the Achievement Gap, Phi Delta Kappan, 86 (8),
588-589
Ferri, B.A. & Connor, D.J. (2005). Tools of exclusion: Race, disability, and
(Re)segregated education. Teachers College Record, 107, (3), 453-474

120
Ferri, B.A., & Connor, D. J. (2005a). In the shadow of Brown: Special education
and overrepresentation of students of color, Remedial and Special
Education, 26, (2), 93-100
Flaugher, R.L. (1978). The Many Definitions of Test Bias. American
Psychologist, July 1978.
Florida Department of Education. Fact Sheet: NCLB and Adequately Yearly
Progress. Retrieved January 25, 2005, from,
http://www.fldoe.org/NCLB/FactSheet-AYP.pdf.
Freeman, C. E. (2005). Trends in educational equity of girls and women: 2004.
(NCES 2005 -016). Washington D.C.: U.S. Department of Education,
National Center for Educational Statistics.
Fuchs, L., Fuchs, D., Compton, D.L., (2004). Monitoring early reading
development in first grade: Word Identification Fluency versus
Nonsense Words. Council forExceptional Children, 71 (1) 7-21
Ghiselli, E. E., (1956). Differentiation of individuals in terms of their
predictability. Journal of Applied Psychology, 40, 374-377
Ghiselli, E.E. (1960a). The prediction of predictability. Educational and
Measurement, 20, 3-8
Ghiselli, E.E., (1960b). Differentiation of tests in terms of the accuracy with
which they predict for a given individual. Educational and Psychological
Measurement, 20, 675-684
Good III, R. H., & Kaminski, R. (1996). Assessment for instructional decisions:
toward a proactive/prevention model of decision making for early literacy

121
skills. School Psychology Quarterly, 11,(4), 326- 336
Good , R. H., Baker, S. K., & Peyton, J. A. (in press). Making sense of nonsense
word fluency. Determining adequate progress in early first grade reading,
Reading and Writing Quarterly.
Good III, R. H., Simmons, D.C., & Kame’enui, E. J. (2001). The importance and
decision-making utility of a continuum of fluency-based indicators of
foundational reading skills for third-grade high-stakes outcomes.
Scientific Studies of Reading, 5, 257-288
Good, R, H., Wallin, J., Simmons, D. C., Kame’enui, R. A., & Kaminski (2002).
Systemwide percentile ranks for DIBELS benchmark assessment
(Technical Report No. 9) Eugene, OR: University of Oregon
Greer, D. C. (2006). Logic-mathematical processes in beginning reading.
Dissertation Abstracts, International Section A: Humanities and Social
Sciences, 66(12-A) 4292
Gresham, F. M., & Witt, J. C. (1997). Utility of intelligence tests for treatment
planning, classification, and placement decisions: Recent empirical ‘
findings and future directions. School Psychology Quarterly, 12, 249-267
Haagar, D., Windmueller, M. (2001). Early reading intervention for English
language learners at- risk for learning disabilities: Student and teacher
outcomes in an urban school. Learning Disability Quarterly, 24 (4) 235-
249
Harcourt Assessment Inc. (2006). Stanford 10 Achievement Tests, 19500,
Bulverde Road, San Antonio, Texas, 78259.
122
Healy, K.; Vanderwood, M.; Edelston, D. (2005). Early literacy interventions for
English language learners: Support for an RtI model. California School
Psychologist. 10, 55-63
Hintze, J. M., Callahan, J. E. III, Matthews, W. J., Williams, S. A. S., & Tobin, K.
G. (2002). Oral reading fluency and prediction of reading comprehension
in African-American and Caucasian elementary school children, School
Psychology Review, 31,(4), 540-553.
Hintze, J. M.; Ryan, A. L.; Stoner, G. (2003). Concurrent and diagnostic accuracy
of the Dynamic Indicators of Basic Early Literacy Skills and the
Comprehensive Test of Phonological Processing. School Psychology
Review, 32 (4) 541-556
Hixson, M. D., McGlinchey, M. T.(2004). The relationship between race, income,
and oral reading fluency and performance on two reading comprehension
measures. Journal of Psychoeducational Assessment, 22, 351-364.
Huebner, E. S. (1990). The generalizability of the confirmation bias among school
psychologists, School Psychology International, 11, 281-286
Iannuccilli, J. A (2004). Monitoring the progress of first-grade students with
Dynamic Indicators of Basic Early Literacy Skills. Dissertation
Abstracts,Humanities and Social Sciences, 64, (8-A) 2824
Institute for the Development of Reading (IDEA) (2002-2004). The Big Ideas in
Beginning Reading, retrieved from: http://reading.uoregon.edu

123
Juel, C. (1998). Learning to read and write: A Longitudinal Study of 54 children
from first through fourth grades. Journal of Educational Psychology 80,
(4)437-447
Kaminitz-Berkooz, I. and Shapiro, E.S. (2005). The applicability of curriculum-
based measurement to measure reading in Hebrew. School Psychology
International, 26, (4) 494-519.
Kaminksi, R. A., Good, R. H. (1996). Toward a technology for assessing basic
early literacy skills. School Psychology Review, 25, 215-227
Kaminski, R. A., Cummings, K. D., Powell-Smith, K. A., & Good, R. H. III
(2008). Best practices in using Dynamic Indicators of Basic Early Literacy
Skills (DIBELS®) for formative assessment and evaluation. In A. Thomas,
& J. Grimes (Eds.), Best practices in school psychology-V, (pp. 1181-
1204). Bethesda, MD: National Association of School Psychologists.
Kamps, D. M.; Wills, H. P.; Greenwood, C. R.(2003) .Curriculum influences on
growth in early reading fluency for students with academic and behavioral
risks: A descriptive study. Journal of Emotional and Behavioral
Disorders, Special Issue: Academic status of children with emotional
disturbance. 11 (4) 211-224
Kao, G., and Tienda, M. (1995). Optimism and achievement: the educational
performance of immigrant youth. Social Science Quarterly, 76, 1-19.
Kaufman, A. S., & Kaufman, L. N.(1990). Kaufman Brief Intelligence Test.
Circle Pines, MN, American Guidance Service, Inc.

124
Kaufman A., O'Neal, S., Marcia, R. (1998). Factor structure of the Woodcock-
Johnson cognitive subtests from preschool to adulthood. Journal of
Psychoeducational Assessment, 6, (1), 35-48
Kamps, D. M.; Wills, H. P.; Greenwood, C. R. (2003). Curriculum influences on
growth in early reading fluency for students with academic and behavioral
risks: A descriptive study. Journal of Emotional and Behavioral Disorders
11, (4). Special Issue: Academic status of children with emotional
disturbance. pp. 211-224
Kaufmann, J. M. (1977). Characteristics of emotional and behavioral disorders of
children and youth (6th ed.) Upper Saddle River, NJ: Prentice Hall
Klein, J. R. & Jimmerson, S. R. (2005). Examining ethnic, gender, language and
socioeconomic bias in oral reading fluency scores among Caucasian and
Hispanic Students. School Psychology Quarterly, Vol.20 (1), 23-50.
Knoff, H. M., Dean, K. R. (1994). Curriculum-based measurement of at-risk
students’ reading skills: a preliminary investigation of bias. Psychological
Reports. 75, (3, Pt1)1355-60
Knopik,V. S., Alarcon, M., & DeFries, J. C. (1998). Common and specific gender
influences on individual differences in reading performance: A Twin
Study. Personality and Individual Differences, 25, 269-277
Kranzler, J. H., Miller, D. M., & Jordan, L. A (1999) An examination of
racial/ethnic and gender bias on curriculum – based measurement in
reading, School Psychology Quarterly, 14(3), 327-342.

125
Larry P. v. Riles (1979). Retrieved Dec 19, 2006, from,
http://www.gnxp.com/MT2/archives/002326.html.
Lopez, M.E. (2001). A comparative study on the role of phonological awareness
on Spanish and English reading acquisition for Spanish-speaking first-
graders. Dissertation Abstracts,International Section A: Humanities and
Social Sciences. 61 (9-A) 3505.
Mashburn, A. J., Hamre, B. K., Downer, J. T., Pianta, R. C. (2006). Teacher and
classroom characteristics associated with teachers’ ratings of
prekindergatners’ relationships and behaviors. Journal of
Psychoeducational Assessment, 24, 367-380
Mathis, W. J. (2005). Bridging the achievement gap: A bridge too far? Phi Delta
Kappan, 86 (8), 590-593
McMillan, P. (2000). Simultaneous measurement of reading growth, gender, and
relative-age effects: many-faceted rasch applied to CBM reading scores.
Journal of Applied Measurement, 1, (4) 393-408.
Millsap, R. E. (1995). Measurement Invariance, Predictive Invariance, and the
Duality Paradox, Multivariate Behavioral Research, 30 (4) 577-605
McNemar, Q. (1975). On so-called Test Bias, American Psychologist, 30 (8),
848-851
Morse, D. T. (2004). Review of the Stanford Achievement Test, Tenth Edition.
Buros Mental Measurement Yearbook. University of Nebraska: Buros
Institute.

126
Nagy, W., & Anderso, R.C., (1984). How many words are there in printed school
English? Reading Research Quarterly, 19, 304-330
National Center for Education Statistics (NCES) (2005). Highlights from the 2003
International Adult Literacy and Lifestyles Survey (ALL) US Department
of Education, Institute of Education Sciences. Retrieved Dec. 19, 2006,
from http://nces.ed.gov/NAAL/index.asp?file=KeyFindings/
Demographics/ RaceAge.asp &PageID=17.
National Reading Panel Report, (2000). Retrieved Dec. 16, 2006, from
http://www.nationalreadingpanel.org/Publications/publications.htm.
National Research Council, (1998). C.E.Snow and M.S.Burns (Editors)
Preventing Reading Difficulties in Young Children, National Academy
Press, Washington, DC.
Nelson, J. M., Machek, G. R. (2007). A survey of training, practice, and
competence in reading assessment and intervention. School Psychology
Review, 36, (2) 311-327
No Child Left Behind (2001). Retrieved October 21, 2006, from
http://www.ed.gov/nclb/landing.jhtml.
Onwuegbuzie, A. J. (2003). Expanding the Framework of Internal and External
Validity in Quantitative Research, Mid-South Educational Research
Association, 10, (1) 71-89.
Prochnow, J. E., Tunmer, W. E., Chapman, J. W., & Greaney, K. T. (2001). A
longitudinal study of early literacy achievement and gender, New Zealand
Journal of Educational Studies, 36, (2), 221-236.

127
Raffaele-Mendez, L. M., Mihalas, S. T., Hardesty, R. (2006). Gender differences
in academic development and performance, in Children’s Needs III:
Development, Prevention and Intervention, NASP., p.553-566.
Ramirez, A. & Carpenter, D. (2005). Phi Delta Kappan, 86 (8) , 599-602
Reschley, D. J. (2000). The present and future status of school psychology in the
United States. School Psychology Review, 29, 507-522
Register, D. (2004). The effects of live music groups versus an educational
children’s television program on the emergent literacy of young children.
Journal of Music Therapy, 41, (41) 2-27.
Reynolds, C. R. (1990). The handbook of psychological and educational
assessment of children, Chapter 7). New York: Guildford Press.
Roberts, G., Good, R., Corcoran, S. (2005). Story retell: A fluency-based
indicator of reading comprehension. School Psychology Quarterly, 20,
(3), 304-317.
Rouse, H. L. & Fantuzzo, J. W. (2006). Validity of the Dynamic Indicators for
Basic Early Literacy Skills as an Indicator of Early Literacy for Urban
Kindergarten Children. School Psychology Review, 35, 341-355
Samanich, T. T. (2004). The effectiveness of the Scott-Foresman early reading
intervention program on improvement of phonemic awareness and
decoding skills for a sample of at-risk kindergarten students. Dissertation
Abstracts: Humanities and Social Sciences 65, (3-A) 831.

128
Sackett, P. R., Laczo, R. M., & Lippe, Z. P. (2003). Differential prediction and the
use of multiple predictors: The omitted variables problem. Journal of
Applied Psychology, 88, (6), 1046-1056.
Shields, J., Konold, T. R., Glutting, J. J. (2004). Validity of the Wide Range
Intelligence Test: differential effects across race/ethnicity, gender, and
educational level, Journal of Psychoeducational Assessment, 22, 287-303.
Siegel, D. (2007). External Validity (Generalizability), retrieved November 11,
2007, from http://www.gifted.uconn.edu/siegle/research/ Samples/
externalvalidity.html.
Smedley, A. (1999). Race in North America: Origin and Evolution of a
Worldwide View, Westview Press.USA.
Snow, C. E., Burns, M. S., & Griffin, P. (1998). Preventing Reading difficulties in
young children. Washington, DC; National Academy Press.
Speece, D. L; Mills, C.; Ritchey, K. D; & Hillman, E. (2002). Journal of Special
Education, 36, (4)223-233
Stanovich, K.E.(1986). Matthew Effects in Reading: Some consequences of
individual differences in the acquisition of literacy. Reading Research
Quarterly, 21, 360-407
Stone, B. J. (1992). Prediction of achievement by Asian-American and white
children. Journal of School Psychology, 30, 91-99.
The Institute of Education Sciences (IES), US Department of Education,
Retrieved October 26, 2006, from
http://www.ed.gov/about/offices/list/ies/index.html.

129
Technical Assistance Paper 12740, (2006). The Bureau of Exceptional Education
and Student Services, US Department of Education, Tallahassee, FL
The Organization for Economic Cooperation and Development (OECD) (2003).
Learning a Living: First Results of the Adult Literacy and Life Skills
Survey (ALL), retrieved October 26, 2006, from
http://www.oecd.org/home/0,2987,en_2649_201185_1_1_1_1_1,00.html.
Tivnan, T., Hemphill, L. (2005). Comparing four literacy reform models in high –
poverty schools; patterns of first-grade achievement, The Elementary
School Journal, 105 (5), 419-438.
Torgesen, J. K., (2006). Preventing reading difficulties in very large numbers of
students: The Reading First Initiative, Florida Center for Reading
Research, Florida State University, Meetings of the International Dyslexic
Association, November 2006. (Powerpoint)
Torgesen, J. K., & Byrant, B. R. (1994). Test of Phonological Awareness,
Burlingame, CA., Psychological and Educational Publications Inc.
Tulloch, S., Eisner, E., McCrary, J., Rooney, C. (2006). National Assessment of
Title 1, Interim Report, Volume 1: Implementation, Institute of Education
Sciences, National Center for Educational Evaluation and Regional
Assistance, US Department of Education.
US Department of Education, National Assessment of Title 1, Interim Report,
Volume 1: Implementation, National Center for Educational Evaluation
and Regional Assistance, Institute of Education Sciences. Retrieved
130
October 26, 2006 from http://www.ed.gov/about/reports/ annual/
nclbrpts.html.
U.S. Department of Education Office of Special Education and Rehabilitative
Services (2002). A New Era: Revitalizing Special Education for Children
and Their Families. Washington, DC. Retrieved from December 18, 2006
from http://www.ed.gov/inits/commissionsboards/ whspecialeducation/
reports/index.html
US Dept, of Education: Answers: Retrieved March 23, 2007.
http://answers.ed.gov/cgibin/education.cfg/php/enduser/std_adp.php?p_fa
qid=8&p_created=1095258227&p_sid=HJj1uJwi&p_lva=&p_sp=cF9zcm
NoPSZwX3NvcnRfYnk9JnBfZ3JpZHNvcnQ9JnBfcm93X2NudD0xMjE
mcF9wcm9kcz0mcF9jYXRzPSZwX3B2PSZwX2N2PSZwX3BhZ2U9M
Q**&p_li=&p_topview=1.
Wehby, J. H.; Falk, K. B.; Barton-Arwood, S.(2003). The impact of
comprehensive reading instruction on the academic and social behavior of
students with emotional and behavioral disorders. Journal of Emotional
and Behavioral Disorders). Special Issue: Academic status of children
with emotional disorders.,11 (4 225-238
Wehby, J. H.; Lane, K. Falk, K. B. (2005). An inclusive approach to improving
early literacy skills of students with emotional and behavioral disorders.
Behavioral Disorders. 30,(2) 155-169

131
Weiss, L. G., & Prifitera, A. (1995). An evaluation of differential prediction of
WIATT achievement scores from WISC-III FSI-IQ across ethnic and
gender groups. Journal of School Psychology, 33, 297-304
Wilkie, P.C. (2002). Are curriculum-based reading probes sex or SES biased?
Criterion-related validity in an elementary – aged sample. Dissertation
Abstracts International: Section B: The Sciences and Engineering, 62, (12-
B), 2002. pp. 6019.
Young, J.W. (1994). Differential Prediction of College Grades by Gender and by
Ethnicity: A Replication Study, Educational and Psychological
Measurement, 54, 1022-1029.

132
Appendix

133
Appendix A: Sample Nonsense Word Fluency Probe