Embed Size (px)
Citation preview

Do Customer Emotions Affect Worker Speed? AnEmpirical Study of Emotional Load in Online
Customer Contact Centers
Daniel Altmana, Shelly Ashtara, Marcello O. Olivaresb, Galit B. Yom-Tova
aTechnion—Israel Institute of Technology, bUniversity of Chile
Problem Definition: Research in Operations Management has focused mainly on system-level load, ignor-
ing the fact that service agents and customers express a variety of emotions that may impact service processes
and outcomes. We introduce the concept of emotional load—the emotional demands that customer behaviors
impose on service agents—to analyze how customer emotions affect service worker’s behavior.
Academic / Practical Relevance: Theories in psychology literature generate ambiguous predictions about
the effect of customer emotion on employee productivity: some theories predict that emotions expressed
by customers reduce productivity (e.g. by increasing the service time required to serve an angry customer)
whereas other theories predict a positive effect (e.g. by motivating the agent to finish an unpleasant con-
versation as quickly as possible). We aim to shed light on which theory is more dominant in reality and
discuss practical opportunities that arise from measuring emotional load, and how it can be used to enhance
productivity.
Methodology: We measure emotional load of agents using a sentiment analysis tool which measure posi-
tive/negative customer emotions in online chat-type contact center, and link it to agent behavior: response
time, the extension of messages and the number of messages required to complete a service request. Identi-
fying a causal effect of customer emotion on agent behavior using observational data is challenging because
there are confounding factors associated to the complexity of service requests, which are related to both
emotions and agent behavior. Our identification strategy uses panel data exploiting the variation across
messages within a focal request, using fixed effects to control for unobserved factors associated to case com-
plexity. Instrumental variables are also used to address issues of measurement error and other endogeneity
problems; the instruments are based on exogenous shocks to agent productivity that have been studied in
the service operations literature.
Results: Analyses show that emotional load created by negative customer emotions increases agent response
time, the extension of the agent messages (a measure of effort) and the required number of messages needed
to solve a case. Emotional load and agent RT reciprocally effect each other, with long agent response times
and high number of messages producing more negative customer emotions.
Managerial Implications: The emotional content in customer communications is an important factor of
the workload assigned to agents in a service system. Our study provides a rigorous methodology to mea-
sure the emotional content from customer text messages and objectively evaluate its associated workload.
We discuss how this can be used to improve staffing decisions and routing workload dynamically through
real-time monitoring of emotional load.
1

2
1. Introduction
Research on service delivery reports extensively on the impact of operational factors on worker
productivity. Most of this research focuses on the impact of system-level load, as measured by
the number of customers per worker, on employee productivity (e.g. Kc and Terwiesch (2009)).
However, service delivery involves people—both workers and customers—who inevitably vary in
their behavior, the emotions they express, and the ways in which they respond to other people.
We posit that studying customer emotion is particularly critical for understanding factors affecting
service delivery and can substantially contribute to the understanding and improvement of service
systems.
Understanding the role of customer emotions in service interactions is critical because customer
emotions impact employee performance (Rafaeli et al. 2012) and service outcomes (Barnes et al.
2010). Yet, emotions are generally ignored in operations research (Field et al. 2018). Research
on the interpersonal effects of emotion in Organizational Behavior describes the effects of one’s
emotions on the people with whom he or she interacts (Hareli and Rafaeli 2008). Partners to a
conversation mutually influence each other (van Kleef et al. 2004), an influence that is salient in
service interactions. Customers are at liberty to express emotions, while agents must restrain and
are emotionally labored (Grandey et al. 2010). Agents must express a specific type of emotion (e.g.
“service with a smile” (Pugh 2001)) and suppress negative emotions that customers invoke. Lab
experiments show that customer emotions affect the speed, accuracy and fatigue of service agents
(Rafaeli et al. 2012). Moreover, negative customer emotions (as pronounced by verbal aggression)
also lead to incivility of agents (Walker et al. 2017), thus suggesting a reciprocal cycle of influence
between customer emotions and agent behavior.
This research develops a methodology to analyze customer emotions expressed in their commu-
nication with service agents and measure its impact on the behavior of service agents, which is
important to evaluate productivity and optimize work allocation. To the best of our knowledge,
available studies on emotion effects have not examined actual, real-time customer-agent conversa-
tions, and thus provide only limited insights for operational implications; research in psychology
relies extensively on lab studies in which participants simulate service interactions (cf. Rafaeli et al.
2012), and on self-report measures (cf. Wang et al. 2011). Moreover, there isn’t much work studying
the impact of positive emotions on service agents. Our work extends the current research into an
understanding of the emotional elements of service interactions in two important ways: (i) predict
and test the effects on micro-level large-scale data of real service conversations and (ii) consider
the effects of a range of customer emotions (from negative to positive) on service agents, using
an objective approach to measure these emotions, which can be replicated in other contexts. We
assert that service interactions vary in the amount and valence of customer emotions that agents

3
encounter and must handle. Analogous to the operational construct of offered load, which measures
the amount of working time required for service delivery, we conceptualize emotional load as the
amount of customer emotion that a service agent encounters and must handle at work. Handling
customer emotions is an important aspect of service delivery: many service organizations require
their employees to address customer emotion (Grandey et al. 2010) and provide “service with a
smile” (Pugh 2001).
The context of this study is contact-center service, which is technology-mediated, and therefore
provides opportunities for detailed measures of both agents and customers behavior (Rafaeli et al.
2017). The analyses are conducted at an extremely high resolution of detail, namely the level of
individual messages within individual customer-agent conversations, using panel data based on
a cross-section of identified agents that provide service to multiple customer requests. We use
objective measurements of customer emotion and agent behavior, thus overcoming limitations of
previous research (Rafaeli et al. 2017). Specifically, our work relies on advances in text analysis and
use automated sentiment analysis engines (Thelwall 2013, Yom-Tov et al. 2018) to provide real-
time objective estimation of customer emotion from text messages. We analyze a dataset of 141,777
conversations between customers and service agents of a large western transportation company.
The data includes multiple operational measures. Our main dependent variable—agent Response
Time (RT)—is the time an agent spends reading, processing, and responding to a specific message
of a focal customer, and includes the time an agent spends on handling other parallel customers.
This study tests empirically how emotional load impacts employee behavior by influencing (a)
agent RT to customers, (b) agent effort (measured as the length of text agent writes), and (c) the
number of customer and agent messages required to complete the service. An important challenge
arises in estimating the causal effect of customer emotion on agent RT, a key objective of this study.
Omitted factors related to problem complexity affect both customer emotions and the amount of
work performed by an agent (which translates into RT). For example, if a solution to a problem
requires multiple interdependent stages thus generating a longer RT, a customer might express
frustration. In addition, there is a simultaneity problem: customer emotion and agent RT affect
each other. These problems may produce an endogeneity bias in the estimation. We circumvent
these problems by performing our analysis at the individual message level, treating the service
chat as panel data and also using Instrumental Variables (IVs) as a source of identification; the
instruments are formulated based on exogenous shocks to agent behavior that have been previously
documented in the service operations literature. Another concern we address in this paper is mea-
surement error associated with quantifying customer emotion. To solve that we use an IV approach
with two sentiment analysis tools (see Section 4). Despite the presence of conflicting theories and
predictions (see Section 3) our analyses show that as customer emotion moves from positive to

4
negative emotion, agents put more effort in each response, RT becomes longer, and the number of
turns it takes to complete the service increases.
We also consider a reversed effect of agent behavior on customer emotions. Emotions expressed
by customers, both negative (e.g., anger, frustration, irritation) and positive (e.g., cheerfulness,
happiness), provide cues of customer perceived service quality. Expressions of positive emotions by
customers indicate satisfaction with the service, while negative emotions indicate discontent, and
likely suggest that service issues are not addressed (Yom-Tov et al. 2018). Therefore, we expect
that agent behavior will affect customer emotions. The prediction here depends on whether the
customer perceives RT as related to service or wait time. Since agent RT also include delays due
to multitasking it is important to understand how RT is interpreted by customers. We examine
how the ways agent signals their effort (either by answering quicker, writing longer messages,
or more messages) are interpreted by the customers by their effect on customer emotions. This
analysis carries implications to the way agent should priorities their work (between angry and happy
customers) and communicate their effort to customers, as well as implications to the acceptable
level of in-service-wait (i.e. waiting during customer length-of-stay) that results from concurrency
decisions.
Our paper demonstrates the importance of measuring and documenting micro-level variations
of load within service conversations. Previous research in Operations Management documented
effects of system load on employee efficiency (Delasay et al. 2019), measuring load by number of
people in a queue (Song et al. 2015) or number of customers per agent in a system (e.g. Kc and
Terwiesch (2009)). Findings show ambiguous effects of system load, in some cases being shown to
increase efficiency and in other cases to decrease efficiency. Delasay et al. (2019) therefore called for
research on mechanisms that might drive these effects (e.g., Batt and Terwiesch (2017)). Consistent
with recent calls to incorporate behavioral phenomena into Operations Management research (Cho
et al. 2019), we suggest that considering aspects of emotional load can enhance our understanding
of agent behavior.
Our analyses integrate a Service Operations perspective with Organizational Behavior theory
into a multidisciplinary view of service systems to provide the following contributions:
1. We propose a new construct of emotional load, as distinct from the known construct of system
workload, building on Organizational Behavior theory. The construct highlights the role of emotions
in service operations. We develop and test a systematic and objective methodology to measure
emotional load in real-time, and show that these measures are effectively impact agent behavior.
2. We use micro-level data to quantify the causal effect of customer emotions on three perfor-
mance indicators that can be linked to productivity: RT, extension of messages, and length of
service conversations. Agent RT tend to be longer for customers that express negative emotions,

5
relative to those that express positive emotions. In terms of magnitude, a customer with negative
emotions (one standard deviation below the mean) increases the agent RT by 16.7%, an effect that
is 3.6 times stronger in magnitude than of agent multitasking and 13 times stronger than system-
level load (queue length). The text length written in chats, as a response to negative emotions, is
32% longer than in neutral chats while positive emotion shorten text length by 15% compared to
the text of neutral chat.
3. The analysis also reveals a reversed effect of agent RT on customer emotions. We show that
to reduce sentiment by 1 SD the RT need to increase by 5 minutes. Long RT is also a result of
multitasking and load. In Section 6, we discuss how the organization can use real-time sentiment
analysis tools to improve customer sentiment.
4. Our results support the claim that emotional load is an essential characteristic of workload
that needs to be taken into account in the design of contact centers and the control of service
systems. We show how these empirical results can be used to improve staffing and work allocation
decisions in contact centers. And discuss several ways of how an organization can leverage the
information regarding customer emotions to improve the contact center operations.
2. Context of the Study and Data Description
This study is based on data provided by LivePerson Inc. (https://www.liveperson.com), a plat-
form for customer service contact centers. LivePerson offers a web-based service platform, which
allows end customers to interact with service agents through written messages—a “chat” between
a customer and an agent. Service-agents are employees of the service brand, and work through the
LivePerson service platform, so LivePerson servers mediate the communication between service-
brand agents and customers. Customers who visit a company website may be invited to a chat,
and those who agree are transferred automatically to available service agents. Customers can also
actively request a chat service. If no agents are available, customers must wait. Service chats com-
prise iterations of agent and customer written messages. A feature unique to chat service platforms
is that unlike in the case of phone service platforms, agents can simultaneously interact with mul-
tiple customers. Still, there is a limit to the number of customers that agents can simultaneously
interact with; agents are considered available only if they are both online and interacting with
less than the maximum number of customers (3 in the case of data used in this study). Once a
customer is assigned to an agent, the service (chat) begins. Note that customers are not explicitly
informed of this multitasking practice. Employees waiting for a specific customer to react may
turn to interact with other customers. When an agent is busy with a particular customer, other
concurrent customers may need to wait (we call this waiting during service “in-service-wait”). But
the waiting customers do not know the reason for the agent’s delayed RT as there are no indicators

6
in the customer interface about any other customers present in the system. When the service is
complete, customers exit the system.
2.1. Data Description and Definitions
We obtained data of 162,362 conversations conducted during the period March 2016 to April 2017
between customers and service agents of a western transportation company. The data include
three types of entries: employee lines, customer lines and system lines. The latter are messages
that are automatically generated, and do not reflect any human behavior, therefore we removed
them from the analyses. From here on we use the terms “chat” and “conversation” to refer to a
full service interaction between an agent and a customer. The terms “line” refers to some text
that a customer/agent sent (i.e., pressed “enter”) and “message” refers to a group lines that a
customer/agent sent one after the other, uninterrupted. That is, one a customer/agent sent a few
lines in a row, we collapsed them to a single message. Figure 1 presents a schematic diagram of
simultaneous chats being handled by a particular agent. Each of the three chats illustrated in
Figure 1 is with a different customer, and each chat involves multiple messages sent by an agent
and a customer. Within our sample, a chat lasts on average 12.11 minutes with standard deviation
of SD= 9.95, and has on average 5.28 customer messages (SD= 3.75) and 5.68 employee messages
(SD= 3.701).
12:00 12:01 12:02 12:04 12:05 12:07
Customer 2 (C2)
Customer 3 (C3)
12:08 12:10
All are from customer 1All are from customer 2All are from customer 3All are from the same agent
with no represent earlier sent messages
C1 Assignment
to Agent
11:58
C2 Assignment
to Agent
12:03
C3 Assignment
to Agent
12:06
Customer C1 RT
Customer C1 RT
Agent RT to C1
Agent response time to C1
Agent RT to C2 Agent RT to C3
Customer C3 RT
Customer sends a message to agent
Agent sends a message to C1
Customer 1 (C1)
Figure 1 Example of Agent-Customer Data Flow

7
Each chat is identified by chat ID, employee ID, date, type of service (sales or support), and the
time the customer waited in the queue before the chat started. Each line in the data, of a specific
chat, contains the following information: a time-stamp of when the line was sent, a notation of
who wrote that line (customer, agent, or system), number of words in the line, and a score of the
customer expression of emotion in the line. Due to privacy considerations we do not have direct
access to the text itself or to any demographic indicators of customers and employees. Figure 2
provides an example of such a chat.
Section Agent Response Time Sentiment Turn
Agent 30 sec 1
Customer 0 (neutral) 2
Agent 75 sec 3
Customer -1 (negative) 4
Agent 82 sec 5
Customer -1 (negative) 6
Customer -2 (very negative) 6
Total 6
Jane Smith
Hi, I’m Jane. How may I help you?
I understand that you would like to access your My Account. We are working to fix the problem
That is not good enough. It has been 9 days
No - I don't trust you
I know how important this is for you. I’ll access your account and assist you. Would that be Ok?
Sd off goodbye
12:34pm
12:37pm
12:40pm
12:35pm
12:38pm
12:42pm
12:43pm
Hello, You are connected to Jane Smith.12:33pm
Wen wiill "MY ACCOUNT" be available ?
Figure 2 Example of Agent-Customer Chat and Measures
The main goal of this study is to link customer expressed emotion with agent behavior that can
be linked to measures of productivity. Usual measures of productivity include the total throughput
time of a conversation and total number of customers that can be served by an agent (i.e. throughout
rate). We identified two performance indicators of agent behavior that are directly linked to these
measures of productivity: 1) RT of the agent to each individual customer message and 2) number
of turns in a conversation. Each time a customer sends a message, there is an elapsed time until
the agent sends a response. We define this time interval as agent RT to the focal customer message.
Theoretically, agent RT can be further decomposed into: (i) time an agent spends doing background
work for the focal customer and writing the response message; (ii) time spent working for other
customers (including background work and writing messages). Unfortunately, the data does not
provide details of the time an agent allocates to different tasks. As a second best, we use the number
of words on each agents response message as a proxy for the effort and time the agent dedicated
to a focal conversation.

8
We use agent RT as our main measure of agent behavior for the following reasons: first, changes
in agent RT translate directly into agent efficiency. Second, RT is the wait time that customers
actually observe, since customers cannot distinguish between the time an agent is working on their
needs versus working for other customers. Finally, we note that RT is influenced by the extent of
agents’ multitasking. Since, we cannot disentangle precisely agent RT to the service time of a focal
customer and the service time of other (concurrent) customers, we control for agent multitasking
by measuring concurrency—the number of customers an agent serves simultaneously.
2.2. Measuring Customer Emotions in a conversation
Research on emotions in psychology and Organizational Behavior groups discrete emotions into
two categories: negative sentiment, which includes emotions such as anger, frustration, irritation,
annoyance, disappointment, anxiety, or stress, and positive sentiment that includes emotions such
as gratitude, enthusiasm, happiness, contentment, sympathy, satisfaction, trust, relief and calmness
(Feldman-Barrett and Russell 1999). Service interactions can involve both negative sentiment, and
positive sentiment (Herzig et al. 2016). Rather than studying the effects of specific emotions, a
common research focus and our focus here as well, is on the presence and impact of positive and
negative sentiment as two sides of a single scale (Watson et al. 1988). From here on we use the terms
“emotion” and “sentiment” interchangeably to refer to customer expressions of emotion during a
service chat.
To measure customer emotions we take advantage of recent progress in Natural Language Pro-
cessing, specifically automated sentiment analysis. A diverse set of tools are available: tools that
are based on word count (i.e. counting words from labeled dictionaries; e.g., LIWC, Tausczik and
Pennebaker (2010)), those who add additional NLP layer of grammatical aspects (SentiStrength,
Thelwall (2013); CustSent, Yom-Tov et al. (2018)), and tools that are based on Neural Net-
works (Stanford, Socher et al. (2013)). In the current study, we use two sentiment analysis tools,
SentiStrength and CustSent. The SentiStrength tool was designed to estimate the strength of
positive and negative sentiment in short texts. It estimates sentiment in both formal and informal
language and has human-level accuracy for short social web texts. The CustSent tool was designed
for assessing sentiment in a conversational context. Both tools utilize labeled dictionaries, as well
as NLP techniques, and their accuracy was validated to customer service context by LivePerson.
Both were found to be superior to other tools in this context, and although CustSent has higher
precision, SentiStrength has higher recall values (Yom-Tov et al. 2018). (See Appendix EC.1 for
data regarding recall and precision of both tools.) As we show later, our analysis combines these
two alternatives to measure emotions to reduce measurement error in our empirical study (see
Section 4).

9
SentiStrength provides a number that represents the assessed valence and intensity of detected
emotion. Negative scores represent negative emotions and positive scores represent positive emo-
tions. The value of the score indicates the intensity of the emotion. The range of the SentiStrength
sentiment score is limited between -5 and +5. For example, the following sentence is coded as (+1):
“That enabled me to access my account. Thanks, that’s really helpful.”
In contrast, the following sentence is coded as (-1):
“This is way too expensive for a local call.”
We use the score of negative (positive) customer sentiment as a proxy of high (low) agent
emotional load; they represent the emotional elements that agents must handle in the process of
their work, in addition to performing the required service tasks. Figures 3 provides some descriptive
statistics that illustrate the variation of customer emotions as evaluated by SentiStrength across
customer conversations with agents. Figure 3(a) shows the proportion of chats that include only
positive/negative emotion, multiple emotion (both positive and negative) or no emotion; given
that more than 85% of chats include emotion, this positions emotion as a central feature of service
interactions. Figure 3(b) shows the proportion of customer messages that express positive/negative
or no emotion; this demonstrates that on a message level most of the conversations are mostly
technical (without emotion) and, contrary to general assumptions, positive emotions are more
frequent in service conversations than negative emotions. This is also demonstrated in Figure 3(c),
that shows the distribution of emotion intensity at the chat level.
Figure 4 provides a preliminary description of the association between customer emotion and
agent RT. The plot shows a kernel smoothing of average agent RT (along the whole chat) as
a function of average customer emotion (in that chat), suggesting a strong relationship between
emotional load and agent RT. As previously mentioned, this correlation does not necessarily imply
a causal effect, as it is important to control for multiple factors that can affect these two outcomes.
The next section formulates the main hypothesis that relates employee productivity with customer
emotion, to be tested with the econometric framework presented in Section 4.
As in SentiStrength, CustSent also provides a number that represents the assessed valence and
intensity of detected emotion. The value of the score indicates the intensity of the emotion (the
strength of the negative or positive emotion). Though there is no hard limit on the range of the
sentiment score, in practice, the scores for emotion in our dataset range between -12 and +10. The
above two exampled sentences are coded as (+2) and (-2), respectively, by this engine.
3. Theory Development
In this study we measure emotional load of agents using a sentiment analysis tool which measures
positive/negative customer emotions in an online chat-type contact center, and link it to agent

10
(a) Full Service Chat (b) Customer Messages (c) Sentiment Distribution
Figure 3 Frequency of Emotion in Customer Service
Figure 4 Agent Productivity—Measured by the Average Agent RT to Customer Messages—as a Function of
Customer Sentiment. The Gray Area Around the Curves Represents 95% Confidence Interval.
behavior: response time, the length of messages and the number of messages required to complete
a service request. Our analyses aims to disentangle the mutual influence of the inputs of both
partners of a service interaction.
Expressions of negative customer emotion create additional work that service agents cannot
ignore (as reviewed in §1). Thus one can view such emotions as a type of load. In this paper,
we use customer expressed emotion as a proxy to agents’ emotional load. We assume that cus-
tomer expressions of negative emotions create high emotional load on the agents whereas customer
expressions of positive emotion create low emotional load. In this section, we combine Organiza-
tional Behavior theory with Operation Research theory to predict how customer expressed emotion
should influences the behavior of service agents (§3.1) and how agent behavior should influences
customer emotion (§3.2).
3.1. Effects of Customer Emotions on Agent Behavior

11
3.1.1. Response Time (RT) Lab experiments show that exposure to negative customer
emotions reduces agents cognitive capabilities by hampering working memory, recall of customer
requests and quality of performance (Rafaeli et al. 2012). In a similar vein, encounters with anger
are likely to evoke a sense of fear, and fear produces an urge to escape or avoid that situation (Marsh
et al. 2005). In a contact center with concurrency an agent can “escape” by delaying responses to a
customer expressing anger and prioritizing other (concurrent) customers; this would translate into
a longer overall RT to the angry customer. Based on these findings, we predict that agents who
encounter customers expressing negative emotions will have an increased RT.
Congruently, positive customer emotion might reduce agent RT. Interacting with people who
display positive emotions makes people happy about their situation (van Kleef et al. 2004). As
Walker et al. (2017) showed, positive customer emotions help replenish employee resources, and
improve employee self regulation. Therefore, we expect agents who encounter positive customers
to have higher motivation and more cognitive resources (Bakker and Demerouti 2007), both of
which will increase agents’ efficiency. In addition, since positive customer emotions create a more
pleasant work experience for agents, we expect that agents who encounter a customer expressing
positive emotion will return faster to that customer. All this suggests a shorter RT to customers
expressing positive emotions.
Additionally, Emotional Contagion theory (Hatfield et al. 1993) suggests that positive/negative
customer emotion will spillover to the agents that interact with them: negative customer emotion
will evoke negative agent emotions, which may reduce agent focus and efficiency, while positive
customer emotions will evoke positive agent emotions and increase agent motivation, broadening
their attention span (Vacharkulksemsuk and Fredrickson 2013). Through this lens, negative cus-
tomer emotions would reduce efficiency and therefore increase RT, while positive customer
emotions would improve efficiency and therefore reduce RT. Since agents regulate their expressed
emotions according to company policy (Rafaeli and Sutton 1987), we are not able to test this the-
ory directly. The general prediction of this theory, however, aligns with the our predictions above.
Thus, our first hypothesis is:
Hypothesis 1. A deterioration in customer emotion (moving from positive to negative)
increases agent RT in the subsequent agent message
An alternative prediction is that agents might speed-up their work in response to customer
expressions of negative emotion since they are motivated to end interactions with these customers
(Marsh et al. 2005). Negative customer emotion may put agents in what regulatory focus theory
(Higgins 1998) labels “prevention focus,” which may manifest in agents trying to end interactions
with customers who express negative emotions quickly. Also, negative emotions can urge agents to

12
work harder. Negative customer emotion can be viewed as a signal of customer dissatisfaction (van
Kleef et al. 2004) and since service agents are assessed by satisfaction of customers, they might try
to repair the damage as quickly as possible. Hence a contradictory hypothesis to hypothesis 1 is:
Hypothesis 2. A deterioration in customer emotion (moving from positive to negative) reduces
agent RT in the subsequent agent message
3.1.2. Effort Reflected in Length of Messages Customer emotion might affect the effort
that an agent puts into service. Noticing and comprehending customer emotions is a distinct task
and must be performed in addition to attending to customer requests (Vilnai-Yavetz and Rafaeli
2003). An agent that encounters customer emotions must realize and display organizationally
appropriate responses to these emotions (Geddes and Callister 2007)—in itself a demanding task
of “Emotional Labor” (Rafaeli and Sutton 1987, Grandey et al. 2010)—therefore, when agents
encounter an emotional customer message, additional effort is required on their behalf. This extra
effort should be evident in the length of the response they write to the customers. As negative
customer emotion signals dissatisfaction, agents are expected to put more effort into responses; for
example in addition to solving the service request, agents may acknowledge the frustration that
a customer is experiencing, or apologize for the delay, thus leading to a longer textual response.
Therefore:
Hypothesis 3. A deterioration in customer emotion (moving from positive to negative)
increases the number of words an agent writes in the subsequent message
In contrast, as we argued before, negative customer emotion is demotivating while positive
customer emotion is motivating; such motivation may increase the amount of information that
an agent communicates to the customer. Positive customer emotion might be also energizing for
agents (Bakker and Demerouti 2007). If agents are strengthened by positive customer emotion,
they may be more likely to invest more effort. Therefore, we consider a competing hypothesis:
Hypothesis 4. An improvement in customer emotion (moving from negative to positive)
increases the number of words an agent writes in the subsequent message
3.1.3. Number of Turns Rafaeli et al. (2012) showed in lab experiments that exposure to
negative emotions reduces agent’s cognitive capabilities and increases agent errors. If an agent is
less focused it may take him or her more inquiries (messages) to understand customer problems.
Moreover, if more errors are being made by the agent then we expect more turns (rounds of
messages) will be required to complete the service. Therefore, we pose the following:
Hypothesis 5. A deterioration in customer emotion (moving from positive to negative)
increases the total number of turns in a conversation.

13
A competing hypothesis is equally plausible. As we argued before, agents might be motivated
to end interactions with customers who express negative emotions (Marsh et al. 2005). Since these
expressions are signals of an aversive situation, agents are likely to be as concrete as they can
with the customers and aim to end the interaction with fewer exchanges as possible. Interviews
with service agents, as reported by Sutton and Rafaeli (1988), suggest that displays of positive
emotions in face-to-face service interactions create more customer engagement. If a spillover effect
exists then the number of turns in a chat should increase in service encounters involving positive
customer emotions. In addition, since positive emotions create a more pleasant work environment,
agents may be motivated to spend more time with the positive customers and thus exchange with
them more messages. Accordingly we can also pose:
Hypothesis 6. A deterioration in customer emotion (moving from positive to negative) reduces
the total number of turns in a conversation.
3.2. Effects of Agent Behavior on Customer Emotion
3.2.1. Response Time (RT) Theory and previous empirical evidence suggest that agent
behavior can itself impact customer emotion. Customers expect the attention and dedicated focus
of their service agent. They strongly dislike waiting (Maister 1984, Larson 1987, Taylor 1994) and
might even abandon the service in response (Mandelbaum and Zeltyn 2013, Allon et al. 2011). Due
to the remote nature of the service interaction (as opposed to face-to-face interactions), chat service
leaves customers totally detached from the service agent, with no ability to see any progress toward
the service goal. This creates an unexplained wait which is perceived as longer than the actual
wait for the agent response the customer experiences (Larson 1987), and therefore may create
frustration. Moreover, as explained, in chat-based services, agent RT includes also in-service-wait
(that is created by concurrency). The effect of waiting on customer emotion is expected to be even
more profound when agents are serving multiple customers in parallel (Goes et al. 2018). Thus, we
believe that long RTs might negatively affect customer emotion. If agent RT is perceived by the
customer as unnecessary waiting, we expect that:
Hypothesis 7. An increase in agent RT deteriorates customer emotion (moving from positive
to negative) in the subsequent customer message
In contrast, there is evidence that longer services are of better quality, and are perceived as
such by the customers (Anand et al. 2011). Due to the remote nature of the service interaction,
customers may not be aware of the fact that they are also waiting for the agent to serve other
customers (in-service-waiting) and therefore may perceive all the RT as service time. Furthermore,
Buell and Norton (2011) showed that if customers perceive the waiting as being a result of agent

14
effort (a.k.a. the “illusion” of labor) their perceived value and satisfaction increases. Therefore,
they suggested the use of transparency tools for projecting agent effort and increasing customer
satisfaction. In contact centers, agent labor is communicated via indicators of agent responsiveness
(short RT), the length of text and the number of messages the agent writes. We expect that as
these three indicators improve customer satisfaction and expressed sentiment will increase too. So,
if RT is perceived by the customer as labor, we expect that:
Hypothesis 8. An increase in agent RT improves customer emotion (moving from negative to
positive) in the subsequent customer message
3.2.2. Effort Reflected in Length of Messages If the number of words agents write is a
proxy of their effort, customers who encounter long agent messages may believe that the agent
puts extra effort into solving their issues. This “extra” attention might lead customers to feel as
if they are being taken care of, thus leading to greater satisfaction. In the same spirit, shorter
messages might signal less effort on the agents behalf and the service might be seen as superficial,
thus leading to customer anger or frustration. Hence, we hypothesize that:
Hypothesis 9. An increase in the number of words the agent writes improves customer emotion
(moving from negative to positive) in the subsequent customer message
3.2.3. Number of Turns Lastly, if a service episode takes too many turns to complete,
customers may perceive the service as unprofessional, even though the agent is putting in more
effort (Anand et al. 2011). This could signal to the customer the existence of a problem that the
agent is unable to solve and lead to customer dissatisfaction—this may then translate into more
expressions of negative emotion as the conversation extends. Thus, our final hypothesis is:
Hypothesis 10. As a conversation increases in the number of turns, customer emotion deteri-
orates (from positive to negative)
In the remainder of this paper, we empirically untangle the complex relationships between cus-
tomer expressed emotion and agent productivity.
4. Econometric Specification
In this section we develop an econometric framework to test the causal effect of customer emotion on
agent productivity. An important challenge in the estimation arises due to omitted factors related
to the complexity of the focal case handled by an agent. Cases of higher complexity are likely to
be associated with longer agent response time, because they require more effort to handle them;
more complex cases are also likely to be related to customer emotion. Although we can include
some observable proxies of case complexity in the model, there are other dimensions of complexity
15
which cannot be measured and therefore become confounders that can bias the estimates. A second
complication is reversed causality between agent productivity and customer emotion, whereby
longer response times may enhance customer frustration. This produces a simultaneity problem
between customer emotion and agent productivity: cases that take longer to handle also tend to
have negative customer emotions, but it is not clear what is the causal relationships between the
two.
The empirical strategy used to identify the causal effect of emotion on agent productivity is to
exploit the panel structure of the data, using the variation across the sequence of messages within
a conversation as a source of identification. Let i index the customer-agent conversation associated
to a case and let NTurnsi denote the number of turns, with t= 1 . . .NTurnsi representing each
turn within that conversation. The variable EMOit measures the emotion of customer message in
turn t, and RTit the agent response time in a message t. Response time (RT) is modeled as:
log(RTit) = δi +βEMOit−1 + γWit + ft(θ) +uit, (1)
where δi is a fixed effect for the conversation, Wit are workload related factors that vary during the
conversation, uit is an error term and ft(θ) is a parametric function capturing changes through the
progression of the conversation. The latter is included because other applications with similar data
revealed that EMO has a positive trend during a conversation (Yom-Tov et al. 2018); a trend that
is crucial to control for. To account for this, the covariate ft(θ) is specified to capture the stage of
the conversation i where the focal turn t occurs, defined as ConvStageit = t/NTurnsi. This control
variable is included in all the econometric models analyzed at the conversation-message (it) level.
The fixed effect δi controls for several unobserved factors that could lead to omitted variable
bias. In particular, it captures the complexity of the case, which by definition does not vary during
the conversation pertaining the same case. Because conversations are relative short (12.11 minutes,
SD=9.95), effects due to day of the week and hour of the day are also captured by δi. Because a
conversation is handled by a single agent, all agent related factors are also absorbed by the fixed
effect.
Previous work showed several mechanisms that relate workload and its composition to agent
productivity (for a review see Delasay et al. (2019)). Workload can affect the speed of an agent’s
work through fatigue, thereby reducing productivity and compliance with process standards (Dai
et al. 2015). On the other hand, current and pending workload can put pressure on an agent
to work harder and increase productivity (Tan and Netessine 2014, Kc and Terwiesch 2009). In
settings with a shared queue among multiple agents, social loafing can lead agents to slow down
when facing a long queue (Wang and Zhou 2016). To capture the effects of the customer queue,

16
a covariate measuring the number of customers in queue at the beginning of the response time
interval, NumInQueueit is included as a control.
In chat contact centers, it is common for agents to handle multiple conversations simultaneously.
This type of workload can also create fatigue and pressure effects. Moreover, handling simultaneous
conversations is a form of multitasking, which is also a determinant of labor productivity in services
(Kc 2013, Goes et al. 2018, Bray et al. 2016). The number of concurrent chats (Concurrentit) is
measured by taking an average over the time interval covered by the response time. Given the
dynamics of work assignment in a customer contact center, both NumInQueue and Concurrent
can vary substantially during the course of a conversation; these two variables are the main covari-
ates included in Wit. Other workload related effects, such as the hours elapsed during the working
shift, do not vary much during a conversation due to its short duration, and are therefore absorbed
in the fixed effect δi.
Identification in this model is driven by the variation in emotion across customer messages during
the same conversation. Recall that one of the concerns regarding the identification of the causal
effect of emotion on agent behavior was reverse causality: it is possible that EMO and RT affect
each other. However, the regression model (1) exploits the sequencing of the messages to avoid this
reverse causality. The variable RTit is measured after the customer expresses emotion in his/her
message on turn t− 1, hence it could not have influenced EMOit−1. Furthermore, the detailed
controls in the model—including the conversation fixed-effect δi—controls for most of omitted
variables related to case and agent heterogeneity, providing a clean identification strategy.
A final concern for identification is measurement error on the EMO variable, which could lead to
an attenuation bias in the coefficient associated to it. Recall that the main measure of EMO used
in the analysis is SentiStrength (Thelwall 2013). To mitigate concerns about measurement error,
an alternative measure of customer emotion was constructed using the methodology developed by
Yom-Tov et al. (2018). The main differences in the computation of the two measures are in the
dictionaries they use and in their range of sentiment scores (SentiStrength scores range between
-5 and +5, whereas CustSent has no hard limit on the range of the scores.) Nevertheless, the
two measures are highly positively correlated (r = 0.630, n= 1,065,079, p < 0.001), and hence the
alternative emotion measure is a useful Instrumental Variable to eliminate measurement error
(Wansbeek and Meijer 2000).
4.1. Decomposing the Effect of Customer Emotion on Agent Behavior
The effect of customer emotion on agent response time can be decomposed into two parts: (1) it
can affect the effort that the agent exerts to respond to each customer message, thereby increasing
the time required to write a response; (2) it can change the behavior of the agent in terms of the

17
priority it puts on the focal conversation, relative to other concurrent conversations. The data do
not contain specific information about the time the agent is spending on writing and back-office
work for each individual case, so these two effects cannot be perfectly separated out. As a second
best, the number of words in the agent’s response message is a reasonable proxy for the amount of
work the agent spends answering to a message. To disentangle these effects, the number of words
in the agent message (NumWordsit) is included in the specifications as follows:
log(RTit) = δi +β1EMOit−1 +β2log(NumWordsit) + γWit + ft(θ) +uit; (2)
log(NumWordsit) = δi +β3EMOit−1 + γWit + ft(θ) + vit. (3)
This specification, which includes the same control variables as in model (1), captures two paths
through which EMO can affect agent productivity. Coefficient β3 captures the effect of customer
emotion on the effort the agent makes to respond to the message, using NumWords as a proxy
for effort. As discussed in section 3, this effect is ambiguous: it is possible that the negative emo-
tion induces more or less dedication of the agent’s effort to the focal case. This effect translates
into an impact on RT because longer text needs more time to write (β2 > 0). In addition, the
coefficient β1 captures other effects of emotion on RT , in addition to the effect that operates
through NumWords. To the extent that the number of words is a good proxy for agent effort
spent responding to the customer, β1 can be interpreted as the impact of emotion on agent behav-
ior in terms of the effort given to the focal conversation. It is possible though that the number
of words is not a perfect proxy, and that β1 may also include other effort-related activities not
reflected in the extension of the agent’s written message (e.g., scrutinized search in the Customer
Relationship Management software). We do not have documentation of agents activity outside of
the chat platform, and therefore cannot measure the full agent effort directly. Despite these limita-
tions, models (2) and (3) provide information about the alternative paths through which customer
emotion affects agent productivity which could be relevant for managerial purposes.
Equations (1) and (2) capture the effect of customer emotions on the response time to each
individual customer message. However, it is also possible that customer emotion affects the number
of turns (NTurnsi) required to address a case, which is also directly related to agent productivity.
Estimating the effect of emotions on the number of turns of a conversation requires a different
identification strategy. In the previous models, identification is driven by the variation across turns
within a chat. This identification strategy cannot be applied to model the number of turns, which
is a variable that we measure at the conversation level. In other words, a conversation is the basic
unit of analysis we used to study the number of turns NTurnsi. The model includes the effect
of emotion in the first customer message of the conversation, EMOi1. One may be tempted to

18
average all messages across the conversation, but this is problematic due to the reverse causality
problem discussed earlier: emotion affects agent productivity but also vice-versa. In addition, the
data reveals that customer emotion tends to improve (become positive) towards the end of the
conversation, so a significant portion of the cross-sectional variation in emotion across conversations
is driven by the initial messages. Because the number of turns can also be affected by the workload
of the agent, the average concurrency during the whole conversation, Concurrent, is computed
as before, and NumInQueue here is calculated by the number of customers in queue when the
conversation started (these variables are exogenous, so it is possible to average Concurrent across
all turns). The following regression model is used to estimate the impact of emotion on the number
of turns:
NTurnsi = ρa(i) +β4EMOi1 + γWi +ψXi +wi. (4)
The term ρa(i) is a fixed effect of the agent serving chat i and wi is an error term. The other
covariates in the model are discussed next.
Model (4) is estimated using a cross-section of conversations, therefore it is important to control
for case complexity. The number of words in the first customer message (CustWords1) is an exoge-
nous variable used to proxy the complexity of the case, included as a covariate with log transforma-
tion (to keep consistency with the previous models). To capture seasonal effects, a weekday-weekend
dummy and hour of the day dummies are included (IsWeekend and HourOfDay, respectively).
The type of service case (SrvType) is controlled through a dummy variable. Finally, changes in
the agent productivity due to fatigue are controlled with dummy variables for each hour worked
during the shift (ShiftT ime). These are the covariates included in the set of controls denoted by
Xi.
Interventions and prescriptions to improve agent productivity depend on whether the impact
of emotion on agent productivity is generated through the response time, the number of words
written by the agent or the number of turns in the conversation. The econometric models described
above are useful to disentangle these effects, which are discussed in Section 6 in terms of their
managerial implications.
4.2. Modeling the Effect of Agent Behavior on Customer Emotion
It is also of interest to study how customer emotion is potentially affected by agent productivity. As
discussed in section 3, there are two mechanisms through which response time can affect emotion.
Longer RT may be associated to the quality of response provided by the agent, which could have
a positive effect on service quality and thereby affect emotion. Alternatively, longer response time
could be reflecting lack of attention of the agent for the focal case, thereby reducing service quality

19
and customer sentiment. The variation in response time is influenced by both effects, which makes
it difficult to disentangle them empirically.
The empirical strategy we used seeks to uncover these two mechanisms as follows. First, consider
the following specification to estimate the effect of RT on customer emotion:
EMOit = δi +α log(RTit−1) + ft(θ) + eit. (5)
The unobservable eit includes the quality of the response of the agent as perceived by the customer,
which is difficult to control with the variables observed in the data. It is then plausible that the
response time, RT , will be positively correlated with the quality of the response, as the agent needs
to do time consuming work to properly address a customer issue. This positive correlation between
RT and the error term induces a positive bias in the estimation of α. Our approach to correct
for this bias is to use Instrumental Variables that affect agent RT but do not directly affect the
customer’s emotion. Recall from model (1) that response time is affected by the workload of the
agent, Wit. In the context of this application, customers do not directly observe the workload of
the agent, thereby the effect of this workload can only affect emotion through the response time
perceived by the customer. Measuring the effect of RT induced by the variation in an agent’s
workload is also useful from a managerial perspective, as it provides insights on how workload
management and staffing decisions can affect customer emotion.
Model (5) can be further refined by including additional factors associated with agent produc-
tivity, specifically, NumWords and Turn:
EMOit = δi +α1 log(RTit−1) +α2log(NumWordsit−1) +α3Turnit + ft(θ) + eit. (6)
The number of words (NumWords) in the agent’s message is a proxy for the agent’s effort, which
is also directly observable by the customer. It is plausible that longer agent messages are include
more information to customers or perhaps are perceived by the customer as agent’s effort to the
focal case, thereby generate positive emotion. On the other hand, the customer has less visibility
on the other activities performed by the agent during the response time, and may interpret long
RT as lack of dedication, thereby generating negative sentiment. In addition, customer emotion
can also be affected by the extension of the conversation, which is captured through the variable
Turnit, which is the ordinal counts of the current turn in the conversation. Notice that Turnit and
ft(θ) are positively (but not perfectly) correlated, but the large sample size enables us to estimate
their effect separately with reasonable precision. Another potential issue is that RT , NumWords
and Turn can be correlated with the complexity of the case—more complex cases require higher
effort of the agent and a longer conversation—but recall that the fixed-effect δi controls for case

20
complexity, therefore mitigating this omitted variable bias. As before, RT is instrumented with the
workload-related exogenous variables W (Concurrent and NumInQueue) in order to mitigate the
endogeneity bias that can be generated by unobservable quality of the agent’s response.
Table 1 summarizes the variables used in all the econometric models described in this section.
Panel data models with Instrumental Variables were estimated using Two-Stage Least Squares
(2SLS), with the panel data methods developed in Balestra and Varadharajan-Krishnakumar
(1987) and implemented in Stata 13 (command xtivreg). The cross-sectional Model (4) was esti-
mated with 2SLS (Stata command ivreg). The next section discusses further specification details,
summary statistics and the estimation results.
Table 1 Labels and Coding of all Variables
Variable Description and coding
Dependent variablesNTurnsi The number of iterations between a customer and an agent in a conversation i
(an iteration is counted when one party answers the second party)RTit Agent response time to a focal customer in turn t of conversation i [seconds]NumWordsit The number of words an agent wrote to a focal customer in turn t of conversation iEMOit Customer sentiment as measured by SentiStrength engine in turn t of conversation i
W variables: Agent workloadNumInQueueit Number of customers waiting in queue at the beginning of turn t of conversation iConcurrentit Weighted average of number of parallel chats handled by the agent during turn t of conversation i
X variables: Complexity of the problem and time variablesSrvTypei Type of service in conversation i: support (coded 0; 50.81%) or sales (coded 1)CustWordsi1 The number of words a customer wrote in the first turn of conversation iShiftT imei The time passed since the shift of an agent started until the beginning of conversation i [hours]HourOfDayi Hour of day (8:00-23:00) of conversation iIsWeekendi Weekday: Mon-Fri (coded 0; 72.24%) , Weekend: Sat-Sun (coded 1)
Other variables:Turnit The ordinal number of the current turn t in a conversation iConvStageit The progression of customer or employee turn in a conversation;
(computed as the current turn t divided by the total number of turns (NTurns) in a conversation i)CustSentit An alternative measure for customer sentiment, via CustSent engine, in turn t of conversation i
5. Estimation Results
Table 2 reports the summary statistics of the variables used in the estimation. The top panel shows
the variables included in models (1)–(3), with messages as the unit of analysis, the bottom panel
shows variables of model (4), with conversation as the unit of analysis. In both cases the sample
was previously filtered by dropping outliers, in order to avoid influential points in the estimation.
Outliers for the message-level data were selected with the following procedure. We removed obser-
vations with RT in the bottom 5% (below 7 seconds); those messages indicate unrealistic RT that
were written at the same time that the customer wrote his response, and therefore are more likely
to be a response to an earlier correspondence. Observations with RT above the 95 percentile were
also removed (the 95% is 1641 seconds). We also removed conversations with data errors in the

21
Table 2 Statistics of Study Variables
Variable Mean Median St. Dev. Min Max
Turn level (N=651168)EMO (SentiStrength) 0.27 0.00 0.74 -4.00 4.00CustSent 0.22 0.00 0.72 -12.00 10.00RT 65.25 47.00 66.10 8.00 1641.00log(RT ) 3.84 3.85 0.80 2.08 7.40NumWords 34.58 27.00 26.17 1.00 387.00log(NumWords) 3.30 3.30 0.72 0.00 5.96Concurrent 2.33 2.47 0.73 0.00 3.00NumInQueue 2.52 1.00 3.87 0.00 73.00ConvStage 0.58 0.58 0.27 0.02 1.00ShiftT ime 3.63 3.41 2.31 0.00 8.16Turn 8.78 6.00 7.99 2.00 132.00
Chat level (N=141777)NTurns 10.19 8.00 7.03 2.00 114.00log(NTurns) 2.14 2.08 0.60 0.69 4.74EMO1 0.10 0.00 0.62 -4.00 4.00CustSent1 -0.04 0.00 0.51 -10.00 7.50RT 64.12 54.50 38.16 7.40 218.86log(RT ) 4.00 4.00 0.58 2.00 5.39NumWords 35.06 33.75 12.30 1.00 70.83log(NumWords) 3.49 3.52 0.39 0.00 4.26Concurrent 2.44 2.65 0.58 0.29 3.00NumInQueue 3.13 2.00 4.00 0.00 72.00CustWords1 26.82 23.00 19.49 1.00 1131.00log(CustWords1) 3.00 3.14 0.88 0.00 7.03ShiftT ime 3.47 3.26 2.27 0.00 7.76
ShiftT ime and dropped conversations that were attended after the eighth hour in the agent’s shift,
to focus on regular shifts (which also corresponds to the top 95%. Lastly, we removed observations
with a value of NumWords above the 95% percentile (387 words). Similar procedure was used
to select outliers in the conversation-level data reported in the bottom panel (the Max column
indicates the cutoffs used to exclude observations). In total, we removed 20,585 chats from the
analysis, leaving an effective sample size of 141,777 chats. To check robustness of the results, all
the analysis was replicated including outliers in the sample (reported in 5.3).
5.1. Effect of Customer Emotion on Agent Behavior
Table 3 shows the estimation results of econometric models (1), (2), (3), and (4) (each model
corresponds to a different column in the respective order). Recall that models (1)–(3) have each
message as a unit of analysis, and include fixed effects for the conversation, so the coefficients are
estimated using variation across turns of each conversation. In model (4) the unit of analysis is a
conversation, including agent fixed-effects.
The key covariate for Model (1) is EMO, the SentiStrength measure of customer emotion.
The results reveal a negative and statistically significant effect on RT . Recall that this variable
is instrumented using an alternative emotion measure (a different sentiment tool), to mitigate
attenuation bias due to measurement error. In terms of the magnitude of the effect, a one point
increase in the sentiment of the customer (i.e., emotion becomes more positive) reduces RT by

22
about 20.6% (a 14 seconds reduction for the average RT per message), which is substantial. For
robustness, we also ran the model without instrumenting EMO (reported in the online appendix):
the coefficient is also negative but smaller in magnitude, consistent with the attenuation bias
associated to measurement error.
In terms of the other control variables, Concurrent has a positive effect on response time,
suggesting that multitasking with multiple customers simultaneously increases the response time
to each of them. NumInQueue shows a small positive coefficient, suggesting that a longer queue
of customers waiting to be attended makes the agent work slightly slower. One possible reason for
this results is loafing induced by free-riding (Latane et al. 1979, Wang and Zhou 2016): as agents
face more work to be assigned, they work slower so that the work is assigned to other agents.
The effect of ConvStage is positive and statistically significant, consistent with an increase in RT
towards the end of the conversation.
Model (2) includes EMO and the logarithm of NumWords as the main variables of interest.
EMO has a negative and significant effect on RT , similar in magnitude relative to the estimates
of model (1): a one point increase in EMO reduces response time by 21%. The number of words
in the message NumWords has a large positive effect on RT , which is expected because a longer
text in general takes more time to write. Doubling the length of an agent’s message increases RT
by approximately 45%. The effect of the other covariates are similar to those reported for model
(1), with the exception of ConvStage which now has a smaller magnitude: towards the end of the
conversation, response time is 4% longer relative to the first message RT . The longer RTs towards
the end of the conversation appear to be partially explained by the length of the messages, which
is further corroborated by the estimates of Model (3) discussed next.
Model (3) has log(NumWords) as the dependent variable and EMO as the main covariate of
interest, which has a small positive effect; the magnitude of the effect is close to zero and negligible.
However, additional specifications reported later in this section show that this result is not robust,
mainly because the effect appears to be non-linear. Considering the other covariates in Model (3),
the effect of concurrent conversations has a negative effect: as agents increase multitasking, they
write shorter messages to each customer. The positive coefficient of ConvStage indicates that agent
messages tend to be longer towards the end of the conversation, which in part explains the longer
RT observed as the conversation moves towards completion.
The results of Model (4) are reported in the fourth column. Recall that the unit of analysis
in this model is a conversation, and customer emotion is measured in the first customer message
(the instrument used for this variable if the alternative sentiment measure CustSent in the first
customer message). The coefficient of EMO is negative and statistically significant, where a one
point reduction in EMO increases the number of turns in the conversation by 1.7, equivalent to

23
17% of the mean, which is large. This result is aligned with those obtained in models (1)–(3),
providing further support that conversations with negative customer emotion tend to be longer and
require more time from the agent. In terms of the other covariates, higher number of concurrent
customers handled by the agent during the conversation reduces the number of turns required to
finish the case, suggesting that agents may be speeding-up to close cases faster when their workload
is high.
Table 3 Effect of Customer Emotion on Agent Behavior (Outliers Excluded)
Model (1) Model (2) Model (3) Model (4)log(RT ) log(RT ) log(NumWords) NTurns
EMO -0.206∗∗∗ -0.209∗∗∗ 0.007∗∗
(0.0028) (0.0026) (0.0025)
EMO1 -1.686∗∗∗
(0.0690)
Concurrent 0.057∗∗∗ 0.075∗∗∗ -0.040∗∗∗ -1.242∗∗∗
(0.0026) (0.0024) (0.0024) (0.0369)
NumInQueue 0.003∗∗∗ 0.002∗∗∗ 0.002∗ 0.032∗∗∗
(0.0007) (0.0006) (0.0006) (0.0047)
ConvStage 0.246∗∗∗ 0.040∗∗∗ 0.463∗∗∗
(0.0043) (0.0040) (0.0038)
log(NumWords) 0.446∗∗∗
(0.0015)
log(CustWords1) -0.326∗∗∗
(0.0211)
IsWeekend -0.013(0.0416)
SrvType 6.199∗
(3.1524)
ShiftT ime Included
HourOfDay Included
Conversation Fixed Effect Included Included Included
Agent Fixed Effect Included
Constant 3.616∗∗∗ 2.228∗∗∗ 3.113∗∗∗ 11.134∗∗∗
(0.0070) (0.0079) (0.0063) (1.6776)Observations 651168 651168 651168 141777R2 Within . 0.162 0.040 .R2 Between 0.018 0.226 0.058 0.011R2 Overall 0.009 0.176 0.044 0.003
Standard errors in parentheses; ∗ p < 0.05, ∗∗ p < 0.01, ∗∗∗ p < 0.001
Table 4 replicates the specifications reported in Table 3 but includes the customer emotion mea-
sure in three levels: Negative (EMO< 0), Neutral (EMO equals to zero) and Positive (EMO> 0).

24
The Neutral level is the excluded dummy. For models (1) and (2), with log(RT ) as dependent
variable, the effect of customer emotion is negative, monotone, and economically significant. Mes-
sages with negative emotion receive RTs which are about 35–40% longer relative to messages with
positive emotion. These results are consistent with the linear specification presented in Table 3.
However, the estimation of Model (3) suggests a different interpretation. Customer messages with
negative emotion have responses which are 12.7% longer in the number of words relative to neutral
messages. In contrast, customer messages with positive emotion have similar NumWords compared
to those with neutral emotion: the coefficient implies a small 2% increase. Hence, the results can
be interpreted as a non-linear effect of customer emotion on the extension of the agent’s response
messages (as measured by NumWords), which is decreasing from negative to neutral emotion, and
then becomes stable from neutral to positive, suggesting that agents put more effort into customers
with negative emotion.
Table 4, Model (4) also corroborates that conversations that begin with customers with negative
emotion tend to have more turns relative to neutral (about 3.5 turns more); neutral customers have
about 0.7 turns more on average relative to positive emotion customers. For an average conversation
of 10 turns, a difference in four turns (the estimated change from negative to positive emotion) is
relatively large and also similar in magnitude to that obtained in the linear specification of Table
3.
Altogether, the results suggest two paths through which customer emotion affects agent behavior.
First, the agent spends more effort writing to customers with negative sentiment (compared to
neutral sentiment), which increases response time. But this mechanism does not explain in full the
increase in RT . For customer messages of similar length, the results suggest that RT continues to be
longer for customers with negative emotion relative to neutral and positive emotion. One possible
explanation for this effect is that agents procrastinate the service of customers with negative
emotion, giving them less priority relative to other concurrent customers they are serving. In what
follows, we conducted additional analysis to test for this potential explanation.
An increase in RT due to agent’s avoidance in serving customers with negative emotion should be
predominant during time periods in which the agent is handling several concurrent conversations.
In fact, this mechanism cannot operate when the agent is handling a single focal conversation. The
idea is then to measure the effect of EMO under situations when there are concurrent conversations
versus a single conversation handled by the agent. A dummy variable NoConcurrent is constructed
to indicate whether a message was handled during a period with no other conversations assigned
to the agent (that is, Concurrent= 1). Only 15% of the messages observed in the data have no
concurrent cases handled by the agent, reflecting that the service system allocates work in order
to keep agents multitasking most of the time. NoConcurrent is added to models (1)–(2) as a

25
Table 4 Effect of Customer Emotion on Agent Behavior. Emotion is Measured in Three Levels: Negative,
Neutral and Positive emotion. The Excluded Level is Neutral. (Outliers Excluded)
Model (1) Model (2) Model (3) Model (4)log(RT ) log(RT ) log(NumWords) NTurns
EMO negative 0.118∗∗∗ 0.061∗∗∗ 0.127∗∗∗
(0.0122) (0.0112) (0.0110)
EMO positive -0.290∗∗∗ -0.299∗∗∗ 0.020∗∗∗
(0.0041) (0.0038) (0.0037)
EMO negative1 3.474∗∗∗
(0.1769)
EMO positive1 -0.726∗∗∗
(0.1234)
Concurrent 0.058∗∗∗ 0.075∗∗∗ -0.040∗∗∗ -1.243∗∗∗
(0.0026) (0.0024) (0.0024) (0.0369)
NumInQueue 0.003∗∗∗ 0.002∗∗∗ 0.002∗ 0.030∗∗∗
(0.0007) (0.0006) (0.0006) (0.0047)
ConvStage 0.251∗∗∗ 0.044∗∗∗ 0.464∗∗∗
(0.0043) (0.0040) (0.0039)
log(NumWords) 0.447∗∗∗
(0.0015)SrvType 6.482∗
(3.1572)
log(CustWords1) -0.417∗∗∗
(0.0239)
IsWeekend -0.024(0.0417)
ShiftT ime Included
HourOfDay Included
Conversation Fixed Effect Included Included Included
Agent Fixed Effect Included
Constant 3.641∗∗∗ 2.255∗∗∗ 3.099∗∗∗ 11.613∗∗∗
(0.0071) (0.0079) (0.0064) 1.6879Observations 651,171 651,171 651,171 141,777R2 Within 0.002 0.165 0.039 .R2 Between 0.017 0.228 0.061 0.010R2 Overall 0.008 0.178 0.044 0.003
Standard errors in parentheses; ∗ p < 0.05, ∗∗ p < 0.01, ∗∗∗ p < 0.001
main effect and interacted with EMO; both EMO and its interaction effect are instrumented
using CustSent and the respective interaction with NoConcurrent. The estimation results are
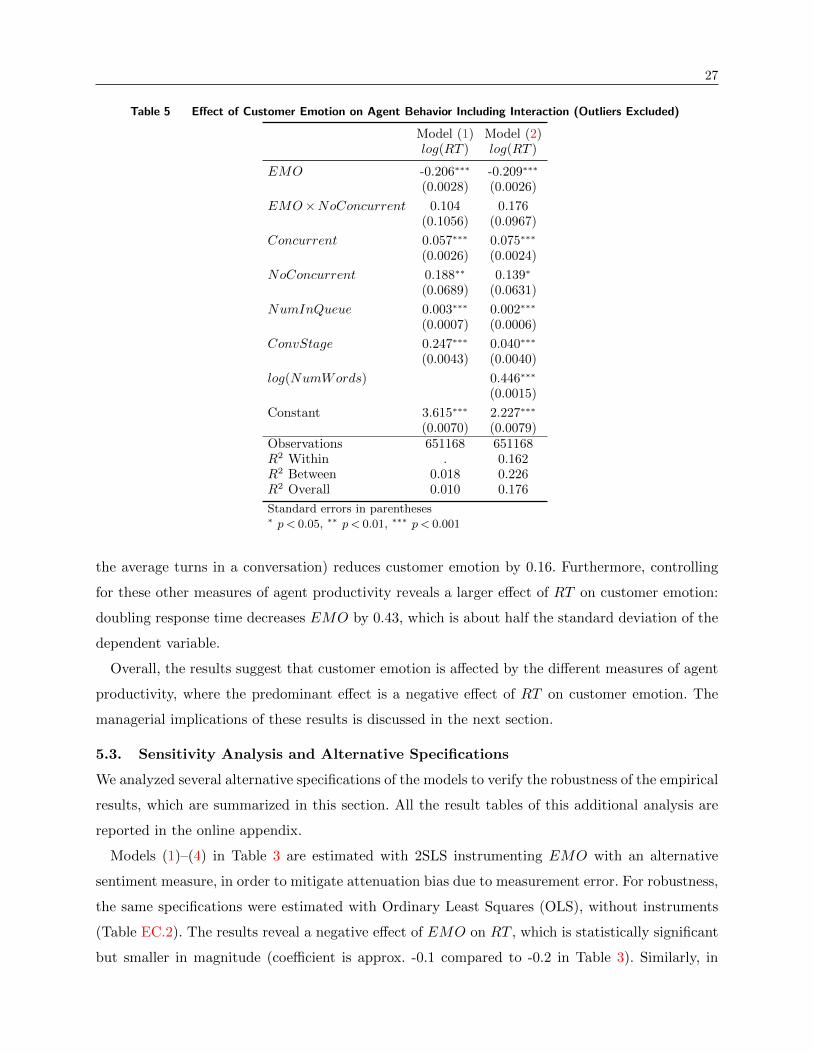
reported in Table 5. Models (1) and (2) show that EMO has a negative and significant effect on RT
(similar in magnitude to the main results in Table 3), but that the interaction between EMO and
NoConcurrent is not significant. This means that the effect of customer emotion on RT appears
to be similar regardless on whether the agent is handing one or multiple cases simultaneously. The

26
lack of significance of the interaction effect does not support the avoidance hypothesis, favoring
other mechanisms that may explain an increase in RT for customers with negative emotion, such
as an increase in the effort required to answer the customer messages or a higher probability of
making mistakes (Section 6 provides further discussion on these alternative mechanisms). Note
however that one possible reason for the lack of significance is the low precision of the estimates
of the interaction effect, with standard errors that are more than one order of magnitude larger
relative to the other estimated coefficients. This low precision is a consequence of the low fraction
of messages handled with no concurrent cases, an inherent limitation in the context of this study.
The results of Table 5 also suggest an interesting pattern on how multitasking affects RT .
Consider the case when Concurrent equals one: the total effect is calculated summing up the
coefficients of NoConcurrent and Concurrent, which equals 0.25 (approx) for Model (1). When
Concurrent increases to two, the effect is twice the Concurrent coefficient, equal to 0.114; for
Concurrent= 3 the effect is 0.17. This implies a U-shaped effect, similar to what has been reported
in other contexts in relation to the effect of workload and multitasking on productivity (e.g. Tan
and Netessine (2014) and Kc (2013)). At low levels of workload, agents expand their work to
fill in the available time, exhibiting longer RTs. As more workload is assigned, they speed-up by
shortening the RT for each message. When agents are overloaded, they become less productive
(perhaps due to switching costs among conversations) and RT increases again.
5.2. Effect of Agent Behavior on Customer Emotion
Table 6 shows the results of the models with customer emotion EMO as dependent variable (Mod-
els (5) and (6)). Recall this specification uses each message as a unit of analysis and includes
fixed effects for the conversation, so the identification is based on variation across turns within a
conversation. Two specifications were estimated, including different sets of covariates that measure
distinct aspects of agent productivity. The specification reported in the first column corresponds
to Model (5), which includes RT as the main covariate. This estimation suggests that doubling RT
decreases customer emotion by 0.06, equivalent to less than 0.1 standard deviations, a relatively
small effect. Both models (5) and (6) are estimated with Two-Stage Least Squares, where RT is
instrumented with the exogenous variables W (Concurrent and NumInQueue) in order to isolate
the variation of RT that is driven by changes in the agent workload (Section 5.3 discuss results
of the estimation without Instrumental Variables. The relevant tables are included in the online
appendix). The second specification corresponds to Model (6), including RT , log(NumWords) and
the corresponding Turn number as the main covariates. The results reveal that customer emotion
becomes more positive for longer messages: doubling NumWords increases EMO by 0.2. In addi-
tion, customer emotion tends to decrease for longer conversations: an increase in 10 turns (equal to
27
Table 5 Effect of Customer Emotion on Agent Behavior Including Interaction (Outliers Excluded)
Model (1) Model (2)log(RT ) log(RT )
EMO -0.206∗∗∗ -0.209∗∗∗
(0.0028) (0.0026)
EMO×NoConcurrent 0.104 0.176(0.1056) (0.0967)
Concurrent 0.057∗∗∗ 0.075∗∗∗
(0.0026) (0.0024)
NoConcurrent 0.188∗∗ 0.139∗
(0.0689) (0.0631)
NumInQueue 0.003∗∗∗ 0.002∗∗∗
(0.0007) (0.0006)
ConvStage 0.247∗∗∗ 0.040∗∗∗
(0.0043) (0.0040)
log(NumWords) 0.446∗∗∗
(0.0015)
Constant 3.615∗∗∗ 2.227∗∗∗
(0.0070) (0.0079)Observations 651168 651168R2 Within . 0.162R2 Between 0.018 0.226R2 Overall 0.010 0.176
Standard errors in parentheses∗ p < 0.05, ∗∗ p < 0.01, ∗∗∗ p < 0.001
the average turns in a conversation) reduces customer emotion by 0.16. Furthermore, controlling
for these other measures of agent productivity reveals a larger effect of RT on customer emotion:
doubling response time decreases EMO by 0.43, which is about half the standard deviation of the
dependent variable.
Overall, the results suggest that customer emotion is affected by the different measures of agent
productivity, where the predominant effect is a negative effect of RT on customer emotion. The
managerial implications of these results is discussed in the next section.
5.3. Sensitivity Analysis and Alternative Specifications
We analyzed several alternative specifications of the models to verify the robustness of the empirical
results, which are summarized in this section. All the result tables of this additional analysis are
reported in the online appendix.
Models (1)–(4) in Table 3 are estimated with 2SLS instrumenting EMO with an alternative
sentiment measure, in order to mitigate attenuation bias due to measurement error. For robustness,
the same specifications were estimated with Ordinary Least Squares (OLS), without instruments
(Table EC.2). The results reveal a negative effect of EMO on RT , which is statistically significant
but smaller in magnitude (coefficient is approx. -0.1 compared to -0.2 in Table 3). Similarly, in
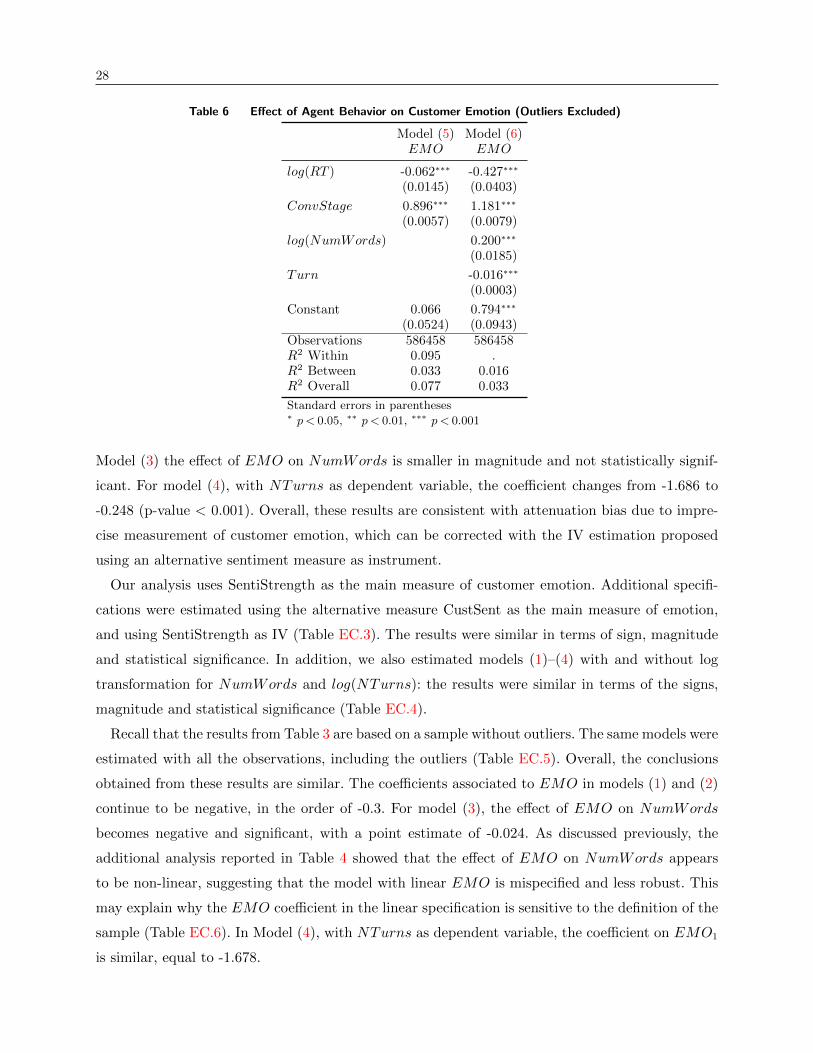
28
Table 6 Effect of Agent Behavior on Customer Emotion (Outliers Excluded)
Model (5) Model (6)EMO EMO
log(RT ) -0.062∗∗∗ -0.427∗∗∗
(0.0145) (0.0403)
ConvStage 0.896∗∗∗ 1.181∗∗∗
(0.0057) (0.0079)
log(NumWords) 0.200∗∗∗
(0.0185)
Turn -0.016∗∗∗
(0.0003)
Constant 0.066 0.794∗∗∗
(0.0524) (0.0943)Observations 586458 586458R2 Within 0.095 .R2 Between 0.033 0.016R2 Overall 0.077 0.033
Standard errors in parentheses∗ p < 0.05, ∗∗ p < 0.01, ∗∗∗ p < 0.001
Model (3) the effect of EMO on NumWords is smaller in magnitude and not statistically signif-
icant. For model (4), with NTurns as dependent variable, the coefficient changes from -1.686 to
-0.248 (p-value < 0.001). Overall, these results are consistent with attenuation bias due to impre-
cise measurement of customer emotion, which can be corrected with the IV estimation proposed
using an alternative sentiment measure as instrument.
Our analysis uses SentiStrength as the main measure of customer emotion. Additional specifi-
cations were estimated using the alternative measure CustSent as the main measure of emotion,
and using SentiStrength as IV (Table EC.3). The results were similar in terms of sign, magnitude
and statistical significance. In addition, we also estimated models (1)–(4) with and without log
transformation for NumWords and log(NTurns): the results were similar in terms of the signs,
magnitude and statistical significance (Table EC.4).
Recall that the results from Table 3 are based on a sample without outliers. The same models were
estimated with all the observations, including the outliers (Table EC.5). Overall, the conclusions
obtained from these results are similar. The coefficients associated to EMO in models (1) and (2)
continue to be negative, in the order of -0.3. For model (3), the effect of EMO on NumWords
becomes negative and significant, with a point estimate of -0.024. As discussed previously, the
additional analysis reported in Table 4 showed that the effect of EMO on NumWords appears
to be non-linear, suggesting that the model with linear EMO is mispecified and less robust. This
may explain why the EMO coefficient in the linear specification is sensitive to the definition of the
sample (Table EC.6). In Model (4), with NTurns as dependent variable, the coefficient on EMO1
is similar, equal to -1.678.

29
Additional analysis was done to evaluate the robustness of models (5) and (6) (main results
reported in Table 6), where the dependent variable is customer emotion. Recall that these models
are estimated with Instrumental Variables to address the endogeneity of RT , which is potentially
correlated with unobservable factors associated to the quality of the response. The same models
were estimated without Instrumental Variables using OLS (Table EC.7). The coefficient associated
with log(RT ) flips from negative to positive, with a point estimate close to 0.02 (with p-value <
0.001). This is consistent with the endogeneity bias that was conjectured: because RT is likely
to be positively correlated with unobservable quality that is part of the error term, this gener-
ates a positive bias in the estimated coefficient of RT . Instrumenting RT with exogenous factors
associated to agent workload helps to correct this bias.
Models (5) and (6) were also estimated replacing EMO with the alternative CustSent measure
(Table EC.8). The results are similar for model (6), but for model (5) the effect of RT was not
significant. The models were also estimated including the outliers in the sample and the results
were similar (Table EC.9).
Overall, the sensitivity analysis provides further support of the estimation results, showing that
they are robust to alternative specifications.
6. Discussion and Managerial Implications
In this section we first discuss in more depth our results (§6.1) and then deliberate on the implication
of those results on operational decisions in contact centers (§6.2).
6.1. Discussion of Empirical Results
Our results show the effects of customer emotion on agent behavior, and the reverse effect of agent
behavior on customer emotion (Tables 3–6). We found that negative customer emotion, a case of
high emotional load, hampers agent efficiency as evident in longer agent RT and the larger number
of turns it takes to complete the service thus supporting—supporting Hypotheses 1 and 5. We find
that a central mechanism through which emotional load impacts performance is agent effort as
manifested in the number of words agents write following a customer message that is emotionally
demanding.
We find that expressions of customer negative emotion increase agent effort (supporting Hypoth-
esis 3), and that when an agent writes more text, RT increases (supporting Hypothesis 9). A proxy
for the total effort required to complete a case can be calculated by multiplying the number of
words per turn and the number of turns. Based on this measure, the results suggest that negative
chat requires 32% more words compared to a neutral chat (363 compared to 2741), while a positive
1 The average number of words in Neutral message is 26.88.

30
chat requires a total of 15% less words than neutral chat due to the decrease in the number of turns
in chats (Model 4 in Table 4). When considering only the effect of a single turn, positive customer
emotion reduces RT despite increased agent effort per message written. This is consistent with the
mechanism where positive emotions enhance employee motivation and therefore her productivity
(Hypothesis 1). However, effort as measured by the number of words may not tell the whole story.
Agent efforts outside of the chat platform (e.g., in the Customer Relationship Management soft-
ware) are absent from our data. We capture such “hidden” effort via the main effect of EMO on
RT and call for future research to replicate our results with different proxies of effort, other than
the number of words agents use in service.
Interestingly, agent effort explains only a part of the variance in agent performance following
expressions of customer emotion (Table 3).Two additional explanations can clarify the effect of
emotional load on employee performance. First, employees make more mistakes when exposed to
negative emotion of others (Rafaeli et al. 2012) thus increasing the number of turns it take to
complete the service. Unfortunately, our data does not allow us to measure agent mistakes. We
therefore call for future research to examine the possible mediating role of mistakes in decreased
performance following exposure to emotional load. Second, agents may avoid customers that present
high emotional load by providing service to other (concurrent) customers. The analysis comparing
the effect of emotion in cases with and without concurrent customers served by the same agent
show that the effect is similar in both cases, suggesting that this “avoidance” mechanism is less
likely to explain the observed effect.
The estimates suggest that the effects of emotional on agent behavior are large relative to other
workload factors. A decrease in emotion of one point is equivalent to increase the number of
concurrent customers handled by the agent from 1 to 4, which is a large change (see Model (2) in
Table 3). The effect on the number of words is similar in magnitude (Model (3) in Table 4).
Looking at the reverse direction of influence, our results show that longer RT and higher number
of turns reduce customer emotion (Table 6), thus supporting Hypotheses 8 and 10. Additionally, we
found that as agents put more effort (increase NumWords), customer emotion improves supporting
Hypotheses 9.
6.2. Managerial Implications
The fact that customer emotion impacts agent behavior and that agent behavior impacts customer
emotion suggests that emotional load should be monitored and taken into account in operational
decisions. This section discusses some prescriptions for the design and control of service systems
that are subject to the effects of emotional load. This is even more important considering findings
that suggest that customer emotions reflect customer satisfaction (Yom-Tov et al. 2018) and the
connection of the latter to organization profitability.

31
• Productivity targets, system design and staffing. The results provide a “call for aware-
ness” that emotional load exists, varies within a service episode, and impacts agent performance.
A standard approach is to consider service time and case characteristics as the key dimensions
of load, but our work suggests that customer emotion is another important factor that should be
considered. When agents deal with more negative customers they should be expected to need more
time to solve the customer issues and to coup with customer emotions. To evaluate the total effects
of emotion, it is useful to compare the agent time required to handle angry (negative), neutral, and
happy (positive) customers. Define total throughput time by multiplying the average agent RT per
turn by the average number of turns in a chat. The total throughput time of an angry customer
is 15.9 minutes (1.34 minutes times 11.9 turns); compared to 11.1 minutes of a neutral customer
and 7.5 minutes of a happy one. This analysis suggests that the total amount of throughput time
associated with an angry customer is 43% larger than the one associated with a neutral one. Many
contact centers measure their employee productivity by the numbers of calls per hour an agent
handles (average concurency divided by total throughput time). They should be aware that an
agent can serve 12.6 neutral customers per hour but only 8.8 angry ones. Hence, the evaluation of
service agents or teams who encounter a high proportion of angry customers (for example customer
retention teams) should be based on adjusted targets of conversations per hour. This is important
if a contact center is considering a design change to incorporate Skill-Based routing design (i.e.
that each customer group is served by a separated agent-skill group).
Another way to think about the implication of emotional load is to consider how variations in
customer mix impact the offered load, which is equivalent to the amount of staffing required to
handle the arriving customer workload. We present in Table 7 a comparison between the offered
load (calculated by the arrival rate2 times total throughput times divided by average concurency)
of the current mix of emotional messages in our contact center vs. the offered load that the agents
will need to handle if 10% of the messages transformed from being neutral to negative for some
reason. This could happen if, for example, the company has some kind of failure with one of its
products or services. This change in customer behavior increases the amount of agents needed to
handle customer issues by 4.6% and the amount of text written per day by 3.3% (assuming arrival
rate is the same for both scenarios). As a conclusion, this analysis suggest that customer emotion
is an important factor that should be accounted for in staffing decisions.
• Counterfactual analysis to analyze the impact of emotional load on service quality.
Most organizations do not monitor customer emotions and do not adjust staffing to match the vari-
ation in customer sentiment. Here we would like to calculate the impact of an increase in emotional
2 Arrival rate data is given in Appendix EC.3.

32
Table 7 Comparison of Working Hour Associated with Different Mix of Message Sentiment
Emotion Base Case Alternative CaseType Message Offered Effort Message Offered Effort
percentage Load (NumWords) percentage Load (NumWords)
Positive 29% 14.7 63,808 29% 14.7 63,808Neutral 63% 47.1 162,812 53% 39.6 136,969Negative 8% 8.6 27,358 18% 19.3 61,556Total 100% 70.4 253,978 100% 73.7 262,333
load on performance level, in case the company does not change staffing. We use the same scenario
presented in Table 7. We use a simulation model that was calibrated to the operation of contact
centers developed by Castellanos et al. (2019). It is a version of an Erlang-A model that takes
into account unique contact center features such as silent abandonment. For this counterfancual
analysis, we estimated the simulation parameters using the data of February 2017. The simulation
assumes that customers arrive to the contact center according to a non-homogeneous Poisson pro-
cess with rate λd,t (λd,t is the arrival rate at day d and hour t). The customer are served by nd,t
statistically identical agents, with average concurency of c. Therefore, the number of service slots
available at time (d, t) is cnd,t. If there is no available slot, the customer wait in a FCFS queue. The
customer has finite patience and assumed to be Exponentially distributed with rate theta, which
was estimated using the methodology developed in Yefenof et al. (2018), that takes into account
the fact that customer waiting time in chat systems is censored both from the right (by the offered
wait) and from the left (by the fact that sometimes customers abandon the service without exiting
the queue—they don’t close the chat window but disappear. For more details about this silent
abandonment phenomena and its implication see Castellanos et al. (2019)). In our data θ = 0.5,
and 70% of the customers indicates their abandonment in real time (30% abandon silently). Service
times are assumed to be exponentially distributed with rate µ. Note that µ in this simulation is one
the divided by the throughput time of a conversation and equal to µ= 0.075; in the counterfactual
scenario with more negative emotion customers, µ was adjusted so that the throughput time was
4.6% longer (as suggested by our empirical results).
The simulation predicts that the 10% change of neutral lines to negative lines increase the
probability of abandonment by 2% and increase the expected waiting time by two minutes.
• Routing policies designed to achieve: load balancing or specialization.
Emotional load should also have impact on work allocation (routing) decisions. In our data,
agents usually treat up to three customers at the same time (on average 2.3 customers simultane-
ously). But the load created by three angry customers differs dramatically from the load created
by three happy customers. Specifically, treating three neutral customers messages is equivalent (in
terms of workload) to treating only 2.4 angry messages or 3.7 positive messages. We suggest that

33
like other measures of workload, emotional workload could be used in the design of dispatching
rules commonly used in contact centers, dynamically adjusting the workload of agents based on
real-time assessments. The sentiment analysis tool used in this work allows for real-time monitoring
of emotional load during service conversations. Previous research showed that there is a clear trend
of sentiment within a conversation (Yom-Tov et al. 2018): customer sentiment usually starts neg-
ative, then becomes neutral and transforms to positive towards the end of the conversation. This
positive trend is captured in our analysis by the variable ConvStage that monitors the conversation
progress. Interestingly, this trend is steeper when customers report that their problem was solved
and that they are satisfied with the service as indicated in post-service surveys. Unfortunately, we
do not have access to customer survey responses in our data, therefore refer the readers to (Yom-
Tov et al. 2018). Although most of the customers start by expressing negative emotions, some of
them will express more positive emotions throughout the conversation while others will remain
unhappy. We suggest designing a routing policy that would balance both offered load as well as
emotional load. The idea is that when a new conversation arrives it will be assigned to an agent
that has the least emotional load. Therefore, only when the real-time assessment of the emotions
of the currently assigned customers identifies that the customer transformed from being negative
to positive state the agent load will decrease and enable new allocation of customers to her. Such
a policy will dynamically allocate more capacity to agents that handle customers who consistently
express negative emotion. This dynamic allocation which allows more agent time to negative cus-
tomers is expected to improve customer emotions since agents can pay more attention to them,
and therefore, may also improve overall customer satisfaction. This idea draws its intuition from
Armony and Ward (2010), Mandelbaum et al. (2012), who suggest adoption of allocating policy
that is fair from the agent perspective (Carmeli et al. 2018).
In addition, in some contact centers customers write their inquiry before entering the queue
(Castellanos et al. 2019). In such cases, we can assess the emotional load expected by that customer
inquiry in real-time before assigning the new conversation to an agent and using the measure of
emotional load we can also predict that customer needs. Model 3 supports the claim that this is
indeed possible by showing that one can predict the number of turns that a chat will need using the
customer sentiment of his first turn. This information can be used for designing a “sentiment-based
routing”, a mechanism that is analogous to skill-based routing. This routing mechanism will assign
an emotional call to appropriate agent group (e.g. customer retention team) that received training
of how to deal with agent anger.
• Prioritization. Our results highlight that customer RT impact customer emotions. Therefore,
operational policies that will reduce agent RT will improve customer emotions. This can be done in
the following way: sentiment engines can be designed to provide real-time monitoring of customer

34
sentiment, and alert managers and agents of problematic situations (e.g. when the sentiment of a
customer dropped below a specific threshold). Since agents handle multiple customers in parallel,
they might miss customers expressions of negative emotion while they are interacting with other
customers. Real-time monitoring can increase agents awareness by alerting them when an escalation
in negative emotion occurs. These alerts will enable agents to prioritize angry customers, reduce
their RT, and improve their satisfaction. Moreover, managers can use these alerts to identify
extreme negative sentiment cases, and to provide agents with relevant assistance. This idea is now
being implemented in one of the companies working with the LivePerson platform. In addition,
our results highlight how important it is for the agent to communicate his effort by writing longer
text. If agents will be more aware of the current state of the customer (by the suggested alerts),
and react by communicating their effort better, customer emotion are expected to improve.
7. Conclusions
Research to date provides ambiguous predictions regarding the effects of expressed customer emo-
tion on agent behavior. Our findings reconcile conflicting predictions and show that deterioration
in customer emotion hampers agent performance-related behaviors: agents respond slower, write
more words, and need more turns to complete a service interaction when customers express neg-
ative emotion. These findings suggest that negative customer emotions create a burden on agents
while positive emotions act as a source of motivation (Bakker and Demerouti 2007). Our analyses
are based on operational and objective measures of agent behavior and of customer emotion in real
service interactions, and thus overcome limitations of past research. Previous research relied almost
solely on experimental manipulations with small samples and self reported emotions, affording
limited managerial insights.
Our findings support the idea that the complexity that customers bring to a service system, in
terms of the problems and the emotions they present, is critical for understanding and predicting
agent work performance (Weiss and Cropanzano 1996). Yet, we acknowledge that our study could
not consider the effects of discrete emotions (i.e., anger, frustration, delight), although this is what
research in Organizational Behavior advocates (Lazarus and Cohen-Charash 2001). We hope that
future developments in Natural Language Processing will allow for analyses in higher granularity
of discrete emotions.
We introduce a new position for customer emotion in service—that of a potential source of load.
This is in contrast to traditional Operations Management views, where customer emotion is treated
as an outcome. The implicit assumption of past research was that customer happiness depends on
their evaluation of the quality of service. We show, however, that customer emotions are also a
factor that determines the efficiency of service; suggesting that the concept of load, as traditionally

35
studied in Operations Management, actually comprises multiple aspects, and that emotional load
is an important construct to account for in planing models. This view of load accounts for pressures
beyond the mere presence of a customer, and is based on factors inherent to the nature and content
of individual service interactions.
Our results show that emotional load creates “micro-level influences”, that occur at the level of
a single message within the conversation between a specific employee and a specific customer. We
theorize and show empirical effects of emotional load that goes beyond multitasking and queue
length effects. Our analyses of a large data-set of conversations between agents and customers,
show empirical measurements of this type of load, and document its influence on critical Operations
Management parameters of agent RT, agent effort, and the number of turns it take to complete a
conversation.
We call for researchers and practitioners to view customer emotion as data that can aid them in
designing service systems. Emotions provide information (data) about a social situation and the
actors in it (van Kleef 2015). To this day, these data served only the service dyad: an agent and
a customer. This dyad is engaged in co-production of value; both actors invest effort to resolve
a specific issue. The ratio of the effort between the service interaction partners is dependent on
context. If a customer requests easy-to-get information, the ratio of effort will be close to 1. In
contrast, if a customer has a complicated request, or if the customer creates high emotional load,
the agent will likely need to invest more effort than the customer. As Roels (2014) showed, one can
improve service system efficiency by considering the effort ratio and route customers to adequate
service channels based on it. Our results show that service systems should use customer emotion
as data that will aid them in allocating customers to agents or other service channels that fits thier
needs.
The type of data we use in the current paper is increasingly available in service organizations
(i.e., full documentation of service). We highlight the opportunities that such data, coupled with
automated sentiment analysis tools create for studying service delivery (Rafaeli et al. 2017) and
improving the operations of service operations. From a managerial perspective, our analyses suggest
the importance of incorporating real time monitoring of customer emotions being handled by
service agents. Beyond the technical count of the number of customers in the service system, service
operations need to acknowledge the dynamics that customers bring to the system. This includes the
types of problems that customers raise, the verbosity with which they communicate their problems,
and the emotions that they attach to this communication. Failing to recognize such customer
induced states can lead to inaccurate planning models and suboptimal service management.
36
References
Allon G, Federgruen A, Pierson M (2011) How much is a reduction of your customers’ wait worth? An empir-
ical study of the fast-food drive-thru industry based on structural estimation methods. Manufacturing
& Service Operations Management 13(4):489–507.
Anand KS, Pac MF, Veeraraghavan S (2011) Quality—speed conundrum: Trade-offs in customer-intensive
services. Management Science 57(1):40–56.
Armony M, Ward A (2010) Fair dynamic routing in large-scale heterogeneous-server systems. Operations
Research 58(3):624–637.
Bakker AB, Demerouti E (2007) The job demands-resources model: State of the art. Journal of managerial
psychology 22(3):309–328.
Balestra P, Varadharajan-Krishnakumar J (1987) Full information estimations of a system of simultaneous
equations with error component structure. Econometric Theory 3(2):223–246.
Barnes DC, Beauchamp MB, Webster C (2010) To delight, or not to delight? This is the question service
firms must address. The Journal of Marketing Theory and Practice 18(3):275–284.
Batt RJ, Terwiesch C (2017) Early task initiation and other load-adaptive mechanisms in the emergency
department. Management Science 63(11):3531–3551.
Bray RL, Coviello D, Ichino A, Persico N (2016) Multitasking, multiarmed bandits, and the italian judiciary.
Manufacturing & Service Operations Management 18(4):545–558.
Buell RW, Norton MI (2011) The labor illusion: How operational transparency increases perceived value.
Management Science 57(9):1564–1579.
Carmeli N, Yom-Tov GB, Mandelbaum A (2018) Multi-dimensional load: Balancing emotional and system
load in service systems, working paper.
Castellanos A, Yom-Tov GB, Goldberg Y (2019) Silent abandonment in contact centers: Estimating customer
patience with uncertain data, working paper.
Cho DD, Bretthauer KM, Cattani KD, Mills AF (2019) Behavior aware service staffing. Production and
Operations Management 28(5):1285–1304.
Dai H, Milkman KL, Hofmann DA, Staats BR (2015) The impact of time at work and time off from work on
rule compliance: The case of hand hygiene in healthcare. Journal of Applied Psychology 100(3):846–862.
Delasay M, Ingolfsson A, Kolfal B, Schultz K (2019) Load effect on service times. European Journal of
Operational Research 279(3):673–686.
Feldman-Barrett L, Russell JA (1999) The structure of current affect controversies and emerging consensus.
Current Directions in Psychological Science 8(1):10–14.
Field JM, Victorino L, Buell RW, Dixon MJ, Meyer Goldstein S, Menor LJ, Pullman ME, Roth AV, Secchi
E, Zhang JJ (2018) Service operations: Whats next? Journal of Service Management 29(1):55–97.

37
Geddes D, Callister RR (2007) Crossing the line (s): A dual threshold model of anger in organizations.
Academy of Management review 32(3):721–746.
Goes PB, Ilk N, Lin M, Zhao JL (2018) When more is less: Field evidence on unintended consequences of
multitasking. Management Science 64(7):2973–3468.
Grandey AA, Rafaeli A, Ravid S, Wirtz J, Steiner DD (2010) Emotion display rules at work in the global
service economy: The special case of the customer. Journal of Service Management 21(3):388–412.
Hareli S, Rafaeli A (2008) Emotion cycles: On the social influence of emotion in organizations. Research in
organizational behavior 28:35–59.
Hatfield E, Cacioppo JT, Rapson RL (1993) Emotional contagion. Current Directions in Psychological Sci-
ence 2(3):96–99.
Herzig J, Feigenblat G, Shmueli-Scheuer M, Konopnicki D, Rafaeli A (2016) Predicting customer satisfaction
in customer support conversations in social media using affective features. Proceedings of the 2016
Conference on User Modeling Adaptation and Personalization, 115–119 (ACM).
Higgins ET (1998) Promotion and prevention: Regulatory focus as a motivational principle. Advances in
experimental social psychology 30:1–46.
Kc DS (2013) Does multitasking improve performance? Evidence from the emergency department. Manu-
facturing & Service Operations Management 16(2):168–183.
Kc DS, Terwiesch C (2009) Impact of workload on service time and patient safety: An econometric analysis
of hospital operations. Management Science 55(9):1486–1498.
Larson R (1987) Perspective on queues: Social justice and the psychology of queueing. Operations Research
35(6):895–905.
Latane B, Williams K, Harkins S (1979) Many hands make light the work: The causes and consequences of
social loafing. Journal of Personality and Social Psychology 37(6):822–832.
Lazarus RS, Cohen-Charash Y (2001) Discrete emotions in organizational life. Payne RL, Cooper CL, eds.,
Emotions at work: Theory, research and applications for management, chapter 3, 45–84 (Chichester,
England: John Wiley & Sons).
Maister D (1984) The psychology of waiting lines (Harvard Business School).
Mandelbaum A, Momcilovic P, Tseytlin Y (2012) On fair routing from emergency departments to hospital
wards: QED queues with heterogeneous servers. Management Science 58(7):1273–1291.
Mandelbaum A, Zeltyn S (2013) Data stories about (im)patient customers in tele-queues. Queueing Systems
75(2–4):115–146.
Marsh AA, Ambady N, Kleck RE (2005) The effects of fear and anger facial expressions on approach- and
avoidance-related behaviors. Emotion 5(1):119–124.

38
Pugh SD (2001) Service with a smile: Emotional contagion in the service encounter. Academy of Management
Journal 44(5):1018–1027.
Rafaeli A, Altman D, Gremler DD, Huang MH, Grewal D, Iyer B, Parsuraman A, Ruyter Kd (2017) The
future of frontline research: Invited commentaries. Journal of Service Research 20(1):90–91.
Rafaeli A, Erez A, Ravid S, Derfler-Rozin R, Efrat-Treister D, Scheyer R (2012) When customers exhibit
verbal aggression, employees pay cognitive costs. Journal of Applied Psychology 97(5):931–950.
Rafaeli A, Sutton RI (1987) Expression of emotion as part of the work role. Academy of Management review
12(1):23–37.
Roels G (2014) Optimal design of coproductive services: Interaction and work allocation. Manufacturing &
Service Operations Management 16(4):578–594.
Socher R, Perelygin A, Wu J, Chuang J, Manning CD, Ng A, Potts C (2013) Recursive deep models for
semantic compositionality over a sentiment treebank. Proceedings of the 2013 Conference on Empir-
ical Methods in Natural Language Processing, 1631–1642 (Seattle, Washington, USA: Association for
Computational Linguistics).
Song H, Tucker AL, Murrell KL (2015) The diseconomies of queue pooling: An empirical investigation of
emergency department length of stay. Management Science 61(12):3032–3053.
Sutton RI, Rafaeli A (1988) Untangling the relationship between displayed emotions and organizational
sales: The case of convenience stores. Academy of Management Journal 31(3):461–487.
Tan TF, Netessine S (2014) When does the devil make work? An empirical study of the impact of workload
on worker productivity. Management Science 60(6):1574–1593.
Tausczik YR, Pennebaker JW (2010) The psychological meaning of words: LIWC and computerized text
analysis methods. Journal of language and social psychology 29(1):24–54.
Taylor S (1994) Waiting for service: The relationship between delays and evaluations of service. The Journal
of Marketing 58(2):56–69.
Thelwall M (2013) Heart and soul: Sentiment strength detection in the social web with sentistrength. Pro-
ceedings of the CyberEmotions 5:1–14.
Vacharkulksemsuk T, Fredrickson BL (2013) Looking Back and Glimpsing Forward: The Broaden-and-Build
Theory of Positive Emotions as Applied to Organizations, volume 1.
van Kleef GA (2015) Social emotions life regulate the emotions as social information (EASI) model. Current
Directions in Psychological Science 18(3):184–188.
van Kleef GA, De Dreu CKW, Manstead ASR (2004) The interpersonal effects of anger and happiness in
negotiations. Journal of personality and social psychology 86(1):57–76.
Vilnai-Yavetz I, Rafaeli A (2003) Organizational interactions: A basic skeleton with spiritual tissue. Giacalone
RA, Jurkiewicz CL, eds., Handbook of Workplace Spirituality and Organizational Performance, 76–92
(Armonk, NY: M.E. Sharpe).
39
Walker DD, van Jaarsveld DD, Skarlicki DP (2017) Sticks and stones can break my bones but words can
also hurt me: The relationship between customer verbal aggression and employee incivility. Journal of
Applied Psychology 102(2):163–179.
Wang J, Zhou YP (2016) Impact of queue configuration on service time: Evidence from a supermarket.
Management Science 64(7):3055–3075.
Wang M, Liao H, Zhan Y, Shi J (2011) Daily customer mistreatment and employee sabotage against cus-
tomers: Examining emotion and resource perspectives. Academy of Management Journal 54(2):312–334.
Wansbeek TJ, Meijer E (2000) Measurement error and latent variables in econometrics, volume 37 (North-
Holland).
Watson D, Clark L, Tellegen A (1988) Development and validation of brief measures of positive and negative
affect: the panas scales. Journal of Personality and Social Psychology 54(6):1063–1070.
Weiss HM, Cropanzano R (1996) Affective events theory: A theoretical discussion of the structure, causes
and consequences of affective experiences at work. Research in Organizational Behavior 18(1):1–74.
Yefenof J, Goldberg Y, Wiler J, Mandelbaum A, Ritov Y (2018) Self-reporting and screening: Data with
current-status and censored observations, working paper.
Yom-Tov GB, Ashtar S, Altman D, Natapov M, Barkay N, Westphal M, Rafaeli A (2018) Customer sentiment
in web-based service interactions: Automated analyses and new insights. In WWW 18 Companion: The
2018 Web Conference Companion, April 23–27, 8 pages (New York, NY, USA: ACM).

ec1
This page is intentionally blank. Proper e-companion title
page, with INFORMS branding and exact metadata of the
main paper, will be produced by the INFORMS office when
the issue is being assembled.
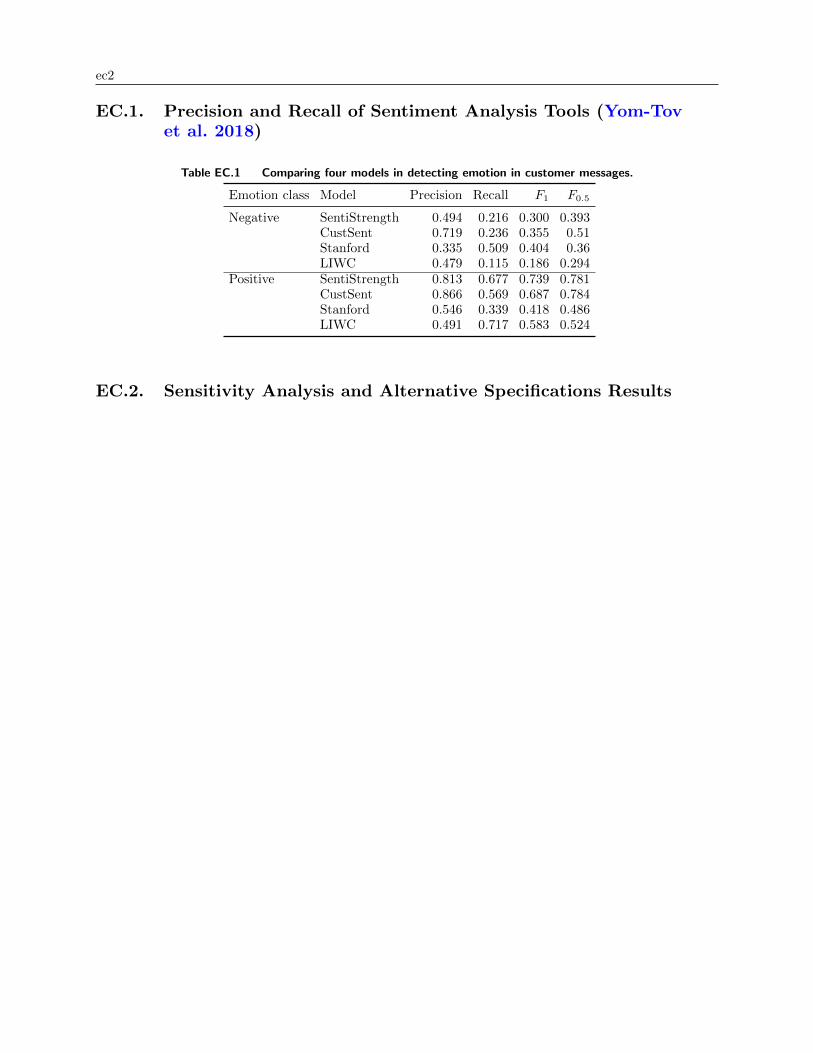
ec2
EC.1. Precision and Recall of Sentiment Analysis Tools (Yom-Tovet al. 2018)
Table EC.1 Comparing four models in detecting emotion in customer messages.
Emotion class Model Precision Recall F1 F0.5
Negative SentiStrength 0.494 0.216 0.300 0.393CustSent 0.719 0.236 0.355 0.51Stanford 0.335 0.509 0.404 0.36LIWC 0.479 0.115 0.186 0.294
Positive SentiStrength 0.813 0.677 0.739 0.781CustSent 0.866 0.569 0.687 0.784Stanford 0.546 0.339 0.418 0.486LIWC 0.491 0.717 0.583 0.524
EC.2. Sensitivity Analysis and Alternative Specifications Results

ec3
Table EC.2 Effect of Customer Emotion on Agent Behavior (Outliers Excluded); OLS with no IVs
Model(1) Model(2) Model (3) Model (4)log(RT ) log(RT ) log(NumWords) NTurns
EMO -0.096∗∗∗ -0.097∗∗∗ 0.001(0.0016) (0.0014) (0.0014)
EMO1 -0.248∗∗∗
(0.0296)
Concurrent 0.056∗∗∗ 0.073∗∗∗ -0.040∗∗∗ -1.243∗∗∗
(0.0026) (0.0024) (0.0024) (0.0366)
NumInQueue 0.003∗∗∗ 0.003∗∗∗ 0.002∗ 0.030∗∗∗
(0.0007) (0.0006) (0.0006) (0.0046)
ConvStage 0.168∗∗∗ -0.040∗∗∗ 0.468∗∗∗
(0.0039) (0.0036) (0.0035)
log(NumWords) 0.446∗∗∗
(0.0014)
log(CustWords1) -0.326∗∗∗
(0.0211)
IsWeekend -0.013(0.0416)
SrvType 6.199∗
(3.1524)
ShiftT ime Included
HourOfDay Included
Conversation Fixed Effect Included Included Included
Agent Fixed Effect Included
Constant 3.634∗∗∗ 2.246∗∗∗ 3.112∗∗∗ 11.106∗∗∗
(0.0070) (0.0078) (0.0063) (1.6637)Observations 651168 651168 651168 141777R2 Within 0.010 0.172 0.040 0.011R2 Between 0.020 0.237 0.058 0.017R2 Overall 0.010 0.187 0.044 0.003
Standard errors in parentheses ∗ p < 0.05, ∗∗ p < 0.01, ∗∗∗ p < 0.001
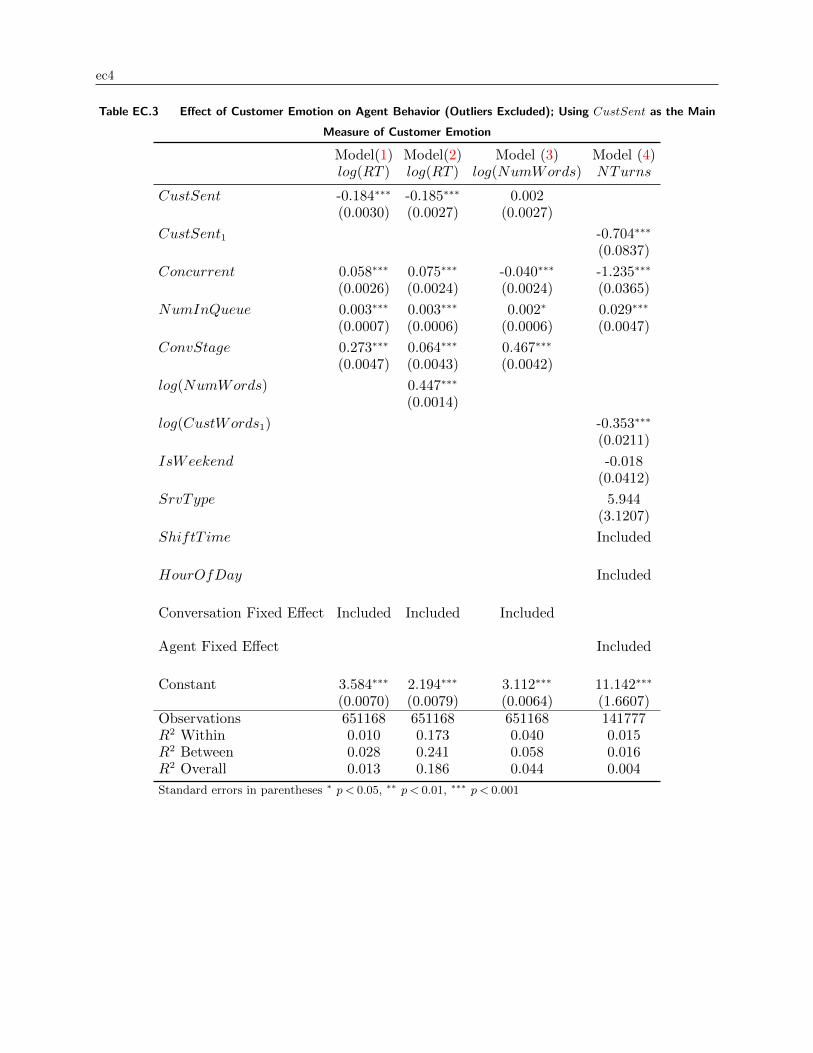
ec4
Table EC.3 Effect of Customer Emotion on Agent Behavior (Outliers Excluded); Using CustSent as the Main
Measure of Customer Emotion
Model(1) Model(2) Model (3) Model (4)log(RT ) log(RT ) log(NumWords) NTurns
CustSent -0.184∗∗∗ -0.185∗∗∗ 0.002(0.0030) (0.0027) (0.0027)
CustSent1 -0.704∗∗∗
(0.0837)
Concurrent 0.058∗∗∗ 0.075∗∗∗ -0.040∗∗∗ -1.235∗∗∗
(0.0026) (0.0024) (0.0024) (0.0365)
NumInQueue 0.003∗∗∗ 0.003∗∗∗ 0.002∗ 0.029∗∗∗
(0.0007) (0.0006) (0.0006) (0.0047)
ConvStage 0.273∗∗∗ 0.064∗∗∗ 0.467∗∗∗
(0.0047) (0.0043) (0.0042)
log(NumWords) 0.447∗∗∗
(0.0014)
log(CustWords1) -0.353∗∗∗
(0.0211)
IsWeekend -0.018(0.0412)
SrvType 5.944(3.1207)
ShiftT ime Included
HourOfDay Included
Conversation Fixed Effect Included Included Included
Agent Fixed Effect Included
Constant 3.584∗∗∗ 2.194∗∗∗ 3.112∗∗∗ 11.142∗∗∗
(0.0070) (0.0079) (0.0064) (1.6607)Observations 651168 651168 651168 141777R2 Within 0.010 0.173 0.040 0.015R2 Between 0.028 0.241 0.058 0.016R2 Overall 0.013 0.186 0.044 0.004
Standard errors in parentheses ∗ p < 0.05, ∗∗ p < 0.01, ∗∗∗ p < 0.001

ec5
Table EC.4 Effect of Customer Emotion on Agent Behavior (Outliers Excluded); using NumWords
Model(1) Model(2) Model (3) Model (4)log(RT ) log(RT ) NumWords NTurns
EMO -0.206∗∗∗ -0.223∗∗∗ 1.452∗∗∗
(0.0028) (0.0026) (0.0910)
EMO1 -1.615∗∗∗
(0.108)
Concurrent 0.057∗∗∗ 0.077∗∗∗ -1.671∗∗∗ -1.263∗∗∗
(0.0026) (0.0024) (0.0851) (0.0369)
NumInQueue 0.003∗∗∗ 0.003∗∗∗ 0.036 0.029∗∗∗
(0.0007) (0.0007) (0.0229) (0.0047)
ConvStage 0.246∗∗∗ 0.055∗∗∗ 16.218∗∗∗
(0.0043) (0.0040) (0.1376)
NumWords 0.012∗∗∗
(0.0000)
CustWords1 0.000(0.0009)
IsWeekend -0.013(0.0416)
SrvType 6.065(3.1525)
ShiftT ime Included
HourOfDay Included
Conversation Fixed Effect Included Included Included
Agent Fixed Effect Included
Constant 3.616∗∗∗ 3.280∗∗∗ 28.509∗∗∗ 10.286∗∗∗
(0.0070) (0.0066) (0.2266) (1.6768)Observations 651168 651168 651168 141777R2 Within . 0.141 0.042 .R2 Between 0.018 0.234 0.079 0.009R2 Overall 0.009 0.158 0.050 0.003
Standard errors in parentheses ∗ p < 0.05, ∗∗ p < 0.01, ∗∗∗ p < 0.001

ec6
Table EC.5 Effect of Customer Emotion on Agent Behavior (Outliers Included)
Model(1) Model(2) Model (3) Model (4)log(RT ) log(RT ) log(NumWords) NTurns
EMO -0.343∗∗∗ -0.332∗∗∗ -0.024∗∗∗
(0.0031) (0.0030) (0.0023)
EMO1 -1.677∗∗∗
(0.0638)
Concurrent 0.098∗∗∗ 0.112∗∗∗ -0.031∗∗∗ -1.153∗∗∗
(0.0030) (0.0028) (0.0022) (0.0337)
NumInQueue 0.004∗∗∗ 0.003∗∗∗ 0.002∗∗∗ 0.030∗∗∗
(0.0008) (0.0008) (0.0006) (0.0043)
ConvStage 0.280∗∗∗ 0.016∗∗∗ 0.570∗∗∗
(0.0048) (0.0046) (0.0035)
log(NumWords) 0.462∗∗∗
(0.0016)
log(CustWords1) -0.299∗∗∗
(0.0196)
IsWeekend 0.0171(0.0385)
SrvType 5.612(3.1187)
ShiftT ime Included
HourOfDay Included
Conversation Fixed Effect Included Included Included
Agent Fixed Effect Included
Constant 3.442∗∗∗ 2.018∗∗∗ 3.083∗∗∗ 10.716∗∗∗
(0.0079) (0.0089) (0.0058) (1.5582)Observations 825577 825577 825583 162362R2 Within . 0.115 0.050 .R2 Between 0.038 0.225 0.114 0.023R2 Overall 0.016 0.137 0.055 0.005
Standard errors in parentheses ∗ p < 0.05, ∗∗ p < 0.01, ∗∗∗ p < 0.001

ec7
Table EC.6 Effect of Customer Emotion on Agent Behavior. Emotion is Measured in Three Levels: Negative,
Neutral and Positive emotion. The Excluded Level is Neutral. (Outliers Included)
Model(1) Model(2) Model (3) Model (4)log(RT ) log(RT ) log(NumWords) NTurns
EMO negative 0.183∗∗∗ 0.121∗∗∗ 0.133∗∗∗
(0.0143) (0.0134) (0.0105)
EMO positive -0.525∗∗∗ -0.512∗∗∗ -0.028∗∗∗
(0.0046) (0.0043) (0.0034)
EMO negative1 3.271∗∗∗
(0.1638)
EMO positive1 -0.907∗∗∗
(0.1140)
Concurrent 0.100∗∗∗ 0.114∗∗∗ -0.031∗∗∗ -1.154∗∗∗
(0.0030) (0.0028) (0.0022) (0.0337)
NumInQueue 0.004∗∗∗ 0.003∗∗∗ 0.002∗∗∗ 0.029∗∗∗
(0.0008) (0.0008) (0.0006) (0.0044)
ConvStage 0.315∗∗∗ 0.050∗∗∗ 0.574∗∗∗
(0.0049) (0.0047) (0.0036)
log(NumWords) 0.463∗∗∗
(0.0016)
log(CustWords1) -0.371∗∗∗
(0.0222)
IsWeekend 0.007(0.0386)
SrvType 5.868(3.1237)
ShiftT ime Included
HourOfDay Included
Conversation Fixed Effect Included Included Included
Agent Fixed Effect Included
Constant 3.481∗∗∗ 2.058∗∗∗ 3.075∗∗∗ 9.734(0.0080) (0.0090) (0.0059) (7.0542)
Observations 825577 825577 825583 162362R2 Within 0.003 0.120 0.049 .R2 Between 0.039 0.230 0.112 0.022R2 Overall 0.017 0.140 0.054 0.005
Standard errors in parentheses ∗ p < 0.05, ∗∗ p < 0.01, ∗∗∗ p < 0.001

ec8
Table EC.7 Effect of Agent Behavior on Customer Emotion (Outliers Excluded); OLS with no IVs
Model (5) Model (6)EMO EMO
log(RT )) 0.019∗∗∗ 0.022∗∗∗
(0.0013) (0.0014)
ConvStage 0.842∗∗∗ 1.129∗∗∗
(0.0035) (0.0063)
log(NumWords) -0.015∗∗∗
(0.0014)
Turn -0.015∗∗∗
(0.0003)
Conversation Fixed Effect Included Included
Constant -0.208∗∗∗ -0.205∗∗∗
(0.0050) (0.0051)Observations 739425 739425R2 Within 0.102 0.107R2 Between 0.044 0.040R2 Overall 0.084 0.082
Standard errors in parentheses∗ p < 0.05, ∗∗ p < 0.01, ∗∗∗ p < 0.001
Table EC.8 Effect of Agent Behavior on Customer Emotion (Outliers Excluded); using CustSent as the Main
Measure of Customer Emotion
Model (5) Model (6)CustSent CustSent
log(RT ) 0.027 -0.275∗∗∗
(0.0140) (0.0375)
ConvStage 1.030∗∗∗ 1.397∗∗∗
(0.0055) (0.0074)
log(NumWords) 0.137∗∗∗
(0.0172)
Turn -0.019∗∗∗
(0.0003)
Conversation Fixed Effect Included Included
Constant -0.366∗∗∗ 0.300∗∗∗
(0.0506) (0.0878)Observations 586456 586456R2 Within 0.146 0.076R2 Between 0.067 0.041R2 Overall 0.121 0.082
Standard errors in parentheses∗ p < 0.05, ∗∗ p < 0.01, ∗∗∗ p < 0.001

ec9
Table EC.9 Effect of Agent Behavior on Customer Emotion (Outliers Included)
Model (5) Model (6)EMO EMO
log(RT ) -0.056∗∗∗ -0.328∗∗∗
(0.0100) (0.0256)
ConvStage 0.875∗∗∗ 1.114∗∗∗
(0.0044) (0.0068)
log(NumWords) 0.163∗∗∗
(0.0125)
Turn -0.015∗∗∗
(0.0003)
Conversation Fixed Effect Included Included
Constant 0.055 0.528∗∗∗
(0.0354) (0.0558)Observations 725805 725805R2 Within 0.090 .R2 Between 0.024 0.014R2 Overall 0.075 0.032
Standard errors in parentheses∗ p < 0.05, ∗∗ p < 0.01, ∗∗∗ p < 0.001
EC.3. Arrival Rate
In this section we provide additional data needed for the calculations of the impact of our results
on offered load. Table EC.10 provide a typical pattern of customer arrival rate per working hour
in our data.
Table EC.10 Arrival Rate during a Working Day
Hour λ
9 62.4510 67.611 63.7512 67.2513 68.914 69.0515 86.2516 90.217 68.118 63.519 59.3520 65.521 57.9522 53.65


![Large-scale Visual Sentiment Ontology and Detectors … · visual content is the analysis of aesthetics [6, 15, 22], in- terestingness [12], and a ect or emotions [13, 21, 37, 36]](https://img.dokumen.tips/doc/110x75/5b9a06f309d3f2cb468ce4bd/large-scale-visual-sentiment-ontology-and-detectors-visual-content-is-the-analysis.jpg)