Embed Size (px)
Citation preview
Annual NOR 2012 ANNEX I – ACC Capacity Evolution
March 2013 Annual NOR 2012 Annex I ©2013 European Organisation for the Safety of Air Navigation (EUROCONTROL)I
1
ANNEX I: ACC CAPACITY EVOLUTION INTRODUCTION.................................................................................................................................................3
1. ALBANIA TIRANA ACC.......................................................................................................................5
2. ARMENIA YEREVAN ACC ...................................................................................................................6
3. AUSTRIA VIENNA ACC........................................................................................................................7
4. AZERBAIJAN BAKU ACC....................................................................................................................8
5. BELGIUM BRUSSELS ACC .................................................................................................................9
6. BULGARIA SOFIA ACC......................................................................................................................10
7. CROATIA ZAGREB ACC....................................................................................................................11
8. CYPRUS NICOSIA ACC......................................................................................................................12
9. CZECH REPUBLIC PRAGUE ACC.....................................................................................................14
10. DENMARK COPENHAGEN ACC .......................................................................................................15
11. ESTONIA TALLINN ACC ....................................................................................................................16
12. EUROCONTROL MAASTRICHT ACC................................................................................................17
13. FINLAND TAMPERE ACC ..................................................................................................................18
14. FRANCE BORDEAUX ACC................................................................................................................19
15. FRANCE BREST ACC ........................................................................................................................20
16. FRANCE MARSEILLE ACC................................................................................................................21
17. FRANCE PARIS ACC .........................................................................................................................22
18. FRANCE REIMS ACC .........................................................................................................................23
19. FYROM SKOPJE ACC........................................................................................................................24
20. GEORGIA TBILISI ACC ......................................................................................................................25
21. GERMANY BREMEN ACC..................................................................................................................26
22. GERMANY KARLSRUHE ACC...........................................................................................................27
23. GERMANY LANGEN ACC..................................................................................................................28
24. GERMANY MUNICH ACC...................................................................................................................29
25. GREECE ATHENS ACC......................................................................................................................30
26. GREECE MAKEDONIA ACC ..............................................................................................................31
27. HUNGARY BUDAPEST ACC..............................................................................................................32
28. IRELAND DUBLIN ACC......................................................................................................................33
29. IRELAND SHANNON ACC .................................................................................................................34
30. ITALY BRINDISI ACC .........................................................................................................................35
31. ITALY MILAN ACC..............................................................................................................................36
32. ITALY PADOVA ACC..........................................................................................................................37
33. ITALY ROME ACC ..............................................................................................................................38
Annual NOR 2012 ANNEX I – ACC Capacity Evolution
March 2013 Annual NOR 2012 Annex I ©2013 European Organisation for the Safety of Air Navigation (EUROCONTROL)I
2
34. LATVIA RIGA ACC .............................................................................................................................39
35. LITHUANIA VILNIUS ACC..................................................................................................................40
36. MALTA MALTA ACC ..........................................................................................................................41
37. MOLDOVA CHISINAU ACC................................................................................................................42
38. THE NETHERLANDS AMSTERDAM ACC.........................................................................................43
39. NORWAY BODO ACC ........................................................................................................................44
40. NORWAY OSLO ACC.........................................................................................................................45
41. NORWAY STAVANGER ACC.............................................................................................................46
42. POLAND WARSAW ACC ...................................................................................................................47
43. PORTUGAL LISBON ACC..................................................................................................................48
44. ROMANIA BUCHAREST ACC............................................................................................................49
45. SERBIA & MONTENEGRO BELGRADE ACC ...................................................................................50
46. SLOVAK REPUBLIC BRATISLAVA ACC ..........................................................................................52
47. SLOVENIA LJUBLJANA ACC............................................................................................................53
48. SPAIN BARCELONA ACC..................................................................................................................54
49. SPAIN CANARIAS ACC......................................................................................................................55
50. SPAIN MADRID ACC ..........................................................................................................................56
51. SPAIN PALMA ACC............................................................................................................................57
52. SPAIN SEVILLA ACC .........................................................................................................................58
53. SWEDEN MALMO ACC ......................................................................................................................59
54. SWEDEN STOCKHOLM ACC.............................................................................................................60
55. SWITZERLAND GENEVA ACC ..........................................................................................................61
56. SWITZERLAND ZURICH ACC............................................................................................................62
57. TURKEY ANKARA /ISTANBUL ACC .................................................................................................63
58. UKRAINE DNIPROPRETROVSK ACC...............................................................................................65
59. UKRAINE KYIV ACC...........................................................................................................................66
60. UKRAINE L’VIV ACC ..........................................................................................................................67
61. UKRAINE ODESA ACC ......................................................................................................................68
62. UKRAINE SIMFEROPOL ACC ...........................................................................................................69
63. UNITED KINGDOM LONDON ACC ....................................................................................................70
64. UNITED KINGDOM LONDON TC .......................................................................................................72
65. UNITED KINGDOM PRESTWICK ACC ..............................................................................................73
Annual NOR 2012 ANNEX I – ACC Capacity Evolution
March 2013 Annual NOR 2012 Annex I ©2013 European Organisation for the Safety of Air Navigation (EUROCONTROL)I
3
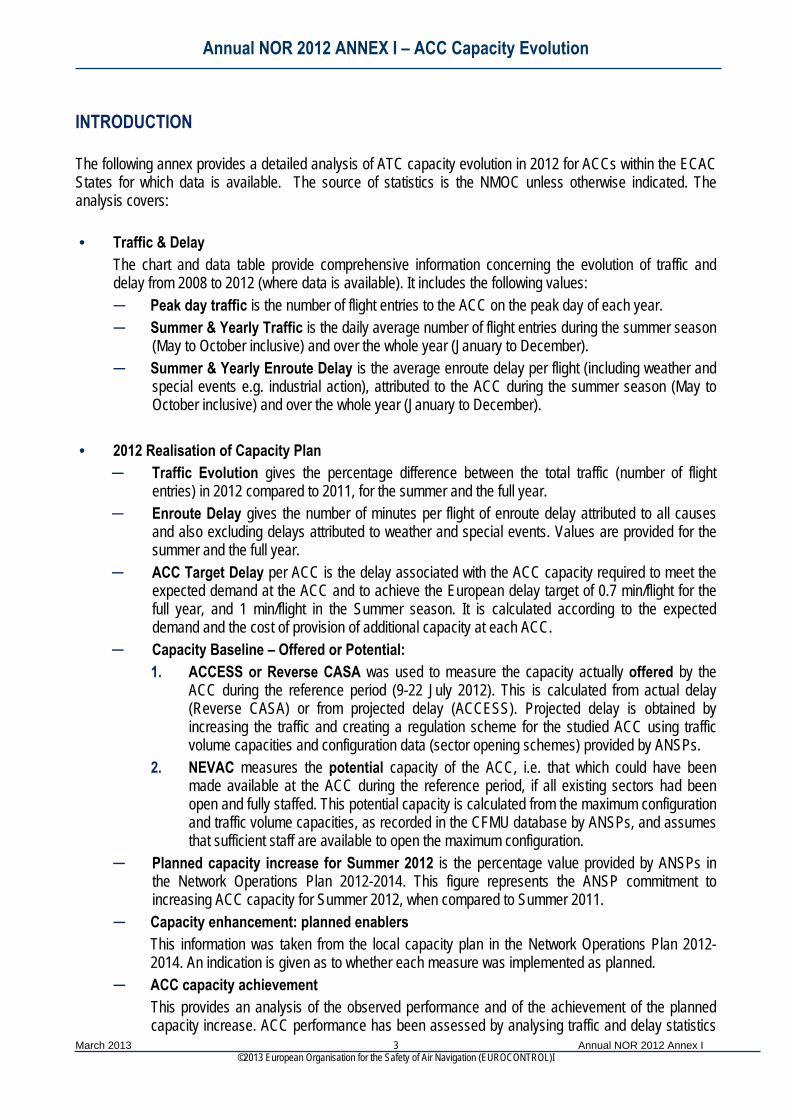
INTRODUCTION The following annex provides a detailed analysis of ATC capacity evolution in 2012 for ACCs within the ECAC States for which data is available. The source of statistics is the NMOC unless otherwise indicated. The analysis covers: • Traffic & Delay
The chart and data table provide comprehensive information concerning the evolution of traffic and delay from 2008 to 2012 (where data is available). It includes the following values: ─ Peak day traffic is the number of flight entries to the ACC on the peak day of each year. ─ Summer & Yearly Traffic is the daily average number of flight entries during the summer season
(May to October inclusive) and over the whole year (January to December). ─ Summer & Yearly Enroute Delay is the average enroute delay per flight (including weather and
special events e.g. industrial action), attributed to the ACC during the summer season (May to October inclusive) and over the whole year (January to December).
• 2012 Realisation of Capacity Plan
─ Traffic Evolution gives the percentage difference between the total traffic (number of flight entries) in 2012 compared to 2011, for the summer and the full year.
─ Enroute Delay gives the number of minutes per flight of enroute delay attributed to all causes and also excluding delays attributed to weather and special events. Values are provided for the summer and the full year.
─ ACC Target Delay per ACC is the delay associated with the ACC capacity required to meet the expected demand at the ACC and to achieve the European delay target of 0.7 min/flight for the full year, and 1 min/flight in the Summer season. It is calculated according to the expected demand and the cost of provision of additional capacity at each ACC.
─ Capacity Baseline – Offered or Potential: 1. ACCESS or Reverse CASA was used to measure the capacity actually offered by the
ACC during the reference period (9-22 July 2012). This is calculated from actual delay (Reverse CASA) or from projected delay (ACCESS). Projected delay is obtained by increasing the traffic and creating a regulation scheme for the studied ACC using traffic volume capacities and configuration data (sector opening schemes) provided by ANSPs.
2. NEVAC measures the potential capacity of the ACC, i.e. that which could have been made available at the ACC during the reference period, if all existing sectors had been open and fully staffed. This potential capacity is calculated from the maximum configuration and traffic volume capacities, as recorded in the CFMU database by ANSPs, and assumes that sufficient staff are available to open the maximum configuration.
─ Planned capacity increase for Summer 2012 is the percentage value provided by ANSPs in the Network Operations Plan 2012-2014. This figure represents the ANSP commitment to increasing ACC capacity for Summer 2012, when compared to Summer 2011.
─ Capacity enhancement: planned enablers This information was taken from the local capacity plan in the Network Operations Plan 2012-2014. An indication is given as to whether each measure was implemented as planned.
─ ACC capacity achievement This provides an analysis of the observed performance and of the achievement of the planned capacity increase. ACC performance has been assessed by analysing traffic and delay statistics

Annual NOR 2012 ANNEX I – ACC Capacity Evolution
March 2013 Annual NOR 2012 Annex I ©2013 European Organisation for the Safety of Air Navigation (EUROCONTROL)I
4
for each ACC and the evolution of the capacity baseline. Where relevant, other significant factors were also taken into account, such as industrial action or planned major events that resulted in a temporary reduction in capacity.
• Allocation of and reasons for Enroute delay
The table lists the reference locations (sectors) causing most of the ACC delay, the number of minutes of enroute delay attributed to each location and the percentage of the total ACC enroute delay. The graph shows the total ATFM enroute delay generated by each ACC, broken down into the 5 most significant reasons given for the delay in 2012 compared to 2011.
Note: The scale on all graphs varies from ACC to ACC - graphs should not be directly compared.

Annual NOR 2012 ANNEX I – ACC Capacity Evolution
March 2013 Annual NOR 2012 Annex I ©2013 European Organisation for the Safety of Air Navigation (EUROCONTROL)I
5
1. ALBANIA TIRANA ACC Traffic & Delay
LAAAACC - Traffic and en-route ATFM delays
0
100
200
300
400
500
600
700
800
900
1000
IFR
flig
hts
(Dai
ly A
vera
ge)
0,0
0,1
0,2
0,3
0,4
0,5
0,6
0,7
0,8
0,9
1,0
Enro
ute
Del
ay (m
inut
es p
er fl
ight
)
Peak Day Traff ic 626 745 831 880 926
Summer Traff ic 494 559 617 671 666
Yearly Traff ic 405 442 497 541 533
Summer enroute delay (all causes) 0,1 0,2 0,2 0,8 0,0
Yearly enroute delay (all causes) 0,1 0,1 0,1 0,5 0,1
2008 2009 2010 2011 2012
2012 Realisation of Capacity Plan
The average en-route delay per flight was at zero minutes per flight during Summer 2012.
Capacity Plan +10% Achieved Comments ATS route network improvements Yes
Capacity benefits from new ATM system Yes
1 additional sector Yes
New Met system Yes
Refresh ATCO on unusual situations Yes
STCA No Not implemented – Postponed to 2013
Flexible DFL Yes
MFCR with LIBB No Postponed to 2013
Increased sector capacities Yes
Maximum configuration: 4 sectors Yes
Summer 2012 performance assessment
The ACC capacity baseline of 65 was calculated with ACCESS and represents the capacity delivered during the Summer season in the ACC. During the period June/July, the average peak 1 hour demand was 55 and the peak 3 hour demand was 49. A maximum configuration of 4 sectors was opened (3 en-route + 1 TMA).
Traffic Evolution (2012 v 2011) Enroute Delay (min. per flight)
Traffic Forecast Tirana LAAA ACC Current
Routes Shortest Routes
Actual Traffic
All reasons
Delay without weather
ACC Target Delay
ACC Capacity Baseline
(% difference v 2011)
Year -1.2% 0.1 0.1 0.31
Capacity gap?
Summer
H: -0.6% B: -0.6% L: -2.0%
+3% -0.8% 0.0 0.0 0.47 No Offered: 65 (+16%)
Allocation of and Reasons for Enroute Delay
Annual NOR 2012 ANNEX I – ACC Capacity Evolution
March 2013 Annual NOR 2012 Annex I ©2013 European Organisation for the Safety of Air Navigation (EUROCONTROL)I
6
2. ARMENIA YEREVAN ACC Traffic & Delay
Armenia Yerevan UDDD ACC - Traffic
0
10.000
20.000
30.000
40.000
50.000
60.000
70.000
Flig
hts
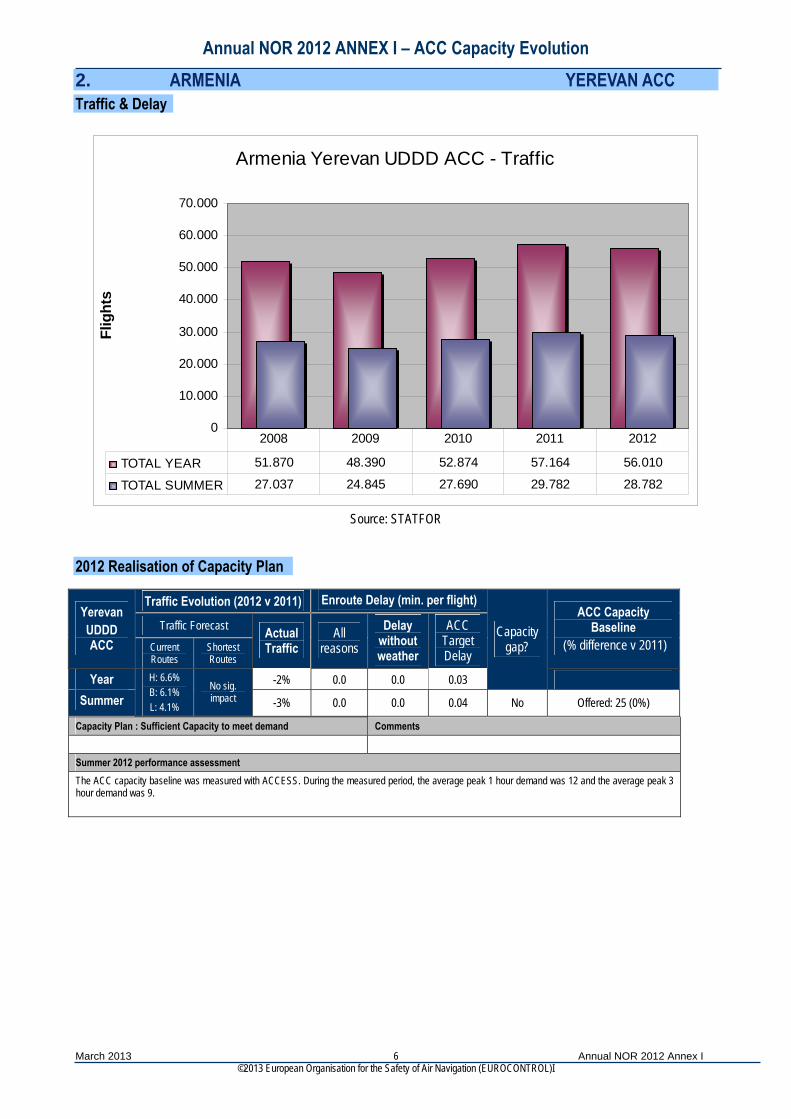
TOTAL YEAR 51.870 48.390 52.874 57.164 56.010
TOTAL SUMMER 27.037 24.845 27.690 29.782 28.782
2008 2009 2010 2011 2012
Source: STATFOR
2012 Realisation of Capacity Plan
Capacity Plan : Sufficient Capacity to meet demand Comments Summer 2012 performance assessment The ACC capacity baseline was measured with ACCESS. During the measured period, the average peak 1 hour demand was 12 and the average peak 3 hour demand was 9.
Traffic Evolution (2012 v 2011) Enroute Delay (min. per flight)
Traffic Forecast Yerevan UDDD ACC Current
Routes Shortest Routes
Actual Traffic
All reasons
Delay without weather
ACC Target Delay
ACC Capacity Baseline
(% difference v 2011)
Year -2% 0.0 0.0 0.03
Capacity gap?
Summer
H: 6.6% B: 6.1% L: 4.1%
No sig. impact -3% 0.0 0.0 0.04 No Offered: 25 (0%)

Annual NOR 2012 ANNEX I – ACC Capacity Evolution
March 2013 Annual NOR 2012 Annex I ©2013 European Organisation for the Safety of Air Navigation (EUROCONTROL)I
7
3. AUSTRIA VIENNA ACC Traffic & Delay
LOVVACC - Traffic and en-route ATFM delays
0
500
1000
1500
2000
2500
3000
IFR
flig
hts
(Dai
ly A
vera
ge)
0,00,20,40,60,81,01,21,41,61,82,02,22,4
Enro
ute
Del
ay (m
inut
es p
er fl
ight
)
Peak Day Traff ic 2841 2565 2598 2782 2788
Summer Traffic 2424 2269 2293 2347 2303
Yearly Traff ic 2108 1976 1969 2015 1961
Summer enroute delay (all causes) 2,1 1,2 2,2 0,3 0,3
Yearly enroute delay (all causes) 1,4 1,2 1,5 0,2 0,2
2008 2009 2010 2011 2012
2012 Realisation of Capacity Plan
The average en-route delay per flight for all reasons remained at 0.3 minutes per flight in Summer 2012. Without weather, it decreased from 0.3 min/flight during Summer 2011 to 0.1 min/flight in Summer 2012. 31% of the delays were for the reason ATC Capacity, 15% for ATC Staffing, and 54% for Weather. Capacity Plan +3% Achieved Comments Improved operational procedures including FMP/AMC Yes
ATS route network improvements Yes
Sector configuration management Yes
Static cross border sectorisation (FAB CE) Yes
10 additional controllers Yes
Maximum configuration: 11 sectors Yes Maximum configuration : 12 sectors
Summer 2012 performance assessment
The capacity baseline of 180 was calculated with ACCESS, showing the capacity offered during the measured period. During the period June/July, the average peak 1 hour demand was 172 and the average peak 3 hour demand was 160. A maximum configuration of 12 sectors was opened.
Traffic Evolution (2012 v 2011) Enroute Delay (min. per flight)
Traffic Forecast Vienna LOVV ACC Current
Routes Shortest Routes
Actual Traffic
All reasons
Delay without weather
ACC Target Delay
ACC Capacity Baseline
(% difference v 2011)
Year -2.4% 0.2 0.1 0.30
Capacity gap?
Summer
H: -1.0% B: -1.7% L: -2.9%
+10% -1.9% 0.3 0.1 0.42 No Offered: 180 (+7%)
Allocation of and Reasons for Enroute Delay
Annual NOR 2012 ANNEX I – ACC Capacity Evolution
March 2013 Annual NOR 2012 Annex I ©2013 European Organisation for the Safety of Air Navigation (EUROCONTROL)I
8
4. AZERBAIJAN BAKU ACC Traffic & Delay
AZERBAIJAN BAKU UBBA ACC: Traffic
0
20.000
40.000
60.000
80.000
100.000
120.000
140.000
Flig
hts
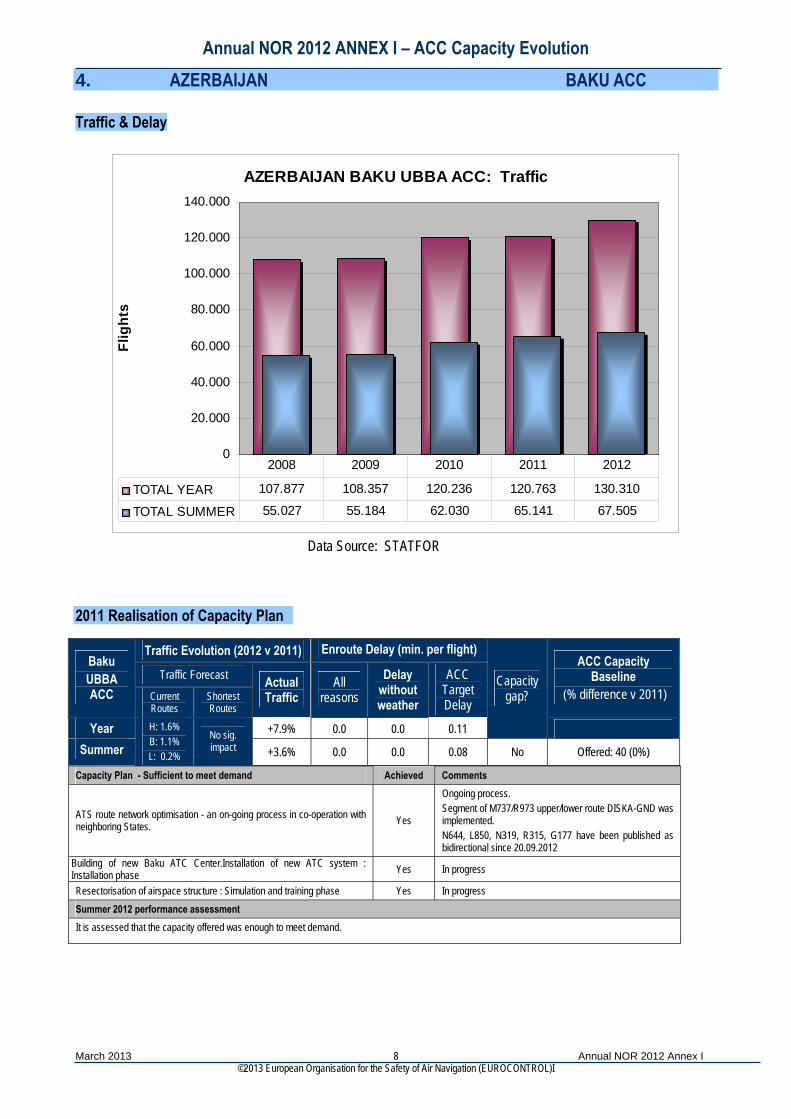
TOTAL YEAR 107.877 108.357 120.236 120.763 130.310
TOTAL SUMMER 55.027 55.184 62.030 65.141 67.505
2008 2009 2010 2011 2012
Data Source: STATFOR
2011 Realisation of Capacity Plan
Capacity Plan - Sufficient to meet demand Achieved Comments
ATS route network optimisation - an on-going process in co-operation with neighboring States. Yes
Ongoing process. Segment of M737/R973 upper/lower route DISKA-GND was implemented. N644, L850, N319, R315, G177 have been published as bidirectional since 20.09.2012
Building of new Baku ATC Center.Installation of new ATC system : Installation phase Yes In progress
Resectorisation of airspace structure : Simulation and training phase Yes In progress Summer 2012 performance assessment It is assessed that the capacity offered was enough to meet demand.
Traffic Evolution (2012 v 2011) Enroute Delay (min. per flight)
Traffic Forecast Baku UBBA ACC Current
Routes Shortest Routes
Actual Traffic
All reasons
Delay without weather
ACC Target Delay
ACC Capacity Baseline
(% difference v 2011)
Year +7.9% 0.0 0.0 0.11
Capacity gap?
Summer
H: 1.6% B: 1.1% L: 0.2%
No sig. impact +3.6% 0.0 0.0 0.08 No Offered: 40 (0%)
Annual NOR 2012 ANNEX I – ACC Capacity Evolution
March 2013 Annual NOR 2012 Annex I ©2013 European Organisation for the Safety of Air Navigation (EUROCONTROL)I
9
5. BELGIUM BRUSSELS ACC Traffic & Delay
EBBUACC - Traffic and en-route ATFM delays
0
500
1000
1500
2000
2500
IFR
flig
hts
(Dai
ly A
vera
ge)
0,0
0,1
0,2
0,3
0,4
0,5
0,6
0,7
0,8
0,9
1,0
Enro
ute
Del
ay (m
inut
es p
er fl
ight
)
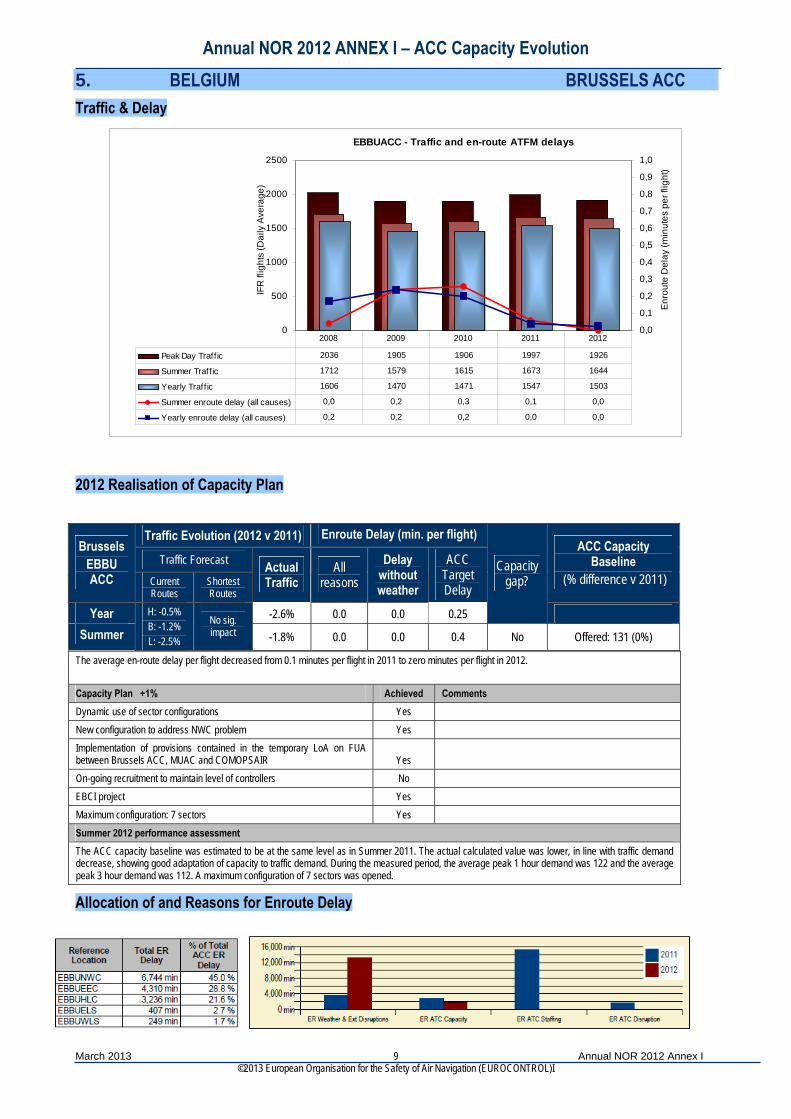
Peak Day Traff ic 2036 1905 1906 1997 1926
Summer Traffic 1712 1579 1615 1673 1644
Yearly Traff ic 1606 1470 1471 1547 1503
Summer enroute delay (all causes) 0,0 0,2 0,3 0,1 0,0
Yearly enroute delay (all causes) 0,2 0,2 0,2 0,0 0,0
2008 2009 2010 2011 2012
2012 Realisation of Capacity Plan
The average en-route delay per flight decreased from 0.1 minutes per flight in 2011 to zero minutes per flight in 2012. Capacity Plan +1% Achieved Comments Dynamic use of sector configurations Yes New configuration to address NWC problem Yes Implementation of provisions contained in the temporary LoA on FUA between Brussels ACC, MUAC and COMOPSAIR Yes On-going recruitment to maintain level of controllers No EBCI project Yes Maximum configuration: 7 sectors Yes Summer 2012 performance assessment The ACC capacity baseline was estimated to be at the same level as in Summer 2011. The actual calculated value was lower, in line with traffic demand decrease, showing good adaptation of capacity to traffic demand. During the measured period, the average peak 1 hour demand was 122 and the average peak 3 hour demand was 112. A maximum configuration of 7 sectors was opened.
Traffic Evolution (2012 v 2011) Enroute Delay (min. per flight)
Traffic Forecast Brussels
EBBU ACC Current
Routes Shortest Routes
Actual Traffic
All reasons
Delay without weather
ACC Target Delay
ACC Capacity Baseline
(% difference v 2011)
Year -2.6% 0.0 0.0 0.25
Capacity gap?
Summer
H: -0.5% B: -1.2% L: -2.5%
No sig. impact -1.8% 0.0 0.0 0.4 No Offered: 131 (0%)
Allocation of and Reasons for Enroute Delay

Annual NOR 2012 ANNEX I – ACC Capacity Evolution
March 2013 Annual NOR 2012 Annex I ©2013 European Organisation for the Safety of Air Navigation (EUROCONTROL)I
10
6. BULGARIA SOFIA ACC Traffic & Delay
LBSRACC - Traffic and en-route ATFM delays
0
500
1000
1500
2000
2500
IFR
flig
hts
(Dai
ly A
vera
ge)
0,0
0,1
0,2
0,3
0,4
0,5
0,6
0,7
0,8
0,9
1,0
Enro
ute
Del
ay (m
inut
es p
er fl
ight
)
Peak Day Traff ic 1948 1992 2150 2337 2253
Summer Traffic 1556 1533 1677 1802 1807
Yearly Traff ic 1187 1230 1322 1418 1422
Summer enroute delay (all causes) 0,0 0,0 0,0 0,1 0,0
Yearly enroute delay (all causes) 0,0 0,0 0,0 0,1 0,0
2008 2009 2010 2011 2012
2012 Realisation of Capacity Plan
The en-route delay per flight decreased from 0.1 min per flight in Summer 2011 to zero minutes per flight during the same period. Capacity Plan - Sufficient capacity to meet demand Achieved Comments ATS route network development and increase of maximum sector configurations available YES Summer 2012 performance assessment The capacity baseline of 149 was measured by ACCESS and reflects the delivered capacity in the ACC. During the measured period, the peak 1 hour demand was 130 and the peak 3 hour demand was 119. A maximum 7 sector configuration was opened.
Traffic Evolution (2012 v 2011) Enroute Delay (min. per flight)
Traffic Forecast Sofia LBSR ACC Current
Routes Shortest Routes
Actual Traffic
All reasons
Delay without weather
ACC Target Delay
ACC Capacity Baseline
(% difference v 2011)
Year +0.5% 0.0 0.0 0.11
Capacity gap?
Summer
H: 1.2% B: 0.0% L: -1.0%
No sig. impact +0.3% 0.0 0.0 0.16 No Offered: 149 (0%)
Allocation of and Reasons for Enroute Delay
Annual NOR 2012 ANNEX I – ACC Capacity Evolution
March 2013 Annual NOR 2012 Annex I ©2013 European Organisation for the Safety of Air Navigation (EUROCONTROL)I
11
7. CROATIA ZAGREB ACC Traffic & Delay
LDZOACC - Traffic and en-route ATFM delays
0
500
1000
1500
2000
2500
IFR
flig
hts
(Dai
ly A
vera
ge)
0,0
0,5
1,0
1,5
2,0
2,5
3,0
3,5
Enro
ute
Del
ay (m
inut
es p
er fl
ight
)
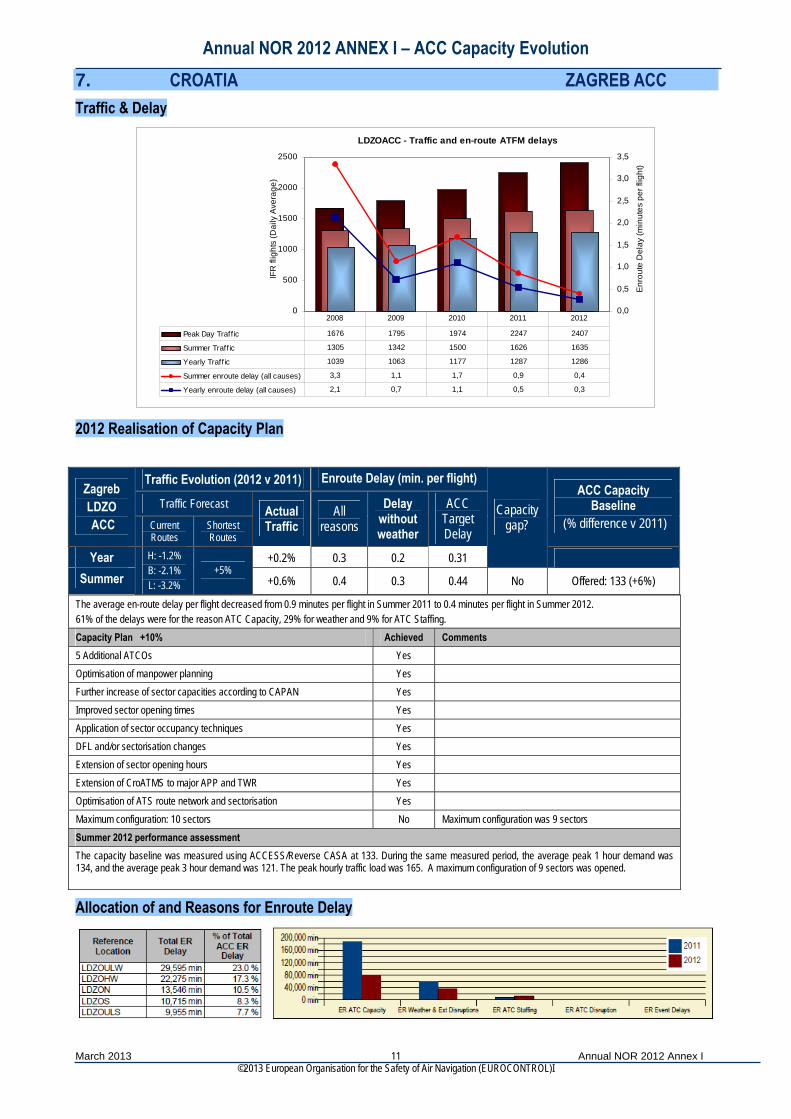
Peak Day Traff ic 1676 1795 1974 2247 2407
Summer Traff ic 1305 1342 1500 1626 1635
Yearly Traff ic 1039 1063 1177 1287 1286
Summer enroute delay (all causes) 3,3 1,1 1,7 0,9 0,4
Yearly enroute delay (all causes) 2,1 0,7 1,1 0,5 0,3
2008 2009 2010 2011 2012
2012 Realisation of Capacity Plan
The average en-route delay per flight decreased from 0.9 minutes per flight in Summer 2011 to 0.4 minutes per flight in Summer 2012. 61% of the delays were for the reason ATC Capacity, 29% for weather and 9% for ATC Staffing. Capacity Plan +10% Achieved Comments 5 Additional ATCOs Yes Optimisation of manpower planning Yes Further increase of sector capacities according to CAPAN Yes Improved sector opening times Yes Application of sector occupancy techniques Yes DFL and/or sectorisation changes Yes Extension of sector opening hours Yes Extension of CroATMS to major APP and TWR Yes Optimisation of ATS route network and sectorisation Yes Maximum configuration: 10 sectors No Maximum configuration was 9 sectors Summer 2012 performance assessment The capacity baseline was measured using ACCESS/Reverse CASA at 133. During the same measured period, the average peak 1 hour demand was 134, and the average peak 3 hour demand was 121. The peak hourly traffic load was 165. A maximum configuration of 9 sectors was opened.
Traffic Evolution (2012 v 2011) Enroute Delay (min. per flight)
Traffic Forecast Zagreb LDZO ACC Current
Routes Shortest Routes
Actual Traffic
All reasons
Delay without weather
ACC Target Delay
ACC Capacity Baseline
(% difference v 2011)
Year +0.2% 0.3 0.2 0.31
Capacity gap?
Summer
H: -1.2% B: -2.1% L: -3.2%
+5% +0.6% 0.4 0.3 0.44 No Offered: 133 (+6%)
Allocation of and Reasons for Enroute Delay
Annual NOR 2012 ANNEX I – ACC Capacity Evolution
March 2013 Annual NOR 2012 Annex I ©2013 European Organisation for the Safety of Air Navigation (EUROCONTROL)I
12
8. CYPRUS NICOSIA ACC Traffic & Delay
LCCCACC - Traffic and en-route ATFM delays
0
200
400
600
800
1000
1200
1400
IFR
flig
hts
(Dai
ly A
vera
ge)
0,0
0,5
1,0
1,5
2,0
2,5
3,0
3,5
4,0
Enro
ute
Del
ay (m
inut
es p
er fl
ight
)
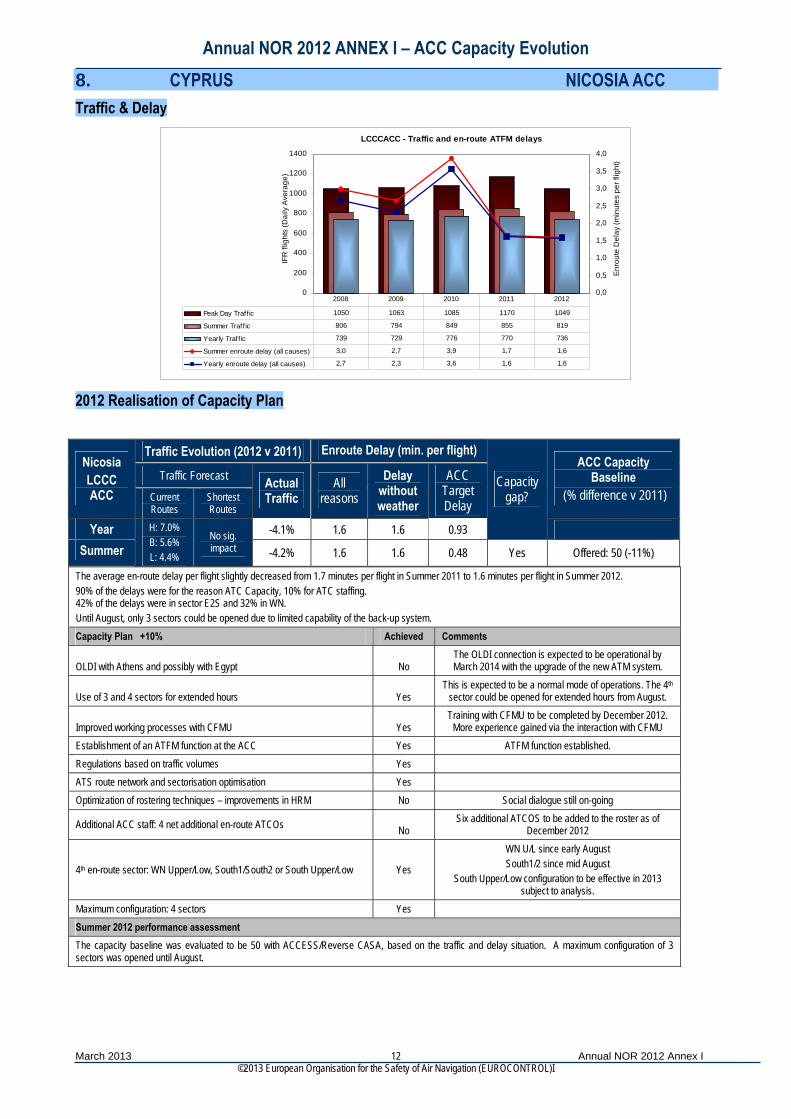
Peak Day Traffic 1050 1063 1085 1170 1049
Summer Traff ic 806 794 849 855 819
Yearly Traff ic 739 729 776 770 736
Summer enroute delay (all causes) 3,0 2,7 3,9 1,7 1,6
Yearly enroute delay (all causes) 2,7 2,3 3,6 1,6 1,6
2008 2009 2010 2011 2012
2012 Realisation of Capacity Plan
The average en-route delay per flight slightly decreased from 1.7 minutes per flight in Summer 2011 to 1.6 minutes per flight in Summer 2012. 90% of the delays were for the reason ATC Capacity, 10% for ATC staffing. 42% of the delays were in sector E2S and 32% in WN. Until August, only 3 sectors could be opened due to limited capability of the back-up system. Capacity Plan +10% Achieved Comments
OLDI with Athens and possibly with Egypt No The OLDI connection is expected to be operational by March 2014 with the upgrade of the new ATM system.
Use of 3 and 4 sectors for extended hours Yes This is expected to be a normal mode of operations. The 4th
sector could be opened for extended hours from August.
Improved working processes with CFMU Yes Training with CFMU to be completed by December 2012.
More experience gained via the interaction with CFMU Establishment of an ATFM function at the ACC Yes ATFM function established. Regulations based on traffic volumes Yes ATS route network and sectorisation optimisation Yes Optimization of rostering techniques – improvements in HRM No Social dialogue still on-going
Additional ACC staff: 4 net additional en-route ATCOs No Six additional ATCOS to be added to the roster as of
December 2012
4th en-route sector: WN Upper/Low, South1/South2 or South Upper/Low Yes
WN U/L since early August South1/2 since mid August
South Upper/Low configuration to be effective in 2013 subject to analysis.
Maximum configuration: 4 sectors Yes Summer 2012 performance assessment The capacity baseline was evaluated to be 50 with ACCESS/Reverse CASA, based on the traffic and delay situation. A maximum configuration of 3 sectors was opened until August.
Traffic Evolution (2012 v 2011) Enroute Delay (min. per flight)
Traffic Forecast Nicosia LCCC ACC Current
Routes Shortest Routes
Actual Traffic
All reasons
Delay without weather
ACC Target Delay
ACC Capacity Baseline
(% difference v 2011)
Year -4.1% 1.6 1.6 0.93
Capacity gap?
Summer
H: 7.0% B: 5.6% L: 4.4%
No sig. impact -4.2% 1.6 1.6 0.48 Yes Offered: 50 (-11%)

Annual NOR 2012 ANNEX I – ACC Capacity Evolution
March 2013 Annual NOR 2012 Annex I ©2013 European Organisation for the Safety of Air Navigation (EUROCONTROL)I
13
Allocation of and Reasons for Enroute Delay
Annual NOR 2012 ANNEX I – ACC Capacity Evolution
March 2013 Annual NOR 2012 Annex I ©2013 European Organisation for the Safety of Air Navigation (EUROCONTROL)I
14
9. CZECH REPUBLIC PRAGUE ACC Traffic & Delay
LKAAACC - Traffic and en-route ATFM delays
0
500
1000
1500
2000
2500
3000
IFR
flig
hts
(Dai
ly A
vera
ge)
0,0
0,1
0,2
0,3
0,4
0,5
0,6
0,7
0,8
0,9
1,0
Enro
ute
Del
ay (m
inut
es p
er fl
ight
)
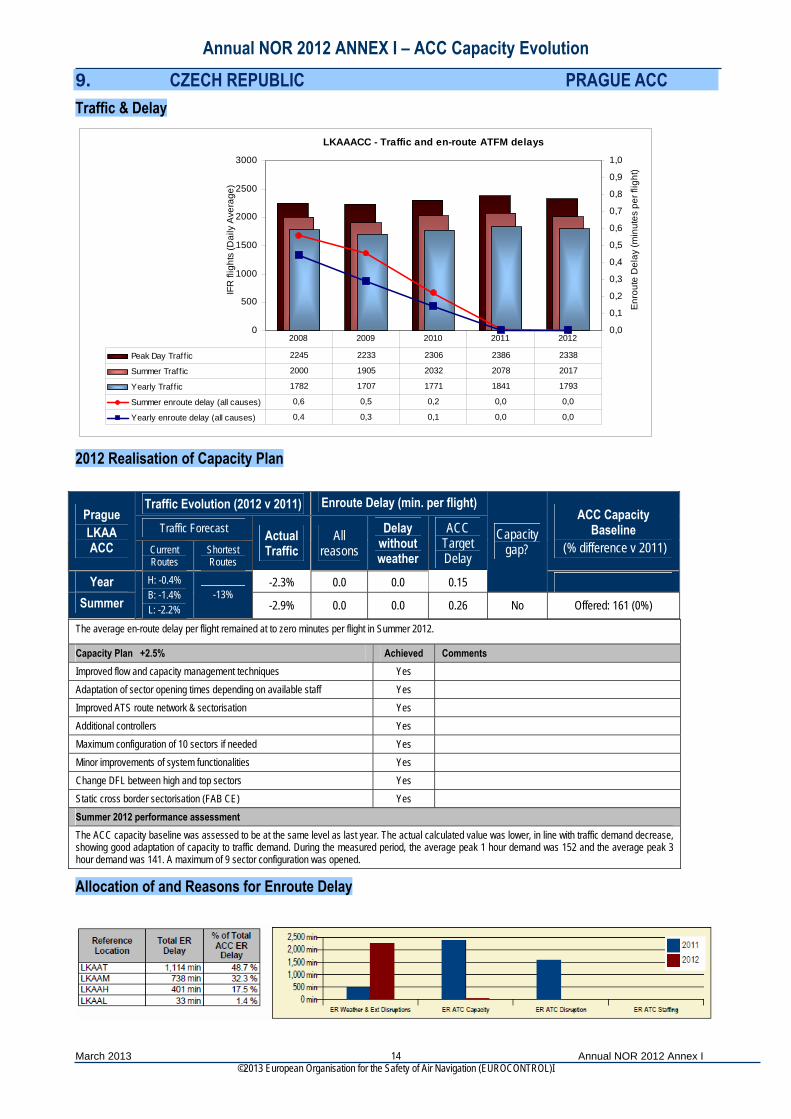
Peak Day Traff ic 2245 2233 2306 2386 2338
Summer Traffic 2000 1905 2032 2078 2017
Yearly Traff ic 1782 1707 1771 1841 1793
Summer enroute delay (all causes) 0,6 0,5 0,2 0,0 0,0
Yearly enroute delay (all causes) 0,4 0,3 0,1 0,0 0,0
2008 2009 2010 2011 2012
2012 Realisation of Capacity Plan
The average en-route delay per flight remained at to zero minutes per flight in Summer 2012.
Capacity Plan +2.5% Achieved Comments Improved flow and capacity management techniques Yes Adaptation of sector opening times depending on available staff Yes Improved ATS route network & sectorisation Yes Additional controllers Yes Maximum configuration of 10 sectors if needed Yes Minor improvements of system functionalities Yes Change DFL between high and top sectors Yes Static cross border sectorisation (FAB CE) Yes Summer 2012 performance assessment The ACC capacity baseline was assessed to be at the same level as last year. The actual calculated value was lower, in line with traffic demand decrease, showing good adaptation of capacity to traffic demand. During the measured period, the average peak 1 hour demand was 152 and the average peak 3 hour demand was 141. A maximum of 9 sector configuration was opened.
Traffic Evolution (2012 v 2011) Enroute Delay (min. per flight)
Traffic Forecast Prague LKAA ACC Current
Routes Shortest Routes
Actual Traffic
All reasons
Delay without weather
ACC Target Delay
ACC Capacity Baseline
(% difference v 2011)
Year -2.3% 0.0 0.0 0.15
Capacity gap?
Summer
H: -0.4% B: -1.4% L: -2.2%
-13% -2.9% 0.0 0.0 0.26 No Offered: 161 (0%)
Allocation of and Reasons for Enroute Delay
Annual NOR 2012 ANNEX I – ACC Capacity Evolution
March 2013 Annual NOR 2012 Annex I ©2013 European Organisation for the Safety of Air Navigation (EUROCONTROL)I
15
10. DENMARK COPENHAGEN ACC
Traffic & Delay
EKDKACC - Traffic and en-route ATFM delays
0
200
400
600
800
1000
1200
1400
1600
1800
2000
IFR
flig
hts
(Dai
ly A
vera
ge)
0,00,20,40,60,81,01,21,41,61,82,02,22,4
Enro
ute
Del
ay (m
inut
es p
er fl
ight
)
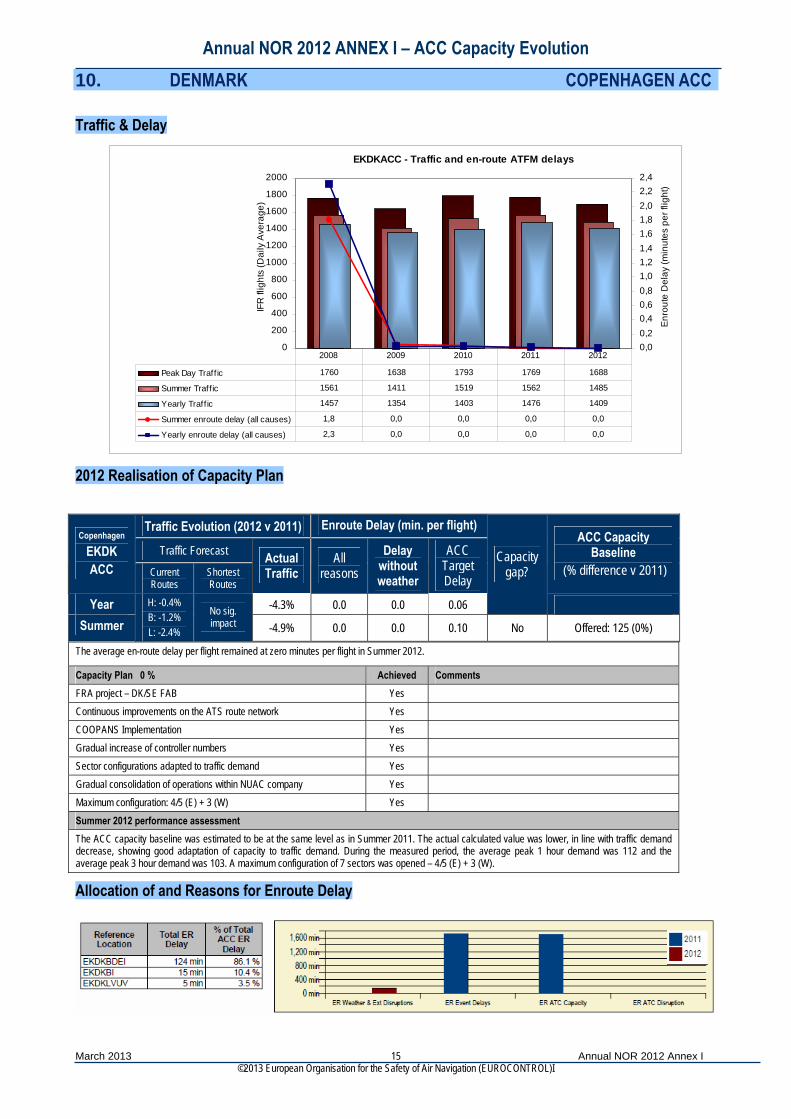
Peak Day Traff ic 1760 1638 1793 1769 1688
Summer Traffic 1561 1411 1519 1562 1485
Yearly Traff ic 1457 1354 1403 1476 1409
Summer enroute delay (all causes) 1,8 0,0 0,0 0,0 0,0
Yearly enroute delay (all causes) 2,3 0,0 0,0 0,0 0,0
2008 2009 2010 2011 2012
2012 Realisation of Capacity Plan
The average en-route delay per flight remained at zero minutes per flight in Summer 2012.
Capacity Plan 0 % Achieved Comments FRA project – DK/SE FAB Yes Continuous improvements on the ATS route network Yes COOPANS Implementation Yes Gradual increase of controller numbers Yes Sector configurations adapted to traffic demand Yes Gradual consolidation of operations within NUAC company Yes Maximum configuration: 4/5 (E) + 3 (W) Yes Summer 2012 performance assessment The ACC capacity baseline was estimated to be at the same level as in Summer 2011. The actual calculated value was lower, in line with traffic demand decrease, showing good adaptation of capacity to traffic demand. During the measured period, the average peak 1 hour demand was 112 and the average peak 3 hour demand was 103. A maximum configuration of 7 sectors was opened – 4/5 (E) + 3 (W).
Traffic Evolution (2012 v 2011) Enroute Delay (min. per flight)
Traffic Forecast Copenhagen
EKDK ACC Current
Routes Shortest Routes
Actual Traffic
All reasons
Delay without weather
ACC Target Delay
ACC Capacity Baseline
(% difference v 2011)
Year -4.3% 0.0 0.0 0.06
Capacity gap?
Summer
H: -0.4% B: -1.2% L: -2.4%
No sig. impact -4.9% 0.0 0.0 0.10 No Offered: 125 (0%)
Allocation of and Reasons for Enroute Delay
Annual NOR 2012 ANNEX I – ACC Capacity Evolution
March 2013 Annual NOR 2012 Annex I ©2013 European Organisation for the Safety of Air Navigation (EUROCONTROL)I
16
11. ESTONIA TALLINN ACC Traffic & Delay
EETTACC - Traffic and en-route ATFM delays
0
100
200
300
400
500
600
700
IFR
flig
hts
(Dai
ly A
vera
ge)
0,0
0,1
0,2
0,3
0,4
0,5
0,6
0,7
0,8
0,9
1,0
Enro
ute
Del
ay (m
inut
es p
er fl
ight
)
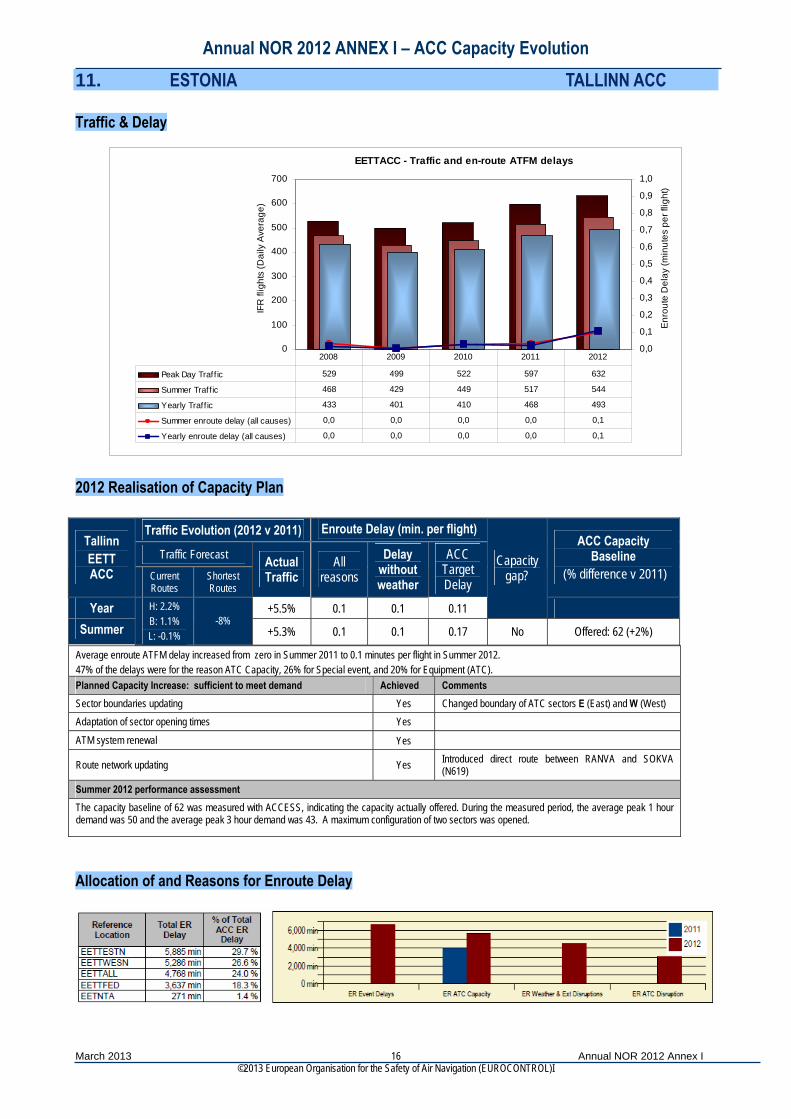
Peak Day Traff ic 529 499 522 597 632
Summer Traffic 468 429 449 517 544
Yearly Traff ic 433 401 410 468 493
Summer enroute delay (all causes) 0,0 0,0 0,0 0,0 0,1
Yearly enroute delay (all causes) 0,0 0,0 0,0 0,0 0,1
2008 2009 2010 2011 2012
2012 Realisation of Capacity Plan
Average enroute ATFM delay increased from zero in Summer 2011 to 0.1 minutes per flight in Summer 2012. 47% of the delays were for the reason ATC Capacity, 26% for Special event, and 20% for Equipment (ATC). Planned Capacity Increase: sufficient to meet demand Achieved Comments Sector boundaries updating Yes Changed boundary of ATC sectors E (East) and W (West) Adaptation of sector opening times Yes
ATM system renewal Yes
Route network updating Yes Introduced direct route between RANVA and SOKVA (N619)
Summer 2012 performance assessment The capacity baseline of 62 was measured with ACCESS, indicating the capacity actually offered. During the measured period, the average peak 1 hour demand was 50 and the average peak 3 hour demand was 43. A maximum configuration of two sectors was opened.
Traffic Evolution (2012 v 2011) Enroute Delay (min. per flight)
Traffic Forecast Tallinn EETT ACC Current
Routes Shortest Routes
Actual Traffic
All reasons
Delay without weather
ACC Target Delay
ACC Capacity Baseline
(% difference v 2011)
Year +5.5% 0.1 0.1 0.11
Capacity gap?
Summer
H: 2.2% B: 1.1% L: -0.1%
-8% +5.3% 0.1 0.1 0.17 No Offered: 62 (+2%)
Allocation of and Reasons for Enroute Delay
Annual NOR 2012 ANNEX I – ACC Capacity Evolution
March 2013 Annual NOR 2012 Annex I ©2013 European Organisation for the Safety of Air Navigation (EUROCONTROL)I
17
12. EUROCONTROL MAASTRICHT ACC Traffic & Delay
EDYYUAC - Traffic and en-route ATFM delays
0
1000
2000
3000
4000
5000
6000
IFR
flig
hts
(Dai
ly A
vera
ge)
0,0
0,1
0,2
0,3
0,4
0,5
0,6
0,7
0,8
0,9
1,0
Enro
ute
Del
ay (m
inut
es p
er fl
ight
)
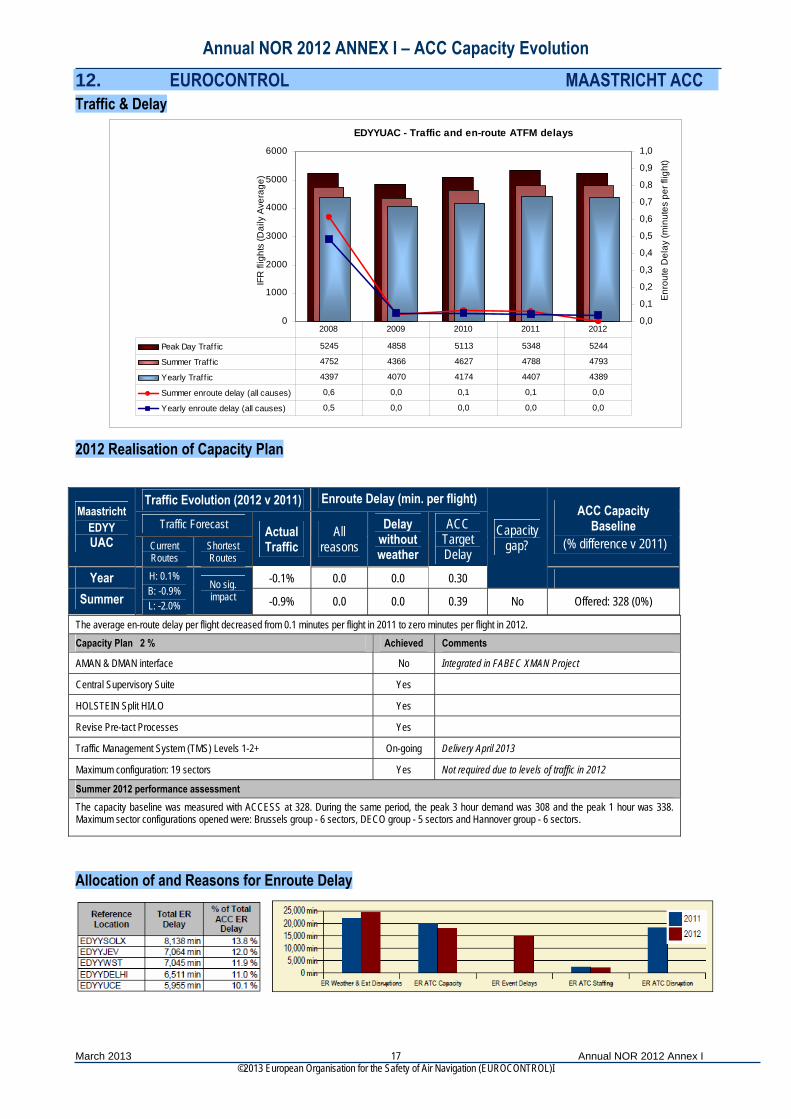
Peak Day Traff ic 5245 4858 5113 5348 5244
Summer Traffic 4752 4366 4627 4788 4793
Yearly Traff ic 4397 4070 4174 4407 4389
Summer enroute delay (all causes) 0,6 0,0 0,1 0,1 0,0
Yearly enroute delay (all causes) 0,5 0,0 0,0 0,0 0,0
2008 2009 2010 2011 2012
2012 Realisation of Capacity Plan
The average en-route delay per flight decreased from 0.1 minutes per flight in 2011 to zero minutes per flight in 2012. Capacity Plan 2 % Achieved Comments
AMAN & DMAN interface No Integrated in FABEC XMAN Project
Central Supervisory Suite Yes
HOLSTEIN Split HI/LO Yes
Revise Pre-tact Processes Yes
Traffic Management System (TMS) Levels 1-2+ On-going Delivery April 2013
Maximum configuration: 19 sectors Yes Not required due to levels of traffic in 2012
Summer 2012 performance assessment The capacity baseline was measured with ACCESS at 328. During the same period, the peak 3 hour demand was 308 and the peak 1 hour was 338. Maximum sector configurations opened were: Brussels group - 6 sectors, DECO group - 5 sectors and Hannover group - 6 sectors.
Traffic Evolution (2012 v 2011) Enroute Delay (min. per flight)
Traffic Forecast Maastricht
EDYY UAC Current
Routes Shortest Routes
Actual Traffic
All reasons
Delay without weather
ACC Target Delay
ACC Capacity Baseline
(% difference v 2011)
Year -0.1% 0.0 0.0 0.30
Capacity gap?
Summer
H: 0.1% B: -0.9% L: -2.0%
No sig. impact -0.9% 0.0 0.0 0.39 No Offered: 328 (0%)
Allocation of and Reasons for Enroute Delay
Annual NOR 2012 ANNEX I – ACC Capacity Evolution
March 2013 Annual NOR 2012 Annex I ©2013 European Organisation for the Safety of Air Navigation (EUROCONTROL)I
18
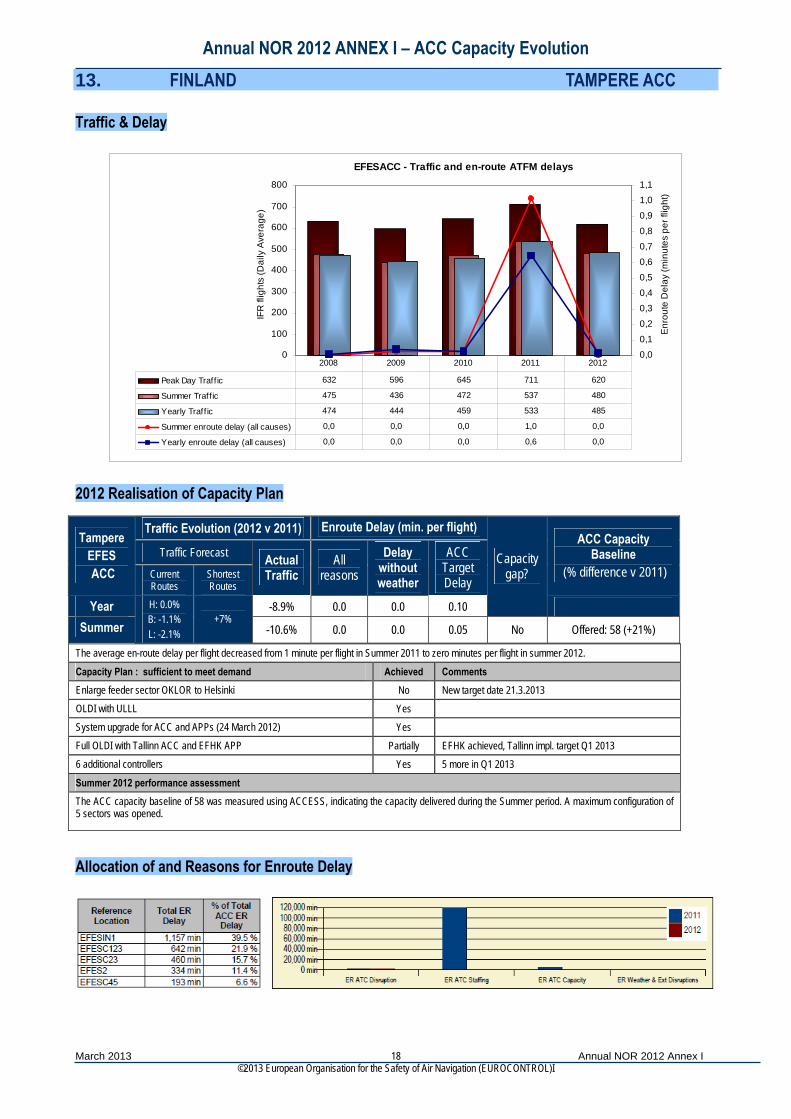
13. FINLAND TAMPERE ACC Traffic & Delay
EFESACC - Traffic and en-route ATFM delays
0
100
200
300
400
500
600
700
800
IFR
flig
hts
(Dai
ly A
vera
ge)
0,00,1
0,2
0,30,4
0,5
0,6
0,70,8
0,9
1,01,1
Enro
ute
Del
ay (m
inut
es p
er fl
ight
)
Peak Day Traff ic 632 596 645 711 620
Summer Traffic 475 436 472 537 480
Yearly Traff ic 474 444 459 533 485
Summer enroute delay (all causes) 0,0 0,0 0,0 1,0 0,0
Yearly enroute delay (all causes) 0,0 0,0 0,0 0,6 0,0
2008 2009 2010 2011 2012
2012 Realisation of Capacity Plan
The average en-route delay per flight decreased from 1 minute per flight in Summer 2011 to zero minutes per flight in summer 2012.
Capacity Plan : sufficient to meet demand Achieved Comments Enlarge feeder sector OKLOR to Helsinki No New target date 21.3.2013 OLDI with ULLL Yes System upgrade for ACC and APPs (24 March 2012) Yes Full OLDI with Tallinn ACC and EFHK APP Partially EFHK achieved, Tallinn impl. target Q1 2013 6 additional controllers Yes 5 more in Q1 2013
Summer 2012 performance assessment The ACC capacity baseline of 58 was measured using ACCESS, indicating the capacity delivered during the Summer period. A maximum configuration of 5 sectors was opened.
Traffic Evolution (2012 v 2011) Enroute Delay (min. per flight)
Traffic Forecast Tampere
EFES ACC Current
Routes Shortest Routes
Actual Traffic
All reasons
Delay without weather
ACC Target Delay
ACC Capacity Baseline
(% difference v 2011)
Year -8.9% 0.0 0.0 0.10
Capacity gap?
Summer
H: 0.0% B: -1.1% L: -2.1%
+7% -10.6% 0.0 0.0 0.05 No Offered: 58 (+21%)
Allocation of and Reasons for Enroute Delay
Annual NOR 2012 ANNEX I – ACC Capacity Evolution
March 2013 Annual NOR 2012 Annex I ©2013 European Organisation for the Safety of Air Navigation (EUROCONTROL)I
19
14. FRANCE BORDEAUX ACC Traffic & Delay
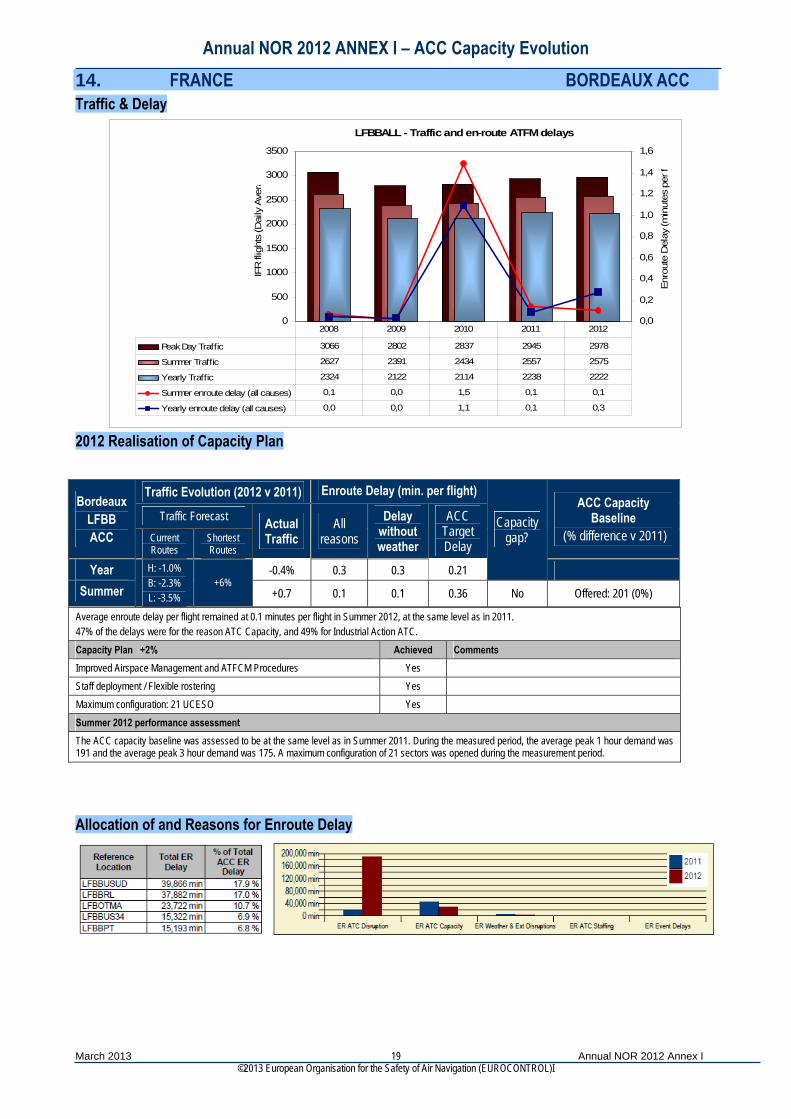
LFBBALL - Traffic and en-route ATFM delays
0
500
1000
1500
2000
2500
3000
3500
IFR
flig
hts
(Dai
ly A
ver
0,0
0,2
0,4
0,6
0,8
1,0
1,2
1,4
1,6
Enro
ute
Del
ay (m
inut
es p
er f
a
Peak Day Traffic 3066 2802 2837 2945 2978
Summer Traffic 2627 2391 2434 2557 2575
Yearly Traffic 2324 2122 2114 2238 2222
Summer enroute delay (all causes) 0,1 0,0 1,5 0,1 0,1
Yearly enroute delay (all causes) 0,0 0,0 1,1 0,1 0,3
2008 2009 2010 2011 2012
2012 Realisation of Capacity Plan
Average enroute delay per flight remained at 0.1 minutes per flight in Summer 2012, at the same level as in 2011. 47% of the delays were for the reason ATC Capacity, and 49% for Industrial Action ATC. Capacity Plan +2% Achieved Comments Improved Airspace Management and ATFCM Procedures Yes Staff deployment / Flexible rostering Yes Maximum configuration: 21 UCESO Yes Summer 2012 performance assessment The ACC capacity baseline was assessed to be at the same level as in Summer 2011. During the measured period, the average peak 1 hour demand was 191 and the average peak 3 hour demand was 175. A maximum configuration of 21 sectors was opened during the measurement period.
Traffic Evolution (2012 v 2011) Enroute Delay (min. per flight)
Traffic Forecast Bordeaux
LFBB ACC Current
Routes Shortest Routes
Actual Traffic
All reasons
Delay without weather
ACC Target Delay
ACC Capacity Baseline
(% difference v 2011)
Year -0.4% 0.3 0.3 0.21
Capacity gap?
Summer
H: -1.0% B: -2.3% L: -3.5%
+6% +0.7 0.1 0.1 0.36 No Offered: 201 (0%)
Allocation of and Reasons for Enroute Delay

Annual NOR 2012 ANNEX I – ACC Capacity Evolution
March 2013 Annual NOR 2012 Annex I ©2013 European Organisation for the Safety of Air Navigation (EUROCONTROL)I
20
15. FRANCE BREST ACC Traffic & Delay
LFRRACC - Traffic and en-route ATFM delays
0
500
1000
1500
2000
2500
3000
3500
4000
IFR
flig
hts
(Dai
ly A
vera
0,0
0,5
1,0
1,5
2,0
2,5
3,0
3,5
Enro
ute
Del
ay (m
inut
es p
er f
Peak Day Traffic 3537 3151 3165 3347 3294
Summer Traffic 2793 2541 2560 2800 2752
Yearly Traffic 2461 2249 2229 2440 2398
Summer enroute delay (all causes) 0,1 0,1 3,5 0,2 0,1
Yearly enroute delay (all causes) 0,1 0,1 2,3 0,1 0,2
2008 2009 2010 2011 2012
2012 Realisation of Capacity Plan
Average enroute delay per flight decreased from 0.2 minutes per flight during Summer 2011 to 0.1 minutes per flight in Summer 2012. 70% of the delays were for the reason ATC Capacity, 10% for Industrial Action (ATC), and 14% for ATC Staffing. Capacity Plan +2% Achieved Comments Improved airspace management and ATFM procedures Yes Staff redeployment / flexible rostering Yes Reorganisation of lower airspace and delegation of ATS to APP units below FL145 (for relevant airspace) Yes Maximum configuration: 18 UCESO Yes Summer 2012 performance assessment The ACC capacity baseline was assessed to be at the same level as in Summer 2011. During the measured period, the average peak 1 hour demand was 203 and the average peak 3 hour demand was 188. A maximum configuration of 18 sectors was opened during the measured period.
Allocation of and Reasons for Enroute Delay
Traffic Evolution (2012 v 2011) Enroute Delay (min. per flight)
Traffic Forecast Brest LFRR ACC Current
Routes Shortest Routes
Actual Traffic
All reasons
Delay without weather
ACC Target Delay
ACC Capacity Baseline
(% difference v 2011)
Year -1.5% 0.2 0.2 0.16
Capacity gap?
Summer
H: -1.2% B: -2.6% L: -3.5%
No sig. impact -1.7% 0.1 0.1 0.26 No Offered: 206 (0%)

Annual NOR 2012 ANNEX I – ACC Capacity Evolution
March 2013 Annual NOR 2012 Annex I ©2013 European Organisation for the Safety of Air Navigation (EUROCONTROL)I
21
16. FRANCE MARSEILLE ACC Traffic & Delay
LFMMACC - Traffic and en-route ATFM delays
0
500
1000
1500
2000
2500
3000
3500
4000
4500
IFR
flig
hts
(Dai
ly A
vera
0,0
0,5
1,0
1,5
2,0
2,5
3,0
3,5
4,0
4,5
Enro
ute
Del
ay (m
inut
es p
er f
Peak Day Traffic 4018 3792 3898 3928 3929
Summer Traffic 3285 3092 3162 3257 3268
Yearly Traffic 2868 2694 2732 2806 2763
Summer enroute delay (all causes) 0,2 0,1 4,4 0,8 0,5
Yearly enroute delay (all causes) 0,1 0,1 3,0 0,5 0,5
2008 2009 2010 2011 2012
2012 Realisation of Capacity Plan
Average en-route delay per flight decreased from 0.8 minutes per flight in Summer 2011 to 0.5 minutes per flight in Summer 2012. 66% of the delays were for the reason ATC Capacity, 12% for ATC Staffing, and 11% for Weather. Capacity Plan +5% Achieved Comments Improved airspace management and ATFM procedures Yes Staff redeployment / flexible rostering Yes Reorganisation of interface with LECB (LUMAS) Phase 1 Yes Reorganisation of sectors E and K Yes Reorganisation has started. Process is on going. Maximum configuration: 28 UCESO Yes Summer 2012 performance assessment The capacity baseline was evaluated to be 237 with ACCESS/Reverse CASA, based on the traffic and delay situation. During the measured period, the average peak 1 hour demand was 242 and the average peak 3 hour demand was 226. A maximum configuration of 28 sectors was opened during the measured period.
Traffic Evolution (2012 v 2011) Enroute Delay (min. per flight)
Traffic Forecast Marseille
LFMM ACC Current
Routes Shortest Routes
Actual Traffic
All reasons
Delay without weather
ACC Target Delay
ACC Capacity Baseline
(% difference v 2011)
Year -1.3% 0.5 0.5 0.17
Capacity gap?
Summer
H: -1.1% B: -2.4% L: -3.7%
No sig. impact +0.4% 0.5 0.5 0.28 Yes Offered: 237 (+2%)
Allocation of and Reasons for Enroute Delay

Annual NOR 2012 ANNEX I – ACC Capacity Evolution
March 2013 Annual NOR 2012 Annex I ©2013 European Organisation for the Safety of Air Navigation (EUROCONTROL)I
22
17. FRANCE PARIS ACC Traffic & Delay
LFFFALL - Traffic and en-route ATFM delays
0
500
1000
1500
2000
2500
3000
3500
4000
4500
IFR
flig
hts
(Dai
ly A
vera
0,00,10,20,30,40,50,60,70,80,91,01,11,2
Enro
ute
Del
ay (m
inut
es p
er f
Peak Day Traffic 4192 4032 3823 4017 4000
Summer Traffic 3628 3423 3334 3462 3429
Yearly Traffic 3449 3266 3122 3284 3227
Summer enroute delay (all causes) 0,4 0,1 1,1 0,3 0,3
Yearly enroute delay (all causes) 0,5 0,2 0,8 0,3 0,3
2008 2009 2010 2011 2012
2012 Realisation of Capacity Plan
Average enroute delay per flight remained at 0.3 minutes per flight in Summer 2012. 57% of the delays were for the reason ATC Capacity, 26% for Weather. Capacity Plan +3% Achieved Comments Improved airspace management and ATFM procedures Yes Staff redeployment / flexible rostering Yes DVR la (Nov 2011) Yes Grenelle – Change of transition altitude (Nov 2011) Yes Maximum configuration: 21 UCESO Yes Summer 2012 performance assessment The ACC capacity baseline was assessed to be at the same level as in Summer 2011 During the measured period, the average peak 1 hour demand was 261 and the average peak 3 hour demand was 235. A maximum configuration of 21 sectors was opened during the measured period.
Traffic Evolution (2012 v 2011) Enroute Delay (min. per flight)
Traffic Forecast Paris LFFF ACC Current
Routes Shortest Routes
Actual Traffic
All reasons
Delay without weather
ACC Target Delay
ACC Capacity Baseline
(% difference v 2011)
Year -1.5% 0.3 0.2 0.23
Capacity gap?
Summer
H: -0.1% B: -1.0% L: -1.8%
No sig. impact -1.0% 0.3 0.2 0.35 No Offered: 268 (0%)
Allocation of and Reasons for Enroute Delay

Annual NOR 2012 ANNEX I – ACC Capacity Evolution
March 2013 Annual NOR 2012 Annex I ©2013 European Organisation for the Safety of Air Navigation (EUROCONTROL)I
23
18. FRANCE REIMS ACC Traffic & Delay
LFEEACC - Traffic and en-route ATFM delays
0
500
1000
1500
2000
2500
3000
3500
IFR
flig
hts
(Dai
ly A
vera
0,0
0,1
0,2
0,3
0,4
0,5
0,6
0,7
0,8
0,9
1,0
Enro
ute
Del
ay (m
inut
es p
er f
Peak Day Traffic 3035 2758 2743 2795 2903
Summer Traffic 2680 2374 2372 2537 2587
Yearly Traffic 2459 2175 2142 2311 2334
Summer enroute delay (all causes) 0,8 0,1 0,4 0,4 0,4
Yearly enroute delay (all causes) 0,5 0,1 0,3 0,2 0,3
2008 2009 2010 2011 2012
2012 Realisation of Capacity Plan
Average enroute delay per flight remained at 0.4 minutes per flight in Summer 2012. 83% of the delays were for the reason ATC Capacity, 15% for Weather. Capacity Plan +3% Achieved Comments Improved airspace management and ATFM procedures Yes Staff redeployment / flexible rostering Yes Resectorisation (additional layer over KH and KE and new DFL 375 between KR/HR and between KN/HN) Yes DVR I step 1 Yes Maximum configuration: 16 UCESO Yes Summer 2012 performance assessment The ACC capacity baseline was assessed to be at the same level as in Summer 2011. During the measured period, the average peak 1 hour demand was 184 and the average peak 3 hour demand was 168. A maximum configuration of 16 sectors was opened during the measured period.
Traffic Evolution (2012 v 2011) Enroute Delay (min. per flight)
Traffic Forecast Reims LFEE ACC Current
Routes Shortest Routes
Actual Traffic
All reasons
Delay without weather
ACC Target Delay
ACC Capacity Baseline
(% difference v 2011)
Year +1.3% 0.3 0.2 0.19
Capacity gap?
Summer
H: -1.0% B: -1.9% L: -2.9%
+9% +2.0% 0.4 0.3 0.32 No Offered: 178 (0%)
Allocation of and Reasons for Enroute Delay
Annual NOR 2012 ANNEX I – ACC Capacity Evolution
March 2013 Annual NOR 2012 Annex I ©2013 European Organisation for the Safety of Air Navigation (EUROCONTROL)I
24
19. FYROM SKOPJE ACC Traffic & Delay
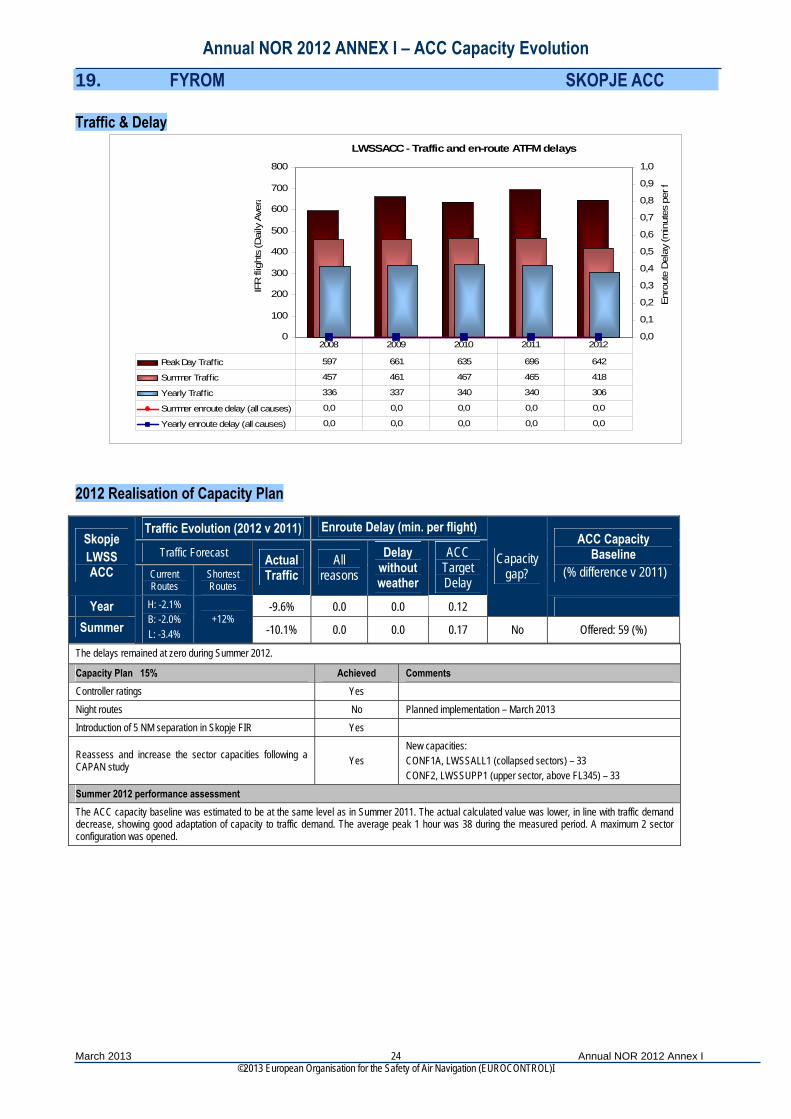
LWSSACC - Traffic and en-route ATFM delays
0
100
200
300
400
500
600
700
800
IFR
flig
hts
(Dai
ly A
ver
0,0
0,1
0,2
0,3
0,4
0,5
0,6
0,7
0,8
0,9
1,0
Enro
ute
Del
ay (m
inut
es p
er f
a
Peak Day Traffic 597 661 635 696 642
Summer Traffic 457 461 467 465 418
Yearly Traffic 336 337 340 340 306
Summer enroute delay (all causes) 0,0 0,0 0,0 0,0 0,0
Yearly enroute delay (all causes) 0,0 0,0 0,0 0,0 0,0
2008 2009 2010 2011 2012
2012 Realisation of Capacity Plan
The delays remained at zero during Summer 2012.
Capacity Plan 15% Achieved Comments Controller ratings Yes Night routes No Planned implementation – March 2013 Introduction of 5 NM separation in Skopje FIR Yes
Reassess and increase the sector capacities following a CAPAN study Yes
New capacities: CONF1A, LWSSALL1 (collapsed sectors) – 33 CONF2, LWSSUPP1 (upper sector, above FL345) – 33
Summer 2012 performance assessment The ACC capacity baseline was estimated to be at the same level as in Summer 2011. The actual calculated value was lower, in line with traffic demand decrease, showing good adaptation of capacity to traffic demand. The average peak 1 hour was 38 during the measured period. A maximum 2 sector configuration was opened.
Traffic Evolution (2012 v 2011) Enroute Delay (min. per flight)
Traffic Forecast Skopje LWSS ACC Current
Routes Shortest Routes
Actual Traffic
All reasons
Delay without weather
ACC Target Delay
ACC Capacity Baseline
(% difference v 2011)
Year -9.6% 0.0 0.0 0.12
Capacity gap?
Summer
H: -2.1% B: -2.0% L: -3.4%
+12% -10.1% 0.0 0.0 0.17 No Offered: 59 (%)
Annual NOR 2012 ANNEX I – ACC Capacity Evolution
March 2013 Annual NOR 2012 Annex I ©2013 European Organisation for the Safety of Air Navigation (EUROCONTROL)I
25
20. GEORGIA TBILISI ACC Traffic & Delay
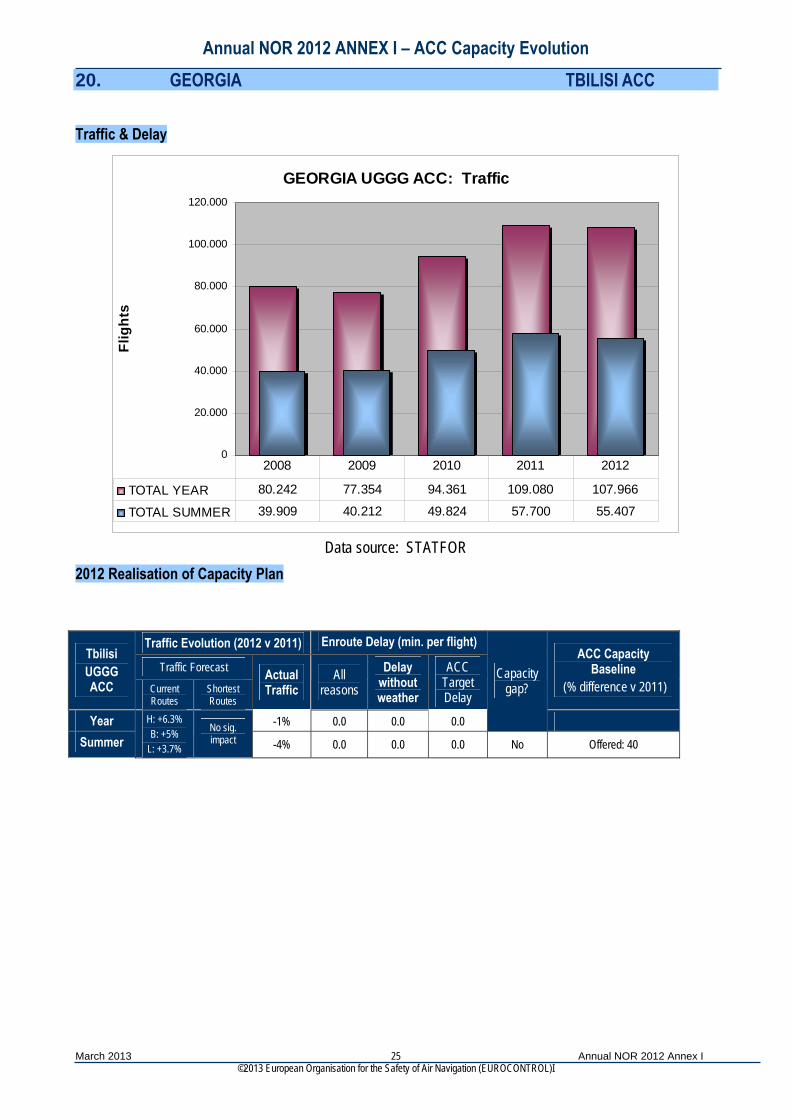
GEORGIA UGGG ACC: Traffic
0
20.000
40.000
60.000
80.000
100.000
120.000
Flig
hts
TOTAL YEAR 80.242 77.354 94.361 109.080 107.966
TOTAL SUMMER 39.909 40.212 49.824 57.700 55.407
2008 2009 2010 2011 2012
Data source: STATFOR
2012 Realisation of Capacity Plan
Traffic Evolution (2012 v 2011) Enroute Delay (min. per flight)
Traffic Forecast Tbilisi UGGG ACC Current
Routes Shortest Routes
Actual Traffic
All reasons
Delay without weather
ACC Target Delay
ACC Capacity Baseline
(% difference v 2011)
Year -1% 0.0 0.0 0.0
Capacity gap?
Summer
H: +6.3% B: +5%
L: +3.7%
No sig. impact -4% 0.0 0.0 0.0 No Offered: 40
Annual NOR 2012 ANNEX I – ACC Capacity Evolution
March 2013 Annual NOR 2012 Annex I ©2013 European Organisation for the Safety of Air Navigation (EUROCONTROL)I
26
21. GERMANY BREMEN ACC Traffic & Delay
EDWWACC - Traffic and en-route ATFM delays
0
500
1000
1500
2000
2500
IFR
flig
hts
(Dai
ly A
vera
0,0
0,1
0,2
0,3
0,4
0,5
0,6
0,7
0,8
0,9
1,0
Enr
oute
Del
ay (m
inut
es p
er f
Peak Day Traffic 2369 2087 2251 2228 2239
Summer Traffic 1900 1732 1836 1830 1826
Yearly Traffic 1762 1623 1661 1709 1674
Summer enroute delay (all causes) 0,2 0,3 0,4 0,2 0,1
Yearly enroute delay (all causes) 0,2 0,3 0,3 0,2 0,1
2008 2009 2010 2011 2012
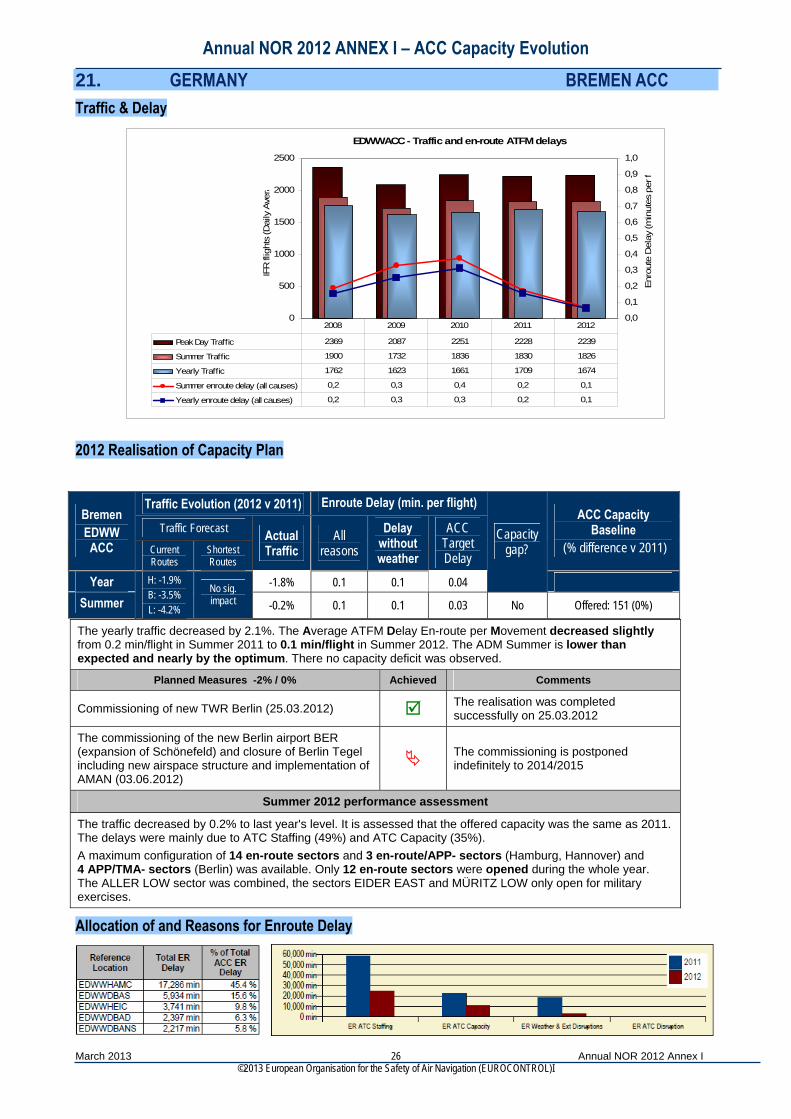
2012 Realisation of Capacity Plan
The yearly traffic decreased by 2.1%. The Average ATFM Delay En-route per Movement decreased slightly from 0.2 min/flight in Summer 2011 to 0.1 min/flight in Summer 2012. The ADM Summer is lower than expected and nearly by the optimum. There no capacity deficit was observed.
Planned Measures -2% / 0% Achieved Comments
Commissioning of new TWR Berlin (25.03.2012) The realisation was completed successfully on 25.03.2012
The commissioning of the new Berlin airport BER (expansion of Schönefeld) and closure of Berlin Tegel including new airspace structure and implementation of AMAN (03.06.2012)
The commissioning is postponed indefinitely to 2014/2015
Summer 2012 performance assessment
The traffic decreased by 0.2% to last year's level. It is assessed that the offered capacity was the same as 2011. The delays were mainly due to ATC Staffing (49%) and ATC Capacity (35%). A maximum configuration of 14 en-route sectors and 3 en-route/APP- sectors (Hamburg, Hannover) and 4 APP/TMA- sectors (Berlin) was available. Only 12 en-route sectors were opened during the whole year. The ALLER LOW sector was combined, the sectors EIDER EAST and MÜRITZ LOW only open for military exercises.
Traffic Evolution (2012 v 2011) Enroute Delay (min. per flight)
Traffic Forecast Bremen EDWW ACC Current
Routes Shortest Routes
Actual Traffic
All reasons
Delay without weather
ACC Target Delay
ACC Capacity Baseline
(% difference v 2011)
Year -1.8% 0.1 0.1 0.04
Capacity gap?
Summer
H: -1.9% B: -3.5% L: -4.2%
No sig. impact -0.2% 0.1 0.1 0.03 No Offered: 151 (0%)
Allocation of and Reasons for Enroute Delay
Annual NOR 2012 ANNEX I – ACC Capacity Evolution
March 2013 Annual NOR 2012 Annex I ©2013 European Organisation for the Safety of Air Navigation (EUROCONTROL)I
27
22. GERMANY KARLSRUHE ACC Traffic & Delay
EDUUUAC - Traffic and en-route ATFM delays
0
1000
2000
3000
4000
5000
6000
IFR
flig
hts
(Dai
ly A
vera
0,0
0,2
0,4
0,6
0,8
1,0
1,2
1,4
1,6
1,8
Enro
ute
Del
ay (m
inut
es p
er f
Peak Day Traffic 4867 4601 4703 4795 4748
Summer Traffic 4413 4124 4233 4305 4345
Yearly Traffic 4015 3747 3743 3871 3905
Summer enroute delay (all causes) 1,3 0,9 1,7 0,5 0,1
Yearly enroute delay (all causes) 0,9 0,6 1,4 0,5 0,1
2008 2009 2010 2011 2012
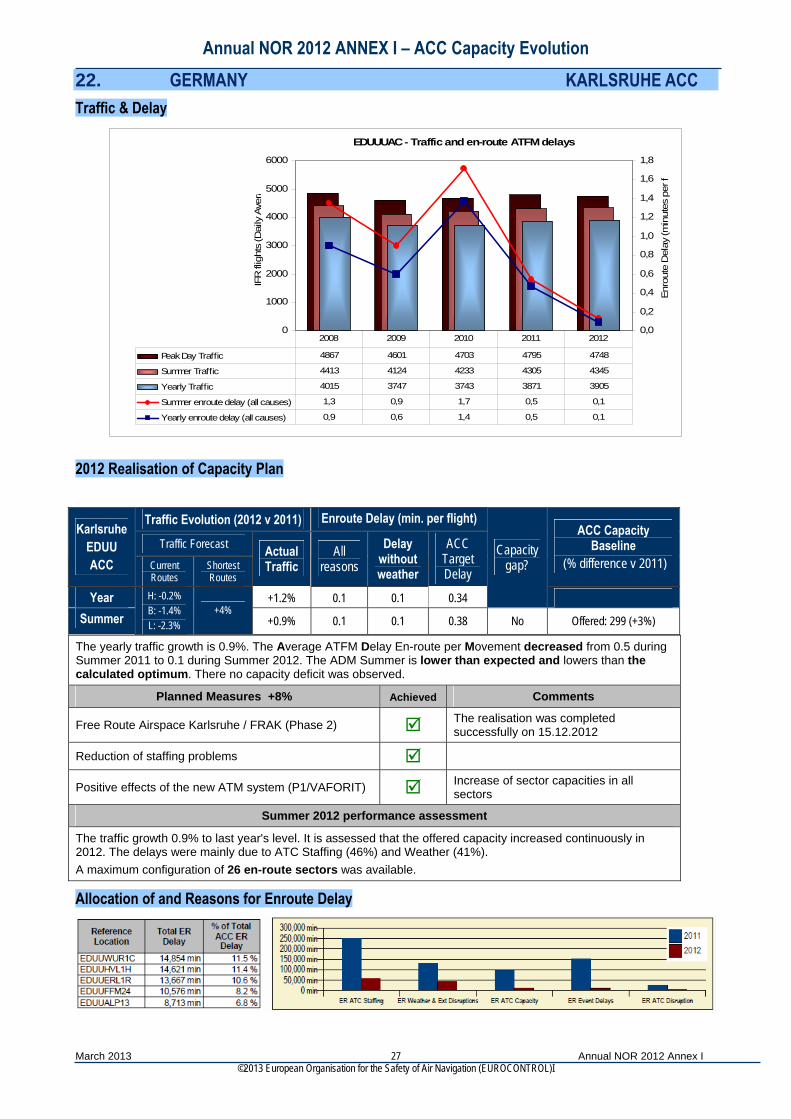
2012 Realisation of Capacity Plan
The yearly traffic growth is 0.9%. The Average ATFM Delay En-route per Movement decreased from 0.5 during Summer 2011 to 0.1 during Summer 2012. The ADM Summer is lower than expected and lowers than the calculated optimum. There no capacity deficit was observed.
Planned Measures +8% Achieved Comments
Free Route Airspace Karlsruhe / FRAK (Phase 2) The realisation was completed successfully on 15.12.2012
Reduction of staffing problems
Positive effects of the new ATM system (P1/VAFORIT) Increase of sector capacities in all sectors
Summer 2012 performance assessment
The traffic growth 0.9% to last year's level. It is assessed that the offered capacity increased continuously in 2012. The delays were mainly due to ATC Staffing (46%) and Weather (41%). A maximum configuration of 26 en-route sectors was available.
Traffic Evolution (2012 v 2011) Enroute Delay (min. per flight)
Traffic Forecast Karlsruhe
EDUU ACC Current
Routes Shortest Routes
Actual Traffic
All reasons
Delay without weather
ACC Target Delay
ACC Capacity Baseline
(% difference v 2011)
Year +1.2% 0.1 0.1 0.34
Capacity gap?
Summer
H: -0.2% B: -1.4% L: -2.3%
+4% +0.9% 0.1 0.1 0.38 No Offered: 299 (+3%)
Allocation of and Reasons for Enroute Delay

Annual NOR 2012 ANNEX I – ACC Capacity Evolution
March 2013 Annual NOR 2012 Annex I ©2013 European Organisation for the Safety of Air Navigation (EUROCONTROL)I
28
23. GERMANY LANGEN ACC Traffic & Delay
EDGGACC - Traffic and en-route ATFM delays
0
500
1000
1500
2000
2500
3000
3500
4000
4500
5000
IFR
flig
hts
(Dai
ly A
vera
0,0
0,2
0,4
0,6
0,8
1,0
1,2
1,4
Enro
ute
Del
ay (m
inut
es p
er f
Peak Day Traffic 4425 4055 4271 4138 4190
Summer Traffic 3811 3560 3699 3654 3688
Yearly Traffic 3578 3364 3382 3434 3377
Summer enroute delay (all causes) 0,5 0,9 1,2 1,4 0,9
Yearly enroute delay (all causes) 0,3 0,6 1,1 1,0 0,6
2008 2009 2010 2011 2012
2012 Realisation of Capacity Plan
The yearly traffic decreased by 1.7%. The Average ATFM Delay En-route per Movement decreased from 1.4 min/flight in Summer 2011 to 0.9 min/flight in Summer 2012. The capacity gap is caused by the staff shortages.
Planned Measures -2% / +2% Achieved Comments
Additional overflow sector in the Dusseldorf APP is planned Postponed after 2016
Summer 2012 performance assessment
The traffic growth 0.9% to last year's level. It is assessed that the offered capacity increased continuously in 2012. The delays were mainly due to ATC Staffing (39%), ATC Capacity (38%) and Weather (22%). A maximum configuration of 23 en-route sectors (including 3 sectors with predominantly military traffic) and 2 en-route/APP- sectors (Stuttgart) and 10 APP/TMA- sectors (Düsseldorf, Frankfurt, Cologne/Bonn) were opened. Due to staffing issues reduced configurations were operated.
Traffic Evolution (2012 v 2011) Enroute Delay (min. per flight)
Traffic Forecast Langen EDGG ACC Current
Routes Shortest Routes
Actual Traffic
All reasons
Delay without weather
ACC Target Delay
ACC Capacity Baseline
(% difference v 2011)
Year -1.4% 0.6 0.5 0.23
Capacity gap?
Summer
H: -1.5% B: -2.9% L: -3.6%
No sig. impact +0.9% 0.9 0.7 0.31 Yes Offered: 244 (+3%)
Allocation of and Reasons for Enroute Delay
Annual NOR 2012 ANNEX I – ACC Capacity Evolution
March 2013 Annual NOR 2012 Annex I ©2013 European Organisation for the Safety of Air Navigation (EUROCONTROL)I
29
24. GERMANY MUNICH ACC Traffic & Delay
EDMMACC - Traffic and en-route ATFM delays
0
1000
2000
3000
4000
5000
6000
IFR
flig
hts
(Dai
ly A
vera
ge)
0.0
0.1
0.2
0.3
0.4
0.5
0.6
0.7
0.8
0.9
1.0
Enr
oute
Del
ay (m
inut
es p
er fl
ight
)
Peak Day Traff ic 4914 4601 4912 5012 4798
Summer Traffic 4440 4115 4468 4504 4390
Yearly Traff ic 4022 3781 3979 4080 3911
Summer enroute delay (all causes) 0.3 0.2 0.3 0.5 0.5
Yearly enroute delay (all causes) 0.2 0.2 0.2 0.3 0.3
2008 2009 2010 2011 2012
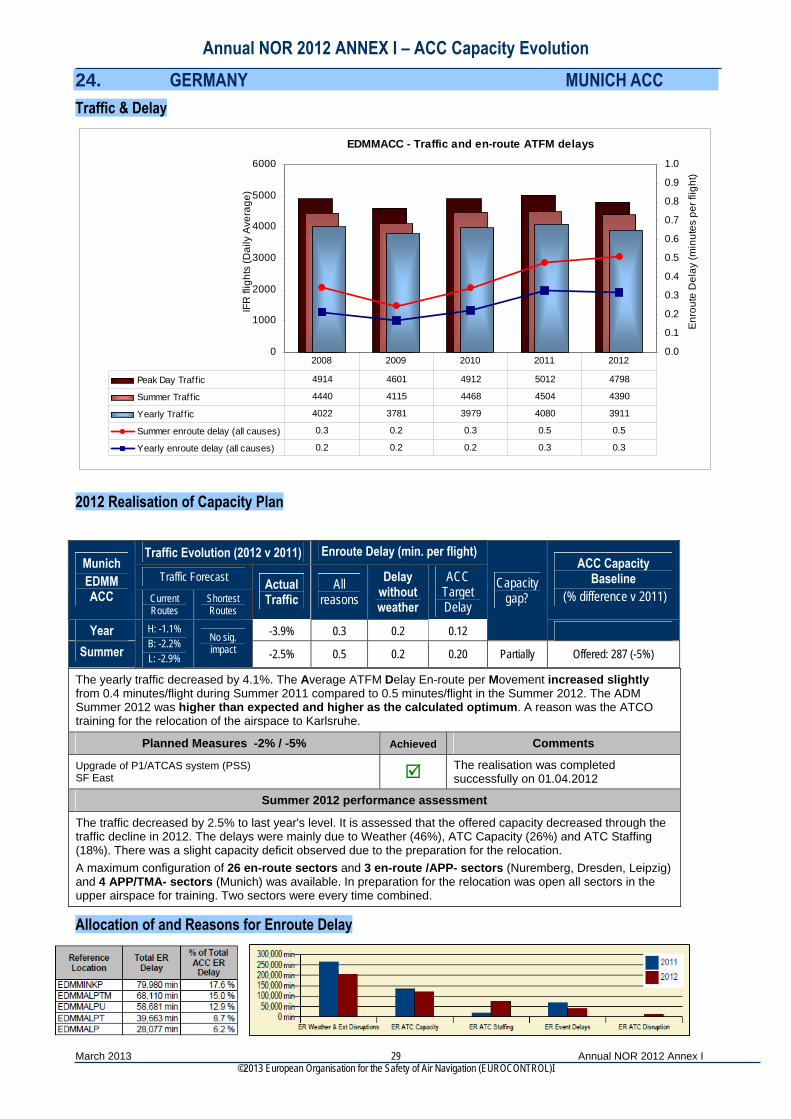
2012 Realisation of Capacity Plan
The yearly traffic decreased by 4.1%. The Average ATFM Delay En-route per Movement increased slightly from 0.4 minutes/flight during Summer 2011 compared to 0.5 minutes/flight in the Summer 2012. The ADM Summer 2012 was higher than expected and higher as the calculated optimum. A reason was the ATCO training for the relocation of the airspace to Karlsruhe.
Planned Measures -2% / -5% Achieved Comments
Upgrade of P1/ATCAS system (PSS) SF East The realisation was completed
successfully on 01.04.2012
Summer 2012 performance assessment
The traffic decreased by 2.5% to last year's level. It is assessed that the offered capacity decreased through the traffic decline in 2012. The delays were mainly due to Weather (46%), ATC Capacity (26%) and ATC Staffing (18%). There was a slight capacity deficit observed due to the preparation for the relocation. A maximum configuration of 26 en-route sectors and 3 en-route /APP- sectors (Nuremberg, Dresden, Leipzig) and 4 APP/TMA- sectors (Munich) was available. In preparation for the relocation was open all sectors in the upper airspace for training. Two sectors were every time combined.
Traffic Evolution (2012 v 2011) Enroute Delay (min. per flight)
Traffic Forecast Munich EDMM ACC Current
Routes Shortest Routes
Actual Traffic
All reasons
Delay without weather
ACC Target Delay
ACC Capacity Baseline
(% difference v 2011)
Year -3.9% 0.3 0.2 0.12
Capacity gap?
Summer
H: -1.1% B: -2.2% L: -2.9%
No sig. impact -2.5% 0.5 0.2 0.20 Partially Offered: 287 (-5%)
Allocation of and Reasons for Enroute Delay
Annual NOR 2012 ANNEX I – ACC Capacity Evolution
March 2013 Annual NOR 2012 Annex I ©2013 European Organisation for the Safety of Air Navigation (EUROCONTROL)I
30
25. GREECE ATHENS ACC Traffic & Delay
LGGGACC - Traffic and en-route ATFM delays
0
500
1000
1500
2000
2500
IFR
flig
hts
(Dai
ly A
vera
ge)
0,0
0,51,0
1,5
2,0
2,5
3,0
3,5
4,0
4,5
5,0
5,5
Enro
ute
Del
ay (m
inut
es p
er fl
ight
)
Peak Day Traffic 2087 1997 2117 2211 2197
Summer Traff ic 1515 1460 1513 1555 1521
Yearly Traffic 1201 1169 1212 1230 1195
Summer enroute delay (all causes) 2,3 1,8 1,8 5,2 0,3
Yearly enroute delay (all causes) 1,4 1,2 1,1 3,3 0,2
2008 2009 2010 2011 2012
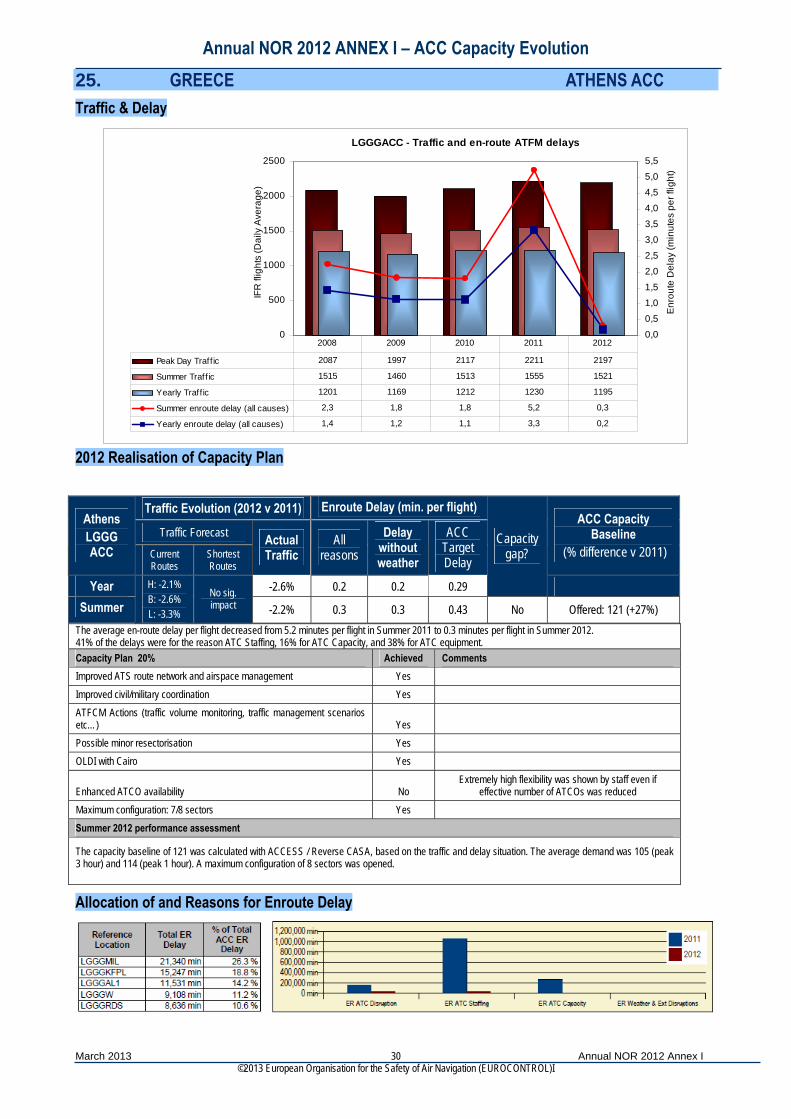
2012 Realisation of Capacity Plan
The average en-route delay per flight decreased from 5.2 minutes per flight in Summer 2011 to 0.3 minutes per flight in Summer 2012. 41% of the delays were for the reason ATC Staffing, 16% for ATC Capacity, and 38% for ATC equipment. Capacity Plan 20% Achieved Comments Improved ATS route network and airspace management Yes Improved civil/military coordination Yes ATFCM Actions (traffic volume monitoring, traffic management scenarios etc…) Yes Possible minor resectorisation Yes OLDI with Cairo Yes
Enhanced ATCO availability No Extremely high flexibility was shown by staff even if
effective number of ATCOs was reduced Maximum configuration: 7/8 sectors Yes Summer 2012 performance assessment
The capacity baseline of 121 was calculated with ACCESS / Reverse CASA, based on the traffic and delay situation. The average demand was 105 (peak 3 hour) and 114 (peak 1 hour). A maximum configuration of 8 sectors was opened.
Traffic Evolution (2012 v 2011) Enroute Delay (min. per flight)
Traffic Forecast Athens LGGG ACC Current
Routes Shortest Routes
Actual Traffic
All reasons
Delay without weather
ACC Target Delay
ACC Capacity Baseline
(% difference v 2011)
Year -2.6% 0.2 0.2 0.29
Capacity gap?
Summer
H: -2.1% B: -2.6% L: -3.3%
No sig. impact -2.2% 0.3 0.3 0.43 No Offered: 121 (+27%)
Allocation of and Reasons for Enroute Delay
Annual NOR 2012 ANNEX I – ACC Capacity Evolution
March 2013 Annual NOR 2012 Annex I ©2013 European Organisation for the Safety of Air Navigation (EUROCONTROL)I
31
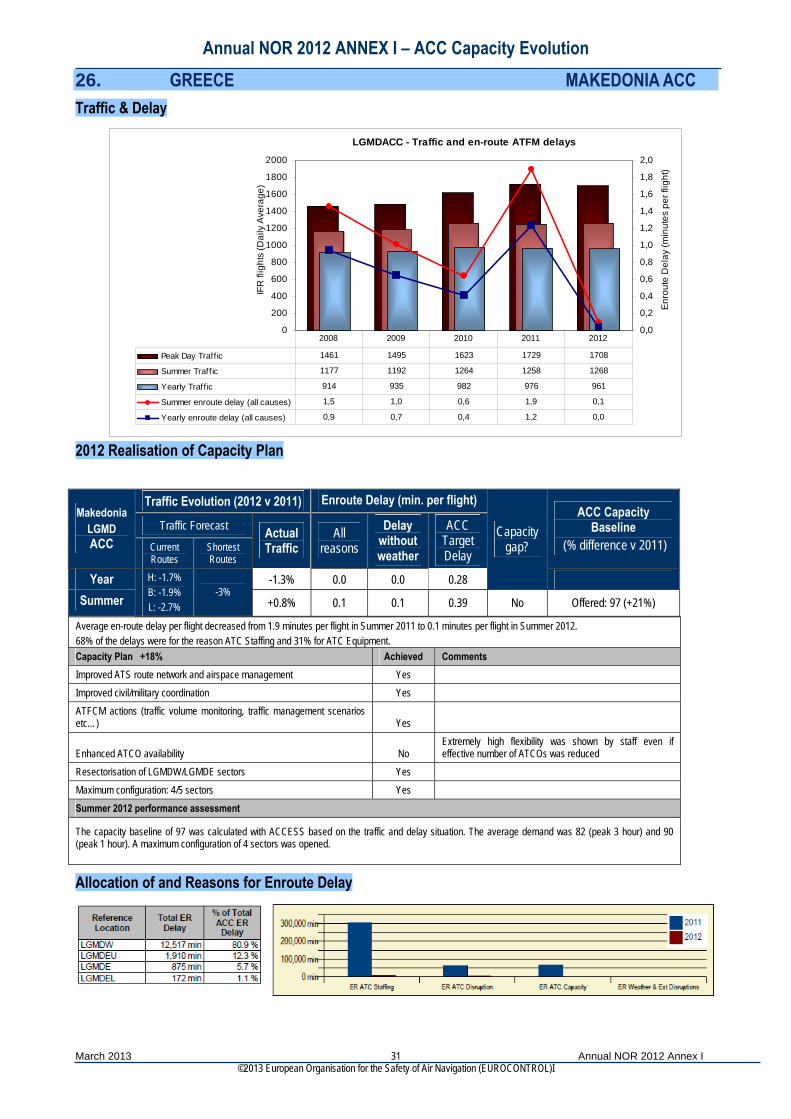
26. GREECE MAKEDONIA ACC Traffic & Delay
LGMDACC - Traffic and en-route ATFM delays
0
200
400
600
800
1000
1200
1400
1600
1800
2000
IFR
flig
hts
(Dai
ly A
vera
ge)
0,0
0,2
0,4
0,6
0,8
1,0
1,2
1,4
1,6
1,8
2,0
Enro
ute
Del
ay (m
inut
es p
er fl
ight
)
Peak Day Traffic 1461 1495 1623 1729 1708
Summer Traff ic 1177 1192 1264 1258 1268
Yearly Traff ic 914 935 982 976 961
Summer enroute delay (all causes) 1,5 1,0 0,6 1,9 0,1
Yearly enroute delay (all causes) 0,9 0,7 0,4 1,2 0,0
2008 2009 2010 2011 2012
2012 Realisation of Capacity Plan
Average en-route delay per flight decreased from 1.9 minutes per flight in Summer 2011 to 0.1 minutes per flight in Summer 2012. 68% of the delays were for the reason ATC Staffing and 31% for ATC Equipment. Capacity Plan +18% Achieved Comments Improved ATS route network and airspace management Yes Improved civil/military coordination Yes ATFCM actions (traffic volume monitoring, traffic management scenarios etc…) Yes
Enhanced ATCO availability No Extremely high flexibility was shown by staff even if effective number of ATCOs was reduced
Resectorisation of LGMDW/LGMDE sectors Yes Maximum configuration: 4/5 sectors Yes Summer 2012 performance assessment
The capacity baseline of 97 was calculated with ACCESS based on the traffic and delay situation. The average demand was 82 (peak 3 hour) and 90 (peak 1 hour). A maximum configuration of 4 sectors was opened.
Traffic Evolution (2012 v 2011) Enroute Delay (min. per flight)
Traffic Forecast Makedonia
LGMD ACC Current
Routes Shortest Routes
Actual Traffic
All reasons
Delay without weather
ACC Target Delay
ACC Capacity Baseline
(% difference v 2011)
Year -1.3% 0.0 0.0 0.28
Capacity gap?
Summer
H: -1.7% B: -1.9% L: -2.7%
-3% +0.8% 0.1 0.1 0.39 No Offered: 97 (+21%)
Allocation of and Reasons for Enroute Delay
Annual NOR 2012 ANNEX I – ACC Capacity Evolution
March 2013 Annual NOR 2012 Annex I ©2013 European Organisation for the Safety of Air Navigation (EUROCONTROL)I
32
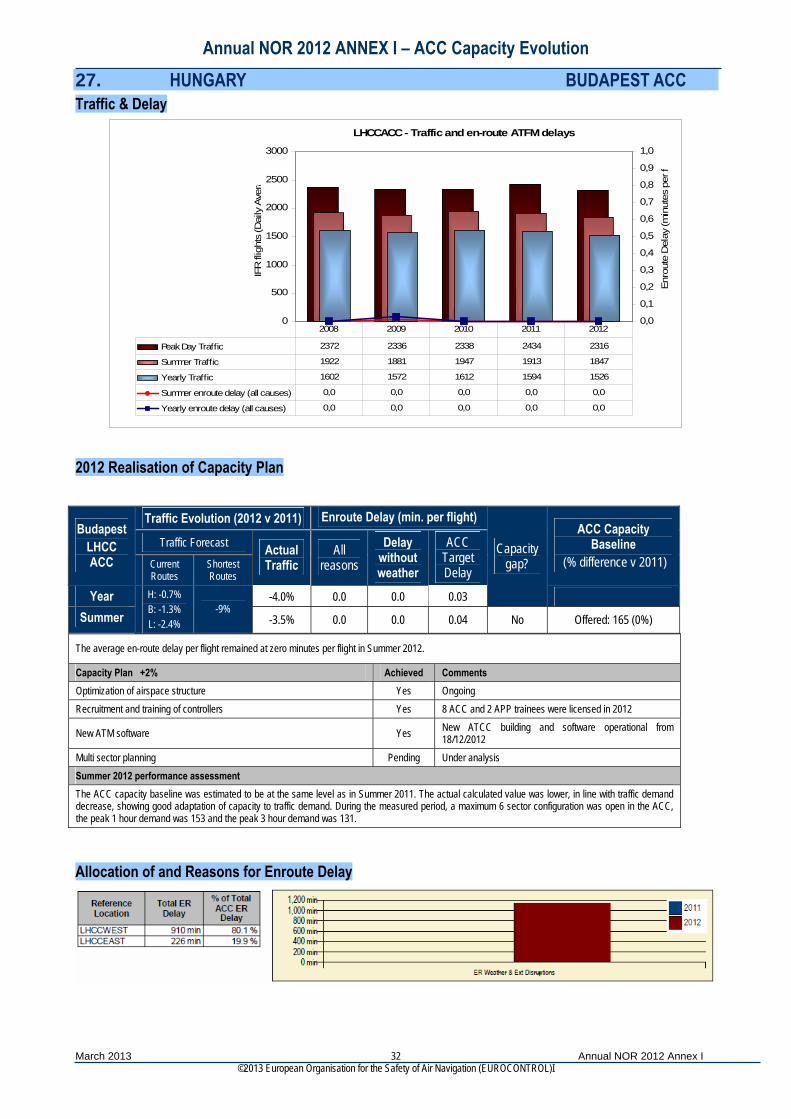
27. HUNGARY BUDAPEST ACC Traffic & Delay
LHCCACC - Traffic and en-route ATFM delays
0
500
1000
1500
2000
2500
3000
IFR
flig
hts
(Dai
ly A
ver
0,0
0,1
0,2
0,3
0,4
0,5
0,6
0,7
0,8
0,9
1,0
Enro
ute
Del
ay (m
inut
es p
er f
a
Peak Day Traffic 2372 2336 2338 2434 2316
Summer Traffic 1922 1881 1947 1913 1847
Yearly Traffic 1602 1572 1612 1594 1526
Summer enroute delay (all causes) 0,0 0,0 0,0 0,0 0,0
Yearly enroute delay (all causes) 0,0 0,0 0,0 0,0 0,0
2008 2009 2010 2011 2012
2012 Realisation of Capacity Plan
The average en-route delay per flight remained at zero minutes per flight in Summer 2012.
Capacity Plan +2% Achieved Comments Optimization of airspace structure Yes Ongoing Recruitment and training of controllers Yes 8 ACC and 2 APP trainees were licensed in 2012
New ATM software Yes New ATCC building and software operational from 18/12/2012
Multi sector planning Pending Under analysis Summer 2012 performance assessment The ACC capacity baseline was estimated to be at the same level as in Summer 2011. The actual calculated value was lower, in line with traffic demand decrease, showing good adaptation of capacity to traffic demand. During the measured period, a maximum 6 sector configuration was open in the ACC, the peak 1 hour demand was 153 and the peak 3 hour demand was 131.
Traffic Evolution (2012 v 2011) Enroute Delay (min. per flight)
Traffic Forecast Budapest
LHCC ACC Current
Routes Shortest Routes
Actual Traffic
All reasons
Delay without weather
ACC Target Delay
ACC Capacity Baseline
(% difference v 2011)
Year -4.0% 0.0 0.0 0.03
Capacity gap?
Summer
H: -0.7% B: -1.3% L: -2.4%
-9% -3.5% 0.0 0.0 0.04 No Offered: 165 (0%)
Allocation of and Reasons for Enroute Delay
Annual NOR 2012 ANNEX I – ACC Capacity Evolution
March 2013 Annual NOR 2012 Annex I ©2013 European Organisation for the Safety of Air Navigation (EUROCONTROL)I
33
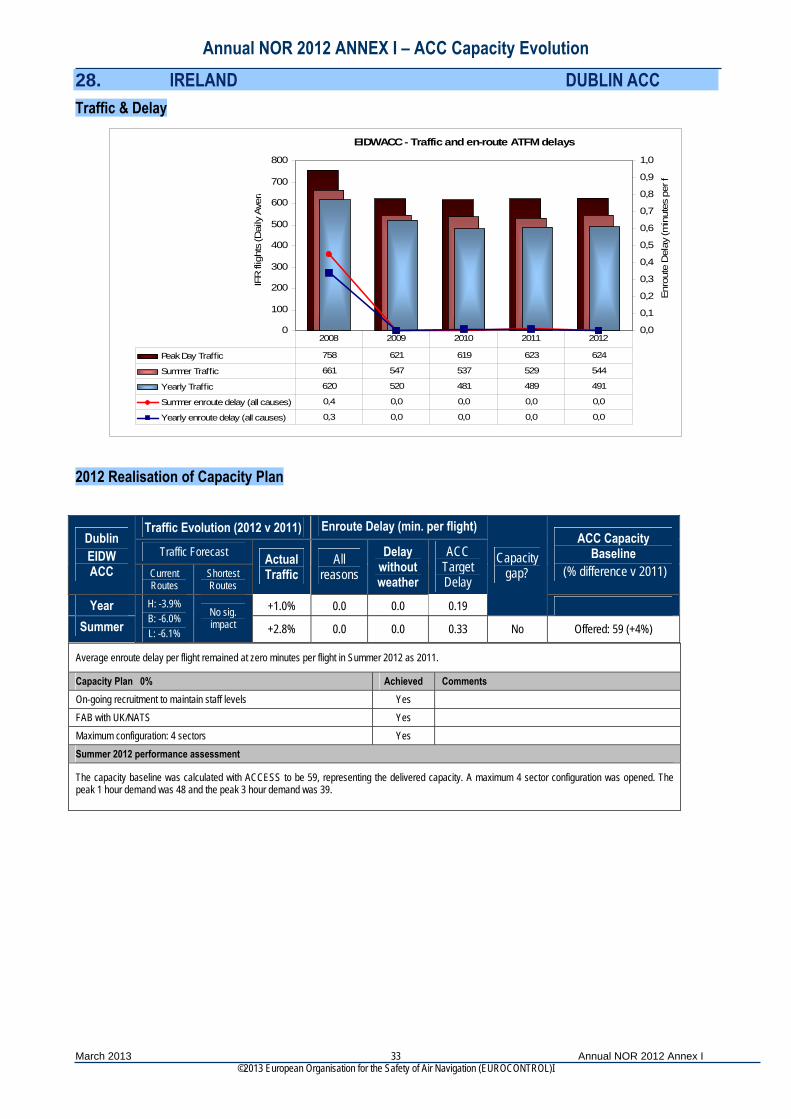
28. IRELAND DUBLIN ACC Traffic & Delay
EIDWACC - Traffic and en-route ATFM delays
0
100
200
300
400
500
600
700
800
IFR
flig
hts
(Dai
ly A
vera
0,0
0,1
0,2
0,3
0,4
0,5
0,6
0,7
0,8
0,9
1,0
Enro
ute
Del
ay (m
inut
es p
er f
Peak Day Traffic 758 621 619 623 624
Summer Traffic 661 547 537 529 544
Yearly Traffic 620 520 481 489 491
Summer enroute delay (all causes) 0,4 0,0 0,0 0,0 0,0
Yearly enroute delay (all causes) 0,3 0,0 0,0 0,0 0,0
2008 2009 2010 2011 2012
2012 Realisation of Capacity Plan
Average enroute delay per flight remained at zero minutes per flight in Summer 2012 as 2011.
Capacity Plan 0% Achieved Comments On-going recruitment to maintain staff levels Yes FAB with UK/NATS Yes Maximum configuration: 4 sectors Yes Summer 2012 performance assessment
The capacity baseline was calculated with ACCESS to be 59, representing the delivered capacity. A maximum 4 sector configuration was opened. The peak 1 hour demand was 48 and the peak 3 hour demand was 39.
Traffic Evolution (2012 v 2011) Enroute Delay (min. per flight)
Traffic Forecast Dublin EIDW ACC Current
Routes Shortest Routes
Actual Traffic
All reasons
Delay without weather
ACC Target Delay
ACC Capacity Baseline
(% difference v 2011)
Year +1.0% 0.0 0.0 0.19
Capacity gap?
Summer
H: -3.9% B: -6.0% L: -6.1%
No sig. impact +2.8% 0.0 0.0 0.33 No Offered: 59 (+4%)
Annual NOR 2012 ANNEX I – ACC Capacity Evolution
March 2013 Annual NOR 2012 Annex I ©2013 European Organisation for the Safety of Air Navigation (EUROCONTROL)I
34
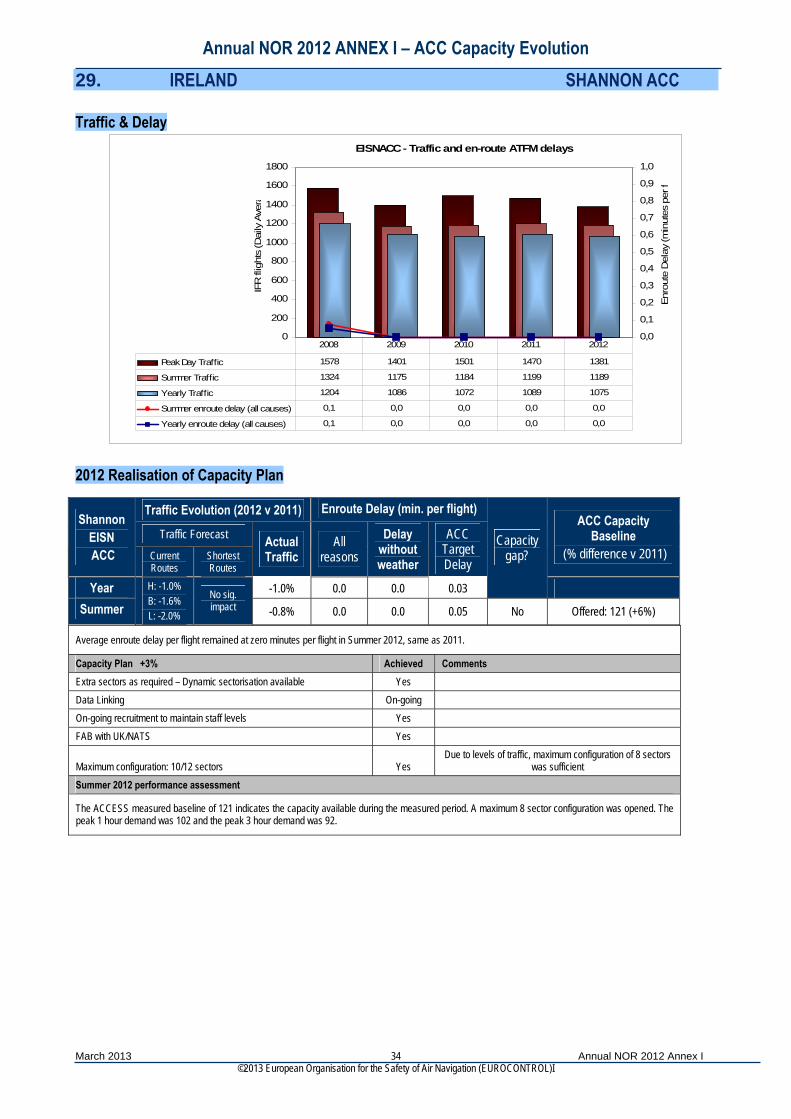
29. IRELAND SHANNON ACC Traffic & Delay
EISNACC - Traffic and en-route ATFM delays
0
200
400
600
800
1000
1200
1400
1600
1800
IFR
flig
hts
(Dai
ly A
ver
0,0
0,1
0,2
0,3
0,4
0,5
0,6
0,7
0,8
0,9
1,0
Enro
ute
Del
ay (m
inut
es p
er f
a
Peak Day Traffic 1578 1401 1501 1470 1381
Summer Traffic 1324 1175 1184 1199 1189
Yearly Traffic 1204 1086 1072 1089 1075
Summer enroute delay (all causes) 0,1 0,0 0,0 0,0 0,0
Yearly enroute delay (all causes) 0,1 0,0 0,0 0,0 0,0
2008 2009 2010 2011 2012
2012 Realisation of Capacity Plan
Enroute Delay (min. per flight) Traffic Evolution (2012 v 2011)
Average enroute delay per flight remained at zero minutes per flight in Summer 2012, same as 2011.
Capacity Plan +3% Achieved Comments Extra sectors as required – Dynamic sectorisation available Yes Data Linking On-going On-going recruitment to maintain staff levels Yes FAB with UK/NATS Yes
Maximum configuration: 10/12 sectors Yes Due to levels of traffic, maximum configuration of 8 sectors
was sufficient Summer 2012 performance assessment
The ACCESS measured baseline of 121 indicates the capacity available during the measured period. A maximum 8 sector configuration was opened. The peak 1 hour demand was 102 and the peak 3 hour demand was 92.
Traffic Forecast Shannon
EISN ACC Current
Routes Shortest Routes
Actual Traffic
All reasons
Delay without weather
ACC Target Delay
ACC Capacity Baseline
(% difference v 2011)
Year -1.0% 0.0 0.0 0.03
Capacity gap?
Summer
H: -1.0% B: -1.6% L: -2.0%
No sig. impact -0.8% 0.0 0.0 0.05 No Offered: 121 (+6%)
Annual NOR 2012 ANNEX I – ACC Capacity Evolution
March 2013 Annual NOR 2012 Annex I ©2013 European Organisation for the Safety of Air Navigation (EUROCONTROL)I
35
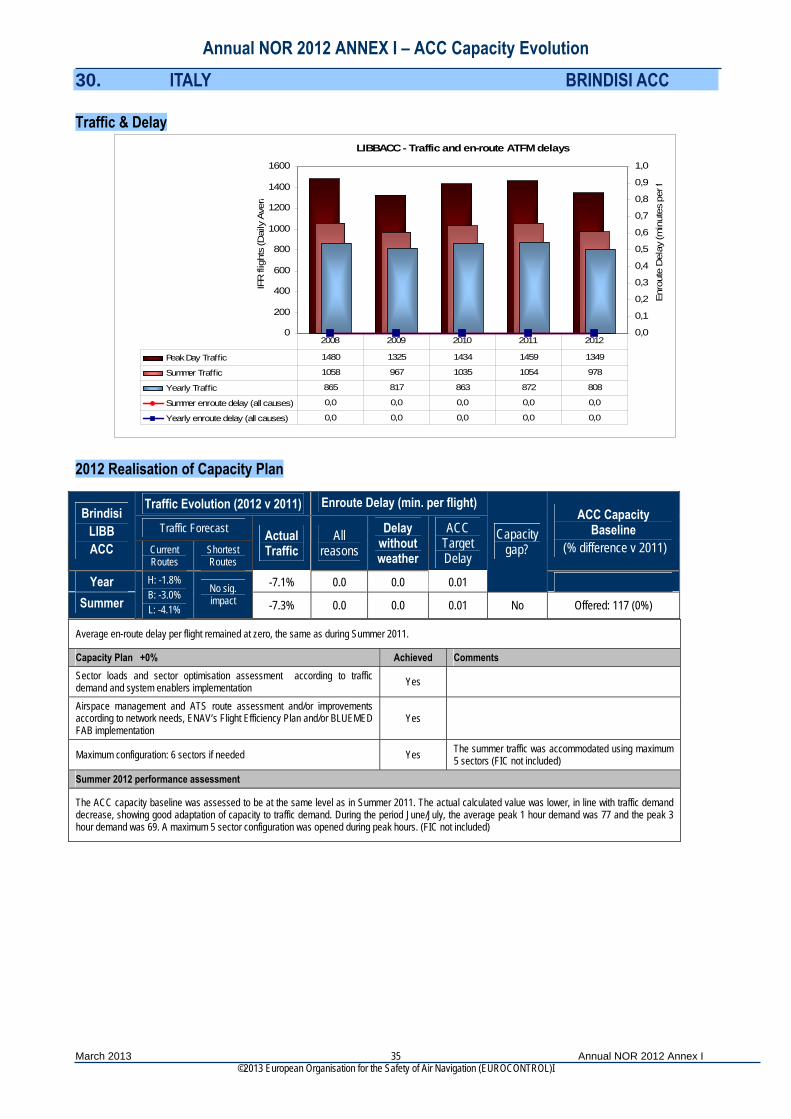
30. ITALY BRINDISI ACC Traffic & Delay
LIBBACC - Traffic and en-route ATFM delays
0
200
400
600
800
1000
1200
1400
1600
IFR
flig
hts
(Dai
ly A
ver
0,0
0,1
0,2
0,3
0,4
0,5
0,6
0,7
0,8
0,9
1,0
Enr
oute
Del
ay (m
inut
es p
er f
a
Peak Day Traffic 1480 1325 1434 1459 1349
Summer Traffic 1058 967 1035 1054 978
Yearly Traffic 865 817 863 872 808
Summer enroute delay (all causes) 0,0 0,0 0,0 0,0 0,0
Yearly enroute delay (all causes) 0,0 0,0 0,0 0,0 0,0
2008 2009 2010 2011 2012
2012 Realisation of Capacity Plan
Average en-route delay per flight remained at zero, the same as during Summer 2011.
Capacity Plan +0% Achieved Comments Sector loads and sector optimisation assessment according to traffic demand and system enablers implementation Yes
Airspace management and ATS route assessment and/or improvements according to network needs, ENAV’s Flight Efficiency Plan and/or BLUEMED FAB implementation
Yes
Maximum configuration: 6 sectors if needed Yes The summer traffic was accommodated using maximum 5 sectors (FIC not included)
Summer 2012 performance assessment
The ACC capacity baseline was assessed to be at the same level as in Summer 2011. The actual calculated value was lower, in line with traffic demand decrease, showing good adaptation of capacity to traffic demand. During the period June/July, the average peak 1 hour demand was 77 and the peak 3 hour demand was 69. A maximum 5 sector configuration was opened during peak hours. (FIC not included)
Traffic Evolution (2012 v 2011) Enroute Delay (min. per flight)
Traffic Forecast Brindisi
LIBB ACC Current
Routes Shortest Routes
Actual Traffic
All reasons
Delay without weather
ACC Target Delay
ACC Capacity Baseline
(% difference v 2011)
Year -7.1% 0.0 0.0 0.01
Capacity gap?
Summer
H: -1.8% B: -3.0% L: -4.1%
No sig. impact -7.3% 0.0 0.0 0.01 No Offered: 117 (0%)

Annual NOR 2012 ANNEX I – ACC Capacity Evolution
March 2013 Annual NOR 2012 Annex I ©2013 European Organisation for the Safety of Air Navigation (EUROCONTROL)I
36
31. ITALY MILAN ACC Traffic & Delay
LIMMACC - Traffic and en-route ATFM delays
0
500
1000
1500
2000
2500
IFR
flig
hts
(Dai
ly A
ver
0,0
0,1
0,2
0,3
0,4
0,5
0,6
0,7
0,8
0,9
1,0
Enro
ute
Del
ay (m
inut
es p
er f
a
Peak Day Traffic 2306 2096 2153 2198 2165
Summer Traffic 1923 1808 1888 1893 1853
Yearly Traffic 1783 1664 1701 1719 1659
Summer enroute delay (all causes) 0,0 0,0 0,0 0,0 0,0
Yearly enroute delay (all causes) 0,0 0,0 0,0 0,0 0,0
2008 2009 2010 2011 2012
2012 Realisation of Capacity Plan
Average en-route delay per flight stayed at zero in Summer 2012. Capacity Plan +0% Achieved Comments Sector loads and sector optimisation assessment according to traffic demand and system enablers implementation Yes
Airspace management and ATS route assessment and/or improvements according to network needs, Airspace Users, ENAV’s Flight Efficiency Plan and/or BLUEMED FAB implementation
Yes RAD revision
Implementation of CDO in LIMC and LIML according to ENV01 Yes AIC 4/2012 Mode S trial No Postponed to 2013
Maximum configuration: 18 sectors Yes The summer traffic was accommodated using maximum 17 sectors
Summer 2012 performance assessment
The ACC capacity baseline was assessed to be at the same level as in Summer 2011. The actual calculated value was lower, in line with traffic demand decrease, showing good adaptation of capacity to traffic demand. During the period June/July, the average peak 1 hour demand was 145 and the peak 3 hour demand was 134. A maximum 17 sector configuration was opened.
Traffic Evolution (2012 v 2011) Enroute Delay (min. per flight)
Traffic Forecast Milan LIMM ACC Current
Routes Shortest Routes
Actual Traffic
All reasons
Delay without weather
ACC Target Delay
ACC Capacity Baseline
(% difference v 2011)
Year -3.2% 0.0 0.0 0.06
Capacity gap?
Summer
H: -2.1% B: -3.2% L: -4.5%
-4% -2.1% 0.0 0.0 0.11 No Offered: 164 (0%)

Annual NOR 2012 ANNEX I – ACC Capacity Evolution
March 2013 Annual NOR 2012 Annex I ©2013 European Organisation for the Safety of Air Navigation (EUROCONTROL)I
37
32. ITALY PADOVA ACC Traffic & Delay
LIPPACC - Traffic and en-route ATFM delays
0
500
1000
1500
2000
2500
3000
IFR
flig
hts
(Dai
ly A
vera
0,0
0,1
0,2
0,3
0,4
0,5
0,6
0,7
0,8
0,9
1,0
Enro
ute
Del
ay (m
inut
es p
er f
Peak Day Traffic 2779 2575 2696 2755 2826
Summer Traffic 2107 1969 2156 2210 2220
Yearly Traffic 1799 1673 1792 1865 1844
Summer enroute delay (all causes) 0,2 0,0 0,0 0,1 0,0
Yearly enroute delay (all causes) 0,1 0,0 0,0 0,0 0,0
2008 2009 2010 2011 2012
2012 Realisation of Capacity Plan
Average en-route delay per flight was zero minutes per flight during Summer 2012. Capacity Plan +2% Achieved Comments Sector loads and sector optimisation according to traffic demand and system enablers implementation Yes According to BZO NDB area reorganization
Airspace management and ATS route assessment and/or improvements according to network needs, Airspace Users, ENAV’s Flight Efficiency Plan and/or BLUEMED FAB implementation
Yes RAD revision
ATS network to/from LIPZ BZO NDB area reorganization
Implementation of CDO in LIPZ according to ENV01 Yes AIC 4/2012 Sectorisation and configuration revision to optimise ATM and sectors loads according to network needs Yes Maximum configuration: 12 sectors Yes Summer 2012 performance assessment
The capacity baseline of 187 for Padova ACC was calculated with ACCESS, representing the capacity delivered during the Summer season. During the period June/July, the average peak 1 hour demand was 174 and the average peak 3 hour demand was 163. A maximum 12 sector configuration was opened (FIC not included).
Traffic Evolution (2012 v 2011) Enroute Delay (min. per flight)
Traffic Forecast Padova
LIPP ACC Current
Routes Shortest Routes
Actual Traffic
All reasons
Delay without weather
ACC Target Delay
ACC Capacity Baseline
(% difference v 2011)
Year -0.9% 0.0 0.0 0.14
Capacity gap?
Summer
H: -1.3% B: -2.1% L: -3.4%
No sig. impact +0.5% 0.0 0.0 0.23 No Offered: 187 (+1%)
Allocation of and Reasons for Enroute Delay
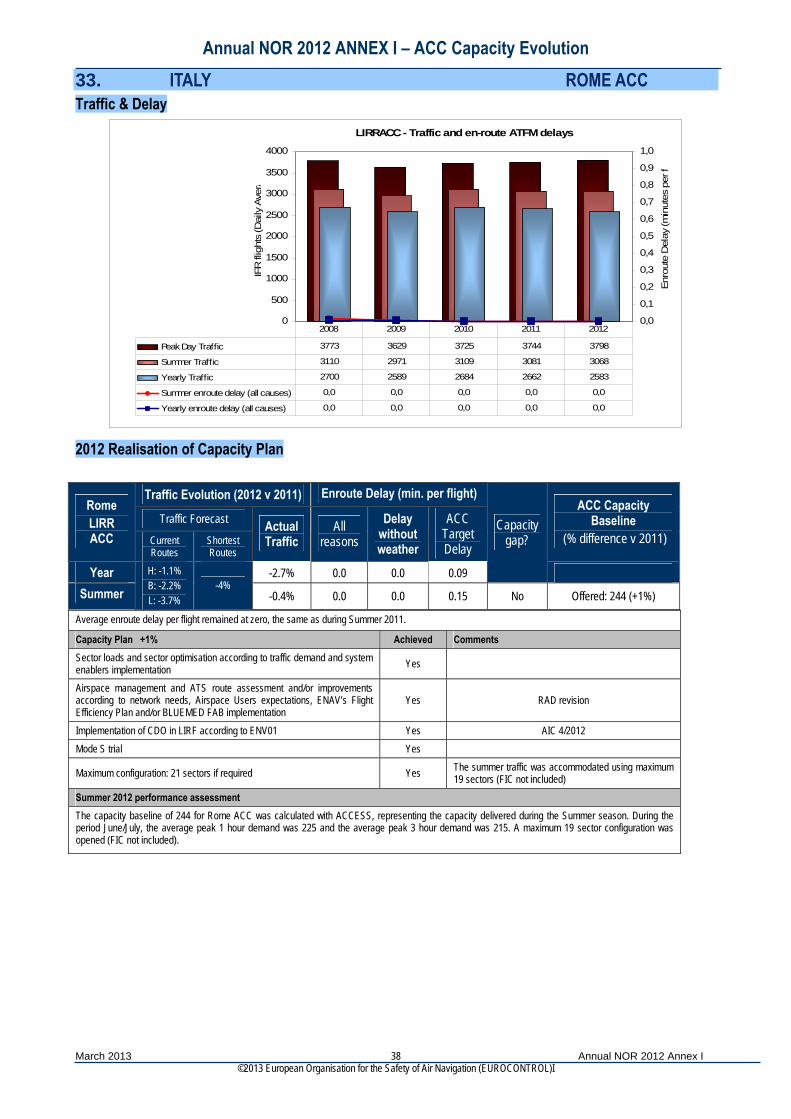
Annual NOR 2012 ANNEX I – ACC Capacity Evolution
March 2013 Annual NOR 2012 Annex I ©2013 European Organisation for the Safety of Air Navigation (EUROCONTROL)I
38
33. ITALY ROME ACC Traffic & Delay
LIRRACC - Traffic and en-route ATFM delays
0
500
1000
1500
2000
2500
3000
3500
4000
IFR
flig
hts
(Dai
ly A
ver
0,0
0,1
0,2
0,3
0,4
0,5
0,6
0,7
0,8
0,9
1,0
Enro
ute
Del
ay (m
inut
es p
er f
a
Peak Day Traffic 3773 3629 3725 3744 3798
Summer Traffic 3110 2971 3109 3081 3068
Yearly Traffic 2700 2589 2684 2662 2583
Summer enroute delay (all causes) 0,0 0,0 0,0 0,0 0,0
Yearly enroute delay (all causes) 0,0 0,0 0,0 0,0 0,0
2008 2009 2010 2011 2012
2012 Realisation of Capacity Plan
Average enroute delay per flight remained at zero, the same as during Summer 2011.
Capacity Plan +1% Achieved Comments Sector loads and sector optimisation according to traffic demand and system enablers implementation Yes
Airspace management and ATS route assessment and/or improvements according to network needs, Airspace Users expectations, ENAV’s Flight Efficiency Plan and/or BLUEMED FAB implementation
Yes RAD revision
Implementation of CDO in LIRF according to ENV01 Yes AIC 4/2012 Mode S trial Yes
Maximum configuration: 21 sectors if required Yes The summer traffic was accommodated using maximum 19 sectors (FIC not included)
Summer 2012 performance assessment The capacity baseline of 244 for Rome ACC was calculated with ACCESS, representing the capacity delivered during the Summer season. During the period June/July, the average peak 1 hour demand was 225 and the average peak 3 hour demand was 215. A maximum 19 sector configuration was opened (FIC not included).
Traffic Evolution (2012 v 2011) Enroute Delay (min. per flight)
Traffic Forecast Rome LIRR ACC Current
Routes Shortest Routes
Actual Traffic
All reasons
Delay without weather
ACC Target Delay
ACC Capacity Baseline
(% difference v 2011)
Year -2.7% 0.0 0.0 0.09
Capacity gap?
Summer
H: -1.1% B: -2.2% L: -3.7%
-4% -0.4% 0.0 0.0 0.15 No Offered: 244 (+1%)
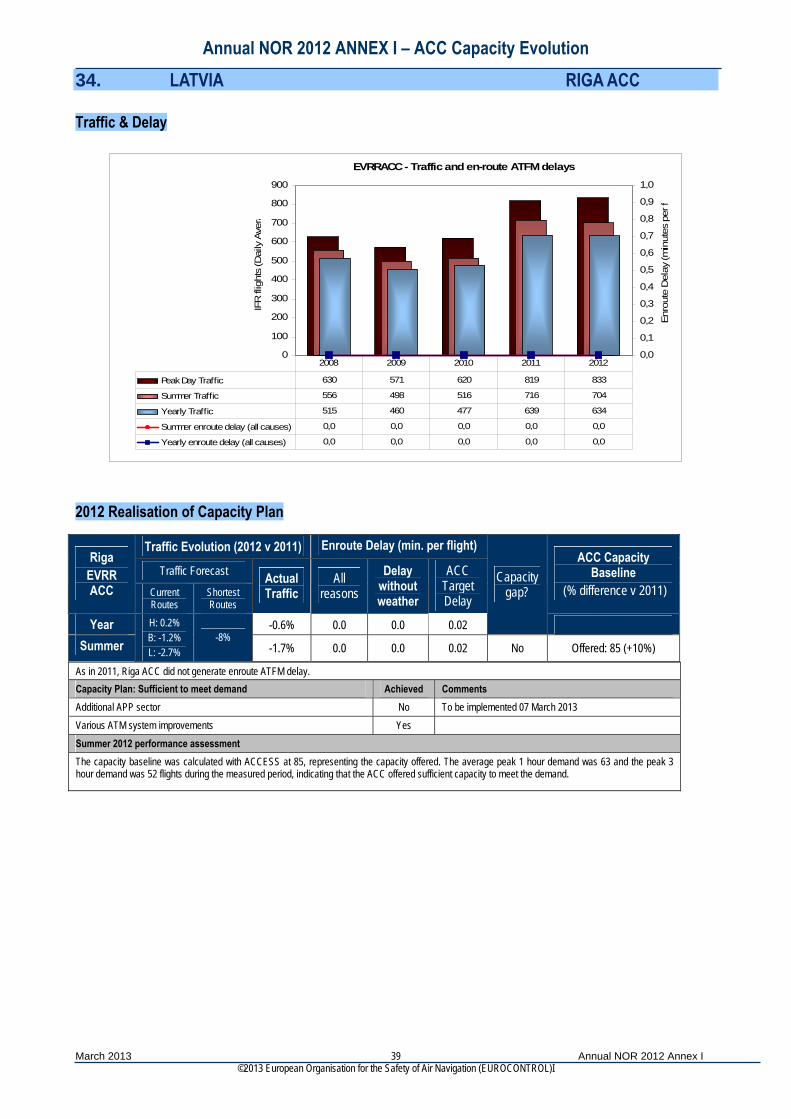
Annual NOR 2012 ANNEX I – ACC Capacity Evolution
March 2013 Annual NOR 2012 Annex I ©2013 European Organisation for the Safety of Air Navigation (EUROCONTROL)I
39
34. LATVIA RIGA ACC Traffic & Delay
EVRRACC - Traffic and en-route ATFM delays
0
100
200
300
400
500
600
700
800
900
IFR
flig
hts
(Dai
ly A
vera
0,0
0,1
0,2
0,3
0,4
0,5
0,6
0,7
0,8
0,9
1,0
Enro
ute
Del
ay (m
inut
es p
er f
Peak Day Traffic 630 571 620 819 833
Summer Traffic 556 498 516 716 704
Yearly Traffic 515 460 477 639 634
Summer enroute delay (all causes) 0,0 0,0 0,0 0,0 0,0
Yearly enroute delay (all causes) 0,0 0,0 0,0 0,0 0,0
2008 2009 2010 2011 2012
2012 Realisation of Capacity Plan
As in 2011, Riga ACC did not generate enroute ATFM delay. Capacity Plan: Sufficient to meet demand Achieved Comments Additional APP sector No To be implemented 07 March 2013 Various ATM system improvements Yes Summer 2012 performance assessment The capacity baseline was calculated with ACCESS at 85, representing the capacity offered. The average peak 1 hour demand was 63 and the peak 3 hour demand was 52 flights during the measured period, indicating that the ACC offered sufficient capacity to meet the demand.
Traffic Evolution (2012 v 2011) Enroute Delay (min. per flight)
Traffic Forecast Riga
EVRR ACC Current
Routes Shortest Routes
Actual Traffic
All reasons
Delay without weather
ACC Target Delay
ACC Capacity Baseline
(% difference v 2011)
Year -0.6% 0.0 0.0 0.02
Capacity gap?
Summer
H: 0.2% B: -1.2% L: -2.7%
-8% -1.7% 0.0 0.0 0.02 No Offered: 85 (+10%)
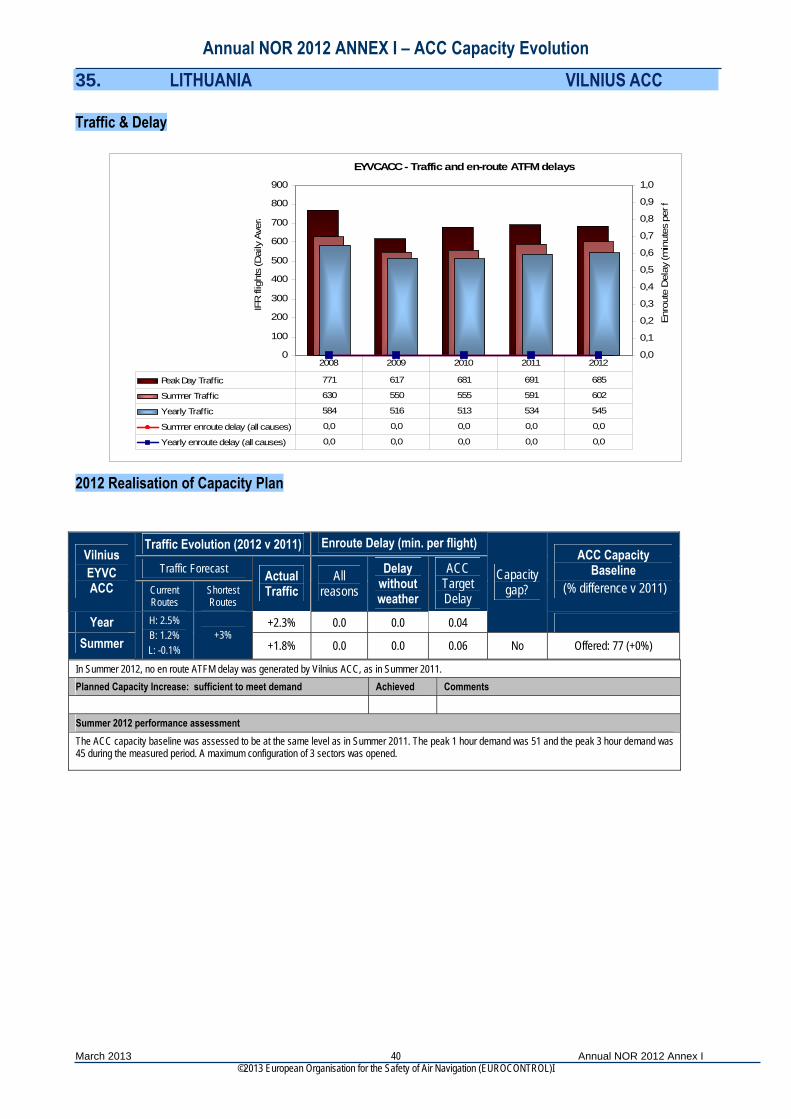
Annual NOR 2012 ANNEX I – ACC Capacity Evolution
March 2013 Annual NOR 2012 Annex I ©2013 European Organisation for the Safety of Air Navigation (EUROCONTROL)I
40
35. LITHUANIA VILNIUS ACC Traffic & Delay
EYVCACC - Traffic and en-route ATFM delays
0
100
200
300
400
500
600
700
800
900
IFR
flig
hts
(Dai
ly A
vera
0,0
0,1
0,2
0,3
0,4
0,5
0,6
0,7
0,8
0,9
1,0
Enro
ute
Del
ay (m
inut
es p
er f
Peak Day Traffic 771 617 681 691 685
Summer Traffic 630 550 555 591 602
Yearly Traffic 584 516 513 534 545
Summer enroute delay (all causes) 0,0 0,0 0,0 0,0 0,0
Yearly enroute delay (all causes) 0,0 0,0 0,0 0,0 0,0
2008 2009 2010 2011 2012
2012 Realisation of Capacity Plan
In Summer 2012, no en route ATFM delay was generated by Vilnius ACC, as in Summer 2011. Planned Capacity Increase: sufficient to meet demand Achieved Comments Summer 2012 performance assessment The ACC capacity baseline was assessed to be at the same level as in Summer 2011. The peak 1 hour demand was 51 and the peak 3 hour demand was 45 during the measured period. A maximum configuration of 3 sectors was opened.
Traffic Evolution (2012 v 2011) Enroute Delay (min. per flight)
Traffic Forecast Vilnius EYVC ACC Current
Routes Shortest Routes
Actual Traffic
All reasons
Delay without weather
ACC Target Delay
ACC Capacity Baseline
(% difference v 2011)
Year +2.3% 0.0 0.0 0.04
Capacity gap?
Summer
H: 2.5% B: 1.2% L: -0.1%
+3% +1.8% 0.0 0.0 0.06 No Offered: 77 (+0%)
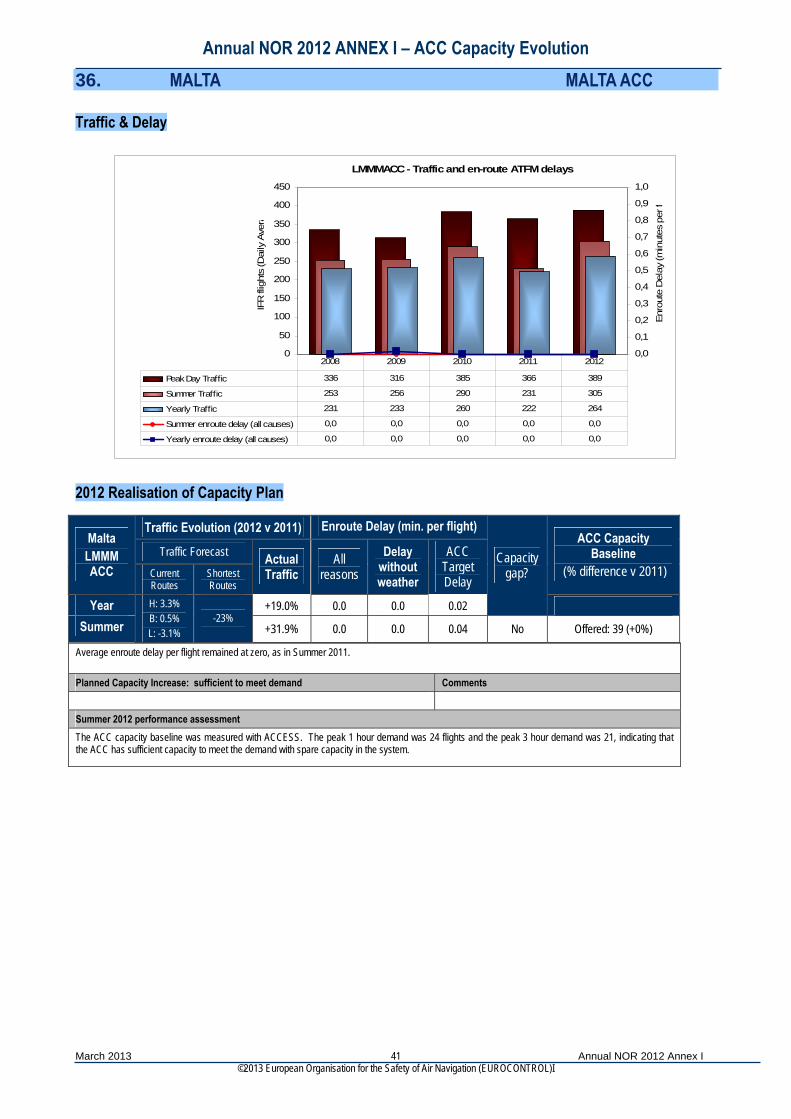
Annual NOR 2012 ANNEX I – ACC Capacity Evolution
March 2013 Annual NOR 2012 Annex I ©2013 European Organisation for the Safety of Air Navigation (EUROCONTROL)I
41
36. MALTA MALTA ACC Traffic & Delay
LMMMACC - Traffic and en-route ATFM delays
0
50
100
150
200
250
300
350
400
450
IFR
flig
hts
(Dai
ly A
vera
0,0
0,1
0,2
0,3
0,4
0,5
0,6
0,7
0,8
0,9
1,0
Enr
oute
Del
ay (m
inut
es p
er f
Peak Day Traffic 336 316 385 366 389
Summer Traffic 253 256 290 231 305
Yearly Traffic 231 233 260 222 264
Summer enroute delay (all causes) 0,0 0,0 0,0 0,0 0,0
Yearly enroute delay (all causes) 0,0 0,0 0,0 0,0 0,0
2008 2009 2010 2011 2012
2012 Realisation of Capacity Plan
Average enroute delay per flight remained at zero, as in Summer 2011. Planned Capacity Increase: sufficient to meet demand Comments Summer 2012 performance assessment The ACC capacity baseline was measured with ACCESS. The peak 1 hour demand was 24 flights and the peak 3 hour demand was 21, indicating that the ACC has sufficient capacity to meet the demand with spare capacity in the system.
Traffic Evolution (2012 v 2011) Enroute Delay (min. per flight)
Traffic Forecast Malta LMMM ACC Current
Routes Shortest Routes
Actual Traffic
All reasons
Delay without weather
ACC Target Delay
ACC Capacity Baseline
(% difference v 2011)
Year +19.0% 0.0 0.0 0.02
Capacity gap?
Summer
H: 3.3% B: 0.5% L: -3.1%
-23% +31.9% 0.0 0.0 0.04 No Offered: 39 (+0%)
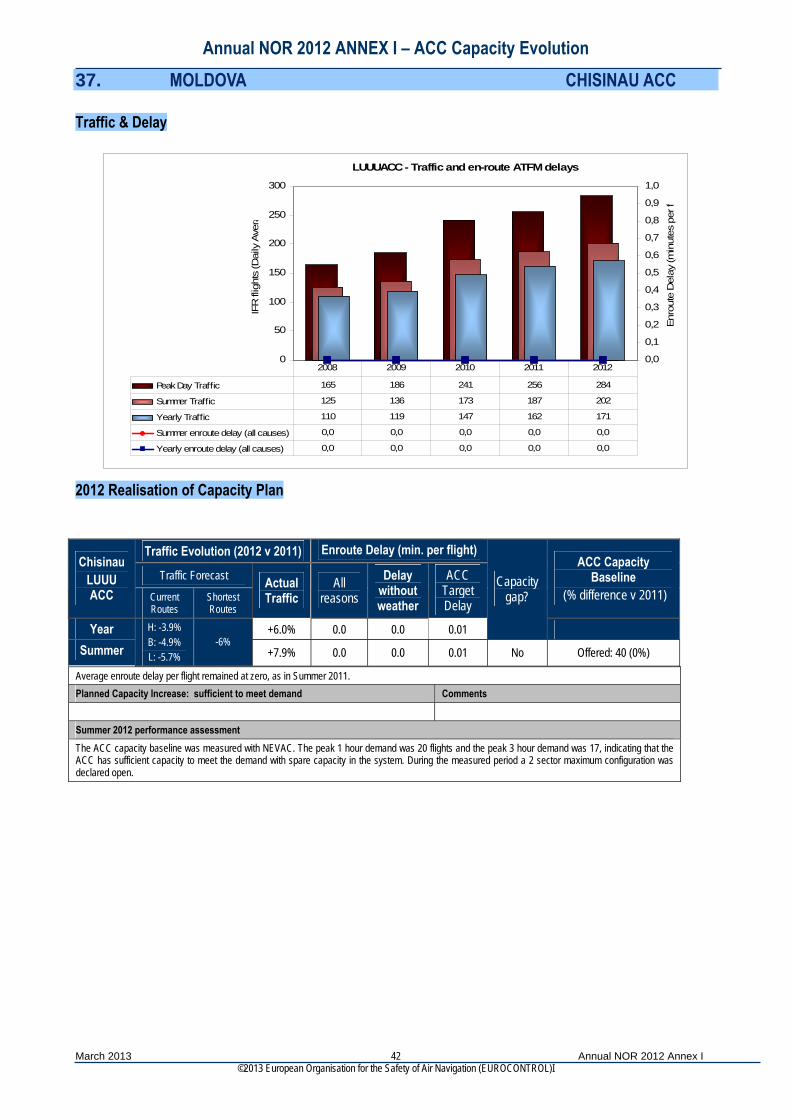
Annual NOR 2012 ANNEX I – ACC Capacity Evolution
March 2013 Annual NOR 2012 Annex I ©2013 European Organisation for the Safety of Air Navigation (EUROCONTROL)I
42
37. MOLDOVA CHISINAU ACC Traffic & Delay
LUUUACC - Traffic and en-route ATFM delays
0
50
100
150
200
250
300
IFR
flig
hts
(Dai
ly A
vera
0,0
0,1
0,2
0,3
0,4
0,5
0,6
0,7
0,8
0,9
1,0
Enro
ute
Del
ay (m
inut
es p
er f
Peak Day Traffic 165 186 241 256 284
Summer Traffic 125 136 173 187 202
Yearly Traffic 110 119 147 162 171
Summer enroute delay (all causes) 0,0 0,0 0,0 0,0 0,0
Yearly enroute delay (all causes) 0,0 0,0 0,0 0,0 0,0
2008 2009 2010 2011 2012
2012 Realisation of Capacity Plan
Average enroute delay per flight remained at zero, as in Summer 2011. Planned Capacity Increase: sufficient to meet demand Comments Summer 2012 performance assessment The ACC capacity baseline was measured with NEVAC. The peak 1 hour demand was 20 flights and the peak 3 hour demand was 17, indicating that the ACC has sufficient capacity to meet the demand with spare capacity in the system. During the measured period a 2 sector maximum configuration was declared open.
Traffic Evolution (2012 v 2011) Enroute Delay (min. per flight)
Traffic Forecast Chisinau
LUUU ACC Current
Routes Shortest Routes
Actual Traffic
All reasons
Delay without weather
ACC Target Delay
ACC Capacity Baseline
(% difference v 2011)
Year +6.0% 0.0 0.0 0.01
Capacity gap?
Summer
H: -3.9% B: -4.9% L: -5.7%
-6% +7.9% 0.0 0.0 0.01 No Offered: 40 (0%)
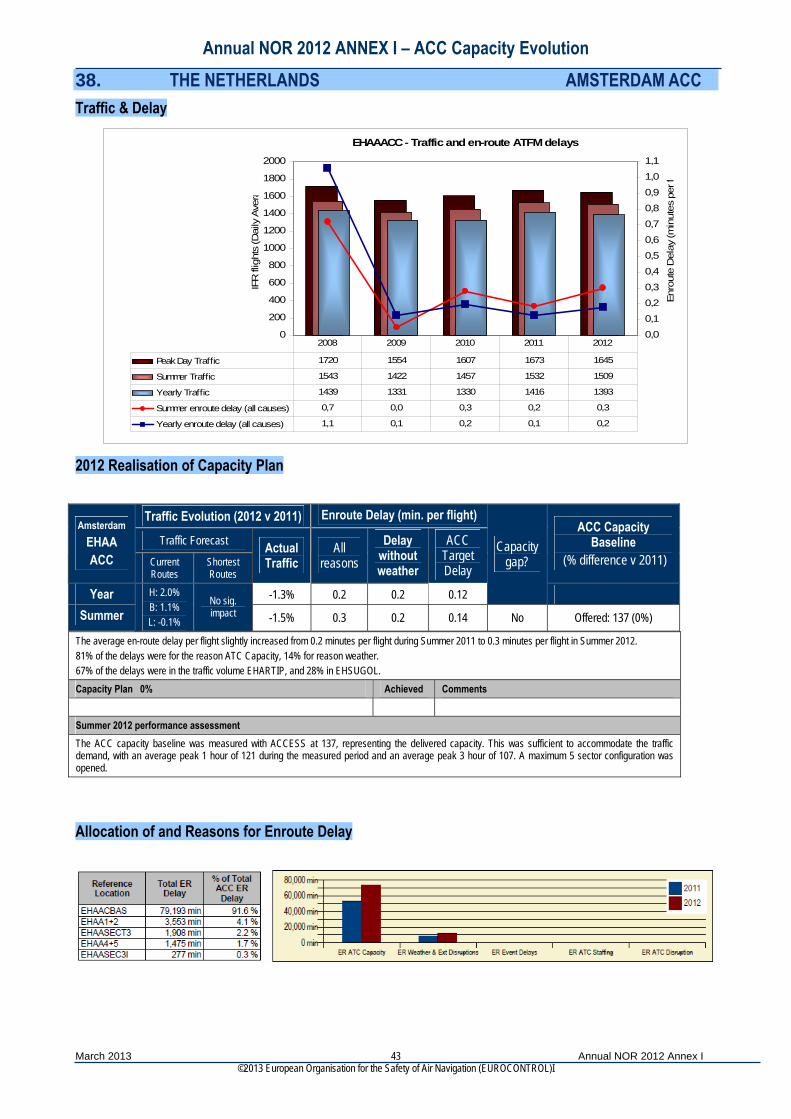
Annual NOR 2012 ANNEX I – ACC Capacity Evolution
March 2013 Annual NOR 2012 Annex I ©2013 European Organisation for the Safety of Air Navigation (EUROCONTROL)I
43
38. THE NETHERLANDS AMSTERDAM ACC Traffic & Delay
EHAAACC - Traffic and en-route ATFM delays
0
200
400
600
800
1000
1200
1400
1600
1800
2000
IFR
flig
hts
(Dai
ly A
vera
0,0
0,10,2
0,3
0,4
0,5
0,6
0,7
0,8
0,9
1,0
1,1
Enro
ute
Del
ay (m
inut
es p
er f
Peak Day Traffic 1720 1554 1607 1673 1645
Summer Traffic 1543 1422 1457 1532 1509
Yearly Traffic 1439 1331 1330 1416 1393
Summer enroute delay (all causes) 0,7 0,0 0,3 0,2 0,3
Yearly enroute delay (all causes) 1,1 0,1 0,2 0,1 0,2
2008 2009 2010 2011 2012
2012 Realisation of Capacity Plan
The average en-route delay per flight slightly increased from 0.2 minutes per flight during Summer 2011 to 0.3 minutes per flight in Summer 2012. 81% of the delays were for the reason ATC Capacity, 14% for reason weather. 67% of the delays were in the traffic volume EHARTIP, and 28% in EHSUGOL. Capacity Plan 0% Achieved Comments Summer 2012 performance assessment The ACC capacity baseline was measured with ACCESS at 137, representing the delivered capacity. This was sufficient to accommodate the traffic demand, with an average peak 1 hour of 121 during the measured period and an average peak 3 hour of 107. A maximum 5 sector configuration was opened.
Traffic Evolution (2012 v 2011) Enroute Delay (min. per flight)
Traffic Forecast Amsterdam
EHAA ACC Current
Routes Shortest Routes
Actual Traffic
All reasons
Delay without weather
ACC Target Delay
ACC Capacity Baseline
(% difference v 2011)
Year -1.3% 0.2 0.2 0.12
Capacity gap?
Summer
H: 2.0% B: 1.1% L: -0.1%
No sig. impact -1.5% 0.3 0.2 0.14 No Offered: 137 (0%)
Allocation of and Reasons for Enroute Delay
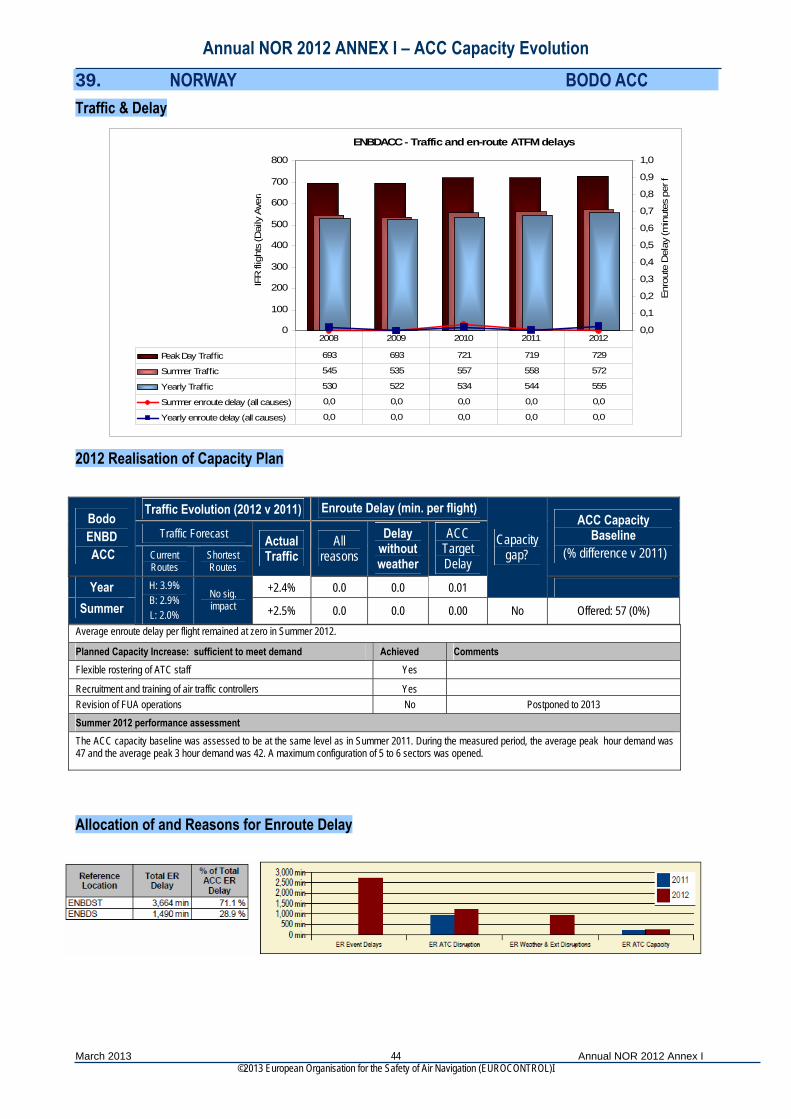
Annual NOR 2012 ANNEX I – ACC Capacity Evolution
March 2013 Annual NOR 2012 Annex I ©2013 European Organisation for the Safety of Air Navigation (EUROCONTROL)I
44
39. NORWAY BODO ACC Traffic & Delay
ENBDACC - Traffic and en-route ATFM delays
0
100
200
300
400
500
600
700
800
IFR
flig
hts
(Dai
ly A
vera
0,0
0,1
0,2
0,3
0,4
0,5
0,6
0,7
0,8
0,9
1,0
Enro
ute
Del
ay (m
inut
es p
er f
Peak Day Traffic 693 693 721 719 729
Summer Traffic 545 535 557 558 572
Yearly Traffic 530 522 534 544 555
Summer enroute delay (all causes) 0,0 0,0 0,0 0,0 0,0
Yearly enroute delay (all causes) 0,0 0,0 0,0 0,0 0,0
2008 2009 2010 2011 2012
2012 Realisation of Capacity Plan
Average enroute delay per flight remained at zero in Summer 2012.
Planned Capacity Increase: sufficient to meet demand Achieved Comments Flexible rostering of ATC staff Yes
Recruitment and training of air traffic controllers Yes Revision of FUA operations No Postponed to 2013 Summer 2012 performance assessment The ACC capacity baseline was assessed to be at the same level as in Summer 2011. During the measured period, the average peak hour demand was 47 and the average peak 3 hour demand was 42. A maximum configuration of 5 to 6 sectors was opened.
Traffic Evolution (2012 v 2011) Enroute Delay (min. per flight)
Traffic Forecast Bodo ENBD ACC Current
Routes Shortest Routes
Actual Traffic
All reasons
Delay without weather
ACC Target Delay
ACC Capacity Baseline
(% difference v 2011)
Year +2.4% 0.0 0.0 0.01
Capacity gap?
Summer
H: 3.9% B: 2.9% L: 2.0%
No sig. impact +2.5% 0.0 0.0 0.00 No Offered: 57 (0%)
Allocation of and Reasons for Enroute Delay

Annual NOR 2012 ANNEX I – ACC Capacity Evolution
March 2013 Annual NOR 2012 Annex I ©2013 European Organisation for the Safety of Air Navigation (EUROCONTROL)I
45
40. NORWAY OSLO ACC Traffic & Delay
ENOSACC - Traffic and en-route ATFM delays
0
200
400
600
800
1000
1200
1400
IFR
flig
hts
(Dai
ly A
vera
0,0
0,1
0,2
0,3
0,4
0,5
0,6
0,7
0,8
0,9
1,0
Enro
ute
Del
ay (m
inut
es p
er f
Peak Day Traffic 1213 1080 1154 1135 1135
Summer Traffic 990 904 962 911 947
Yearly Traffic 929 866 891 884 898
Summer enroute delay (all causes) 0,0 0,0 0,0 0,0 0,8
Yearly enroute delay (all causes) 0,0 0,0 0,0 0,0 0,5
2008 2009 2010 2011 2012
2012 Realisation of Capacity Plan
Average enroute delay per flight increased from zero minutes per flight in Summer 2011 to 0.8 minutes per flight in Summer 2012. 100% of the delays were due to ATC staffing. 36% were in combined sector 1267, 33% in combined sector 3458 and 21% in combined sector 345. Planned Capacity Increase: sufficient to meet demand Achieved Comments Recruitment and training of air traffic controllers No Net: 1 ATCO less Summer 2012 performance assessment The capacity offered was measured with ACCESS Reverse CASA at a level of 67, for an average peak demand of 74 (peak 1 hour) and 69 (peak 3 hour). A maximum configuration of 7 sectors was opened.
Traffic Evolution (2012 v 2011) Enroute Delay (min. per flight)
Traffic Forecast Oslo
ENOS ACC Current
Routes Shortest Routes
Actual Traffic
All reasons
Delay without weather
ACC Target Delay
ACC Capacity Baseline
(% difference v 2011)
Year +1.9% 0.5 0.5 0.0
Capacity gap?
Summer
H: 3.3% B: 2.3% L: 0.9%
No sig. impact +4.0% 0.8 0.8 0.0 Yes Offered: 67 (-29%)
Allocation of and Reasons for Enroute Delay
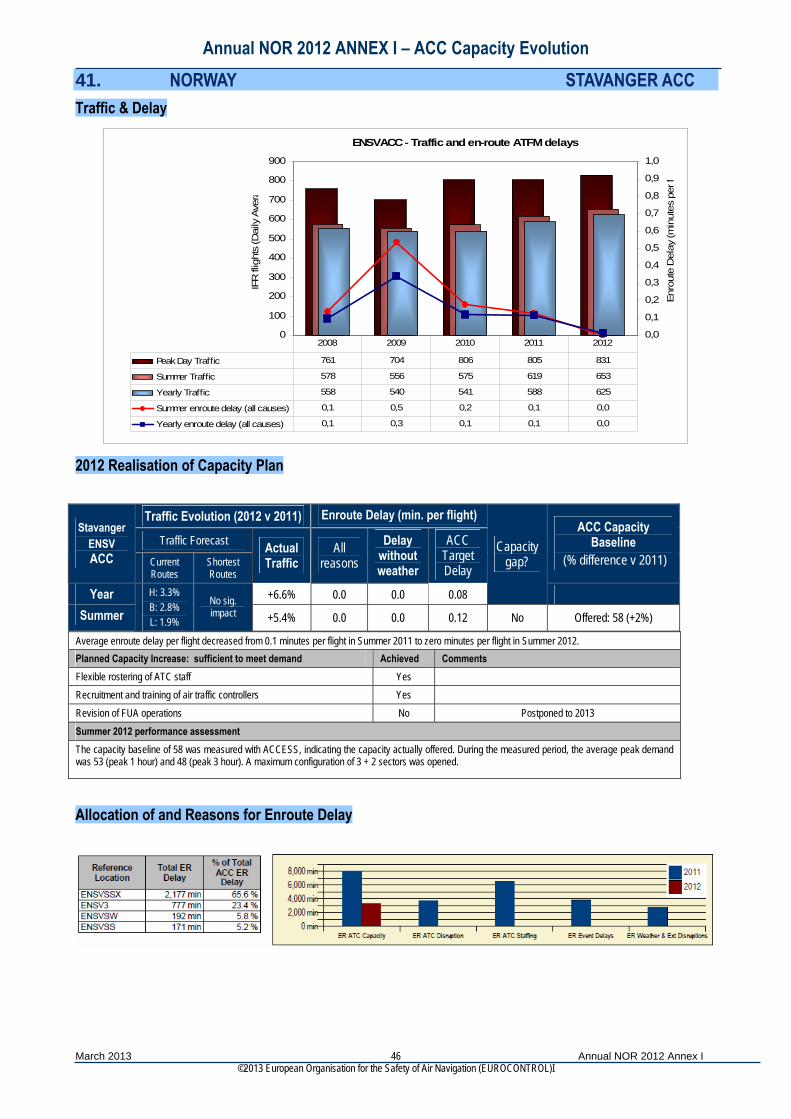
Annual NOR 2012 ANNEX I – ACC Capacity Evolution
March 2013 Annual NOR 2012 Annex I ©2013 European Organisation for the Safety of Air Navigation (EUROCONTROL)I
46
41. NORWAY STAVANGER ACC Traffic & Delay
ENSVACC - Traffic and en-route ATFM delays
0
100
200
300
400
500
600
700
800
900
IFR
flig
hts
(Dai
ly A
vera
0,0
0,1
0,2
0,3
0,4
0,5
0,6
0,7
0,8
0,9
1,0
Enro
ute
Del
ay (m
inut
es p
er f
Peak Day Traffic 761 704 806 805 831
Summer Traffic 578 556 575 619 653
Yearly Traffic 558 540 541 588 625
Summer enroute delay (all causes) 0,1 0,5 0,2 0,1 0,0
Yearly enroute delay (all causes) 0,1 0,3 0,1 0,1 0,0
2008 2009 2010 2011 2012
2012 Realisation of Capacity Plan
Average enroute delay per flight decreased from 0.1 minutes per flight in Summer 2011 to zero minutes per flight in Summer 2012. Planned Capacity Increase: sufficient to meet demand Achieved Comments Flexible rostering of ATC staff Yes Recruitment and training of air traffic controllers Yes Revision of FUA operations No Postponed to 2013 Summer 2012 performance assessment The capacity baseline of 58 was measured with ACCESS, indicating the capacity actually offered. During the measured period, the average peak demand was 53 (peak 1 hour) and 48 (peak 3 hour). A maximum configuration of 3 + 2 sectors was opened.
Traffic Evolution (2012 v 2011) Enroute Delay (min. per flight)
Traffic Forecast Stavanger
ENSV ACC Current
Routes Shortest Routes
Actual Traffic
All reasons
Delay without weather
ACC Target Delay
ACC Capacity Baseline
(% difference v 2011)
Year +6.6% 0.0 0.0 0.08
Capacity gap?
Summer
H: 3.3% B: 2.8% L: 1.9%
No sig. impact +5.4% 0.0 0.0 0.12 No Offered: 58 (+2%)
Allocation of and Reasons for Enroute Delay
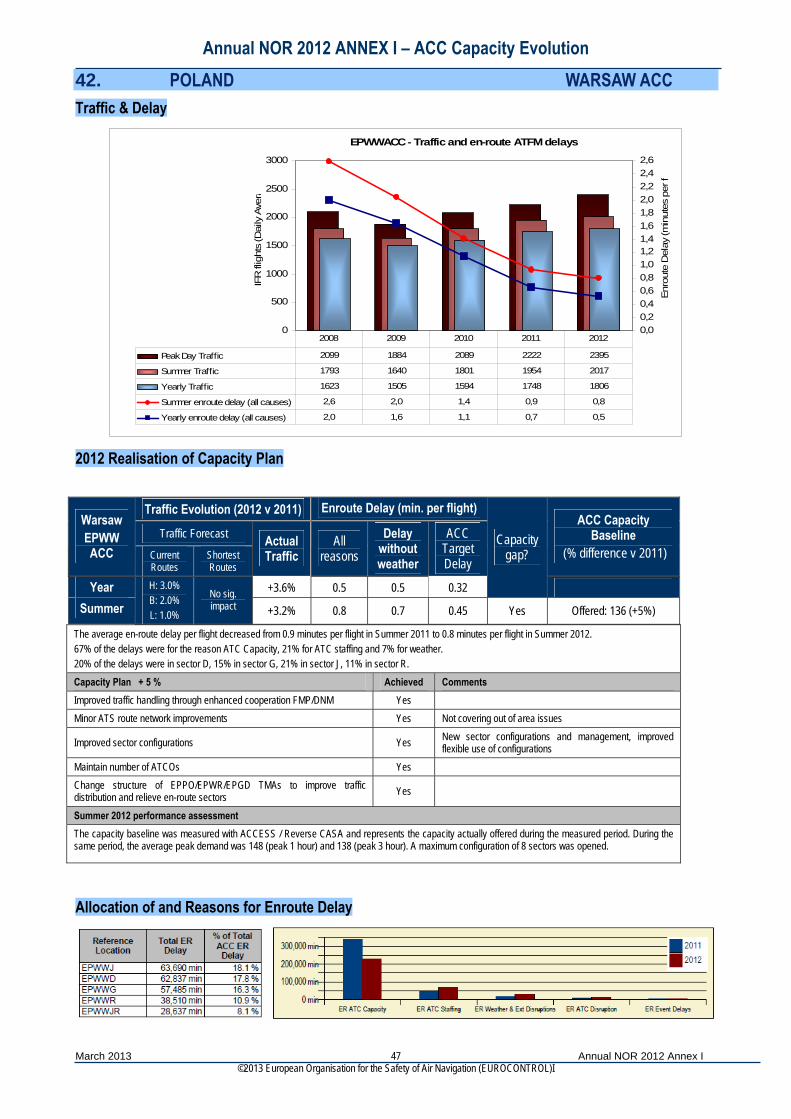
Annual NOR 2012 ANNEX I – ACC Capacity Evolution
March 2013 Annual NOR 2012 Annex I ©2013 European Organisation for the Safety of Air Navigation (EUROCONTROL)I
47
42. POLAND WARSAW ACC Traffic & Delay
EPWWACC - Traffic and en-route ATFM delays
0
500
1000
1500
2000
2500
3000
IFR
flig
hts
(Dai
ly A
vera
0,00,20,40,60,81,01,21,41,61,82,02,22,42,6
Enro
ute
Del
ay (m
inut
es p
er f
Peak Day Traffic 2099 1884 2089 2222 2395
Summer Traffic 1793 1640 1801 1954 2017
Yearly Traffic 1623 1505 1594 1748 1806
Summer enroute delay (all causes) 2,6 2,0 1,4 0,9 0,8
Yearly enroute delay (all causes) 2,0 1,6 1,1 0,7 0,5
2008 2009 2010 2011 2012
2012 Realisation of Capacity Plan
The average en-route delay per flight decreased from 0.9 minutes per flight in Summer 2011 to 0.8 minutes per flight in Summer 2012. 67% of the delays were for the reason ATC Capacity, 21% for ATC staffing and 7% for weather. 20% of the delays were in sector D, 15% in sector G, 21% in sector J, 11% in sector R. Capacity Plan + 5 % Achieved Comments Improved traffic handling through enhanced cooperation FMP/DNM Yes Minor ATS route network improvements Yes Not covering out of area issues
Improved sector configurations Yes New sector configurations and management, improved flexible use of configurations
Maintain number of ATCOs Yes Change structure of EPPO/EPWR/EPGD TMAs to improve traffic distribution and relieve en-route sectors Yes
Summer 2012 performance assessment The capacity baseline was measured with ACCESS / Reverse CASA and represents the capacity actually offered during the measured period. During the same period, the average peak demand was 148 (peak 1 hour) and 138 (peak 3 hour). A maximum configuration of 8 sectors was opened.
Traffic Evolution (2012 v 2011) Enroute Delay (min. per flight)
Traffic Forecast Warsaw EPWW ACC Current
Routes Shortest Routes
Actual Traffic
All reasons
Delay without weather
ACC Target Delay
ACC Capacity Baseline
(% difference v 2011)
Year +3.6% 0.5 0.5 0.32
Capacity gap?
Summer
H: 3.0% B: 2.0% L: 1.0%
No sig. impact +3.2% 0.8 0.7 0.45 Yes Offered: 136 (+5%)
Allocation of and Reasons for Enroute Delay
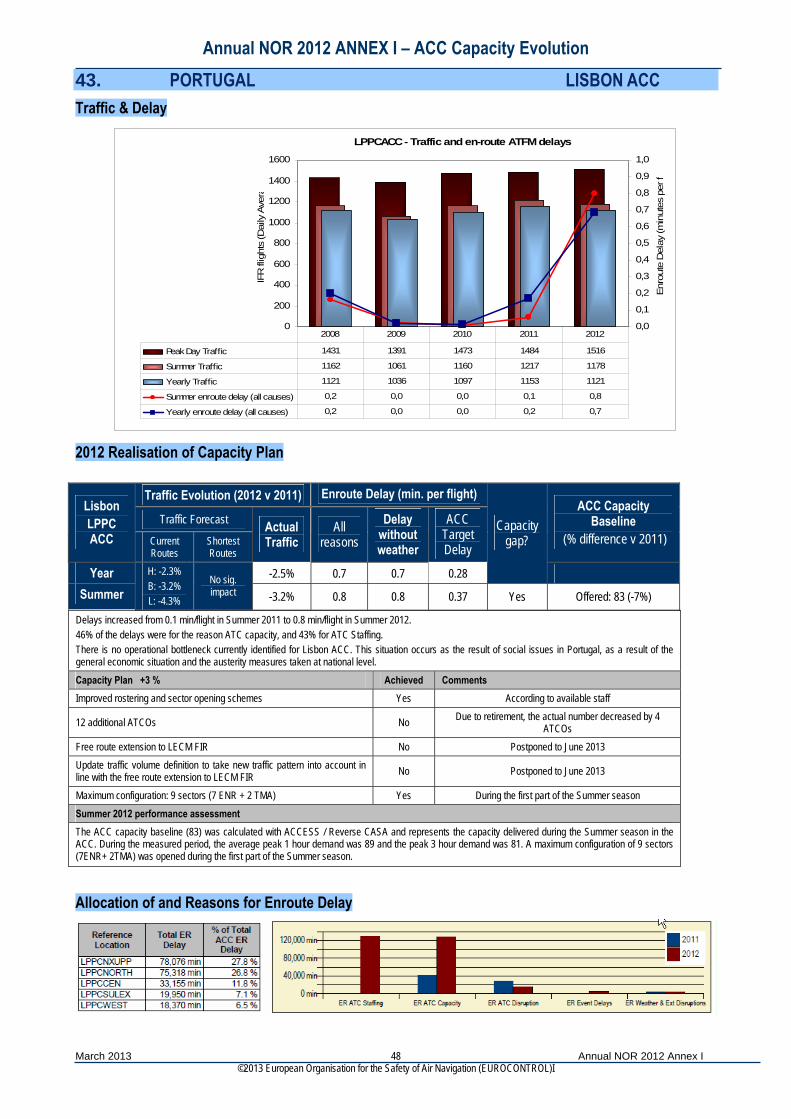
Annual NOR 2012 ANNEX I – ACC Capacity Evolution
March 2013 Annual NOR 2012 Annex I ©2013 European Organisation for the Safety of Air Navigation (EUROCONTROL)I
48
43. PORTUGAL LISBON ACC Traffic & Delay
LPPCACC - Traffic and en-route ATFM delays
0
200
400
600
800
1000
1200
1400
1600
IFR
flig
hts
(Dai
ly A
vera
0,0
0,1
0,2
0,3
0,4
0,5
0,6
0,7
0,8
0,9
1,0
Enr
oute
Del
ay (m
inut
es p
er f
Peak Day Traffic 1431 1391 1473 1484 1516
Summer Traffic 1162 1061 1160 1217 1178
Yearly Traffic 1121 1036 1097 1153 1121
Summer enroute delay (all causes) 0,2 0,0 0,0 0,1 0,8
Yearly enroute delay (all causes) 0,2 0,0 0,0 0,2 0,7
2008 2009 2010 2011 2012
2012 Realisation of Capacity Plan
Delays increased from 0.1 min/flight in Summer 2011 to 0.8 min/flight in Summer 2012. 46% of the delays were for the reason ATC capacity, and 43% for ATC Staffing. There is no operational bottleneck currently identified for Lisbon ACC. This situation occurs as the result of social issues in Portugal, as a result of the general economic situation and the austerity measures taken at national level. Capacity Plan +3 % Achieved Comments Improved rostering and sector opening schemes Yes According to available staff
12 additional ATCOs No Due to retirement, the actual number decreased by 4 ATCOs
Free route extension to LECM FIR No Postponed to June 2013 Update traffic volume definition to take new traffic pattern into account in line with the free route extension to LECM FIR No Postponed to June 2013
Maximum configuration: 9 sectors (7 ENR + 2 TMA) Yes During the first part of the Summer season Summer 2012 performance assessment The ACC capacity baseline (83) was calculated with ACCESS / Reverse CASA and represents the capacity delivered during the Summer season in the ACC. During the measured period, the average peak 1 hour demand was 89 and the peak 3 hour demand was 81. A maximum configuration of 9 sectors (7ENR+ 2TMA) was opened during the first part of the Summer season.
Traffic Evolution (2012 v 2011) Enroute Delay (min. per flight)
Traffic Forecast Lisbon LPPC ACC Current
Routes Shortest Routes
Actual Traffic
All reasons
Delay without weather
ACC Target Delay
ACC Capacity Baseline
(% difference v 2011)
Year -2.5% 0.7 0.7 0.28
Capacity gap?
Summer
H: -2.3% B: -3.2% L: -4.3%
No sig. impact -3.2% 0.8 0.8 0.37 Yes Offered: 83 (-7%)
Allocation of and Reasons for Enroute Delay
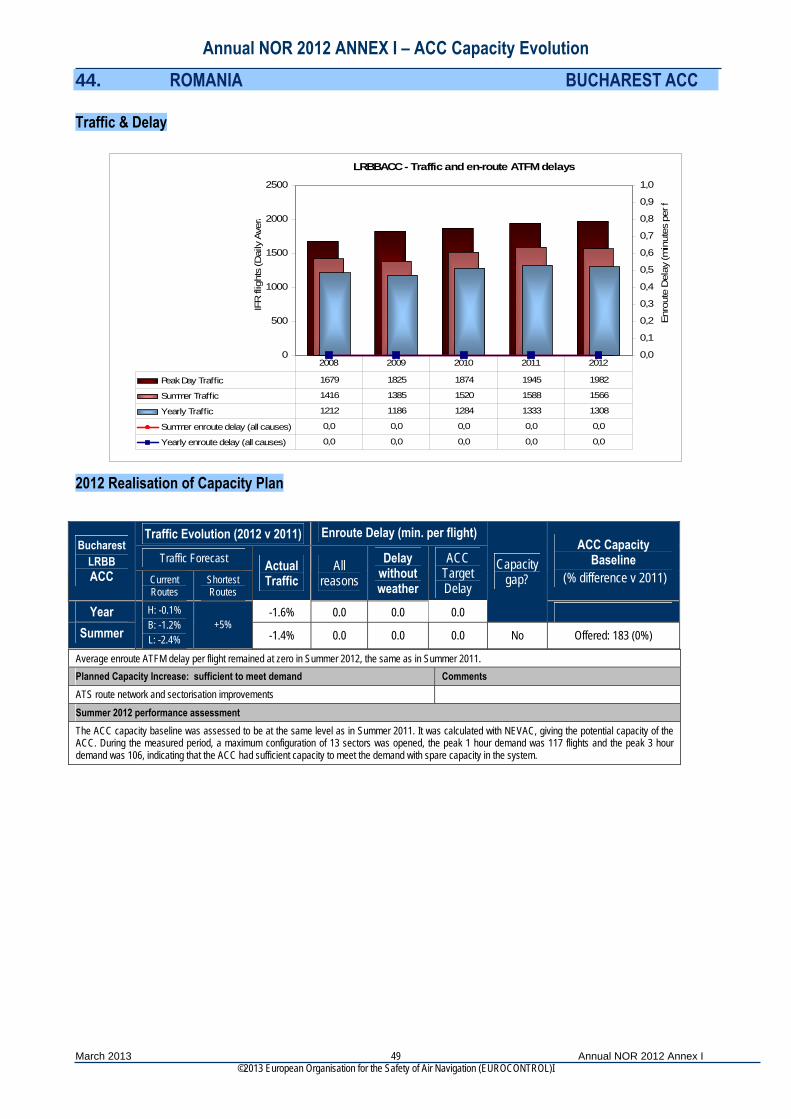
Annual NOR 2012 ANNEX I – ACC Capacity Evolution
March 2013 Annual NOR 2012 Annex I ©2013 European Organisation for the Safety of Air Navigation (EUROCONTROL)I
49
44. ROMANIA BUCHAREST ACC Traffic & Delay
LRBBACC - Traffic and en-route ATFM delays
0
500
1000
1500
2000
2500
IFR
flig
hts
(Dai
ly A
vera
0,0
0,1
0,2
0,3
0,4
0,5
0,6
0,7
0,8
0,9
1,0
Enro
ute
Del
ay (m
inut
es p
er f
Peak Day Traffic 1679 1825 1874 1945 1982
Summer Traffic 1416 1385 1520 1588 1566
Yearly Traffic 1212 1186 1284 1333 1308
Summer enroute delay (all causes) 0,0 0,0 0,0 0,0 0,0
Yearly enroute delay (all causes) 0,0 0,0 0,0 0,0 0,0
2008 2009 2010 2011 2012
2012 Realisation of Capacity Plan
Average enroute ATFM delay per flight remained at zero in Summer 2012, the same as in Summer 2011. Planned Capacity Increase: sufficient to meet demand Comments ATS route network and sectorisation improvements Summer 2012 performance assessment The ACC capacity baseline was assessed to be at the same level as in Summer 2011. It was calculated with NEVAC, giving the potential capacity of the ACC. During the measured period, a maximum configuration of 13 sectors was opened, the peak 1 hour demand was 117 flights and the peak 3 hour demand was 106, indicating that the ACC had sufficient capacity to meet the demand with spare capacity in the system.
Traffic Evolution (2012 v 2011) Enroute Delay (min. per flight)
Traffic Forecast Bucharest
LRBB ACC Current
Routes Shortest Routes
Actual Traffic
All reasons
Delay without weather
ACC Target Delay
ACC Capacity Baseline
(% difference v 2011)
Year -1.6% 0.0 0.0 0.0
Capacity gap?
Summer
H: -0.1% B: -1.2% L: -2.4%
+5% -1.4% 0.0 0.0 0.0 No Offered: 183 (0%)
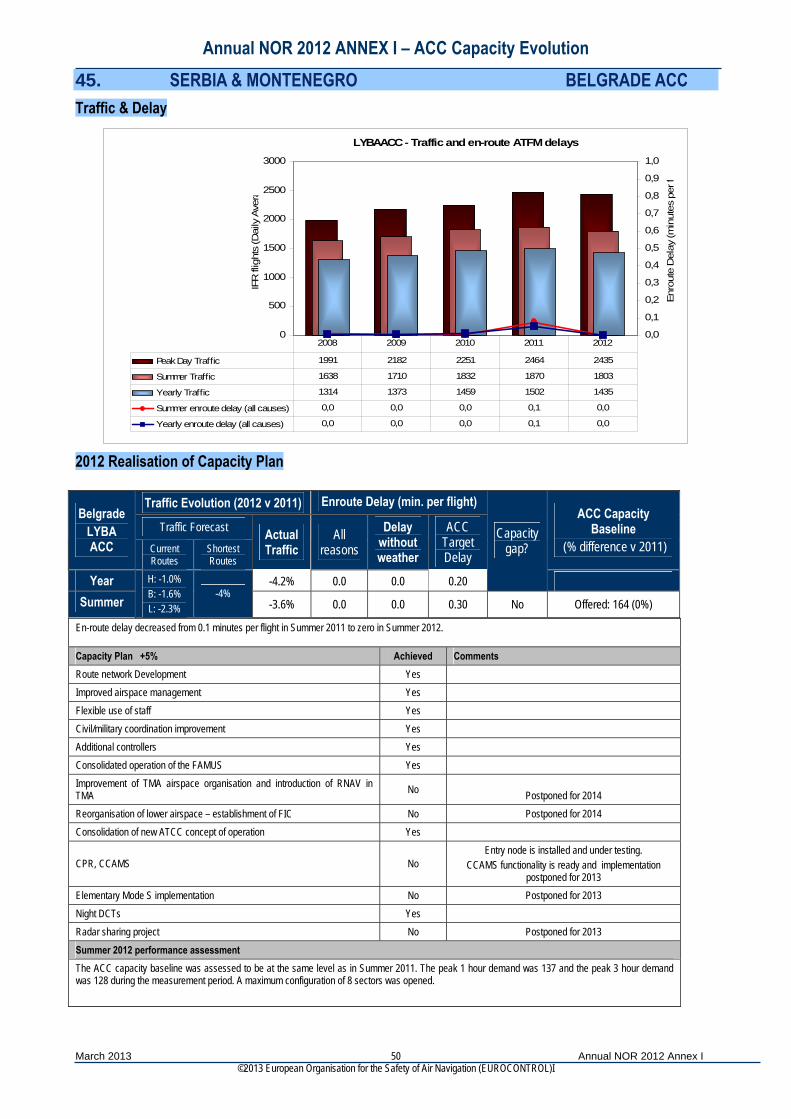
Annual NOR 2012 ANNEX I – ACC Capacity Evolution
March 2013 Annual NOR 2012 Annex I ©2013 European Organisation for the Safety of Air Navigation (EUROCONTROL)I
50
45. SERBIA & MONTENEGRO BELGRADE ACC Traffic & Delay
LYBAACC - Traffic and en-route ATFM delays
0
500
1000
1500
2000
2500
3000
IFR
flig
hts
(Dai
ly A
vera
0,0
0,1
0,2
0,3
0,4
0,5
0,6
0,7
0,8
0,9
1,0
Enro
ute
Del
ay (m
inut
es p
er f
Peak Day Traffic 1991 2182 2251 2464 2435
Summer Traffic 1638 1710 1832 1870 1803
Yearly Traffic 1314 1373 1459 1502 1435
Summer enroute delay (all causes) 0,0 0,0 0,0 0,1 0,0
Yearly enroute delay (all causes) 0,0 0,0 0,0 0,1 0,0
2008 2009 2010 2011 2012
2012 Realisation of Capacity Plan
En-route delay decreased from 0.1 minutes per flight in Summer 2011 to zero in Summer 2012.
Capacity Plan +5% Achieved Comments Route network Development Yes Improved airspace management Yes Flexible use of staff Yes Civil/military coordination improvement Yes Additional controllers Yes Consolidated operation of the FAMUS Yes Improvement of TMA airspace organisation and introduction of RNAV in TMA No Postponed for 2014 Reorganisation of lower airspace – establishment of FIC No Postponed for 2014 Consolidation of new ATCC concept of operation Yes
CPR, CCAMS No Entry node is installed and under testing.
CCAMS functionality is ready and implementation postponed for 2013
Elementary Mode S implementation No Postponed for 2013 Night DCTs Yes Radar sharing project No Postponed for 2013 Summer 2012 performance assessment The ACC capacity baseline was assessed to be at the same level as in Summer 2011. The peak 1 hour demand was 137 and the peak 3 hour demand was 128 during the measurement period. A maximum configuration of 8 sectors was opened.
Traffic Evolution (2012 v 2011) Enroute Delay (min. per flight)
Traffic Forecast Belgrade
LYBA ACC Current
Routes Shortest Routes
Actual Traffic
All reasons
Delay without weather
ACC Target Delay
ACC Capacity Baseline
(% difference v 2011)
Year -4.2% 0.0 0.0 0.20
Capacity gap?
Summer
H: -1.0% B: -1.6% L: -2.3%
-4% -3.6% 0.0 0.0 0.30 No Offered: 164 (0%)
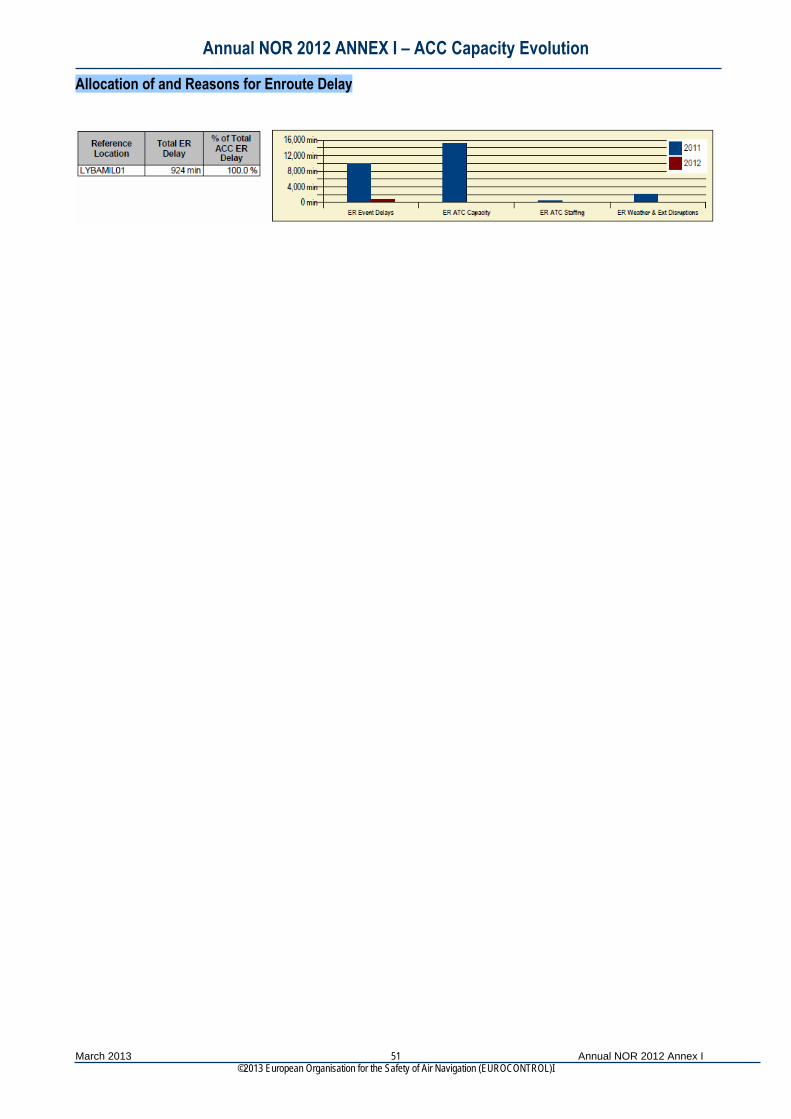
Annual NOR 2012 ANNEX I – ACC Capacity Evolution
March 2013 Annual NOR 2012 Annex I ©2013 European Organisation for the Safety of Air Navigation (EUROCONTROL)I
51
Allocation of and Reasons for Enroute Delay
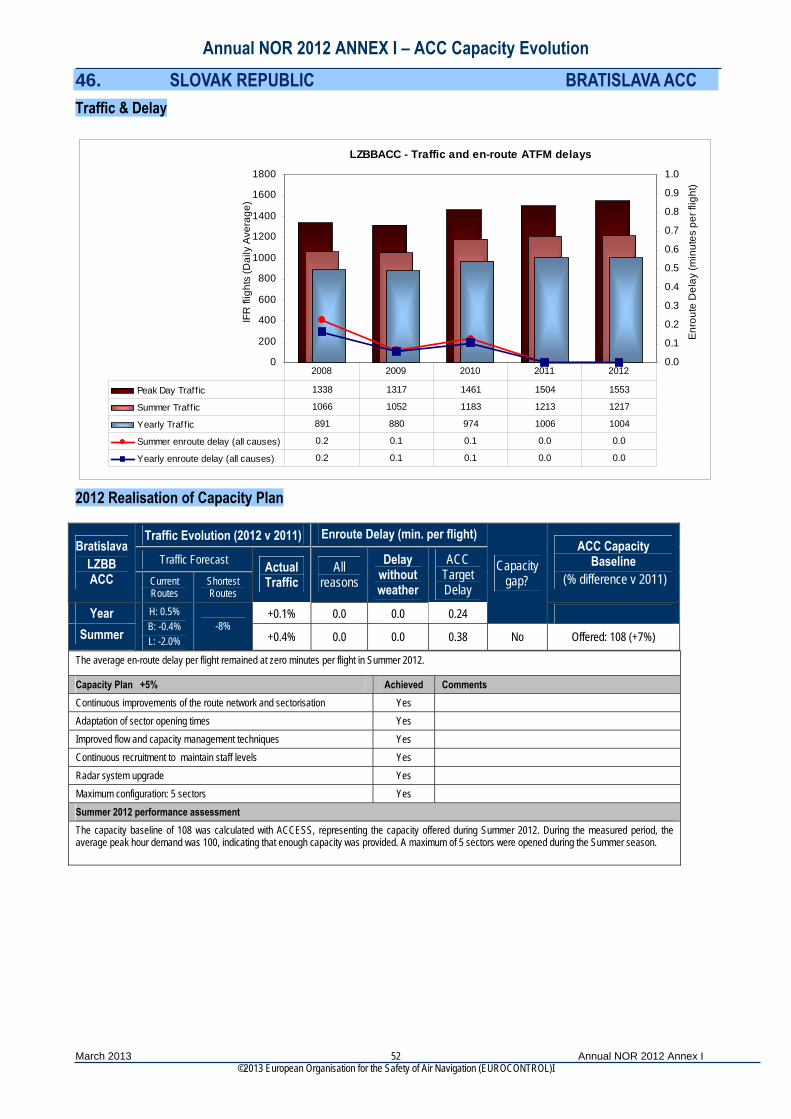
Annual NOR 2012 ANNEX I – ACC Capacity Evolution
March 2013 Annual NOR 2012 Annex I ©2013 European Organisation for the Safety of Air Navigation (EUROCONTROL)I
52
46. SLOVAK REPUBLIC BRATISLAVA ACC Traffic & Delay
LZBBACC - Traffic and en-route ATFM delays
0
200
400
600
800
1000
1200
1400
1600
1800
IFR
flig
hts
(Dai
ly A
vera
ge)
0.0
0.1
0.2
0.3
0.4
0.5
0.6
0.7
0.8
0.9
1.0
Enr
oute
Del
ay (m
inut
es p
er fl
ight
)
Peak Day Traff ic 1338 1317 1461 1504 1553
Summer Traffic 1066 1052 1183 1213 1217
Yearly Traff ic 891 880 974 1006 1004
Summer enroute delay (all causes) 0.2 0.1 0.1 0.0 0.0
Yearly enroute delay (all causes) 0.2 0.1 0.1 0.0 0.0
2008 2009 2010 2011 2012
2012 Realisation of Capacity Plan
The average en-route delay per flight remained at zero minutes per flight in Summer 2012.
Capacity Plan +5% Achieved Comments Continuous improvements of the route network and sectorisation Yes Adaptation of sector opening times Yes Improved flow and capacity management techniques Yes Continuous recruitment to maintain staff levels Yes Radar system upgrade Yes Maximum configuration: 5 sectors Yes Summer 2012 performance assessment The capacity baseline of 108 was calculated with ACCESS, representing the capacity offered during Summer 2012. During the measured period, the average peak hour demand was 100, indicating that enough capacity was provided. A maximum of 5 sectors were opened during the Summer season.
Traffic Evolution (2012 v 2011) Enroute Delay (min. per flight)
Traffic Forecast Bratislava
LZBB ACC Current
Routes Shortest Routes
Actual Traffic
All reasons
Delay without weather
ACC Target Delay
ACC Capacity Baseline
(% difference v 2011)
Year +0.1% 0.0 0.0 0.24
Capacity gap?
Summer
H: 0.5% B: -0.4% L: -2.0%
-8% +0.4% 0.0 0.0 0.38 No Offered: 108 (+7%)

Annual NOR 2012 ANNEX I – ACC Capacity Evolution
March 2013 Annual NOR 2012 Annex I ©2013 European Organisation for the Safety of Air Navigation (EUROCONTROL)I
53
47. SLOVENIA LJUBLJANA ACC Traffic & Delay
LJLAACC - Traffic and en-route ATFM delays
0
200
400
600
800
1000
1200
1400
IFR
flig
hts
(Dai
ly A
vera
0,0
0,1
0,2
0,3
0,4
0,5
0,6
0,7
0,8
0,9
1,0
Enro
ute
Del
ay (m
inut
es p
er f
Peak Day Traffic 986 937 1035 1189 1262
Summer Traffic 815 759 830 912 909
Yearly Traffic 671 632 673 741 735
Summer enroute delay (all causes) 0,1 0,0 0,0 0,0 0,0
Yearly enroute delay (all causes) 0,0 0,0 0,0 0,0 0,0
2008 2009 2010 2011 2012
2012 Realisation of Capacity Plan
The average en-route delay per flight remained zero in Summer 2012.
Capacity Plan : Up to +5% Achieved Comments Flexible sector configurations Yes ATS route network and traffic organisation changes Yes 5% increase in sector hours Yes During the WE Maximum configuration: 4 sectors Yes Summer 2012 performance assessment The capacity baseline was measured with ACCESS, representing the delivered capacity (87). The peak 1 hour demand was 78 and the peak 3 hour demand was 70 during the measurement period. A maximum configuration of 4 sectors was opened.
Traffic Evolution (2012 v 2011) Enroute Delay (min. per flight)
Traffic Forecast Ljubljana
LJLA ACC Current
Routes Shortest Routes
Actual Traffic
All reasons
Delay without weather
ACC Target Delay
ACC Capacity Baseline
(% difference v 2011)
Year -0.5% 0.0 0.0 0.31
Capacity gap?
Summer
H: -1.9% B: -2.2% L: -3.6%
+10% -0.3% 0.0 0.0 0.46 No Offered: 87 (0%)
Allocation of and Reasons for Enroute Delay
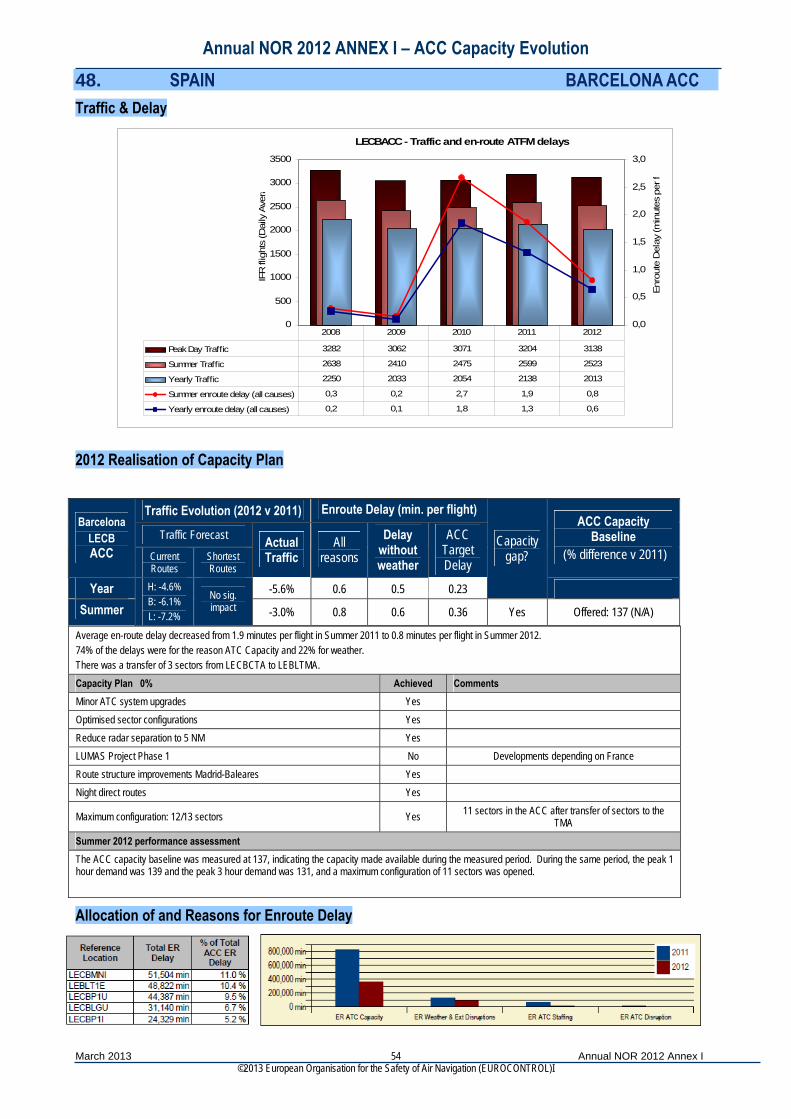
Annual NOR 2012 ANNEX I – ACC Capacity Evolution
March 2013 Annual NOR 2012 Annex I ©2013 European Organisation for the Safety of Air Navigation (EUROCONTROL)I
54
48. SPAIN BARCELONA ACC Traffic & Delay
LECBACC - Traffic and en-route ATFM delays
0
500
1000
1500
2000
2500
3000
3500
IFR
flig
hts
(Dai
ly A
vera
0,0
0,5
1,0
1,5
2,0
2,5
3,0
Enro
ute
Del
ay (m
inut
es p
er f
Peak Day Traffic 3282 3062 3071 3204 3138
Summer Traffic 2638 2410 2475 2599 2523
Yearly Traffic 2250 2033 2054 2138 2013
Summer enroute delay (all causes) 0,3 0,2 2,7 1,9 0,8
Yearly enroute delay (all causes) 0,2 0,1 1,8 1,3 0,6
2008 2009 2010 2011 2012
2012 Realisation of Capacity Plan
Average en-route delay decreased from 1.9 minutes per flight in Summer 2011 to 0.8 minutes per flight in Summer 2012. 74% of the delays were for the reason ATC Capacity and 22% for weather. There was a transfer of 3 sectors from LECBCTA to LEBLTMA. Capacity Plan 0% Achieved Comments Minor ATC system upgrades Yes Optimised sector configurations Yes Reduce radar separation to 5 NM Yes LUMAS Project Phase 1 No Developments depending on France Route structure improvements Madrid-Baleares Yes Night direct routes Yes
Maximum configuration: 12/13 sectors Yes 11 sectors in the ACC after transfer of sectors to the TMA
Summer 2012 performance assessment The ACC capacity baseline was measured at 137, indicating the capacity made available during the measured period. During the same period, the peak 1 hour demand was 139 and the peak 3 hour demand was 131, and a maximum configuration of 11 sectors was opened.
Traffic Evolution (2012 v 2011) Enroute Delay (min. per flight)
Traffic Forecast Barcelona
LECB ACC Current
Routes Shortest Routes
Actual Traffic
All reasons
Delay without weather
ACC Target Delay
ACC Capacity Baseline
(% difference v 2011)
Year -5.6% 0.6 0.5 0.23
Capacity gap?
Summer
H: -4.6% B: -6.1% L: -7.2%
No sig. impact -3.0% 0.8 0.6 0.36 Yes Offered: 137 (N/A)
Allocation of and Reasons for Enroute Delay
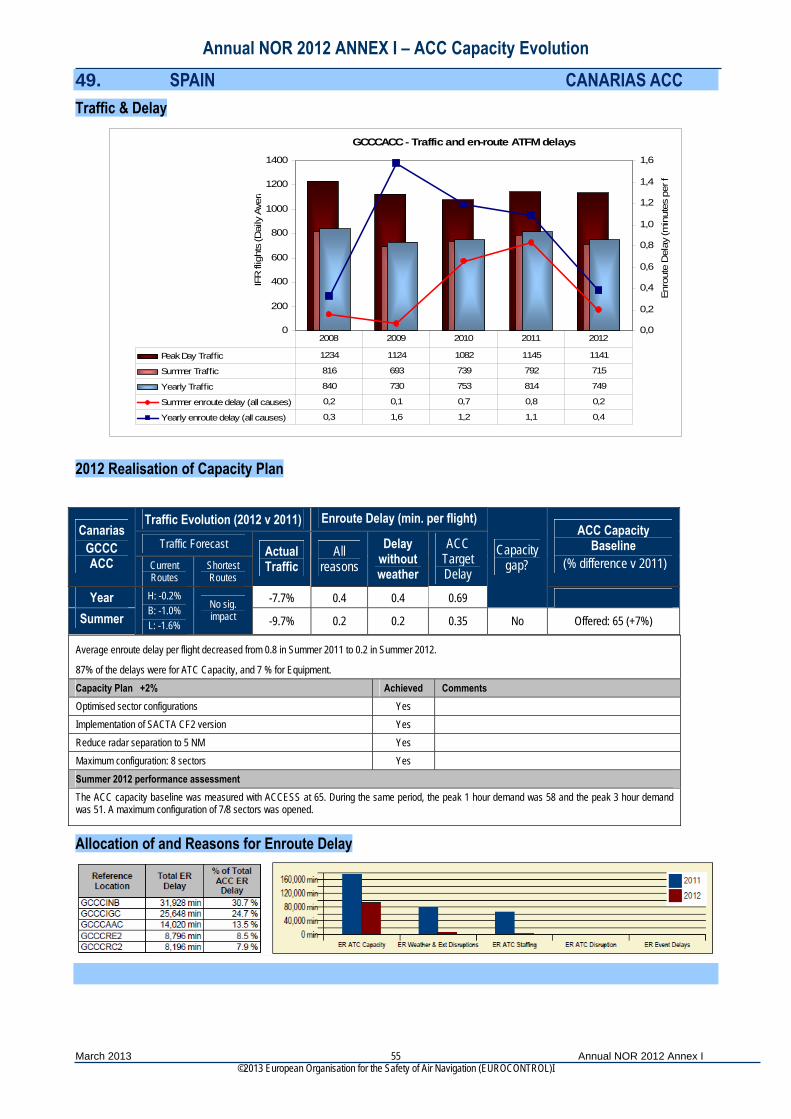
Annual NOR 2012 ANNEX I – ACC Capacity Evolution
March 2013 Annual NOR 2012 Annex I ©2013 European Organisation for the Safety of Air Navigation (EUROCONTROL)I
55
49. SPAIN CANARIAS ACC Traffic & Delay
GCCCACC - Traffic and en-route ATFM delays
0
200
400
600
800
1000
1200
1400
IFR
flig
hts
(Dai
ly A
vera
0,0
0,2
0,4
0,6
0,8
1,0
1,2
1,4
1,6
Enro
ute
Del
ay (m
inut
es p
er f
Peak Day Traffic 1234 1124 1082 1145 1141
Summer Traffic 816 693 739 792 715
Yearly Traffic 840 730 753 814 749
Summer enroute delay (all causes) 0,2 0,1 0,7 0,8 0,2
Yearly enroute delay (all causes) 0,3 1,6 1,2 1,1 0,4
2008 2009 2010 2011 2012
2012 Realisation of Capacity Plan
Average enroute delay per flight decreased from 0.8 in Summer 2011 to 0.2 in Summer 2012.
87% of the delays were for ATC Capacity, and 7 % for Equipment. Capacity Plan +2% Achieved Comments Optimised sector configurations Yes Implementation of SACTA CF2 version Yes Reduce radar separation to 5 NM Yes Maximum configuration: 8 sectors Yes Summer 2012 performance assessment The ACC capacity baseline was measured with ACCESS at 65. During the same period, the peak 1 hour demand was 58 and the peak 3 hour demand was 51. A maximum configuration of 7/8 sectors was opened.
Allocation of and Reasons for Enroute Delay
Traffic Evolution (2012 v 2011) Enroute Delay (min. per flight)
Traffic Forecast Canarias
GCCC ACC Current
Routes Shortest Routes
Actual Traffic
All reasons
Delay without weather
ACC Target Delay
ACC Capacity Baseline
(% difference v 2011)
Year -7.7% 0.4 0.4 0.69
Capacity gap?
Summer
H: -0.2% B: -1.0% L: -1.6%
No sig. impact -9.7% 0.2 0.2 0.35 No Offered: 65 (+7%)
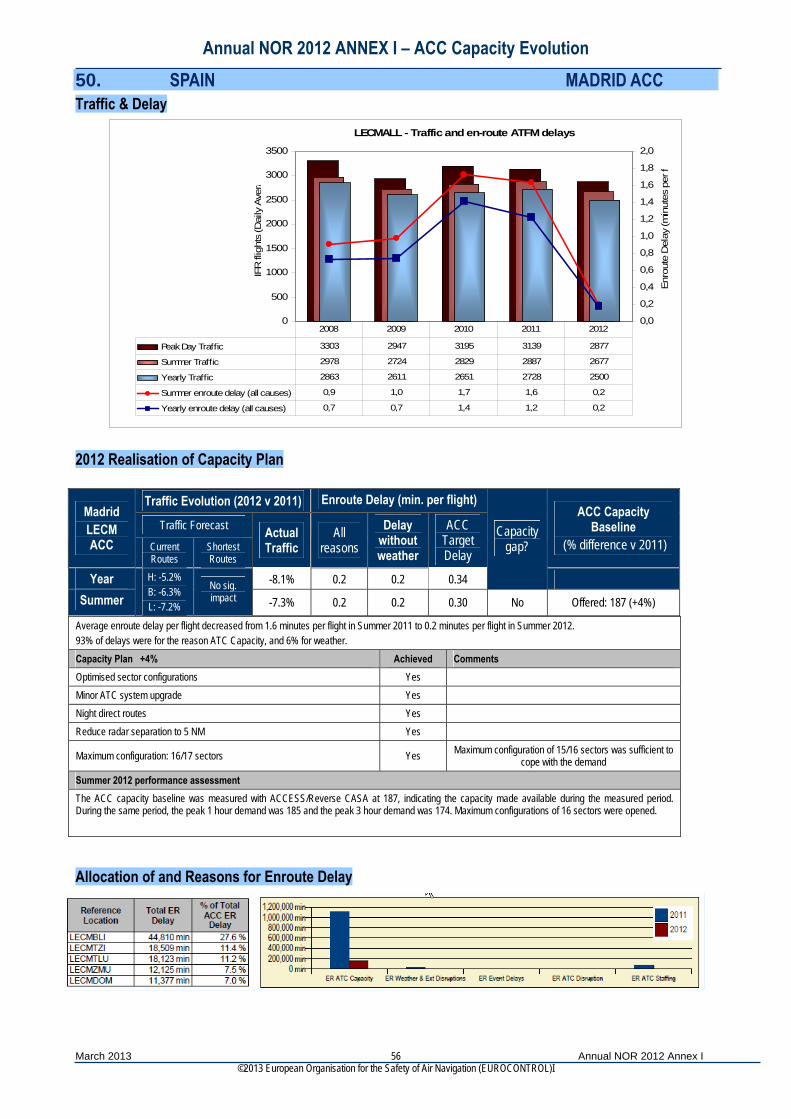
Annual NOR 2012 ANNEX I – ACC Capacity Evolution
March 2013 Annual NOR 2012 Annex I ©2013 European Organisation for the Safety of Air Navigation (EUROCONTROL)I
56
50. SPAIN MADRID ACC Traffic & Delay
LECMALL - Traffic and en-route ATFM delays
0
500
1000
1500
2000
2500
3000
3500
IFR
flig
hts
(Dai
ly A
ver
0,0
0,2
0,4
0,6
0,8
1,0
1,2
1,4
1,6
1,8
2,0
Enro
ute
Del
ay (m
inut
es p
er f
a
Peak Day Traffic 3303 2947 3195 3139 2877
Summer Traffic 2978 2724 2829 2887 2677
Yearly Traffic 2863 2611 2651 2728 2500
Summer enroute delay (all causes) 0,9 1,0 1,7 1,6 0,2
Yearly enroute delay (all causes) 0,7 0,7 1,4 1,2 0,2
2008 2009 2010 2011 2012
2012 Realisation of Capacity Plan
Average enroute delay per flight decreased from 1.6 minutes per flight in Summer 2011 to 0.2 minutes per flight in Summer 2012. 93% of delays were for the reason ATC Capacity, and 6% for weather. Capacity Plan +4% Achieved Comments Optimised sector configurations Yes Minor ATC system upgrade Yes Night direct routes Yes Reduce radar separation to 5 NM Yes
Maximum configuration: 16/17 sectors Yes Maximum configuration of 15/16 sectors was sufficient to cope with the demand
Summer 2012 performance assessment The ACC capacity baseline was measured with ACCESS/Reverse CASA at 187, indicating the capacity made available during the measured period. During the same period, the peak 1 hour demand was 185 and the peak 3 hour demand was 174. Maximum configurations of 16 sectors were opened.
Traffic Evolution (2012 v 2011) Enroute Delay (min. per flight)
Traffic Forecast Madrid LECM ACC Current
Routes Shortest Routes
Actual Traffic
All reasons
Delay without weather
ACC Target Delay
ACC Capacity Baseline
(% difference v 2011)
Year -8.1% 0.2 0.2 0.34
Capacity gap?
Summer
H: -5.2% B: -6.3% L: -7.2%
No sig. impact -7.3% 0.2 0.2 0.30 No Offered: 187 (+4%)
Allocation of and Reasons for Enroute Delay

Annual NOR 2012 ANNEX I – ACC Capacity Evolution
March 2013 Annual NOR 2012 Annex I ©2013 European Organisation for the Safety of Air Navigation (EUROCONTROL)I
57
51. SPAIN PALMA ACC Traffic & Delay
LECPACC - Traffic and en-route ATFM delays
0
200
400
600
800
1000
1200
1400
1600
1800
IFR
flig
hts
(Dai
ly A
ver
0,0
0,1
0,2
0,3
0,4
0,5
0,6
0,7
0,8
0,9
1,0
Enro
ute
Del
ay (m
inut
es p
er f
a
Peak Day Traffic 1545 1478 1513 1572 1527
Summer Traffic 1017 936 964 1035 1011
Yearly Traffic 733 678 685 717 682
Summer enroute delay (all causes) 0,0 0,2 0,2 0,5 0,3
Yearly enroute delay (all causes) 0,0 0,1 0,1 0,4 0,2
2008 2009 2010 2011 2012
2012 Realisation of Capacity Plan
Average enroute delay per flight decreased from 0.5 minutes in Summer 2011 to 0.2 minutes per flight in Summer 2012. 94% of the delays were for the reason ATC Capacity, and 5% for weather. Capacity Plan +2% Achieved Comments Optimised sector configurations Yes Minor ATC system upgrade Yes Reduce radar separation to 5 NM Yes Route structure improvements Madrid-Baleares Yes Maximum configuration: 7 sectors Yes Summer 2012 performance assessment The ACC capacity baseline was measured with ACCESS/REVERSE CASA at 92, giving the capacity made available during the measured period. During the same period, the peak 1 hour demand was 85, the peak 3 hour demand was 78. A maximum configuration of 7 sectors was opened.
Traffic Evolution (2012 v 2011) Enroute Delay (min. per flight)
Traffic Forecast Palma LECP ACC Current
Routes Shortest Routes
Actual Traffic
All reasons
Delay without weather
ACC Target Delay
ACC Capacity Baseline
(% difference v 2011)
Year -4.7% 0.2 0.2 0.14
Capacity gap?
Summer
H: -4.3% B: -6.3% L: -7.7%
No sig. impact -2.3% 0.3 0.2 0.19 No Offered: 92 (0%)
Allocation of and Reasons for Enroute Delay
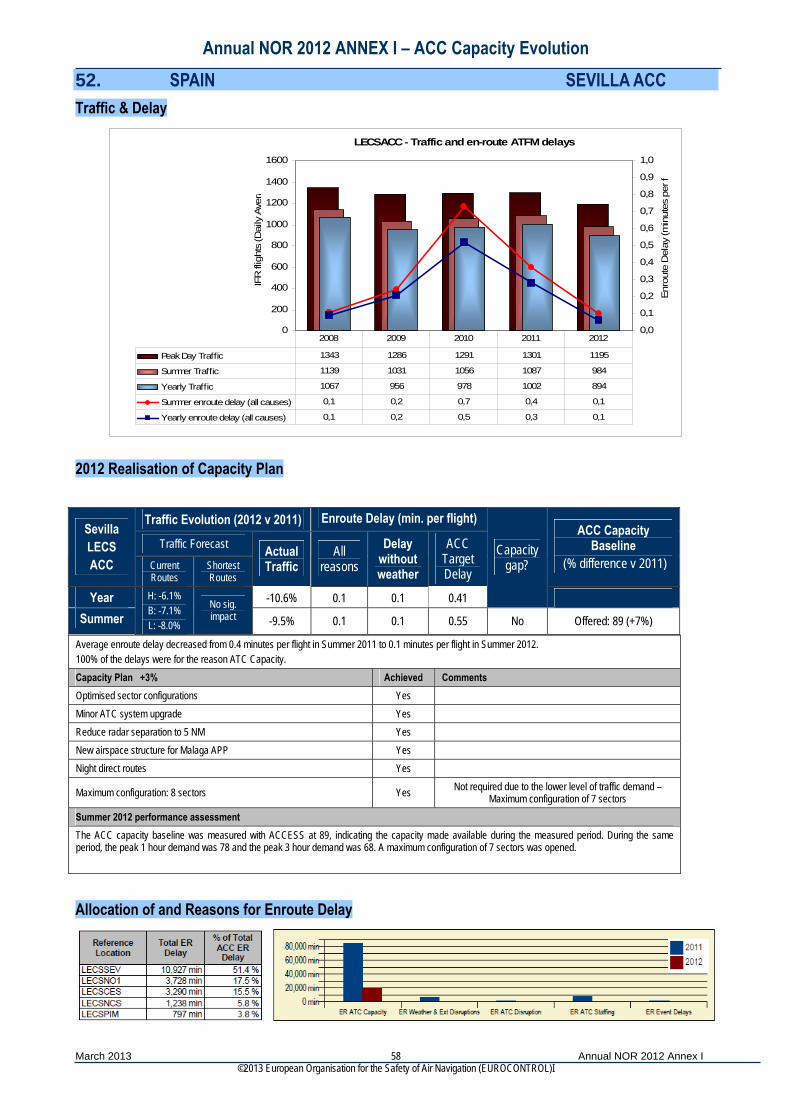
Annual NOR 2012 ANNEX I – ACC Capacity Evolution
March 2013 Annual NOR 2012 Annex I ©2013 European Organisation for the Safety of Air Navigation (EUROCONTROL)I
58
52. SPAIN SEVILLA ACC Traffic & Delay
LECSACC - Traffic and en-route ATFM delays
0
200
400
600
800
1000
1200
1400
1600
IFR
flig
hts
(Dai
ly A
vera
0,0
0,1
0,2
0,3
0,4
0,5
0,6
0,7
0,8
0,9
1,0
Enro
ute
Del
ay (m
inut
es p
er f
Peak Day Traffic 1343 1286 1291 1301 1195
Summer Traffic 1139 1031 1056 1087 984
Yearly Traffic 1067 956 978 1002 894
Summer enroute delay (all causes) 0,1 0,2 0,7 0,4 0,1
Yearly enroute delay (all causes) 0,1 0,2 0,5 0,3 0,1
2008 2009 2010 2011 2012
2012 Realisation of Capacity Plan
Average enroute delay decreased from 0.4 minutes per flight in Summer 2011 to 0.1 minutes per flight in Summer 2012. 100% of the delays were for the reason ATC Capacity. Capacity Plan +3% Achieved Comments Optimised sector configurations Yes Minor ATC system upgrade Yes Reduce radar separation to 5 NM Yes New airspace structure for Malaga APP Yes Night direct routes Yes
Maximum configuration: 8 sectors Yes Not required due to the lower level of traffic demand – Maximum configuration of 7 sectors
Summer 2012 performance assessment The ACC capacity baseline was measured with ACCESS at 89, indicating the capacity made available during the measured period. During the same period, the peak 1 hour demand was 78 and the peak 3 hour demand was 68. A maximum configuration of 7 sectors was opened.
Traffic Evolution (2012 v 2011) Enroute Delay (min. per flight)
Traffic Forecast Sevilla LECS ACC Current
Routes Shortest Routes
Actual Traffic
All reasons
Delay without weather
ACC Target Delay
ACC Capacity Baseline
(% difference v 2011)
Year -10.6% 0.1 0.1 0.41
Capacity gap?
Summer
H: -6.1% B: -7.1% L: -8.0%
No sig. impact -9.5% 0.1 0.1 0.55 No Offered: 89 (+7%)
Allocation of and Reasons for Enroute Delay
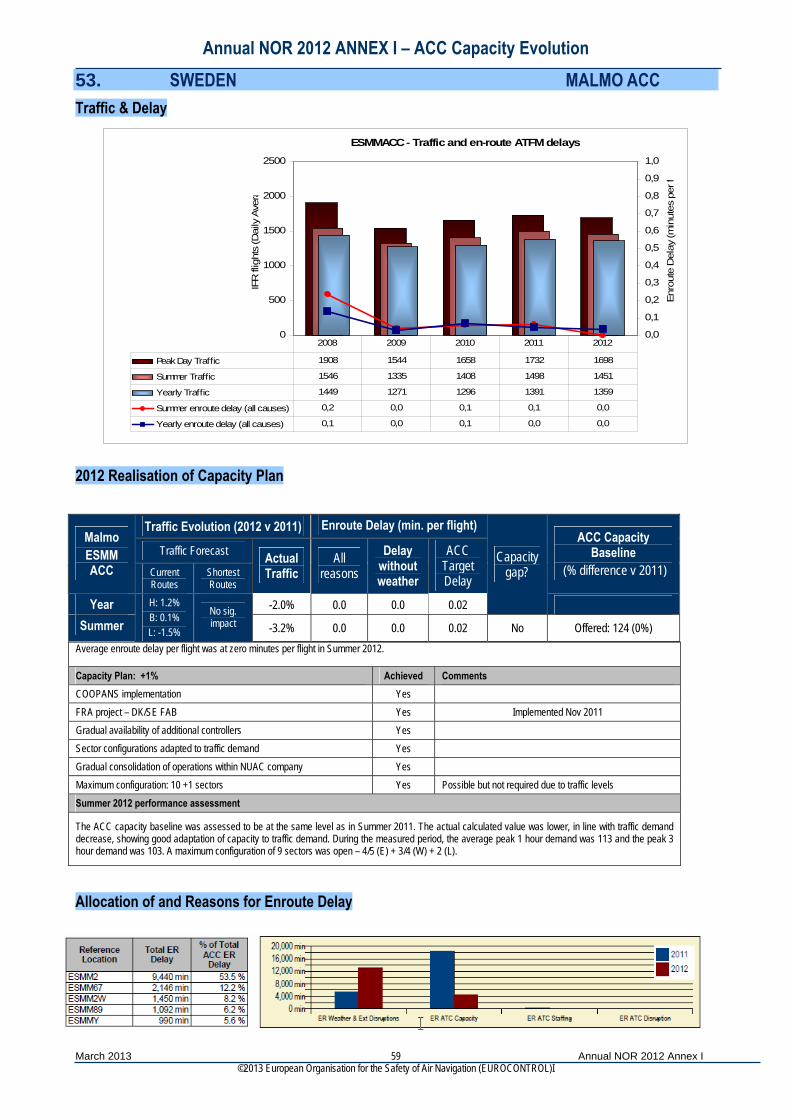
Annual NOR 2012 ANNEX I – ACC Capacity Evolution
March 2013 Annual NOR 2012 Annex I ©2013 European Organisation for the Safety of Air Navigation (EUROCONTROL)I
59
53. SWEDEN MALMO ACC Traffic & Delay
ESMMACC - Traffic and en-route ATFM delays
0
500
1000
1500
2000
2500
IFR
flig
hts
(Dai
ly A
vera
0,0
0,1
0,2
0,3
0,4
0,5
0,6
0,7
0,8
0,9
1,0
Enro
ute
Del
ay (m
inut
es p
er f
Peak Day Traffic 1908 1544 1658 1732 1698
Summer Traffic 1546 1335 1408 1498 1451
Yearly Traffic 1449 1271 1296 1391 1359
Summer enroute delay (all causes) 0,2 0,0 0,1 0,1 0,0
Yearly enroute delay (all causes) 0,1 0,0 0,1 0,0 0,0
2008 2009 2010 2011 2012
2012 Realisation of Capacity Plan
Average enroute delay per flight was at zero minutes per flight in Summer 2012.
Capacity Plan: +1% Achieved Comments COOPANS implementation Yes FRA project – DK/SE FAB Yes Implemented Nov 2011 Gradual availability of additional controllers Yes Sector configurations adapted to traffic demand Yes Gradual consolidation of operations within NUAC company Yes Maximum configuration: 10 +1 sectors Yes Possible but not required due to traffic levels Summer 2012 performance assessment
The ACC capacity baseline was assessed to be at the same level as in Summer 2011. The actual calculated value was lower, in line with traffic demand decrease, showing good adaptation of capacity to traffic demand. During the measured period, the average peak 1 hour demand was 113 and the peak 3 hour demand was 103. A maximum configuration of 9 sectors was open – 4/5 (E) + 3/4 (W) + 2 (L).
Traffic Evolution (2012 v 2011) Enroute Delay (min. per flight)
Traffic Forecast Malmo ESMM ACC Current
Routes Shortest Routes
Actual Traffic
All reasons
Delay without weather
ACC Target Delay
ACC Capacity Baseline
(% difference v 2011)
Year -2.0% 0.0 0.0 0.02
Capacity gap?
Summer
H: 1.2% B: 0.1% L: -1.5%
No sig. impact -3.2% 0.0 0.0 0.02 No Offered: 124 (0%)
Allocation of and Reasons for Enroute Delay

Annual NOR 2012 ANNEX I – ACC Capacity Evolution
March 2013 Annual NOR 2012 Annex I ©2013 European Organisation for the Safety of Air Navigation (EUROCONTROL)I
60
54. SWEDEN STOCKHOLM ACC Traffic & Delay
ESOSACC - Traffic and en-route ATFM delays
0
200
400
600
800
1000
1200
1400
1600
1800
IFR
flig
hts
(Dai
ly A
ver
0,0
0,1
0,2
0,3
0,4
0,5
0,6
0,7
0,8
0,9
1,0
Enro
ute
Del
ay (m
inut
es p
er f
a
Peak Day Traffic 1549 1392 1444 1485 1428
Summer Traffic 1157 1040 1069 1133 1090
Yearly Traffic 1129 1028 1021 1094 1062
Summer enroute delay (all causes) 0,0 0,0 0,1 0,2 0,0
Yearly enroute delay (all causes) 0,0 0,0 0,2 0,1 0,0
2008 2009 2010 2011 2012
2012 Realisation of Capacity Plan
Average enroute delay per flight was at zero minutes per flight in Summer 2012.
Capacity Plan: +1% Achieved Comments FRA project – DK/SE FAB Yes
Sector configurations adapted to traffic demand Yes
Gradual availability of additional controllers Yes Gradual consolidation of operations within NUAC company Yes Parallel new routings for arriving traffic to Stockholm area Yes Split of sector 1 (impl. Nov 2011) Yes Maximum configuration: 4 (M) + 3 (N) + 4 (S) Yes Possible but not required due to traffic levels Summer 2012 performance assessment The ACC capacity baseline was assessed to be at the same level as in Summer 2011. The actual calculated value was lower, in line with traffic demand decrease, showing good adaptation of capacity to traffic demand. During the measured period, the average traffic demand was 81 for the peak 1 hour and 73 for the peak 3 hour. A maximum configuration of 9 sectors was opened – 2/3 (M) + 2/3 (N) + 3/4 (S).
Traffic Evolution (2012 v 2011) Enroute Delay (min. per flight)
Traffic Forecast Stockholm
ESOS ACC Current
Routes Shortest Routes
Actual Traffic
All reasons
Delay without weather
ACC Target Delay
ACC Capacity Baseline
(% difference v 2011)
Year -2.7% 0.0 0.0 0.00
Capacity gap?
Summer
H: 1.0% B: 0.6% L: -1.0%
No sig. impact -3.8% 0.0 0.0 0.00 Offered: 112 (0%)
Allocation of and Reasons for Enroute Delay
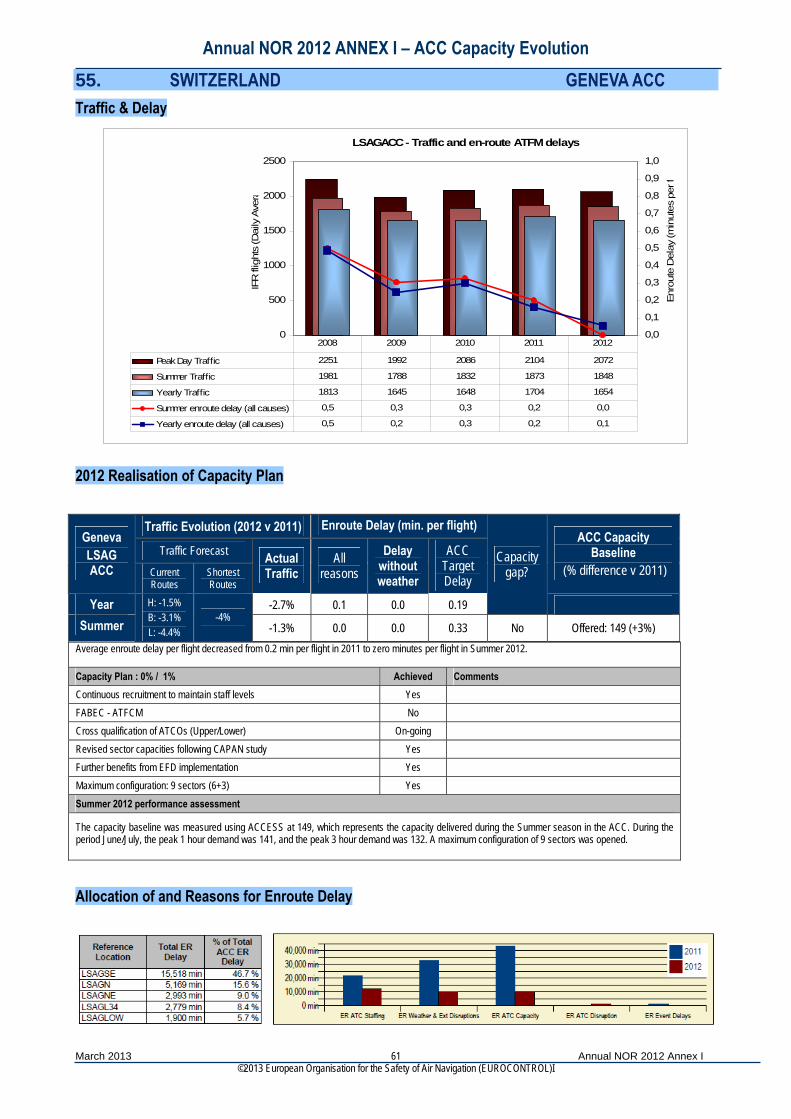
Annual NOR 2012 ANNEX I – ACC Capacity Evolution
March 2013 Annual NOR 2012 Annex I ©2013 European Organisation for the Safety of Air Navigation (EUROCONTROL)I
61
55. SWITZERLAND GENEVA ACC Traffic & Delay
LSAGACC - Traffic and en-route ATFM delays
0
500
1000
1500
2000
2500
IFR
flig
hts
(Dai
ly A
vera
0,0
0,1
0,2
0,3
0,4
0,5
0,6
0,7
0,8
0,9
1,0
Enro
ute
Del
ay (m
inut
es p
er f
Peak Day Traffic 2251 1992 2086 2104 2072
Summer Traffic 1981 1788 1832 1873 1848
Yearly Traffic 1813 1645 1648 1704 1654
Summer enroute delay (all causes) 0,5 0,3 0,3 0,2 0,0
Yearly enroute delay (all causes) 0,5 0,2 0,3 0,2 0,1
2008 2009 2010 2011 2012
2012 Realisation of Capacity Plan
Average enroute delay per flight decreased from 0.2 min per flight in 2011 to zero minutes per flight in Summer 2012. Capacity Plan : 0% / 1% Achieved Comments Continuous recruitment to maintain staff levels Yes FABEC - ATFCM No Cross qualification of ATCOs (Upper/Lower) On-going Revised sector capacities following CAPAN study Yes Further benefits from EFD implementation Yes Maximum configuration: 9 sectors (6+3) Yes Summer 2012 performance assessment
The capacity baseline was measured using ACCESS at 149, which represents the capacity delivered during the Summer season in the ACC. During the period June/July, the peak 1 hour demand was 141, and the peak 3 hour demand was 132. A maximum configuration of 9 sectors was opened.
Traffic Evolution (2012 v 2011) Enroute Delay (min. per flight)
Traffic Forecast Geneva LSAG ACC Current
Routes Shortest Routes
Actual Traffic
All reasons
Delay without weather
ACC Target Delay
ACC Capacity Baseline
(% difference v 2011)
Year -2.7% 0.1 0.0 0.19
Capacity gap?
Summer
H: -1.5% B: -3.1% L: -4.4%
-4% -1.3% 0.0 0.0 0.33 No Offered: 149 (+3%)
Allocation of and Reasons for Enroute Delay
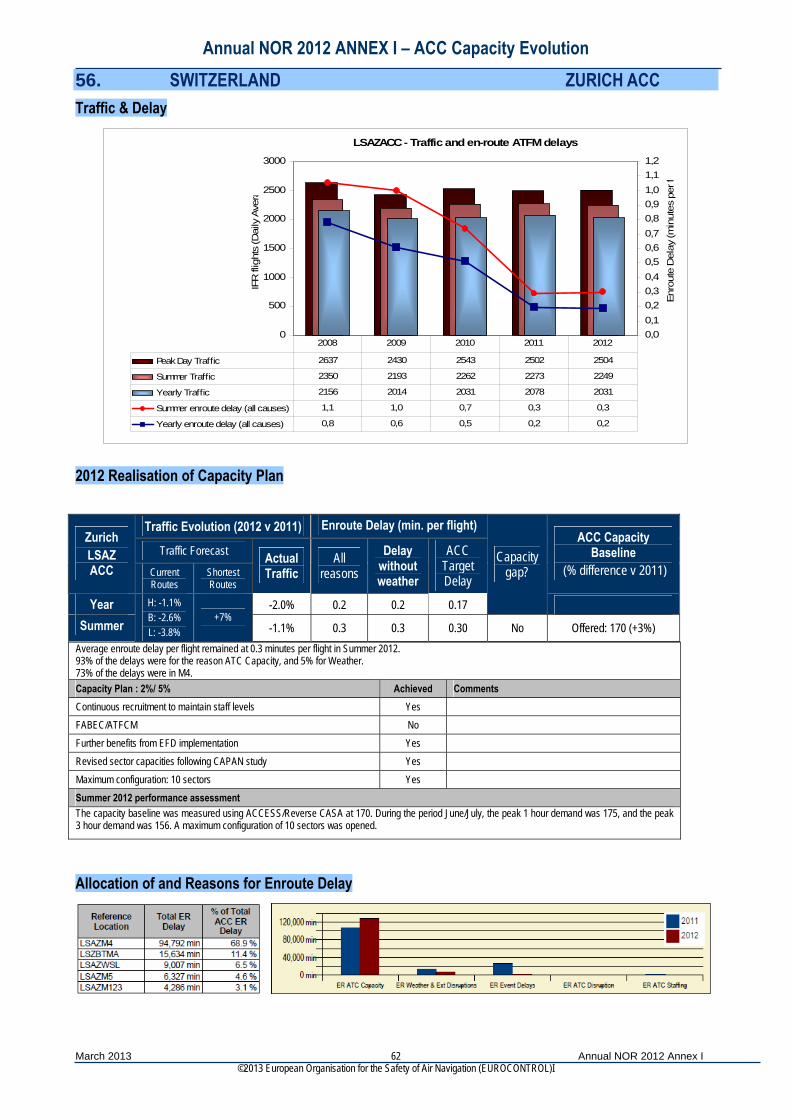
Annual NOR 2012 ANNEX I – ACC Capacity Evolution
March 2013 Annual NOR 2012 Annex I ©2013 European Organisation for the Safety of Air Navigation (EUROCONTROL)I
62
56. SWITZERLAND ZURICH ACC Traffic & Delay
LSAZACC - Traffic and en-route ATFM delays
0
500
1000
1500
2000
2500
3000
IFR
flig
hts
(Dai
ly A
vera
0,00,10,20,30,40,50,60,70,80,91,01,11,2
Enro
ute
Del
ay (m
inut
es p
er f
Peak Day Traffic 2637 2430 2543 2502 2504
Summer Traffic 2350 2193 2262 2273 2249
Yearly Traffic 2156 2014 2031 2078 2031
Summer enroute delay (all causes) 1,1 1,0 0,7 0,3 0,3
Yearly enroute delay (all causes) 0,8 0,6 0,5 0,2 0,2
2008 2009 2010 2011 2012
2012 Realisation of Capacity Plan
Average enroute delay per flight remained at 0.3 minutes per flight in Summer 2012. 93% of the delays were for the reason ATC Capacity, and 5% for Weather. 73% of the delays were in M4. Capacity Plan : 2%/ 5% Achieved Comments Continuous recruitment to maintain staff levels Yes FABEC/ATFCM No Further benefits from EFD implementation Yes Revised sector capacities following CAPAN study Yes Maximum configuration: 10 sectors Yes Summer 2012 performance assessment The capacity baseline was measured using ACCESS/Reverse CASA at 170. During the period June/July, the peak 1 hour demand was 175, and the peak 3 hour demand was 156. A maximum configuration of 10 sectors was opened.
Traffic Evolution (2012 v 2011) Enroute Delay (min. per flight)
Traffic Forecast Zurich LSAZ ACC Current
Routes Shortest Routes
Actual Traffic
All reasons
Delay without weather
ACC Target Delay
ACC Capacity Baseline
(% difference v 2011)
Year -2.0% 0.2 0.2 0.17
Capacity gap?
Summer
H: -1.1% B: -2.6% L: -3.8%
+7% -1.1% 0.3 0.3 0.30 No Offered: 170 (+3%)
Allocation of and Reasons for Enroute Delay
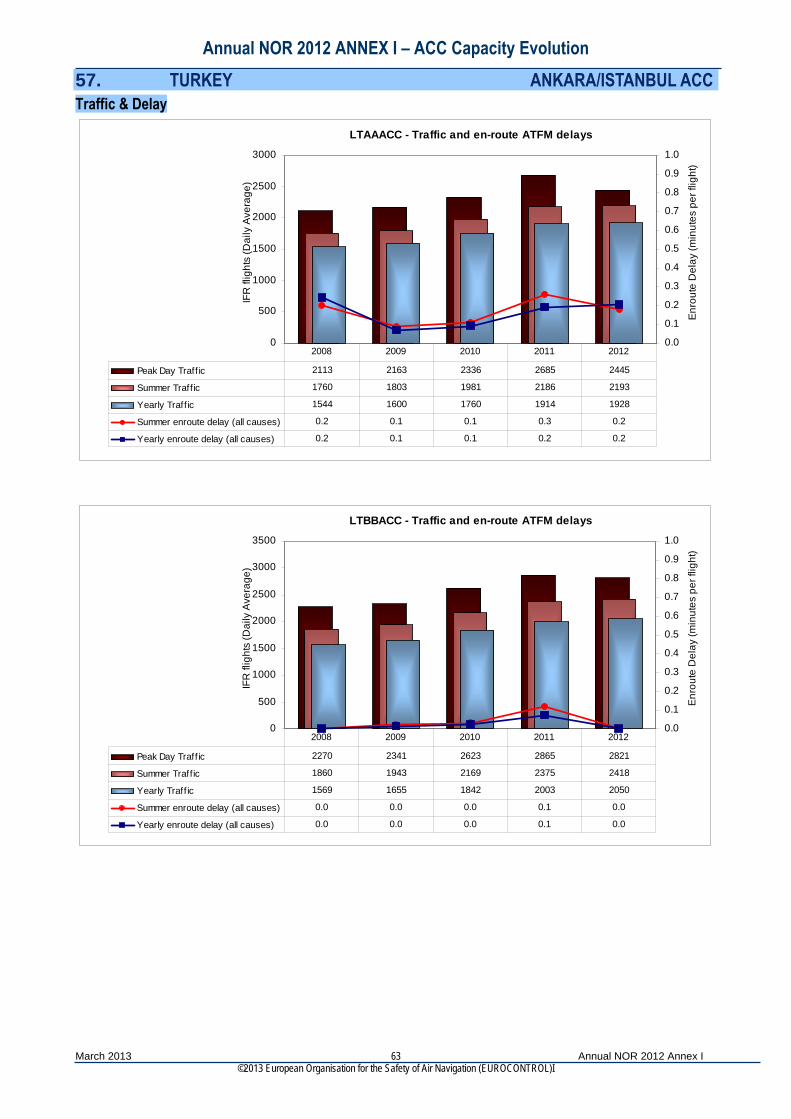
Annual NOR 2012 ANNEX I – ACC Capacity Evolution
March 2013 Annual NOR 2012 Annex I ©2013 European Organisation for the Safety of Air Navigation (EUROCONTROL)I
63
57. TURKEY ANKARA/ISTANBUL ACC Traffic & Delay
LTAAACC - Traffic and en-route ATFM delays
0
500
1000
1500
2000
2500
3000
IFR
flig
hts
(Dai
ly A
vera
ge)
0.0
0.1
0.2
0.3
0.4
0.5
0.6
0.7
0.8
0.9
1.0
Enro
ute
Del
ay (m
inut
es p
er fl
ight
)
Peak Day Traff ic 2113 2163 2336 2685 2445
Summer Traffic 1760 1803 1981 2186 2193
Yearly Traff ic 1544 1600 1760 1914 1928
Summer enroute delay (all causes) 0.2 0.1 0.1 0.3 0.2
Yearly enroute delay (all causes) 0.2 0.1 0.1 0.2 0.2
2008 2009 2010 2011 2012
LTBBACC - Traffic and en-route ATFM delays
0
500
1000
1500
2000
2500
3000
3500
IFR
flig
hts
(Dai
ly A
vera
ge)
0.0
0.1
0.2
0.3
0.4
0.5
0.6
0.7
0.8
0.9
1.0
Enro
ute
Del
ay (m
inut
es p
er fl
ight
)
Peak Day Traff ic 2270 2341 2623 2865 2821
Summer Traffic 1860 1943 2169 2375 2418
Yearly Traff ic 1569 1655 1842 2003 2050
Summer enroute delay (all causes) 0.0 0.0 0.0 0.1 0.0
Yearly enroute delay (all causes) 0.0 0.0 0.0 0.1 0.0
2008 2009 2010 2011 2012
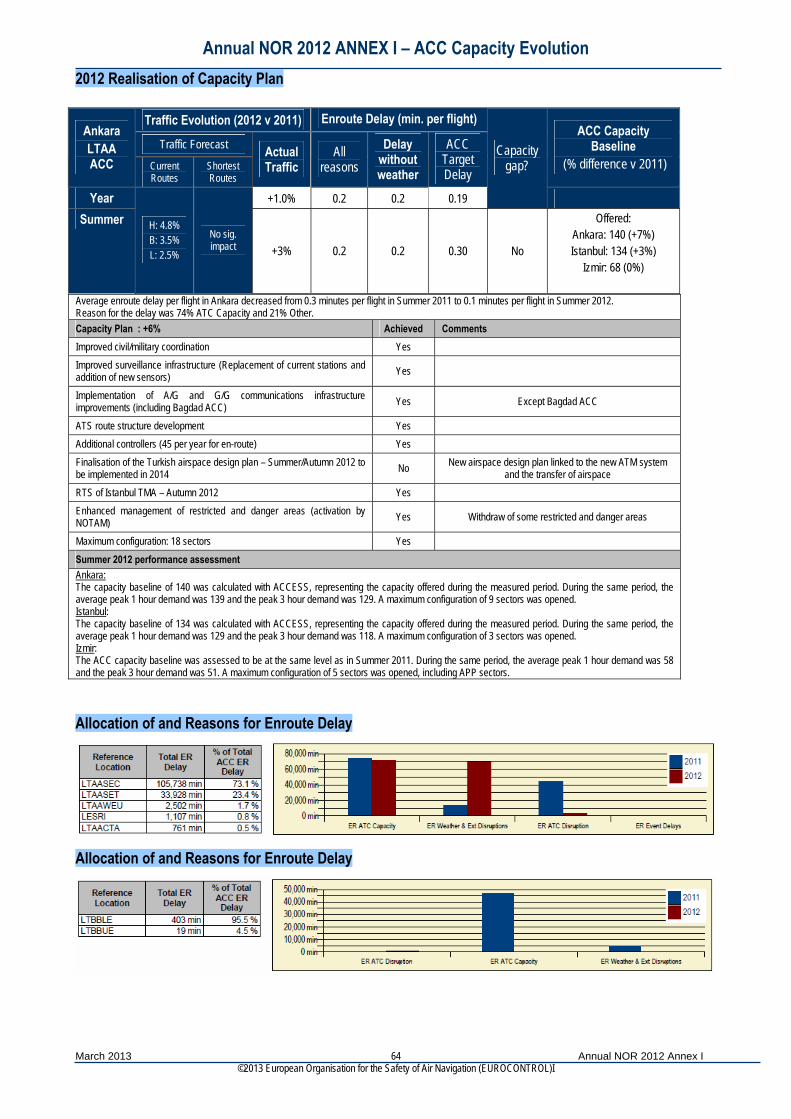
Annual NOR 2012 ANNEX I – ACC Capacity Evolution
March 2013 Annual NOR 2012 Annex I ©2013 European Organisation for the Safety of Air Navigation (EUROCONTROL)I
64
2012 Realisation of Capacity Plan
Average enroute delay per flight in Ankara decreased from 0.3 minutes per flight in Summer 2011 to 0.1 minutes per flight in Summer 2012. Reason for the delay was 74% ATC Capacity and 21% Other. Capacity Plan : +6% Achieved Comments Improved civil/military coordination Yes Improved surveillance infrastructure (Replacement of current stations and addition of new sensors) Yes Implementation of A/G and G/G communications infrastructure improvements (including Bagdad ACC) Yes Except Bagdad ACC
ATS route structure development Yes Additional controllers (45 per year for en-route) Yes Finalisation of the Turkish airspace design plan – Summer/Autumn 2012 to be implemented in 2014 No New airspace design plan linked to the new ATM system
and the transfer of airspace RTS of Istanbul TMA – Autumn 2012 Yes Enhanced management of restricted and danger areas (activation by NOTAM) Yes Withdraw of some restricted and danger areas
Maximum configuration: 18 sectors Yes Summer 2012 performance assessment Ankara: The capacity baseline of 140 was calculated with ACCESS, representing the capacity offered during the measured period. During the same period, the average peak 1 hour demand was 139 and the peak 3 hour demand was 129. A maximum configuration of 9 sectors was opened. Istanbul: The capacity baseline of 134 was calculated with ACCESS, representing the capacity offered during the measured period. During the same period, the average peak 1 hour demand was 129 and the peak 3 hour demand was 118. A maximum configuration of 3 sectors was opened. Izmir: The ACC capacity baseline was assessed to be at the same level as in Summer 2011. During the same period, the average peak 1 hour demand was 58 and the peak 3 hour demand was 51. A maximum configuration of 5 sectors was opened, including APP sectors.
Traffic Evolution (2012 v 2011) Enroute Delay (min. per flight)
Traffic Forecast Ankara LTAA ACC Current
Routes Shortest Routes
Actual Traffic
All reasons
Delay without weather
ACC Target Delay
ACC Capacity Baseline
(% difference v 2011)
Year +1.0% 0.2 0.2 0.19
Capacity gap?
Summer H: 4.8%
B: 3.5% L: 2.5%
No sig. impact +3% 0.2 0.2 0.30 No
Offered: Ankara: 140 (+7%) Istanbul: 134 (+3%)
Izmir: 68 (0%)
Allocation of and Reasons for Enroute Delay
Allocation of and Reasons for Enroute Delay

Annual NOR 2012 ANNEX I – ACC Capacity Evolution
March 2013 Annual NOR 2012 Annex I ©2013 European Organisation for the Safety of Air Navigation (EUROCONTROL)I
65
58. UKRAINE DNIPROPRETROVSK ACC Traffic & Delay
UKDVACC - Traffic and en-route ATFM delays
0
100
200
300
400
500
600
700
800
IFR
flig
hts
(Dai
ly A
ver
0,0
0,1
0,2
0,3
0,4
0,5
0,6
0,7
0,8
0,9
1,0
Enr
oute
Del
ay (m
inut
es p
er f
a
Peak Day Traffic 512 533 527 577 703
Summer Traffic 415 382 443 488 522
Yearly Traffic 364 337 382 422 446
Summer enroute delay (all causes) 0,0 0,0 0,0 0,0 0,0
Yearly enroute delay (all causes) 0,0 0,0 0,0 0,0 0,0
2008 2009 2010 2011 2012
2012 Realisation of Capacity Plan
Average enroute ATFM delay remained at zero, as in Summer 2011. Planned Capacity Increase: sufficient to meet demand Achieved Comments Revised sector configurations according to traffic demand Yes
Installation of new ATM systems in UKCC APP and UKHH APP Partially achieved
ATM systems in UKCC APP is already used ATM systems in UKHH APP is under installation
Implementation of P-RNAV procedures in TMA airspace Yes
Re-definition of sector configurations (DFL change) Yes There was created new sector configuration (it is used as default sector configuration)
Maximum configuration: 4 sectors Yes Summer 2012 performance assessment The ACC capacity baseline was measured using ACCESS. The peak 1 hour demand was 38 flights, indicating that the ACC offered sufficient capacity to meet demand with spare capacity remaining in the system. The peak 3 hour demand was 33. A maximum configuration of 4 sectors was declared open.
Traffic Evolution (2012 v 2011) Enroute Delay (min. per flight)
Traffic Forecast
Dnipro-petrovsk
UKDV ACC Current
Routes Shortest Routes
Actual Traffic
All reasons
Delay without weather
ACC Target Delay
ACC Capacity Baseline
(% difference v 2011)
Year +6.0% 0.0 0.0 0.09
Capacity gap?
Summer
H: 4.0% B: 3.5% L: 2.5%
No sig. impact +6.9% 0.0 0.0 0.13 No Offered: 49 (+4%)

Annual NOR 2012 ANNEX I – ACC Capacity Evolution
March 2013 Annual NOR 2012 Annex I ©2013 European Organisation for the Safety of Air Navigation (EUROCONTROL)I
66
59. UKRAINE KYIV ACC Traffic & Delay
UKBVACC - Traffic and en-route ATFM delays
0
200
400
600
800
1000
1200
IFR
flig
hts
(Dai
ly A
ver
0,0
0,1
0,2
0,3
0,4
0,5
0,6
0,7
0,8
0,9
1,0
Enro
ute
Del
ay (m
inut
es p
er f
a
Peak Day Traffic 743 721 789 876 1099
Summer Traffic 622 549 630 713 754
Yearly Traffic 550 498 549 626 650
Summer enroute delay (all causes) 0,0 0,0 0,1 0,0 0,0
Yearly enroute delay (all causes) 0,0 0,0 0,1 0,0 0,0
2008 2009 2010 2011 2012
2012 Realisation of Capacity Plan
Average enroute ATFM delay decreased from 0.1 min per flight in 2011 to zero min per flight in 2012.
Planned Capacity Increase: Sufficient to meet demand Achieved Comments Revised sector configurations according to traffic demand Yes Modernization of ATM system Yes Implementation of P-RNAV procedures in UKBV TMA airspace Yes Re-sectorisation of TMA airspace (according to SOIR procedure in UKBB) Yes
Maximum configuration: 6 sectors Yes There was created 7 sector configuration. It was used due to special event (final of EURO2012)
Summer 2012 performance assessment The ACC capacity baseline was assessed to be at the same level as in Summer 2011. The peak 1 hour demand was 57 flights, indicating that the ACC offered sufficient capacity to meet demand with spare capacity remaining in the system. The peak 3 hour demand was 51 flights. During the measured period a 7 sector maximum configuration was declared open.
Traffic Evolution (2012 v 2011) Enroute Delay (min. per flight)
Traffic Forecast Kyiv
UKBV ACC Current
Routes Shortest Routes
Actual Traffic
All reasons
Delay without weather
ACC Target Delay
ACC Capacity Baseline
(% difference v 2011)
Year +4.2% 0.0 0.0 0.02
Capacity gap?
Summer
H: 2.7% B: 1.6% L: 0.9%
No sig. impact +5.7% 0.0 0.0 0.04 No Offered: 72 (0%)
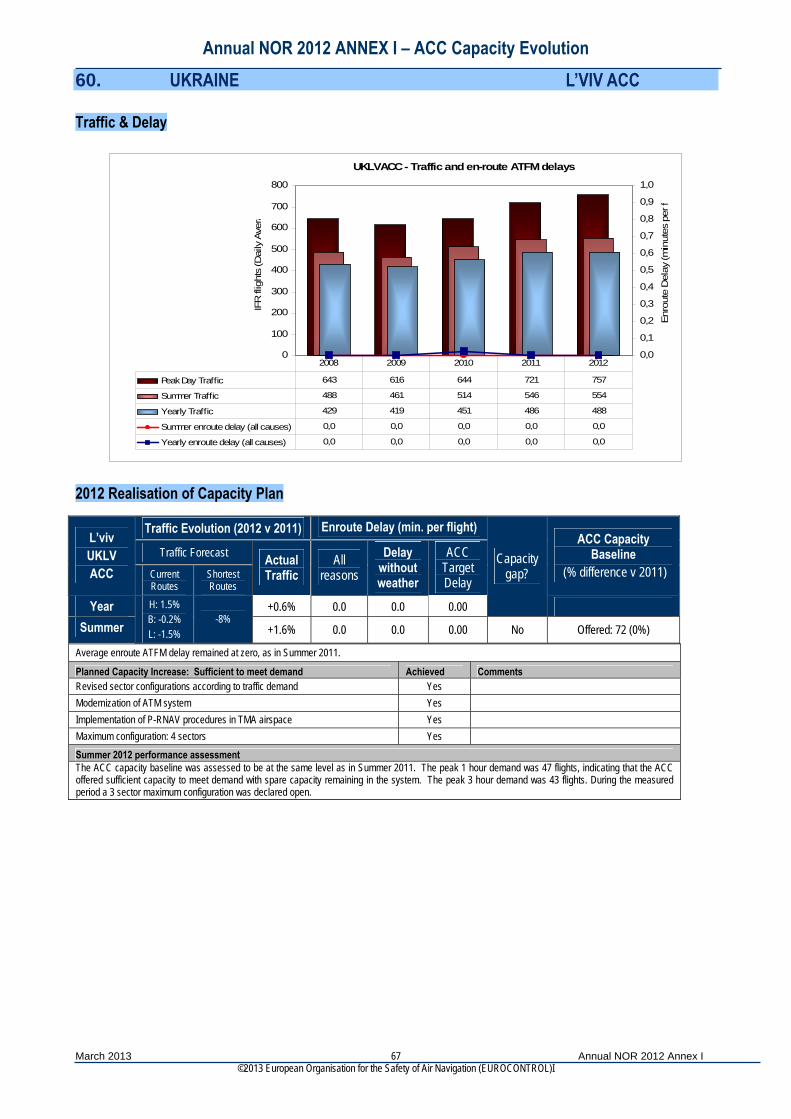
Annual NOR 2012 ANNEX I – ACC Capacity Evolution
March 2013 Annual NOR 2012 Annex I ©2013 European Organisation for the Safety of Air Navigation (EUROCONTROL)I
67
60. UKRAINE L’VIV ACC Traffic & Delay
UKLVACC - Traffic and en-route ATFM delays
0
100
200
300
400
500
600
700
800
IFR
flig
hts
(Dai
ly A
vera
0,0
0,1
0,2
0,3
0,4
0,5
0,6
0,7
0,8
0,9
1,0
Enro
ute
Del
ay (m
inut
es p
er f
Peak Day Traffic 643 616 644 721 757
Summer Traffic 488 461 514 546 554
Yearly Traffic 429 419 451 486 488
Summer enroute delay (all causes) 0,0 0,0 0,0 0,0 0,0
Yearly enroute delay (all causes) 0,0 0,0 0,0 0,0 0,0
2008 2009 2010 2011 2012
2012 Realisation of Capacity Plan
Average enroute ATFM delay remained at zero, as in Summer 2011.
Planned Capacity Increase: Sufficient to meet demand Achieved Comments Revised sector configurations according to traffic demand Yes Modernization of ATM system Yes Implementation of P-RNAV procedures in TMA airspace Yes Maximum configuration: 4 sectors Yes
Summer 2012 performance assessment The ACC capacity baseline was assessed to be at the same level as in Summer 2011. The peak 1 hour demand was 47 flights, indicating that the ACC offered sufficient capacity to meet demand with spare capacity remaining in the system. The peak 3 hour demand was 43 flights. During the measured period a 3 sector maximum configuration was declared open.
Traffic Evolution (2012 v 2011) Enroute Delay (min. per flight)
Traffic Forecast L’viv UKLV ACC Current
Routes Shortest Routes
Actual Traffic
All reasons
Delay without weather
ACC Target Delay
ACC Capacity Baseline
(% difference v 2011)
Year +0.6% 0.0 0.0 0.00
Capacity gap?
Summer
H: 1.5% B: -0.2% L: -1.5%
-8% +1.6% 0.0 0.0 0.00 No Offered: 72 (0%)
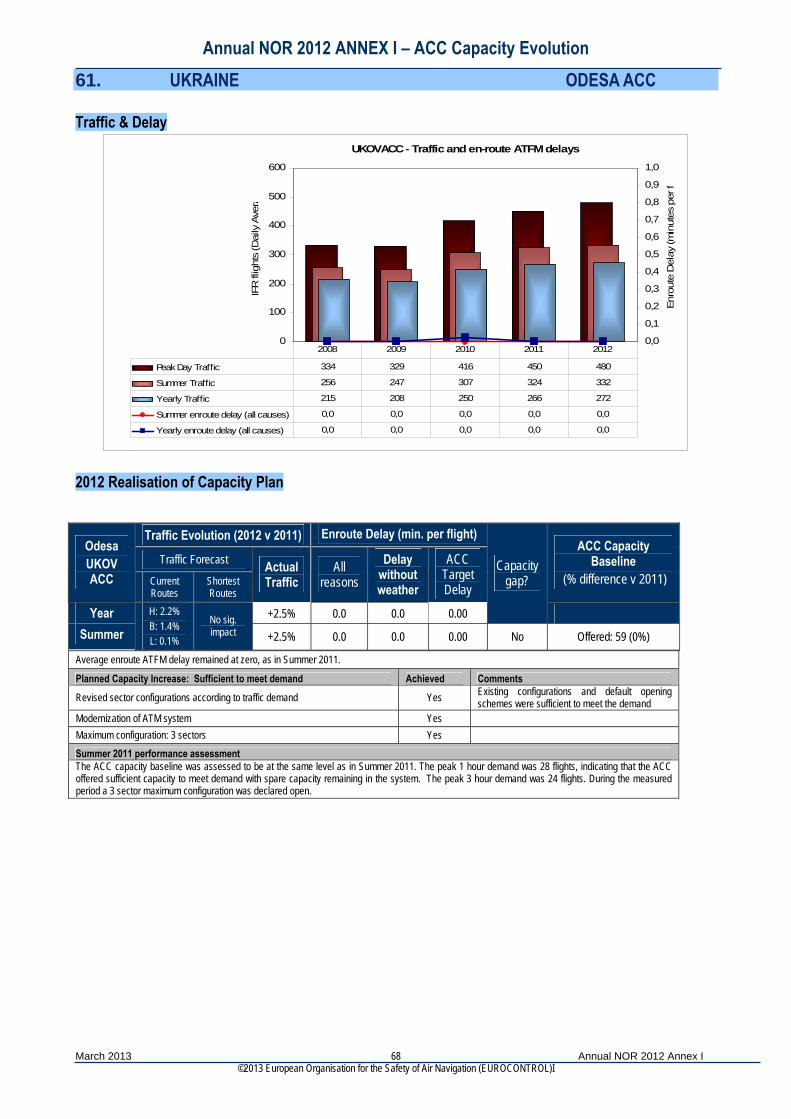
Annual NOR 2012 ANNEX I – ACC Capacity Evolution
March 2013 Annual NOR 2012 Annex I ©2013 European Organisation for the Safety of Air Navigation (EUROCONTROL)I
68
61. UKRAINE ODESA ACC Traffic & Delay
UKOVACC - Traffic and en-route ATFM delays
0
100
200
300
400
500
600
IFR
flig
hts
(Dai
ly A
ver
0,0
0,1
0,2
0,3
0,4
0,5
0,6
0,7
0,8
0,9
1,0
Enro
ute
Del
ay (m
inut
es p
er f
a
Peak Day Traffic 334 329 416 450 480
Summer Traffic 256 247 307 324 332
Yearly Traffic 215 208 250 266 272
Summer enroute delay (all causes) 0,0 0,0 0,0 0,0 0,0
Yearly enroute delay (all causes) 0,0 0,0 0,0 0,0 0,0
2008 2009 2010 2011 2012
2012 Realisation of Capacity Plan
Average enroute ATFM delay remained at zero, as in Summer 2011.
Planned Capacity Increase: Sufficient to meet demand Achieved Comments
Revised sector configurations according to traffic demand Yes Existing configurations and default opening schemes were sufficient to meet the demand
Modernization of ATM system Yes Maximum configuration: 3 sectors Yes
Summer 2011 performance assessment The ACC capacity baseline was assessed to be at the same level as in Summer 2011. The peak 1 hour demand was 28 flights, indicating that the ACC offered sufficient capacity to meet demand with spare capacity remaining in the system. The peak 3 hour demand was 24 flights. During the measured period a 3 sector maximum configuration was declared open.
Traffic Evolution (2012 v 2011) Enroute Delay (min. per flight)
Traffic Forecast Odesa UKOV ACC Current
Routes Shortest Routes
Actual Traffic
All reasons
Delay without weather
ACC Target Delay
ACC Capacity Baseline
(% difference v 2011)
Year +2.5% 0.0 0.0 0.00
Capacity gap?
Summer
H: 2.2% B: 1.4% L: 0.1%
No sig. impact +2.5% 0.0 0.0 0.00 No Offered: 59 (0%)

Annual NOR 2012 ANNEX I – ACC Capacity Evolution
March 2013 Annual NOR 2012 Annex I ©2013 European Organisation for the Safety of Air Navigation (EUROCONTROL)I
69
62. UKRAINE SIMFEROPOL ACC Traffic & Delay
UKFVACC - Traffic and en-route ATFM delays
0
100
200
300
400
500
600
700
800
900
IFR
flig
hts
(Dai
ly A
vera
0,0
0,1
0,2
0,3
0,4
0,5
0,6
0,7
0,8
0,9
1,0
Enro
ute
Del
ay (m
inut
es p
er f
Peak Day Traffic 682 668 804 758 760
Summer Traffic 537 526 648 616 618
Yearly Traffic 481 463 559 544 541
Summer enroute delay (all causes) 0,0 0,0 0,0 0,0 0,0
Yearly enroute delay (all causes) 0,0 0,0 0,0 0,0 0,0
2008 2009 2010 2011 2012
2012 Realisation of Capacity Plan
Average enroute ATFM delay remained at zero, as in Summer 2011.
Planned Capacity Increase: Sufficient to meet demand Achieved Comments
Revised sector configurations according to traffic demand Yes Existing configurations and default opening schemes were sufficient to meet the demand
Maximum configuration: 5 sectors Yes Summer 2012 performance assessment The ACC capacity baseline was assessed to be at the same level as in Summer 2011. The peak 1 hour demand was 46 flights, indicating that the ACC offered sufficient capacity to meet demand with spare capacity remaining in the system. The peak 3 hour demand was 40 flights. During the measured period a 5 sector maximum configuration was declared open.
Traffic Evolution (2012 v 2011) Enroute Delay (min. per flight)
Traffic Forecast Simferopol
UKFV ACC Current
Routes Shortest Routes
Actual Traffic
All reasons
Delay without weather
ACC Target Delay
ACC Capacity Baseline
(% difference v 2011)
Year -0.3% 0.0 0.0 0.01
Capacity gap?
Summer
H: 3.4% B: 2.7% L: 1.5%
-17% +0.4% 0.0 0.0 0.01 No Offered: 75 (0%)

Annual NOR 2012 ANNEX I – ACC Capacity Evolution
March 2013 Annual NOR 2012 Annex I ©2013 European Organisation for the Safety of Air Navigation (EUROCONTROL)I
70
63. UNITED KINGDOM LONDON ACC Traffic & Delay
EGTTACC - Traffic and en-route ATFM delays
0
1000
2000
3000
4000
5000
6000
7000
IFR
flig
hts
(Dai
ly A
ver
0,0
0,1
0,2
0,3
0,4
0,5
0,6
0,7
0,8
0,9
1,0
Enro
ute
Del
ay (m
inut
es p
er f
a
Peak Day Traffic 6644 6046 6014 6180 6028
Summer Traffic 5971 5457 5408 5499 5426
Yearly Traffic 5430 4982 4800 4971 4894
Summer enroute delay (all causes) 0,8 0,3 0,1 0,3 0,1
Yearly enroute delay (all causes) 0,6 0,2 0,1 0,2 0,1
2008 2009 2010 2011 2012
2012 Realisation of Capacity Plan
Average enroute delay per flight decreased from 0.3 minutes per flight in Summer 2011 to 0.1 minutes per flight in Summer 2012 (May to October inclusive). 37% of delays were due to ATC Capacity, 12% to ATC Staffing and 49% to Weather. NATS attributable average en-route delay per flight decreased from 10 seconds in Summer 2011 to 2 seconds in Summer 2012. Capacity Plan +3% Achieved Comments Traffic Management Improvements Yes Adaptation of sector configurations to demand Yes Flexible use of existing staff (including cross-sector training) more closely related to sector demand Yes Improved ATFCM Yes Complexity reduction and improved traffic presentation between sectors / ANSPs Yes iFACTS Yes UK / Ireland FAB initiatives Yes Airspace & traffic management of arrangements for Olympic games Yes Maximum configuration: 19 sectors Yes Summer 2012 performance assessment The capacity of 390 was calculated with ACCESS. During the period June/July, the peak hour demand was 396, the peak 3 hour demand was 358. A maximum 19 sector configuration was opened.
Traffic Evolution (2012 v 2011) Enroute Delay (min. per flight)
Traffic Forecast London EGTT ACC Current
Routes Shortest Routes
Actual Traffic
All reasons
Delay without weather
ACC Target Delay
ACC Capacity Baseline
(% difference v 2011)
Year -1.3% 0.1 0.0 0.22
Capacity gap?
Summer
H: -0.3% B: -1.3% L: -2.1%
No sig. impact -1.3% 0.1 0.05 0.39 No Offered: 390 (+5%)
Allocation of and Reasons for Enroute Delay
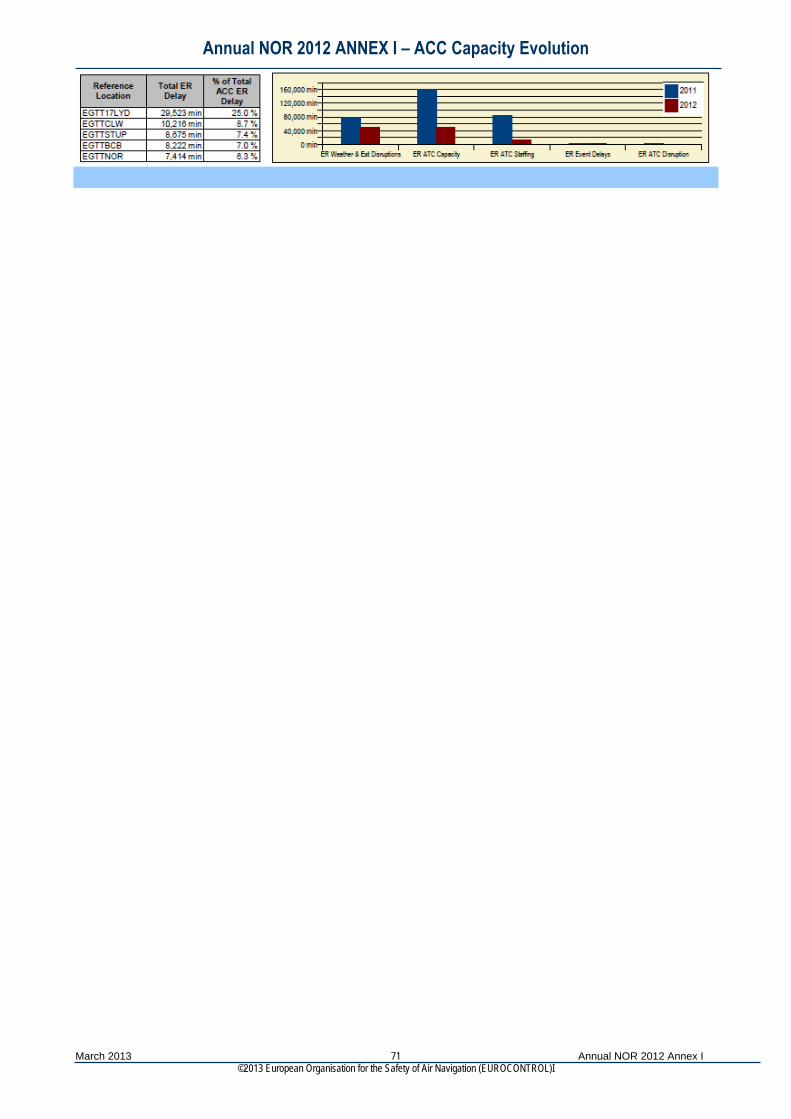
Annual NOR 2012 ANNEX I – ACC Capacity Evolution
March 2013 Annual NOR 2012 Annex I ©2013 European Organisation for the Safety of Air Navigation (EUROCONTROL)I
71

Annual NOR 2012 ANNEX I – ACC Capacity Evolution
March 2013 Annual NOR 2012 Annex I ©2013 European Organisation for the Safety of Air Navigation (EUROCONTROL)I
72
64. UNITED KINGDOM LONDON TC Traffic & Delay
EGTTTC - Traffic and en-route ATFM delays
0
500
1000
1500
2000
2500
3000
3500
4000
4500
5000
IFR
flig
hts
(Dai
ly A
vera
0,0
0,1
0,2
0,3
0,4
0,5
0,6
0,7
0,8
0,9
1,0
Enro
ute
Del
ay (m
inut
es p
er f
Peak Day Traffic 4568 4151 4015 4133 4059
Summer Traffic 4053 3716 3635 3680 3663
Yearly Traffic 3780 3480 3318 3420 3386
Summer enroute delay (all causes) 0,6 0,1 0,0 0,0 0,0
Yearly enroute delay (all causes) 0,8 0,3 0,0 0,0 0,0
2008 2009 2010 2011 2012
2012 Realisation of Capacity Plan
Average enroute delay per flight remained at zero minutes per flight in Summer 2012. NATS attributable average enroute delay per flight was unchanged at 1 second in Summer 2012 compared with Summer 2011.
Capacity Plan +1% Achieved Comments Traffic Management Improvements Yes Adaptation of sector configurations to demand Yes Flexible use of existing staff Yes Improved ATFCM Yes Airspace & traffic management of arrangements for Olympic games Yes Complexity reduction and improved traffic presentation between sectors / ANSPs Yes Maximum configuration: 22 sectors Yes 14 ENR + 8 APP Summer 2012 performance assessment The ACC capacity baseline was assessed to be at the same level as in Summer 2011. During the period June/July, the peak hour demand was 270, the peak 3 hour demand was 247. A maximum configuration of 22 sectors was opened.
Traffic Evolution (2012 v 2011) Enroute Delay (min. per flight)
Traffic Forecast London EGTT
TC Current Routes
Shortest Routes
Actual Traffic
All reasons
Delay without weather
ACC Target Delay
ACC Capacity Baseline
(% difference v 2011)
Year -0.7% 0.0 0.0 0.11
Capacity gap?
Summer
H: -0.5% B: -1.2% L: -2.0%
No sig. impact -0.4% 0.0 0.0 0.17 No Offered: 276 (0%)
Allocation of and Reasons for Enroute Delay
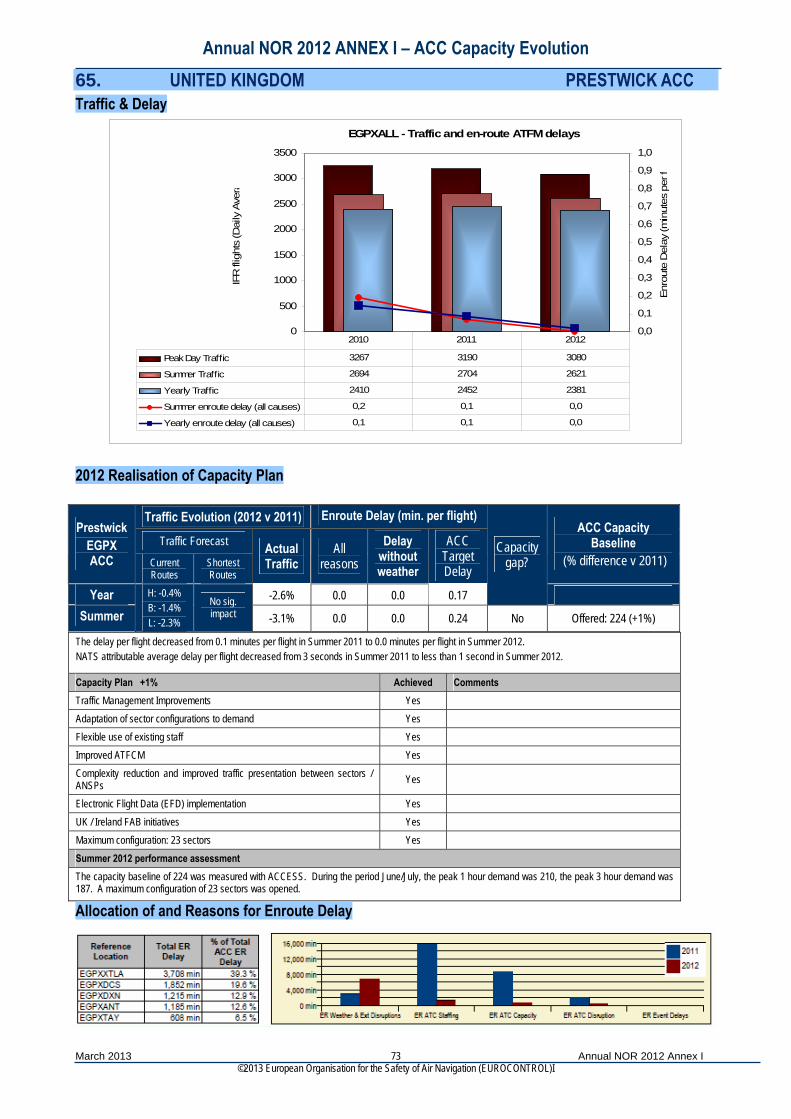
Annual NOR 2012 ANNEX I – ACC Capacity Evolution
March 2013 Annual NOR 2012 Annex I ©2013 European Organisation for the Safety of Air Navigation (EUROCONTROL)I
73
65. UNITED KINGDOM PRESTWICK ACC Traffic & Delay
EGPXALL - Traffic and en-route ATFM delays
0
500
1000
1500
2000
2500
3000
3500
IFR
flig
hts
(Dai
ly A
ver
0,0
0,1
0,2
0,3
0,4
0,5
0,6
0,7
0,8
0,9
1,0
Enro
ute
Del
ay (m
inut
es p
er f
a
Peak Day Traffic 3267 3190 3080
Summer Traffic 2694 2704 2621
Yearly Traffic 2410 2452 2381
Summer enroute delay (all causes) 0,2 0,1 0,0
Yearly enroute delay (all causes) 0,1 0,1 0,0
2010 2011 2012
2012 Realisation of Capacity Plan
The delay per flight decreased from 0.1 minutes per flight in Summer 2011 to 0.0 minutes per flight in Summer 2012. NATS attributable average delay per flight decreased from 3 seconds in Summer 2011 to less than 1 second in Summer 2012.
Capacity Plan +1% Achieved Comments Traffic Management Improvements Yes Adaptation of sector configurations to demand Yes Flexible use of existing staff Yes Improved ATFCM Yes Complexity reduction and improved traffic presentation between sectors / ANSPs Yes Electronic Flight Data (EFD) implementation Yes UK / Ireland FAB initiatives Yes Maximum configuration: 23 sectors Yes Summer 2012 performance assessment The capacity baseline of 224 was measured with ACCESS. During the period June/July, the peak 1 hour demand was 210, the peak 3 hour demand was 187. A maximum configuration of 23 sectors was opened.
Traffic Evolution (2012 v 2011) Enroute Delay (min. per flight)
Traffic Forecast Prestwick
EGPX ACC Current
Routes Shortest Routes
Actual Traffic
All reasons
Delay without weather
ACC Target Delay
ACC Capacity Baseline
(% difference v 2011)
Year -2.6% 0.0 0.0 0.17
Capacity gap?
Summer
H: -0.4% B: -1.4% L: -2.3%
No sig. impact -3.1% 0.0 0.0 0.24 No Offered: 224 (+1%)
Allocation of and Reasons for Enroute Delay
Annual NOR 2012 ANNEX I – ACC Capacity Evolution
INTENTIONALLY LEFT BLANK
March 2013 Annual NOR 2012 Annex I ©2013 European Organisation for the Safety of Air Navigation (EUROCONTROL)I
74


