Embed Size (px)
Citation preview

1
Header Header
Footer Footer
Content Content
Six good reasons for choosing
DNB in the new banking
environment
UBS Conference
12 September, Stockholm
Rune Bjerke, CEO of DNB

2
Header Header
Footer Footer
Content Content
Reason 1:
DNB’s Norwegian platform

3
Header Header
Footer Footer
Content Content
Norway- one of the strongest home markets globally
Source: DNB Markets and OECD Economic Outlook, May 2012
2.8
2.1
1.8
1.5
Norway* Sweden Finland Denmark
Average real GDP growth 1990 - 2012
* Mainland
-200
-150
-100
-50
0
50
100
150
General government net financial liabilities
(As percentage of nominal GDP 2012)

4
Header Header
Footer Footer
Content Content
A strong position - Market leader in Norway and leading within selected global industries
Source: DNB Markets
Significant market share Global leader within selected industries
DNB Other
#1 shipping and offshore bank globally
One of the world’s leading seafood banks
A leading international energy bank

5
Header Header
Footer Footer
Content Content
Reason 2:
DNB’s strong track record of competitive returns

6
Header Header
Footer Footer
Content Content
Sustainable achievements
– We have delivered on our promises
15.6
18.7 21.1 21.8 20.8
11.2 3.5
7.7
3 3.4 3.2
1.7
2008 2009 2010 2011 2012 H113
Development in pre-tax operating profit before impairment (NOK billion)
Pre-tax operating profit before impairment Impairment
CAGR:
7.5 %

7
Header Header
Footer Footer
Content Content
Stable returns in spite of an increasing capital base
70.1
89.6 94.9
104
116 118
12.4%
10.6%
13.6%
11.4% 11.2% 11.6%
0,0 %
2,0 %
4,0 %
6,0 %
8,0 %
10,0 %
12,0 %
14,0 %
16,0 %
18,0 %
20,0 %
0
20
40
60
80
100
120
140
2008 2009 2010 2011 2012 2Q 2013
CET1 capital (NOK billion) Return on equity (%)

8
Header Header
Footer Footer
Content Content
Reason 3:
DNB’s favourable funding position

9
Header Header
Footer Footer
Content Content
Highest deposit-to-loan ratio
Source: 2Q 2013 from the financial institutions
50 53
55 58
63
68
75
Deposit-to-loan ratio: DNB (Per cent)
75
70
54
39
58
48
DNB Bank 1 Bank 2 Bank 3 Bank 4 Bank 5
Deposit-to-loan ratio: Nordic banks (Per cent, 2Q13)

10
Header Header
Footer Footer
Content Content
Stable access to long-term funding and decreasing funding costs
Source: DNB Markets
-50
0
50
100
150
200
2007 2008 2009 2010 2011 2012 2013
Indicative Trading Level Spreads NOK
DNB 5Y senior unsecured DNB 5Y covered bonds
5-year senior and covered bonds

11
Header Header
Footer Footer
Content Content
Reason 4:
DNB’s potential for growth in quality earnings

12
Header Header
Footer Footer
Content Content
Stable growth in net interest income
All numbers are in NOK Million
24 197
24 613
25 252
25 887
26 473
26 907
27 216
27 419
28 266
30 June 30 Sept. 31 Dec. 31 March 30 June 30 Sept. 31 Dec. 31 March 30 June
2011 2012 2013
+ 8.3 per cent
+ 9.4 per cent
+ 9.3 per cent
+ 7.8 per cent
+ 5.9 per cent
+ 6.8 per cent

13
Header Header
Footer Footer
Content Content
Still high potential in non-capital-intensive areas
Source: Second quarter report 2013 from the financial institutions
72 63 60 56 56
44
28 37 40 44 44
56
Bank1 DNB Bank2 Bank3 Bank4 Bank5
Net interest income as a percentage of total income (%)
Net other operating income as a percentage of total income (%)

14
Header Header
Footer Footer
Content Content
Several areas with high expected growth
Issuance of non-financial
bonds in Norway at all-time
high in 2012
Norway has the world’s
highest growth in USD
millionaires
Issuance of non-financial bonds
in Norway in NOK million
Jan
Feb
Ma
r
Apr
Ma
y
Jun
Jul
Aug
Sep
Oct
No
v
De
c
2010 2011
2012 2013
64
55,3
Growth potential in the
non-life insurance market
5%
95%
DNB Others
Non-life insurance market
2010 2011
Development in number of USD millionaires,
Norway
6.2% 90 000

15
Header Header
Footer Footer
Content Content
Reason 5:
DNB’s firm actions for cost reductions
16
Header Header
Footer Footer
Content Content
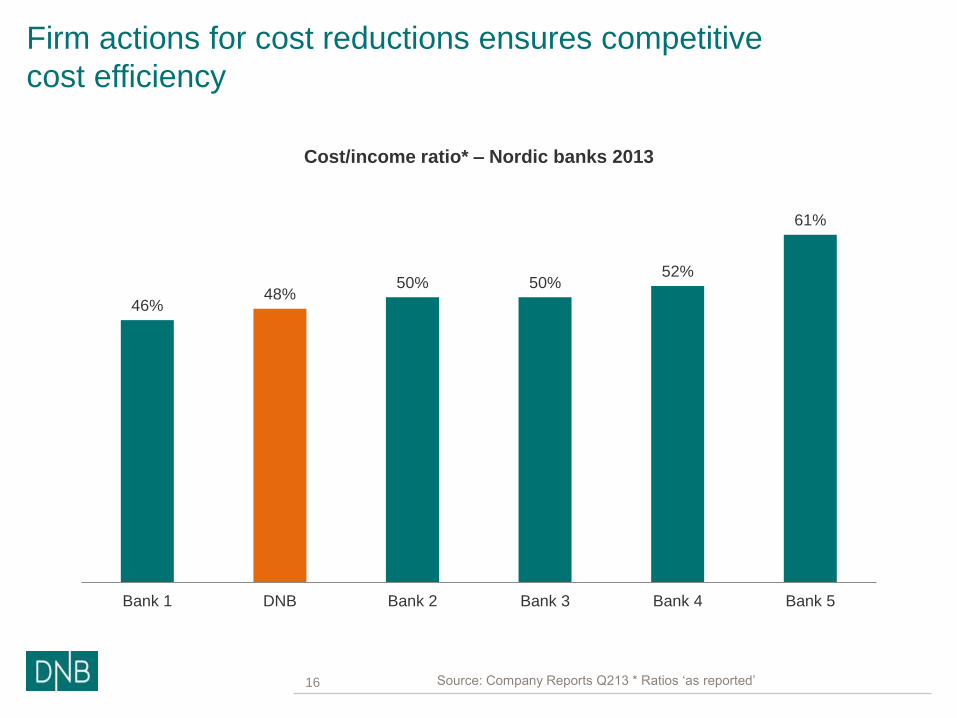
Firm actions for cost reductions ensures competitive
cost efficiency
Source: Company Reports Q213 * Ratios ‘as reported’
46% 48%
50% 50% 52%
61%
Bank 1 DNB Bank 2 Bank 3 Bank 4 Bank 5
Cost/income ratio* – Nordic banks 2013

17
Header Header
Footer Footer
Content Content
Reason 6:
DNB’s solid capital base

18
Header Header
Footer Footer
Content Content
Perceived solidity is not best in class
– different risk weights due to local regulatory requirements
12.1
14.2
17.2 17.8
14.0
DNB Bank 1 Bank 2 Bank 3 Bank 4
Equity Tier 1 ratio Basel III Per cent
Source: Second quarter report 2013 from the financial institutions

19
Header Header
Footer Footer
Content Content
Risk-adjusted capital places us among the most solid banks
Standard and Poor’s 2013
9.42% 8.86%
8.25% 8.22% 8.21% 7.78%
Bank 1 DNB Bank 2 Bank 3 Bank 4 Bank 5
DNB’s risk-adjusted capital versus peers 2013

20
Header Header
Footer Footer
Content Content
|
1
2
Six good reasons for choosing DNB in the
new banking environment
Our “Norwegian” platform
Our strong track record of competitive returns
3
4
5
6 Our solid capital base
Our firm actions for cost reductions
Our potential for growth in quality earnings
Our favourable funding position

21
Header Header
Footer Footer
Content Content
|
Some kind of sum up- that
confirmes that we are creating
values in spite of a low growth
environment