Embed Size (px)
Citation preview

STRUCTURAL BRAIN CHANGES ASSOCIATED WITH DETECTABLE HIV DNA
A THESIS SUBMITTED TO THE GRADUATE DIVISION OF THE UNIVERSITY
OF HAWAI‘I AT MĀNOA IN PARTIAL FULFILLMENT OF THE REQUIREMENTS
FOR THE DEGREE OF
MASTER OF SCIENCE
IN
BIOMEDICAL SCIENCES
DECEMBER 2012
By
Kalpana Juliet Kallianpur Tata
Thesis Committee:
Cecilia Shikuma (Chairperson)
Rosanne Harrigan
Bruce Shiramizu
Dominic Chow
Keywords: HIV, MRI, cognitive impairment, subcortical, insula, perivascular spaces

ii
Acknowledgments
This work was supported by NIH grants U19MH081835, P20RR011091,
U54RR026136 [RMATRIX], U54MD007584 [RMATRIX], R01 NS061696 [V.
Valcour], R01NS053345 [B. Shiramizu]. Many thanks to Dr. Cecilia Shikuma for
mentorship and to Drs. Rosanne Harrigan, Bruce Shiramizu, Victor Valcour and
Dominic Chow for guidance and support. Thank you to Gregory Kirk for helpful
discussions and technical assistance. I also thank the staff at InVision Imaging
and the Hawaii Center for AIDS for support, and the research subjects for their
participation in this study.

iii
List of Tables Part I
Table 1. Demographic and medical characteristics of HIV+ subjects with undetectable
and detectable levels of HIV DNA…………..………………………………….……….…...35
Table 2. Mean cortical thickness for low and high HIV DNA groups in each ROI….......…
…………………………………………………………………………..……………..36
Table 3. Spearman correlation between mean cortical ROI thickness and Grooved
Pegboard test z-scores……………………………………..……………….…..…………....37
Table 4. Mean cortical thickness for low and high HIV DNA groups in each ROI, and
corresponding p-values computed using t-tests………….…………........................…….38
Part II
Table 1. Demographic and clinical characteristics of study participants……..…......…..41
Table 2. Regional brain volumes as percentage of intracranial volume……..……...…..42
Table 3. Brain metabolite ratios………………………………………………….…...…......43

iv
List of Figures
Part I
Figure 1. Significance maps of cortical thinning in group with detectable PBMC HIV
DNA………………………………………………………......................................................39
Figure 2. Locations of the ROIs….…..…….…………….….............................................40
Part II
Figure 1. FreeSurfer’s labeling of subcortical structures……………………………..….. 44
Figure 2. Normalized regional brain volumes for SN, HIV-U and HIV-D groups …..…..45
Figure A-1. MRS voxel locations…………………………………………….………..…......46

v
LIST OF ABBREVIATIONS
AIDS Acquired immune deficiency syndrome
cART Combination antiretroviral therapy
Cho Choline
Cr Creatine
FWM Frontal white matter
Glu Glutamate
HAND HIV-associated neurocognitive disorders
HAART Highly active antiretroviral therapy
HIV Human immunodeficiency virus
HIV DNA HIV deoxyribonucleic acid
HIV RNA HIV ribonucleic acid
D-HIV Detectable HIV DNA
U-HIV Undetectable HIV DNA
ICV Intracranial volume
MRI Magnetic resonance imaging
MRS Magnetic resonance spectroscopy
NAA N-acetylaspartate
PBMC Peripheral blood mononuclear cell
PLSD Protected Least Significant Difference
SN Seronegative
TE Echo time
TR Repetition time
VRS Virchow-Robin space
vi
TABLE OF CONTENTS
Acknowledgments……………………..….............…………………………………………….ii
List of Tables................…………………………………………………………………...........iii
List of Figures................…………………………………………….....……………… ...........iv
List of Abbreviations .......................................……...........................................................v
Preface............................................................................................................................viii
Thesis Introduction....................................................…….................................................1
I. Regional Cortical Thinning Associated with Detectable Levels of HIV DNA
Introduction and Background.............................................................................................1
Materials and Methods ……………...................................................................................4
Subjects ................................................................................................................4
PBMC HIV DNA Assessment ...............................................................................4
Neuropsychological Assessment ..........................................................................5
Structural MRI Data Acquisition ……....................................................................5
Segmentation and Surface Extraction ..................................................................5
Group Analysis…………………………….…………………………………………….6
Statistical Methods……………………………………………..……………………….7
Results ..............................................................................................................................7
Subject characteristics...........................................................................................7
Effect of HIV DNA Group Status on Cortical Thickness ........................................7
Cortical Thinning and Behavioral Effects……………….……………….………….10
Discussion.......................................................................................................................11
Summary and Conclusion................................................................................................14
II. HIV DNA in Peripheral Blood Reservoirs is Associated with Atrophy of Cerebellar
and Subcortical Gray Matter
Introduction and Background.......................................................................................... 15
Materials and Methods ...................................................................................................17
Subjects …….......................................................................................................17
PBMC HIV DNA Assessment .............................................................................18
Neuroimaging ......................................................................................................18
Image Processing…….........................................................................................18
Statistical Methods ..............................................................................................19
Results ............................................................................................................................19

vii
Subject characteristics ....................................................................................................19
HIV Serostatus and Regional Brain Volumes .....................................................19
HIV DNA and Regional Brain Volumes ……………….…………………….………20
HIV Serostatus, HIV DNA and Cerebral Metabolite Ratios ….…………………...21
Discussion.......................................................................................................................21
Summary and Conclusion................................................................................................23
Appendix ………………………………………………………………………………………..23
MRS Imaging Protocol…………………………………………………..…………….23
MRS Data Processing…………………………………………………………………24
Thesis Conclusion...........................................................................................................24
References......................................................................................................................25
Tables and Figures..........................................................................................................35

viii
PREFACE
This thesis is in divided into two parts corresponding to the two aims of the thesis
proposal. The impact of elevated peripheral blood mononuclear cell HIV DNA on brain
structure is assessed: Part I investigates changes in cortical thickness, while Part II
focuses on subcortical gray matter regions and the cerebellum.

1
THESIS INTRODUCTION
In the era of potent antiretroviral therapy, HIV-related neurocognitive dysfunction
remains prevalent although its severest form, HIV dementia, has become less common.
Patients with well-controlled infection often continue to experience neurologic and
cognitive impairment.
HIV neuropathogenesis is incompletely understood. The persistence of cognitive
dysfunction in HIV may be secondary to HIV-infected peripheral blood mononuclear cells
which cross the blood-brain barrier, eventually causing perivascular inflammation and
neuronal injury. Optimal antiretroviral therapy can reduce HIV RNA in plasma to
undetectable levels while failing to eradicate the virus from cellular reservoirs. Circulating
proviral HIV DNA in peripheral blood cells is known to correlate with HIV-related
cognitive deficits.
Although altered brain structure has been linked to HIV-associated neurocognitive
disorders, the relationship of HIV DNA to brain structure has not been previously
examined. This thesis, in a study of antiretroviral-treated HIV-infected individuals with
suppressed plasma HIV RNA, relates brain regional volumes and cortical thickness to
HIV DNA in peripheral blood mononuclear cells. Identifying the association between this
latent viral reservoir and structural brain changes may help to determine the
neuropathogenesis of HIV infection, with possible implications for disease management
and development of new therapies.
I. REGIONAL CORTICAL THINNING ASSOCIATED WITH DETECTABLE LEVELS OF
HIV DNA1
Introduction and Background
In developed countries, highly active antiretroviral therapy (HAART) has transformed
HIV from a subacute, lethal disease to a chronic illness2,3 by dramatically reducing
opportunistic infections and AIDS-related mortality.4 Initiation of HAART suppresses
plasma HIV RNA (viral load) and restores immune function.5 However, despite
decreased incidence of HIV-associated dementia5,6, milder neurocognitive deficits
related to the infection remain a major concern in this population. Prevalence of
cognitive dysfunction in patients on HAART is estimated at 20-37%.6-8 Individuals on

2
HAART, whose plasma viral loads are low or undetectable, are nevertheless susceptible
to HIV-induced neuronal damage9 and/or may suffer impaired cognition.10,11 Although
neurocognitive function can markedly improve with HAART12-15, deficits typically fluctuate
in severity.13,16 One longitudinal study showed that HIV-infected (HIV+) subjects failed to
return to premorbid functioning after three years of treatment.17 HIV-associated
neurocognitive impairment diminishes quality of life even in the era of HAART.18,19
Incomplete cognitive recovery has heightened the need to understand mechanisms of
HIV-associated neurocognitive disorders (HAND). Neuronal damage results primarily
from neurotoxins released by macrophages and microglia20-23 rather than from direct HIV
infection. Plasma HIV RNA (viral load) is typically well controlled by HAART. However,
even with suppression of plasma viremia, HIV-infected cells (including HIV-infected
monocytes) continue to be found in the bloodstream of many individuals. Cell-free
plasma HIV RNA and HIV-infected cells (HIV DNA) appear to play biologically different
and independent roles in HIV pathogenesis.24 HIV-infected monocytes are of particular
interest because they have been implicated in the pathogenesis of HAND.25 Monocytes
are believed to become activated upon exposure to HIV or its components. Activated
monocytes, including those that are infected, cross the blood-brain barrier to accumulate
in perivascular spaces where they initiate microglial activation and inflammatory
processe.26,27 Activated monocytes that transmigrate the blood-brain barrier are
therefore integral to the pathogenesis of HAND.28,29
HIV-infected cells in the bloodstream were quantitated by assessing the amount of HIV
DNA present per 106 peripheral blood mononuclear cells (PBMCs).30 HAART-treated
patients whose plasma viral loads are undetectable by current assays can have
detectable PBMC HIV DNA levels.31 When therapy is initiated, plasma HIV RNA decline
precedes and is steeper than the drop in PBMC HIV DNA.32 HAART reduces HIV DNA
more effectively when initiated early in the course of infection.33,34 PBMC HIV DNA load
may indicate the spread of disease whereas plasma HIV RNA reflects active
infection.35,36
HIV DNA in PBMCs constitutes a viral reservoir that contributes to ongoing neurological
impairment. Detectable PBMC HIV DNA correlates with cognitive dysfunction both in
HAART-naïve individuals37 and in HAART-treated subjects with undetectable plasma

3
HIV RNA.38,39 Recent data suggest that HIV DNA is an independent risk factor for HIV-
associated neurocognitive impairment.40 Activated monocytes that cross the blood-brain
barrier are involved in the pathogenesis of HAND.28,29 HIV DNA likely reflects the
presence of HIV DNA within monocytes (CD14+ cells). Cognitive decline was correlated
with HIV DNA specifically within the activated CD14+ monocyte subset of PBMCs38,41,
indicating that these cells migrate to the brain and set up an environmental milieu that is
primed for neuronal injury.
Studies using brain volumetric magnetic resonance imaging (MRI) show that major
targets for HIV include subcortical gray matter structures (e.g., basal ganglia, thalamus)
and central white matter.42-44 Concomitant widespread cortical atrophy is found in HIV-
infected subjects compared with healthy controls.45,46 Primary sensorimotor cortices are
thinned by about 15%, and prefrontal and parietal gray-matter atrophy is linked with
cognitive and motor impairment.45 Cortical as well as subcortical atrophy persists despite
effective antiretroviral treatment.47,48 HIV-related brain volumetric loss in HAART-treated
patients with suppressed plasma viral load may present a somewhat cortical pattern;
and whereas basal ganglia shrinkage seems most related to current disease status,
cortical and global brain volumes correlate most strongly with disease history variables.47
Cortical involvement (reduced resting blood flow in the visual cortex) was observed via
arterial spin labeling perfusion MRI in HIV+ individuals.49 Proton magnetic resonance
spectroscopy (MRS) reveals HIV-associated cerebral metabolite disturbances; e.g.,
decreased levels of N-acetylaspartate (NAA) that indicate neuronal injury, and increases
in choline and myo-inositol, reflecting inflammation.50-56 Such metabolite abnormalities,
especially loss of NAA, were reported to be significantly associated with both cortical
and subcortical atrophy in HIV, though the relationship between biochemical and
volumetric changes is not well understood.57
While monocyte reservoirs contribute to the continued prevalence of cognitive
dysfunction in HIV infection, the relevance to HAND of lymphocytes, which also migrate
to the brain, is unclear.58,59 In the current work we focus on HIV DNA in PBMCs. Our
MRI-based study examined cortical thickness in HIV+ subjects who had detectable HIV
DNA levels, using as a comparison group HIV+ individuals whose HIV DNA was
undetectable. All participants were on HAART with evidence of viral suppression. We

4
present here what we believe is the first report of a neuroimaging correlate of detectable
HIV DNA in peripheral blood.
Materials and Methods
Subjects
This retrospective study was based on a convenience sample of MRIs from HIV-infected
individuals in a cross-sectional study that explored the relationship of brain metabolites
to PBMC HIV DNA using MRS. Participants with undetectable levels of PBMC HIV DNA
(< 10 copies/106 cells) and detectable HIV DNA (> 10 copies/106 cells) were enrolled.
Each subject provided written informed consent for data and specimens to be utilized for
other studies related to HIV and cognitive dysfunction. The MRS study and ancillary
consent for future use of data and specimens were approved by the University of Hawaii
Committee on Human Studies. All subjects had documented evidence of HIV infection.
Exclusion criteria for the 1H MRS study included any major psychiatric or neurological
disorder, history of head injury with unconsciousness lasting longer than 30 minutes,
learning disability, current substance abuse or dependence as defined by the Diagnostic
and Statistical Manual of Mental Disorders, 4th edition (DSM-IV)60, history of
opportunistic brain infection, primary language other than English, and implanted metal
or other conditions (e.g., claustrophobia) precluding the use of MRI. Subjects underwent
neuroimaging, clinical evaluations, blood draws for assays of PBMC HIV DNA, and
neuropsychological testing from September through October 2008. T1-weighted
magnetic resonance imaging (MRI) was performed as part of the protocol. Specimens
were obtained and stored at the time of study entry. Plasma HIV RNA and CD4 cell
counts were performed by a local commercial CLIA-certified laboratory. Nadir CD4 count
and years since HIV diagnosis were determined by subject self-report.
PBMC HIV DNA Assessment
Blood draws for PBMC HIV DNA copy assays were performed within 30 days of MRI.
The HIV DNA assay was performed as previously reported.30 Its low intra- and inter-
assay variability is indicated by mean coefficients of variation of 1.1% and 1.4%,
respectively. Copy numbers of each sample gene (HIV gag and beta-globin) were
analyzed against the standard curves, and the HIV DNA copy number per 1 X 10⁶ cells
determined. The lower limit of detection of HIV DNA was 10 copies/106 cells, with values
less than 10 copies/106 cells considered undetectable.

5
Neuropsychological Assessment
Neuropsychological testing was conducted within 30 days of MRI in the domains of
psychomotor speed, attention/working memory, and executive function. A research staff
member, trained and supervised by a board-certified neuropsychologist, administered
the Grooved Pegboard Tests (dominant and non-dominant hands), Trail-Making Test
(Parts A and B), Wechsler Adult Intelligence Scale–Revised (WAIS-R) Digit Span
(Forward and Backward), and WAIS-R Digit Symbol Test. Test results were transformed
to z-scores using appropriate age- and education-matched normative data.
Structural MRI Data Acquisition
Structural MRI data were acquired on a 3.0-Tesla Philips Medical Systems Achieva
machine equipped with an 8-channel head coil (InVision Imaging, Honolulu). For each
subject, a high-resolution anatomical volume was acquired with a sagittal T1-weighted
3D turbo field echo (T1W 3D TFE) sequence (echo time TE/repetition time TR = 3.1
ms/6.7 ms; flip angle 8°; slice thickness 1.2 mm with no gap; in-plane resolution 1.0
mm2; field of view 256 x 256 mm2; scan time =10 min 13 sec ). Image files in DICOM
format were transferred to a Linux workstation for morphometric analyses. MRS, T2-
weighted and diffusion tensor imaging were included in the scanning protocol but not
examined here.
Segmentation and Surface Extraction
The T1-weighted structural MRI scans were processed using FreeSurfer v4.5.0
(Athinoula A. Martinos Center for Biomedical Imaging and CorTechs Labs©,
http://www.nmr.mgh.harvard.edu/freesurfer), as described at length in the literature.61-70
Briefly, the automated, computationally intensive procedure includes skull-stripping,
intensity normalization, Talairach transformation, segmentation of subcortical white
matter and deep gray matter structures, and tessellation of the white matter surfaces.
FreeSurfer uses a manually labeled, prior segmentation to disambiguate subcortical
structures. The gray/white surface is deformed outward, following intensity gradients and
a constraint on curvature, to reconstruct the gray matter/cerebrospinal fluid boundary, or
pial surface. The distance between the pial and white matter surfaces yields an estimate
of cortical thickness at each tessellation vertex. This method measures thickness of the
cerebral cortex with great accuracy across the entire brain: the inter-subject standard
deviation of the thickness measure is less than 0.5 mm, enabling detection of focal

6
atrophy in small populations or even individual subjects.66 The automated technique
was validated histologically71 and by manual measurement on MRI sections.72, 73
Automated cortical parcellation was conducted within FreeSurfer using the Destrieux
atlas.74
Group Analysis
Prior to group analysis, the reconstructed cortical surfaces for each study participant
were inspected for defects. FreeSurfer uses a measure of convexity to align the cortical
surfaces and produce an average cortical surface. The measure of convexity is weighted
such that folding pattern features such as the Sylvian fissure fissure that show less
variability across subjects have a higher weighting.68,75 A mapping was thus obtained
between each vertex on the average surface and the corresponding vertex on the
surface of each subject’s cortical reconstruction. The cortical thickness estimates for
each subject were then resampled onto the average surface and smoothed with a 10
mm full-width/half-maximum Gaussian kernel. Subjects with undetectable and detectable
HIV DNA levels constituted the two groups of interest. For each group, a linear
regression model of cortical thickness as a function of age was computed at every vertex
on the surface. The slopes of the lines were constrained to be the same for the two
groups, but the vertical intercepts (representing thickness) were allowed to vary freely in
obtaining the best fit to the data. Statistical significance of the between-group difference
in vertical intercept, while regressing out the effect of age, was then inferred. The
parametric maps directly display this p-value measure of significance.
In order to extract mean cortical thickness values over the extended areas of thinning,
we used FreeSurfer tools to delineate regions of interest (ROIs) on the average surface.
The ROIs encompassed significant (p < 0.01) voxels on the parametric maps and
included all the large regions where cortical thickness differences were identified by
vertex-wise analysis. Each ROI was then mapped to each individual subject’s surfaces,
and mean cortical thickness over the ROI computed for each subject. Nonparametric
statistical testing was subsequently performed on the mean cortical thickness values of
the ROIs.
To summarize, the procedure was as follows: 1) At each point on the average surface,
a linear regression (thickness against age) was performed for each group separately; 2)
at each point on the average surface, we tested the significance of the cortical thickness
7
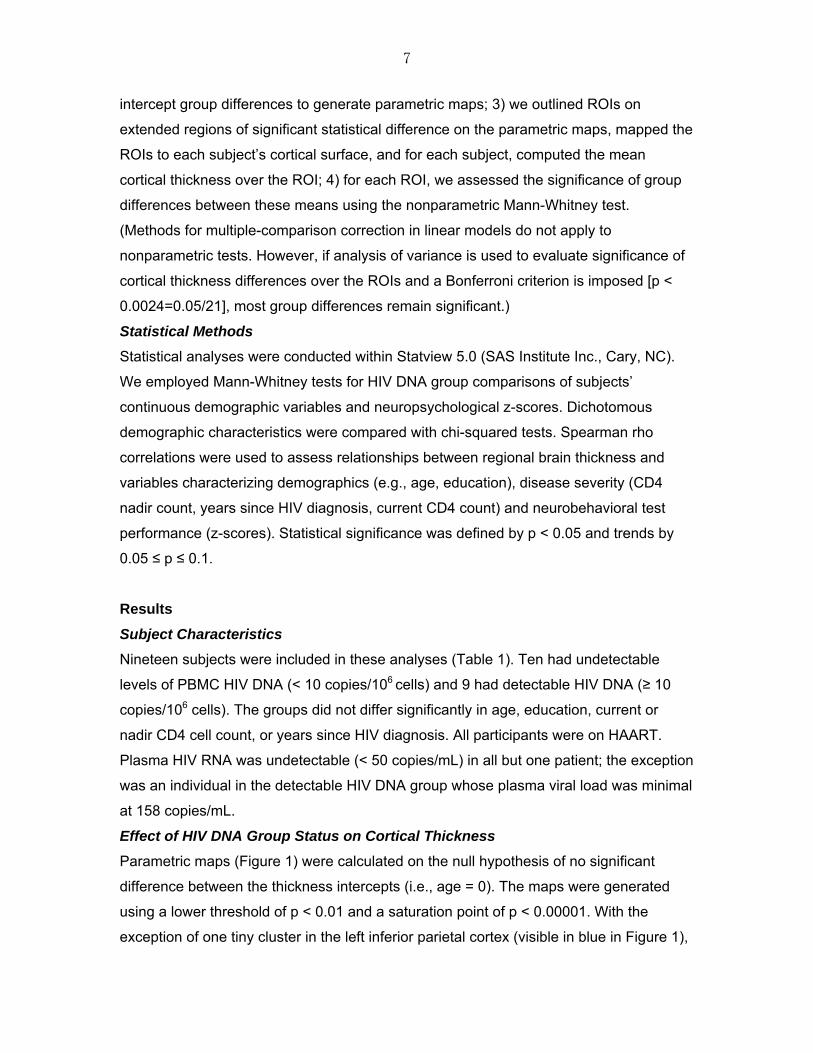
intercept group differences to generate parametric maps; 3) we outlined ROIs on
extended regions of significant statistical difference on the parametric maps, mapped the
ROIs to each subject’s cortical surface, and for each subject, computed the mean
cortical thickness over the ROI; 4) for each ROI, we assessed the significance of group
differences between these means using the nonparametric Mann-Whitney test.
(Methods for multiple-comparison correction in linear models do not apply to
nonparametric tests. However, if analysis of variance is used to evaluate significance of
cortical thickness differences over the ROIs and a Bonferroni criterion is imposed [p <
0.0024=0.05/21], most group differences remain significant.)
Statistical Methods
Statistical analyses were conducted within Statview 5.0 (SAS Institute Inc., Cary, NC).
We employed Mann-Whitney tests for HIV DNA group comparisons of subjects’
continuous demographic variables and neuropsychological z-scores. Dichotomous
demographic characteristics were compared with chi-squared tests. Spearman rho
correlations were used to assess relationships between regional brain thickness and
variables characterizing demographics (e.g., age, education), disease severity (CD4
nadir count, years since HIV diagnosis, current CD4 count) and neurobehavioral test
performance (z-scores). Statistical significance was defined by p < 0.05 and trends by
0.05 ≤ p ≤ 0.1.
Results
Subject Characteristics
Nineteen subjects were included in these analyses (Table 1). Ten had undetectable
levels of PBMC HIV DNA (< 10 copies/106 cells) and 9 had detectable HIV DNA (≥ 10
copies/106 cells). The groups did not differ significantly in age, education, current or
nadir CD4 cell count, or years since HIV diagnosis. All participants were on HAART.
Plasma HIV RNA was undetectable (< 50 copies/mL) in all but one patient; the exception
was an individual in the detectable HIV DNA group whose plasma viral load was minimal
at 158 copies/mL.
Effect of HIV DNA Group Status on Cortical Thickness
Parametric maps (Figure 1) were calculated on the null hypothesis of no significant
difference between the thickness intercepts (i.e., age = 0). The maps were generated
using a lower threshold of p < 0.01 and a saturation point of p < 0.00001. With the
exception of one tiny cluster in the left inferior parietal cortex (visible in blue in Figure 1),

8
all statistically significant voxel clusters showed thinner cortex in the group with
detectable HIV DNA. Guided by these parametric maps, we defined ROIs that coincided
with the regions of most significant cortical thickness change. Clusters with surface area
< 40 mm2 were excluded from analysis. Locations of the ROIs are shown in Figure 2.
Over each ROI, mean cortical thickness was computed for all subjects, and HIV DNA
group differences were assessed using Mann-Whitney tests. Table 2 presents cortical
thickness values for the 21 ROIs. Differences between detectable and undetectable HIV
DNA groups remained statistically significant (p < 0.05) in all ROIs when assessed
nonparametrically. All ROIs demonstrated an association of detectable HIV DNA levels
with cortical thinning. There was no significant Spearman correlation of cortical thickness
with age, education, duration of illness, or current or nadir CD4. Although thickness of
the cortex may not bear a linear relationship to actual HIV DNA burden, and our subjects
with detectable HIV DNA (N=9) were too few for a valid correlation statistic, we state for
completeness that mean cortical thickness did not correlate with HIV DNA level for any
ROI (p > 0.1).
The ROI analysis found the largest and most significant (p < 0.001) regions of cortical
thinning to occur in the bilateral insula (left superior circular insular sulcus, ROI 1, −14%;
right short insular gyrus, ROI 11, −16%). Small areas of right-hemisphere insular cortex
(long and short gyrus and central sulcus, ROI 20) were approximately 10% significantly
thinner in the detectable HIV DNA group. Decreased thickness of right-hemisphere
cingulate cortex was notable in these subjects; the right anterior and mid-anterior
cingulate (ROI 13) was 14% thinner (p = 0.001) when compared with the undetectable
HIV DNA group.
Individuals with detectable HIV DNA demonstrated reduced thickness in frontal and
parietal cortices relative to the comparison subjects. Most affected were the right
superior frontal (ROI 14, p = 0.001) and left rostral middle frontal (ROI 4, p = 0.004)
regions, which were 16% thinner. Significant cortical thinning was found in small areas of
the right hemisphere (pars triangularis, ROI 18: −13%, p = 0.009). We also observed
reduced thickness in orbitofrontal cortex. A large area of the right orbital gyrus and
orbital medial olfactory sulcus (ROI 12) was about 16% thinner in detectable HIV DNA
subjects (p < 0.001). Significant thinning was noted in the left orbital gyrus and H-shaped
sulcus (ROI 5, −12%, p = 0.003).

9
In parietal cortex, the left supramarginal gyrus was significantly affected over both a
large area (ROI 3, −11%, p = 0.001) and a smaller one (ROI 7, −15%, p < 0.001).
Cortical thickness was reduced in the right precuneus (ROI 19, −15%, p = 0.001).
Significant bilateral thinning was present in frontoparietal cortex: in the detectable HIV
DNA group, paracentral gyral and sulcal thickness was decreased by approximately
13% (ROI 15, p < 0.001) in the right hemisphere and by 18% in the left (ROI 9, p =
0.009). Left precentral cortex was 11% thinner (ROI 8, p < 0.001).
Significant thinning associated with detectable HIV DNA occurred bilaterally in temporal
lobes, particularly in the left hemisphere where the spatial extent was large. Cortical
thickness was reduced in the left middle temporal (ROI 2, −19%, p = 0.002) and left
superior temporal/inferior parietal (ROI 3, −11%, p = 0.001) regions. The right temporal
pole had a similar degree of cortical thinning (ROI 16, −12%, p = 0.001). Subjects with
detectable HIV DNA also showed significant thickness reductions in occipitotemporal
cortex. Right-hemisphere fusiform and parahippocampal regions were affected (ROI 17,
−10%, p < 0.001), as were small areas of bilateral fusiform (right: ROI 21, −13%, p =
0.009; left: ROI 10, 19%, p = 0.018).
It is worth noting that as derived by nonparametric statistical methods, the above-
mentioned findings are in fact conservative. Parametric tests upheld the significant main
effects of group; i.e., t-tests yielded significant group differences in ROI cortical
thickness, with p < 0.001 for most regions (Table 4). Large effect sizes (typical Cohen’s
d ~ 2.0) probably enabled the detection of group differences with a small cohort. Most
ROI group differences remained significant when a Bonferroni correction for multiple
comparisons was applied (p < .0.0024 = 5/21). The results (both nonparametric and
parametric) were not skewed by the subject who had detectable HIV RNA, since
excluding this individual from the analysis produced very little change in p-values.
To investigate whether the apparent effects of HIV DNA may be linked to demographic
or clinical factors, we added age, education, duration of illness, current CD4 count and
nadir CD4 count (separately) as independent variables in an analysis of covariance
(ANCOVA). These parameters had non-significant effects on mean cortical thickness for
virtually every ROI (p > 0.05). Moreover, when the covariates were included in the

10
model, effects of HIV DNA group status changed only minimally and did not change from
significant to non-significant for any region. For example, we found no significant or
trend-level effects of nadir or current CD4 count on mean cortical thickness (p > 0.1) for
the largest ROIs in each brain hemisphere (ROI 1-3, 11-15 of Table 4). Age and
education also had no significant effects (p > 0.05). Age affected ROI 1 at trend-level
(p=0.0679), but did not alter the effect of HIV DNA (p=0.0001). Similarly, while education
showed trend effects on ROI 1 (p=0.0701) and ROI 14 (p=0.0915), adjusting for
education resulted in HIV DNA group status becoming slightly more significant
(p<0.0001, ROI 1; p=0.0001, ROI 14). Only duration of illness had a significant effect on
mean cortical thickness in any region (p=0.0472, ROI 14), as inclusion of this variable in
the ANCOVA increased the significance of HIV DNA (p < 0.0001, ROI 14). Therefore,
the significant main effects of HIV DNA category persisted even when disease history,
current disease status or demographics were covaried as potentially confounding
variables, in agreement with the lack of Spearman correlation between these parameters
and ROI cortical thickness,
Cortical Thinning and Behavioral Effects
Using the Mann-Whitney Test, we found a significant HIV DNA group effect on z-scores
for the Grooved Pegboard Test with Dominant Hand (mean = 0.45, undetectable HIV
DNA; mean = −0.51, detectable HIV DNA; p = 0.014). Detectable and undetectable HIV
DNA groups did not perform significantly differently on Digit Symbol, Grooved Pegboard
(Non-Dominant Hand), or Trail-Making A or B Tests.
The relation between mean ROI cortical thickness values and Grooved Pegboard
(Dominant) Test z-scores was explored using Spearman rho correlations (Table 3).
Thinner cortex correlated significantly with poorer test performance (i.e., lower z-scores
or higher peg insertion times) in most of the ROIs, notably the left insula (ROI 1, p =
0.007, ρ = 0.64). We also found moderately strong correlations between lower z-scores
and decreased cortical thickness of other temporal regions (left supramarginal gyrus,
ROI 7: p = 0.007, ρ = 0.63; left fusiform, ROI 10: p = 0.015, ρ = 0.57; right cingulate
gyrus and sulcus, ROI 13: p = 0.015, ρ = 0.58; right temporal pole, ROI 16: p = 0.019,
ρ = 0.55). In parietal cortex, thinning of the right paracentral gyrus and sulcus (ROI 15, p
= 0.003, ρ = 0.71) and the right precuneus (ROI 19, p = 0.009, ρ = 0.62) correlated with
diminished test performance.

11
Discussion
We demonstrated a significant association of regional cortical thinning with detectable
levels of PBMC HIV DNA in virally suppressed HIV+ individuals. The comparison group
comprised age- and education-matched HIV+ subjects with undetectable HIV DNA; we
emphasize that they were not healthy controls. Global thinning of the cortical ribbon was
visually apparent in all study participants. Thus the spatial pattern of gray matter loss
described here is superposed on cortical alterations present in individuals whose viral
DNA is undetectable. Prefrontal and frontoparietal cortices were affected in subjects with
elevated HIV DNA, consistent with prior studies of HIV-related brain atrophy, and we
also detected thinning of temporal gray matter. Of particular interest is the insula, a
structure not previously considered a target of this disease.
Worldwide, both with and without HAART76, impairment of executive function, motor
skills, attention, working memory and speed of information processing tends to be
pronounced in HIV infection.77-80 The specific pattern of cognitive deficits varies greatly
across individuals.77 Under HAART, diminished cognitive ability may not correlate with
plasma HIV RNA levels13,81-85 but is linked to elevated HIV DNA30,86,87, which can persist
in reservoirs despite treatment.32,88,89 Comparing HIV+ subjects who had normal
cognition, minor cognitive motor disorder, and HIV-associated dementia, Shiramizu and
colleagues87 found that the amount of PBMC HIV DNA at study entry was proportional to
HIV-associated neurocognitive impairment in all three groups. Moreover, viral DNA level
was associated with deficits in individual cognitive domains that included motor speed
and working memory. Recognition memory suffered the greatest decline.
In the present cross-sectional study, which employed limited neuropsychological testing,
only Grooved Pegboard (Dominant Hand) Test scores differed significantly between
subjects with undetectable and detectable HIV DNA. Impaired psychomotor speed as
assessed by this task correlated strongly with cortical thinning in multiple affected
regions involved in motor speed, such as the supramarginal gyrus and anterior cingulate
cortex90, or in motor control; e.g., the precuneus.91,92 A larger study may reveal
relationships between cortical alterations and other measures of cognitive function.
Therefore we discuss below the relevance of brain areas identified in this paper to
neurocognitive and motor impairment in the HIV population. Our focus is on regional

12
cortical functions pertaining to the cognitive domains (recognition memory, visuospatial
ability, learning, verbal memory, executive function, working memory, attention and
concentration, visual memory, and language) in which deficits were correlated with
PBMC HIV DNA levels.87
Our study found the largest areas of cortical thinning to be located in the bilateral
anterior insula. The insula is considered a supplementary motor93 or motor association
area.94,95 Left and right anterior insula are linked to vocal motor control of speech
production95,96, respectively, and bilateral insular injury can dramatically disrupt both
verbal and non-verbal communication.97 The role of this structure, however, is
intriguingly complex. Among a vast range of functions, the insula is implicated in
somatosensory perception97, emotional processing99 and self-awareness.100,101 As a
nodal point between limbic and motor systems96, the insula is believed to integrate
autonomic, affective, sensory and cognitive input to create representations of affective
state.102
Thinner insular cortex in our cohort correlated with poorer performance on the Grooved
Pegboard Test for Dominant Hand. This finding is consistent with the insula’s apparent
involvement in paced tasks and oculomotor control103 and hand motor control.98 More
generally, with the right anterior insula implicated as a central node in both dorsal and
ventral attention systems104, an association between elevated HIV DNA and insular
atrophy may manifest itself in various types of neuropsychological deficits (e.g.,
attention, concentration, working memory) among subjects with detectable viral DNA.
Executive function performance is one of the cognitive domains significantly correlated
with higher HIV DNA levels.87 Another is recognition memory. The known effects of
insular lesions include profound deficits in risk assessment102 that have clear
implications for executive functioning. Data from lesions appear to confirm the role of the
insula in executive function105, supporting the somatic marker hypothesis that decision-
making relies on processing and integration of emotionally relevant information.106,107
Functional magnetic resonance imaging (fMRI) studies of healthy volunteers have linked
activation of the anterior insula to decision-making under uncertainty or risk.108,109
Insular atrophy could thus result in executive dysfunction. Damaged insula in individuals
with elevated HIV DNA may also contribute to impaired recognition memory: in a striking

13
cause-and-effect experiment, administration of the muscarinic cholinergic receptor
antagonist scopolamine into the insular cortex of rats produced a deficit in visual object
recognition memory.110
The insula is connected to cingulate cortex, orbitofrontal cortex, the temporal pole and
superior temporal sulcus.93,94,111 In all of these regions we found significantly reduced
cortical thickness in subjects with detectable HIV DNA, atrophy which may have a
bearing on specific neuropsychological deficits. The right caudal anterior cingulate, for
example, has been implicated in error detection.112,113 Impairment of error monitoring, an
executive function, would influence other neurocognitive domains affected by elevated
HIV DNA, such as recognition memory, motor skills and motor speed. Orbitofrontal
cortex also contributes to decision-making.114 Damage to medial orbitofrontal and
anterior cingulate cortex is known to affect judgment and impulse control.115,116
Higher HIV DNA levels correlate with diminished verbal and visual memory87, functions
mediated by the temporal lobe.117,118 We found detectable HIV DNA to be associated
with bilateral thinning of temporal cortex. Cortical thinning of brain regions identified in
our study, including the insula, is exhibited by patients with semantic dementia and
progressive nonfluent aphasia.119
Another site of decreased cortical thickness in our detectable HIV DNA group is the
precuneus, in the posterior medial parietal lobe. The precuneus may participate in brain
networks underlying recognition memory.120 Furthermore, HIV is associated with
significant impairment of parietal-dependent visuospatial skills121, and damage to the
right-hemisphere precuneus linked to loss of navigational ability.122 Data from positron
emission tomography (PET) indicate that navigation may be subserved by a network that
includes the insula and precuneus.123 PET and fMRI results are converging on a central
role of the precuneus in motor and visuospatial imagery.124 Since HIV+ subjects have
shown altered frontoparietal network activation125-127, the pattern of cortical thinning that
we have found may reflect disrupted brain circuitry.
In reviewing the cognitive functions of brain regions implicated in our work, we have
emphasized the largest area, the insula, and touched on only a small fraction of relevant
research. There is a vast literature on substantiated and posited functions of all the
14
affected regions. It is probable that damage to these cortical areas may underlie the
increased burden of neurocognitive deficits seen in individuals with detectable HIV DNA.
Two caveats, however, apply. This cross-sectional study does not permit inference of a
causal relationship between elevated HIV DNA and cortical thinning. Moreover, although
nonparametric and parametric procedures gave similar results, our small sample size
limited the applicability of parametric statistical analysis. A large, carefully designed
study, with the power to include main and interaction effects of all relevant clinical
parameters in a multivariate model, is needed to confirm associations among cortical
thickness, HIV DNA and cognitive function.
Summary and Conclusion
Using a direct, validated measurement of cortical thickness, we have identified a
statistically significant pattern of cortical thinning in subjects with detectable levels of HIV
DNA. Given the prevalence of neurocognitive sequelae present in populations of
HAART-treated HIV+ individuals, the importance of uncovering a neural basis for these
deficits is paramount in the search for effective therapies. The statistical significance of
the cortical thinning pattern, as well as the fact that we found a neuropsychological
testing correlate, lends credence to the results. Much of the affected cortex is located in
the frontal lobe where previous HIV/AIDS research identified the most prevalent
damage. The pattern of cortical thinning presented here, likely related to cognitive
deficits associated with elevated HIV DNA, may indicate disrupted attentional networks
in HIV although the findings extend across regions that possibly comprise a number of
different functional systems. Open questions remain as to whether the changes in
cortical thickness reflect neuronal death or loss of neuropil, and whether they are due to
HIV-related toxins or perhaps to a diaschisis effect (possibly mediated by white matter
destruction) resulting from compromised subcortical brain structures.
HIV DNA may prove a useful marker of HIV-related brain injury and treatment efficacy,
particularly in patients whose plasma HIV RNA levels fall below the detectable threshold.
Our findings support initation of HAART during the primary phase of infection for optimal
depletion of the PBMC HIV DNA reservoir. Obvious limitations of this work are the small
sample size and limited neuropsychological tests. Future longitudinal studies are needed
to confirm our results, and should be conducted using a large study population and
extensive neuropsychological testing. High angular resolution diffusion imaging and

15
resting-state fMRI acquisitions may be useful modalities for investigating white matter
damage and the possible association of detectable HIV DNA levels with altered brain
structural and functional connectivity. Further research should include subset analyses
to localize HIV DNA to monocytes and lymphocytes.
II. HIV DNA IN PERIPHERAL BLOOD RESERVOIRS IS ASSOCIATED WITH
ATROPHY OF CEREBELLAR AND SUBCORTICAL GRAY MATTER
Introduction and Background
Rates of dementia associated with human immunodeficiency virus (HIV) infection have
fallen sharply with the use of combination antiretroviral therapy (cART).1 Yet HIV-
associated neurocognitive disorders (HAND) remain common, with a prevalence
approaching 50%.2 The mechanism whereby suppressed HIV infection can induce
neuronal injury3 and neurocognitive deficits4 remains unclear
Substantial evidence links HIV to brain atrophy both before and after the advent of
cART. Early neuroimaging research found ventricular enlargement and reduced basal
ganglia and white matter volumes to be associated with clinical disease severity and
cognitive dysfunction.5,6 Currently optimal antiretroviral regimens have not halted whole-
brain atrophy7,8 or widespread cortical and white matter loss.9,10 Magnetic resonance
imaging (MRI) reveals shrinkage of the basal ganglia and globus pallidus9,11-13,
thalamus9, hippocampus13, amygdala11 and cerebellum14,15; as well as correlation of
decreased whole-brain parenchymal volume with neuropsychological and motor
impairment.7
Brain chemistry can be assessed with proton (1H) magnetic resonance spectroscopy
(MRS). This technique measures in vivo a localized spectrum of cerebral metabolites,
including N-acetylaspartate (NAA), choline-containing compounds (Cho), myo-inositol
(MI), and glutamate (Glu), all studied in HIV infection.16-20 Found primarily in basal
ganglia and frontal lobe white matter, brain metabolite disturbances generally occur early
and worsen with cognitive decline.21-23 HIV-induced inflammation in the brain precedes
neuronal damage. Increased levels of the inflammatory markers Cho and MI are
observed from early through late stages of the disease and related cognitive

16
dysfunction,21,24-26 whereas NAA, a marker of neuronal density, decreases in advanced
HIV infection.24,25 MRS studies of Glu, a neurotransmitter, have usually measured the
combined signal from brain glutamate and glutamine rather than from glutamate alone.16-
20 Cerebral metabolite abnormalities indicative of inflammation and neuronal injury may
be ameliorated by treatment27 but persist despite cART28,29 as do volumetric changes.29
Incomplete cognitive recovery underscores the need to clarify mechanisms of HAND.
Neuronal damage is caused by neurotoxins released by macrophages and microglia30,
not by direct HIV infection. Cell-free plasma HIV RNA (viral load) and integrated HIV
DNA in HIV-infected cells may play separate roles in the disease.31 Although plasma
viral load is typically suppressed by cART, HIV-infected cells can remain in the
bloodstream. Monocytes that are activated by exposure to the virus, including HIV-
infected monocytes, infiltrate perivascular or Virchow-Robin spaces (VRS). HIV most
likely enters the brain via monocyte-derived macrophages which subsequently initiate
microglial activation and release of neurotoxins.32 Transmigration of the blood-brain
barrier (BBB) by activated monocytes is central to the hypothesized pathogenesis of
HAND.33,34
HIV DNA in peripheral blood mononuclear cells (PBMCs) constitutes a viral reservoir
that may contribute to ongoing neurological impairment. PBMC HIV DNA can be
detected in cART-treated patients whose plasma viral loads are undetectable by current
assays.35 Detectable PBMC HIV DNA was associated with cognitive dysfunction in
cART-naïve individuals36 and in cART-treated subjects with undetectable plasma HIV
RNA.37,38 HIV DNA within the activated CD14+ monocyte subset of PBMCs has been
correlated with neurocognitive decline.37,39 We previously reported a link between
elevated PBMC HIV DNA and thinning of the cortex,40 but the relationship of HIV DNA to
brain structure has been little explored.
In the present study we hypothesized that detectability of PBMC HIV DNA would be
associated with cerebral metabolite abnormalities and with decreased volumes of
subcortical gray matter structures and other brain regions. Structural MRI was used to
obtain volumes of the caudate nucleus, putamen, globus pallidus, thalamus,
hippocampus and amygdala. The nucleus accumbens and brainstem were examined as
well. While few studies have related HIV to volumetric change within these two regions,

17
brainstem atrophy was noted in early HIV infection41 and smaller nucleus accumbens
volume correlated with greater apathy in nondemented HIV patients.42 We also analyzed
volumes of total cortical and subcortical gray matter, cerebral white matter, cerebellar
gray and white matter, and lateral ventricles. MRS in frontal white matter, basal ganglia
and posterior cingulate gray matter measured relative signal intensities of NAA, Cho, MI
and Glu, expressed for group comparisons by their ratios over creatine (Cr) (e.g.,
NAA/Cr). HIV-infected cells in the bloodstream were quantitated by assessing the
amount of HIV DNA present per 106 PBMCs.39 Regional brain volumes and cerebral
metabolite ratios were compared among healthy HIV-seronegative controls and two HIV-
seropositive subject groups stratified by detectability of PBMC HIV DNA.
Materials and Methods
Subjects
Thirty-five HIV-seropositive (HIV+) individuals and 12 HIV-seronegative (SN) control
subjects aged 40 years and older were studied. HIV+ individuals with confirmed serologic
status were drawn from existing Hawaii Center for AIDS research cohorts whose recent
HIV DNA levels were known and who had agreed to be contacted for future trials.
Patients within our HIV clinic who had high HIV DNA were identified through a separate
screening protocol. SN controls were recruited from the local community through flyers
and word of mouth. The HIV+ participants comprised 10 subjects with undetectable
PBMC HIV DNA (< 10 copies/106 cells) and 25 with detectable HIV DNA (median 269.0
copies/106 cells; range 21.0 – 31,159.0), respectively termed the “U-HIV” and “D-HIV”
groups. Each subject provided written informed consent. HIV+ participants had been on
stable cART ≥ 1 year and evidenced suppressed plasma HIV RNA. HIV-seronegativity in
controls was verified by ELISA. HIV+ and SN individuals were eligible for the study if they
were ≥ 18 years old, could understand and sign a written informed consent document,
and met none of the following exclusion criteria: 1) a major psychiatric or neurological
disorder; 2) head injury with unconsciousness lasting > 30 minutes; 3) learning disability;
4) current substance abuse or dependence as defined by the Diagnostic and Statistical
Manual of Mental Disorders, 4th edition43; 5) history of opportunistic brain infection; 6)
non-English primary language; or 7) implanted metal or conditions (e.g., claustrophobia)
precluding MRI. Participants underwent clinical evaluation, blood draws for assays of
PBMC HIV DNA, and neuroimaging. Specimens were obtained and stored at the time of
study entry. Plasma HIV RNA and CD4 cell counts were performed by a local
18
commercial CLIA-certified laboratory. Nadir CD4 count and years since HIV diagnosis
were determined by subject self-report. Current cART central nervous system
penetration-effectiveness (CPE) scores were computed by summing the CPE rankings
for individual drugs in a regimen.44 The University of Hawaii Committee on Human
Studies approved the study.
PBMC HIV DNA Assessment
Blood draws for PBMC HIV DNA copy assays were conducted within 30 days of MRI.
HIV DNA assay was carried out as detailed in the literature, with low intra- and inter-
assay variability shown by mean coefficients of variation of 1.1% and 1.4%,
respectively.39 Copy numbers of each sample gene (HIV gag and beta-globin) were
analyzed against standard curves, and the HIV DNA copy number per 1 x 10⁶ cells
determined. The lower limit of detection of PBMC HIV DNA was 10 copies/106 cells.
Neuroimaging
Study participants underwent MRI and MRS on a 3.0-Tesla Philips Medical Systems
Achieva scanner equipped with an 8-channel head coil (InVision Imaging, Honolulu). For
each subject, a high-resolution anatomical volume was acquired with a sagittal T1-
weighted 3D turbo field echo (T1W 3D TFE) sequence (echo time TE/repetition time TR
= 3.1 ms/6.7 ms; flip angle 8°; slice thickness 1.2 mm with no gap; in-plane resolution
1.0 mm2; field of view 256 x 256 mm2). Choline, myoinositol, N-acetylaspartate and
glutamate levels were measured by single-voxel MRS in left-hemisphere frontal white
matter (FWM), left basal ganglia, and posterior cingulate gray matter. MRS imaging
parameters are given in the Appendix.
Image Processing
MRS data processing is described in the Appendix. Structural (T1-weighted) MRI scans
were processed using version 4.5.0 of FreeSurfer.45-48 The procedure includes skull-
stripping49, intensity normalization50, Talairach transformation, segmentation of
subcortical white matter and deep gray matter structures46,48, and cortical gray/white
matter boundary and pial surface reconstruction.45 Quality assurance of FreeSurfer data
processing was done by visual inspection, and cortical surfaces and subcortical
segmentations were checked prior to group analysis. FreeSurfer’s estimate of
intracranial volume (ICV) has been validated and deemed a reliable measure for
regional brain volume normalization.51 FreeSurfer is effective for subcortical volumetry in
HIV-infected patients.52 Figure 1 displays FreeSurfer’s labeling of subcortical gray

19
matter structures in a HIV+ study participant whose plasma HIV RNA and PBMC HIV
DNA were undetectable.
Statistical Methods
Statistical analyses were conducted within Statview 5.0 (SAS Institute Inc., Cary, NC).
Demographic and clinical characteristics were compared between HIV+ and SN subjects,
and between the D-HIV and U-HIV groups, with Mann-Whitney or chi-squared tests.
Regional brain volumes were summed over both hemispheres and normalized (scaled)
by ICV to control for head size. Group differences in normalized volumes were assessed
using one-way analysis of covariance (ANCOVA) with age as a covariate. Only main
effects of group and age were included unless group x age interaction was significant.
When combined ANCOVA indicated significant or trend-level differences among U-HIV,
D-HIV and SN subjects, post-hoc Fisher’s Protected Least Significant Difference (PLSD)
tests were performed to correct for multiple pairwise group comparisons and to identify
group differences that accounted for the overall p-value. P < 0.05 was considered
statistically significant and 0.05 ≤ p < 0.1 suggestive of trends.
ANCOVA, controlling for age, compared cerebral metabolite ratios among groups (all
HIV+ vs. SN; SN vs. U-HIV; SN vs. D-HIV; D-HIV vs. U-HIV). A Bonferroni correction for
12 comparisons (four metabolite ratios across three brain regions) was done at the
0.0042 (=0.05/12) level of significance. Spearman correlation assessed relationships of
brain volumes and metabolite ratios to HIV DNA level (for D-HIV subjects), current and
nadir CD4 count, years since HIV diagnosis, and age.
Results
Subject Characteristics
The HIV+ and SN groups did not differ significantly in age, education or gender. U-HIV
and D-HIV subjects had no significant differences in age, education, gender, current
CD4 cell count, nadir CD4, CPE score, or years since HIV diagnosis (Table 1). Plasma
HIV RNA was undetectable (< 50 copies/mL) in all but one HIV+ study participant, a
subject in the D-HIV group with low-level plasma viremia (158 copies/mL).
HIV Serostatus and Regional Brain Volumes
Two-sided ANCOVA of normalized regional volumes, with age as a covariate, showed
that the pooled HIV+ subjects had significantly decreased deep gray matter structures
relative to the healthy control group (p < 0.05). Volumetric reductions of 14% for the

20
amygdala (p=0.007) and 10-12% for the caudate nucleus (p=0.006), thalamus (p=0.01),
hippocampus (p=0.01), nucleus accumbens (p=0.02) and putamen (p=0.04) were
associated with HIV seropositive status. Globus pallidus volume did not differ between
HIV+ and SN subjects (−7%, p=0.22). HIV+ individuals had larger lateral ventricles
(+44%; p=0.03) and smaller volumes of total subcortical gray matter (−9%; p=0.04),
brainstem (−10%, p=0.03) and total cortical gray matter (−8%; p=0.02).
HIV DNA and Regional Brain Volumes
Combined ANCOVA revealed significant or trend-level group differences among the SN,
U-HIV and D-HIV groups for all normalized volumes of all brain regions examined except
the globus pallidus and cerebellar white matter (Table 2). Group-by-age interaction was
significant (and included in the ANCOVA) only for lateral ventricular volume. Fisher’s
PLSD Tests were performed in post-hoc pairwise comparisons to identify group
differences that accounted for these p-values. Total subcortical gray matter volume was
greatest in SN controls, intermediate in the U-HIV group, and lowest in subjects with
detectable HIV DNA (−13% relative to SN, p=0.004). Similar stepwise decreases were
observed for total cortical gray matter, total cerebral white matter, brainstem, and
individual subcortical gray matter structures (Figure 2). Relative to controls, D-HIV
subjects exhibited significant atrophy in the caudate (−12%, p=0.003), hippocampus
(−13%, p=0.004), thalamus (−15%, p=0.002), putamen (−12%, p=0.02), nucleus
accumbens (−12%, p=0.02), amygdala (−14%, p=0.009), and brainstem (−11%, p=0.01).
The U-HIV group showed non-significant volumetric decreases compared to SN for the
same structures, with the exception of the amygdala (−13%, p=0.04). Lateral ventricles
were larger in D-HIV than in SN subjects (+49%, p=0.02).
Relative to the U-HIV group, D-HIV subjects demonstrated reduced cerebellar gray
matter volume (−14%, p=0.020) and total subcortical gray matter volume (−10%,
p=0.024). Volume differences between the D-HIV and U-HIV groups did not reach
statistical significance for individual subcortical gray matter structures. D-HIV subjects
showed trends toward decreased volumes of thalamus (−11% relative to U-HIV, p =
0.053) and total cortical gray matter (−6% relative to U-HIV, p = 0.086).
Spearman correlation found no relationship between regional brain volumes and PBMC
HIV DNA level in D-HIV subjects (p>0.1). Volumes did not correlate significantly with
current or nadir CD4 cell counts or with years since diagnosis in either the U-HIV or D-

21
HIV group. Age correlated with lateral ventricular volume in the SN (p = 0.006; ρ = 0.83)
and U-HIV (p = 0.005; ρ = 0.94) groups, but not in the D-HIV (p = 0.16; ρ = 0.29).
HIV Serostatus, HIV DNA and Cerebral Metabolite Ratios
FWM Glu/Cr was elevated in the pooled HIV+ study participants (+14% compared to SN,
p=0.032). Results from ANCOVA of metabolite ratios (uncorrected for multiple
comparisons) are presented in Table 3. Metabolite group differences did not meet
Bonferroni-adjusted criteria for significance (p < 0.0042) or trends (p < 0.0083=0.1/12).
Discussion
We observed that detectability of PBMC HIV DNA in HIV+ subjects with suppressed
plasma viremia was associated with marked volumetric reductions of cerebellar and
subcortical gray matter. These results were supported by lateral ventricular dilatation
reflecting central atrophy. Volumes of caudate, putamen, thalamus, nucleus accumbens,
hippocampus, brainstem, total cerebral white matter and cortex were significantly
smaller in subjects with detectable HIV DNA than in healthy controls. HIV+ subjects with
undetectable HIV DNA did not exhibit such relationships.
Gray matter loss in subcortical brain regions is well documented in HIV infection, and in
the cerebellum relates to HIV rather than to age.53 The association between subcortical
and cerebellar gray matter atrophy and elevated PBMC HIV DNA in virologically
suppressed individuals may provide clues to processes underlying persistent HAND.
HIV-infected/activated monocytes are hypothesized to traffic into the VRS where they
differentiate into macrophages. Dilated VRS, which are present in HIV54, may mark BBB
breakdown and neuroinflammation55 as well as loss of surrounding brain tissue.56 In
normal subjects, VRS are visible on MRI within the basal ganglia, thalamus, midbrain,
cerebellum, insular cortex and extreme capsule, hippocampus, along the optical tract
and in white matter.57 Enlarged VRS can develop along the cingulate gyrus.58 As in the
present study, the majority of structural brain changes reported in HIV infection are
localized to subcortical gray matter structures and white matter; i.e., adjacent to VRS.
Previously we found that detectable PBMC HIV DNA was related to gray matter loss in
the bilateral insula, cingulate cortex, and ventromedial prefrontal cortex near the optic
tract.40 It is noteworthy that shrinkage associated with high PBMC HIV DNA occurs in
brain regions that are located near perivascular spaces. Monocyte invasion of VRS is
connected to BBB disruption59, which in turn correlates with severity of HAND.60 Our

22
results support an etiology for HAND involving a viral reservoir in peripheral blood and
the accumulation of HIV-infected PBMCs in brain perivascular spaces.
The viral reservoir in the brain is established early, probably during acute
seroconversion.61 HIV-infected cells in VRS enter brain parenchyma to instigate
inflammatory responses leading to neuronal loss. We hypothesize that when HIV DNA in
PBMCs is elevated, these blood cells continually replenish and expand the perivascular
reservoir, resulting in pronounced atrophy of proximate brain regions. Thus HIV
reservoirs in both peripheral blood and VRS may contribute to regional brain volumetric
decreases, with greater shrinkage in those with detectable PBMC HIV DNA as seen in
our cohort. Lateral ventricle expansion, a non-specific indicator of atrophy, correlated
with older age in SN and U-HIV subjects only, suggesting that anomalous processes
may mask age-related brain parenchymal loss in the D-HIV group.
Longer duration of HIV DNA detectability should in this scenario correlate with increased
brain atrophy. We were unable to examine this relationship as we had no data on the
longitudinal progression of participants’ HIV DNA levels, including (in the U-HIV group)
the time taken for HIV DNA to fall below the threshold of detectability. The duration of
untreated HIV infection and duration of plasma HIV RNA detectability were also
unknown. Longitudinal studies must clarify the impact of HIV-infected PBMCs and
peripheral blood monocyte subsets on brain structure.
Presuming that changes in brain metabolism precede the onset of atrophy, we
anticipated that D-HIV subjects would manifest cerebral metabolite alterations such as
increased MI/Cr, a correlate of HIV-related BBB compromise.60 The absence of
significant differences in metabolite levels between the D-HIV and U-HIV groups may
reflect inadequate statistical power or the dependence of single-voxel MRS on voxel
position.
Finally, our pooled HIV+ subjects had higher FWM Glu/Cr than did controls, though the
increase becomes non-significant when corrected for multiple comparisons. Earlier
studies found reduced62 or unchanged22 Glu in FWM of HIV patients, but elevated Glu in
plasma63 and cerebrospinal fluid (CSF).64 CSF Glu levels correlate with brain atrophy in
HIV-associated dementia.64 Glutamate regulation by HIV is poorly understood.65 Glu

23
secreted by activated HIV-infected macrophages mediates neurotoxicity66 and damages
neurons.67 Significant brain Glu increases, measured in vivo by MRS, have directly
implicated glutamate-mediated toxicity in neuronal loss associated with feline
immunodeficiency virus infection.68 If enhanced, MRS-derived Glu/Cr in our HIV+
participants may reflect extracellular brain glutamate.
Summary and Conclusion
In HIV+ subjects with suppressed plasma HIV RNA, detectable HIV DNA in peripheral
blood mononuclear cells was significantly associated with reduced volumes of cerebellar
gray matter and total subcortical gray matter. Smaller caudate, putamen, hippocampus,
thalamus, nucleus accumbens, and brainstem volumes also distinguished HIV+ subjects
with detectable PBMC HIV DNA from those with undetectable HIV DNA and from SN
controls. Locations of the affected regions indicate involvement of activated, HIV-
infected macrophages that accumulate in Virchow-Robin spaces upon entry from the
periphery. Our study was limited by its cross-sectional nature and modest sample size.
Nevertheless, the observed association between elevated HIV DNA and significantly
decreased subcortical and cerebellar gray matter may shed light on post-cART brain
atrophy and may hold implications for therapeutic approaches targeting depletion of HIV-
infected cells in peripheral blood.
Appendix
MRS imaging protocol
Under the MRS scanning protocol, all subjects underwent a 3D sagittal T1-weighted
gradient echo image (TE=7ms, TR=11.2ms, flip angle=25o with 1 mm voxel resolution)
MRI scan on a 3.0-Tesla Philips Medical Systems Achieva clinical scanner equipped
with an 8-channel sensitivity encoding (SENSE) head coil for data reception and a
standard body coil for transmission (InVision Imaging, Honolulu). These T1-weighted
images were reconstructed into coronal and transverse planes used to prescribe
spectroscopy voxels of interest. Dynamic water-suppressed single-voxel MR
spectroscopy was performed using a double spin echo data acquisition with multiple
echo times. The following data acquisition parameters were used: starting TE=35ms,
ending TE=196ms with 5ms 32-TE increments; and TR=1500ms. The three prescribed
voxel locations were in left frontal white matter (FWM), posterior cingulate gray matter
(PGM) and left basal ganglia (BG) (Figure A-1) The number of averages for each TE

24
step was 8, with a total acquisition time of 8 minutes per voxel location. The voxel size
was 2x2x2 cm3. A second set of dynamic water-unsuppressed single voxel MRS was
also acquired for each voxel location with one excitation for each TE step.
MRS Data Processing
Eight time domain MRS data sets from each coil element of the eight-channel phased-
array head coil were generated for each voxel location. The time domain data, corrected
for eddy currents and zero-order phase, were averaged over the 32 TE values to
generate a single spectrum from each coil. These eight data sets were then combined to
generate a single data frame using the relative unsuppressed water signal intensity from
each coil element as a scaling factor. Metabolite concentrations for NAA, Cr, Cho and
Glu were estimated using a frequency domain fitting routine (LC Model). Goodness-of-fit
was defined as satisfactory if the standard deviation (percentage of standard deviation)
from the LC Model fitting was below 25%. The basis-set reference solutions used in TE-
averaged fitting were acquired using the same data acquisition parameters as those in
the in vivo acquisition.
THESIS CONCLUSION
We have established an association between elevated peripheral blood mononuclear
cell HIV DNA and significant reductions of cortical, subcortical and cerebellar gray matter
in HIV-infected individuals whose plasma viral load is suppressed by antiretroviral
therapy. Regions of gray matter loss were located near the brain perivascular spaces
where HIV-infected or activated macrophages are believed to accumulate after crossing
the blood-brain barrier. Thinning of the cortex was observed in areas consistent with
neuropsychological deficits in HIV.
If results of this thesis are validated by larger studies, HIV DNA may prove to be a
predictive marker of brain injury in well-controlled HIV disease. The association between
elevated HIV DNA and brain atrophy may help to clarify the mechanism by which HIV
causes neurocognitive impairment, and may inform the development of therapeutic
strategies targeting depletion of peripheral blood HIV reservoirs.

25
REFERENCES
Part I: 1. Kallianpur, K.J., et al., Regional Cortical Thinning Associated with Detectable Levels of HIV DNA. Cereb Cortex 2012; 22(9): 2065-2075. 2. Hammer, S.M., et al., A controlled trial of two nucleoside analogues plus indinavir
in persons with human immunodeficiency virus infection and CD4 cell counts of 200 per cubic millimeter or less. AIDS Clinical Trials Group 320 Study Team. N Engl J Med, 1997. 337(11): p. 725-33.
3. Palella, F.J., Jr., et al., Declining morbidity and mortality among patients with advanced human immunodeficiency virus infection. HIV Outpatient Study Investigators. N Engl J Med, 1998. 338(13): p. 853-60.
4. Moore, R.D. and R.E. Chaisson, Natural history of HIV infection in the era of combination antiretroviral therapy. AIDS, 1999. 13(14): p. 1933-42.
5. Brodt, H.R., et al., Changing incidence of AIDS-defining illnesses in the era of antiretroviral combination therapy. AIDS, 1997. 11(14): p. 1731-8.
6. Sacktor, N., et al., HIV-associated neurologic disease incidence changes:: Multicenter AIDS Cohort Study, 1990-1998. Neurology, 2001. 56(2): p. 257-60.
7. Sacktor, N., et al., HIV-associated cognitive impairment before and after the advent of combination therapy. J Neurovirol, 2002. 8(2): p. 136-42.
8. Robertson, K.R., et al., The prevalence and incidence of neurocognitive impairment in the HAART era. AIDS, 2007. 21(14): p. 1915-21.
9. Neuenburg, J.K., et al., HIV-related neuropathology, 1985 to 1999: rising prevalence of HIV encephalopathy in the era of highly active antiretroviral therapy. J Acquir Immune Defic Syndr, 2002. 31(2): p. 171-7.
10. Cysique, L.A., P. Maruff, and B.J. Brew, Prevalence and pattern of neuropsychological impairment in human immunodeficiency virus-infected/acquired immunodeficiency syndrome (HIV/AIDS) patients across pre- and post-highly active antiretroviral therapy eras: a combined study of two cohorts. J Neurovirol, 2004a. 10(6): p. 350-7.
11. Cysique, L.A., P. Maruff, and B.J. Brew, Antiretroviral therapy in HIV infection: are neurologically active drugs important? Arch Neurol, 2004b. 61(11): p. 1699-704.
12. Robertson, K.R., et al., Highly active antiretroviral therapy improves neurocognitive functioning. J Acquir Immune Defic Syndr, 2004. 36(1): p. 562-6.
13. McArthur, J.C., et al., Human immunodeficiency virus-associated dementia: an evolving disease. J Neurovirol, 2003. 9(2): p. 205-21.
14. Sacktor, N.C., et al., Improvement in HIV-associated motor slowing after antiretroviral therapy including protease inhibitors. J Neurovirol, 2000. 6(1): p. 84-8.
15. Suarez, S., et al., Outcome of patients with HIV-1-related cognitive impairment on highly active antiretroviral therapy. AIDS, 2001. 15(2): p. 195-200.
16. Antinori, A., et al., Updated research nosology for HIV-associated neurocognitive disorders. Neurology, 2007. 69(18): p. 1789-99.
17. Anderson, E., et al., HIV-1-associated dementia: a metabolic encephalopathy perpetrated by virus-infected and immune-competent mononuclear phagocytes. J Acquir Immune Defic Syndr, 2002. 31 Suppl 2: p. S43-54.
18. Tozzi, V., et al., Neurocognitive impairment influences quality of life in HIV-infected patients receiving HAART. Int J STD AIDS, 2004. 15(4): p. 254-9.
19. Tozzi, V., et al., Neurocognitive performance and quality of life in patients with HIV infection. AIDS Res Hum Retroviruses, 2003. 19(8): p. 643-52.

26
20. Heyes, M.P., et al., Elevated cerebrospinal fluid quinolinic acid levels are associated with region-specific cerebral volume loss in HIV infection. Brain, 2001. 124(Pt 5): p. 1033-42.
21. Kaul, M., G.A. Garden, and S.A. Lipton, Pathways to neuronal injury and apoptosis in HIV-associated dementia. Nature, 2001. 410(6831): p. 988-94.
22. Li, W., et al., Molecular and cellular mechanisms of neuronal cell death in HIV dementia. Neurotox Res, 2005. 8(1-2): p. 119-34.
23. Mattson, M.P., N.J. Haughey, and A. Nath, Cell death in HIV dementia. Cell Death Differ, 2005. 12 Suppl 1: p. 893-904.
24. Scott-Algara, D., et al., In untreated HIV-1-infected children, PBMC-associated HIV DNA levels and cell-free HIV RNA levels are correlated to distinct T-lymphocyte populations. J Acquir Immune Defic Syndr, 2010. 53(5): p. 553-63.
25. Gonzalez-Scarano, F. and J. Martin-Garcia, The neuropathogenesis of AIDS. Nat Rev Immunol, 2005. 5(1): p. 69-81.
26. Kim, W.K., et al., Monocyte/macrophage traffic in HIV and SIV encephalitis. J Leukoc Biol, 2003. 74(5): p. 650-6.
27. Liu, Y., et al., Analysis of human immunodeficiency virus type 1 gp160 sequences from a patient with HIV dementia: evidence for monocyte trafficking into brain. J Neurovirol, 2000. 6 Suppl 1: p. S70-81.
28. Koenig, S., et al., Detection of AIDS virus in macrophages in brain tissue from AIDS patients with encephalopathy. Science, 1986. 233(4768): p. 1089-93.
29. Gartner, S., HIV infection and dementia. Science, 2000. 287(5453): p. 602-4. 30. Shiramizu, B., et al., Circulating proviral HIV DNA and HIV-associated dementia.
AIDS, 2005. 19(1): p. 45-52. 31. Wong, J.K., et al., Recovery of replication-competent HIV despite prolonged
suppression of plasma viremia. Science, 1997. 278(5341): p. 1291-5. 32. Bruisten, S.M., et al., Cellular proviral HIV type 1 DNA load persists after long-
term RT-inhibitor therapy in HIV type 1 infected persons. AIDS Res Hum Retroviruses, 1998. 14(12): p. 1053-8.
33. Hocquloux, L., et al., Better HIV DNA depletion and CD4 restoration with HAART initiated at the time of primary HIV infection than with HAART started during chronic HIV infection. 2009, Abstract #515. 16th Conference of Retroviruses and Opportunistic Infections. Montreal, CA, CROI: Alexandria, VA.
34. Ngo-Giang-Huong, N., et al., Proviral HIV-1 DNA in subjects followed since primary HIV-1 infection who suppress plasma viral load after one year of highly active antiretroviral therapy. AIDS, 2001. 15(6): p. 665-73.
35. Kostrikis, L.G., et al., Quantitation of human immunodeficiency virus type 1 DNA forms with the second template switch in peripheral blood cells predicts disease progression independently of plasma RNA load. J Virol, 2002. 76(20): p. 10099-108.
36. Re, M.C., et al., Meaning of DNA detection during the follow-up of HIV-1 infected patients: a brief review. New Microbiol, 2006. 29(2): p. 81-8.
37. Shiramizu, B., et al., HIV DNA and dementia in treatment-naive HIV-1-infected individuals in Bangkok, Thailand. Int J Med Sci, 2007. 4(1): p. 13-8.
38. Valcour, V.G., et al., HIV DNA and cognition in a Thai longitudinal HAART initiation cohort: the SEARCH 001 Cohort Study. Neurology, 2009. 72(11): p. 992-8.
39. Valcour, V.G., B.T. Shiramizu, and C.M. Shikuma, HIV DNA in circulating monocytes as a mechanism to dementia and other HIV complications. J Leukoc Biol, 2010. 87(4): p. 621-6.
27
40. Carsenti-Dellamonica, H., et al., LPS May Be a Predictive Factor Even in Mild Forms of HIV-associated Neurocognitive Impairment: Sub-analysis of the Neuradapt Study. 2011, Abstract #404. 18th Conference of Retroviruses and Opportunistic Infections. Boston, MA, CROI.
41. Shiramizu, B., et al., HIV DNA in PBMC and monocytes associated with dementia (Abstract). 2007.
42. Aylward, E.H., et al., Reduced basal ganglia volume in HIV-1-associated dementia: results from quantitative neuroimaging. Neurology, 1993. 43(10): p. 2099-104.
43. Hall, M., et al., The correlation between neuropsychological and neuroanatomic changes over time in asymptomatic and symptomatic HIV-1-infected individuals. Neurology, 1996. 46(6): p. 1697-702.
44. Stout, J.C., et al., Progressive cerebral volume loss in human immunodeficiency virus infection: a longitudinal volumetric magnetic resonance imaging study. HIV Neurobehavioral Research Center Group. Arch Neurol, 1998. 55(2): p. 161-8.
45. Thompson, P.M., et al., Thinning of the cerebral cortex visualized in HIV/AIDS reflects CD4+ T lymphocyte decline. Proc Natl Acad Sci U S A, 2005. 102(43): p. 15647-52.
46. Chiang, M.C., et al., 3D pattern of brain atrophy in HIV/AIDS visualized using tensor-based morphometry. Neuroimage, 2007. 34(1): p. 44-60.
47. Cohen, R.A., et al., Effects of nadir CD4 count and duration of human immunodeficiency virus infection on brain volumes in the highly active antiretroviral therapy era. J Neurovirol, 2010. 16(1): p. 25-32.
48. Becker, J.T., et al., Subcortical brain atrophy persists even in HAART-regulated HIV disease. Brain Imaging Behav, 2011.
49. Ances, B.M., et al., Resting cerebral blood flow: a potential biomarker of the effects of HIV in the brain. Neurology, 2009. 73(9): p. 702-8.
50. Chang, L., et al., A multicenter in vivo proton-MRS study of HIV-associated dementia and its relationship to age. Neuroimage, 2004. 23(4): p. 1336-47.
51. Schifitto, G., et al., Selegiline and oxidative stress in HIV-associated cognitive impairment. Neurology, 2009. 73(23): p. 1975-81.
52. Schweinsburg, B.C., et al., Brain mitochondrial injury in human immunodeficiency virus-seropositive (HIV+) individuals taking nucleoside reverse transcriptase inhibitors. J Neurovirol, 2005. 11(4): p. 356-64.
53. Paul, R.H., et al., Proton MRS and neuropsychological correlates in AIDS dementia complex: evidence of subcortical specificity. J Neuropsychiatry Clin Neurosci, 2007. 19(3): p. 283-92.
54. Lentz, M.R., et al., Changes in MRS neuronal markers and T cell phenotypes observed during early HIV infection. Neurology, 2009. 72(17): p. 1465-72.
55. Harezlak, J., et al., Persistence of HIV-associated cognitive impairment, inflammation, and neuronal injury in era of highly active antiretroviral treatment. AIDS, 2011. 25(5): p. 625-33.
56. Mohamed, M.A., et al., Factor analysis of proton MR spectroscopic imaging data in HIV infection: metabolite-derived factors help identify infection and dementia. Radiology, 2010. 254(2): p. 577-86.
57. Cohen, R.A., et al., Cerebral metabolite abnormalities in human immunodeficiency virus are associated with cortical and subcortical volumes. J Neurovirol, 2010. 16(6): p. 435-44.
58. Kalams, S.A. and B.D. Walker, Cytotoxic T lymphocytes and HIV-1 related neurologic disorders. Curr Top Microbiol Immunol, 1995. 202: p. 79-88.

28
59. Kaul, M., et al., HIV-1 infection and AIDS: consequences for the central nervous system. Cell Death Differ, 2005. 12 Suppl 1: p. 878-92.
60. American Psychiatric Association, Diagnostic and Statistical Manual of Mental Disorders (4th ed.). 1994, American Psychiatric Publishing: Washington, D.C.
61. Segonne, F., et al., A hybrid approach to the skull stripping problem in MRI. Neuroimage, 2004. 22(3): p. 1060-75.
62. Fischl, B., et al., Automatically parcellating the human cerebral cortex. Cereb Cortex, 2004. 14(1): p. 11-22.
63. Fischl, B., A. Liu, and A.M. Dale, Automated manifold surgery: constructing geometrically accurate and topologically correct models of the human cerebral cortex. IEEE Trans Med Imaging, 2001. 20(1): p. 70-80.
64. Dale, A.M., Sereno, M.I., Improved localization of cortical activity by combining EEG and MEG with MRI cortical surface reconstruction: a linear approach. J Cogn Neurosci, 1993. 5: p. 162-176.
65. Dale, A.M., B. Fischl, and M.I. Sereno, Cortical surface-based analysis. I. Segmentation and surface reconstruction. Neuroimage, 1999. 9(2): p. 179-94.
66. Fischl, B. and A.M. Dale, Measuring the thickness of the human cerebral cortex from magnetic resonance images. Proc Natl Acad Sci U S A, 2000. 97(20): p. 11050-5.
67. Fischl, B., M.I. Sereno, and A.M. Dale, Cortical surface-based analysis. II: Inflation, flattening, and a surface-based coordinate system. Neuroimage, 1999. 9(2): p. 195-207.
68. Fischl, B., et al., High-resolution intersubject averaging and a coordinate system for the cortical surface. Hum Brain Mapp, 1999. 8(4): p. 272-84.
69. Han, X., et al., Reliability of MRI-derived measurements of human cerebral cortical thickness: the effects of field strength, scanner upgrade and manufacturer. Neuroimage, 2006. 32(1): p. 180-94.
70. Jovicich, J., et al., Reliability in multi-site structural MRI studies: effects of gradient non-linearity correction on phantom and human data. Neuroimage, 2006. 30(2): p. 436-43.
71. Rosas, H.D., et al., Regional and progressive thinning of the cortical ribbon in Huntington's disease. Neurology, 2002. 58(5): p. 695-701.
72. Kuperberg, G.R., et al., Regionally localized thinning of the cerebral cortex in schizophrenia. Arch Gen Psychiatry, 2003. 60(9): p. 878-88.
73. Salat, D.H., et al., Thinning of the cerebral cortex in aging. Cereb Cortex, 2004. 14(7): p. 721-30.
74. Destrieux, C., et al., Automatic parcellation of human cortical gyri and sulci using standard anatomical nomenclature. Neuroimage, 2010. 53(1): p. 1-15.
75. Fischl, B., et al., A coordinate system for the cortical surface. Neuroimage, 1998. 7(4):S740( ).
76. Robertson, K., J. Liner, and R. Heaton, Neuropsychological assessment of HIV-infected populations in international settings. Neuropsychol Rev, 2009. 19(2): p. 232-49.
77. Dawes, S., et al., Variable patterns of neuropsychological performance in HIV-1 infection. J Clin Exp Neuropsychol, 2008. 30(6): p. 613-26.
78. Stout, J.C., et al., Decline in working memory associated with HIV infection. HNRC Group. Psychol Med, 1995. 25(6): p. 1221-32.
79. York, M.K., et al., Verbal working memory storage and processing deficits in HIV-1 asymptomatic and symptomatic individuals. Psychol Med, 2001. 31(7): p. 1279-91.

29
80. Marcotte, T.D., et al., Visual attention deficits are associated with driving accidents in cognitively-impaired HIV-infected individuals. J Clin Exp Neuropsychol, 2006. 28(1): p. 13-28.
81. Robertson, K., et al., CSF, plasma viral load and HIV associated dementia. J Neurovirol, 1998. 4(1): p. 90-4.
82. Reger, M.A., et al., The relationship between plasma viral load and neuropsychological functioning in HIV-1 infection. Arch Clin Neuropsychol, 2005. 20(2): p. 137-43.
83. Langford, T.D., et al., Changing patterns in the neuropathogenesis of HIV during the HAART era. Brain Pathol, 2003. 13(2): p. 195-210.
84. Albright, A.V., S.S. Soldan, and F. Gonzalez-Scarano, Pathogenesis of human immunodeficiency virus-induced neurological disease. J Neurovirol, 2003. 9(2): p. 222-7.
85. Lawrence, D.M. and E.O. Major, HIV-1 and the brain: connections between HIV-1-associated dementia, neuropathology and neuroimmunology. Microbes Infect, 2002. 4(3): p. 301-8.
86. Shiramizu, B., et al., HIV proviral DNA associated with decreased neuropsychological function. J Neuropsychiatry Clin Neurosci, 2007. 19(2): p. 157-63.
87. Shiramizu, B., et al., Amount of HIV DNA in peripheral blood mononuclear cells is proportional to the severity of HIV-1-associated neurocognitive disorders. J Neuropsychiatry Clin Neurosci, 2009. 21(1): p. 68-74.
88. Delobel, P., et al., Persistence of distinct HIV-1 populations in blood monocytes and naive and memory CD4 T cells during prolonged suppressive HAART. AIDS, 2005. 19(16): p. 1739-50.
89. Dickover, R.E., et al., Decreases in unintegrated HIV DNA are associated with antiretroviral therapy in AIDS patients. J Acquir Immune Defic Syndr, 1992. 5(1): p. 31-6.
90. Naito, E., et al., Fast reaction to different sensory modalities activates common fields in the motor areas, but the anterior cingulate cortex is involved in the speed of reaction. J Neurophysiol, 2000. 83(3): p. 1701-9.
91. Witt, S.T., A.R. Laird, and M.E. Meyerand, Functional neuroimaging correlates of finger-tapping task variations: an ALE meta-analysis. Neuroimage, 2008. 42(1): p. 343-56.
92. Jancke, L., N.J. Shah, and M. Peters, Cortical activations in primary and secondary motor areas for complex bimanual movements in professional pianists. Brain Res Cogn Brain Res, 2000. 10(1-2): p. 177-83.
93. Augustine, J.R., The insular lobe in primates including humans. Neurol Res, 1985. 7(1): p. 2-10.
94. Augustine, J.R., Circuitry and functional aspects of the insular lobe in primates including humans. Brain Res Brain Res Rev, 1996. 22(3): p. 229-44.
95. Borovsky, A., et al., Lesion correlates of conversational speech production deficits. Neuropsychologia, 2007. 45(11): p. 2525-33.
96. Ackermann, H. and A. Riecker, The contribution of the insula to motor aspects of speech production: a review and a hypothesis. Brain Lang, 2004. 89(2): p. 320-8.
97. Habib, M., et al., Mutism and auditory agnosia due to bilateral insular damage--role of the insula in human communication. Neuropsychologia, 1995. 33(3): p. 327-39.
98. Fink, G.R., et al., Multiple nonprimary motor areas in the human cortex. J Neurophysiol, 1997. 77(4): p. 2164-74.
30
99. Phan, K.L., et al., Functional neuroanatomy of emotion: a meta-analysis of emotion activation studies in PET and fMRI. Neuroimage, 2002. 16(2): p. 331-48.
100. Craig, A.D., How do you feel--now? The anterior insula and human awareness. Nat Rev Neurosci, 2009. 10(1): p. 59-70.
101. Tsakiris, M., et al., Neural signatures of body ownership: a sensory network for bodily self-consciousness. Cereb Cortex, 2007. 17(10): p. 2235-44.
102. Jones, C.L., J. Ward, and H.D. Critchley, The neuropsychological impact of insular cortex lesions. J Neurol Neurosurg Psychiatry, 2010. 81(6): p. 611-8.
103. Anderson, T.J., et al., Cortical control of saccades and fixation in man. A PET study. Brain, 1994. 117 ( Pt 5): p. 1073-84.
104. Eckert, M.A., et al., At the heart of the ventral attention system: the right anterior insula. Hum Brain Mapp, 2009. 30(8): p. 2530-41.
105. Clark, L., et al., Differential effects of insular and ventromedial prefrontal cortex lesions on risky decision-making. Brain, 2008. 131(Pt 5): p. 1311-22.
106. Damasio, A.R., Descartes' error and the future of human life. Sci Am, 1994. 271(4): p. 144.
107. Bechara, A. and H. Damasio, Decision-making and addiction (part I): impaired activation of somatic states in substance dependent individuals when pondering decisions with negative future consequences. Neuropsychologia, 2002. 40(10): p. 1675-89.
108. Kuhnen, C.M. and B. Knutson, The neural basis of financial risk taking. Neuron, 2005. 47(5): p. 763-70.
109. Paulus, M.P., et al., Increased activation in the right insula during risk-taking decision making is related to harm avoidance and neuroticism. Neuroimage, 2003. 19(4): p. 1439-48.
110. Bermudez-Rattoni, F., et al., Insular cortex is involved in consolidation of object recognition memory. Learn Mem, 2005. 12(5): p. 447-9.
111. Ongur, D. and J.L. Price, The organization of networks within the orbital and medial prefrontal cortex of rats, monkeys and humans. Cereb Cortex, 2000. 10(3): p. 206-19.
112. Pourtois, G., et al., Errors recruit both cognitive and emotional monitoring systems: simultaneous intracranial recordings in the dorsal anterior cingulate gyrus and amygdala combined with fMRI. Neuropsychologia, 2010. 48(4): p. 1144-59.
113. Simoes-Franklin, C., et al., Executive function and error detection: The effect of motivation on cingulate and ventral striatum activity. Hum Brain Mapp, 2010. 31(3): p. 458-69.
114. Wallis, J.D., Orbitofrontal cortex and its contribution to decision-making. Annu Rev Neurosci, 2007. 30: p. 31-56.
115. Cato, M.A., et al., Assessing the elusive cognitive deficits associated with ventromedial prefrontal damage: a case of a modern-day Phineas Gage. J Int Neuropsychol Soc, 2004. 10(3): p. 453-65.
116. Berlin, H.A., E.T. Rolls, and U. Kischka, Impulsivity, time perception, emotion and reinforcement sensitivity in patients with orbitofrontal cortex lesions. Brain, 2004. 127(Pt 5): p. 1108-26.
117. Libon, D.J., et al., Neurocognitive contributions to verbal fluency deficits in frontotemporal lobar degeneration. Neurology, 2009. 73(7): p. 535-42.
118. Maki, P.M., et al., Impairments in memory and hippocampal function in HIV-positive vs HIV-negative women: a preliminary study. Neurology, 2009. 72(19): p. 1661-8.

31
119. Rohrer, J.D., et al., Patterns of cortical thinning in the language variants of frontotemporal lobar degeneration. Neurology, 2009. 72(18): p. 1562-9.
120. Dorfel, D., et al., Distinct brain networks in recognition memory share a defined region in the precuneus. Eur J Neurosci, 2009. 30(10): p. 1947-59.
121. Olesen, P.J., et al., HIV infection affects parietal-dependent spatial cognition: evidence from mental rotation and hierarchical pattern perception. Behav Neurosci, 2007. 121(6): p. 1163-73.
122. Suzuki, K., et al., Pure topographical disorientation related to dysfunction of the viewpoint dependent visual system. Cortex, 1998. 34(4): p. 589-99.
123. Ghaem, O., et al., Mental navigation along memorized routes activates the hippocampus, precuneus, and insula. Neuroreport, 1997. 8(3): p. 739-44.
124. Cavanna, A.E. and M.R. Trimble, The precuneus: a review of its functional anatomy and behavioural correlates. Brain, 2006. 129(Pt 3): p. 564-83.
125. Castelo, J.M., et al., Altered hippocampal-prefrontal activation in HIV patients during episodic memory encoding. Neurology, 2006. 66(11): p. 1688-95.
126. Chang, L., et al., Adaptation of the attention network in human immunodeficiency virus brain injury. Ann Neurol, 2004. 56(2): p. 259-72.
127. Ernst, T., et al., Abnormal brain activation on functional MRI in cognitively asymptomatic HIV patients. Neurology, 2002. 59(9): p. 1343-9.
Part II: 1. Sacktor N, Lyles RH, Skolasky R, et al. HIV-associated neurologic disease
incidence changes: Multicenter AIDS Cohort Study, 1990-1998. Neurology 2001;56:257-260.
2. Heaton RK, Clifford DB, Franklin DR, Jr., et al. HIV-associated neurocognitive disorders persist in the era of potent antiretroviral therapy: CHARTER Study. Neurology 2010;75:2087-2096.
3. Neuenburg JK, Brodt HR, Herndier BG, et al. HIV-related neuropathology, 1985 to 1999: rising prevalence of HIV encephalopathy in the era of highly active antiretroviral therapy. J Acquir Immune Defic Syndr 2002;31:171-177.
4. Cysique LA, Maruff P, Brew BJ. Prevalence and pattern of neuropsychological impairment in human immunodeficiency virus-infected/acquired immunodeficiency syndrome (HIV/AIDS) patients across pre- and post-highly active antiretroviral therapy eras: a combined study of two cohorts. J Neurovirol 2004a;10:350-357.
5. Aylward EH, Henderer JD, McArthur JC, et al. Reduced basal ganglia volume in HIV-1-associated dementia: results from quantitative neuroimaging. Neurology 1993;43:2099-2104.
6. Stout JC, Ellis RJ, Jernigan TL, et al. Progressive cerebral volume loss in human immunodeficiency virus infection: a longitudinal volumetric magnetic resonance imaging study. HIV Neurobehavioral Research Center Group. Arch Neurol 1998;55:161-168.
7. Patel SH, Kolson DL, Glosser G, et al. Correlation between percentage of brain parenchymal volume and neurocognitive performance in HIV-infected patients. AJNR Am J Neuroradiol 2002;23:543-549.
8. Cardenas VA, Meyerhoff DJ, Studholme C, et al. Evidence for ongoing brain injury in human immunodeficiency virus-positive patients treated with antiretroviral therapy. J Neurovirol 2009;15:324-333.
9. Chiang MC, Dutton RA, Hayashi KM, et al. 3D pattern of brain atrophy in HIV/AIDS visualized using tensor-based morphometry. Neuroimage 2007;34:44-60.

32
10. Thompson PM, Dutton RA, Hayashi KM, et al. Thinning of the cerebral cortex visualized in HIV/AIDS reflects CD4+ T lymphocyte decline. Proc Natl Acad Sci U S A 2005;102:15647-15652.
11. Ances BM, Ortega M, Vaida F, Heaps J, Paul R. Independent effects of HIV, aging, and HAART on brain volumetric measures. J Acquir Immune Defic Syndr 2012;59:469-477.
12. Becker JT, Sanders J, Madsen SK, et al. Subcortical brain atrophy persists even in HAART-regulated HIV disease. Brain Imaging Behav 2011.
13. Archibald SL, Masliah E, Fennema-Notestine C, et al. Correlation of in vivo neuroimaging abnormalities with postmortem human immunodeficiency virus encephalitis and dendritic loss. Arch Neurol 2004;61:369-376.
14. Klunder AD, Chiang MC, Dutton RA, et al. Mapping cerebellar degeneration in HIV/AIDS. Neuroreport 2008;19:1655-1659.
15. Elsheikh BH, Maher WE, Kissel JT. Cerebellar atrophy associated with human immunodeficiency virus infection. Arch Neurol 2010;67:634-635.
16. Chang, L., et al., A multicenter in vivo proton-MRS study of HIV-associated dementia and its relationship to age. Neuroimage, 2004. 23(4): p. 1336-47.
17. Schifitto, G., et al., Selegiline and oxidative stress in HIV-associated cognitive impairment. Neurology, 2009. 73(23): p. 1975-81.
18. Schweinsburg, B.C., et al., Brain mitochondrial injury in human immunodeficiency virus-seropositive (HIV+) individuals taking nucleoside reverse transcriptase inhibitors. J Neurovirol, 2005. 11(4): p. 356-64.
19. Paul, R.H., et al., Proton MRS and neuropsychological correlates in AIDS dementia complex: evidence of subcortical specificity. J Neuropsychiatry Clin Neurosci, 2007. 19(3): p. 283-92.
20. Lentz, M.R., et al., Changes in MRS neuronal markers and T cell phenotypes observed during early HIV infection. Neurology, 2009. 72(17): p. 1465-72.
21. Chang, L., et al., Cerebral metabolite abnormalities correlate with clinical severity of HIV-1 cognitive motor complex. Neurology, 1999. 52(1): p. 100-8.
22. Mohamed, M.A., et al., Factor analysis of proton MR spectroscopic imaging data in HIV infection: metabolite-derived factors help identify infection and dementia. Radiology, 2010. 254(2): p. 577-86.
23. Sacktor, N., et al., A multicenter study of two magnetic resonance spectroscopy techniques in individuals with HIV dementia. J Magn Reson Imaging, 2005. 21(4): p. 325-33.
24. Tracey, I., et al., Brain choline-containing compounds are elevated in HIV-positive patients before the onset of AIDS dementia complex: A proton magnetic resonance spectroscopic study. Neurology, 1996. 46(3): p. 783-8.
25. Paul, R.H., et al., Relative sensitivity of magnetic resonance spectroscopy and quantitative magnetic resonance imaging to cognitive function among nondemented individuals infected with HIV. J Int Neuropsychol Soc, 2008. 14(5): p. 725-33.
26. Meyerhoff, D.J., et al., Reduced brain N-acetylaspartate suggests neuronal loss in cognitively impaired human immunodeficiency virus-seropositive individuals: in vivo 1H magnetic resonance spectroscopic imaging. Neurology, 1993. 43(3 Pt 1): p. 509-15.
27. Chang, L., et al., Highly active antiretroviral therapy reverses brain metabolite abnormalities in mild HIV dementia. Neurology, 1999. 53(4): p. 782-9.
28. Harezlak, J., et al., Persistence of HIV-associated cognitive impairment, inflammation, and neuronal injury in era of highly active antiretroviral treatment. AIDS, 2011. 25(5): p. 625-33.

33
29. Cohen, R.A., et al., Cerebral metabolite abnormalities in human immunodeficiency virus are associated with cortical and subcortical volumes. J Neurovirol, 2010. 16(6): p. 435-44.
30. Kaul, M., G.A. Garden, and S.A. Lipton, Pathways to neuronal injury and apoptosis in HIV-associated dementia. Nature, 2001. 410(6831): p. 988-94.
31. Scott-Algara, D., et al., In untreated HIV-1-infected children, PBMC-associated HIV DNA levels and cell-free HIV RNA levels are correlated to distinct T-lymphocyte populations. J Acquir Immune Defic Syndr, 2010. 53(5): p. 553-63.
32. Nottet, H.S. and H.E. Gendelman, Unraveling the neuroimmune mechanisms for the HIV-1-associated cognitive/motor complex. Immunol Today, 1995. 16(9): p. 441-8.
33. Koenig, S., et al., Detection of AIDS virus in macrophages in brain tissue from AIDS patients with encephalopathy. Science, 1986. 233(4768): p. 1089-93.
34. Gartner, S., HIV infection and dementia. Science, 2000. 287(5453): p. 602-4. 35. Wong, J.K., et al., Recovery of replication-competent HIV despite prolonged
suppression of plasma viremia. Science, 1997. 278(5341): p. 1291-5. 36. Shiramizu, B., et al., HIV DNA and dementia in treatment-naive HIV-1-infected
individuals in Bangkok, Thailand. Int J Med Sci, 2007. 4(1): p. 13-8. 37. Valcour, V.G., et al., HIV DNA and cognition in a Thai longitudinal HAART
initiation cohort: the SEARCH 001 Cohort Study. Neurology, 2009. 72(11): p. 992-8.
38. Valcour, V.G., B.T. Shiramizu, and C.M. Shikuma, HIV DNA in circulating monocytes as a mechanism to dementia and other HIV complications. J Leukoc Biol, 2010. 87(4): p. 621-6.
39. Kusao I, Shiramizu B, Liang CY, et al. Cognitive performance related to HIV-1-infected monocytes. J Neuropsychiatry Clin Neurosci. 2012 Dec 1;24(1):71-80.
40. Kallianpur, K.J., et al., Regional Cortical Thinning Associated with Detectable Levels of HIV DNA. Cereb Cortex 2012; 22(9): 2065-2075.
41. Elovaara, I., et al., Mild brain atrophy in early HIV infection: the lack of association with cognitive deficits and HIV-specific intrathecal immune response. J Neurol Sci, 1990. 99(2-3): p. 121-36.
42. Paul, R.H., et al., Apathy is associated with volume of the nucleus accumbens in patients infected with HIV. J Neuropsychiatry Clin Neurosci, 2005. 17(2): p. 167-71.
43. American Psychiatric Association, Diagnostic and Statistical Manual of Mental Disorders (4th ed.). 1994, American Psychiatric Publishing: Washington, D.C.
44. Letendre SL, Ellis RJ, Ances BM, McCutchan JA. Neurologic complications of HIV disease and their treatment. Top HIV Med 2010;18:45-55.
45. Dale, A.M., B. Fischl, and M.I. Sereno, Cortical surface-based analysis. I. Segmentation and surface reconstruction. Neuroimage, 1999. 9(2): p. 179-94.
46. Fischl, B., et al., Whole brain segmentation: automated labeling of neuroanatomical structures in the human brain. Neuron, 2002. 33(3): p. 341-55.
47. Fischl, B., M.I. Sereno, and A.M. Dale, Cortical surface-based analysis. II: Inflation, flattening, and a surface-based coordinate system. Neuroimage, 1999. 9(2): p. 195-207.
48. Fischl, B., et al., Automatically parcellating the human cerebral cortex. Cereb Cortex, 2004. 14(1): p. 11-22.
49. Segonne, F., et al., A hybrid approach to the skull stripping problem in MRI. Neuroimage, 2004. 22(3): p. 1060-75.
34
50. Sled, J.G., A.P. Zijdenbos, and A.C. Evans, A nonparametric method for automatic correction of intensity nonuniformity in MRI data. IEEE Trans Med Imaging, 1998. 17(1): p. 87-97.
51. Buckner, R.L., et al., A unified approach for morphometric and functional data analysis in young, old, and demented adults using automated atlas-based head size normalization: reliability and validation against manual measurement of total intracranial volume. Neuroimage, 2004. 23(2): p. 724-38.
52. Dewey, J., et al., Reliability and validity of MRI-based automated volumetry software relative to auto-assisted manual measurement of subcortical structures in HIV-infected patients from a multisite study. Neuroimage, 2010. 51(4): p. 1334-44.
53. Becker JT, Maruca V, Kingsley LA, et al. Factors affecting brain structure in men with HIV disease in the post-HAART era. Neuroradiology 2012;54:113-121.
54. Corti, M., et al., Magnetic resonance imaging findings in AIDS patients with central nervous system cryptococcosis. Rev Iberoam Micol, 2008. 25(4): p. 211-4.
55. Wuerfel, J., et al., Perivascular spaces--MRI marker of inflammatory activity in the brain? Brain, 2008. 131(Pt 9): p. 2332-40.
56. Barkhof, F., Enlarged Virchow-Robin spaces: do they matter? J Neurol Neurosurg Psychiatry, 2004. 75(11): p. 1516-7.
57. Groeschel, S., et al., Virchow-Robin spaces on magnetic resonance images: normative data, their dilatation, and a review of the literature. Neuroradiology, 2006. 48(10): p. 745-54.
58. Fayeye, O., et al., Mesencephalic enlarged Virchow-Robin spaces in a 6-year-old boy: a case-based update. Childs Nerv Syst. 26(9): p. 1155-60.
59. Persidsky, Y., et al., Mononuclear phagocytes mediate blood-brain barrier compromise and neuronal injury during HIV-1-associated dementia. J Leukoc Biol, 2000. 68(3): p. 413-22.
60. Avison, M.J., et al., Neuroimaging correlates of HIV-associated BBB compromise. J Neuroimmunol, 2004. 157(1-2): p. 140-6.
61. Valcour V, Chalermchai T, Sailasuta N, et al. Central Nervous System Viral Invasion and Inflammation During Acute HIV Infection. J Infect Dis 2012;206:275-282.
62. Sailasuta, N., K. Shriner, and B. Ross, Evidence of reduced glutamate in the frontal lobe of HIV-seropositive patients. NMR Biomed, 2009. 22(3): p. 326-31.
63. Ollenschlager, G., et al., Plasma amino acid pattern of patients with HIV infection. Clin Chem, 1988. 34(9): p. 1787-9.
64. Ferrarese, C., et al., Increased glutamate in CSF and plasma of patients with HIV dementia. Neurology, 2001. 57(4): p. 671-5.
65. Erdmann, N., et al., Glutamate production by HIV-1 infected human macrophage is blocked by the inhibition of glutaminase. J Neurochem, 2007. 102(2): p. 539-49.
66. Jiang, Z.G., et al., Glutamate is a mediator of neurotoxicity in secretions of activated HIV-1-infected macrophages. J Neuroimmunol, 2001. 117(1-2): p. 97-107.
67. Zhao, J., et al., Mitochondrial glutaminase enhances extracellular glutamate production in HIV-1-infected macrophages: linkage to HIV-1 associated dementia. J Neurochem, 2004. 88(1): p. 169-80.
68. Power, C., et al., Feline immunodeficiency virus causes increased glutamate levels and neuronal loss in brain. Neuroscience, 1997. 77(4): p. 1175-85.

35
TABLES AND FIGURES (PART I)
Table 1 Demographic and medical characteristics of HIV+ subjects with undetectable and detectable levels of PBMC HIV DNA Characteristic Undetectable HIVDNA Detectable HIV DNA p (< 10 copies/106 cells) (> 10 copies/106 cells)
Sample size 10 9 --
Sex (% male) 90 100 > 0.99
Mean age (years) 54.6 ± 8.3 55.8 ± 5.5 0.81
Mean education (years) 14.6 ± 2.8 14.4 ± 2.4 0.97
Mean current CD4 count (cells/mm³) 549.7 ± 220.8 431.9 ± 198.4 0.19
Mean nadir CD4 count (cells/mm³) 183.4 ± 192.4 156.9 ± 146.1 > 0.99
Mean years since HIV+ diagnosis 14.5 ± 5.9 17.4 ± 8.9 0.31
Plasma HIV RNA (#undetectable) 10 8 0.47
Median PBMC HIV DNA (copies/106 cells, min - max)
N/A 132 (29 - 28,901) --
Race or ethnicity (Caucasian/non-Caucasian)
7/3 8/1 0.58
Note: p-values are computed by Mann-Whitney (continuous variables) or chi-squared
tests (categorical variables)

36
Table 2 Mean cortical thickness for undetectable and detectable HIV DNA groups in each ROI, with corresponding Mann-Whitney p-values and % difference in thickness between groups.
Mean cortical thickness (mm) ROI
#
Vertices
Hemi-sphere
Anatomical location U-HIV D-HIV %
difference p
1 496 L Insula (superior circular sulcus) 2.75 ± 0.18 2.36 ± 0.16 -14.1 < 0.001
2 224 L Middle temporal gyrus
3.07 ± 0.34 2.49 ± 0.24 -18.8 0.002
3 213 L Superior temporal; inferior parietal (supramarginal gyrus)
2.97 ± 0.15 2.63 ± 0.17 -11.4 0.001
4 132 L Rostral middle frontal 2.12 ± 0.13 1.77 ± 0.25 -16.5 0.004
5 91 L Lateral orbitofrontal (orbital gyrus & H-shaped sulcus)
2.64 ± 0.17 2.31 ± 0.16 -12.5 0.003
6 73 L Superior temporal sulcus 2.62 ± 0.31 2.25 ± 0.21 -14.1 0.007
7 67 L Supramarginal gyrus 2.87 ± 0.19 2.44 ± 0.20 -14.9 < 0.001
8 49 L Precentral (central sulcus)
2.12 ± 0.12 1.88 ± 0.08 -11.4 < 0.001
9 43 L Paracentral gyrus & sulcus
2.40 ± 0.30 1.97 ± 0.22 -17.7 0.009
10 40 L Fusiform 2.24 ± 0.35 1.82 ± 0.11 -18.7 0.018
11 321 R Insula (short gyrus) 3.83 ± 0.21 3.20 ± 0.31 -16.3 < 0.001
12 313 R Orbital gyrus; medial orbital olfactory sulcus
2.56 ± 0.15 2.16 ± 0.14 -15.7 < 0.001
13 311 R Anterior and mid-anterior cingulate gyrus & sulcus
2.95 ± 0.18 2.53 ± 0.23 -14.2 0.001
14 301 R Superior frontal gyrus 3.00 ± 0.27 2.53 ± 0.16 -15.9 0.001
15 124 R Paracentral gyrus & sulcus
2.18 ± 0.12 1.90 ± 0.13 -12.6 < 0.001
16 107 R Temporal pole 4.09 ± 0.29 3.60 ± 0.22 -11.8 0.001
17 105 R Fusiform; parahippocampal
2.46 ± 0.09 2.23 ± 0.10 -90.6 < 0.001
18 70 R Pars triangularis 2.61 ± 0.22 2.27 ± 0.18 -12.8 0.00919 66 R Precuneus 2.51 ± 0.26 2.13 ± 0.19 -15.4 0.00120 52 R Insula (central insular
sulcus; long & short insular gyri)
3.23 ± 0.20 2.91 ± 0.11 -10.1 0.002
21 40 R Fusiform 3.36 ± 0.28 2.92 ± 0.32 -13.2 0.009

37
Table 3. Results of Spearman correlation between mean cortical ROI thickness and z-scores for Grooved Pegboard Test (Dominant Hand)
ROI Hemisphere Anatomical region ρ p
1 L Insula (superior circular sulcus) 0.64 0.007 2 L Middle temporal gyrus 0.31 0.193
3 L Superior temporal; inferior parietal (supramarginal gyrus)
0.86 0.388
4 L Rostral middle frontal 0.39 0.096 5 L Lateral orbitofrontal (orbital
gyrus and H-shaped sulcus) 0.49 0.037
6 L Superior temporal sulcus 0.44 0.063 7 L Supramarginal gyrus 0.63 0.008
8 L Precentral (central sulcus) 0.55 0.021
9 L Paracentral gyrus and sulcus 0.40 0.088 10 L Fusiform 0.57 0.015 11 R Insula (short gyrus) 0.36 0.130
12 R Orbital gyrus; medial orbital olfactory sulcus
0.43 0.066
13 R Anterior and mid-anterior cingulate gyrus and sulcus
0.58 0.015
14 R Superior frontal gyrus 0.36 0.130 15 R Paracentral gyrus and sulcus 0.71 0.003 16 R Temporal pole 0.55 0.019 17 R Fusiform; parahippocampal 0.44 0.061 18 R Pars triangularis 0.40 0.091 19 R Precuneus 0.62 0.009 20 R Insula (central insular sulcus;
long and short insular gyri) 0.47 0.045
21 R Fusiform 0.25 0.282
Regions in bold correlate significantly (p < 0.05) with Grooved Pegboard (Dominant) Test
z-scores.

38
Table 4 Mean cortical thickness for undetectable and detectable HIV DNA groups in each ROI, % difference in thickness between groups, and corresponding p-values computed using t-tests.
Mean cortical thickness (mm) ROI
Vertices Hemi-
sphere
Anatomical location U-HIV D-HIV %
difference
p
1 496 L Insula (superior circular sulcus)
2.75 ± 0.18 2.36 ± 0.16 -14.1 0.0001
2 224 L Middle temporal gyrus
3.07 ± 0.34 2.49 ± 0.24 -18.8 0.0006
3 213 L Superior temporal; inferior parietal (supramarginal gyrus)
2.97 ± 0.15 2.63 ± 0.17 -11.4 0.0003
4 132 L Rostral middle frontal
2.12 ± 0.13 1.77 ± 0.25 -16.5 0.0013
5 91 L Lateral orbitofrontal (orbital gyrus and
2.64 ± 0.17 2.31 ± 0.16 -12.5 0.0005
6 73 L Superior temporal sulcus
2.62 ± 0.31 2.25 ± 0.21 -14.1 0.0077
7 67 L Supramarginal 2.87 ± 0.19 2.44 ± 0.20 -14.9 0.0002
8 49 L Precentral (central sulcus)
2.12 ± 0.12 1.88 ± 0.08 -11.4 <0.0001
9 43 L Paracentral gyrus and sulcus
2.40 ± 0.30 1.97 ± 0.22 -17.7 0.0031
10 40 L Fusiform 2.24 ± 0.35 1.82 ± 0.11 -18.7 0.0033
11 321 R Insula (short gyrus)
3.83 ± 0.21 3.20 ± 0.31 -16.3 <0.0001
12 313 R Orbital gyrus; medial orbital olfactory sulcus
2.56 ± 0.15 2.16 ± 0.14 -15.7 <0.0001
13 311 R Anterior and mid-anterior cingulate gyrus and sulcus
2.95 ± 0.18 2.53 ± 0.23 -14.2 0.0003
14 301 R Superior frontal gyrus
3.00 ± 0.27 2.53 ± 0.16 -15.9 0.0002
15 124 R Paracentral gyrus and sulcus
2.18 ± 0.12 1.90 ± 0.13 -12.6 0.0002
16 107 R Temporal pole 4.09 ± 0.29 3.60 ± 0.22 -11.8 0.0009
17 105 R Fusiform; parahippocampal
2.46 ± 0.09 2.23 ± 0.10 -9.6 <0.0001
18 70 R Pars triangularis 2.61 ± 0.22 2.27 ± 0.18 -12.8 0.0018 19 66 R Precuneus 2.51 ± 0.26 2.13 ± 0.19 -15.4 0.0018 20 52 R Insula (central
insular sulcus; long and short insular gyri)
3.23 ± 0.20 2.91 ± 0.11 -10.1 0.0004
21 40 R Fusiform 3.36 ± 0.28 2.92 ± 0.32 -13.2 0.0048

39
Figure 1. Significance maps of statistically significant cortical thinning in group with
detectable PBMC HIV DNA. Regions in the parametric maps corresponding to areas of
statistical significance (p< 0.01) are shown as a color overlain on the average surface.
Yellow denotes regions where p<0.0001 (significance greater than 99.99% confidence
interval). A red/yellow overlay denotes areas where cortex of the detectable HIV DNA
group is thinner than that of the undetectable HIV DNA group; a blue overlay denotes
the opposite.

40
Figure 2. Locations of the ROIs.

41
TABLES AND FIGURES (PART II)
Table 1. Demographic and Clinical Characteristics of Study Participants
Variable SN (N=12)
U-HIV (N=10)
D-HIV (N=25)
SN vs. U-HIV
SN vs. D-HIV
D-HIV vs. U-HIV
Age (years) 53.5 ± 10.7 54.1 ± 10.7 53.8 ± 9.6 0.97 0.69 0.90 Male gender 12 (100%) 9 (90%) 23 (92%) 0.85 Education (years) 15.0 ± 1.8 14.8 ± 3.0 13.9 ± 2.4 0.49 0.18 0.60 Duration of HIV infection (years) -- 14.50 ± 5.93 15.80 ± 7.88 -- -- 0.45
CD4 (cells/mm3) -- 549.7 ± 220.8 521.5 ± 281.3 -- -- 0.55 Nadir CD4 count (cells/mm3) (min – max)
-- 183.5 ± 192.4 (4.0 – 600.0)
155.4 ± 124.6 (0 – 450.0)
-- -- 0.96
Plasma HIV RNA (# undetectable)
-- 10 (100%) 24 (96%) -- -- 0.52
PBMC HIV DNA (log10 copies/106 cells)
-- -- 2.59 ± 0.97 -- -- --
CPE score -- 6.80 ± 1.55 7.76 ± 2.52 -- -- 0.17
P-values are computed by Mann-Whitney (continuous variables) or chi-squared test
(categorical variables). Values given are means ± S.D. except when expressed as n (%).

42
Data obtained by structural MRI. Values are given as mean ± SD. P-values for pairwise
group comparisons were computed by ANCOVA, controlling for age, followed by
corrections for multiple comparisons using Fisher’s PLSD method.
Table 2. Regional Brain Volumes as Percentage of Intracranial Volume (Mean ± SD)
p-value Brain region
SN (N=12)
U-HIV (N=10)
D-HIV (N=25)
ANCOVA p-value SN vs.
U-HIV SN vs. D-HIV
D-HIV vs. U-HIV
Caudate 0.535 ± 0.081
0.497± 0.050
0.472 ± 0.047
0.013 0.13 0.0032 0.25
Amygdala 0.310 ± 0.046
0.269 ± 0.044
0.266 ± 0.046
0.028 0.041 0.0093 0.88
Hippocampus 0.622 ± 0.094
0.577 ± 0.070
0.539 ± 0.074
0.016 0.18 0.0043 0.21
Thalamus 1.023 ± 0.190
0.969 ± 0.163
0.865 ± 0.114
0.0065 0.37 0.0024 0.053
Nucleus accumbens
0.098 ± 0.014
0.088 ± 0.019
0.086 ± 0.015
0.067 0.11 0.019 0.68
Putamen 0.855 ± 0.114
0.796 ± 0.152
0.749 ± 0.139
0.078 0.30 0.024 0.33
Globus pallidus 0.237 ± 0.032
0.236 ± 0.053
0.215 ± 0.033
0.16 -- -- --
Subcortical GM 12.623 ± 1.550
12.426 ± 1.850
11.135 ± 1.360
0.0091 0.76 0.0064 0.024
Cortex (GM) 32.167 ± 3.549
31.018 ± 3.894
29.055 ± 2.495
0.014 0.37 0.0048 0.086
Cerebral WM 37.376 ± 4.050
34.750 ± 5.743
33.590 ± 3.574
0.043 0.14 0.012 0.45
Cerebellar GM 6.779 ± 0.971
6.958 ± 1.154
6.015 ± 1.051
0.028 0.69 0.044 0.020
Cerebellar WM 2.353 ± 0.443
2.225 ± 0.405
2.061 ± 0.433
0.16 -- -- --
Brainstem 1.599 ± 0.212
1.520 ± 0.265
1.416 ± 0.157
0.034 0.35 0.011 0.17
Lateral ventricles
1.136 ± 0.495
1.496 ± 0.708
1.690 ± 0.806
0.025† 0.19 0.017 0.42
† Model included a significant (p=0.034) group-by-age interaction.

43
Table 3. Brain Metabolite Ratios (Mean ± SD)
p-value Metabolite and region
SN (N=12)
U-HIV (N=10)
D-HIV (N=25) SN vs.
U-HIV SN vs. D-HIV
D-HIV vs. U-HIV
Basal ganglia
NAA/Cr 1.27 ± 0.11 1.26 ± 0.12 1.34 ± 0.14 0.79 0.22 0.27 Cho/Cr 0.26 ± 0.03 0.26 ± 0.06 0.28 ± 0.05 0.98 0.25 0.41 MI/Cr 0.35 ± 0.23 0.91 ± 0.92 0.40 ± 0.37 0.06 0.71 0.05 Glu/Cr 0.82 ± 0.27 1.11 ± 0.21 0.86 ± 0.38 0.08 0.80 0.20 Frontal WM NAA/Cr 1.36 ± 0.10 1.42 ± 0.10 1.37 ± 0.09 0.18 0.74 0.19 Cho/Cr 0.25 ± 0.03 0.30 ± 0.06 0.26 ± 0.03 0.01 0.16 0.02 MI/Cr 0.63 ± 0.13 0.62 ± 0.23 0.68 ± 0.13 0.84 0.39 0.44 Glu/Cr 0.88 ± 0.22 0.98 ± 0.13 1.02 ± 0.13 0.25 0.04 0.54 Parietal GM NAA/Cr 1.26 ± 0.08 1.33 ± 0.12 1.30 ± 0.11 0.12 0.20 0.56 Cho/Cr 0.18 ± 0.02 0.18 ± 0.02 0.18 ± 0.02 0.77 0.22 0.48 MI/Cr 0.61 ± 0.09 0.60 ± 0.23 0.60 ± 0.18 0.84 0.89 0.95 Glu/Cr 1.10 ± 0.09 1.09 ± 0.24 1.12 ± 0.19 0.92 0.71 0.69
P-values for each group comparison were computed by ANCOVA, adjusting for age,
without correction for multiple comparisons.

44
Figure 1. FreeSurfer’s labeling of subcortical structures.

45
Figure 2. Normalized regional brain volumes that differ significantly among SN, U-HIV
and D-HIV groups. P-values were obtained from ANCOVA with correction for multiple
comparisons.

46
Figure A-1. MRS voxel locations in left-hemisphere frontal white matter, right-
hemisphere basal ganglia and posterior gray matter for acquisition of spectra by
magnetic resonance spectroscopy.