Embed Size (px)
Citation preview

8/13/2019 Dmd Accuracy Web Versions
http://slidepdf.com/reader/full/dmd-accuracy-web-versions 1/41
Forecast Accuracy and
Safety Stock StrategiesÓ
White Paper03/25/2009
10G Roessler Rd. Suite 508, Woburn, MA 01801 – Email: [email protected] – www.demandplanning.net
1© 2007-2009 Demand Planning LLC
By Mark Chockalingam Ph.D.

8/13/2019 Dmd Accuracy Web Versions
http://slidepdf.com/reader/full/dmd-accuracy-web-versions 2/41
Forecast Accuracy - Abstract
Accurate and timely demand plans are a vital component of an
effective supply chain.
• Forecast accuracy at the primitive SKU level is critical for proper
allocation of supply chain resources.
• Inaccurate demand forecasts often would result in supply imbalances
when it comes to meeting customer demand.
In this white paper, we will discuss the process of measuring
forecast accuracy, the pros and cons of different accuracy
metrics, and the time-lag with which accuracy should be
measured. We will also discuss a method to identify and track
forecast bias.
© 2007-2009 Demand Planning LLC 2
8/13/2019 Dmd Accuracy Web Versions
http://slidepdf.com/reader/full/dmd-accuracy-web-versions 3/41
Demand Plan
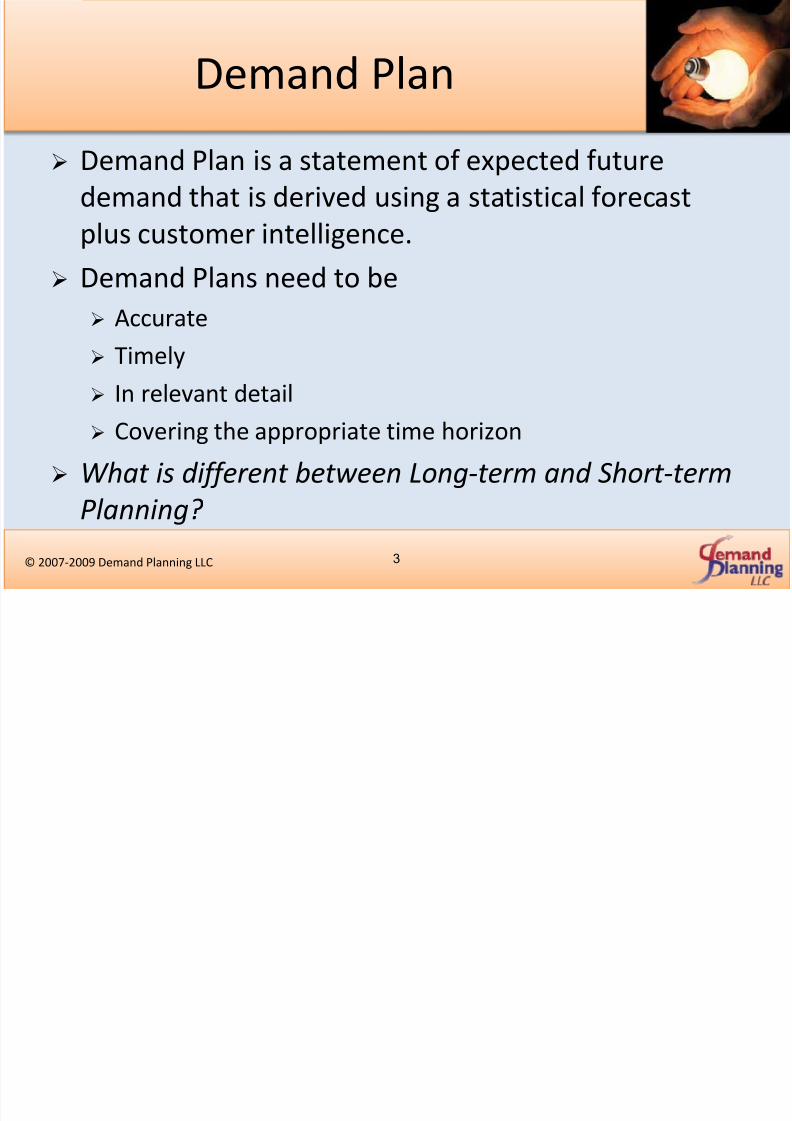
Ø Demand Plan is a statement of expected future
demand that is derived using a statistical forecast
plus customer intelligence.
Ø Demand Plans need to beØ Accurate
Ø Timely
Ø In relevant detail
Ø Covering the appropriate time horizon
Ø What is different between Long-term and Short-term
Planning?
© 2007-2009 Demand Planning LLC 3

8/13/2019 Dmd Accuracy Web Versions
http://slidepdf.com/reader/full/dmd-accuracy-web-versions 4/41
Short-term Planning
ØCritical for tactical planning
ØLimited flexibility to reschedule resources
So Make or Break it!
ØInaccurate forecast means
• Lost sale
• Lost customer
• Excess inventory• Other inefficiencies
© 2007-2009 Demand Planning LLC 4
8/13/2019 Dmd Accuracy Web Versions
http://slidepdf.com/reader/full/dmd-accuracy-web-versions 5/41
Long-term Forecasts
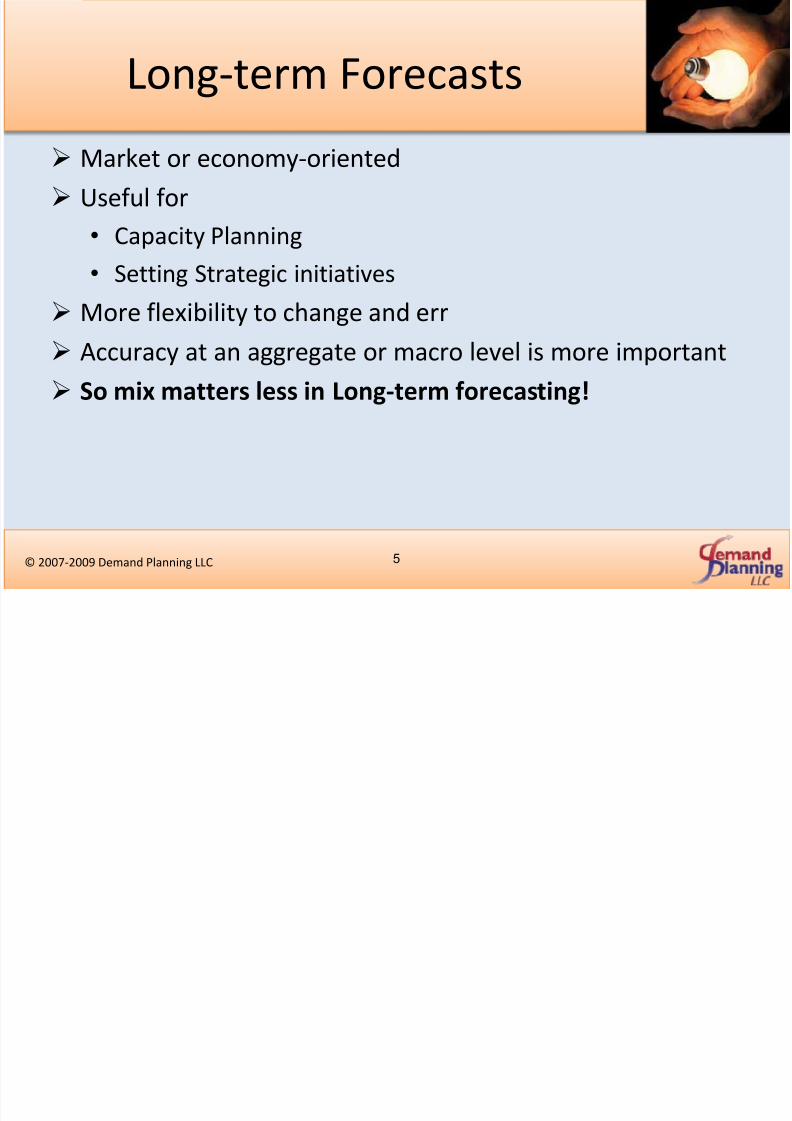
Ø Market or economy-oriented
Ø Useful for
• Capacity Planning
• Setting Strategic initiativesØ More flexibility to change and err
Ø Accuracy at an aggregate or macro level is more important
Ø So mix matters less in Long-term forecasting!
© 2007-2009 Demand Planning LLC 5

8/13/2019 Dmd Accuracy Web Versions
http://slidepdf.com/reader/full/dmd-accuracy-web-versions 6/41
Right amount, wrong SKU!
© 2007-2009 Demand Planning LLC 6
SKU A SKU B Total
Forecast 75 25 100
Actual 25 75 100
Accuracy 0% 0% 100%

8/13/2019 Dmd Accuracy Web Versions
http://slidepdf.com/reader/full/dmd-accuracy-web-versions 7/41
Forecast Error
ØForecast Error is the deviation of the Actual
from the forecasted quantity
• Error = absolute value of {(Actual – Forecast)}• Error (%) = |(A – F)|/A
ØDeviation vs. Direction
• The first is the magnitude of the Error
• The second implies bias, if persistent
© 2007-2009 Demand Planning LLC 7

8/13/2019 Dmd Accuracy Web Versions
http://slidepdf.com/reader/full/dmd-accuracy-web-versions 8/41
Forecast Accuracy
Ø Forecast Accuracy is a measure of how close the ActualDemand is to the forecasted quantity.• Forecast Accuracy is the converse of Error
• Accuracy (%) = 1 – Error (%)
Ø However we truncate the Impact of Large Forecast Errors at100%.
Ø More formally
• Actual = Forecast => 100% Accuracy
• Error > 100% => 0% Accuracy• We constrain Accuracy to be between 0 and 100%
Ø More Rigorously,• Accuracy = maximum of (1 – Error, 0)
© 2007-2009 Demand Planning LLC 8
8/13/2019 Dmd Accuracy Web Versions
http://slidepdf.com/reader/full/dmd-accuracy-web-versions 9/41
Example (continued…)
© 2007-2009 Demand Planning LLC 9
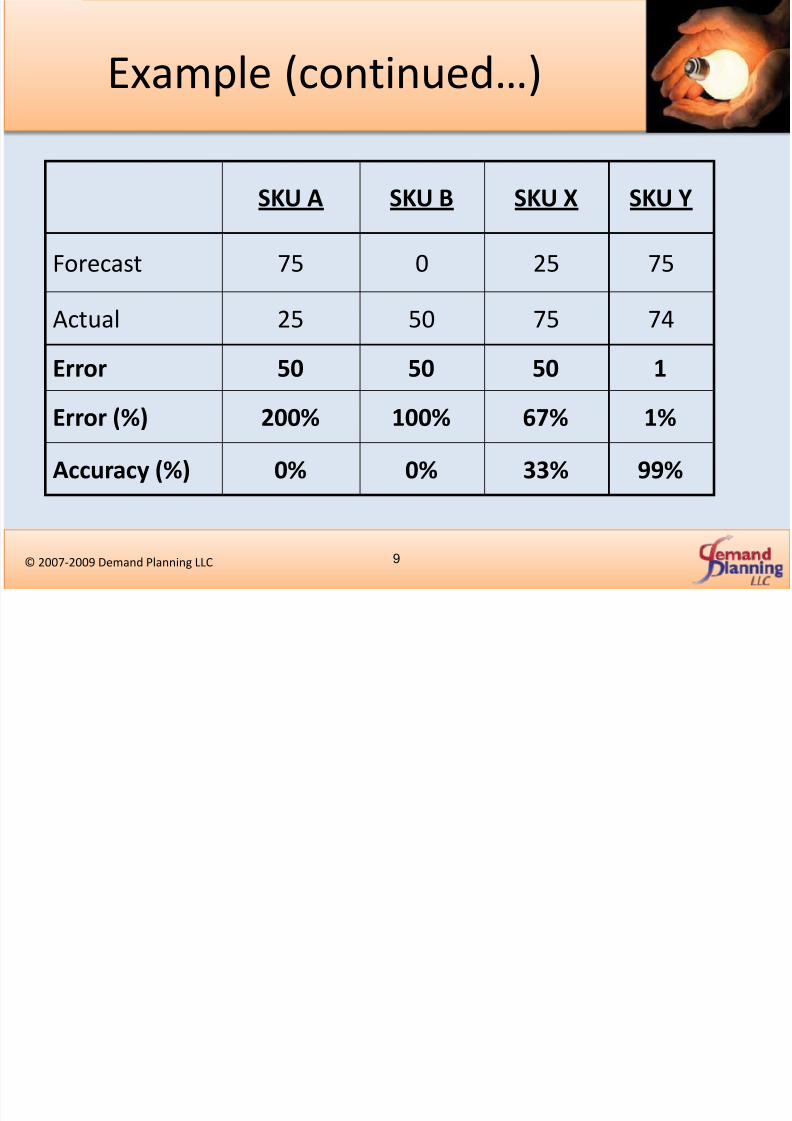
SKU A SKU B SKU X SKU Y
Forecast 75 0 25 75
Actual 25 50 75 74
Error 50 50 50 1
Error (%) 200% 100% 67% 1%
Accuracy (%) 0% 0% 33% 99%

8/13/2019 Dmd Accuracy Web Versions
http://slidepdf.com/reader/full/dmd-accuracy-web-versions 10/41
CALCULATION METHODOLOGYØHow to calculate a performance measure for forecast accuracy?
ØHow do we aggregate errors across products and customers?
ØWhat are the different error measurements available?
ØHow do you define the Mean Absolute Percent Error?
ØWhat is the weighted MAPE?
10© 2007-2009 Demand Planning LLC
How do you measure value chain performance? Find out at the DemandPlanning.Net metrics workshop!

8/13/2019 Dmd Accuracy Web Versions
http://slidepdf.com/reader/full/dmd-accuracy-web-versions 11/41
Aggregating Errors
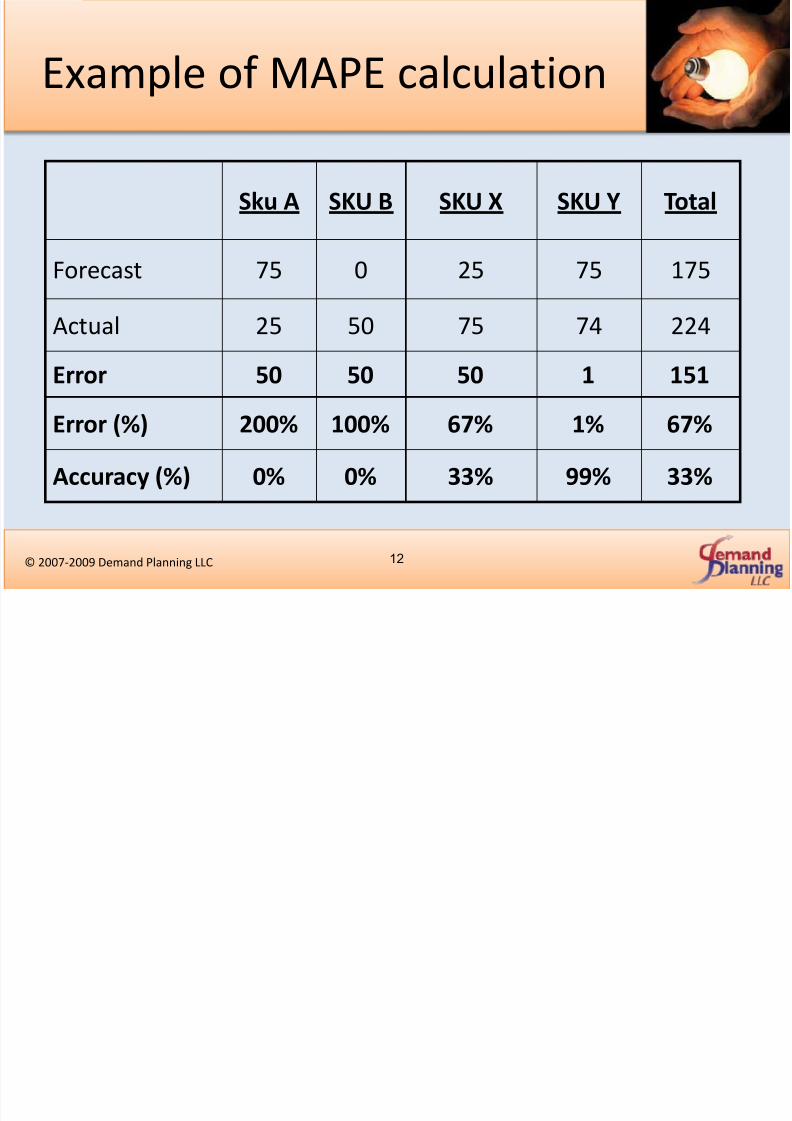
To compute one metric of accuracy across a
group of items, we need to calculate an Average Error
Ø Simple but Intuitive Method
• Add all the absolute errors across all items
• Divide the above by the total actual quantity
• Define the average error as Sum of all Errors divided by the
sum of Actual shipments
Ø This is known as MAPE or
Mean Absolute Percentage Error!!!!
© 2007-2009 Demand Planning LLC 11
8/13/2019 Dmd Accuracy Web Versions
http://slidepdf.com/reader/full/dmd-accuracy-web-versions 12/41
Example of MAPE calculation
© 2007-2009 Demand Planning LLC 12
Sku A SKU B SKU X SKU Y Total
Forecast 75 0 25 75 175
Actual 25 50 75 74 224
Error 50 50 50 1 151
Error (%) 200% 100% 67% 1% 67%
Accuracy (%) 0% 0% 33% 99% 33%

8/13/2019 Dmd Accuracy Web Versions
http://slidepdf.com/reader/full/dmd-accuracy-web-versions 13/41
Different ways to err!
ØMean Percent Error
Ø
Mean Absolute Percent Error orMAPE
ØMean Squared Error
ØRoot Mean Squared Error
© 2007-2009 Demand Planning LLC 13

8/13/2019 Dmd Accuracy Web Versions
http://slidepdf.com/reader/full/dmd-accuracy-web-versions 14/41
Different ways to err!
Ø Mean Percent Error is an Average of the Absolute PercentageError. Very rarely used!
Ø Mean Absolute Percent Error is the Sum of Absolute errorsdivided by the Sum of the Actuals
• MAPE = å|(A-F)|/å A• MAPE can also be construed as the Average Absolute Error divided
by the Average Actual quantity
• Most widely used measure
Ø Mean Squared Error is the Average of the sum-squared errors.
Since we use the root of such average, this is also known asRMSE
• RMSE = SQRT [(A-F)² / N]
© 2007-2009 Demand Planning LLC 14

8/13/2019 Dmd Accuracy Web Versions
http://slidepdf.com/reader/full/dmd-accuracy-web-versions 15/41
Illustration of Error Metrics
© 2007-2009 Demand Planning LLC 15
Forecast Actual Error Abs. Error Pct. Error Sqrd. Error
Sku A 3 1 -2 2 200% 4
Sku B 0 50 50 50 100% 2,500
Sku X 25 75 50 50 67% 2,500
Sku Y 75 74 -1 1 1% 1 Sku Z 100 75 -25 25 33% 625
Total 203 275 72 128 5,630
Average 40.6 55 14.4 25.6 80% 1,126
with A w/o Sku A
Mean Percent Error = 80% 50%Mean Absolute Percent Error = 47% 46%
Root Mean Squared Error = 34 38
RMSE as % of Actuals = 61% 55%

8/13/2019 Dmd Accuracy Web Versions
http://slidepdf.com/reader/full/dmd-accuracy-web-versions 16/41
Why MAPE?
Ø MPE
• very unstable
• will be skewed by small values
• In the Example, Sku A drives most of the Error.Ø RMSE
• Rigorous Error measure
• Not as easy as MAPE
Ø MAPE is simple and elegant while robust as acomputational measure!
© 2007-2009 Demand Planning LLC 16

8/13/2019 Dmd Accuracy Web Versions
http://slidepdf.com/reader/full/dmd-accuracy-web-versions 17/41
MAPES!!
Ø The simple MAPE is volume-weighted rather than value
weighted.
• Assumes the absolute error on each item is equally
important.• Large error on a low-value item or C item can unfairly skew
the overall error.
Ø To overcome this, MAPE can be value weighted either
by standard cost or list price• High-value items will influence the overall error
© 2007-2009 Demand Planning LLC 17

8/13/2019 Dmd Accuracy Web Versions
http://slidepdf.com/reader/full/dmd-accuracy-web-versions 18/41
WMAPE
ØWeighted Mape or Value weighted Mape
• WMAPE = å(w*|(A-F))|/ å(w*A)
• Both Error and Actuals are weighted
• The weight can even be a subjective measure based oncriticality of the item.
Ø High-value items will influence the overall error
Ø Highly correlated with safety stock requirements
Ø Very useful in setting safety stock strategies
© 2007-2009 Demand Planning LLC 18

8/13/2019 Dmd Accuracy Web Versions
http://slidepdf.com/reader/full/dmd-accuracy-web-versions 19/41
LAG AND BIASØWhat is forecast bias?
ØHow to measure forecast bias?
ØWhat is the forecast lag for evaluating forecasts?
ØHow do you determine forecast lags?
19© 2007-2009 Demand Planning LLC
New to SAP APO? Learn the best strategies and techniques with a DemandPlanning.Net APO workshop!

8/13/2019 Dmd Accuracy Web Versions
http://slidepdf.com/reader/full/dmd-accuracy-web-versions 20/41
Forecast Actual Error Abs. Error Pct. Error
Sku A 3 1 -2 2 200%
Sku B 0 50 50 50 100%
Sku X 25 75 50 50 67%
Sku Y 75 74 -1 1 1%
Sku Z 100 75 -25 25 33%
Total 203 275 72 128
Average 40.6 55 14.4 25.6 80%
Mean Absolute Percent Error = 47%
Absolute Accuracy (%) 53%
Arithmetic Accuracy 135%
Absolute vs. Arithmetic!
© 2007-2009 Demand Planning LLC 20

8/13/2019 Dmd Accuracy Web Versions
http://slidepdf.com/reader/full/dmd-accuracy-web-versions 21/41
Absolute vs. Arithmetic
ØAbsolute accuracy is the converse of MAPE.
• A 47% MAPE implies accuracy of 53%.
ØArithmetic Accuracy is a measure of total
business performance regardless of the mixissues
• Defined as a simple quotient of Actual vs. Forecast
•Directionally offsetting errors result in accuracyclose to 100%
• Arithmetic Accuracy is also known as ForecastAttainment.
© 2007-2009 Demand Planning LLC 21

8/13/2019 Dmd Accuracy Web Versions
http://slidepdf.com/reader/full/dmd-accuracy-web-versions 22/41
Lead vs. Lag
Ø Setting measurement standards will be influenced by
• Production Lead time
• Batch Size
Ø Production Lead time dictates the Forecast Lag to be
used in computing accuracy
• Longer the lead time, larger is the forecast Lag
• Larger the Lag, lower the forecast accuracy
© 2007-2009 Demand Planning LLC 22

8/13/2019 Dmd Accuracy Web Versions
http://slidepdf.com/reader/full/dmd-accuracy-web-versions 23/41
Lag Analysis
© 2007-2009 Demand Planning LLC 23
March April May June July
March 125 130 175 210 225
Lag 0 1 2 3 4
April 135 185 220 235 Lag 0 1 2 3
May 170 225 225
Lag 0 1 2
Actuals 128 135 172 225
Lag 2Forecast
Evolution of
forecast
8/13/2019 Dmd Accuracy Web Versions
http://slidepdf.com/reader/full/dmd-accuracy-web-versions 24/41
Forecast Bias
Bias is the tendency for error to be persistent in
one direction. Most bias can be classified into
one of two main categories:
ØForecaster bias occurs when error is in onedirection for all items.
ØBusiness Process Bias occurs when error is in
one direction for specific items over a periodof time.
© 2007-2009 Demand Planning LLC 24

8/13/2019 Dmd Accuracy Web Versions
http://slidepdf.com/reader/full/dmd-accuracy-web-versions 25/41
Forecast Bias – Case 1
© 2007-2009 Demand Planning LLC 25
Forecast Actual Error Abs. Error Pct. Error Accuracy
Sku A 3 1 -2 2 200% 0%
Sku B 50 25 -25 25 100% 0%
Sku X 75 25 -50 50 200% 0%
Sku Y 75 74 -1 1 1% 99%
Sku Z 100 75 -25 25 33% 67%
Total 303 200 -103 103 52% 48%
Average 60.6 40 -20.6 20.6
Absolute Accuracy 48%
Arithmetic Accuracy 66%

8/13/2019 Dmd Accuracy Web Versions
http://slidepdf.com/reader/full/dmd-accuracy-web-versions 26/41
Type 1 Bias
Ø This is a subjective bias. Occurs due to human intervention(often erroneous) to build unnecessary forecast safeguards.Examples:
• Increase forecast to match Division Goal
• Adjust forecast to reflect the best case volume scenario inresponse to a promotion
• Building a forecast component to reflect production uncertainty(in effect, doubling the safety stock)
• Organization’s natural tendency to over-forecast due to high
visibility of product outs compared to excess inventoryØ This bias results in
• Increased inventories and
• Higher risk of obsolescence.
© 2007-2009 Demand Planning LLC 26
8/13/2019 Dmd Accuracy Web Versions
http://slidepdf.com/reader/full/dmd-accuracy-web-versions 27/41
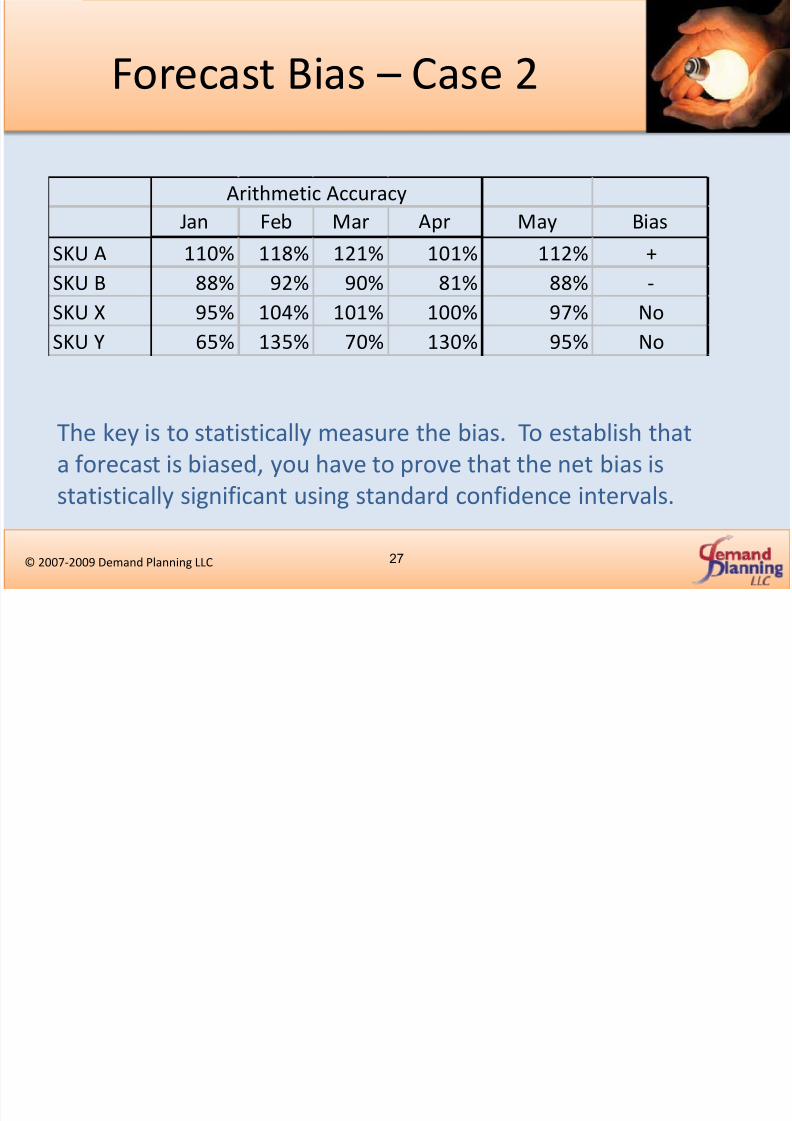
Forecast Bias – Case 2
© 2007-2009 Demand Planning LLC 27
The key is to statistically measure the bias. To establish that
a forecast is biased, you have to prove that the net bias is
statistically significant using standard confidence intervals.
Jan Feb Mar Apr May Bias
SKU A 110% 118% 121% 101% 112% +
SKU B 88% 92% 90% 81% 88% -SKU X 95% 104% 101% 100% 97% No
SKU Y 65% 135% 70% 130% 95% No
Arithmetic Accuracy

8/13/2019 Dmd Accuracy Web Versions
http://slidepdf.com/reader/full/dmd-accuracy-web-versions 28/41
Type 2 Bias
Ø This bias is a manifestation of business process specific to the
product.
Ø This can either be an over-forecasting or under-forecasting
bias. This bias is hard to control, unless the underlying
business process itself is restructured.
Ø Examples:
• Items specific to a few customers
• Persistent demand trend when forecast adjustments are slow to
respond to such trends
• Distribution changes of an item over time
• Either item getting distribution across new customers over time or
• Item slowly going through an attrition with delistments over time.
© 2007-2009 Demand Planning LLC 28

8/13/2019 Dmd Accuracy Web Versions
http://slidepdf.com/reader/full/dmd-accuracy-web-versions 29/41
Bias – Is there a remedy?
Ø If bias is type 1, correcting the forecast is easy but making the
organization adjust to unbiased forecasting is the harder sell.
• Since Arithmetic accuracy conveys similar information as
absolute accuracy, using a mass counter-adjustment is the
easiest solution.• In Case 1, slashing the forecast across the board by 33% would
dramatically increase the accuracy.
Ø If bias is type 2
• Each item bias needs to examined for specific process reasons.• Process needs to be re-adjusted
© 2007-2009 Demand Planning LLC 29

8/13/2019 Dmd Accuracy Web Versions
http://slidepdf.com/reader/full/dmd-accuracy-web-versions 30/41
Cut forecast by 33% in Case 1
© 2007-2009 Demand Planning LLC 30
Original
Forecast
Rev.
forecast Actual Abs. Error Pct. Error Accuracy
Sku A 3 2.01 1 1 101% 0%
Sku B 50 33.5 25 9 34% 66%
Sku X 75 50.25 25 25 101% 0%
Sku Y 75 50.25 74 24 32% 68%
Sku Z 100 67 75 8 11% 89%
Total 303 203.01 200 66.51 33% 67%
Average 60.6 40.602 40 13.302
Absolute Accuracy 67%
Arithmetic Accuracy 99%

8/13/2019 Dmd Accuracy Web Versions
http://slidepdf.com/reader/full/dmd-accuracy-web-versions 31/41
Industry Benchmark
MeasurementØ We measure item level absolute accuracy using an one-month
bucket and a three-month bucket.
Ø The one-month accuracy is measured using a two-month lagforecast ie. May actuals measured using March forecast
Ø The three-month accuracy is measured using an one-monthlag forecast ie. May-July actuals using April forecast.
Ø Business policy issue
• Quarter close effects
• Unannounced business dealsØ The above have an effect on one-month accuracy but NOT on
three-month accuracy.
© 2007-2009 Demand Planning LLC 31

8/13/2019 Dmd Accuracy Web Versions
http://slidepdf.com/reader/full/dmd-accuracy-web-versions 32/41
SAFETY STOCKØWhy do we need safety stock?
ØIs safety stock related to Forecast Accuracy?
ØHow do you calculate safety stock levels?
32© 2007-2009 Demand Planning LLC
Want to improve your process? DemandPlanning.Net Diagnostic consulting is a good place to start!

8/13/2019 Dmd Accuracy Web Versions
http://slidepdf.com/reader/full/dmd-accuracy-web-versions 33/41
Safety stock
Ø Safety stock is defined
• as the component of total inventory needed to
cover unanticipated fluctuation in demand or
supply or both• As the inventory needed to defend against a
forecast error
Ø Hence Forecast error is a key driver of safetystock strategies.
© 2007-2009 Demand Planning LLC 33

8/13/2019 Dmd Accuracy Web Versions
http://slidepdf.com/reader/full/dmd-accuracy-web-versions 34/41
Safety Stock Calculation
ØUsing all three determinants of Safety stock,
• SS = SL * Forecast Error * ÖLead TimeØ SL is Customer Service Level
• Generally set at 98% (why?)
• Which translates into a multiple of 2.054 (why?)
Ø Forecast Error used is the Root Mean Squared Error
Ø Lead time is either weeks or months, consistent with the forecastmeasurement period.
© 2007-2009 Demand Planning LLC 34

8/13/2019 Dmd Accuracy Web Versions
http://slidepdf.com/reader/full/dmd-accuracy-web-versions 35/41
Importance of Forecast Error
ØLead times are externally determined
• Supplier Considerations
• Structure of your Supply Chain
ØService Level Targets are typically in a narrow
band between 95% and 99.5%
ØHence Forecast Error is the big driver of safety
stock.
© 2007-2009 Demand Planning LLC 35

8/13/2019 Dmd Accuracy Web Versions
http://slidepdf.com/reader/full/dmd-accuracy-web-versions 36/41
Example
© 2007-2009 Demand Planning LLC 36
Sku X Sku Y Sku Z
Lead Time Months 0.75 2 2
Service Level 98% 2.054 2.054 2.054
Forecast Error Monthly 16 11 5
Safety Stock Units 28 32 15
8/13/2019 Dmd Accuracy Web Versions
http://slidepdf.com/reader/full/dmd-accuracy-web-versions 37/41
Forecast Bias
Ø Does Bias affect Safety stock?
• Depends on whether it is type 1 or type 2 bias.
• If bias can be quantified, then there is no uncertainty and hence
no need for additional safety stock
Ø If this is a type 1 bias, adjustment is easy
• Add or subtract the bias to the forecasted quantity to arrive at
your supply
• Safety stock needs to be adjusted down to match the error
contributed by the bias
© 2007-2009 Demand Planning LLC 37

8/13/2019 Dmd Accuracy Web Versions
http://slidepdf.com/reader/full/dmd-accuracy-web-versions 38/41
ABOUT USØWho is the author?
ØWhat is Demand Planning LLC?
ØWho are Demand Planning LLC clients?
ØHow can you contact the author of this paper?
38© 2007-2009 Demand Planning LLC

8/13/2019 Dmd Accuracy Web Versions
http://slidepdf.com/reader/full/dmd-accuracy-web-versions 39/41
About The Author
© 2007-2009 Demand Planning LLC 39
Dr. Mark Chockalingam is Founder and Managing Principal, Demand
Planning LLC, a Business Process and Strategy Consultancy firm. He
has conducted numerous training and strategy facilitation
workshops in the US and abroad, and has worked with a variety of
clients from Fortune 500 companies such as Wyeth, Miller SAB,
FMC, Teva to small and medium size companies such as Au Bon
pain, Multy Industries, Ticona- a division of Celanese AG.
Prior to establishing his consulting practice, Mark has held important supply chain
positions with several manufacturing companies. He was Director of Market Analysis and
Demand Planning for the Gillette Company (now part of P&G), and prior to that he led the
Sun care, Foot care and OTC forecasting processes for Schering-Plough ConsumerHealthCare.
Mark has a Ph. D. in Finance from Arizona State University, an MBA from the University of
Toledo and is a member of the Institute of Chartered Accountants of India.

8/13/2019 Dmd Accuracy Web Versions
http://slidepdf.com/reader/full/dmd-accuracy-web-versions 40/41
About Demand Planning LLC
© 2007-2009 Demand Planning LLC 40
Demand Planning LLC
has worked with…
• NStar
• Abbott Labs
• Wyeth
• Au Bon Pain
• Teva• Celanese
• Hill’s Pet Nutrition
• Campbell’s Soups
• Miller Brewing co.
• Texas Instruments
• Hewlett Packard
• World Kitchen• Lifetime Products
• FMC Lithium
• McCain Foods
• Lnoppen, Shanghai
• Vistakon J&J,
Malaysia
• Pacific Cycles
•Smead• White Wave foods
• Ross Products
• Fox entertainment
• Limited Brands
• Nomacorc
• F. Schumaker
Demand Planning LLC is a consulting boutique
comprised of seasoned experts with real-world
supply chain experience and subject-matter
expertise in demand forecasting, S&OP, Customer
planning, and supply chain strategy.
We provide process and strategy consulting services
to customers across a variety of industries -pharmaceuticals, CPG, High-Tech, Foods and
Beverage, Quick Service Restaurants and Utilities.
Through our knowledge portal DemandPlanning.Net,
we offer a full menu of training programs through in-
person and online courses in Demand Forecast
Modeling, S&OP, Industry Forecasting, collaborative
Forecasting using POS data.DemandPlanning.Net also offers a variety of
informational articles and downloadable calculation
templates, and a unique Demand Planning discussion
forum.

8/13/2019 Dmd Accuracy Web Versions
http://slidepdf.com/reader/full/dmd-accuracy-web-versions 41/41
Contact Us
Mark Chockalingam, Ph.D.
Demand Planning, LLC
10G Roessler Road, Suite 508
Woburn, MA 01801
Email: [email protected]
Web: www.demandplanning.net
Phone: (781)995-0685
41