Embed Size (px)
Citation preview

DLAS Document Summary
DLAS Document Summary
2014-2015 Teacher Salary Survey Results
Author
Department of Education
Enabling Authority
Item 136, paragraph B.12., Chapter 3, 2014 Special Session I Acts of Assembly
Executive Summary
Item 136, paragraph B.12., Chapter 3, 2014 Special Session I Acts of Assembly directs
the Superintendent of Public Instruction to provide a report on the status of teacher
salaries, by local school division, to the Governor and the Chairmen of the Senate
Finance and House Appropriations Committees. Beginning in 2008-2009, the report
also includes information on starting salaries by school division and average teacher
salaries by school.
Department of Education staff prepared the report based on Annual School Report
(ASR) expenditure data submitted by each school division and regional program.
Statewide and school division salary averages were computed for fiscal years 2013 and
2014. The report shows salary information from fiscal years 2013, 2014, and 2015 for
comparative purposes. Year-to-year percentage change in salary averages is shown
for statewide and division data.
According to these calculations, average salaries are expected to increase for
classroom teachers, assistant principals, and principals from fiscal year 2014 to fiscal
year 2015.
The average budgeted classroom teacher salary for fiscal year 2015 is $54,516; this is
a 1.30 percent increase from fiscal year 2014.
The average budgeted principal salary for fiscal year 2015 is $97,471; this is a 2.14
percent increase from fiscal year 2014.
The average budgeted assistant principal salary for fiscal year 2015 is $80,908; this is a
1.36 percent increase from fiscal year 2014.

Table of Contents
Statewide Averages - Summary
Classroom Teacher …………………………………………………………………………………………………Page 3
Principal……………………………………………………………………………………………………...Page 3
Assistant Principal………………………………………………………………………………………………………Page 3
Virginia Teacher Salaries Compared to National and Regional Averages
Comparison………………………………………………………………………………………………………Page 4
School Division and Regional Program Detail –
Fiscal Years (FY) 2013, 2014, and 2015
Classroom Teacher Salaries - FY 2013, 2014, and 2015………………………………………………………………………………………………………Page 5
Principal Salaries - FY 2013, 2014, and 2015………………………………………………………………………………………………………Page 9
Assistant Principal Salaries - FY 2013, 2014, and 2015………………………………………………………………………………………………………Page 13
School Division Narrative on Proposed FY 2015 Salary Actions
School Division Narrative………………………………………………………………………………………………………Page 18
Classroom Teacher Starting Salaries - FY 2015.…………………………………..Page 23
Average Teacher Salaries By School - FY 2015……………………………………..Page 27
Appendix - A
Mandate for the Reporting Requirement………………………………………………………………………………………………………Page 63
Appendix - B
Explanation of average salary calculations ………………………………………Page 64
FY 2015 Salary Survey - Table of Contents
January 14, 2015
Page 2

Statewide:
FY 2013 Actual Average Teacher Salary $52,923
FY 2014 Actual Average Teacher Salary 2 $53,818
Average Percentage Change, FY 2013 to FY 2014 1.69%
FY 2015 Budgeted Average Teacher Salary 3 $54,516
Budgeted Percentage Change, FY 2014 to FY 2015 1.30%
Statewide:
FY 2013 Actual Average Principal Salary $93,370
FY 2014 Actual Average Principal Salary 2 $95,431
Average Percentage Change, FY 2013 to FY 2014 2.21%
FY 2015 Budgeted Average Principal Salary 3 $97,471
Budgeted Percentage Change, FY 2014 to FY 2015 2.14%
Statewide:
FY 2013 Actual Average Assistant Principal Salary $77,506
FY 2014 Actual Average Assistant Principal Salary 2 $79,825
Average Percentage Change, FY 2013 to FY 2014 2.99%
FY 2015 Budgeted Average Assistant Principal Salary 3 $80,908
Budgeted Percentage Change, FY 2014 to FY 2015 1.36%
Statewide Averages - Summary
3 Based on certification by division superintendents of the average budgeted salary to be provided, as reported by school
divisions and regional programs on the 2013-2014 Annual School Report. Averages calculated on the basis of statewide
totals.
Classroom Teacher Salaries1
Principal Salaries1
Assistant Principal Salaries 1
2 Based on actual expenditures for salaries divided by the actual number of full-time equivalent (FTE) positions, as
reported by school divisions and regional programs on the 2013-2014 Annual School Report and certified by division
superintendents. Averages calculated on the basis of statewide totals.
1 Includes school divisions and regional programs.
FY 2015 Salary Survey - Summary
January 14, 2015
Page 3

Rank State School Year 2012–13 Average Salary
1 NEW YORK $76,865 *
2 NEW JERSEY $72,990 *
3 MASSACHUSETTS $72,334
4 DISTRICT OF COLUMBIA $70,906 *
5 CALIFORNIA $70,087 *
6 CONNECTICUT $69,397
7 RHODE ISLAND $68,821 *
8 MARYLAND $68,114
9 ALASKA $66,919
10 PENNSYLVANIA $64,847
11 DELAWARE $63,256 *
12 MICHIGAN $61,560
13 MINNESOTA $61,307 *
14 OHIO $61,266 *
15 OREGON $60,484
16 ILLINOIS $59,113 *
17 WYOMING $58,846
UNITED STATES $58,066 *
18 WISCONSIN $57,858
19 NEVADA $56,433 *
20 HAWAII $55,757
21 NEW HAMPSHIRE $55,599 *
22 GEORGIA $55,383
23 WASHINGTON $55,317
24 VERMONT $54,102 *
25 LOUISIANA $53,960 *
26 IOWA $53,308
27 KENTUCKY $52,498
28 COLORADO $52,147 *
29 IDAHO $51,837 *
30 TEXAS $51,689
31 UTAH $51,572 *
32 MISSOURI $51,228 *
33 SOUTH CAROLINA $50,771
34 VIRGINIA $50,717 *
35 INDIANA $50,086
36 MONTANA $50,003 *
37 MAINE $49,971
38 ARIZONA $49,885 *
39 ALABAMA $49,875
40 ARKANSAS $49,680
41 TENNESSEE $49,647
42 NORTH DAKOTA $49,159
43 NEBRASKA $48,997
44 KANSAS $48,759 *
45 FLORIDA $47,935
46 NEW MEXICO $47,630
47 WEST VIRGINIA $47,486
48 OKLAHOMA $46,216
49 NORTH CAROLINA $45,737
50 MISSISSIPPI $43,779
51 SOUTH DAKOTA $40,641
* Computed from NEA Research, Estimates Database (2013).
Data Excerpted from the National Education Association's (NEA)
"Rankings of the States 2013 and Estimates of School Statistics 2014" Report
http://www.nea.org/assets/docs/NEA-Rankings-and-Estimates-2013-2014.pdf
NOTE: There is a difference between the average salary used in the NEA report and the average salary as published in the Annual Salary Survey
Report. The NEA Rankings and Estimates average teacher salary includes instructional classroom teachers, substitutes, and homebound instructional
teachers. The average teacher salary that is calculated and published in the Annual Salary Survey Report includes those positions included in the NEA
average salary except substitutes, but also includes guidance counselors, librarians, instructional technology positions, and supplemental salary
expenditures. The average salary shown below for Virginia is based on the NEA calculation.
From Rankings & Estimates 2013-2014, Rankings, Table C-18
Average Salaries ($) of Public School Teachers, 2012–13
FY 2015 Salary Survey - Rank
January 14, 2015
Page 4

Division Name
FY 2013
Actual Average
Teacher Salary
FY 2014
Actual Average
Teacher Salary
FY 2013 to
FY 2014
Percent
Increase/
(Decrease)
FY 2015
Budgeted
Average
Teacher Salary
FY 2014 to
FY 2015
Percent
Increase/
(Decrease)
School Divisions
Counties
001 Accomack County Public Schools 40,596 Data not submitted
by division. N/A
Data not submitted
by division. N/A
002 Albemarle County Public Schools 53,521 54,586 1.99% 55,312 1.33%
003 Alleghany County Public Schools 48,254 47,477 (1.61%) 45,088 (5.03%)
004 Amelia County Public Schools 43,357 49,019 13.06% 45,049 (8.10%)
005 Amherst County Public Schools 44,779 45,527 1.67% 45,180 (0.76%)
006 Appomattox County Public Schools 40,810 39,904 (2.22%) 40,366 1.16%
007 Arlington County Public Schools 73,626 73,846 0.30% 74,737 1.21%
008 Augusta County Public Schools 45,519 47,061 3.39% 46,801 (0.55%)
009 Bath County Public Schools 45,628 46,784 2.53% 47,686 1.93%
010 Bedford County Public Schools1 42,524 43,653 2.65% 43,502 (0.35%)
011 Bland County Public Schools 41,685 43,775 5.02% 43,476 (0.68%)
012 Botetourt County Public Schools 48,866 51,189 4.75% 50,589 (1.17%)
013 Brunswick County Public Schools 41,333 41,712 0.92% 41,178 (1.28%)
014 Buchanan County Public Schools 38,468 39,840 3.57% 39,257 (1.46%)
015 Buckingham County Public Schools 42,521 42,193 (0.77%) 42,211 0.04%
016 Campbell County Public Schools 41,998 43,257 3.00% 44,547 2.98%
017 Caroline County Public Schools 49,820 47,144 (5.37%) 48,527 2.93%
018 Carroll County Public Schools 42,644 44,042 3.28% 45,472 3.25%
019 Charles City County Public Schools 39,107 45,722 16.92% 45,729 0.02%
020 Charlotte County Public Schools 43,874 44,298 0.97% 44,574 0.62%
021 Chesterfield County Public Schools 48,673 50,087 2.90% 50,666 1.16%
022 Clarke County Public Schools 50,808 50,728 (0.16%) 52,265 3.03%
023 Craig County Public Schools 41,255 45,277 9.75% 42,468 (6.20%)
024 Culpeper County Public Schools 48,667 48,769 0.21% 49,348 1.19%
025 Cumberland County Public Schools 45,946 48,069 4.62% 51,060 6.22%
026 Dickenson County Public Schools 38,960 38,948 (0.03%) 40,755 4.64%
027 Dinwiddie County Public Schools 47,078 47,901 1.75% 45,625 (4.75%)
028 Essex County Public Schools 47,325 45,007 (4.90%) 45,261 0.57%
029 Fairfax County Public Schools2 63,422 64,580 1.83% 67,623 4.71%
030 Fauquier County Public Schools 57,743 56,267 (2.56%) 56,890 1.11%
031 Floyd County Public Schools 43,044 44,747 3.96% 45,410 1.48%
032 Fluvanna County Public Schools 49,612 50,524 1.84% 51,489 1.91%
033 Franklin County Public Schools 43,884 44,974 2.48% 45,360 0.86%
034 Frederick County Public Schools 49,368 50,689 2.68% 52,258 3.09%
035 Giles County Public Schools 38,762 40,759 5.15% 41,113 0.87%
036 Gloucester County Public Schools 48,942 49,567 1.28% 49,141 (0.86%)
037 Goochland County Public Schools 45,314 48,187 6.34% 49,032 1.75%
038 Grayson County Public Schools 36,427 37,245 2.25% 48,517 30.27%
039 Greene County Public Schools 44,158 44,856 1.58% 48,504 8.13%
040 Greensville County Public Schools3 43,966 46,397 5.53% 48,514 4.56%
041 Halifax County Public Schools 47,241 38,883 (17.69%) 48,367 24.39%
042 Hanover County Public Schools 48,557 48,334 (0.46%) 48,444 0.23%
043 Henrico County Public Schools 50,594 50,428 (0.33%) 50,428 (0.00%)
044 Henry County Public Schools 44,655 44,957 0.68% 44,143 (1.81%)
045 Highland County Public Schools 45,120 46,255 2.52% 49,162 6.29%
046 Isle Of Wight County Public Schools 54,556 54,956 0.73% 54,621 (0.61%)
048 King George County Public Schools 45,465 47,457 4.38% 47,570 0.24%
049 King And Queen County Public Schools 47,437 47,586 0.31% 47,820 0.49%
050 King William County Public Schools 44,817 48,618 8.48% 50,261 3.38%
051 Lancaster County Public Schools 44,682 47,480 6.26% 45,910 (3.31%)
052 Lee County Public Schools 38,138 39,243 2.90% 42,049 7.15%
053 Loudoun County Public Schools 60,798 61,485 1.13% 61,206 (0.45%)
054 Louisa County Public Schools 47,144 48,671 3.24% 50,457 3.67%
055 Lunenburg County Public Schools 44,865 44,401 (1.03%) 45,579 2.65%
056 Madison County Public Schools 44,429 44,490 0.14% 44,601 0.25%
057 Mathews County Public Schools 43,168 44,931 4.08% 46,054 2.50%
058 Mecklenburg County Public Schools 43,010 43,750 1.72% 43,691 (0.14%)
059 Middlesex County Public Schools 43,217 43,881 1.54% 41,539 (5.34%)
060 Montgomery County Public Schools 45,504 47,338 4.03% 48,645 2.76%
Virginia Department of Education
2014-2015 Salary Survey - Teachers
Classroom Teacher Salary Survey (Including Librarians and Guidance Counselors)
FY 2015 Salary Survey - Teachers
January 14, 2015
Page 5

Division Name
FY 2013
Actual Average
Teacher Salary
FY 2014
Actual Average
Teacher Salary
FY 2013 to
FY 2014
Percent
Increase/
(Decrease)
FY 2015
Budgeted
Average
Teacher Salary
FY 2014 to
FY 2015
Percent
Increase/
(Decrease)
Virginia Department of Education
2014-2015 Salary Survey - Teachers
Classroom Teacher Salary Survey (Including Librarians and Guidance Counselors)
062 Nelson County Public Schools 48,124 50,967 5.91% 50,824 (0.28%)
063 New Kent County Public Schools 45,079 46,996 4.25% 46,415 (1.24%)
065 Northampton County Public Schools 37,823 41,427 9.53% 41,077 (0.84%)
066 Northumberland County Public Schools 47,221 48,024 1.70% 47,831 (0.40%)
067 Nottoway County Public Schools 47,575 47,793 0.46% 47,354 (0.92%)
068 Orange County Public Schools 48,980 47,465 (3.09%) 48,540 2.27%
069 Page County Public Schools 42,983 43,358 0.87% 48,855 12.68%
070 Patrick County Public Schools 42,543 42,447 (0.22%) 44,213 4.16%
071 Pittsylvania County Public Schools 42,260 40,865 (3.30%) 41,428 1.38%
072 Powhatan County Public Schools 49,789 51,846 4.13% 51,631 (0.41%)
073 Prince Edward County Public Schools 45,389 42,916 (5.45%) 45,088 5.06%
074 Prince George County Public Schools 49,469 51,816 4.74% 53,551 3.35%
075 Prince William County Public Schools 61,863 62,046 0.30% 57,552 (7.24%)
077 Pulaski County Public Schools 43,784 45,209 3.25% 44,030 (2.61%)
078 Rappahannock County Public Schools 49,343 51,519 4.41% 47,529 (7.74%)
079 Richmond County Public Schools 49,492 49,185 (0.62%) 47,117 (4.20%)
080 Roanoke County Public Schools 50,886 49,968 (1.80%) 56,517 13.11%
081 Rockbridge County Public Schools 47,363 45,971 (2.94%) 47,037 2.32%
082 Rockingham County Public Schools 46,585 47,503 1.97% 50,062 5.39%
083 Russell County Public Schools 37,116 38,804 4.55% 39,391 1.51%
084 Scott County Public Schools 47,555 45,962 (3.35%) 44,358 (3.49%)
085 Shenandoah County Public Schools 46,751 46,694 (0.12%) 51,032 9.29%
086 Smyth County Public Schools 44,590 43,259 (2.98%) 43,383 0.29%
087 Southampton County Public Schools 43,509 43,171 (0.78%) 46,177 6.96%
088 Spotsylvania County Public Schools 53,725 53,178 (1.02%) 49,364 (7.17%)
089 Stafford County Public Schools 50,864 53,031 4.26% 51,227 (3.40%)
090 Surry County Public Schools 50,813 50,198 (1.21%) 51,872 3.33%
091 Sussex County Public Schools 51,839 52,978 2.20% 52,829 (0.28%)
092 Tazewell County Public Schools 42,062 38,762 (7.85%) 45,759 18.05%
093 Warren County Public Schools 48,241 47,916 (0.67%) 46,922 (2.08%)
094 Washington County Public Schools 47,059 47,414 0.75% 47,357 (0.12%)
095 Westmoreland County Public Schools 44,363 44,675 0.70% 44,662 (0.03%)
096 Wise County Public Schools 45,692 49,693 8.76% 46,125 (7.18%)
097 Wythe County Public Schools 46,890 47,288 0.85% 47,904 1.30%
098 York County Public Schools 48,310 49,883 3.26% 51,303 2.85%
Cities
101 Alexandria City Public Schools 74,682 72,942 (2.33%) 75,447 3.43%
102 Bristol City Public Schools 46,660 43,926 (5.86%) 45,811 4.29%
103 Buena Vista City Public Schools 42,528 40,483 (4.81%) 38,968 (3.74%)
104 Charlottesville City Public Schools 55,114 54,886 (0.41%) 56,001 2.03%
106 Colonial Heights City Public Schools 51,501 51,300 (0.39%) 50,849 (0.88%)
107 Covington City Public Schools 49,439 51,141 3.44% 57,119 11.69%
108 Danville City Public Schools 46,948 47,879 1.98% 47,194 (1.43%)
109 Falls Church City Public Schools 65,583 66,589 1.53% 70,956 6.56%
110 Fredericksburg City Public Schools 47,201 49,493 4.86% 53,234 7.56%
111 Galax City Public Schools 46,993 46,328 (1.42%) 46,895 1.22%
112 Hampton City Public Schools 45,029 47,516 5.52% 44,656 (6.02%)
113 Harrisonburg City Public Schools 44,237 43,974 (0.60%) 45,260 2.92%
114 Hopewell City Public Schools 46,797 48,013 2.60% 49,578 3.26%
115 Lynchburg City Public Schools 41,089 39,037 (4.99%) 55,991 43.43%
116 Martinsville City Public Schools 44,623 43,210 (3.17%) 42,398 (1.88%)
117 Newport News City Public Schools 48,192 49,682 3.09% 51,716 4.09%
118 Norfolk City Public Schools 48,929 49,908 2.00% 49,636 (0.54%)
119 Norton City Public Schools 41,039 41,463 1.03% 40,255 (2.91%)
120 Petersburg City Public Schools 41,139 42,150 2.46% 43,625 3.50%
121 Portsmouth City Public Schools 38,183 38,872 1.80% 38,705 (0.43%)
122 Radford City Public Schools 49,967 50,428 0.92% 51,424 1.97%
123 Richmond City Public Schools 48,921 50,148 2.51% 53,144 5.97%
124 Roanoke City Public Schools 47,363 50,509 6.64% 52,365 3.68%
126 Staunton City Public Schools 43,979 46,730 6.26% 49,923 6.83%
127 Suffolk City Public Schools 49,158 49,809 1.32% 47,290 (5.06%)
128 Virginia Beach City Public Schools 54,875 56,048 2.14% 53,833 (3.95%)
130 Waynesboro City Public Schools 45,209 47,484 5.03% 47,785 0.63%
FY 2015 Salary Survey - Teachers
January 14, 2015
Page 6

Division Name
FY 2013
Actual Average
Teacher Salary
FY 2014
Actual Average
Teacher Salary
FY 2013 to
FY 2014
Percent
Increase/
(Decrease)
FY 2015
Budgeted
Average
Teacher Salary
FY 2014 to
FY 2015
Percent
Increase/
(Decrease)
Virginia Department of Education
2014-2015 Salary Survey - Teachers
Classroom Teacher Salary Survey (Including Librarians and Guidance Counselors)
131 Williamsburg Public Schools4 52,037 52,920 1.70% 51,103 (3.43%)
132 Winchester City Public Schools 54,404 53,910 (0.91%) 54,576 1.23%
135 Franklin City Public Schools 44,257 46,430 4.91% 48,403 4.25%
136 Chesapeake City Public Schools 54,830 56,484 3.02% 56,457 (0.05%)
137 Lexington City Public Schools 41,025 39,402 (3.96%) 40,926 3.87%
139 Salem City Public Schools 56,207 55,115 (1.94%) 57,291 3.95%
142 Poquoson City Public Schools 48,113 46,887 (2.55%) 46,602 (0.61%)
143 Manassas City Public Schools 62,347 62,534 0.30% 62,546 0.02%
144 Manassas Park City Public Schools 56,323 58,089 3.13% 59,229 1.96%
Towns
202 Colonial Beach Public Schools 40,116 41,498 3.45% 42,620 2.70%
207 West Point Public Schools 40,911 37,914 (7.33%) 40,607 7.10%
Average for School Divisions5: 52,949 53,830 1.66% 54,521 1.29%
Governor's Schools
260 Central Virginia Governor's School 70,950 72,865 2.70% 74,322 2.00%
261 Southwest Virginia Governor's School 51,800 51,974 0.34% 51,974 0.00%
262 Governor's School For The Arts 40,348 43,117 6.86% 40,830 (5.30%)
263 Roanoke Valley Governor's School 52,206 58,524 12.10% 57,815 (1.21%)
264 New Horizons Governor's School 48,506 53,770 10.85% 53,257 (0.95%)
265 Shenandoah Valley Governor's School 50,245 51,891 3.28% 52,466 1.11%
266 Governor's School Global Economics/Tech 52,368 47,547 (9.21%) 47,611 0.13%
267 Appomattox Regional Governor's School 48,090 42,026 (12.61%) 43,734 4.06%
268 A. Linwood Holton Governor's School 47,705 44,238 (7.27%) 44,238 0.00%
269 Chesapeake Bay Governor's School 48,055 46,999 (2.20%) 51,237 9.02%
270 Commonwealth Governor's School 58,970 59,574 1.02% 57,798 (2.98%)
271 Maggie L. Walker Governor's School Data not submitted
by division. 54,978 N/A 51,864 (5.67%)
272 Thomas Jefferson High School 77,467 79,492 2.61% 83,287 4.77%
273 Blue Ridge Governor's School 40,418 41,580 2.87% 48,033 15.52%
274 Jackson River Governor's School - - -
275 Massanutten Governor's School 51,855 57,427 10.74% 58,576 2.00%
276 Piedmont Governor's School 46,903 52,267 11.44% 55,244 5.70%
277 Mountain Vista Governor's School 65,170 66,890 2.64% 67,332 0.66%
278 Governor's School at Innovation Park 60,566 65,245 7.73% 65,079 (0.25%)
Average for Governor's Schools5: 61,579 61,135 (0.72%) 61,960 1.35%
Special Education Regional Programs
280 Cooperative Centers For Exceptional Children 41,016 43,331 5.64% 43,980 1.50%
281 Middle Peninsula Special Education Program 42,179 43,053 2.07% 43,175 0.28%
282 Laurel Regional Special Education Center 48,112 51,595 7.24% 52,627 2.00%
283 Northern Neck Special Education Program 42,467 39,727 (6.45%) 45,064 13.44%
284 Northwestern Regional Education Program 49,961 51,449 2.98% 51,276 (0.34%)
285 Peninsula Area Cooperative Education Services 45,286 44,555 (1.61%) 47,980 7.68%
286 Piedmont Regional Education Program 42,624 44,926 5.40% 54,016 20.23%
287 Shenandoah Valley Regional Program 43,524 50,927 17.01% 62,191 22.12%
288 Southeastern Cooperative Educational Program 45,866 46,357 1.07% 45,437 (1.99%)
290 N. Virginia Regional Special Education Program 58,058 58,998 1.62% 58,998 0.00%
292 Henry Co/Martinsville Regional Program 41,847 41,529 (0.76%) 47,813 15.13%
299 Roanoke Valley Regional Board 43,073 46,657 8.32% 46,373 (0.61%)
Average for Special Education Programs5: 48,637 50,730 4.30% 52,310 3.12%
Vocational Education Regional Programs
301 Charlottesville-Albemarle Vocational-Technical 62,598 62,216 (0.61%) 64,253 3.27%
302 Jackson River Technical Center 49,929 47,818 (4.23%) 48,352 1.12%
304 Massanutten Technical Center 51,584 51,637 0.10% 51,754 0.23%
306 Valley Vocational-Technical Center 47,930 51,838 8.15% 54,347 4.84%
307 New Horizons Regional Education Center 46,281 52,053 12.47% 52,248 0.38%
308 P. D. Pruden Vocational-Technical Center 47,784 49,254 3.08% 49,254 0.00%
309 Rowanty Vocational-Technical Center 49,862 50,911 2.11% 51,313 0.79%
310 Northern Neck Vocational-Technical Center 45,180 47,412 4.94% 45,067 (4.95%)
FY 2015 Salary Survey - Teachers
January 14, 2015
Page 7
Division Name
FY 2013
Actual Average
Teacher Salary
FY 2014
Actual Average
Teacher Salary
FY 2013 to
FY 2014
Percent
Increase/
(Decrease)
FY 2015
Budgeted
Average
Teacher Salary
FY 2014 to
FY 2015
Percent
Increase/
(Decrease)
Virginia Department of Education
2014-2015 Salary Survey - Teachers
Classroom Teacher Salary Survey (Including Librarians and Guidance Counselors)
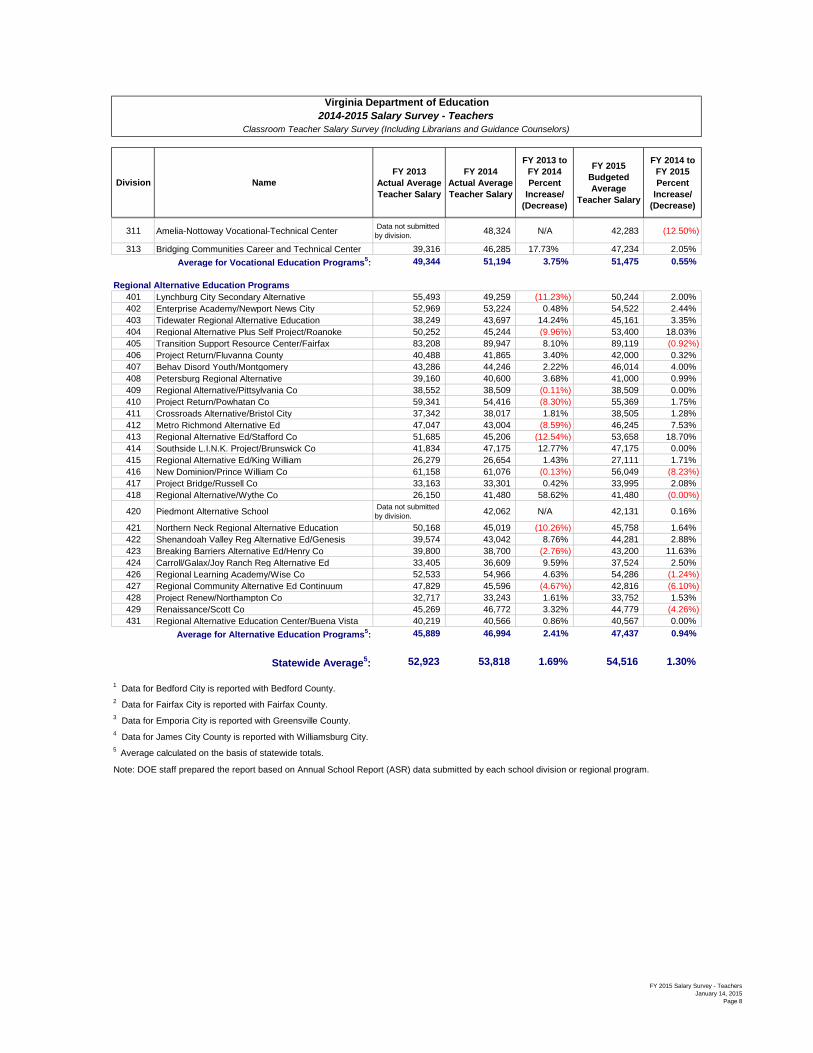
311 Amelia-Nottoway Vocational-Technical Center Data not submitted
by division. 48,324 N/A 42,283 (12.50%)
313 Bridging Communities Career and Technical Center 39,316 46,285 17.73% 47,234 2.05%
Average for Vocational Education Programs5: 49,344 51,194 3.75% 51,475 0.55%
Regional Alternative Education Programs
401 Lynchburg City Secondary Alternative 55,493 49,259 (11.23%) 50,244 2.00%
402 Enterprise Academy/Newport News City 52,969 53,224 0.48% 54,522 2.44%
403 Tidewater Regional Alternative Education 38,249 43,697 14.24% 45,161 3.35%
404 Regional Alternative Plus Self Project/Roanoke 50,252 45,244 (9.96%) 53,400 18.03%
405 Transition Support Resource Center/Fairfax 83,208 89,947 8.10% 89,119 (0.92%)
406 Project Return/Fluvanna County 40,488 41,865 3.40% 42,000 0.32%
407 Behav Disord Youth/Montgomery 43,286 44,246 2.22% 46,014 4.00%
408 Petersburg Regional Alternative 39,160 40,600 3.68% 41,000 0.99%
409 Regional Alternative/Pittsylvania Co 38,552 38,509 (0.11%) 38,509 0.00%
410 Project Return/Powhatan Co 59,341 54,416 (8.30%) 55,369 1.75%
411 Crossroads Alternative/Bristol City 37,342 38,017 1.81% 38,505 1.28%
412 Metro Richmond Alternative Ed 47,047 43,004 (8.59%) 46,245 7.53%
413 Regional Alternative Ed/Stafford Co 51,685 45,206 (12.54%) 53,658 18.70%
414 Southside L.I.N.K. Project/Brunswick Co 41,834 47,175 12.77% 47,175 0.00%
415 Regional Alternative Ed/King William 26,279 26,654 1.43% 27,111 1.71%
416 New Dominion/Prince William Co 61,158 61,076 (0.13%) 56,049 (8.23%)
417 Project Bridge/Russell Co 33,163 33,301 0.42% 33,995 2.08%
418 Regional Alternative/Wythe Co 26,150 41,480 58.62% 41,480 (0.00%)
420 Piedmont Alternative School Data not submitted
by division. 42,062 N/A 42,131 0.16%
421 Northern Neck Regional Alternative Education 50,168 45,019 (10.26%) 45,758 1.64%
422 Shenandoah Valley Reg Alternative Ed/Genesis 39,574 43,042 8.76% 44,281 2.88%
423 Breaking Barriers Alternative Ed/Henry Co 39,800 38,700 (2.76%) 43,200 11.63%
424 Carroll/Galax/Joy Ranch Reg Alternative Ed 33,405 36,609 9.59% 37,524 2.50%
426 Regional Learning Academy/Wise Co 52,533 54,966 4.63% 54,286 (1.24%)
427 Regional Community Alternative Ed Continuum 47,829 45,596 (4.67%) 42,816 (6.10%)
428 Project Renew/Northampton Co 32,717 33,243 1.61% 33,752 1.53%
429 Renaissance/Scott Co 45,269 46,772 3.32% 44,779 (4.26%)
431 Regional Alternative Education Center/Buena Vista 40,219 40,566 0.86% 40,567 0.00%
Average for Alternative Education Programs5: 45,889 46,994 2.41% 47,437 0.94%
Statewide Average5: 52,923 53,818 1.69% 54,516 1.30%
1 Data for Bedford City is reported with Bedford County.
2 Data for Fairfax City is reported with Fairfax County.
3 Data for Emporia City is reported with Greensville County.
4 Data for James City County is reported with Williamsburg City.
5 Average calculated on the basis of statewide totals.
Note: DOE staff prepared the report based on Annual School Report (ASR) data submitted by each school division or regional program.
FY 2015 Salary Survey - Teachers
January 14, 2015
Page 8

Division Name
FY 2013
Actual Average
Principal Salary
FY 2014
Actual Average
Principal Salary
FY 2013 to FY
2014 Percent
Increase/
(Decrease)
FY 2015
Budgeted
Average
Principal Salary
FY 2014 to
FY 2015
Percent
Increase/
(Decrease)
School Divisions
Counties
001 Accomack County Public Schools 70,940 Data not submitted
by division. N/A
Data not submitted
by division. N/A
002 Albemarle County Public Schools 100,500 103,832 3.32% 104,558 0.70%
003 Alleghany County Public Schools 78,845 80,839 2.53% 82,456 2.00%
004 Amelia County Public Schools 82,796 86,616 4.61% 86,084 (0.61%)
005 Amherst County Public Schools 76,751 78,387 2.13% 79,516 1.44%
006 Appomattox County Public Schools 72,660 74,130 2.02% 75,500 1.85%
007 Arlington County Public Schools 141,478 140,745 (0.52%) 143,560 2.00%
008 Augusta County Public Schools 79,842 84,336 5.63% 85,400 1.26%
009 Bath County Public Schools 66,324 65,704 (0.94%) 68,378 4.07%
010 Bedford County Public Schools1 76,111 79,842 4.90% 79,902 0.07%
011 Bland County Public Schools 58,987 59,968 1.66% 66,416 10.75%
012 Botetourt County Public Schools 91,374 96,486 5.59% 89,174 (7.58%)
013 Brunswick County Public Schools 77,923 79,402 1.90% 81,200 2.26%
014 Buchanan County Public Schools 60,664 58,022 (4.36%) 68,195 17.53%
015 Buckingham County Public Schools 77,256 79,343 2.70% 83,311 5.00%
016 Campbell County Public Schools 92,555 95,892 3.60% 97,448 1.62%
017 Caroline County Public Schools 83,654 87,033 4.04% 88,824 2.06%
018 Carroll County Public Schools 70,592 72,084 2.11% 73,886 2.50%
019 Charles City County Public Schools 73,402 84,289 14.83% 84,289 0.00%
020 Charlotte County Public Schools 66,826 70,001 4.75% 74,850 6.93%
021 Chesterfield County Public Schools 86,916 88,715 2.07% 89,307 0.67%
022 Clarke County Public Schools 104,603 106,695 2.00% 93,283 (12.57%)
023 Craig County Public Schools 66,887 68,123 1.85% 66,623 (2.20%)
024 Culpeper County Public Schools 93,987 95,887 2.02% 98,071 2.28%
025 Cumberland County Public Schools 77,890 79,432 1.98% 79,432 0.00%
026 Dickenson County Public Schools 71,364 73,933 3.60% 75,880 2.63%
027 Dinwiddie County Public Schools 87,058 74,480 (14.45%) 72,764 (2.30%)
028 Essex County Public Schools 85,236 80,624 (5.41%) 85,850 6.48%
029 Fairfax County Public Schools2 122,588 125,519 2.39% 129,711 3.34%
030 Fauquier County Public Schools 98,211 95,007 (3.26%) 98,481 3.66%
031 Floyd County Public Schools 72,843 74,833 2.73% 74,758 (0.10%)
032 Fluvanna County Public Schools 88,106 88,400 0.33% 92,410 4.54%
033 Franklin County Public Schools 77,624 80,132 3.23% 81,053 1.15%
034 Frederick County Public Schools 96,473 96,495 0.02% 98,840 2.43%
035 Giles County Public Schools 72,926 77,093 5.71% 82,214 6.64%
036 Gloucester County Public Schools 85,360 86,642 1.50% 87,301 0.76%
037 Goochland County Public Schools 80,873 85,799 6.09% 87,050 1.46%
038 Grayson County Public Schools 60,391 61,586 1.98% 59,189 (3.89%)
039 Greene County Public Schools 81,124 73,945 (8.85%) 82,336 11.35%
040 Greensville County Public Schools3 77,584 72,094 (7.08%) 81,352 12.84%
041 Halifax County Public Schools 57,893 68,048 17.54% 62,138 (8.68%)
042 Hanover County Public Schools 95,539 97,132 1.67% 100,288 3.25%
043 Henrico County Public Schools 101,493 99,547 (1.92%) 99,549 0.00%
044 Henry County Public Schools 76,569 77,661 1.43% 72,517 (6.62%)
045 Highland County Public Schools 65,566 69,630 6.20% 70,989 1.95%
046 Isle Of Wight County Public Schools 88,483 85,904 (2.92%) 86,080 0.20%
048 King George County Public Schools 87,840 84,145 (4.21%) 92,607 10.06%
049 King And Queen County Public Schools 79,877 77,994 (2.36%) 79,014 1.31%
050 King William County Public Schools 88,378 91,577 3.62% 93,408 2.00%
051 Lancaster County Public Schools 81,837 88,864 8.59% 90,528 1.87%
052 Lee County Public Schools 59,597 57,034 (4.30%) 56,668 (0.64%)
053 Loudoun County Public Schools 115,654 120,131 3.87% 124,827 3.91%
054 Louisa County Public Schools 82,487 86,390 4.73% 85,916 (0.55%)
055 Lunenburg County Public Schools 71,490 72,747 1.76% 73,983 1.70%
056 Madison County Public Schools 88,144 94,681 7.42% 89,143 (5.85%)
057 Mathews County Public Schools 76,435 70,682 (7.53%) 72,095 2.00%
058 Mecklenburg County Public Schools 63,698 70,901 11.31% 73,186 3.22%
059 Middlesex County Public Schools 70,994 72,414 2.00% 73,336 1.27%
Virginia Department of Education
2014-2015 Salary Survey - Principals
FY 2015 Salary Survey - Principals
January 14, 2015
Page 9

Division Name
FY 2013
Actual Average
Principal Salary
FY 2014
Actual Average
Principal Salary
FY 2013 to FY
2014 Percent
Increase/
(Decrease)
FY 2015
Budgeted
Average
Principal Salary
FY 2014 to
FY 2015
Percent
Increase/
(Decrease)
Virginia Department of Education
2014-2015 Salary Survey - Principals
060 Montgomery County Public Schools 76,562 80,144 4.68% 82,527 2.97%
062 Nelson County Public Schools 94,195 93,017 (1.25%) 89,248 (4.05%)
063 New Kent County Public Schools 80,364 86,764 7.96% 86,444 (0.37%)
065 Northampton County Public Schools 76,767 77,827 1.38% 81,786 5.09%
066 Northumberland County Public Schools 87,074 93,628 7.53% 82,313 (12.08%)
067 Nottoway County Public Schools 81,008 84,339 4.11% 84,562 0.26%
068 Orange County Public Schools 84,380 86,080 2.01% 89,523 4.00%
069 Page County Public Schools 68,643 75,568 10.09% 73,846 (2.28%)
070 Patrick County Public Schools 71,359 68,427 (4.11%) 68,161 (0.39%)
071 Pittsylvania County Public Schools 77,485 77,625 0.18% 79,316 2.18%
072 Powhatan County Public Schools 89,058 91,644 2.90% 87,415 (4.62%)
073 Prince Edward County Public Schools 82,243 77,637 (5.60%) 81,067 4.42%
074 Prince George County Public Schools 86,657 90,147 4.03% 90,213 0.07%
075 Prince William County Public Schools 113,765 120,046 5.52% 117,711 (1.95%)
077 Pulaski County Public Schools 82,157 82,919 0.93% 81,823 (1.32%)
078 Rappahannock County Public Schools 85,769 89,668 4.55% 91,012 1.50%
079 Richmond County Public Schools 83,442 81,717 (2.07%) 82,943 1.50%
080 Roanoke County Public Schools 94,187 93,719 (0.50%) 98,496 5.10%
081 Rockbridge County Public Schools 80,511 80,506 (0.01%) 78,035 (3.07%)
082 Rockingham County Public Schools 84,946 86,389 1.70% 87,609 1.41%
083 Russell County Public Schools 68,572 68,599 0.04% 69,955 1.98%
084 Scott County Public Schools 75,006 76,661 2.21% 75,263 (1.82%)
085 Shenandoah County Public Schools 90,649 95,708 5.58% 94,393 (1.37%)
086 Smyth County Public Schools 78,960 78,487 (0.60%) 79,389 1.15%
087 Southampton County Public Schools 74,158 76,123 2.65% 80,381 5.59%
088 Spotsylvania County Public Schools 108,594 108,962 0.34% 111,310 2.15%
089 Stafford County Public Schools 103,063 100,782 (2.21%) 101,087 0.30%
090 Surry County Public Schools 82,228 71,417 (13.15%) 90,137 26.21%
091 Sussex County Public Schools 87,920 86,623 (1.48%) 86,623 (0.00%)
092 Tazewell County Public Schools 72,647 74,874 3.07% 80,574 7.61%
093 Warren County Public Schools 94,323 92,615 (1.81%) 92,604 (0.01%)
094 Washington County Public Schools 80,216 85,247 6.27% 85,247 0.00%
095 Westmoreland County Public Schools 75,162 75,949 1.05% 77,489 2.03%
096 Wise County Public Schools 64,781 81,276 25.46% 76,807 (5.50%)
097 Wythe County Public Schools 83,760 83,991 0.28% 84,096 0.12%
098 York County Public Schools 81,885 82,663 0.95% 85,736 3.72%
Cities
101 Alexandria City Public Schools 131,409 128,852 (1.95%) 133,128 3.32%
102 Bristol City Public Schools 81,441 82,090 0.80% 82,172 0.10%
103 Buena Vista City Public Schools 54,548 47,726 (12.51%) 73,232 53.44%
104 Charlottesville City Public Schools 97,187 96,043 (1.18%) 97,964 2.00%
106 Colonial Heights City Public Schools 85,272 86,805 1.80% 86,770 (0.04%)
107 Covington City Public Schools 76,886 81,608 6.14% 81,244 (0.45%)
108 Danville City Public Schools 76,557 77,093 0.70% 74,746 (3.04%)
109 Falls Church City Public Schools 125,687 130,335 3.70% 134,903 3.50%
110 Fredericksburg City Public Schools 104,195 107,997 3.65% 110,897 2.69%
111 Galax City Public Schools 70,894 69,351 (2.18%) 74,668 7.67%
112 Hampton City Public Schools 80,795 85,601 5.95% 82,389 (3.75%)
113 Harrisonburg City Public Schools 92,492 93,208 0.77% 94,619 1.51%
114 Hopewell City Public Schools 86,546 88,213 1.93% 105,357 19.44%
115 Lynchburg City Public Schools 81,761 94,929 16.11% 105,443 11.08%
116 Martinsville City Public Schools 79,522 83,886 5.49% 86,419 3.02%
117 Newport News City Public Schools 80,794 82,009 1.50% 85,650 4.44%
118 Norfolk City Public Schools 96,731 94,668 (2.13%) 97,910 3.42%
119 Norton City Public Schools 73,207 75,659 3.35% 77,037 1.82%
120 Petersburg City Public Schools 76,356 76,348 (0.01%) 84,029 10.06%
121 Portsmouth City Public Schools 92,565 89,226 (3.61%) 91,908 3.01%
122 Radford City Public Schools 82,978 84,613 1.97% 86,306 2.00%
123 Richmond City Public Schools 91,176 89,714 (1.60%) 91,845 2.38%
124 Roanoke City Public Schools 80,077 79,556 (0.65%) 87,693 10.23%
126 Staunton City Public Schools 75,374 78,642 4.34% 80,667 2.57%
127 Suffolk City Public Schools 84,893 82,401 (2.94%) 86,338 4.78%
FY 2015 Salary Survey - Principals
January 14, 2015
Page 10

Division Name
FY 2013
Actual Average
Principal Salary
FY 2014
Actual Average
Principal Salary
FY 2013 to FY
2014 Percent
Increase/
(Decrease)
FY 2015
Budgeted
Average
Principal Salary
FY 2014 to
FY 2015
Percent
Increase/
(Decrease)
Virginia Department of Education
2014-2015 Salary Survey - Principals
128 Virginia Beach City Public Schools 89,420 95,502 6.80% 97,440 2.03%
130 Waynesboro City Public Schools 79,677 83,799 5.17% 85,120 1.58%
131 Williamsburg Public Schools4 85,762 86,179 0.49% 90,306 4.79%
132 Winchester City Public Schools 93,690 94,255 0.60% 97,532 3.48%
135 Franklin City Public Schools 76,864 77,596 0.95% 77,596 (0.00%)
136 Chesapeake City Public Schools 96,577 97,834 1.30% 96,412 (1.45%)
137 Lexington City Public Schools 70,287 71,874 2.26% 91,289 27.01%
139 Salem City Public Schools 101,581 87,705 (13.66%) 98,410 12.21%
142 Poquoson City Public Schools 84,074 85,913 2.19% 87,860 2.27%
143 Manassas City Public Schools 113,734 114,350 0.54% 115,539 1.04%
144 Manassas Park City Public Schools 122,409 121,215 (0.98%) 130,824 7.93%
Towns
202 Colonial Beach Public Schools 68,329 69,701 2.01% 77,515 11.21%
207 West Point Public Schools 82,537 83,756 1.48% 88,518 5.69%
Average for School Divisions5: 93,736 95,739 2.14% 97,724 2.07%
Governor's Schools
260 Central Virginia Governor's School 92,246 95,013 3.00% 96,913 2.00%
261 Southwest Virginia Governor's School 87,627 89,380 2.00% 89,380 0.00%
262 Governor's School For The Arts 98,148 102,113 4.04% 104,155 2.00%
263 Roanoke Valley Governor's School 94,798 102,447 8.07% 105,848 3.32%
264 New Horizons Governor's School - - -
265 Shenandoah Valley Governor's School 63,882 69,506 8.80% 71,709 3.17%
266 Governor's School Global Economics/Tech - - -
267 Appomattox Regional Governor's School - - -
268 A. Linwood Holton Governor's School - - -
269 Chesapeake Bay Governor's School - - -
270 Commonwealth Governor's School - - -
271 Maggie L. Walker Governor's School
Data not
submitted by
division.
119,098 N/A 121,480 2.00%
272 Thomas Jefferson High School 132,205 137,532 4.03% 141,208 2.67%
273 Blue Ridge Governor's School - - -
274 Jackson River Governor's School - - -
275 Massanutten Governor's School - - -
276 Piedmont Governor's School - - -
277 Mountain Vista Governor's School 97,800 102,099 4.40% 102,624 0.51%
278 Governor's School at Innovation Park 87,090 89,703 3.00% 89,703 0.00%
Average for Governor's Schools5: 94,356 101,104 7.15% 102,890 1.77%
Special Education Regional Programs
280 Cooperative Centers For Exceptional Children - - -
281 Middle Peninsula Special Education Program - - -
282 Laurel Regional Special Education Center 72,237 74,404 3.00% 75,892 2.00%
283 Northern Neck Special Education Program - - -
284 Northwestern Regional Education Program 96,802 99,138 2.41% 101,914 2.80%
285 Peninsula Area Cooperative Education Services - - -
286 Piedmont Regional Education Program 32,904 42,374 28.78% 64,724 52.75%
287 Shenandoah Valley Regional Program - - -
288 Southeastern Cooperative Educational Program 79,137 83,419 5.41% 85,417 2.39%
290 N. Virginia Regional Special Education Program 107,745 115,660 7.35% 115,660 0.00%
292 Henry Co/Martinsville Regional Program - - -
299 Roanoke Valley Regional Board - - -
Average for Special Education Programs5: 75,844 81,195 7.06% 86,540 6.58%
Vocational Education Regional Programs
301 Charlottesville-Albemarle Vocational-Technical 94,340 99,642 5.62% 102,532 2.90%
302 Jackson River Technical Center 85,480 85,480 0.00% 86,848 1.60%
304 Massanutten Technical Center 96,468 98,303 1.90% 99,500 1.22%
306 Valley Vocational-Technical Center 76,957 86,292 12.13% 89,717 3.97%
307 New Horizons Regional Education Center 83,744 87,363 4.32% 87,971 0.70%
FY 2015 Salary Survey - Principals
January 14, 2015
Page 11

Division Name
FY 2013
Actual Average
Principal Salary
FY 2014
Actual Average
Principal Salary
FY 2013 to FY
2014 Percent
Increase/
(Decrease)
FY 2015
Budgeted
Average
Principal Salary
FY 2014 to
FY 2015
Percent
Increase/
(Decrease)
Virginia Department of Education
2014-2015 Salary Survey - Principals
308 P. D. Pruden Vocational-Technical Center 78,856 79,653 1.01% 79,653 0.00%
309 Rowanty Vocational-Technical Center 97,565 99,466 1.95% 99,466 0.00%
310 Northern Neck Vocational-Technical Center 87,936 85,500 (2.77%) 86,793 1.51%
311 Amelia-Nottoway Vocational-Technical Center
Data not
submitted by
division.
77,000 N/A 77,000 0.00%
313 Bridging Communities Career and Technical Center N/A - N/A -
Average for Vocational Education Programs5: 87,232 89,217 2.28% 90,276 1.19%
Regional Alternative Education Programs
401 Lynchburg City Secondary Alternative - - -
402 Enterprise Academy/Newport News City 124,113 116,074 (6.48%) 86,735 (25.28%)
403 Tidewater Regional Alternative Education 75,813 78,183 3.13% 82,222 5.17%
404 Regional Alternative Plus Self Project/Roanoke - - -
405 Transition Support Resource Center/Fairfax - - -
406 Project Return/Fluvanna County - - -
407 Behav Disord Youth/Montgomery - - -
408 Petersburg Regional Alternative 71,520 63,585 (11.09%) 64,000 0.65%
409 Regional Alternative/Pittsylvania Co 93,906 81,968 (12.71%) 81,968 0.00%
410 Project Return/Powhatan Co - - -
411 Crossroads Alternative/Bristol City - - -
412 Metro Richmond Alternative Ed - - 70,000
413 Regional Alternative Ed/Stafford Co - - -
414 Southside L.I.N.K. Project/Brunswick Co - - -
415 Regional Alternative Ed/King William 101,448 104,015 2.53% 105,038 0.98%
416 New Dominion/Prince William Co 92,395 95,167 3.00% 112,800 18.53%
417 Project Bridge/Russell Co - - -
418 Regional Alternative/Wythe Co - - -
420 Piedmont Alternative School
Data not
submitted by
division.
77,000 N/A 77,000 0.00%
421 Northern Neck Regional Alternative Education - - -
422 Shenandoah Valley Reg Alternative Ed/Genesis - - -
423 Breaking Barriers Alternative Ed/Henry Co 55,848 56,981 2.03% 68,840 20.81%
424 Carroll/Galax/Joy Ranch Reg Alternative Ed - - -
426 Regional Learning Academy/Wise Co - - -
427 Regional Community Alternative Ed Continuum 90,950 92,769 2.00% 93,269 0.54%
428 Project Renew/Northampton Co - - -
429 Renaissance/Scott Co - -
431 Regional Alternative Education Center/Buena Vista - - -
Average for Alternative Education Programs5: 89,569 85,582 (4.45%) 87,351 2.07%
Statewide Average5: 93,370 95,431 2.21% 97,471 2.14%
1 Data for Bedford City is reported with Bedford County.
2 Data for Fairfax City is reported with Fairfax County.
3 Data for Emporia City is reported with Greensville County.
4 Data for James City County is reported with Williamsburg City.
5 Average calculated on the basis of statewide totals.
Note: DOE staff prepared the report based on Annual School Report (ASR) data submitted by each school division or regional program.
FY 2015 Salary Survey - Principals
January 14, 2015
Page 12

Division Name
FY 2013
Actual Average
Assistant
Principal Salary
FY 2014
Actual Average
Assistant
Principal Salary
FY 2013 to
FY 2014
Percent
Increase/
(Decrease)
FY 2015
Budgeted Average
Assistant Principal
Salary
FY 2014 to
FY 2015
Percent
Increase/
(Decrease)
School Divisions
Counties
001 Accomack County Public Schools 63,485 Data not submitted
by division. N/A
Data not submitted by
division. N/A
002 Albemarle County Public Schools 81,132 80,228 (1.11%) 79,316 (1.14%)
003 Alleghany County Public Schools 73,835 73,893 0.08% 75,371 2.00%
004 Amelia County Public Schools 61,447 66,125 7.61% 69,955 5.79%
005 Amherst County Public Schools 67,069 69,300 3.33% 69,300 0.00%
006 Appomattox County Public Schools 65,416 62,880 (3.88%) 61,872 (1.60%)
007 Arlington County Public Schools 115,741 117,429 1.46% 119,777 2.00%
008 Augusta County Public Schools 64,703 66,728 3.13% 67,408 1.02%
009 Bath County Public Schools - - -
010 Bedford County Public Schools1 65,827 70,424 6.98% 66,734 (5.24%)
011 Bland County Public Schools - - -
012 Botetourt County Public Schools 77,018 81,336 5.61% 82,666 1.64%
013 Brunswick County Public Schools 60,182 63,149 4.93% 67,000 6.10%
014 Buchanan County Public Schools 63,806 65,324 2.38% 55,500 (15.04%)
015 Buckingham County Public Schools 64,440 69,743 8.23% 69,772 0.04%
016 Campbell County Public Schools 67,938 69,965 2.98% 72,580 3.74%
017 Caroline County Public Schools 63,030 66,714 5.85% 67,799 1.62%
018 Carroll County Public Schools 60,772 59,820 (1.57%) 60,413 0.99%
019 Charles City County Public Schools 53,336 54,380 1.96% 54,381 0.00%
020 Charlotte County Public Schools 61,366 57,441 (6.40%) 59,448 3.49%
021 Chesterfield County Public Schools 65,049 64,360 (1.06%) 66,199 2.86%
022 Clarke County Public Schools 64,196 65,148 1.48% 67,755 4.00%
023 Craig County Public Schools 54,962 48,013 (12.64%) 55,715 16.04%
024 Culpeper County Public Schools 75,981 77,392 1.86% 75,983 (1.82%)
025 Cumberland County Public Schools 64,627 64,325 (0.47%) 70,955 10.31%
026 Dickenson County Public Schools 46,952 40,942 (12.80%) 42,490 3.78%
027 Dinwiddie County Public Schools 64,271 65,108 1.30% 72,044 10.65%
028 Essex County Public Schools 69,447 65,398 (5.83%) 69,376 6.08%
029 Fairfax County Public Schools2 102,861 107,964 4.96% 104,886 (2.85%)
030 Fauquier County Public Schools 75,856 76,521 0.88% 78,909 3.12%
031 Floyd County Public Schools 56,008 63,599 13.55% 65,734 3.36%
032 Fluvanna County Public Schools 67,687 66,056 (2.41%) 70,487 6.71%
033 Franklin County Public Schools 69,959 72,978 4.32% 76,124 4.31%
034 Frederick County Public Schools 74,137 76,518 3.21% 82,987 8.46%
035 Giles County Public Schools 60,656 57,172 (5.74%) 65,745 14.99%
036 Gloucester County Public Schools 58,479 60,044 2.68% 59,649 (0.66%)
037 Goochland County Public Schools 70,997 74,850 5.43% 76,480 2.18%
038 Grayson County Public Schools 51,708 56,004 8.31% 29,402 (47.50%)
039 Greene County Public Schools 58,951 59,108 0.27% 72,278 22.28%
040 Greensville County Public Schools3 56,934 54,032 (5.10%) 54,372 0.63%
041 Halifax County Public Schools 74,178 59,322 (20.03%) 64,872 9.36%
042 Hanover County Public Schools 69,378 70,898 2.19% 72,362 2.06%
043 Henrico County Public Schools 70,127 76,294 8.79% 76,290 (0.01%)
044 Henry County Public Schools 64,771 64,793 0.03% 60,100 (7.24%)
045 Highland County Public Schools - - -
046 Isle Of Wight County Public Schools 66,687 68,601 2.87% 68,493 (0.16%)
048 King George County Public Schools 73,544 79,769 8.46% 77,992 (2.23%)
049 King And Queen County Public Schools 62,557 57,115 (8.70%) -
Virginia Department of Education
2014-2015 Salary Survey - Assistant Principals
FY 2015 Salary Survey - Asst. Principals
January 14, 2015
Page 13

Division Name
FY 2013
Actual Average
Assistant
Principal Salary
FY 2014
Actual Average
Assistant
Principal Salary
FY 2013 to
FY 2014
Percent
Increase/
(Decrease)
FY 2015
Budgeted Average
Assistant Principal
Salary
FY 2014 to
FY 2015
Percent
Increase/
(Decrease)
Virginia Department of Education
2014-2015 Salary Survey - Assistant Principals
050 King William County Public Schools 66,939 68,938 2.99% 70,317 2.00%
051 Lancaster County Public Schools 69,118 65,916 (4.63%) 67,060 1.74%
052 Lee County Public Schools 46,343 49,608 7.05% 51,500 3.81%
053 Loudoun County Public Schools 83,494 86,433 3.52% 92,974 7.57%
054 Louisa County Public Schools 64,372 65,257 1.37% 66,736 2.27%
055 Lunenburg County Public Schools 58,467 59,062 1.02% 60,066 1.70%
056 Madison County Public Schools 68,106 64,070 (5.93%) 65,384 2.05%
057 Mathews County Public Schools 60,303 56,721 (5.94%) 57,856 2.00%
058 Mecklenburg County Public Schools 48,589 49,990 2.88% 51,168 2.36%
059 Middlesex County Public Schools 61,346 64,668 5.41% 66,291 2.51%
060 Montgomery County Public Schools 63,002 67,622 7.33% 70,163 3.76%
062 Nelson County Public Schools 67,560 75,712 12.07% 68,829 (9.09%)
063 New Kent County Public Schools 72,743 75,528 3.83% 73,390 (2.83%)
065 Northampton County Public Schools 67,223 68,769 2.30% 68,989 0.32%
066 Northumberland County Public Schools 70,303 68,462 (2.62%) 66,362 (3.07%)
067 Nottoway County Public Schools 71,286 71,650 0.51% 70,968 (0.95%)
068 Orange County Public Schools 73,625 75,069 1.96% 78,072 4.00%
069 Page County Public Schools 47,139 57,800 22.62% 56,743 (1.83%)
070 Patrick County Public Schools 52,475 61,607 17.40% 61,044 (0.91%)
071 Pittsylvania County Public Schools 57,708 62,237 7.85% 63,202 1.55%
072 Powhatan County Public Schools 76,314 79,430 4.08% 90,358 13.76%
073 Prince Edward County Public Schools 67,180 71,404 6.29% 70,455 (1.33%)
074 Prince George County Public Schools 68,947 67,836 (1.61%) 67,817 (0.03%)
075 Prince William County Public Schools 89,453 94,915 6.11% 92,468 (2.58%)
077 Pulaski County Public Schools 67,490 65,952 (2.28%) 63,571 (3.61%)
078 Rappahannock County Public Schools 72,049 73,427 1.91% 74,527 1.50%
079 Richmond County Public Schools 68,250 64,058 (6.14%) 66,631 4.02%
080 Roanoke County Public Schools 71,179 71,539 0.51% 77,635 8.52%
081 Rockbridge County Public Schools 65,997 62,593 (5.16%) 63,845 2.00%
082 Rockingham County Public Schools 70,283 71,541 1.79% 73,478 2.71%
083 Russell County Public Schools 54,260 61,582 13.49% 59,702 (3.05%)
084 Scott County Public Schools 63,387 63,735 0.55% 64,182 0.70%
085 Shenandoah County Public Schools 76,471 80,121 4.77% 79,128 (1.24%)
086 Smyth County Public Schools 74,201 72,172 (2.73%) 72,172 0.00%
087 Southampton County Public Schools 65,533 61,120 (6.73%) 63,223 3.44%
088 Spotsylvania County Public Schools 83,553 80,907 (3.17%) 83,988 3.81%
089 Stafford County Public Schools 89,941 85,843 (4.56%) 87,344 1.75%
090 Surry County Public Schools 67,735 58,598 (13.49%) 73,919 26.15%
091 Sussex County Public Schools 61,337 73,023 19.05% 73,000 (0.03%)
092 Tazewell County Public Schools 58,311 61,571 5.59% 62,303 1.19%
093 Warren County Public Schools 72,148 74,188 2.83% 74,299 0.15%
094 Washington County Public Schools 70,929 70,813 (0.16%) 70,813 0.00%
095 Westmoreland County Public Schools 60,400 61,207 1.34% 61,753 0.89%
096 Wise County Public Schools 60,500 63,647 5.20% 62,609 (1.63%)
097 Wythe County Public Schools 74,647 76,086 1.93% 76,336 0.33%
098 York County Public Schools 56,499 64,714 14.54% 67,337 4.05%
Cities
101 Alexandria City Public Schools 101,797 101,552 (0.24%) 101,580 0.03%
102 Bristol City Public Schools 74,886 76,380 2.00% 77,651 1.66%
103 Buena Vista City Public Schools 53,574 57,866 8.01% 57,866 (0.00%)
104 Charlottesville City Public Schools 70,468 71,725 1.78% 73,160 2.00%
106 Colonial Heights City Public Schools 71,844 74,537 3.75% 74,537 (0.00%)
FY 2015 Salary Survey - Asst. Principals
January 14, 2015
Page 14

Division Name
FY 2013
Actual Average
Assistant
Principal Salary
FY 2014
Actual Average
Assistant
Principal Salary
FY 2013 to
FY 2014
Percent
Increase/
(Decrease)
FY 2015
Budgeted Average
Assistant Principal
Salary
FY 2014 to
FY 2015
Percent
Increase/
(Decrease)
Virginia Department of Education
2014-2015 Salary Survey - Assistant Principals
107 Covington City Public Schools 67,511 76,750 13.69% 77,484 0.96%
108 Danville City Public Schools 57,799 56,616 (2.05%) 56,871 0.45%
109 Falls Church City Public Schools 100,948 104,287 3.31% 91,490 (12.27%)
110 Fredericksburg City Public Schools 85,228 88,143 3.42% 90,123 2.25%
111 Galax City Public Schools 59,053 60,526 2.50% 61,945 2.34%
112 Hampton City Public Schools 60,374 63,907 5.85% 66,811 4.54%
113 Harrisonburg City Public Schools 71,498 73,687 3.06% 74,804 1.52%
114 Hopewell City Public Schools 61,083 62,002 1.50% 63,101 1.77%
115 Lynchburg City Public Schools 63,227 64,880 2.61% 92,085 41.93%
116 Martinsville City Public Schools 59,704 64,311 7.72% 64,908 0.93%
117 Newport News City Public Schools 68,751 71,408 3.87% 74,490 4.32%
118 Norfolk City Public Schools 68,842 70,799 2.84% 70,997 0.28%
119 Norton City Public Schools 66,130 62,927 (4.84%) 57,568 (8.52%)
120 Petersburg City Public Schools 47,612 48,553 1.98% 59,953 23.48%
121 Portsmouth City Public Schools 71,328 68,733 (3.64%) 71,099 3.44%
122 Radford City Public Schools 68,010 69,370 2.00% 70,757 2.00%
123 Richmond City Public Schools 69,503 70,802 1.87% 74,211 4.81%
124 Roanoke City Public Schools 66,459 59,427 (10.58%) 67,806 14.10%
126 Staunton City Public Schools 65,363 68,338 4.55% 70,216 2.75%
127 Suffolk City Public Schools 64,026 65,235 1.89% 68,317 4.72%
128 Virginia Beach City Public Schools 71,188 71,832 0.90% 73,772 2.70%
130 Waynesboro City Public Schools 64,971 67,908 4.52% 66,843 (1.57%)
131 Williamsburg Public Schools4 63,530 62,343 (1.87%) 65,301 4.74%
132 Winchester City Public Schools 85,788 85,957 0.20% 88,637 3.12%
135 Franklin City Public Schools 56,855 73,358 29.03% 65,338 (10.93%)
136 Chesapeake City Public Schools 75,291 76,350 1.41% 77,800 1.90%
137 Lexington City Public Schools - - -
139 Salem City Public Schools 80,416 75,650 (5.93%) 77,586 2.56%
142 Poquoson City Public Schools 63,332 65,463 3.36% 67,015 2.37%
143 Manassas City Public Schools 95,389 100,177 5.02% 96,841 (3.33%)
144 Manassas Park City Public Schools 76,073 79,382 4.35% 83,597 5.31%
Towns
202 Colonial Beach Public Schools - - -
207 West Point Public Schools 67,670 69,362 2.50% 71,443 3.00%
Average for School Divisions5: 77,496 79,798 2.97% 80,877 1.35%
Governor's Schools
260 Central Virginia Governor's School - - -
261 Southwest Virginia Governor's School - - -
262 Governor's School For The Arts 77,428 76,807 (0.80%) 80,557 4.88%
263 Roanoke Valley Governor's School - - -
264 New Horizons Governor's School - - -
265 Shenandoah Valley Governor's School - - -
266 Governor's School Global Economics/Tech - - -
267 Appomattox Regional Governor's School - - -
268 A. Linwood Holton Governor's School - - -
269 Chesapeake Bay Governor's School - - -
270 Commonwealth Governor's School - - -
271 Maggie L. Walker Governor's School
Data not
submitted by
division.
101,190 N/A 106,694 N/A
272 Thomas Jefferson High School 111,594 104,185 (6.64%) 103,856 (0.32%)
FY 2015 Salary Survey - Asst. Principals
January 14, 2015
Page 15

Division Name
FY 2013
Actual Average
Assistant
Principal Salary
FY 2014
Actual Average
Assistant
Principal Salary
FY 2013 to
FY 2014
Percent
Increase/
(Decrease)
FY 2015
Budgeted Average
Assistant Principal
Salary
FY 2014 to
FY 2015
Percent
Increase/
(Decrease)
Virginia Department of Education
2014-2015 Salary Survey - Assistant Principals
273 Blue Ridge Governor's School - - -
274 Jackson River Governor's School - - -
275 Massanutten Governor's School - - -
276 Piedmont Governor's School - - -
277 Mountain Vista Governor's School - - -
278 Governor's School at Innovation Park - - -
Average for Governor's Schools5: 103,053 98,642 (4.28%) 100,919 2.31%
Special Education Regional Programs
280 Cooperative Centers For Exceptional Children - - -
281 Middle Peninsula Special Education Program - - -
282 Laurel Regional Special Education Center - - -
283 Northern Neck Special Education Program - - -
284 Northwestern Regional Education Program 70,905 71,968 1.50% 73,769 2.50%
285 Peninsula Area Cooperative Education Services - - -
286 Piedmont Regional Education Program - - -
287 Shenandoah Valley Regional Program - - -
288 Southeastern Cooperative Educational Program - - -
290 N. Virginia Regional Special Education Program 89,053 96,363 8.21% 96,363 0.00%
292 Henry Co/Martinsville Regional Program - - -
299 Roanoke Valley Regional Board - - -
Average for Special Education Programs5: 83,793 90,819 8.38% 91,228 0.45%
Vocational Education Regional Programs
301 Charlottesville-Albemarle Vocational-Technical 77,007 79,318 3.00% 81,618 2.90%
302 Jackson River Technical Center 57,780 48,775 (15.58%) 59,520 22.03%
304 Massanutten Technical Center 72,601 74,053 2.00% 75,000 1.28%
306 Valley Vocational-Technical Center 65,861 67,276 2.15% 69,946 3.97%
307 New Horizons Regional Education Center 73,513 76,660 4.28% 79,045 3.11%
308 P. D. Pruden Vocational-Technical Center 69,704 70,411 1.01% 70,411 0.00%
309 Rowanty Vocational-Technical Center - - -
310 Northern Neck Vocational-Technical Center 59,640 62,192 4.28% 63,125 1.50%
311 Amelia-Nottoway Vocational-Technical Center
Data not
submitted by
division.
- N/A -
313 Bridging Communities Career and Technical Center N/A - N/A -
Average for Vocational Education Programs5: 70,528 72,228 2.41% 73,836 2.23%
Regional Alternative Education Programs
401 Lynchburg City Secondary Alternative - - -
402 Enterprise Academy/Newport News City 84,547 82,548 (2.36%) 86,263 4.50%
403 Tidewater Regional Alternative Education - - -
404 Regional Alternative Plus Self Project/Roanoke - - -
405 Transition Support Resource Center/Fairfax - - -
406 Project Return/Fluvanna County - - -
407 Behav Disord Youth/Montgomery - - -
408 Petersburg Regional Alternative - - -
409 Regional Alternative/Pittsylvania Co - - -
410 Project Return/Powhatan Co - - -
411 Crossroads Alternative/Bristol City - - -
412 Metro Richmond Alternative Ed 62,766 - -
413 Regional Alternative Ed/Stafford Co - - -
FY 2015 Salary Survey - Asst. Principals
January 14, 2015
Page 16

Division Name
FY 2013
Actual Average
Assistant
Principal Salary
FY 2014
Actual Average
Assistant
Principal Salary
FY 2013 to
FY 2014
Percent
Increase/
(Decrease)
FY 2015
Budgeted Average
Assistant Principal
Salary
FY 2014 to
FY 2015
Percent
Increase/
(Decrease)
Virginia Department of Education
2014-2015 Salary Survey - Assistant Principals
414 Southside L.I.N.K. Project/Brunswick Co - - -
415 Regional Alternative Ed/King William - - -
416 New Dominion/Prince William Co 66,049 60,570 (8.30%) 62,280 2.82%
417 Project Bridge/Russell Co - - -
418 Regional Alternative/Wythe Co - - -
420 Piedmont Alternative School
Data not
submitted by
division.
- N/A -
421 Northern Neck Regional Alternative Education 65,296 66,603 2.00% 67,603 1.50%
422 Shenandoah Valley Reg Alternative Ed/Genesis - - -
423 Breaking Barriers Alternative Ed/Henry Co - - -
424 Carroll/Galax/Joy Ranch Reg Alternative Ed - - -
426 Regional Learning Academy/Wise Co - - -
427 Regional Community Alternative Ed Continuum 66,700 68,715 3.02% 68,534 (0.26%)
428 Project Renew/Northampton Co - - -
429 Renaissance/Scott Co - - -
431 Regional Alternative Education Center/Buena Vista - - -
Average for Alternative Education Programs5: 68,781 69,896 1.62% 71,408 2.16%
Statewide Average5: 77,506 79,825 2.99% 80,908 1.36%
1 Data for Bedford City is reported with Bedford County.
2 Data for Fairfax City is reported with Fairfax County.
3 Data for Emporia City is reported with Greensville County.
4 Data for James City County is reported with Williamsburg City.
5 Average calculated on the basis of statewide totals.
Note: DOE staff prepared the report based on Annual School Report (ASR) data submitted by each school division or regional program.
FY 2015 Salary Survey - Asst. Principals
January 14, 2015
Page 17

Division Name Reported Local Action to Improve Classroom Teacher Salaries in FY 2015
School Divisions
Counties
001 Accomack County Public Schools Data not submitted by division.
002 Albemarle County Public Schools Approximately 1% (Step and Scale) for teachers and 1% for classified.
003 Alleghany County Public Schools 2% increase reflected in salary schedule adjustment
004 Amelia County Public Schools A 2.5% increase was given.
005 Amherst County Public Schools No action taken to improve teacher's salaries
006 Appomattox County Public Schools No action taken to improve teacher's salaries
007 Arlington County Public Schools All employees received a 2% cost of living adjustment in FY 2015.
008 Augusta County Public SchoolsFor the 2014-2015 school year, the teachers were given an average 3.969% increase in salary and
the administrators and support staff received a 3.4% increase.
009 Bath County Public Schools Teachers were provided a 5% salary increase.
010 Bedford County Public Schools1 No action taken to improve teacher's salaries
011 Bland County Public Schools Salary step increases plus one percent were given to teachers.
012 Botetourt County Public Schools No action taken to improve teacher's salaries
013 Brunswick County Public Schools No action taken to improve teacher's salaries
014 Buchanan County Public Schools $1000 increase
015 Buckingham County Public Schools No action taken to improve teacher's salaries
016 Campbell County Public Schools 1.5% pay increase across the board
017 Caroline County Public Schools Salary one step increase
018 Carroll County Public Schools All staff were given a 1.5% plus step increase. Staff also had to contribute an additional 1% to VRS.
019 Charles City County Public Schools No action taken to improve teacher's salaries
020 Charlotte County Public SchoolsWe gave teachers a 2% salary increase for FY 2015 and keep the heatlh insurance rate the same
cost to employees
021 Chesterfield County Public Schools All CCPS employees will receive a 1% increase in FY2015
022 Clarke County Public SchoolsA study was commissioned and funds were set aside for salary increases. Pay increases based on
the results of the study are expected, but no action has been taken at this time.
023 Craig County Public Schools No action taken to improve teacher's salaries
024 Culpeper County Public Schools 3% increase
025 Cumberland County Public Schools Some teacher received a step increase according to salary scale.
026 Dickenson County Public Schools
Provided a3.25% across the board raise to all VRS covered employees. 3% was to offset the final
phase-in of the employee VRS deduction, the remaining 0.25% was to help offset the additional FICA
and Medicare taxes that would be withheld from employees wages.
027 Dinwiddie County Public Schools No action taken to improve teacher's salaries
028 Essex County Public Schools provided 2 % increase
029 Fairfax County Public Schools2 A two month delayed salary step increase for most teachers.
030 Fauquier County Public SchoolsTeacher scale adjustment to address compression at the beginning steps and compensation amounts
in the targeted area of steps 3 to 13. Overall, average increase just under 1%.
031 Floyd County Public Schools No action taken to improve teacher's salaries
032 Fluvanna County Public SchoolsAn increase of 3.6% is budgeted for FY 2015 for full-time contracted employees, of which 3% will be
used to increase the cost of employee-funded VSRS.
033 Franklin County Public Schools
All full-time employees will receive a 1.15% pay increase in 2014-15 to offset the mandate to pay an
additional 1.00% of their own VRS retirement contributions-----the phase-in approach over 5 years.
Also, all full-time employees will receive a one-time cost-of-living-payment (employee bonus) totaling
$1,000 and regular part-time employees will receive $500. This is a one-time payment which will not
increase their contracted pay.
034 Frederick County Public SchoolsAll employees received a step movement on existing salary scales ranging from 2 to 3.3 percent
increase. Further, 11 month assistant principal positions were extended to 12 months contract.
035 Giles County Public SchoolsFOR FISCAL YEAR 2015 - SCHOOL PERSONNEL WAS GIVEN AN OVERALL 3% RAISED
BASED ON SALARY SCALE
036 Gloucester County Public Schools No action taken to improve teacher's salaries
037 Goochland County Public Schools1% cost of living increase plus improved education supplement (from flat $1500 for Masters to 4.5%
of base salary) which averaged as a 1.5% salary increase for teachers
038 Grayson County Public Schools Employees received an average of 3% raise plus a step in FY2015
039 Greene County Public SchoolsMandatory 1% increase given to off-set additional 1% of VRS cost shifted from employer to employee.
5% Cost of living increase
040 Greensville County Public Schools3 2.00% salary increase to classroom teachers in FY 2015
041 Halifax County Public Schools No action taken to improve teacher's salaries
042 Hanover County Public Schools 2% COLA salary increase
043 Henrico County Public Schools There will be a 3% increase midyear
044 Henry County Public Schools No action taken to improve teacher's salaries
045 Highland County Public Schools Teachers received a 2% raise plus a step on the salary scale.
Local Actions to Improve Classroom Teacher Salaries in Fiscal Year 2015
(As reported by school divisions on the 2013-2014 Annual School Report - narrative not edited by DOE for content or format)
Virginia Department of Education
2014-2015 Salary Survey
FY 2015 Salary Survey - Narrative
January 14, 2015
Page 18

Division Name Reported Local Action to Improve Classroom Teacher Salaries in FY 2015
Local Actions to Improve Classroom Teacher Salaries in Fiscal Year 2015
(As reported by school divisions on the 2013-2014 Annual School Report - narrative not edited by DOE for content or format)
Virginia Department of Education
2014-2015 Salary Survey
046 Isle Of Wight County Public Schools
A step increase was given to all teaching staff. Teaching staff at step 30 or above on the salary scale
were frozen and no salary increase was given. All staff not on the teacher salary scale received a 2%
salary increase.
048 King George County Public Schools The teachers were given a 1% COLA and a 2% salary increase.
049 King And Queen County Public SchoolsTeachers who were hired prior to July 1, 2012, will receive a 1% salary increase for FY2015,
representing the last phase in of VRS.
050 King William County Public Schools Teachers were given a step increase which averaged about 2.5%.
051 Lancaster County Public Schools Step Increase equal to 2%
052 Lee County Public Schools A salary step increase was provided to teachers for FY15; a 3.81% average increase.
053 Loudoun County Public SchoolsAll salary scales were restructured resulting in average increases of between 2.6% and 4.0%. In
addition, a 1% increase for third phase of VRS implementation.
054 Louisa County Public Schools
We adjusted our teacher scales to bring staff half way back to the FY09 steps. This meant staff was
increased between 2.3% to 8%. Most were in the 3.5% range plus 1% VRS increase. Certified staff
increased 2% + 1% VRS and Admin was increased 1% and 1% for VRS.
055 Lunenburg County Public SchoolsAll employees not at the top of their scale were given a step increase. Increase amounted to
approximately 1%.
056 Madison County Public Schools No action taken to improve teacher's salaries
057 Mathews County Public Schools One percent plus step raise
058 Mecklenburg County Public Schools 1% VRS Adjustment; some step adjustments
059 Middlesex County Public Schools No action taken to improve teacher's salaries
060 Montgomery County Public SchoolsEmployees received a two step increase, one step for experience and one makeup step, for FY 2015.
This is approximately a 3.4% raise.
062 Nelson County Public Schools No action taken to improve teacher's salaries
063 New Kent County Public SchoolsThe teachers received a minimal step increase. New Kent has a plan that in over seven year we will
decompress the scale that was compressed for years.
065 Northampton County Public Schools A one step increase was given, which was equivalent to 1.5%.
066 Northumberland County Public Schools 1% increase
067 Nottoway County Public Schools No action taken to improve teacher's salaries
068 Orange County Public Schools
Adjusted salary scales by increasing the amount of pay on each step, decreasing the number of steps
and creating equal increments between each step. Teachers will experience an average 4% salary
increase as a result (combination of step + COLA).
069 Page County Public Schools No action taken to improve teacher's salaries
070 Patrick County Public SchoolsPatrick County Public Schools provided a salary step increase for all personnel and a two hundred
dollar increase for those employees that were at the top of the salary scale.
071 Pittsylvania County Public Schools We gave a 1% cost of living increase and continued with the 1% VRS offset.
072 Powhatan County Public Schools Provided a 2% increase to creditable compensation for all teachers.
073 Prince Edward County Public Schools All contractual employees received a 1% salary increase for FY 2015.
074 Prince George County Public Schools No action taken to improve teacher's salaries
075 Prince William County Public SchoolsThe school division increased salaries by giving a 2% increase to all employee as a pay plan
adjustment. As well as a 1% increase for the increase in VRS costs.
077 Pulaski County Public Schools No action taken to improve teacher's salaries
078 Rappahannock County Public Schools Teachers received a step increase in by a step which equates to a 1.5% increase.
079 Richmond County Public SchoolsSalaries were adjusted for teaching staff at a average of 2%; all other personnel received an average
of 1.5% increase.
080 Roanoke County Public Schools 2% Cola raise in 2015 for all employees.
081 Rockbridge County Public Schools Everyone got a one step increase.
082 Rockingham County Public Schools 2% salary increase given to all employees
083 Russell County Public Schools5 All employees will receive a 1.275% salary increase for FY 15.
084 Scott County Public Schools Step Increase
085 Shenandoah County Public Schools Provided a cost of living increase
086 Smyth County Public Schools No action taken to improve teacher's salaries
087 Southampton County Public Schools A minimum 2% salary increase for all contracted employees
088 Spotsylvania County Public SchoolsAll employees received a salary step increase plus 1% COLA. The effective annual percentage
salary increase for classroom teachers was approximately 2.86%.
089 Stafford County Public Schools Provided 1% increase in accordance with increase in VRS withholding.
090 Surry County Public Schools Cost of Living Adjustment of 1% added to salaries
091 Sussex County Public Schools No action taken to improve teacher's salaries
092 Tazewell County Public Schools No action taken to improve teacher's salaries
093 Warren County Public Schools No action taken to improve teacher's salaries
094 Washington County Public Schools No action taken to improve teacher's salaries
095 Westmoreland County Public Schools
Teachers were behind on their step. Teachers were moved at least two steps on the scale, unless
they were not behind and moving one step, put them at their correct year on the scale. This equal to
about a 2% increase
096 Wise County Public Schools No action taken to improve teacher's salaries
FY 2015 Salary Survey - Narrative
January 14, 2015
Page 19

Division Name Reported Local Action to Improve Classroom Teacher Salaries in FY 2015
Local Actions to Improve Classroom Teacher Salaries in Fiscal Year 2015
(As reported by school divisions on the 2013-2014 Annual School Report - narrative not edited by DOE for content or format)
Virginia Department of Education
2014-2015 Salary Survey
097 Wythe County Public Schools No action taken to improve teacher's salaries
098 York County Public Schools
Shifted 1% of the VRS to the employee with a corresponding increase in salary and provided an
average 3.1% increase for all full-time permanent staff. The 3.1% average increase included a step
increase for eligible staff and an across the board increase.
Cities
101 Alexandria City Public Schools 1% increase for market rate adjustment
102 Bristol City Public Schools Provided a flat 1% pay increase to cover the 1% increase in Employee VRS
103 Buena Vista City Public Schools No action taken to improve teacher's salaries
104 Charlottesville City Public Schools average increase of 3%
106 Colonial Heights City Public Schools No action taken to improve teacher's salaries
107 Covington City Public Schools Adjustment made to provide for VRS employee share phase-in.
108 Danville City Public Schools cost of living increase of 2% for all teaching personnel
109 Falls Church City Public Schools
A new Teacher Salary Scale is being phased-in over the next 4 years to provide more regionally-
competive salaries. This first year (between FY14 and FY15) the overall improvement averages
7.2%, which includes a step increase. However, please note that this increase also includes passing
the final 3.0% of the 5% Employee Share of VRS back to the staff.
110 Fredericksburg City Public Schools Average Scale Step Increase of 10.49%
111 Galax City Public Schools Average 1.5% increase.
112 Hampton City Public Schools No action taken to improve teacher's salaries
113 Harrisonburg City Public Schools Each employee received a $200 bonus in FY14
114 Hopewell City Public Schools We provided a 2% COLA to all employees.
115 Lynchburg City Public Schools All teachers salaries were increased by a 2% cost of living adjustment
116 Martinsville City Public Schools No action taken to improve teacher's salaries
117 Newport News City Public Schools
All personnel will a 4.5% pay increase in FY2015. However, employees are will then have to pay 3%
of this raise to VRS, thus increasing the employee VRS contribution from the current 2% to the full
5%.
118 Norfolk City Public Schools No action taken to improve teacher's salaries
119 Norton City Public Schools No action taken to improve teacher's salaries
120 Petersburg City Public Schools 5% Teacher Salary Increase.
121 Portsmouth City Public Schools No action taken to improve teacher's salaries
122 Radford City Public Schools Salary step increase
123 Richmond City Public SchoolsRPS teachers received a 4.03% increase in salaries which included the final 1% VRS employee
contribution phase in.
124 Roanoke City Public Schools 2% cost of living increase or step, whichever was higher
126 Staunton City Public Schools average 3% increase
127 Suffolk City Public Schools 1% adjustment for VRS contribution and 1.5% COLA.
128 Virginia Beach City Public Schools 3% pay raise with VRS offset of 1% for a net 2% pay raise
130 Waynesboro City Public Schools No action taken to improve teacher's salaries
131 Williamsburg Public Schools4All employees received a 1% pay increase. All full time, VRS eligible employees, also received 3.42%
to offset the phasing in of the remainder of the VRS deduction (full 5% beginning in FY15).
132 Winchester City Public Schools
Our adopted school board budget includes a 3% raise for all employees on a wage or salary scale
effective January 1, 2015. At that time, each employee will move up a step on the July 1, 2015 scale
which represents a minimum of a 3% raise.
135 Franklin City Public Schools No action taken to improve teacher's salaries
136 Chesapeake City Public Schools 2% salary increase
137 Lexington City Public Schools 2% increase
139 Salem City Public Schools
It was just decided in the August 2014 School Board meeting that Classified staff would receive a step
increase (average of 2.5%), Teachers would receive an average 2% raise and Administration would
receive an average 1.5% raise.
142 Poquoson City Public Schools
Employees were given a 2.4% raise. The raise was required as PCPS phased-in the final 2% of the
VRS Employee rate. An additional .4% was also provided so that a majority of employees would not
lose money through the phase-in process.
143 Manassas City Public Schools Salary step increase average 3.05%
144 Manassas Park City Public Schools 35 VRS Pass thur plus 2% COLA for all salaries in the division
Towns
202 Colonial Beach Public Schools Salary step increase and 2% COLA, about a 3% increase overall
207 West Point Public Schools West Point School Board will provide a 3.5% salary and a step increae.
Governor's Schools
260 Central Virginia Governor's School 2% salary increase
261 Southwest Virginia Governor's School No action taken to improve teacher's salaries
FY 2015 Salary Survey - Narrative
January 14, 2015
Page 20

Division Name Reported Local Action to Improve Classroom Teacher Salaries in FY 2015
Local Actions to Improve Classroom Teacher Salaries in Fiscal Year 2015
(As reported by school divisions on the 2013-2014 Annual School Report - narrative not edited by DOE for content or format)
Virginia Department of Education
2014-2015 Salary Survey
262 Governor's School For The Arts 2% cost of living increase
263 Roanoke Valley Governor's School Step increase or 2% cost of living increase
264 New Horizons Governor's SchoolTeachers salaries have been increased by 3.1%. The effective annual percentage of net salary
increase after a 2% VRS increase and social security is .3%.
265 Shenandoah Valley Governor's SchoolFor 2014-2015, teachers received an average 3.969% salary increase and administrators and
support staff received a 3.4% increase.
266 Governor's School Global Economics/Tech No action taken to improve teacher's salaries
267 Appomattox Regional Governor's School Teacher salaries will be adjusted in FY2015 by 1% for a salary increase
268 A. Linwood Holton Governor's School No action taken to improve teacher's salaries
269 Chesapeake Bay Governor's School 2% Salary Increase for all staff
270 Commonwealth Governor's School
Stafford County Public Schools gave a 1% increase for the VRS offset only. Spotsylvania County
Public Schools gave a Step plus 1% COLA to all employees (effective 2.86% increase for classroom
teachers). King George County Public Schools gave a total of 2% (1% COLA plus 1% VRS offset) --
and Caroline County Public Schools gave a 1% STEP to eligible employees.
271 Maggie L. Walker Governor's School 2% increase in salaries to offset VRS costs
272 Thomas Jefferson High School A two month delayed salary step increase for most teachers.
273 Blue Ridge Governor's SchoolAn increase of 3.6% is budgeted for FY 2015 for full-time contracted employees of which 3% will be
used to increase the cost of employee funded VSRS.
274 Jackson River Governor's School 2% salary increase.
275 Massanutten Governor's School COST OF LIVING INCREASE
276 Piedmont Governor's School No action taken to improve teacher's salaries
277 Mountain Vista Governor's School Salary scale adjustments with an overall average salary increase of 1%.
278 Governor's School at Innovation ParkThe school division increased salaries by giving a 2% increase to all employees as apay plan
adjustment. As well as a 1% increase for the increase in VRS costs.
Special Education Regional Programs
280 Cooperative Centers For Exceptional Children 1.5% salary increase given across the board to offset the additional 1% for VRS
281 Middle Peninsula Special Education Program No action taken to improve teacher's salaries
282 Laurel Regional Special Education Center 2% salary increase
283 Northern Neck Special Education Program 2 % SALARY INCREASE
284 Northwestern Regional Education ProgramAll employees received a step movement on existing salary scales ranging from 2 to 3.3 percent
increase.
285 Peninsula Area Cooperative Education Services No action taken to improve teacher's salaries
286 Piedmont Regional Education Program step +2% increase to offset VRS employee contribution
287 Shenandoah Valley Regional Program A 2% across-the-board increase was budgeted for FY15.
288 Southeastern Cooperative Educational Program Approx. 2% pay raise
290 N. Virginia Regional Special Education Program No action taken to improve teacher's salaries
292 Henry Co/Martinsville Regional Program No action taken to improve teacher's salaries
299 Roanoke Valley Regional Board No action taken to improve teacher's salaries
Vocational Education Regional Programs
301 Charlottesville-Albemarle Vocational-Technical 1% increase for teacher scales. One time bonus paid to teachers at the top of their scales.
302 Jackson River Technical Center Teachers were given a 1.6% salary increase.
304 Massanutten Technical Center 2% salary increase was given to all
306 Valley Vocational-Technical Center Provided step increase and adjusted steps. Average salary increase will be approximately 4%
307 New Horizons Regional Education CenterTeachers salaries have increased by 3.1%. The effective annual percentage of net salary increase
after a 2% VRS increase and social security is .3%
308 P. D. Pruden Vocational-Technical Center No action taken to improve teacher's salaries
309 Rowanty Vocational-Technical Center No action taken to improve teacher's salaries
310 Northern Neck Vocational-Technical Center 1.5% cost of living increase
311 Amelia-Nottoway Vocational-Technical Center No action taken to improve teacher's salaries
313 Bridging Communities Career and Technical CenterThe teachers received a minimal step increase. New Kent has a plan that in over seven years we wil
decompress the scale that was compressed for years.
Regional Alternative Education Programs
401 Lynchburg City Secondary Alternative 2% salary increase
402 Enterprise Academy/Newport News City
All personnel will a 4.5% pay increase in FY2015. However, employees are will then have to pay 3%
of this raise to VRS, thus increasing the employee VRS contribution from the current 2% to the full
5%.
403 Tidewater Regional Alternative Education 2% cost of living raise
404 Regional Alternative Plus Self Project/Roanoke step increase or 2% cost of living increase
405 Transition Support Resource Center/Fairfax A two month delayed salary step increase for most teachers.
406 Project Return/Fluvanna CountyAn increase of 3.6% is budgeted for FY 2015 for full-time contracted employees of which 3% will be
used to increase the cost of employee funded VSRS.
FY 2015 Salary Survey - Narrative
January 14, 2015
Page 21

Division Name Reported Local Action to Improve Classroom Teacher Salaries in FY 2015
Local Actions to Improve Classroom Teacher Salaries in Fiscal Year 2015
(As reported by school divisions on the 2013-2014 Annual School Report - narrative not edited by DOE for content or format)
Virginia Department of Education
2014-2015 Salary Survey
407 Behav Disord Youth/Montgomery A raise of approximately 2%.
408 Petersburg Regional Alternative Step increase
409 Regional Alternative/Pittsylvania Co 1% cost of living salary increase, 1% salary increase to offset VRS expense
410 Project Return/Powhatan Co Provided a 2% salary increase.
411 Crossroads Alternative/Bristol City Required 1% salary increase related to VRS increase
412 Metro Richmond Alternative Ed Performance based merit increases were given.
413 Regional Alternative Ed/Stafford Co Provided 1% increase in accordance with increase in VRS withholding.
414 Southside L.I.N.K. Project/Brunswick Co No action taken to improve teacher's salaries
415 Regional Alternative Ed/King WilliamSite directors were given a 2% increase. Teachers' pay was increased from $28 per hour to $30 per
hour.
416 New Dominion/Prince William CoThe school division increased salaries by giving a 2% increase to all employees as a pay plan
adjustment. As well as a 1% increase for the increase in VRS costs.
417 Project Bridge/Russell Co All full-time employees will receive a 1.275% increase.
418 Regional Alternative/Wythe Co No action taken to improve teacher's salaries
420 Piedmont Alternative School No action taken to improve teacher's salaries
421 Northern Neck Regional Alternative Education Staff received a 1.5% salary increase
422 Shenandoah Valley Reg Alternative Ed/Genesis Average 3% salary increase
423 Breaking Barriers Alternative Ed/Henry Co No action taken to improve teacher's salaries
424 Carroll/Galax/Joy Ranch Reg Alternative Ed All staff members were given a 1.5% plus step increase for 14/15
426 Regional Learning Academy/Wise Co No action taken to improve teacher's salaries
427 Regional Community Alternative Ed ContinuumTeacher scale adjustment to address compression at the beginning steps and compensation amounts
in the targeted area of steps 3 to 13. Overall, average increase just under 1%.
428 Project Renew/Northampton Co One step, equivalent to 1.5% in Northampton County.
429 Renaissance/Scott Co 2% decrease + step increase
431 Regional Alternative Education Center/Buena Vista No action taken to improve teacher's salaries
1 Data for Bedford City is reported with Bedford County.
2 Data for Fairfax City is reported with Fairfax County.
3 Data for Emporia City is reported with Greensville County.
4 Data for James City County is reported with Williamsburg City.
FY 2015 Salary Survey - Narrative
January 14, 2015
Page 22

Division Division Name
Bachelor's
Starting Salary
Master's
Starting Salary
Doctorate
Starting Salary
001 Accomack County Public Schools 35,521 38,239 36,607
002 Albemarle County Public Schools 44,300 46,415 48,529
003 Alleghany County Public Schools 37,436 40,436 41,436
004 Amelia County Public Schools 38,000 40,271 41,000
005 Amherst County Public Schools 38,138 40,942 42,221
006 Appomattox County Public Schools 38,512 40,612 41,812
007 Arlington County Public Schools 48,228 53,173 58,662
008 Augusta County Public Schools 39,200 41,779 44,358
009 Bath County Public Schools 34,707 37,707 39,207
010 Bedford County Public Schools 37,627 39,508 41,390
011 Bland County Public Schools 33,015 34,454 35,202
012 Botetourt County Public Schools 38,350 41,350 42,850
013 Brunswick County Public Schools 36,404 39,082 41,759
014 Buchanan County Public Schools 30,500 32,800 33,800
015 Buckingham County Public Schools 39,957 41,999 41,999
016 Campbell County Public Schools 37,298 39,336 39,336
017 Caroline County Public Schools 38,166 39,916 40,966
018 Carroll County Public Schools 36,000 38,402 41,118
019 Charles City County Public Schools 37,300 39,018 39,860
020 Charlotte County Public Schools 38,500 40,612 40,612
021 Chesterfield County Public Schools 42,311 44,427 46,648
022 Clarke County Public Schools 39,135 45,698 45,698
023 Craig County Public Schools 31,794 33,294 34,794
024 Culpeper County Public Schools 38,749 40,749 43,249
025 Cumberland County Public Schools 37,225 39,225 40,725
026 Dickenson County Public Schools 33,283 34,719 36,155
027 Dinwiddie County Public Schools 40,126 42,027 43,083
028 Essex County Public Schools 38,805 40,805 40,805
029 Fairfax County Public Schools 46,756 52,530 56,164
030 Fauquier County Public Schools 42,315 44,431 45,489
031 Floyd County Public Schools 37,813 40,881 N/A
032 Fluvanna County Public Schools 42,000 46,200 46,300
033 Franklin County Public Schools 35,943 38,443 38,443
034 Frederick County Public Schools 41,060 44,028 46,228
035 Giles County Public Schools 34,190 36,190 37,190
036 Gloucester County Public Schools 39,108 43,068 47,027
Virginia Department of Education
Starting Teacher Salaries for School Year 2014-2015
The starting salary calculation includes licensed elementary and secondary classroom teachers
(regardless of fund source). Classroom teachers include: regular K-12 education teachers, art, music,
physical education, technology, remedial, gifted, mathematics, reading, special education, and ESL
teachers. Not included in the calculation are: teacher aides, guidance counselors or librarians.
FY 2015 Salary Survey - Starting Teacher Salaries
January 14, 2015
Page 23

Division Division Name
Bachelor's
Starting Salary
Master's
Starting Salary
Doctorate
Starting Salary
Virginia Department of Education
Starting Teacher Salaries for School Year 2014-2015
The starting salary calculation includes licensed elementary and secondary classroom teachers
(regardless of fund source). Classroom teachers include: regular K-12 education teachers, art, music,
physical education, technology, remedial, gifted, mathematics, reading, special education, and ESL
teachers. Not included in the calculation are: teacher aides, guidance counselors or librarians.
037 Goochland County Public Schools 42,378 44,285 45,133
038 Grayson County Public Schools 33,468 35,472 37,472
039 Greene County Public Schools 41,006 43,006 43,306
040 Greensville County Public Schools 39,114 41,214 41,739
041 Halifax County Public Schools 36,976 39,162 41,348
042 Hanover County Public Schools 42,462 45,010 46,284
043 Henrico County Public Schools 41,726 43,729 43,729
044 Henry County Public Schools 39,492 41,592 42,592
045 Highland County Public Schools 35,573 38,573 38,573
046 Isle of Wight County Public Schools 37,240 39,990 42,490
048 King George County Public Schools 37,087 39,683 41,683
049 King and Queen County Public Schools 37,525 39,625 40,285
050 King William County Public Schools 42,218 44,338 46,458
051 Lancaster County Public Schools 35,666 37,766 38,816
052 Lee County Public Schools 35,250 36,500 38,500
053 Loudoun County Public Schools 47,500 53,156 58,812
054 Louisa County Public Schools 42,004 44,270 45,092
055 Lunenburg County Public Schools 36,490 38,690 39,290
056 Madison County Public Schools 39,788 42,388 42,388
057 Mathews County Public Schools 38,502 41,002 43,002
058 Mecklenburg County Public Schools 35,193 37,593 39,193
059 Middlesex County Public Schools 37,655 39,655 40,655
060 Montgomery County Public Schools 37,011 39,111 40,161
062 Nelson County Public Schools 43,000 45,500 45,500
063 New Kent County Public Schools 37,149 39,699 40,969
065 Northampton County Public Schools 35,346 37,468 39,716
066 Northumberland County Public Schools 37,000 39,000 41,000
067 Nottoway County Public Schools 39,308 41,508 42,208
068 Orange County Public Schools 39,000 41,655 43,617
069 Page County Public Schools 38,705 41,670 44,577
070 Patrick County Public Schools 35,720 37,951 39,999
071 Pittsylvania County Public Schools 37,461 39,315 40,243
072 Powhatan County Public Schools 41,790 43,880 44,972
073 Prince Edward County Public Schools 38,052 40,212 41,860
074 Prince George County Public Schools 40,683 42,683 45,083
075 Prince William County Public Schools 45,998 51,516 54,758
FY 2015 Salary Survey - Starting Teacher Salaries
January 14, 2015
Page 24

Division Division Name
Bachelor's
Starting Salary
Master's
Starting Salary
Doctorate
Starting Salary
Virginia Department of Education
Starting Teacher Salaries for School Year 2014-2015
The starting salary calculation includes licensed elementary and secondary classroom teachers
(regardless of fund source). Classroom teachers include: regular K-12 education teachers, art, music,
physical education, technology, remedial, gifted, mathematics, reading, special education, and ESL
teachers. Not included in the calculation are: teacher aides, guidance counselors or librarians.
077 Pulaski County Public Schools 36,934 39,089 41,784
078 Rappahannock County Public Schools 40,542 41,485 41,485
079 Richmond County Public Schools 38,610 40,710 43,710
080 Roanoke County Public Schools 36,000 37,605 39,210
081 Rockbridge County Public Schools 37,639 39,954 41,439
082 Rockingham County Public Schools 41,300 43,785 45,310
083 Russell County Public Schools 31,000 33,000 35,000
084 Scott County Public Schools 37,285 39,340 39,340
085 Shenandoah County Public Schools 40,000 43,171 46,342
086 Smyth County Public Schools 31,500 34,140 36,991
087 Southampton County Public Schools 39,000 41,000 43,000
088 Spotsylvania County Public Schools 39,390 42,148 44,511
089 Stafford County Public Schools 37,793 41,940 43,312
090 Surry County Public Schools 44,270 46,770 47,270
091 Sussex County Public Schools 40,038 44,488 44,488
092 Tazewell County Public Schools 35,092 36,881 39,884
093 Warren County Public Schools 40,655 42,860 46,800
094 Washington County Public Schools 35,839 37,924 39,934
095 Westmoreland County Public Schools 36,566 39,716 39,716
096 Wise County Public Schools 34,000 37,000 38,000
097 Wythe County Public Schools 37,340 39,616 42,695
098 York County Public Schools 41,555 44,332 47,898
101 Alexandria City Public Schools 47,242 54,188 56,501
102 Bristol City Public Schools 34,673 36,673 37,173
103 Buena Vista City Public Schools 30,863 34,863 35,863
104 Charlottesville City Public Schools 44,160 46,276 48,391
106 Colonial Heights City Public Schools 40,215 41,715 42,465
107 Covington City Public Schools 37,530 40,530 N/A
108 Danville City Public Schools 35,585 38,210 39,785
109 Falls Church City Public Schools 48,500 54,000 57,500
110 Fredericksburg City Public Schools 41,000 43,750 45,550
111 Galax City Public Schools 37,404 40,664 41,204
112 Hampton City Public Schools 40,000 41,800 44,600
113 Harrisonburg City Public Schools 41,811 44,511 46,626
114 Hopewell City Public Schools 40,998 43,648 43,948
115 Lynchburg City Public Schools 38,000 41,260 43,044
FY 2015 Salary Survey - Starting Teacher Salaries
January 14, 2015
Page 25

Division Division Name
Bachelor's
Starting Salary
Master's
Starting Salary
Doctorate
Starting Salary
Virginia Department of Education
Starting Teacher Salaries for School Year 2014-2015
The starting salary calculation includes licensed elementary and secondary classroom teachers
(regardless of fund source). Classroom teachers include: regular K-12 education teachers, art, music,
physical education, technology, remedial, gifted, mathematics, reading, special education, and ESL
teachers. Not included in the calculation are: teacher aides, guidance counselors or librarians.
116 Martinsville City Public Schools 39,315 42,102 42,903
117 Newport News City Public Schools 40,500 43,335 46,422
118 Norfolk City Public Schools 41,724 45,055 49,110
119 Norton City Public Schools 32,620 34,670 36,120
120 Petersburg City Public Schools 41,426 42,626 43,326
121 Portsmouth City Public Schools 42,134 44,634 48,134
122 Radford City Public Schools 37,300 40,787 43,367
123 Richmond City Public Schools 43,836 46,028 49,531
124 Roanoke City Public Schools 39,037 41,169 43,306
126 Staunton City Public Schools 39,792 41,782 N/A
127 Suffolk City Public Schools 39,290 42,175 44,441
128 Virginia Beach City Public Schools 41,362 43,862 45,462
130 Waynesboro City Public Schools 39,232 41,875 43,990
131Williamsburg-James City County Public
Schools 40,301 41,929 45,806
132 Winchester City Public Schools 40,500 44,730 48,960
135 Franklin City Public Schools 38,934 40,934 42,434
136 Chesapeake City Public Schools 41,149 44,349 47,549
137 Lexington City Public Schools 38,210 41,777 41,777
139 Salem City Public Schools 42,000 45,720 47,514
142 Poquoson City Public Schools 38,540 41,265 43,990
143 Manassas City Public Schools 46,078 51,578 53,678
144 Manassas Park City Public Schools 44,490 50,490 57,490
202 Colonial Beach Public Schools 39,973 42,479 45,110
207 West Point Public Schools 43,471 45,471 N/A
FY 2015 Salary Survey - Starting Teacher Salaries
January 14, 2015
Page 26

Division Name
School
Number School Name
Average
2014-2015
Salary
001 Accomack County Public Schools 530 TANGIER COMBINED 46,525.00
001 Accomack County Public Schools 540 ARCADIA HIGH 47,583.00
001 Accomack County Public Schools 580 CHINCOTEAGUE HIGH 46,464.00
001 Accomack County Public Schools 590 PUNGOTEAGUE ELEM 42,027.00
001 Accomack County Public Schools 600 KEGOTANK ELEM 42,379.00
001 Accomack County Public Schools 70 NANDUA HIGH 45,668.00
001 Accomack County Public Schools 701 ACCAWMACKE ELEM 42,971.00
001 Accomack County Public Schools 702 METOMPKIN ELEM 41,418.00
001 Accomack County Public Schools 703 NANDUA MIDDLE 44,355.00
001 Accomack County Public Schools 704 ARCADIA MIDDLE 46,318.00
001 Accomack County Public Schools 80 CHINCOTEAGUE ELEM 47,072.00
002 Albemarle County Public Schools 10 HOLLYMEAD ELEM 55,256.00
002 Albemarle County Public Schools 100 BROADUS WOOD ELEM 54,036.00
002 Albemarle County Public Schools 1051 MORTIMER Y SUTHERLAND MIDDLE 55,484.00
002 Albemarle County Public Schools 1052 MONTICELLO HIGH 54,107.00
002 Albemarle County Public Schools 1053 BAKER-BUTLER ELEM 55,110.00
002 Albemarle County Public Schools 1060 ALBEMARLE COUNTY COMMUNITY PUBLIC CHARTER 50,601.00
002 Albemarle County Public Schools 140 WESTERN ALBEMARLE HIGH 57,719.00
002 Albemarle County Public Schools 150 PAUL H CALE ELEM 55,005.00
002 Albemarle County Public Schools 160 AGNOR-HURT ELEM 56,984.00
002 Albemarle County Public Schools 20 LESLIE H WALTON MIDDLE 54,140.00
002 Albemarle County Public Schools 240 STONY POINT ELEM 54,701.00
002 Albemarle County Public Schools 250 MERIWETHER LEWIS ELEM 57,881.00
002 Albemarle County Public Schools 30 SCOTTSVILLE ELEM 55,639.00
002 Albemarle County Public Schools 340 CROZET ELEM 54,031.00
002 Albemarle County Public Schools 40 MARY CARR GREER ELEM 54,573.00
002 Albemarle County Public Schools 540 RED HILL ELEM 57,003.00
002 Albemarle County Public Schools 69 JACKSON P BURLEY MIDDLE 54,597.00
002 Albemarle County Public Schools 880 ALBEMARLE HIGH 55,101.00
002 Albemarle County Public Schools 890 MURRAY HIGH 57,733.00
002 Albemarle County Public Schools 900 BENJAMIN F YANCEY ELEM 54,718.00
002 Albemarle County Public Schools 910 VIRGINIA L MURRAY ELEM 53,893.00
002 Albemarle County Public Schools 920 STONE ROBINSON ELEM 56,682.00
002 Albemarle County Public Schools 930 WOODBROOK ELEM 55,522.00
002 Albemarle County Public Schools 941 BROWNSVILLE ELEM 54,426.00
002 Albemarle County Public Schools 942 JOSEPH T HENLEY MIDDLE 56,354.00
002 Albemarle County Public Schools 950 JACK JOUETT MIDDLE 52,552.00
003 Alleghany County Public Schools 1040 CLIFTON MIDDLE 45,214.00
003 Alleghany County Public Schools 1041 MT VIEW ELEM 46,140.00
003 Alleghany County Public Schools 110 CALLAGHAN ELEM 46,853.00
003 Alleghany County Public Schools 310 ALLEGHANY HIGH 44,317.00
003 Alleghany County Public Schools 90 SHARON ELEM 47,275.00
004 Amelia County Public Schools 10 AMELIA COUNTY HIGH 46,553.82
004 Amelia County Public Schools 210 AMELIA COUNTY MIDDLE 44,425.30
004 Amelia County Public Schools 220 AMELIA COUNTY ELEM 46,536.78
005 Amherst County Public Schools 20 MONELISON MIDDLE 45,964.00
005 Amherst County Public Schools 240 PLEASANT VIEW ELEM 43,495.00
005 Amherst County Public Schools 500 MADISON HEIGHTS ELEM 42,945.00
005 Amherst County Public Schools 670 AMHERST MIDDLE 42,206.00
005 Amherst County Public Schools 740 TEMPERANCE ELEM 41,951.00
005 Amherst County Public Schools 750 AMHERST COUNTY HIGH 44,077.00
005 Amherst County Public Schools 760 ELON ELEM 43,796.00
005 Amherst County Public Schools 770 CENTRAL ELEM 44,380.00
Virginia Department of Education
Average Teacher Salaries by School for School Year 2014-2015
The average salary calculation includes licensed elementary and secondary classroom teachers (regardless of fund source). Classroom teachers
include: regular K-12 education teachers, art, music, physical education, technology, remedial, gifted, mathematics, reading, special education, and ESL
teachers. Not included in the calculation are: teacher aides, guidance counselors or librarians.
To calculate each school’s average salary, the salaries of each teacher who works in the school were summed and divided by the FTE total of all
teachers (full-time and part-time) in the school.
FY 2015 Salary Survey - Avg Teacher Salary by School
January 14, 2015
Page 27

Division Name
School
Number School Name
Average
2014-2015
Salary
Virginia Department of Education
Average Teacher Salaries by School for School Year 2014-2015
The average salary calculation includes licensed elementary and secondary classroom teachers (regardless of fund source). Classroom teachers
include: regular K-12 education teachers, art, music, physical education, technology, remedial, gifted, mathematics, reading, special education, and ESL
teachers. Not included in the calculation are: teacher aides, guidance counselors or librarians.
To calculate each school’s average salary, the salaries of each teacher who works in the school were summed and divided by the FTE total of all
teachers (full-time and part-time) in the school.
005 Amherst County Public Schools 780 AMELON ELEM 43,645.00
005 Amherst County Public Schools 790 AMHERST ELEM 44,358.00
006 Appomattox County Public Schools 110 APPOMATTOX ELEM 43,442.00
006 Appomattox County Public Schools 160 APPOMATTOX MIDDLE 42,363.00
006 Appomattox County Public Schools 250 APPOMATTOX PRIMARY 42,076.00
006 Appomattox County Public Schools 260 APPOMATTOX COUNTY HIGH 42,615.00
007 Arlington County Public Schools 100 GLEBE ELEM 74,962.77
007 Arlington County Public Schools 111 FRANCIS SCOTT KEY ELEM 76,845.90
007 Arlington County Public Schools 150 BARCROFT ELEM 74,178.88
007 Arlington County Public Schools 160 HENRY ELEM 70,439.25
007 Arlington County Public Schools 180 JEFFERSON MIDDLE 76,404.82
007 Arlington County Public Schools 200 DREW MODEL ELEM 75,393.36
007 Arlington County Public Schools 211 TUCKAHOE ELEM 71,847.54
007 Arlington County Public Schools 240 SWANSON MIDDLE 74,324.65
007 Arlington County Public Schools 250 BARRETT ELEM 74,853.37
007 Arlington County Public Schools 330 YORKTOWN HIGH 82,824.19
007 Arlington County Public Schools 350 ABINGDON ELEM 79,203.19
007 Arlington County Public Schools 360 OAKRIDGE ELEM 71,422.87
007 Arlington County Public Schools 380 MCKINLEY ELEM 71,370.52
007 Arlington County Public Schools 410 NOTTINGHAM ELEM 76,095.32
007 Arlington County Public Schools 420 TAYLOR ELEM 75,662.87
007 Arlington County Public Schools 440 JAMESTOWN ELEM 72,667.50
007 Arlington County Public Schools 450 WAKEFIELD HIGH 80,881.84
007 Arlington County Public Schools 460 LONG BRANCH ELEM 73,711.02
007 Arlington County Public Schools 470 ARLINGTON TRADITIONAL 79,750.13
007 Arlington County Public Schools 480 WILLIAMSBURG MIDDLE 78,623.23
007 Arlington County Public Schools 490 ASHLAWN ELEM 77,783.66
007 Arlington County Public Schools 500 KENMORE MIDDLE 82,898.18
007 Arlington County Public Schools 510 RANDOLPH ELEM 76,995.69
007 Arlington County Public Schools 611 GUNSTON MIDDLE 76,957.77
007 Arlington County Public Schools 613 ARLINGTON SCIENCE FOCUS 71,281.14
007 Arlington County Public Schools 614 HOFFMAN-BOSTON ELEM 73,292.61
007 Arlington County Public Schools 615 CAMPBELL ELEM 75,128.68
007 Arlington County Public Schools 618 ARLINGTON MILL HIGH 91,948.38
007 Arlington County Public Schools 622 CLAREMONT IMMERSION 71,828.51
007 Arlington County Public Schools 80 WASHINGTON LEE HIGH 76,861.97
007 Arlington County Public Schools 90 CARLIN SPRINGS ELEM 74,870.44
008 Augusta County Public Schools 140 CHURCHVILLE ELEM 45,198.00
008 Augusta County Public Schools 210 BEVERLEY MANOR ELEM 47,074.00
008 Augusta County Public Schools 212 BEVERLEY MANOR MIDDLE 44,447.00
008 Augusta County Public Schools 30 CASSELL ELEM 45,424.00
008 Augusta County Public Schools 370 CRAIGSVILLE ELEM 43,740.00
008 Augusta County Public Schools 40 NORTH RIVER ELEM 44,812.00
008 Augusta County Public Schools 440 STUARTS DRAFT ELEM 45,153.00
008 Augusta County Public Schools 60 STUARTS DRAFT MIDDLE 48,380.00
008 Augusta County Public Schools 640 WILSON ELEM 44,788.00
008 Augusta County Public Schools 660 BUFFALO GAP HIGH 46,273.00
008 Augusta County Public Schools 670 FT DEFIANCE HIGH 49,536.00
008 Augusta County Public Schools 680 RIVERHEADS HIGH 47,216.00
008 Augusta County Public Schools 710 VERONA ELEM 47,364.00
008 Augusta County Public Schools 720 WILSON MEMORIAL HIGH 45,816.00
008 Augusta County Public Schools 730 STUARTS DRAFT HIGH 46,471.00
008 Augusta County Public Schools 740 RIVERHEADS ELEM 45,770.00
FY 2015 Salary Survey - Avg Teacher Salary by School
January 14, 2015
Page 28
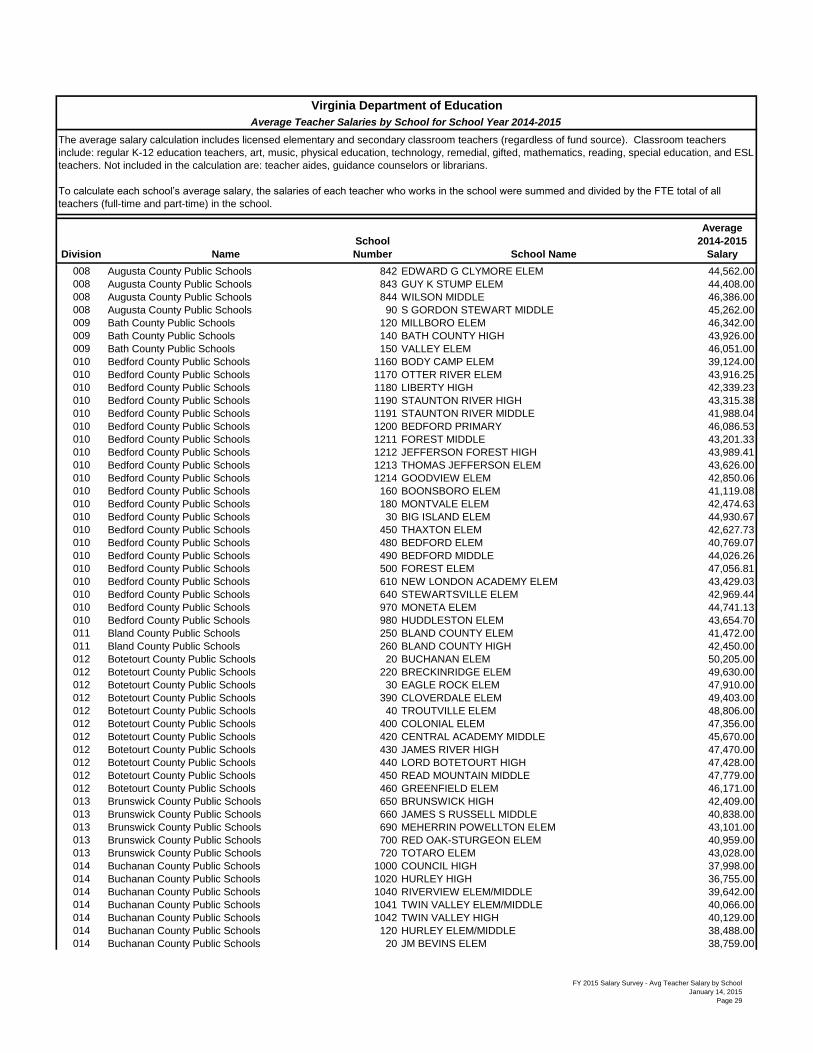
Division Name
School
Number School Name
Average
2014-2015
Salary
Virginia Department of Education
Average Teacher Salaries by School for School Year 2014-2015
The average salary calculation includes licensed elementary and secondary classroom teachers (regardless of fund source). Classroom teachers
include: regular K-12 education teachers, art, music, physical education, technology, remedial, gifted, mathematics, reading, special education, and ESL
teachers. Not included in the calculation are: teacher aides, guidance counselors or librarians.
To calculate each school’s average salary, the salaries of each teacher who works in the school were summed and divided by the FTE total of all
teachers (full-time and part-time) in the school.
008 Augusta County Public Schools 842 EDWARD G CLYMORE ELEM 44,562.00
008 Augusta County Public Schools 843 GUY K STUMP ELEM 44,408.00
008 Augusta County Public Schools 844 WILSON MIDDLE 46,386.00
008 Augusta County Public Schools 90 S GORDON STEWART MIDDLE 45,262.00
009 Bath County Public Schools 120 MILLBORO ELEM 46,342.00
009 Bath County Public Schools 140 BATH COUNTY HIGH 43,926.00
009 Bath County Public Schools 150 VALLEY ELEM 46,051.00
010 Bedford County Public Schools 1160 BODY CAMP ELEM 39,124.00
010 Bedford County Public Schools 1170 OTTER RIVER ELEM 43,916.25
010 Bedford County Public Schools 1180 LIBERTY HIGH 42,339.23
010 Bedford County Public Schools 1190 STAUNTON RIVER HIGH 43,315.38
010 Bedford County Public Schools 1191 STAUNTON RIVER MIDDLE 41,988.04
010 Bedford County Public Schools 1200 BEDFORD PRIMARY 46,086.53
010 Bedford County Public Schools 1211 FOREST MIDDLE 43,201.33
010 Bedford County Public Schools 1212 JEFFERSON FOREST HIGH 43,989.41
010 Bedford County Public Schools 1213 THOMAS JEFFERSON ELEM 43,626.00
010 Bedford County Public Schools 1214 GOODVIEW ELEM 42,850.06
010 Bedford County Public Schools 160 BOONSBORO ELEM 41,119.08
010 Bedford County Public Schools 180 MONTVALE ELEM 42,474.63
010 Bedford County Public Schools 30 BIG ISLAND ELEM 44,930.67
010 Bedford County Public Schools 450 THAXTON ELEM 42,627.73
010 Bedford County Public Schools 480 BEDFORD ELEM 40,769.07
010 Bedford County Public Schools 490 BEDFORD MIDDLE 44,026.26
010 Bedford County Public Schools 500 FOREST ELEM 47,056.81
010 Bedford County Public Schools 610 NEW LONDON ACADEMY ELEM 43,429.03
010 Bedford County Public Schools 640 STEWARTSVILLE ELEM 42,969.44
010 Bedford County Public Schools 970 MONETA ELEM 44,741.13
010 Bedford County Public Schools 980 HUDDLESTON ELEM 43,654.70
011 Bland County Public Schools 250 BLAND COUNTY ELEM 41,472.00
011 Bland County Public Schools 260 BLAND COUNTY HIGH 42,450.00
012 Botetourt County Public Schools 20 BUCHANAN ELEM 50,205.00
012 Botetourt County Public Schools 220 BRECKINRIDGE ELEM 49,630.00
012 Botetourt County Public Schools 30 EAGLE ROCK ELEM 47,910.00
012 Botetourt County Public Schools 390 CLOVERDALE ELEM 49,403.00
012 Botetourt County Public Schools 40 TROUTVILLE ELEM 48,806.00
012 Botetourt County Public Schools 400 COLONIAL ELEM 47,356.00
012 Botetourt County Public Schools 420 CENTRAL ACADEMY MIDDLE 45,670.00
012 Botetourt County Public Schools 430 JAMES RIVER HIGH 47,470.00
012 Botetourt County Public Schools 440 LORD BOTETOURT HIGH 47,428.00
012 Botetourt County Public Schools 450 READ MOUNTAIN MIDDLE 47,779.00
012 Botetourt County Public Schools 460 GREENFIELD ELEM 46,171.00
013 Brunswick County Public Schools 650 BRUNSWICK HIGH 42,409.00
013 Brunswick County Public Schools 660 JAMES S RUSSELL MIDDLE 40,838.00
013 Brunswick County Public Schools 690 MEHERRIN POWELLTON ELEM 43,101.00
013 Brunswick County Public Schools 700 RED OAK-STURGEON ELEM 40,959.00
013 Brunswick County Public Schools 720 TOTARO ELEM 43,028.00
014 Buchanan County Public Schools 1000 COUNCIL HIGH 37,998.00
014 Buchanan County Public Schools 1020 HURLEY HIGH 36,755.00
014 Buchanan County Public Schools 1040 RIVERVIEW ELEM/MIDDLE 39,642.00
014 Buchanan County Public Schools 1041 TWIN VALLEY ELEM/MIDDLE 40,066.00
014 Buchanan County Public Schools 1042 TWIN VALLEY HIGH 40,129.00
014 Buchanan County Public Schools 120 HURLEY ELEM/MIDDLE 38,488.00
014 Buchanan County Public Schools 20 JM BEVINS ELEM 38,759.00
FY 2015 Salary Survey - Avg Teacher Salary by School
January 14, 2015
Page 29

Division Name
School
Number School Name
Average
2014-2015
Salary
Virginia Department of Education
Average Teacher Salaries by School for School Year 2014-2015
The average salary calculation includes licensed elementary and secondary classroom teachers (regardless of fund source). Classroom teachers
include: regular K-12 education teachers, art, music, physical education, technology, remedial, gifted, mathematics, reading, special education, and ESL
teachers. Not included in the calculation are: teacher aides, guidance counselors or librarians.
To calculate each school’s average salary, the salaries of each teacher who works in the school were summed and divided by the FTE total of all
teachers (full-time and part-time) in the school.
014 Buchanan County Public Schools 90 COUNCIL ELEM/MIDDLE 36,028.00
014 Buchanan County Public Schools 990 GRUNDY HIGH 42,724.00
015 Buckingham County Public Schools 20 BUCKINGHAM CO PRE SCH CTR 44,807.00
015 Buckingham County Public Schools 700 BUCKINGHAM COUNTY HIGH 48,321.00
015 Buckingham County Public Schools 721 BUCKINGHAM CO. MIDDLE 45,956.00
015 Buckingham County Public Schools 723 BUCKINGHAM CO PRIMARY 43,959.00
015 Buckingham County Public Schools 724 BUCKINGHAM CO ELEM 46,901.00
016 Campbell County Public Schools 130 CONCORD ELEM 42,533.45
016 Campbell County Public Schools 20 BROOKVILLE MIDDLE 44,277.78
016 Campbell County Public Schools 200 ALTAVISTA HIGH 44,177.82
016 Campbell County Public Schools 211 RUSTBURG MIDDLE 42,988.48
016 Campbell County Public Schools 222 RUSTBURG HIGH 43,277.89
016 Campbell County Public Schools 542 WILLIAM CAMPBELL HIGH 43,414.34
016 Campbell County Public Schools 560 ALTAVISTA ELEM 45,396.89
016 Campbell County Public Schools 60 TOMAHAWK ELEM 43,530.88
016 Campbell County Public Schools 650 BROOKNEAL ELEM 42,664.70
016 Campbell County Public Schools 690 LEESVILLE ROAD ELEM 42,421.14
016 Campbell County Public Schools 710 YELLOW BRANCH ELEM 44,172.51
016 Campbell County Public Schools 720 BROOKVILLE HIGH 43,946.92
016 Campbell County Public Schools 821 RUSTBURG ELEM 44,243.74
017 Caroline County Public Schools 450 CAROLINE MIDDLE 43,954.36
017 Caroline County Public Schools 460 CAROLINE HIGH 45,426.56
017 Caroline County Public Schools 620 BOWLING GREEN ELEM 46,152.62
017 Caroline County Public Schools 630 MADISON ELEM 45,326.78
017 Caroline County Public Schools 9020 LEWIS & CLARK ELEM 46,050.65
018 Carroll County Public Schools 1110 ST PAUL 44,022.10
018 Carroll County Public Schools 1130 OAKLAND ELEM 43,744.61
018 Carroll County Public Schools 1150 GLADESBORO ELEM 43,095.84
018 Carroll County Public Schools 1160 LAUREL ELEM 43,386.10
018 Carroll County Public Schools 1170 HILLSVILLE ELEM 43,148.56
018 Carroll County Public Schools 1180 FANCY GAP ELEM 46,088.77
018 Carroll County Public Schools 1210 GLADEVILLE ELEM 42,728.04
018 Carroll County Public Schools 1230 CARROLL COUNTY HIGH 45,491.92
018 Carroll County Public Schools 450 CARROLL COUNTY MIDDLE 44,520.99
019 Charles City County Public Schools 100 CHARLES CITY CO HIGH 44,074.02
019 Charles City County Public Schools 110 CHARLES CITY CO MIDDLE 41,537.67
019 Charles City County Public Schools 80 CHARLES CITY CO ELEM 42,421.35
020 Charlotte County Public Schools 100 EUREKA ELEM 44,749.00
020 Charlotte County Public Schools 210 CENTRAL MIDDLE 43,158.00
020 Charlotte County Public Schools 450 PHENIX ELEM 43,929.00
020 Charlotte County Public Schools 460 RANDOLPH-HENRY HIGH 44,915.00
020 Charlotte County Public Schools 470 BACON DISTRICT ELEM 42,334.00
021 Chesterfield County Public Schools 10 LLOYD C BIRD HIGH 49,727.89
021 Chesterfield County Public Schools 110 MATOACA MIDDLE 48,404.50
021 Chesterfield County Public Schools 130 BEULAH ELEM 50,680.23
021 Chesterfield County Public Schools 150 CLOVER HILL ELEM 49,268.00
021 Chesterfield County Public Schools 180 GRANGE HALL ELEM 47,708.91
021 Chesterfield County Public Schools 20 BON AIR ELEM 48,829.89
021 Chesterfield County Public Schools 270 SWIFT CREEK MIDDLE 47,127.32
021 Chesterfield County Public Schools 280 MONACAN HIGH 50,328.49
021 Chesterfield County Public Schools 290 W W GORDON ELEM 50,821.87
021 Chesterfield County Public Schools 30 CHESTERFIELD COMMUNITY HIGH 46,582.09
021 Chesterfield County Public Schools 300 EVERGREEN ELEM 48,845.05
FY 2015 Salary Survey - Avg Teacher Salary by School
January 14, 2015
Page 30
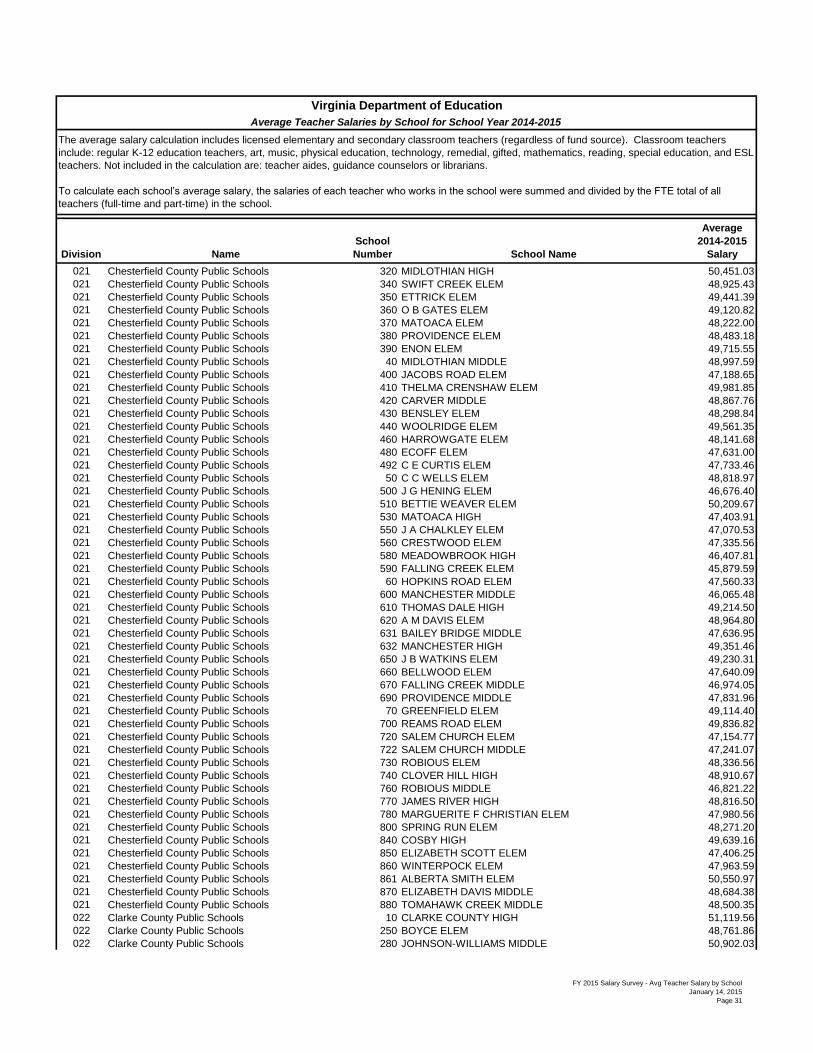
Division Name
School
Number School Name
Average
2014-2015
Salary
Virginia Department of Education
Average Teacher Salaries by School for School Year 2014-2015
The average salary calculation includes licensed elementary and secondary classroom teachers (regardless of fund source). Classroom teachers
include: regular K-12 education teachers, art, music, physical education, technology, remedial, gifted, mathematics, reading, special education, and ESL
teachers. Not included in the calculation are: teacher aides, guidance counselors or librarians.
To calculate each school’s average salary, the salaries of each teacher who works in the school were summed and divided by the FTE total of all
teachers (full-time and part-time) in the school.
021 Chesterfield County Public Schools 320 MIDLOTHIAN HIGH 50,451.03
021 Chesterfield County Public Schools 340 SWIFT CREEK ELEM 48,925.43
021 Chesterfield County Public Schools 350 ETTRICK ELEM 49,441.39
021 Chesterfield County Public Schools 360 O B GATES ELEM 49,120.82
021 Chesterfield County Public Schools 370 MATOACA ELEM 48,222.00
021 Chesterfield County Public Schools 380 PROVIDENCE ELEM 48,483.18
021 Chesterfield County Public Schools 390 ENON ELEM 49,715.55
021 Chesterfield County Public Schools 40 MIDLOTHIAN MIDDLE 48,997.59
021 Chesterfield County Public Schools 400 JACOBS ROAD ELEM 47,188.65
021 Chesterfield County Public Schools 410 THELMA CRENSHAW ELEM 49,981.85
021 Chesterfield County Public Schools 420 CARVER MIDDLE 48,867.76
021 Chesterfield County Public Schools 430 BENSLEY ELEM 48,298.84
021 Chesterfield County Public Schools 440 WOOLRIDGE ELEM 49,561.35
021 Chesterfield County Public Schools 460 HARROWGATE ELEM 48,141.68
021 Chesterfield County Public Schools 480 ECOFF ELEM 47,631.00
021 Chesterfield County Public Schools 492 C E CURTIS ELEM 47,733.46
021 Chesterfield County Public Schools 50 C C WELLS ELEM 48,818.97
021 Chesterfield County Public Schools 500 J G HENING ELEM 46,676.40
021 Chesterfield County Public Schools 510 BETTIE WEAVER ELEM 50,209.67
021 Chesterfield County Public Schools 530 MATOACA HIGH 47,403.91
021 Chesterfield County Public Schools 550 J A CHALKLEY ELEM 47,070.53
021 Chesterfield County Public Schools 560 CRESTWOOD ELEM 47,335.56
021 Chesterfield County Public Schools 580 MEADOWBROOK HIGH 46,407.81
021 Chesterfield County Public Schools 590 FALLING CREEK ELEM 45,879.59
021 Chesterfield County Public Schools 60 HOPKINS ROAD ELEM 47,560.33
021 Chesterfield County Public Schools 600 MANCHESTER MIDDLE 46,065.48
021 Chesterfield County Public Schools 610 THOMAS DALE HIGH 49,214.50
021 Chesterfield County Public Schools 620 A M DAVIS ELEM 48,964.80
021 Chesterfield County Public Schools 631 BAILEY BRIDGE MIDDLE 47,636.95
021 Chesterfield County Public Schools 632 MANCHESTER HIGH 49,351.46
021 Chesterfield County Public Schools 650 J B WATKINS ELEM 49,230.31
021 Chesterfield County Public Schools 660 BELLWOOD ELEM 47,640.09
021 Chesterfield County Public Schools 670 FALLING CREEK MIDDLE 46,974.05
021 Chesterfield County Public Schools 690 PROVIDENCE MIDDLE 47,831.96
021 Chesterfield County Public Schools 70 GREENFIELD ELEM 49,114.40
021 Chesterfield County Public Schools 700 REAMS ROAD ELEM 49,836.82
021 Chesterfield County Public Schools 720 SALEM CHURCH ELEM 47,154.77
021 Chesterfield County Public Schools 722 SALEM CHURCH MIDDLE 47,241.07
021 Chesterfield County Public Schools 730 ROBIOUS ELEM 48,336.56
021 Chesterfield County Public Schools 740 CLOVER HILL HIGH 48,910.67
021 Chesterfield County Public Schools 760 ROBIOUS MIDDLE 46,821.22
021 Chesterfield County Public Schools 770 JAMES RIVER HIGH 48,816.50
021 Chesterfield County Public Schools 780 MARGUERITE F CHRISTIAN ELEM 47,980.56
021 Chesterfield County Public Schools 800 SPRING RUN ELEM 48,271.20
021 Chesterfield County Public Schools 840 COSBY HIGH 49,639.16
021 Chesterfield County Public Schools 850 ELIZABETH SCOTT ELEM 47,406.25
021 Chesterfield County Public Schools 860 WINTERPOCK ELEM 47,963.59
021 Chesterfield County Public Schools 861 ALBERTA SMITH ELEM 50,550.97
021 Chesterfield County Public Schools 870 ELIZABETH DAVIS MIDDLE 48,684.38
021 Chesterfield County Public Schools 880 TOMAHAWK CREEK MIDDLE 48,500.35
022 Clarke County Public Schools 10 CLARKE COUNTY HIGH 51,119.56
022 Clarke County Public Schools 250 BOYCE ELEM 48,761.86
022 Clarke County Public Schools 280 JOHNSON-WILLIAMS MIDDLE 50,902.03
FY 2015 Salary Survey - Avg Teacher Salary by School
January 14, 2015
Page 31
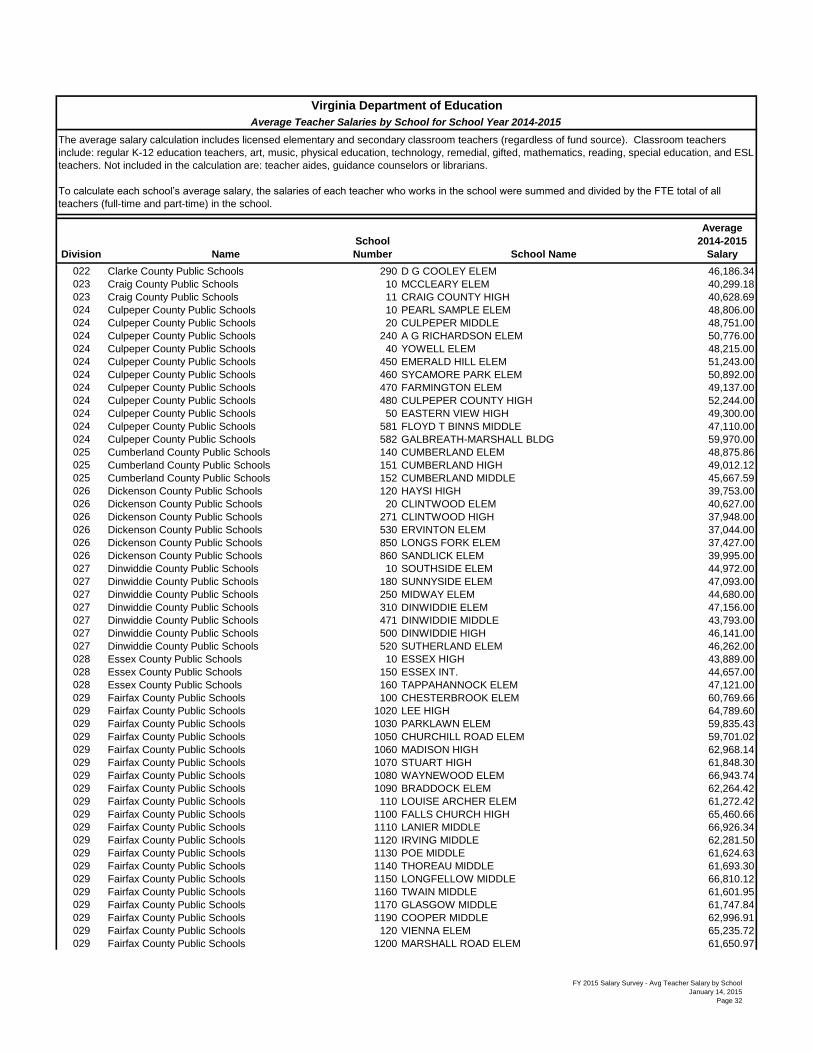
Division Name
School
Number School Name
Average
2014-2015
Salary
Virginia Department of Education
Average Teacher Salaries by School for School Year 2014-2015
The average salary calculation includes licensed elementary and secondary classroom teachers (regardless of fund source). Classroom teachers
include: regular K-12 education teachers, art, music, physical education, technology, remedial, gifted, mathematics, reading, special education, and ESL
teachers. Not included in the calculation are: teacher aides, guidance counselors or librarians.
To calculate each school’s average salary, the salaries of each teacher who works in the school were summed and divided by the FTE total of all
teachers (full-time and part-time) in the school.
022 Clarke County Public Schools 290 D G COOLEY ELEM 46,186.34
023 Craig County Public Schools 10 MCCLEARY ELEM 40,299.18
023 Craig County Public Schools 11 CRAIG COUNTY HIGH 40,628.69
024 Culpeper County Public Schools 10 PEARL SAMPLE ELEM 48,806.00
024 Culpeper County Public Schools 20 CULPEPER MIDDLE 48,751.00
024 Culpeper County Public Schools 240 A G RICHARDSON ELEM 50,776.00
024 Culpeper County Public Schools 40 YOWELL ELEM 48,215.00
024 Culpeper County Public Schools 450 EMERALD HILL ELEM 51,243.00
024 Culpeper County Public Schools 460 SYCAMORE PARK ELEM 50,892.00
024 Culpeper County Public Schools 470 FARMINGTON ELEM 49,137.00
024 Culpeper County Public Schools 480 CULPEPER COUNTY HIGH 52,244.00
024 Culpeper County Public Schools 50 EASTERN VIEW HIGH 49,300.00
024 Culpeper County Public Schools 581 FLOYD T BINNS MIDDLE 47,110.00
024 Culpeper County Public Schools 582 GALBREATH-MARSHALL BLDG 59,970.00
025 Cumberland County Public Schools 140 CUMBERLAND ELEM 48,875.86
025 Cumberland County Public Schools 151 CUMBERLAND HIGH 49,012.12
025 Cumberland County Public Schools 152 CUMBERLAND MIDDLE 45,667.59
026 Dickenson County Public Schools 120 HAYSI HIGH 39,753.00
026 Dickenson County Public Schools 20 CLINTWOOD ELEM 40,627.00
026 Dickenson County Public Schools 271 CLINTWOOD HIGH 37,948.00
026 Dickenson County Public Schools 530 ERVINTON ELEM 37,044.00
026 Dickenson County Public Schools 850 LONGS FORK ELEM 37,427.00
026 Dickenson County Public Schools 860 SANDLICK ELEM 39,995.00
027 Dinwiddie County Public Schools 10 SOUTHSIDE ELEM 44,972.00
027 Dinwiddie County Public Schools 180 SUNNYSIDE ELEM 47,093.00
027 Dinwiddie County Public Schools 250 MIDWAY ELEM 44,680.00
027 Dinwiddie County Public Schools 310 DINWIDDIE ELEM 47,156.00
027 Dinwiddie County Public Schools 471 DINWIDDIE MIDDLE 43,793.00
027 Dinwiddie County Public Schools 500 DINWIDDIE HIGH 46,141.00
027 Dinwiddie County Public Schools 520 SUTHERLAND ELEM 46,262.00
028 Essex County Public Schools 10 ESSEX HIGH 43,889.00
028 Essex County Public Schools 150 ESSEX INT. 44,657.00
028 Essex County Public Schools 160 TAPPAHANNOCK ELEM 47,121.00
029 Fairfax County Public Schools 100 CHESTERBROOK ELEM 60,769.66
029 Fairfax County Public Schools 1020 LEE HIGH 64,789.60
029 Fairfax County Public Schools 1030 PARKLAWN ELEM 59,835.43
029 Fairfax County Public Schools 1050 CHURCHILL ROAD ELEM 59,701.02
029 Fairfax County Public Schools 1060 MADISON HIGH 62,968.14
029 Fairfax County Public Schools 1070 STUART HIGH 61,848.30
029 Fairfax County Public Schools 1080 WAYNEWOOD ELEM 66,943.74
029 Fairfax County Public Schools 1090 BRADDOCK ELEM 62,264.42
029 Fairfax County Public Schools 110 LOUISE ARCHER ELEM 61,272.42
029 Fairfax County Public Schools 1100 FALLS CHURCH HIGH 65,460.66
029 Fairfax County Public Schools 1110 LANIER MIDDLE 66,926.34
029 Fairfax County Public Schools 1120 IRVING MIDDLE 62,281.50
029 Fairfax County Public Schools 1130 POE MIDDLE 61,624.63
029 Fairfax County Public Schools 1140 THOREAU MIDDLE 61,693.30
029 Fairfax County Public Schools 1150 LONGFELLOW MIDDLE 66,810.12
029 Fairfax County Public Schools 1160 TWAIN MIDDLE 61,601.95
029 Fairfax County Public Schools 1170 GLASGOW MIDDLE 61,747.84
029 Fairfax County Public Schools 1190 COOPER MIDDLE 62,996.91
029 Fairfax County Public Schools 120 VIENNA ELEM 65,235.72
029 Fairfax County Public Schools 1200 MARSHALL ROAD ELEM 61,650.97
FY 2015 Salary Survey - Avg Teacher Salary by School
January 14, 2015
Page 32

Division Name
School
Number School Name
Average
2014-2015
Salary
Virginia Department of Education
Average Teacher Salaries by School for School Year 2014-2015
The average salary calculation includes licensed elementary and secondary classroom teachers (regardless of fund source). Classroom teachers
include: regular K-12 education teachers, art, music, physical education, technology, remedial, gifted, mathematics, reading, special education, and ESL
teachers. Not included in the calculation are: teacher aides, guidance counselors or librarians.
To calculate each school’s average salary, the salaries of each teacher who works in the school were summed and divided by the FTE total of all
teachers (full-time and part-time) in the school.
029 Fairfax County Public Schools 1210 MANTUA ELEM 64,737.90
029 Fairfax County Public Schools 1240 KEENE MILL ELEM 62,542.48
029 Fairfax County Public Schools 1250 HERNDON ELEM 63,300.24
029 Fairfax County Public Schools 1260 WOODSON HIGH 67,412.91
029 Fairfax County Public Schools 1270 EDISON HIGH 66,833.91
029 Fairfax County Public Schools 1290 MARSHALL HIGH 62,815.75
029 Fairfax County Public Schools 1300 SANDBURG MIDDLE 61,196.53
029 Fairfax County Public Schools 131 CHANTILLY HIGH 68,636.49
029 Fairfax County Public Schools 1310 RAVENSWORTH ELEM 69,831.10
029 Fairfax County Public Schools 1320 WASHINGTON MILL ELEM 63,783.01
029 Fairfax County Public Schools 1330 HOLLIN MEADOWS ELEM 62,969.27
029 Fairfax County Public Schools 1350 STRATFORD LANDING ELEM 62,459.72
029 Fairfax County Public Schools 1360 ANNANDALE TERRACE ELEM 62,820.15
029 Fairfax County Public Schools 1371 THOMAS JEFFERSON HIGH 78,098.97
029 Fairfax County Public Schools 1380 STENWOOD ELEM 60,250.03
029 Fairfax County Public Schools 1390 MOSBY WOODS ELEM 59,060.74
029 Fairfax County Public Schools 140 OAKTON ELEM 62,511.29
029 Fairfax County Public Schools 1400 LITTLE RUN ELEM 61,103.07
029 Fairfax County Public Schools 1410 FROST MIDDLE 62,465.50
029 Fairfax County Public Schools 1420 HYBLA VALLEY ELEM 60,072.04
029 Fairfax County Public Schools 1430 WEST SPRINGFIELD ELEM 66,027.40
029 Fairfax County Public Schools 1440 KINGS PARK ELEM 62,736.40
029 Fairfax County Public Schools 1450 FORESTDALE ELEM 62,655.76
029 Fairfax County Public Schools 1460 LANGLEY HIGH 66,280.12
029 Fairfax County Public Schools 1480 FAIRFAX VILLA ELEM 63,769.30
029 Fairfax County Public Schools 150 ORANGE HUNT ELEM 65,758.13
029 Fairfax County Public Schools 1500 GREENBRIAR WEST ELEM 62,258.95
029 Fairfax County Public Schools 1510 COLUMBIA ELEM 59,283.63
029 Fairfax County Public Schools 1521 HOLMES MIDDLE 61,188.99
029 Fairfax County Public Schools 1530 ARMSTRONG ELEM 62,899.92
029 Fairfax County Public Schools 1540 UNION MILL ELEM 60,297.48
029 Fairfax County Public Schools 1550 WHITMAN MIDDLE 66,756.32
029 Fairfax County Public Schools 1570 LAKE ANNE ELEM 64,697.63
029 Fairfax County Public Schools 1580 WESTBRIAR ELEM 60,215.98
029 Fairfax County Public Schools 1590 CANTERBURY WOODS ELEM 59,834.67
029 Fairfax County Public Schools 1600 CUB RUN ELEM 64,592.10
029 Fairfax County Public Schools 1610 WEST SPRINGFIELD HIGH 66,604.80
029 Fairfax County Public Schools 1620 SPRING HILL ELEM 67,588.18
029 Fairfax County Public Schools 1630 FAIRHILL ELEM 58,635.52
029 Fairfax County Public Schools 1640 MOUNT VERNON WOODS ELEM 61,412.29
029 Fairfax County Public Schools 1650 OLDE CREEK ELEM 61,479.65
029 Fairfax County Public Schools 1660 SHREVEWOOD ELEM 59,670.16
029 Fairfax County Public Schools 1670 WESTGATE ELEM 58,654.32
029 Fairfax County Public Schools 1680 SILVERBROOK ELEM 60,896.50
029 Fairfax County Public Schools 1690 CARDINAL FOREST ELEM 59,219.55
029 Fairfax County Public Schools 170 TERRA CENTRE ELEM 66,222.60
029 Fairfax County Public Schools 1700 CUNNINGHAM PARK ELEM 60,456.26
029 Fairfax County Public Schools 1710 OAKTON HIGH 62,230.29
029 Fairfax County Public Schools 1730 BEECH TREE ELEM 61,092.27
029 Fairfax County Public Schools 1740 HAYFIELD ELEM 66,329.47
029 Fairfax County Public Schools 1760 KILMER MIDDLE 64,826.51
029 Fairfax County Public Schools 1761 KILMER CENTER 68,677.43
029 Fairfax County Public Schools 1770 ROLLING VALLEY ELEM 61,516.22
FY 2015 Salary Survey - Avg Teacher Salary by School
January 14, 2015
Page 33

Division Name
School
Number School Name
Average
2014-2015
Salary
Virginia Department of Education
Average Teacher Salaries by School for School Year 2014-2015
The average salary calculation includes licensed elementary and secondary classroom teachers (regardless of fund source). Classroom teachers
include: regular K-12 education teachers, art, music, physical education, technology, remedial, gifted, mathematics, reading, special education, and ESL
teachers. Not included in the calculation are: teacher aides, guidance counselors or librarians.
To calculate each school’s average salary, the salaries of each teacher who works in the school were summed and divided by the FTE total of all
teachers (full-time and part-time) in the school.
029 Fairfax County Public Schools 1790 BROOKFIELD ELEM 64,959.03
029 Fairfax County Public Schools 1800 HAYFIELD SECONDARY 66,747.55
029 Fairfax County Public Schools 1810 WOLFTRAP ELEM 63,756.48
029 Fairfax County Public Schools 1820 RIVERSIDE ELEM 58,549.23
029 Fairfax County Public Schools 1830 LONDON TOWNE ELEM 60,283.73
029 Fairfax County Public Schools 1840 GREENBRIAR EAST ELEM 62,541.37
029 Fairfax County Public Schools 1850 LEES CORNER ELEM 66,476.64
029 Fairfax County Public Schools 1860 OAK VIEW ELEM 64,220.34
029 Fairfax County Public Schools 1870 CLERMONT ELEM 63,304.63
029 Fairfax County Public Schools 1880 HUNT VALLEY ELEM 64,232.91
029 Fairfax County Public Schools 1890 KINGS GLEN ELEM 63,255.77
029 Fairfax County Public Schools 190 FAIRFAX COUNTY ADULT HIGH 76,140.40
029 Fairfax County Public Schools 1900 KEY MIDDLE 62,595.01
029 Fairfax County Public Schools 1901 KEY CENTER 64,188.98
029 Fairfax County Public Schools 1920 FORT HUNT ELEM 59,793.87
029 Fairfax County Public Schools 1940 CAMELOT ELEM 64,099.58
029 Fairfax County Public Schools 1950 HUNTERS WOODS ELEM 62,993.65
029 Fairfax County Public Schools 1960 ROBINSON SECONDARY 66,797.02
029 Fairfax County Public Schools 1970 LAUREL RIDGE ELEM 64,565.93
029 Fairfax County Public Schools 1980 HUTCHISON ELEM 59,707.01
029 Fairfax County Public Schools 1990 SOUTH LAKES HIGH 65,492.17
029 Fairfax County Public Schools 20 FAIRFAX HIGH 66,122.95
029 Fairfax County Public Schools 200 CENTREVILLE HIGH 67,090.37
029 Fairfax County Public Schools 2000 BONNIE BRAE ELEM 62,302.09
029 Fairfax County Public Schools 2010 DRANESVILLE ELEM 62,845.38
029 Fairfax County Public Schools 2020 CROSSFIELD ELEM 64,097.64
029 Fairfax County Public Schools 2030 SANGSTER ELEM 61,591.10
029 Fairfax County Public Schools 2040 SARATOGA ELEM 61,020.99
029 Fairfax County Public Schools 2050 VIRGINIA RUN ELEM 62,833.67
029 Fairfax County Public Schools 2060 WILLOW SPRINGS ELEM 64,045.35
029 Fairfax County Public Schools 2070 STONE MIDDLE 71,681.04
029 Fairfax County Public Schools 2080 POPLAR TREE ELEM 64,477.06
029 Fairfax County Public Schools 2090 CENTRE RIDGE ELEM 61,533.86
029 Fairfax County Public Schools 2100 WAPLES MILL ELEM 65,808.72
029 Fairfax County Public Schools 220 DOGWOOD ELEM 60,959.95
029 Fairfax County Public Schools 2201 BRYANT ALTERNATIVE HIGH 70,868.54
029 Fairfax County Public Schools 2203 ALDRIN ELEM 65,549.25
029 Fairfax County Public Schools 2204 DEER PARK ELEM 67,633.43
029 Fairfax County Public Schools 2205 CENTREVILLE ELEM 66,242.64
029 Fairfax County Public Schools 2209 LANE ELEM 59,356.30
029 Fairfax County Public Schools 2210 HALLEY ELEM 65,000.52
029 Fairfax County Public Schools 2211 MOUNTAIN VIEW ALTERNATIVE HIGH 71,341.51
029 Fairfax County Public Schools 2222 CARSON MIDDLE 67,457.14
029 Fairfax County Public Schools 2224 FORT BELVOIR ELEM 67,755.19
029 Fairfax County Public Schools 2225 BULL RUN ELEM 64,814.23
029 Fairfax County Public Schools 2228 WESTFIELD HIGH 68,520.71
029 Fairfax County Public Schools 2229 DANIELS RUN ELEM 61,162.82
029 Fairfax County Public Schools 2230 PROVIDENCE ELEM 62,228.40
029 Fairfax County Public Schools 2231 MCNAIR ELEM 58,403.73
029 Fairfax County Public Schools 2233 LIBERTY MIDDLE 64,174.18
029 Fairfax County Public Schools 2234 COLVIN RUN ELEM 61,761.72
029 Fairfax County Public Schools 2235 ISLAND CREEK ELEM 62,747.43
029 Fairfax County Public Schools 2236 LORTON STATION ELEM 59,787.95
FY 2015 Salary Survey - Avg Teacher Salary by School
January 14, 2015
Page 34

Division Name
School
Number School Name
Average
2014-2015
Salary
Virginia Department of Education
Average Teacher Salaries by School for School Year 2014-2015
The average salary calculation includes licensed elementary and secondary classroom teachers (regardless of fund source). Classroom teachers
include: regular K-12 education teachers, art, music, physical education, technology, remedial, gifted, mathematics, reading, special education, and ESL
teachers. Not included in the calculation are: teacher aides, guidance counselors or librarians.
To calculate each school’s average salary, the salaries of each teacher who works in the school were summed and divided by the FTE total of all
teachers (full-time and part-time) in the school.
029 Fairfax County Public Schools 2237 POWELL ELEM 64,938.34
029 Fairfax County Public Schools 2238 DUNN LORING E C RESOURCE CTR 71,776.65
029 Fairfax County Public Schools 2241 SOUTH COUNTY HIGH 67,732.17
029 Fairfax County Public Schools 2243 EAGLE VIEW ELEM 59,873.58
029 Fairfax County Public Schools 2251 ROCKY RUN E C RESOURCE CTR 76,804.94
029 Fairfax County Public Schools 2252 VIRGINIA HILLS E C RESOURCE CTR 79,499.91
029 Fairfax County Public Schools 2347 COATES ELEM 57,650.16
029 Fairfax County Public Schools 2348 LAUREL HILL ELEM 58,862.84
029 Fairfax County Public Schools 2410 MASON CREST ELEM 55,501.73
029 Fairfax County Public Schools 2420 SOUTH COUNTY MIDDLE 65,890.78
029 Fairfax County Public Schools 2430 FALLS CHURCH EC RESOURCE CTR 57,613.75
029 Fairfax County Public Schools 2440 PIMMIT EC RESOURCE CTR 65,195.83
029 Fairfax County Public Schools 250 TERRASET ELEM 63,339.46
029 Fairfax County Public Schools 260 CLEARVIEW ELEM 64,464.70
029 Fairfax County Public Schools 280 SUNRISE VALLEY ELEM 62,806.40
029 Fairfax County Public Schools 290 FAIRVIEW ELEM 61,995.75
029 Fairfax County Public Schools 300 ROCKY RUN MIDDLE 66,085.32
029 Fairfax County Public Schools 32 HERNDON HIGH 67,322.67
029 Fairfax County Public Schools 320 FRANCONIA ELEM 63,169.13
029 Fairfax County Public Schools 33 HERNDON MIDDLE 63,835.68
029 Fairfax County Public Schools 330 GROVETON ELEM 58,094.26
029 Fairfax County Public Schools 350 HUGHES MIDDLE 62,795.16
029 Fairfax County Public Schools 370 FORESTVILLE ELEM 65,924.52
029 Fairfax County Public Schools 380 WOODLAWN ELEM 60,272.67
029 Fairfax County Public Schools 390 FOX MILL ELEM 67,867.89
029 Fairfax County Public Schools 400 WHITE OAKS ELEM 64,555.48
029 Fairfax County Public Schools 420 MOUNT VERNON HIGH 63,537.76
029 Fairfax County Public Schools 430 OAK HILL ELEM 64,060.50
029 Fairfax County Public Schools 440 FRANKLIN MIDDLE 66,217.84
029 Fairfax County Public Schools 470 NEWINGTON FOREST ELEM 67,373.16
029 Fairfax County Public Schools 480 CHERRY RUN ELEM 65,715.42
029 Fairfax County Public Schools 490 FREEDOM HILL ELEM 62,946.20
029 Fairfax County Public Schools 510 MOUNT EAGLE ELEM 61,884.75
029 Fairfax County Public Schools 520 WEYANOKE ELEM 65,023.16
029 Fairfax County Public Schools 530 GRAHAM ROAD ELEM 58,366.46
029 Fairfax County Public Schools 550 BAILEYS ELEM 57,668.17
029 Fairfax County Public Schools 560 BELLE VIEW ELEM 59,943.60
029 Fairfax County Public Schools 570 GREAT FALLS ELEM 67,361.34
029 Fairfax County Public Schools 580 WESTLAWN ELEM 63,698.53
029 Fairfax County Public Schools 590 WOODLEY HILLS ELEM 63,049.18
029 Fairfax County Public Schools 620 CAMERON ELEM 71,738.41
029 Fairfax County Public Schools 630 GARFIELD ELEM 64,188.56
029 Fairfax County Public Schools 650 WOODBURN ELEM 61,550.95
029 Fairfax County Public Schools 660 ANNANDALE HIGH 65,746.10
029 Fairfax County Public Schools 673 JACKSON MIDDLE 64,438.25
029 Fairfax County Public Schools 680 BUSH HILL ELEM 61,641.55
029 Fairfax County Public Schools 690 GUNSTON ELEM 64,401.71
029 Fairfax County Public Schools 70 FOREST EDGE ELEM 61,024.48
029 Fairfax County Public Schools 700 BUCKNELL ELEM 62,035.29
029 Fairfax County Public Schools 710 SLEEPY HOLLOW ELEM 65,012.04
029 Fairfax County Public Schools 720 BELVEDERE ELEM 59,824.47
029 Fairfax County Public Schools 730 FLINT HILL ELEM 65,714.35
029 Fairfax County Public Schools 740 FLORIS ELEM 62,606.01
FY 2015 Salary Survey - Avg Teacher Salary by School
January 14, 2015
Page 35
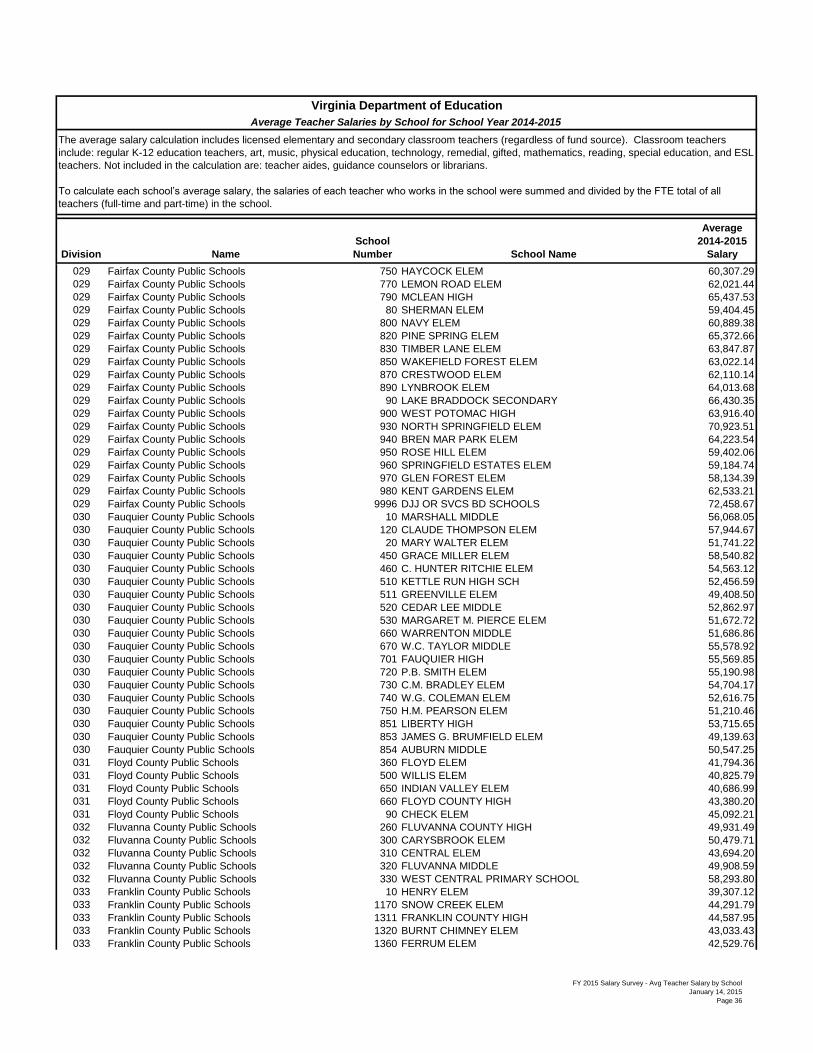
Division Name
School
Number School Name
Average
2014-2015
Salary
Virginia Department of Education
Average Teacher Salaries by School for School Year 2014-2015
The average salary calculation includes licensed elementary and secondary classroom teachers (regardless of fund source). Classroom teachers
include: regular K-12 education teachers, art, music, physical education, technology, remedial, gifted, mathematics, reading, special education, and ESL
teachers. Not included in the calculation are: teacher aides, guidance counselors or librarians.
To calculate each school’s average salary, the salaries of each teacher who works in the school were summed and divided by the FTE total of all
teachers (full-time and part-time) in the school.
029 Fairfax County Public Schools 750 HAYCOCK ELEM 60,307.29
029 Fairfax County Public Schools 770 LEMON ROAD ELEM 62,021.44
029 Fairfax County Public Schools 790 MCLEAN HIGH 65,437.53
029 Fairfax County Public Schools 80 SHERMAN ELEM 59,404.45
029 Fairfax County Public Schools 800 NAVY ELEM 60,889.38
029 Fairfax County Public Schools 820 PINE SPRING ELEM 65,372.66
029 Fairfax County Public Schools 830 TIMBER LANE ELEM 63,847.87
029 Fairfax County Public Schools 850 WAKEFIELD FOREST ELEM 63,022.14
029 Fairfax County Public Schools 870 CRESTWOOD ELEM 62,110.14
029 Fairfax County Public Schools 890 LYNBROOK ELEM 64,013.68
029 Fairfax County Public Schools 90 LAKE BRADDOCK SECONDARY 66,430.35
029 Fairfax County Public Schools 900 WEST POTOMAC HIGH 63,916.40
029 Fairfax County Public Schools 930 NORTH SPRINGFIELD ELEM 70,923.51
029 Fairfax County Public Schools 940 BREN MAR PARK ELEM 64,223.54
029 Fairfax County Public Schools 950 ROSE HILL ELEM 59,402.06
029 Fairfax County Public Schools 960 SPRINGFIELD ESTATES ELEM 59,184.74
029 Fairfax County Public Schools 970 GLEN FOREST ELEM 58,134.39
029 Fairfax County Public Schools 980 KENT GARDENS ELEM 62,533.21
029 Fairfax County Public Schools 9996 DJJ OR SVCS BD SCHOOLS 72,458.67
030 Fauquier County Public Schools 10 MARSHALL MIDDLE 56,068.05
030 Fauquier County Public Schools 120 CLAUDE THOMPSON ELEM 57,944.67
030 Fauquier County Public Schools 20 MARY WALTER ELEM 51,741.22
030 Fauquier County Public Schools 450 GRACE MILLER ELEM 58,540.82
030 Fauquier County Public Schools 460 C. HUNTER RITCHIE ELEM 54,563.12
030 Fauquier County Public Schools 510 KETTLE RUN HIGH SCH 52,456.59
030 Fauquier County Public Schools 511 GREENVILLE ELEM 49,408.50
030 Fauquier County Public Schools 520 CEDAR LEE MIDDLE 52,862.97
030 Fauquier County Public Schools 530 MARGARET M. PIERCE ELEM 51,672.72
030 Fauquier County Public Schools 660 WARRENTON MIDDLE 51,686.86
030 Fauquier County Public Schools 670 W.C. TAYLOR MIDDLE 55,578.92
030 Fauquier County Public Schools 701 FAUQUIER HIGH 55,569.85
030 Fauquier County Public Schools 720 P.B. SMITH ELEM 55,190.98
030 Fauquier County Public Schools 730 C.M. BRADLEY ELEM 54,704.17
030 Fauquier County Public Schools 740 W.G. COLEMAN ELEM 52,616.75
030 Fauquier County Public Schools 750 H.M. PEARSON ELEM 51,210.46
030 Fauquier County Public Schools 851 LIBERTY HIGH 53,715.65
030 Fauquier County Public Schools 853 JAMES G. BRUMFIELD ELEM 49,139.63
030 Fauquier County Public Schools 854 AUBURN MIDDLE 50,547.25
031 Floyd County Public Schools 360 FLOYD ELEM 41,794.36
031 Floyd County Public Schools 500 WILLIS ELEM 40,825.79
031 Floyd County Public Schools 650 INDIAN VALLEY ELEM 40,686.99
031 Floyd County Public Schools 660 FLOYD COUNTY HIGH 43,380.20
031 Floyd County Public Schools 90 CHECK ELEM 45,092.21
032 Fluvanna County Public Schools 260 FLUVANNA COUNTY HIGH 49,931.49
032 Fluvanna County Public Schools 300 CARYSBROOK ELEM 50,479.71
032 Fluvanna County Public Schools 310 CENTRAL ELEM 43,694.20
032 Fluvanna County Public Schools 320 FLUVANNA MIDDLE 49,908.59
032 Fluvanna County Public Schools 330 WEST CENTRAL PRIMARY SCHOOL 58,293.80
033 Franklin County Public Schools 10 HENRY ELEM 39,307.12
033 Franklin County Public Schools 1170 SNOW CREEK ELEM 44,291.79
033 Franklin County Public Schools 1311 FRANKLIN COUNTY HIGH 44,587.95
033 Franklin County Public Schools 1320 BURNT CHIMNEY ELEM 43,033.43
033 Franklin County Public Schools 1360 FERRUM ELEM 42,529.76
FY 2015 Salary Survey - Avg Teacher Salary by School
January 14, 2015
Page 36

Division Name
School
Number School Name
Average
2014-2015
Salary
Virginia Department of Education
Average Teacher Salaries by School for School Year 2014-2015
The average salary calculation includes licensed elementary and secondary classroom teachers (regardless of fund source). Classroom teachers
include: regular K-12 education teachers, art, music, physical education, technology, remedial, gifted, mathematics, reading, special education, and ESL
teachers. Not included in the calculation are: teacher aides, guidance counselors or librarians.
To calculate each school’s average salary, the salaries of each teacher who works in the school were summed and divided by the FTE total of all
teachers (full-time and part-time) in the school.
033 Franklin County Public Schools 1370 BOONES MILL ELEM 46,869.78
033 Franklin County Public Schools 1380 ROCKY MOUNT ELEM 42,859.45
033 Franklin County Public Schools 1481 GEREAU CTR FOR APL TECH&CAREER EXPL 45,724.22
033 Franklin County Public Schools 20 DUDLEY ELEM 45,161.95
033 Franklin County Public Schools 31 BEN. FRANKLIN MIDDLE-WEST 44,456.51
033 Franklin County Public Schools 32 BEN. FRANKLIN MIDDLE-EAST 44,724.00
033 Franklin County Public Schools 350 CALLAWAY ELEM 47,445.48
033 Franklin County Public Schools 660 LEE M. WAID ELEM 44,543.12
033 Franklin County Public Schools 690 GLADE HILL ELEM 45,526.26
033 Franklin County Public Schools 960 SONTAG ELEM 46,481.20
033 Franklin County Public Schools 980 WINDY GAP ELEM 39,866.62
034 Frederick County Public Schools 10 APPLE PIE RIDGE ELEM 49,232.00
034 Frederick County Public Schools 20 BASS-HOOVER ELEM 51,294.00
034 Frederick County Public Schools 30 JAMES WOOD HIGH 50,867.00
034 Frederick County Public Schools 320 ARMEL ELEM 48,810.00
034 Frederick County Public Schools 340 MIDDLETOWN ELEM 49,854.00
034 Frederick County Public Schools 380 GAINESBORO ELEM 48,373.00
034 Frederick County Public Schools 40 INDIAN HOLLOW ELEM 47,478.00
034 Frederick County Public Schools 410 STONEWALL ELEM 48,854.00
034 Frederick County Public Schools 420 JAMES WOOD MIDDLE 50,511.00
034 Frederick County Public Schools 460 FREDERICK COUNTY MIDDLE 50,679.00
034 Frederick County Public Schools 480 ROBERT E. AYLOR MIDDLE 51,958.00
034 Frederick County Public Schools 581 SHERANDO HIGH 52,078.00
034 Frederick County Public Schools 582 REDBUD RUN ELEM 48,856.00
034 Frederick County Public Schools 583 ORCHARD VIEW ELEM 47,710.00
034 Frederick County Public Schools 584 MILLBROOK HIGH 49,840.00
034 Frederick County Public Schools 586 ADMIRAL RICHARD E. BYRD MIDDLE 49,551.00
034 Frederick County Public Schools 587 EVENDALE ELEM 47,704.00
034 Frederick County Public Schools 590 GREENWOOD MILL ELEM 50,404.00
035 Giles County Public Schools 10 EASTERN COMBINED 42,291.00
035 Giles County Public Schools 390 MACY MCCLAUGHERTY COMBINED 39,616.00
035 Giles County Public Schools 400 NARROWS ELEM/MID. 43,521.00
035 Giles County Public Schools 461 GILES HIGH 42,921.00
035 Giles County Public Schools 470 NARROWS HIGH 43,470.00
036 Gloucester County Public Schools 100 BOTETOURT ELEM 48,163.48
036 Gloucester County Public Schools 240 ACHILLES ELEM 46,926.35
036 Gloucester County Public Schools 250 ABINGDON ELEM 47,018.57
036 Gloucester County Public Schools 260 GLOUCESTER HIGH 48,118.89
036 Gloucester County Public Schools 270 PETSWORTH ELEM 46,650.40
036 Gloucester County Public Schools 280 PEASLEY MIDDLE 47,387.52
036 Gloucester County Public Schools 381 BETHEL ELEM 50,200.26
036 Gloucester County Public Schools 90 PAGE MIDDLE 48,687.60
037 Goochland County Public Schools 120 BYRD ELEM 49,204.00
037 Goochland County Public Schools 220 GOOCHLAND HIGH 48,127.00
037 Goochland County Public Schools 260 RANDOLPH ELEM 47,250.00
037 Goochland County Public Schools 340 GOOCHLAND MIDDLE 46,099.00
037 Goochland County Public Schools 360 GOOCHLAND ELEM 45,235.00
038 Grayson County Public Schools 11 INDEPENDENCE MIDDLE 41,682.00
038 Grayson County Public Schools 421 GRAYSON COUNTY HIGH 39,452.00
038 Grayson County Public Schools 422 INDEPENDENCE ELEM 40,512.00
038 Grayson County Public Schools 430 GRAYSON HIGHLANDS 37,233.00
038 Grayson County Public Schools 440 BAYWOOD ELEM 38,136.00
038 Grayson County Public Schools 480 FAIRVIEW ELEM 37,466.00
FY 2015 Salary Survey - Avg Teacher Salary by School
January 14, 2015
Page 37

Division Name
School
Number School Name
Average
2014-2015
Salary
Virginia Department of Education
Average Teacher Salaries by School for School Year 2014-2015
The average salary calculation includes licensed elementary and secondary classroom teachers (regardless of fund source). Classroom teachers
include: regular K-12 education teachers, art, music, physical education, technology, remedial, gifted, mathematics, reading, special education, and ESL
teachers. Not included in the calculation are: teacher aides, guidance counselors or librarians.
To calculate each school’s average salary, the salaries of each teacher who works in the school were summed and divided by the FTE total of all
teachers (full-time and part-time) in the school.
038 Grayson County Public Schools 911 FRIES SCHOOL 37,558.00
039 Greene County Public Schools 10 NATHANAEL GREENE PRIMARY SCHOOL 46,207.00
039 Greene County Public Schools 20 NATHANAEL GREENE ELEM 43,246.00
039 Greene County Public Schools 30 RUCKERSVILLE ELEM 45,197.00
039 Greene County Public Schools 71 WILLIAM MONROE MIDDLE 47,010.00
039 Greene County Public Schools 72 WILLIAM MONROE HIGH 47,880.00
040 Greensville County Public Schools 190 EDWARD W WYATT MIDDLE 42,864.14
040 Greensville County Public Schools 200 GREENSVILLE COUNTY HIGH 47,294.00
040 Greensville County Public Schools 260 BELFIELD ELEM 46,796.00
040 Greensville County Public Schools 50 GREENSVILLE ELEM 45,638.00
041 Halifax County Public Schools 10 HALIFAX COUNTY HIGH 42,472.00
041 Halifax County Public Schools 1480 HALIFAX COUNTY MIDDLE 42,201.00
041 Halifax County Public Schools 1490 SYDNOR JENNINGS ELEM 43,313.00
041 Halifax County Public Schools 1501 CLUSTER SPRINGS EARLY LEARNING CTR 43,852.00
041 Halifax County Public Schools 1510 SCOTTSBURG ELEM 40,885.00
041 Halifax County Public Schools 1521 SINAI ELEM 42,711.00
041 Halifax County Public Schools 1550 MEADVILLE ELEM 41,308.00
041 Halifax County Public Schools 1560 CLAYS MILL ELEM 44,613.00
041 Halifax County Public Schools 20 CLUSTER SPRINGS ELEM 41,300.00
041 Halifax County Public Schools 30 SOUTH BOSTON ELEM 41,778.00
041 Halifax County Public Schools 950 SOUTH BOSTON/HALIFAX EARLY LEARNING CTR 41,674.00
042 Hanover County Public Schools 150 HENRY CLAY ELEM 49,582.77
042 Hanover County Public Schools 162 JOHN M. GANDY ELEM 50,662.48
042 Hanover County Public Schools 20 BEAVERDAM ELEM 48,982.30
042 Hanover County Public Schools 200 KERSEY CREEK ELEM 48,421.91
042 Hanover County Public Schools 210 LAUREL MEADOW ELEM 47,113.16
042 Hanover County Public Schools 290 WASHINGTON-HENRY ELEM 50,057.85
042 Hanover County Public Schools 30 RURAL POINT ELEM 51,699.17
042 Hanover County Public Schools 360 BATTLEFIELD PARK ELEM 50,642.53
042 Hanover County Public Schools 370 LEE DAVIS HIGH 49,756.08
042 Hanover County Public Schools 40 SOUTH ANNA ELEM 48,137.62
042 Hanover County Public Schools 400 PATRICK HENRY HIGH 49,239.93
042 Hanover County Public Schools 410 PEARSON'S CORNER ELEM 52,089.15
042 Hanover County Public Schools 420 MECHANICSVILLE ELEM 48,146.35
042 Hanover County Public Schools 430 ELMONT ELEM 50,484.68
042 Hanover County Public Schools 440 STONEWALL JACKSON MIDDLE 48,466.86
042 Hanover County Public Schools 450 LIBERTY MIDDLE 48,479.56
042 Hanover County Public Schools 551 COOL SPRING ELEM 49,748.02
042 Hanover County Public Schools 552 POLE GREEN ELEM 48,935.30
042 Hanover County Public Schools 553 OAK KNOLL MIDDLE 49,373.88
042 Hanover County Public Schools 554 HANOVER HIGH 49,692.39
042 Hanover County Public Schools 61 CHICKAHOMINY MIDDLE 49,128.29
042 Hanover County Public Schools 62 ATLEE HIGH 50,214.12
042 Hanover County Public Schools 70 COLD HARBOR ELEM 49,680.80
043 Henrico County Public Schools 10 THREE CHOPT ELEM 45,475.00
043 Henrico County Public Schools 100 HUNGARY CREEK MIDDLE 48,043.00
043 Henrico County Public Schools 120 DONAHOE ELEM 46,250.00
043 Henrico County Public Schools 130 ROLFE MIDDLE 45,067.00
043 Henrico County Public Schools 140 GODWIN HIGH 50,585.00
043 Henrico County Public Schools 150 GAYTON ELEM 49,583.00
043 Henrico County Public Schools 160 DEEP RUN HIGH 47,950.00
043 Henrico County Public Schools 190 HIGHLAND SPRINGS HIGH 46,994.00
043 Henrico County Public Schools 20 GLEN ALLEN ELEM 46,079.00
FY 2015 Salary Survey - Avg Teacher Salary by School
January 14, 2015
Page 38
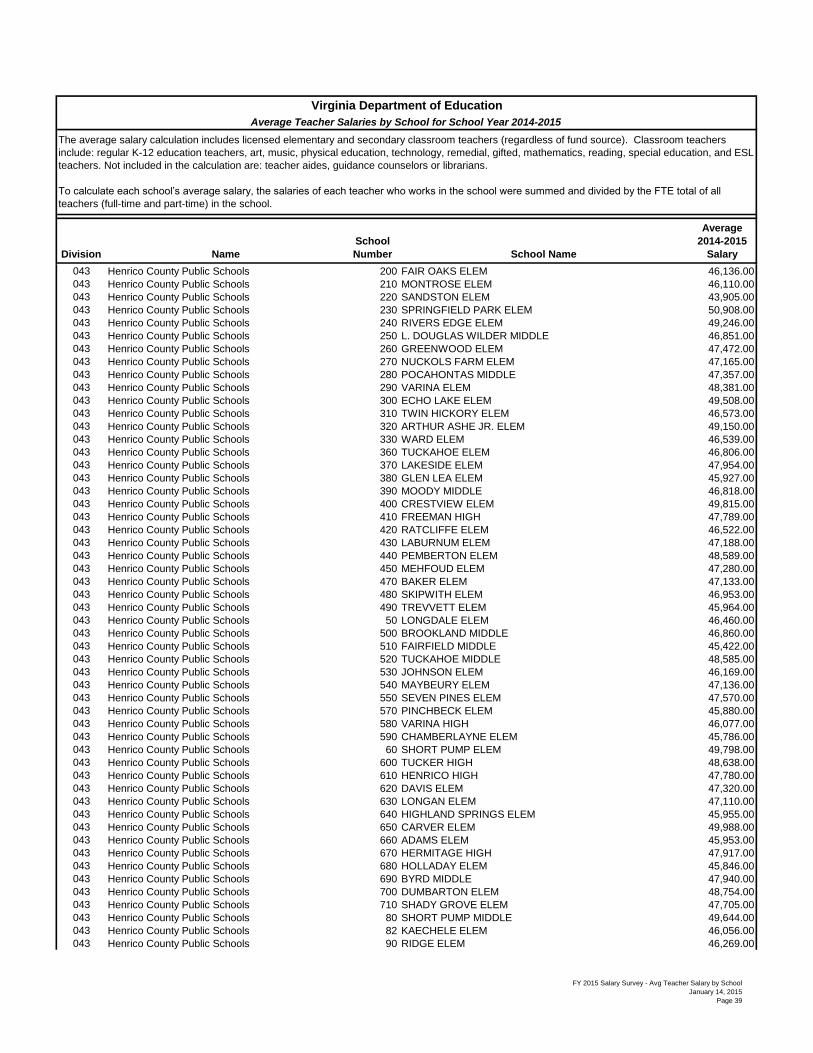
Division Name
School
Number School Name
Average
2014-2015
Salary
Virginia Department of Education
Average Teacher Salaries by School for School Year 2014-2015
The average salary calculation includes licensed elementary and secondary classroom teachers (regardless of fund source). Classroom teachers
include: regular K-12 education teachers, art, music, physical education, technology, remedial, gifted, mathematics, reading, special education, and ESL
teachers. Not included in the calculation are: teacher aides, guidance counselors or librarians.
To calculate each school’s average salary, the salaries of each teacher who works in the school were summed and divided by the FTE total of all
teachers (full-time and part-time) in the school.
043 Henrico County Public Schools 200 FAIR OAKS ELEM 46,136.00
043 Henrico County Public Schools 210 MONTROSE ELEM 46,110.00
043 Henrico County Public Schools 220 SANDSTON ELEM 43,905.00
043 Henrico County Public Schools 230 SPRINGFIELD PARK ELEM 50,908.00
043 Henrico County Public Schools 240 RIVERS EDGE ELEM 49,246.00
043 Henrico County Public Schools 250 L. DOUGLAS WILDER MIDDLE 46,851.00
043 Henrico County Public Schools 260 GREENWOOD ELEM 47,472.00
043 Henrico County Public Schools 270 NUCKOLS FARM ELEM 47,165.00
043 Henrico County Public Schools 280 POCAHONTAS MIDDLE 47,357.00
043 Henrico County Public Schools 290 VARINA ELEM 48,381.00
043 Henrico County Public Schools 300 ECHO LAKE ELEM 49,508.00
043 Henrico County Public Schools 310 TWIN HICKORY ELEM 46,573.00
043 Henrico County Public Schools 320 ARTHUR ASHE JR. ELEM 49,150.00
043 Henrico County Public Schools 330 WARD ELEM 46,539.00
043 Henrico County Public Schools 360 TUCKAHOE ELEM 46,806.00
043 Henrico County Public Schools 370 LAKESIDE ELEM 47,954.00
043 Henrico County Public Schools 380 GLEN LEA ELEM 45,927.00
043 Henrico County Public Schools 390 MOODY MIDDLE 46,818.00
043 Henrico County Public Schools 400 CRESTVIEW ELEM 49,815.00
043 Henrico County Public Schools 410 FREEMAN HIGH 47,789.00
043 Henrico County Public Schools 420 RATCLIFFE ELEM 46,522.00
043 Henrico County Public Schools 430 LABURNUM ELEM 47,188.00
043 Henrico County Public Schools 440 PEMBERTON ELEM 48,589.00
043 Henrico County Public Schools 450 MEHFOUD ELEM 47,280.00
043 Henrico County Public Schools 470 BAKER ELEM 47,133.00
043 Henrico County Public Schools 480 SKIPWITH ELEM 46,953.00
043 Henrico County Public Schools 490 TREVVETT ELEM 45,964.00
043 Henrico County Public Schools 50 LONGDALE ELEM 46,460.00
043 Henrico County Public Schools 500 BROOKLAND MIDDLE 46,860.00
043 Henrico County Public Schools 510 FAIRFIELD MIDDLE 45,422.00
043 Henrico County Public Schools 520 TUCKAHOE MIDDLE 48,585.00
043 Henrico County Public Schools 530 JOHNSON ELEM 46,169.00
043 Henrico County Public Schools 540 MAYBEURY ELEM 47,136.00
043 Henrico County Public Schools 550 SEVEN PINES ELEM 47,570.00
043 Henrico County Public Schools 570 PINCHBECK ELEM 45,880.00
043 Henrico County Public Schools 580 VARINA HIGH 46,077.00
043 Henrico County Public Schools 590 CHAMBERLAYNE ELEM 45,786.00
043 Henrico County Public Schools 60 SHORT PUMP ELEM 49,798.00
043 Henrico County Public Schools 600 TUCKER HIGH 48,638.00
043 Henrico County Public Schools 610 HENRICO HIGH 47,780.00
043 Henrico County Public Schools 620 DAVIS ELEM 47,320.00
043 Henrico County Public Schools 630 LONGAN ELEM 47,110.00
043 Henrico County Public Schools 640 HIGHLAND SPRINGS ELEM 45,955.00
043 Henrico County Public Schools 650 CARVER ELEM 49,988.00
043 Henrico County Public Schools 660 ADAMS ELEM 45,953.00
043 Henrico County Public Schools 670 HERMITAGE HIGH 47,917.00
043 Henrico County Public Schools 680 HOLLADAY ELEM 45,846.00
043 Henrico County Public Schools 690 BYRD MIDDLE 47,940.00
043 Henrico County Public Schools 700 DUMBARTON ELEM 48,754.00
043 Henrico County Public Schools 710 SHADY GROVE ELEM 47,705.00
043 Henrico County Public Schools 80 SHORT PUMP MIDDLE 49,644.00
043 Henrico County Public Schools 82 KAECHELE ELEM 46,056.00
043 Henrico County Public Schools 90 RIDGE ELEM 46,269.00
FY 2015 Salary Survey - Avg Teacher Salary by School
January 14, 2015
Page 39

Division Name
School
Number School Name
Average
2014-2015
Salary
Virginia Department of Education
Average Teacher Salaries by School for School Year 2014-2015
The average salary calculation includes licensed elementary and secondary classroom teachers (regardless of fund source). Classroom teachers
include: regular K-12 education teachers, art, music, physical education, technology, remedial, gifted, mathematics, reading, special education, and ESL
teachers. Not included in the calculation are: teacher aides, guidance counselors or librarians.
To calculate each school’s average salary, the salaries of each teacher who works in the school were summed and divided by the FTE total of all
teachers (full-time and part-time) in the school.
043 Henrico County Public Schools 92 ELKO MIDDLE 46,823.00
043 Henrico County Public Schools 93 COLONIAL TRAIL ELEM 47,181.00
043 Henrico County Public Schools 94 HARVIE ELEM 46,181.00
043 Henrico County Public Schools 95 HOLMAN MIDDLE 47,777.00
043 Henrico County Public Schools 96 GLEN ALLEN HIGH 45,709.00
044 Henry County Public Schools 10 BASSETT HIGH 44,173.92
044 Henry County Public Schools 20 MAGNA VISTA HIGH 47,465.65
044 Henry County Public Schools 220 SANVILLE ELEM 45,328.32
044 Henry County Public Schools 361 AXTON ELEM 43,922.38
044 Henry County Public Schools 480 CARVER ELEM 43,980.53
044 Henry County Public Schools 530 DREWRY MASON ELEM 46,397.77
044 Henry County Public Schools 590 CAMPBELL COURT ELEM 46,152.97
044 Henry County Public Schools 620 FIELDALE-COLLINSVILLE MIDDLE 43,585.80
044 Henry County Public Schools 661 JOHN REDD SMITH ELEM 44,102.65
044 Henry County Public Schools 662 COLLINSVILLE PRIMARY 45,744.75
044 Henry County Public Schools 670 LAUREL PARK MIDDLE 43,589.23
044 Henry County Public Schools 740 RICH ACRES ELEM 43,831.73
044 Henry County Public Schools 760 STANLEYTOWN ELEM 45,883.11
044 Henry County Public Schools 872 MT. OLIVET ELEM 44,672.00
045 Highland County Public Schools 110 HIGHLAND ELEM 46,596.66
045 Highland County Public Schools 220 HIGHLAND HIGH 50,568.39
046 Isle of Wight County Public Schools 240 WINDSOR ELEM 53,154.00
046 Isle of Wight County Public Schools 250 WINDSOR HIGH 55,128.00
046 Isle of Wight County Public Schools 280 CARRSVILLE ELEM 56,295.00
046 Isle of Wight County Public Schools 320 HARDY ELEM 56,055.00
046 Isle of Wight County Public Schools 40 SMITHFIELD HIGH 54,704.00
046 Isle of Wight County Public Schools 421 CARROLLTON ELEM 51,815.00
046 Isle of Wight County Public Schools 422 GEORGIE D. TYLER MIDDLE 53,342.00
046 Isle of Wight County Public Schools 424 WESTSIDE ELEM 55,143.00
046 Isle of Wight County Public Schools 50 SMITHFIELD MIDDLE 54,089.00
048 King George County Public Schools 10 KING GEORGE MIDDLE 44,402.00
048 King George County Public Schools 100 KING GEORGE ELEM 49,751.00
048 King George County Public Schools 120 KING GEORGE HIGH 45,795.00
048 King George County Public Schools 221 SEALSTON ELEM 44,732.00
048 King George County Public Schools 50 POTOMAC ELEM 45,697.00
049 King and Queen County Public Schools 200 KING & QUEEN ELEM 43,679.50
049 King and Queen County Public Schools 280 CENTRAL HIGH 45,549.19
049 King and Queen County Public Schools 290 LAWSON-MARRIOTT ELEM 46,246.63
050 King William County Public Schools 130 KING WILLIAM HIGH 52,764.00
050 King William County Public Schools 160 HAMILTON HOLMES MIDDLE 48,403.00
050 King William County Public Schools 180 ACQUINTON ELEM 48,232.00
050 King William County Public Schools 190 COOL SPRING PRIMARY 49,250.00
051 Lancaster County Public Schools 10 LANCASTER HIGH 45,150.00
051 Lancaster County Public Schools 110 LANCASTER MIDDLE 41,979.00
051 Lancaster County Public Schools 210 LANCASTER PRIMARY 42,721.00
052 Lee County Public Schools 160 DRYDEN ELEM 41,079.00
052 Lee County Public Schools 200 ST. CHARLES ELEM 42,872.00
052 Lee County Public Schools 290 PENNINGTON MIDDLE 42,640.00
052 Lee County Public Schools 300 LEE HIGH 41,467.00
052 Lee County Public Schools 330 ELK KNOB ELEM 41,233.00
052 Lee County Public Schools 470 JONESVILLE MIDDLE 41,154.00
052 Lee County Public Schools 630 FLATWOODS ELEM 39,450.00
052 Lee County Public Schools 670 ROSE HILL ELEM 39,573.00
FY 2015 Salary Survey - Avg Teacher Salary by School
January 14, 2015
Page 40
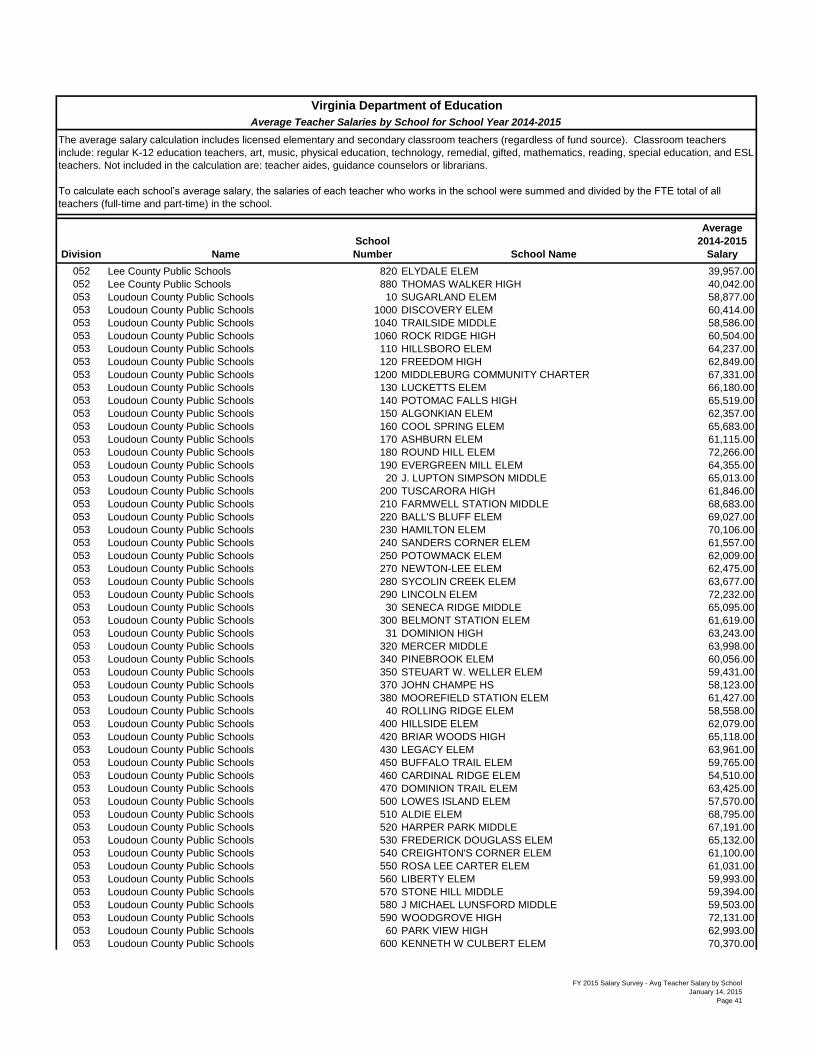
Division Name
School
Number School Name
Average
2014-2015
Salary
Virginia Department of Education
Average Teacher Salaries by School for School Year 2014-2015
The average salary calculation includes licensed elementary and secondary classroom teachers (regardless of fund source). Classroom teachers
include: regular K-12 education teachers, art, music, physical education, technology, remedial, gifted, mathematics, reading, special education, and ESL
teachers. Not included in the calculation are: teacher aides, guidance counselors or librarians.
To calculate each school’s average salary, the salaries of each teacher who works in the school were summed and divided by the FTE total of all
teachers (full-time and part-time) in the school.
052 Lee County Public Schools 820 ELYDALE ELEM 39,957.00
052 Lee County Public Schools 880 THOMAS WALKER HIGH 40,042.00
053 Loudoun County Public Schools 10 SUGARLAND ELEM 58,877.00
053 Loudoun County Public Schools 1000 DISCOVERY ELEM 60,414.00
053 Loudoun County Public Schools 1040 TRAILSIDE MIDDLE 58,586.00
053 Loudoun County Public Schools 1060 ROCK RIDGE HIGH 60,504.00
053 Loudoun County Public Schools 110 HILLSBORO ELEM 64,237.00
053 Loudoun County Public Schools 120 FREEDOM HIGH 62,849.00
053 Loudoun County Public Schools 1200 MIDDLEBURG COMMUNITY CHARTER 67,331.00
053 Loudoun County Public Schools 130 LUCKETTS ELEM 66,180.00
053 Loudoun County Public Schools 140 POTOMAC FALLS HIGH 65,519.00
053 Loudoun County Public Schools 150 ALGONKIAN ELEM 62,357.00
053 Loudoun County Public Schools 160 COOL SPRING ELEM 65,683.00
053 Loudoun County Public Schools 170 ASHBURN ELEM 61,115.00
053 Loudoun County Public Schools 180 ROUND HILL ELEM 72,266.00
053 Loudoun County Public Schools 190 EVERGREEN MILL ELEM 64,355.00
053 Loudoun County Public Schools 20 J. LUPTON SIMPSON MIDDLE 65,013.00
053 Loudoun County Public Schools 200 TUSCARORA HIGH 61,846.00
053 Loudoun County Public Schools 210 FARMWELL STATION MIDDLE 68,683.00
053 Loudoun County Public Schools 220 BALL'S BLUFF ELEM 69,027.00
053 Loudoun County Public Schools 230 HAMILTON ELEM 70,106.00
053 Loudoun County Public Schools 240 SANDERS CORNER ELEM 61,557.00
053 Loudoun County Public Schools 250 POTOWMACK ELEM 62,009.00
053 Loudoun County Public Schools 270 NEWTON-LEE ELEM 62,475.00
053 Loudoun County Public Schools 280 SYCOLIN CREEK ELEM 63,677.00
053 Loudoun County Public Schools 290 LINCOLN ELEM 72,232.00
053 Loudoun County Public Schools 30 SENECA RIDGE MIDDLE 65,095.00
053 Loudoun County Public Schools 300 BELMONT STATION ELEM 61,619.00
053 Loudoun County Public Schools 31 DOMINION HIGH 63,243.00
053 Loudoun County Public Schools 320 MERCER MIDDLE 63,998.00
053 Loudoun County Public Schools 340 PINEBROOK ELEM 60,056.00
053 Loudoun County Public Schools 350 STEUART W. WELLER ELEM 59,431.00
053 Loudoun County Public Schools 370 JOHN CHAMPE HS 58,123.00
053 Loudoun County Public Schools 380 MOOREFIELD STATION ELEM 61,427.00
053 Loudoun County Public Schools 40 ROLLING RIDGE ELEM 58,558.00
053 Loudoun County Public Schools 400 HILLSIDE ELEM 62,079.00
053 Loudoun County Public Schools 420 BRIAR WOODS HIGH 65,118.00
053 Loudoun County Public Schools 430 LEGACY ELEM 63,961.00
053 Loudoun County Public Schools 450 BUFFALO TRAIL ELEM 59,765.00
053 Loudoun County Public Schools 460 CARDINAL RIDGE ELEM 54,510.00
053 Loudoun County Public Schools 470 DOMINION TRAIL ELEM 63,425.00
053 Loudoun County Public Schools 500 LOWES ISLAND ELEM 57,570.00
053 Loudoun County Public Schools 510 ALDIE ELEM 68,795.00
053 Loudoun County Public Schools 520 HARPER PARK MIDDLE 67,191.00
053 Loudoun County Public Schools 530 FREDERICK DOUGLASS ELEM 65,132.00
053 Loudoun County Public Schools 540 CREIGHTON'S CORNER ELEM 61,100.00
053 Loudoun County Public Schools 550 ROSA LEE CARTER ELEM 61,031.00
053 Loudoun County Public Schools 560 LIBERTY ELEM 59,993.00
053 Loudoun County Public Schools 570 STONE HILL MIDDLE 59,394.00
053 Loudoun County Public Schools 580 J MICHAEL LUNSFORD MIDDLE 59,503.00
053 Loudoun County Public Schools 590 WOODGROVE HIGH 72,131.00
053 Loudoun County Public Schools 60 PARK VIEW HIGH 62,993.00
053 Loudoun County Public Schools 600 KENNETH W CULBERT ELEM 70,370.00
FY 2015 Salary Survey - Avg Teacher Salary by School
January 14, 2015
Page 41

Division Name
School
Number School Name
Average
2014-2015
Salary
Virginia Department of Education
Average Teacher Salaries by School for School Year 2014-2015
The average salary calculation includes licensed elementary and secondary classroom teachers (regardless of fund source). Classroom teachers
include: regular K-12 education teachers, art, music, physical education, technology, remedial, gifted, mathematics, reading, special education, and ESL
teachers. Not included in the calculation are: teacher aides, guidance counselors or librarians.
To calculate each school’s average salary, the salaries of each teacher who works in the school were summed and divided by the FTE total of all
teachers (full-time and part-time) in the school.
053 Loudoun County Public Schools 610 ARCOLA ELEM 63,535.00
053 Loudoun County Public Schools 650 BANNEKER ELEM 66,156.00
053 Loudoun County Public Schools 660 LOUDOUN COUNTY HIGH 68,074.00
053 Loudoun County Public Schools 680 LOUDOUN VALLEY HIGH 70,488.00
053 Loudoun County Public Schools 690 STERLING ELEM 60,476.00
053 Loudoun County Public Schools 70 MEADOWLAND ELEM 65,907.00
053 Loudoun County Public Schools 700 WATERFORD ELEM 69,354.00
053 Loudoun County Public Schools 710 CATOCTIN ELEM 65,148.00
053 Loudoun County Public Schools 720 GUILFORD ELEM 59,248.00
053 Loudoun County Public Schools 730 EMERICK ELEM 66,184.00
053 Loudoun County Public Schools 740 BROAD RUN HIGH 66,012.00
053 Loudoun County Public Schools 750 SULLY ELEM 59,645.00
053 Loudoun County Public Schools 760 STERLING MIDDLE 64,116.00
053 Loudoun County Public Schools 780 LOVETTSVILLE ELEM 68,548.00
053 Loudoun County Public Schools 790 BLUE RIDGE MIDDLE 69,914.00
053 Loudoun County Public Schools 80 LEESBURG ELEM 67,092.00
053 Loudoun County Public Schools 820 HORIZON ELEM 61,327.00
053 Loudoun County Public Schools 840 CEDAR LANE ELEM 64,050.00
053 Loudoun County Public Schools 850 STONE BRIDGE HIGH 65,327.00
053 Loudoun County Public Schools 860 LITTLE RIVER ELEM 59,408.00
053 Loudoun County Public Schools 870 SELDENS LANDING ELEM 62,094.00
053 Loudoun County Public Schools 880 EAGLE RIDGE MIDDLE 63,278.00
053 Loudoun County Public Schools 890 COUNTRYSIDE ELEM 60,017.00
053 Loudoun County Public Schools 90 SMART'S MILL MIDDLE 63,862.00
053 Loudoun County Public Schools 900 HERITAGE HIGH 66,317.00
053 Loudoun County Public Schools 91 FRANCES HAZEL REID ELEM 64,432.00
053 Loudoun County Public Schools 910 MILL RUN ELEM 62,516.00
053 Loudoun County Public Schools 921 HARMONY MIDDLE 70,704.00
053 Loudoun County Public Schools 930 RIVER BEND MIDDLE 64,967.00
053 Loudoun County Public Schools 940 BELMONT RIDGE MIDDLE 62,618.00
053 Loudoun County Public Schools 950 JOHN W. TOLBERT JR. ELEM 63,630.00
053 Loudoun County Public Schools 960 HUTCHISON FARM ELEM 60,693.00
053 Loudoun County Public Schools 970 FOREST GROVE ELEM 62,137.00
053 Loudoun County Public Schools 980 MOUNTAIN VIEW ELEM 73,971.00
054 Louisa County Public Schools 601 LOUISA COUNTY MIDDLE 49,711.00
054 Louisa County Public Schools 602 LOUISA COUNTY HIGH 51,755.00
054 Louisa County Public Schools 610 THOMAS JEFFERSON ELEM 50,847.00
054 Louisa County Public Schools 641 TREVILIANS ELEM 48,843.00
054 Louisa County Public Schools 660 JOUETT ELEM 49,580.00
054 Louisa County Public Schools 80 MOSS-NUCKOLS ELEM 48,026.00
055 Lunenburg County Public Schools 140 VICTORIA ELEM 44,300.00
055 Lunenburg County Public Schools 171 LUNENBURG MIDDLE 44,173.00
055 Lunenburg County Public Schools 240 KENBRIDGE ELEM 45,292.00
055 Lunenburg County Public Schools 560 CENTRAL HIGH 43,192.00
056 Madison County Public Schools 200 WAVERLY YOWELL ELEM 42,826.00
056 Madison County Public Schools 221 MADISON COUNTY HIGH 46,941.00
056 Madison County Public Schools 222 WILLIAM H. WETSEL MIDDLE 42,645.00
056 Madison County Public Schools 230 MADISON PRIMARY 46,104.00
057 Mathews County Public Schools 100 THOMAS HUNTER MIDDLE 45,536.03
057 Mathews County Public Schools 190 MATHEWS HIGH 42,952.68
057 Mathews County Public Schools 291 LEE-JACKSON ELEM 46,138.32
058 Mecklenburg County Public Schools 1000 CLARKSVILLE ELEM 41,639.84
058 Mecklenburg County Public Schools 1020 LACROSSE ELEM 41,168.86
FY 2015 Salary Survey - Avg Teacher Salary by School
January 14, 2015
Page 42

Division Name
School
Number School Name
Average
2014-2015
Salary
Virginia Department of Education
Average Teacher Salaries by School for School Year 2014-2015
The average salary calculation includes licensed elementary and secondary classroom teachers (regardless of fund source). Classroom teachers
include: regular K-12 education teachers, art, music, physical education, technology, remedial, gifted, mathematics, reading, special education, and ESL
teachers. Not included in the calculation are: teacher aides, guidance counselors or librarians.
To calculate each school’s average salary, the salaries of each teacher who works in the school were summed and divided by the FTE total of all
teachers (full-time and part-time) in the school.
058 Mecklenburg County Public Schools 190 SOUTH HILL ELEM 41,821.16
058 Mecklenburg County Public Schools 910 CHASE CITY ELEM 41,858.03
058 Mecklenburg County Public Schools 950 PARK VIEW MIDDLE 40,064.46
058 Mecklenburg County Public Schools 960 BLUESTONE MIDDLE 39,527.13
058 Mecklenburg County Public Schools 980 BLUESTONE HIGH 40,526.15
058 Mecklenburg County Public Schools 990 PARK VIEW HIGH 40,480.19
059 Middlesex County Public Schools 140 ST. CLARE WALKER MIDDLE 45,113.00
059 Middlesex County Public Schools 291 MIDDLESEX ELEM 43,512.00
059 Middlesex County Public Schools 90 MIDDLESEX HIGH 43,598.00
060 Montgomery County Public Schools 10 HARDING AVENUE ELEM 47,065.54
060 Montgomery County Public Schools 210 PRICES FORK ELEM 43,624.98
060 Montgomery County Public Schools 290 SHAWSVILLE MIDDLE 46,222.60
060 Montgomery County Public Schools 30 EASTERN MONTGOMERY ELEM 45,055.02
060 Montgomery County Public Schools 600 FALLING BRANCH ELEM 43,631.42
060 Montgomery County Public Schools 650 AUBURN HIGH 46,141.26
060 Montgomery County Public Schools 671 CHRISTIANSBURG MIDDLE 45,780.31
060 Montgomery County Public Schools 700 BELVIEW ELEM 46,814.74
060 Montgomery County Public Schools 710 BLACKSBURG MIDDLE 48,870.85
060 Montgomery County Public Schools 730 MARGARET BEEKS ELEM 45,441.76
060 Montgomery County Public Schools 740 CHRISTIANSBURG ELEM 43,872.06
060 Montgomery County Public Schools 750 GILBERT LINKOUS ELEM 45,200.87
060 Montgomery County Public Schools 760 BLACKSBURG HIGH 47,439.08
060 Montgomery County Public Schools 770 CHRISTIANSBURG HIGH 45,637.89
060 Montgomery County Public Schools 780 CHRISTIANSBURG PRIMARY 45,085.20
060 Montgomery County Public Schools 901 KIPPS ELEM 45,234.56
060 Montgomery County Public Schools 902 AUBURN ELEM 44,666.93
060 Montgomery County Public Schools 903 AUBURN MIDDLE 43,814.14
060 Montgomery County Public Schools 904 EASTERN MONTGOMERY HIGH 43,572.70
062 Nelson County Public Schools 10 ROCKFISH RIVER ELEM 46,954.29
062 Nelson County Public Schools 20 TYE RIVER ELEM 50,223.68
062 Nelson County Public Schools 710 NELSON COUNTY HIGH 49,377.02
062 Nelson County Public Schools 730 NELSON MIDDLE 52,000.94
063 New Kent County Public Schools 10 NEW KENT ELEM 46,411.00
063 New Kent County Public Schools 100 NEW KENT MIDDLE 44,486.00
063 New Kent County Public Schools 180 GEORGE W. WATKINS ELEM 45,701.00
063 New Kent County Public Schools 20 NEW KENT HIGH 46,248.00
065 Northampton County Public Schools 350 NORTHAMPTON HIGH 43,517.00
065 Northampton County Public Schools 360 NORTHAMPTON MIDDLE 40,865.00
065 Northampton County Public Schools 451 OCCOHANNOCK ELEM 43,235.00
065 Northampton County Public Schools 452 KIPTOPEKE ELEM 43,423.00
066 Northumberland County Public Schools 210 NORTHUMBERLAND MIDDLE 44,523.00
066 Northumberland County Public Schools 331 NORTHUMBERLAND ELEM 45,963.00
066 Northumberland County Public Schools 40 NORTHUMBERLAND HIGH 47,453.00
067 Nottoway County Public Schools 300 NOTTOWAY INTERMEDIATE 45,200.97
067 Nottoway County Public Schools 301 NOTTOWAY HIGH 48,697.50
067 Nottoway County Public Schools 302 NOTTOWAY MIDDLE 45,879.79
067 Nottoway County Public Schools 310 BURKEVILLE ELEM 45,031.76
067 Nottoway County Public Schools 330 CREWE PRIMARY 47,927.70
067 Nottoway County Public Schools 340 BLACKSTONE PRIMARY 48,179.76
068 Orange County Public Schools 330 ORANGE CO. HIGH 48,228.51
068 Orange County Public Schools 340 PROSPECT HEIGHTS MIDDLE 49,770.77
068 Orange County Public Schools 350 UNIONVILLE ELEM 51,388.34
068 Orange County Public Schools 360 GORDON-BARBOUR ELEM 48,041.33
FY 2015 Salary Survey - Avg Teacher Salary by School
January 14, 2015
Page 43

Division Name
School
Number School Name
Average
2014-2015
Salary
Virginia Department of Education
Average Teacher Salaries by School for School Year 2014-2015
The average salary calculation includes licensed elementary and secondary classroom teachers (regardless of fund source). Classroom teachers
include: regular K-12 education teachers, art, music, physical education, technology, remedial, gifted, mathematics, reading, special education, and ESL
teachers. Not included in the calculation are: teacher aides, guidance counselors or librarians.
To calculate each school’s average salary, the salaries of each teacher who works in the school were summed and divided by the FTE total of all
teachers (full-time and part-time) in the school.
068 Orange County Public Schools 370 ORANGE ELEM 49,412.72
068 Orange County Public Schools 471 LOCUST GROVE MIDDLE 47,325.13
068 Orange County Public Schools 50 LOCUST GROVE ELEM 47,468.01
068 Orange County Public Schools 51 LOCUST GROVE PRIMARY SCHOOL 47,155.64
068 Orange County Public Schools 70 LIGHTFOOT ELEM 46,818.50
069 Page County Public Schools 110 LURAY HIGH 51,532.00
069 Page County Public Schools 210 STANLEY ELEM 43,845.00
069 Page County Public Schools 310 SHENANDOAH ELEM 40,693.00
069 Page County Public Schools 340 GROVE HILL PRESCHOOL ACADEMY 47,564.00
069 Page County Public Schools 350 LURAY ELEM 43,042.00
069 Page County Public Schools 380 PAGE COUNTY HIGH 49,560.00
069 Page County Public Schools 390 PAGE COUNTY MIDDLE 43,279.00
069 Page County Public Schools 400 LURAY MIDDLE 45,153.00
069 Page County Public Schools 50 SPRINGFIELD ELEM 41,033.00
070 Patrick County Public Schools 150 MEADOWS OF DAN ELEM 39,748.91
070 Patrick County Public Schools 320 STUART ELEM 41,430.15
070 Patrick County Public Schools 350 HARDIN REYNOLDS ELEM 38,838.71
070 Patrick County Public Schools 440 BLUE RIDGE ELEM 40,637.43
070 Patrick County Public Schools 680 PATRICK SPRINGS ELEM 43,692.24
070 Patrick County Public Schools 700 PATRICK COUNTY HIGH 43,453.75
070 Patrick County Public Schools 80 WOOLWINE ELEM 42,197.17
071 Pittsylvania County Public Schools 1090 DAN RIVER MIDDLE 40,751.00
071 Pittsylvania County Public Schools 1130 TUNSTALL MIDDLE 42,397.00
071 Pittsylvania County Public Schools 1460 SOUTHSIDE ELEM 40,674.00
071 Pittsylvania County Public Schools 1660 CHATHAM MIDDLE 41,396.00
071 Pittsylvania County Public Schools 1680 DAN RIVER HIGH 41,239.00
071 Pittsylvania County Public Schools 1690 KENTUCK ELEM 40,907.00
071 Pittsylvania County Public Schools 1700 GRETNA HIGH 42,473.00
071 Pittsylvania County Public Schools 1710 STONY MILL ELEM 41,040.00
071 Pittsylvania County Public Schools 1720 CHATHAM HIGH 41,574.00
071 Pittsylvania County Public Schools 1730 TUNSTALL HIGH 43,290.00
071 Pittsylvania County Public Schools 1740 UNION HALL ELEM 41,108.00
071 Pittsylvania County Public Schools 1750 MT. AIRY ELEM 42,077.00
071 Pittsylvania County Public Schools 1851 TWIN SPRINGS ELEM 42,330.00
071 Pittsylvania County Public Schools 1853 BROSVILLE ELEM 41,691.00
071 Pittsylvania County Public Schools 280 GRETNA ELEM 41,539.00
071 Pittsylvania County Public Schools 290 GRETNA MIDDLE 42,114.00
071 Pittsylvania County Public Schools 30 JOHN L. HURT ELEM 40,987.00
071 Pittsylvania County Public Schools 640 CHATHAM ELEM 41,214.00
072 Powhatan County Public Schools 11 POWHATAN HIGH 49,910.00
072 Powhatan County Public Schools 13 POWHATAN ELEM 48,270.00
072 Powhatan County Public Schools 130 POWHATAN JR. HIGH 48,579.00
072 Powhatan County Public Schools 21 FLAT ROCK ELEM 48,976.00
072 Powhatan County Public Schools 231 POCAHONTAS ELEM 49,441.00
072 Powhatan County Public Schools 232 POCAHONTAS MIDDLE 48,550.00
073 Prince Edward County Public Schools 10 PRINCE EDWARD ELEM 47,915.00
073 Prince Edward County Public Schools 20 PRINCE EDWARD MIDDLE 40,821.00
073 Prince Edward County Public Schools 400 PRINCE EDWARD COUNTY HIGH 44,432.00
074 Prince George County Public Schools 20 PRINCE GEORGE HIGH 50,520.00
074 Prince George County Public Schools 270 N.B. CLEMENTS JUNIOR HIGH 49,157.00
074 Prince George County Public Schools 280 WILLIAM A. WALTON ELEM 47,765.00
074 Prince George County Public Schools 290 NORTH ELEM 46,333.00
074 Prince George County Public Schools 300 SOUTH ELEM 51,541.00
FY 2015 Salary Survey - Avg Teacher Salary by School
January 14, 2015
Page 44

Division Name
School
Number School Name
Average
2014-2015
Salary
Virginia Department of Education
Average Teacher Salaries by School for School Year 2014-2015
The average salary calculation includes licensed elementary and secondary classroom teachers (regardless of fund source). Classroom teachers
include: regular K-12 education teachers, art, music, physical education, technology, remedial, gifted, mathematics, reading, special education, and ESL
teachers. Not included in the calculation are: teacher aides, guidance counselors or librarians.
To calculate each school’s average salary, the salaries of each teacher who works in the school were summed and divided by the FTE total of all
teachers (full-time and part-time) in the school.
074 Prince George County Public Schools 310 L.L. BEAZLEY ELEM 49,452.00
074 Prince George County Public Schools 320 J.E.J. MOORE MIDDLE 49,694.00
074 Prince George County Public Schools 340 DAVID A. HARRISON ELEM 50,183.00
075 Prince William County Public Schools 1060 PATRIOT HIGH 62,126.87
075 Prince William County Public Schools 110 PINEY BRANCH ELEM 59,225.24
075 Prince William County Public Schools 120 ENTERPRISE ELEM 58,576.60
075 Prince William County Public Schools 130 JOHN F. PATTIE SR. ELEM 59,735.93
075 Prince William County Public Schools 140 POTOMAC HIGH 64,371.05
075 Prince William County Public Schools 150 THE NOKESVILLE SCHOOL 67,740.64
075 Prince William County Public Schools 160 MARTIN LUTHER KING JR. ELEM 57,271.00
075 Prince William County Public Schools 170 POTOMAC MIDDLE 60,638.42
075 Prince William County Public Schools 180 LAKE RIDGE ELEM 57,883.25
075 Prince William County Public Schools 190 WOODBINE PRE-SCHOOL CENTER 68,761.25
075 Prince William County Public Schools 20 SUDLEY ELEM 60,281.97
075 Prince William County Public Schools 200 ASHLAND ELEM 59,440.42
075 Prince William County Public Schools 220 J.W. ALVEY ELEM 61,489.90
075 Prince William County Public Schools 231 MARY G. PORTER TRADITIONAL 62,642.71
075 Prince William County Public Schools 240 MARY WILLIAMS ELEM 59,073.62
075 Prince William County Public Schools 250 HAYMARKET ELEM 57,479.29
075 Prince William County Public Schools 260 OCCOQUAN ELEM 59,590.81
075 Prince William County Public Schools 270 SUELLA G. ELLIS ELEM 57,366.51
075 Prince William County Public Schools 280 DUMFRIES ELEM 62,179.10
075 Prince William County Public Schools 290 BATTLEFIELD HIGH 63,697.01
075 Prince William County Public Schools 30 MINNIEVILLE ELEM 60,783.41
075 Prince William County Public Schools 300 FREEDOM HIGH 60,931.04
075 Prince William County Public Schools 310 RONALD WILSON REAGAN MIDDLE 61,256.73
075 Prince William County Public Schools 320 SPRINGWOODS ELEM 66,221.31
075 Prince William County Public Schools 330 A. HENDERSON ELEM 62,180.04
075 Prince William County Public Schools 340 GLENKIRK ELEM 61,759.80
075 Prince William County Public Schools 350 YORKSHIRE ELEM 56,284.46
075 Prince William County Public Schools 360 SAMUEL L. GRAVELY JR. ELEM SCH 59,533.93
075 Prince William County Public Schools 370 FANNIE W. FITZGERALD ELEM 58,132.90
075 Prince William County Public Schools 380 HERBERT J. SAUNDERS MIDDLE 65,104.86
075 Prince William County Public Schools 390 VICTORY ELEM 56,487.28
075 Prince William County Public Schools 40 ROCKLEDGE ELEM 56,988.74
075 Prince William County Public Schools 430 TRIANGLE ELEM 61,279.43
075 Prince William County Public Schools 440 R. DEAN KILBY ELEM 63,405.99
075 Prince William County Public Schools 450 FEATHERSTONE ELEM 62,443.39
075 Prince William County Public Schools 460 LOCH LOMOND ELEM 59,754.22
075 Prince William County Public Schools 470 T CLAY WOOD ELEM 59,942.44
075 Prince William County Public Schools 480 STONEWALL MIDDLE 62,849.08
075 Prince William County Public Schools 490 E.H. MARSTELLER MIDDLE 69,639.66
075 Prince William County Public Schools 500 SIGNAL HILL ELEM 63,041.13
075 Prince William County Public Schools 501 PARKSIDE MIDDLE 64,882.23
075 Prince William County Public Schools 510 GRAHAM PARK MIDDLE 63,659.95
075 Prince William County Public Schools 520 FRED M. LYNN MIDDLE 57,730.47
075 Prince William County Public Schools 530 BRENTSVILLE DISTRICT HIGH 63,250.48
075 Prince William County Public Schools 540 WEST GATE ELEM 57,772.06
075 Prince William County Public Schools 550 POTOMAC VIEW ELEM 56,823.83
075 Prince William County Public Schools 560 WOODBRIDGE MIDDLE 62,270.18
075 Prince William County Public Schools 570 MARUMSCO HILLS ELEM 60,064.46
075 Prince William County Public Schools 580 ELIZABETH VAUGHAN ELEM 58,457.38
075 Prince William County Public Schools 591 RIPPON MIDDLE 69,755.21
FY 2015 Salary Survey - Avg Teacher Salary by School
January 14, 2015
Page 45

Division Name
School
Number School Name
Average
2014-2015
Salary
Virginia Department of Education
Average Teacher Salaries by School for School Year 2014-2015
The average salary calculation includes licensed elementary and secondary classroom teachers (regardless of fund source). Classroom teachers
include: regular K-12 education teachers, art, music, physical education, technology, remedial, gifted, mathematics, reading, special education, and ESL
teachers. Not included in the calculation are: teacher aides, guidance counselors or librarians.
To calculate each school’s average salary, the salaries of each teacher who works in the school were summed and divided by the FTE total of all
teachers (full-time and part-time) in the school.
075 Prince William County Public Schools 60 WOODBRIDGE HIGH 62,405.27
075 Prince William County Public Schools 600 BELMONT ELEM 57,007.49
075 Prince William County Public Schools 610 DALE CITY ELEM 62,157.42
075 Prince William County Public Schools 620 C.A. SINCLAIR ELEM 59,615.78
075 Prince William County Public Schools 630 GEORGE G. TYLER ELEM 59,964.44
075 Prince William County Public Schools 640 MILLS E. GODWIN MIDDLE 60,741.63
075 Prince William County Public Schools 660 COLES ELEM 58,610.34
075 Prince William County Public Schools 670 BEL AIR ELEM 61,285.44
075 Prince William County Public Schools 680 STONEWALL JACKSON HIGH 65,446.09
075 Prince William County Public Schools 690 GAR-FIELD HIGH 68,711.88
075 Prince William County Public Schools 70 KERRYDALE ELEM 61,689.00
075 Prince William County Public Schools 700 NEABSCO ELEM 58,221.18
075 Prince William County Public Schools 710 C.D. HYLTON HIGH 65,502.85
075 Prince William County Public Schools 720 LAKE RIDGE MIDDLE 61,549.60
075 Prince William County Public Schools 730 SHARON C. MCAULIFFE ELEM 63,012.03
075 Prince William County Public Schools 740 WESTRIDGE ELEM 59,409.58
075 Prince William County Public Schools 750 RIVER OAKS ELEM 64,435.23
075 Prince William County Public Schools 760 ANTIETAM ELEM 61,771.28
075 Prince William County Public Schools 770 GEORGE P. MULLEN ELEM 61,835.13
075 Prince William County Public Schools 780 STUART M. BEVILLE MIDDLE 67,423.20
075 Prince William County Public Schools 790 THURGOOD MARSHALL ELEM 57,991.21
075 Prince William County Public Schools 80 OSBOURN PARK HIGH 66,056.94
075 Prince William County Public Schools 800 MONTCLAIR ELEM 60,506.24
075 Prince William County Public Schools 810 MOUNTAIN VIEW ELEM 64,458.84
075 Prince William County Public Schools 820 OLD BRIDGE ELEM 63,252.18
075 Prince William County Public Schools 830 LEESYLVANIA ELEM 60,021.33
075 Prince William County Public Schools 840 BENNETT ELEM 63,492.74
075 Prince William County Public Schools 850 SONNIE PENN ELEM 63,867.65
075 Prince William County Public Schools 860 BRISTOW RUN ELEM 63,381.26
075 Prince William County Public Schools 870 FOREST PARK HIGH 63,615.15
075 Prince William County Public Schools 880 LOUISE A. BENTON MIDDLE 69,725.14
075 Prince William County Public Schools 890 SWANS CREEK ELEM 61,721.09
075 Prince William County Public Schools 900 CEDAR POINT ELEM 63,259.54
075 Prince William County Public Schools 920 BULL RUN MIDDLE 62,839.03
075 Prince William County Public Schools 941 ROSA PARKS ELEM 58,467.78
075 Prince William County Public Schools 945 PENNINGTON SCHOOL 64,753.21
075 Prince William County Public Schools 950 BUCKLAND MILLS ELEM 60,347.81
075 Prince William County Public Schools 960 GAINESVILLE MIDDLE 62,293.83
077 Pulaski County Public Schools 10 PULASKI COUNTY SR. HIGH 43,458.00
077 Pulaski County Public Schools 20 CRITZER ELEM 44,164.00
077 Pulaski County Public Schools 230 PULASKI ELEM 43,889.00
077 Pulaski County Public Schools 430 SNOWVILLE ELEM 47,189.00
077 Pulaski County Public Schools 460 PULASKI MIDDLE 41,602.00
077 Pulaski County Public Schools 500 RIVERLAWN ELEM 43,116.00
077 Pulaski County Public Schools 530 DUBLIN MIDDLE 42,610.00
077 Pulaski County Public Schools 540 DUBLIN ELEM 45,111.00
078 Rappahannock County Public Schools 230 RAPPAHANNOCK CO. HIGH 47,606.00
078 Rappahannock County Public Schools 240 RAPPAHANNOCK COUNTY ELEM 49,041.00
079 Richmond County Public Schools 190 RICHMOND COUNTY INT 43,925.41
079 Richmond County Public Schools 20 RICHMOND COUNTY ELEM 45,318.57
079 Richmond County Public Schools 210 RAPPAHANNOCK HIGH 49,075.58
080 Roanoke County Public Schools 10 HIDDEN VALLEY MIDDLE 46,587.00
080 Roanoke County Public Schools 180 BURLINGTON ELEM 43,294.00
FY 2015 Salary Survey - Avg Teacher Salary by School
January 14, 2015
Page 46

Division Name
School
Number School Name
Average
2014-2015
Salary
Virginia Department of Education
Average Teacher Salaries by School for School Year 2014-2015
The average salary calculation includes licensed elementary and secondary classroom teachers (regardless of fund source). Classroom teachers
include: regular K-12 education teachers, art, music, physical education, technology, remedial, gifted, mathematics, reading, special education, and ESL
teachers. Not included in the calculation are: teacher aides, guidance counselors or librarians.
To calculate each school’s average salary, the salaries of each teacher who works in the school were summed and divided by the FTE total of all
teachers (full-time and part-time) in the school.
080 Roanoke County Public Schools 232 WILLIAM BYRD MIDDLE 45,772.00
080 Roanoke County Public Schools 290 MT. PLEASANT ELEM 44,691.00
080 Roanoke County Public Schools 330 CLEARBROOK ELEM 44,821.00
080 Roanoke County Public Schools 40 FORT LEWIS ELEM 45,349.00
080 Roanoke County Public Schools 420 BACK CREEK ELEM 46,448.00
080 Roanoke County Public Schools 470 CAVE SPRING HIGH 46,812.00
080 Roanoke County Public Schools 480 OAK GROVE ELEM 45,700.00
080 Roanoke County Public Schools 490 GLENVAR ELEM 44,490.00
080 Roanoke County Public Schools 50 PENN FOREST ELEM 46,311.00
080 Roanoke County Public Schools 500 MOUNTAIN VIEW ELEM 45,981.00
080 Roanoke County Public Schools 520 NORTHSIDE HIGH 44,587.00
080 Roanoke County Public Schools 530 MASON'S COVE ELEM 44,588.00
080 Roanoke County Public Schools 540 HERMAN L. HORN ELEM 42,227.00
080 Roanoke County Public Schools 560 CAVE SPRING ELEM 45,916.00
080 Roanoke County Public Schools 60 W.E. CUNDIFF ELEM 41,637.00
080 Roanoke County Public Schools 600 GREEN VALLEY ELEM 45,575.00
080 Roanoke County Public Schools 610 GLENVAR HIGH 45,581.00
080 Roanoke County Public Schools 620 CAVE SPRING MIDDLE 43,768.00
080 Roanoke County Public Schools 630 WILLIAM BYRD HIGH 43,159.00
080 Roanoke County Public Schools 640 NORTHSIDE MIDDLE 42,957.00
080 Roanoke County Public Schools 650 GLEN COVE ELEM 45,872.00
080 Roanoke County Public Schools 751 GLENVAR MIDDLE 43,175.00
080 Roanoke County Public Schools 752 BONSACK ELEM 45,468.00
080 Roanoke County Public Schools 754 HIDDEN VALLEY HIGH 45,901.00
081 Rockbridge County Public Schools 150 FAIRFIELD ELEM 45,857.00
081 Rockbridge County Public Schools 22 ROCKBRIDGE COUNTY HIGH 44,428.00
081 Rockbridge County Public Schools 340 MOUNTAIN VIEW ELEM 45,368.00
081 Rockbridge County Public Schools 641 NATURAL BRIDGE ELEM 44,438.00
081 Rockbridge County Public Schools 650 CENTRAL ELEM 45,051.00
081 Rockbridge County Public Schools 678 MAURY RIVER MIDDLE 44,763.00
082 Rockingham County Public Schools 10 PLAINS ELEM 50,741.27
082 Rockingham County Public Schools 1071 JOHN C. MYERS ELEM 57,457.22
082 Rockingham County Public Schools 1073 PEAK VIEW ELEM 47,747.06
082 Rockingham County Public Schools 20 SPOTSWOOD HIGH 45,947.29
082 Rockingham County Public Schools 360 LINVILLE-EDOM ELEM 45,795.76
082 Rockingham County Public Schools 390 RIVER BEND ELEM 48,006.79
082 Rockingham County Public Schools 391 EAST ROCKINGHAM HIGH 46,590.80
082 Rockingham County Public Schools 400 ELKTON ELEM 50,314.62
082 Rockingham County Public Schools 500 LACEY SPRING ELEM 49,524.35
082 Rockingham County Public Schools 520 MOUNTAIN VIEW ELEM 52,638.60
082 Rockingham County Public Schools 600 MCGAHEYSVILLE ELEM 49,919.44
082 Rockingham County Public Schools 830 SOUTH RIVER ELEM 48,811.03
082 Rockingham County Public Schools 850 TURNER ASHBY HIGH 50,082.85
082 Rockingham County Public Schools 860 MONTEVIDEO MIDDLE 47,868.94
082 Rockingham County Public Schools 861 CUB RUN ELEM 48,501.47
082 Rockingham County Public Schools 870 BROADWAY HIGH 49,038.24
082 Rockingham County Public Schools 890 WILBUR S. PENCE MIDDLE 48,230.41
082 Rockingham County Public Schools 900 ELKTON MIDDLE 45,841.88
082 Rockingham County Public Schools 920 OTTOBINE ELEM 47,863.04
082 Rockingham County Public Schools 940 FULKS RUN ELEM 46,938.77
082 Rockingham County Public Schools 950 PLEASANT VALLEY ELEM 45,375.84
082 Rockingham County Public Schools 960 J. FRANK HILLYARD MIDDLE 46,212.89
082 Rockingham County Public Schools 970 JOHN W. WAYLAND ELEM 49,368.64
FY 2015 Salary Survey - Avg Teacher Salary by School
January 14, 2015
Page 47

Division Name
School
Number School Name
Average
2014-2015
Salary
Virginia Department of Education
Average Teacher Salaries by School for School Year 2014-2015
The average salary calculation includes licensed elementary and secondary classroom teachers (regardless of fund source). Classroom teachers
include: regular K-12 education teachers, art, music, physical education, technology, remedial, gifted, mathematics, reading, special education, and ESL
teachers. Not included in the calculation are: teacher aides, guidance counselors or librarians.
To calculate each school’s average salary, the salaries of each teacher who works in the school were summed and divided by the FTE total of all
teachers (full-time and part-time) in the school.
083 Russell County Public Schools 140 LEBANON HIGH 40,858.97
083 Russell County Public Schools 390 LEBANON PRIMARY 39,446.13
083 Russell County Public Schools 410 LEBANON ELEM 38,361.35
083 Russell County Public Schools 540 HONAKER HIGH 41,216.49
083 Russell County Public Schools 580 BELFAST ELK GARDEN ELEM 40,785.00
083 Russell County Public Schools 710 SWORDS CREEK ELEM 40,363.57
083 Russell County Public Schools 791 CASTLEWOOD HIGH 43,932.84
083 Russell County Public Schools 792 CASTLEWOOD ELEM 36,586.04
083 Russell County Public Schools 800 GIVENS ELEM 38,857.75
083 Russell County Public Schools 820 COPPER CREEK ELEM 39,228.54
083 Russell County Public Schools 890 HONAKER ELEM 41,210.25
083 Russell County Public Schools 902 LEBANON MIDDLE 41,486.00
084 Scott County Public Schools 102 FORT BLACKMORE PRIMARY 45,691.00
084 Scott County Public Schools 20 RYE COVE INTERMEDIATE 40,111.00
084 Scott County Public Schools 220 NICKELSVILLE ELEM 45,560.00
084 Scott County Public Schools 260 RYE COVE HIGH 44,300.00
084 Scott County Public Schools 42 DUNGANNON INTERMEDIATE 45,612.00
084 Scott County Public Schools 641 SHOEMAKER ELEM 42,750.00
084 Scott County Public Schools 670 HILTON ELEM 42,835.00
084 Scott County Public Schools 740 WEBER CITY ELEM 42,846.00
084 Scott County Public Schools 750 DUFFIELD-PATTONSVILLE PRIMARY 42,987.00
084 Scott County Public Schools 770 GATE CITY HIGH 46,140.00
084 Scott County Public Schools 771 GATE CITY MIDDLE 43,230.00
084 Scott County Public Schools 780 TWIN SPRINGS HIGH 45,050.00
084 Scott County Public Schools 790 YUMA ELEM 47,578.00
085 Shenandoah County Public Schools 20 W.W. ROBINSON ELEM 44,489.00
085 Shenandoah County Public Schools 30 PETER MUHLENBERG MIDDLE 49,487.00
085 Shenandoah County Public Schools 40 NORTH FORK MIDDLE 46,778.00
085 Shenandoah County Public Schools 50 SIGNAL KNOB MIDDLE 45,766.00
085 Shenandoah County Public Schools 770 STRASBURG HIGH 43,093.00
085 Shenandoah County Public Schools 780 CENTRAL HIGH 46,731.00
085 Shenandoah County Public Schools 790 STONEWALL JACKSON HIGH 50,542.00
085 Shenandoah County Public Schools 810 SANDY HOOK ELEM 45,890.00
085 Shenandoah County Public Schools 820 ASHBY LEE ELEM 45,786.00
086 Smyth County Public Schools 120 NORTHWOOD MIDDLE 46,224.68
086 Smyth County Public Schools 250 NORTHWOOD HIGH 43,965.18
086 Smyth County Public Schools 290 ATKINS ELEM 44,945.56
086 Smyth County Public Schools 460 CHILHOWIE HIGH 42,843.77
086 Smyth County Public Schools 555 SUGAR GROVE ELEM 41,585.38
086 Smyth County Public Schools 680 MARION MIDDLE 39,817.05
086 Smyth County Public Schools 690 OAK POINT ELEM 41,591.78
086 Smyth County Public Schools 700 MARION SENIOR HIGH 39,642.50
086 Smyth County Public Schools 710 MARION ELEM 41,614.16
086 Smyth County Public Schools 720 RICH VALLEY ELEM 44,928.64
086 Smyth County Public Schools 730 CHILHOWIE ELEM 43,594.46
086 Smyth County Public Schools 740 SALTVILLE ELEM 46,841.74
086 Smyth County Public Schools 851 CHILHOWIE MIDDLE 44,401.18
087 Southampton County Public Schools 10 NOTTOWAY ELEM 43,549.00
087 Southampton County Public Schools 20 MEHERRIN ELEM 42,798.00
087 Southampton County Public Schools 690 SOUTHAMPTON HIGH 43,744.00
087 Southampton County Public Schools 700 SOUTHAMPTON MIDDLE 42,711.00
087 Southampton County Public Schools 710 CAPRON ELEM 42,838.00
087 Southampton County Public Schools 780 RIVERDALE ELEM 42,787.00
FY 2015 Salary Survey - Avg Teacher Salary by School
January 14, 2015
Page 48

Division Name
School
Number School Name
Average
2014-2015
Salary
Virginia Department of Education
Average Teacher Salaries by School for School Year 2014-2015
The average salary calculation includes licensed elementary and secondary classroom teachers (regardless of fund source). Classroom teachers
include: regular K-12 education teachers, art, music, physical education, technology, remedial, gifted, mathematics, reading, special education, and ESL
teachers. Not included in the calculation are: teacher aides, guidance counselors or librarians.
To calculate each school’s average salary, the salaries of each teacher who works in the school were summed and divided by the FTE total of all
teachers (full-time and part-time) in the school.
088 Spotsylvania County Public Schools 10 BATTLEFIELD ELEM 55,358.89
088 Spotsylvania County Public Schools 130 ROBERT E. LEE ELEM 53,138.16
088 Spotsylvania County Public Schools 20 COURTLAND HIGH 54,100.15
088 Spotsylvania County Public Schools 22 COURTLAND ELEM 53,134.28
088 Spotsylvania County Public Schools 220 POST OAK MIDDLE 51,077.11
088 Spotsylvania County Public Schools 30 LEE HILL ELEM 48,032.83
088 Spotsylvania County Public Schools 330 SPOTSYLVANIA MIDDLE 55,469.96
088 Spotsylvania County Public Schools 340 BERKELEY ELEM 55,788.74
088 Spotsylvania County Public Schools 350 LIVINGSTON ELEM 52,067.54
088 Spotsylvania County Public Schools 360 SPOTSWOOD ELEM 53,122.50
088 Spotsylvania County Public Schools 370 SPOTSYLVANIA HIGH 52,885.30
088 Spotsylvania County Public Schools 381 CHANCELLOR HIGH 53,939.40
088 Spotsylvania County Public Schools 382 CHANCELLOR MIDDLE 50,991.27
088 Spotsylvania County Public Schools 390 SMITH STATION ELEM 52,940.75
088 Spotsylvania County Public Schools 40 CHANCELLOR ELEM 52,671.78
088 Spotsylvania County Public Schools 400 BROCK ROAD ELEM 53,293.20
088 Spotsylvania County Public Schools 50 BATTLEFIELD MIDDLE 49,807.98
088 Spotsylvania County Public Schools 501 COURTHOUSE RD ELEM 51,091.38
088 Spotsylvania County Public Schools 502 THORNBURG MIDDLE 51,634.77
088 Spotsylvania County Public Schools 503 RIVERVIEW ELEM 50,557.40
088 Spotsylvania County Public Schools 504 WILDERNESS ELEM 54,299.32
088 Spotsylvania County Public Schools 505 NI RIVER MIDDLE 53,492.75
088 Spotsylvania County Public Schools 506 MASSAPONAX HIGH 50,979.21
088 Spotsylvania County Public Schools 507 HARRISON ROAD ELEM 47,047.91
088 Spotsylvania County Public Schools 508 PARKSIDE ELEM 51,351.77
088 Spotsylvania County Public Schools 509 FREEDOM MIDDLE 49,199.57
088 Spotsylvania County Public Schools 510 RIVERBEND HIGH 51,279.99
088 Spotsylvania County Public Schools 511 CEDAR FOREST ELEM 49,462.58
088 Spotsylvania County Public Schools 60 SALEM ELEM 51,485.73
089 Stafford County Public Schools 10 EDWARD E. DREW JR. MIDDLE 56,456.00
089 Stafford County Public Schools 111 STAFFORD ELEM 49,811.00
089 Stafford County Public Schools 112 STAFFORD MIDDLE 52,199.00
089 Stafford County Public Schools 162 T. BENTON GAYLE MIDDLE 53,322.00
089 Stafford County Public Schools 20 STAFFORD SR. HIGH 54,205.00
089 Stafford County Public Schools 230 FERRY FARM ELEM 55,840.00
089 Stafford County Public Schools 250 HARTWOOD ELEM 50,967.00
089 Stafford County Public Schools 260 ANNE E. MONCURE ELEM 52,443.00
089 Stafford County Public Schools 270 GRAFTON VILLAGE ELEM 54,548.00
089 Stafford County Public Schools 280 FALMOUTH ELEM 49,323.00
089 Stafford County Public Schools 30 NORTH STAFFORD HIGH 52,888.00
089 Stafford County Public Schools 300 PARK RIDGE ELEM 54,780.00
089 Stafford County Public Schools 320 HAMPTON OAKS ELEM 48,409.00
089 Stafford County Public Schools 40 ANDREW G. WRIGHT MIDDLE 52,376.00
089 Stafford County Public Schools 41 GARRISONVILLE ELEM 55,667.00
089 Stafford County Public Schools 421 BROOKE POINT HIGH 56,578.00
089 Stafford County Public Schools 422 H.H. POOLE MIDDLE 55,115.00
089 Stafford County Public Schools 423 WINDING CREEK ELEM 51,696.00
089 Stafford County Public Schools 424 COLONIAL FORGE HIGH 51,558.00
089 Stafford County Public Schools 425 ROCKY RUN ELEM 52,877.00
089 Stafford County Public Schools 426 RODNEY E. THOMPSON MIDDLE 50,087.00
089 Stafford County Public Schools 427 KATE WALLER BARRETT ELEM 47,951.00
089 Stafford County Public Schools 429 MARGARET BRENT ELEM 50,890.00
089 Stafford County Public Schools 430 MOUNTAIN VIEW HIGH 51,718.00
FY 2015 Salary Survey - Avg Teacher Salary by School
January 14, 2015
Page 49

Division Name
School
Number School Name
Average
2014-2015
Salary
Virginia Department of Education
Average Teacher Salaries by School for School Year 2014-2015
The average salary calculation includes licensed elementary and secondary classroom teachers (regardless of fund source). Classroom teachers
include: regular K-12 education teachers, art, music, physical education, technology, remedial, gifted, mathematics, reading, special education, and ESL
teachers. Not included in the calculation are: teacher aides, guidance counselors or librarians.
To calculate each school’s average salary, the salaries of each teacher who works in the school were summed and divided by the FTE total of all
teachers (full-time and part-time) in the school.
089 Stafford County Public Schools 431 CONWAY ELEM 51,642.00
089 Stafford County Public Schools 432 DONALD B. DIXON-LYLE R. SMITH MIDDLE 56,548.00
089 Stafford County Public Schools 433 ANTHONY BURNS ELEM 48,878.00
089 Stafford County Public Schools 440 SHIRLEY C. HEIM MIDDLE 47,844.00
089 Stafford County Public Schools 50 WIDEWATER ELEM 48,083.00
089 Stafford County Public Schools 60 ROCKHILL ELEM 54,753.00
090 Surry County Public Schools 10 SURRY COUNTY HIGH 50,557.00
090 Surry County Public Schools 20 SURRY ELEM 48,438.00
090 Surry County Public Schools 30 LUTHER P. JACKSON MIDDLE 51,947.00
091 Sussex County Public Schools 340 SUSSEX CENTRAL HIGH 51,036.00
091 Sussex County Public Schools 482 SUSSEX CENTRAL MIDDLE 45,106.96
091 Sussex County Public Schools 483 SUSSEX CENTRAL ELEM 53,295.50
092 Tazewell County Public Schools 10 GRAHAM MIDDLE 48,839.00
092 Tazewell County Public Schools 100 TAZEWELL MIDDLE 43,098.00
092 Tazewell County Public Schools 1020 ABBS VALLEY-BOISSEVAIN ELEM 43,971.00
092 Tazewell County Public Schools 1030 TAZEWELL ELEM 42,323.00
092 Tazewell County Public Schools 450 NORTH TAZEWELL ELEM 40,589.00
092 Tazewell County Public Schools 750 DUDLEY PRIMARY 44,421.00
092 Tazewell County Public Schools 821 RICHLANDS HIGH 45,573.00
092 Tazewell County Public Schools 822 RICHLANDS ELEM 42,253.00
092 Tazewell County Public Schools 823 RICHLANDS MIDDLE 45,670.00
092 Tazewell County Public Schools 830 CEDAR BLUFF ELEM 42,385.00
092 Tazewell County Public Schools 890 TAZEWELL HIGH 46,135.00
092 Tazewell County Public Schools 920 RAVEN ELEM 40,489.00
092 Tazewell County Public Schools 940 GRAHAM HIGH 50,351.00
092 Tazewell County Public Schools 960 GRAHAM INTERMEDIATE 45,600.00
092 Tazewell County Public Schools 980 SPRINGVILLE ELEM 42,706.00
093 Warren County Public Schools 140 E. WILSON MORRISON ELEM 44,984.00
093 Warren County Public Schools 20 LESLIE FOX KEYSER ELEM 45,600.00
093 Warren County Public Schools 230 WARREN COUNTY HIGH 46,294.00
093 Warren County Public Schools 240 RESSIE JEFFRIES ELEM 45,562.00
093 Warren County Public Schools 250 SKYLINE HIGH 46,304.00
093 Warren County Public Schools 270 WARREN COUNTY MIDDLE 45,415.00
093 Warren County Public Schools 371 HILDA J. BARBOUR ELEM 45,675.00
093 Warren County Public Schools 90 A.S. RHODES ELEM 44,481.00
094 Washington County Public Schools 1020 VALLEY INSTITUTE ELEM 44,252.31
094 Washington County Public Schools 1030 ABINGDON HIGH 45,523.40
094 Washington County Public Schools 1040 JOHN S. BATTLE HIGH 46,156.61
094 Washington County Public Schools 1050 PATRICK HENRY HIGH 47,265.48
094 Washington County Public Schools 1060 HOLSTON HIGH 43,564.49
094 Washington County Public Schools 1070 HIGH POINT ELEM 42,074.62
094 Washington County Public Schools 1080 ABINGDON ELEM 46,275.23
094 Washington County Public Schools 1090 GLADE SPRING MIDDLE 47,070.57
094 Washington County Public Schools 1110 E.B. STANLEY MIDDLE 46,273.62
094 Washington County Public Schools 20 MEADOWVIEW ELEM 43,346.45
094 Washington County Public Schools 260 GREENDALE ELEM 43,525.88
094 Washington County Public Schools 40 DAMASCUS MIDDLE 44,171.26
094 Washington County Public Schools 50 RHEA VALLEY ELEM 44,251.23
094 Washington County Public Schools 620 WALLACE MIDDLE 46,429.97
094 Washington County Public Schools 70 WATAUGA ELEM 45,212.41
095 Westmoreland County Public Schools 120 WASHINGTON & LEE HIGH 44,738.00
095 Westmoreland County Public Schools 210 COPLE ELEM 47,388.00
095 Westmoreland County Public Schools 300 MONTROSS MIDDLE 42,106.00
FY 2015 Salary Survey - Avg Teacher Salary by School
January 14, 2015
Page 50

Division Name
School
Number School Name
Average
2014-2015
Salary
Virginia Department of Education
Average Teacher Salaries by School for School Year 2014-2015
The average salary calculation includes licensed elementary and secondary classroom teachers (regardless of fund source). Classroom teachers
include: regular K-12 education teachers, art, music, physical education, technology, remedial, gifted, mathematics, reading, special education, and ESL
teachers. Not included in the calculation are: teacher aides, guidance counselors or librarians.
To calculate each school’s average salary, the salaries of each teacher who works in the school were summed and divided by the FTE total of all
teachers (full-time and part-time) in the school.
095 Westmoreland County Public Schools 310 WASHINGTON DISTRICT ELEM 41,988.00
096 Wise County Public Schools 1000 CENTRAL HIGH 44,882.60
096 Wise County Public Schools 1010 UNION HIGH 47,526.85
096 Wise County Public Schools 1012 POWELL VALLEY PRIMARY 45,624.13
096 Wise County Public Schools 1013 POWELL VALLEY MIDDLE 45,276.81
096 Wise County Public Schools 1020 WISE PRIMARY 43,136.43
096 Wise County Public Schools 20 APPALACHIA ELEM 41,750.89
096 Wise County Public Schools 320 L.F. ADDINGTON MIDDLE 43,860.54
096 Wise County Public Schools 651 COEBURN MIDDLE 42,597.90
096 Wise County Public Schools 652 EASTSIDE HIGH 47,596.44
096 Wise County Public Schools 653 COEBURN PRIMARY 43,989.45
096 Wise County Public Schools 73 J.W. ADAMS COMBINED 43,044.70
096 Wise County Public Schools 871 ST. PAUL ELEM 43,667.80
097 Wythe County Public Schools 100 MAX MEADOWS ELEM 46,302.00
097 Wythe County Public Schools 1073 FORT CHISWELL MIDDLE 47,321.00
097 Wythe County Public Schools 1074 RURAL RETREAT MIDDLE 43,326.00
097 Wythe County Public Schools 1075 SCOTT MEMORIAL MIDDLE 45,006.00
097 Wythe County Public Schools 190 SPILLER ELEM 46,799.00
097 Wythe County Public Schools 201 RURAL RETREAT ELEM 46,499.00
097 Wythe County Public Schools 202 RURAL RETREAT HIGH 47,177.00
097 Wythe County Public Schools 440 SPEEDWELL ELEM 45,674.00
097 Wythe County Public Schools 721 GEORGE WYTHE HIGH 45,839.00
097 Wythe County Public Schools 730 JACKSON MEMORIAL ELEM 44,894.00
097 Wythe County Public Schools 740 SHEFFEY ELEM 44,805.00
097 Wythe County Public Schools 760 FORT CHISWELL HIGH 46,064.00
098 York County Public Schools 10 MAGRUDER ELEM 50,563.56
098 York County Public Schools 140 GRAFTON BETHEL ELEM 52,686.80
098 York County Public Schools 160 DARE ELEM 49,381.19
098 York County Public Schools 170 SEAFORD ELEM 49,109.03
098 York County Public Schools 180 BETHEL MANOR ELEM 46,628.85
098 York County Public Schools 190 TABB MIDDLE 49,434.62
098 York County Public Schools 20 BRUTON HIGH 48,210.79
098 York County Public Schools 200 QUEENS LAKE MIDDLE 48,679.13
098 York County Public Schools 210 YORKTOWN ELEM 50,686.93
098 York County Public Schools 220 WALLER MILL ELEM 47,333.14
098 York County Public Schools 230 TABB HIGH 50,201.79
098 York County Public Schools 30 YORK HIGH 49,756.13
098 York County Public Schools 332 GRAFTON HIGH 48,955.53
098 York County Public Schools 333 GRAFTON MIDDLE 48,916.38
098 York County Public Schools 335 YORK RIVER ACADEMY 46,258.13
098 York County Public Schools 50 TABB ELEM 49,741.24
098 York County Public Schools 60 YORKTOWN MIDDLE 48,973.22
098 York County Public Schools 80 MT. VERNON ELEM 50,062.44
098 York County Public Schools 90 COVENTRY ELEM 50,658.37
101 Alexandria City Public Schools 100 GEORGE MASON ELEM 69,328.00
101 Alexandria City Public Schools 110 DOUGLAS MACARTHUR ELEM 76,977.00
101 Alexandria City Public Schools 120 CHARLES BARRETT ELEM 70,950.00
101 Alexandria City Public Schools 130 GEORGE WASHINGTON MIDDLE 71,782.00
101 Alexandria City Public Schools 140 FRANCIS C. HAMMOND MIDDLE 73,903.00
101 Alexandria City Public Schools 160 CORA KELLY MAGNET ELEM 61,252.00
101 Alexandria City Public Schools 190 WILLIAM RAMSAY ELEM 67,859.00
101 Alexandria City Public Schools 210 TC WILLIAMS HIGH 74,695.00
101 Alexandria City Public Schools 220 JAMES K POLK ELEM 72,871.00
FY 2015 Salary Survey - Avg Teacher Salary by School
January 14, 2015
Page 51

Division Name
School
Number School Name
Average
2014-2015
Salary
Virginia Department of Education
Average Teacher Salaries by School for School Year 2014-2015
The average salary calculation includes licensed elementary and secondary classroom teachers (regardless of fund source). Classroom teachers
include: regular K-12 education teachers, art, music, physical education, technology, remedial, gifted, mathematics, reading, special education, and ESL
teachers. Not included in the calculation are: teacher aides, guidance counselors or librarians.
To calculate each school’s average salary, the salaries of each teacher who works in the school were summed and divided by the FTE total of all
teachers (full-time and part-time) in the school.
101 Alexandria City Public Schools 230 JOHN ADAMS ELEM 68,134.00
101 Alexandria City Public Schools 30 MOUNT VERNON ELEM 70,545.00
101 Alexandria City Public Schools 333 SAMUEL W TUCKER ELEM 79,899.00
101 Alexandria City Public Schools 50 PATRICK HENRY ELEM 65,540.00
101 Alexandria City Public Schools 60 MAURY ELEM 71,710.00
101 Alexandria City Public Schools 80 LYLES-CROUCH ELEM 79,406.00
101 Alexandria City Public Schools 90 JEFFERSON-HOUSTON ELEM 75,085.00
102 Bristol City Public Schools 10 VIRGINIA MIDDLE 42,781.21
102 Bristol City Public Schools 100 JOSEPH VAN PELT ELEM 44,355.46
102 Bristol City Public Schools 60 HIGHLAND VIEW ELEM 39,766.84
102 Bristol City Public Schools 70 STONEWALL JACKSON ELEM 41,771.60
102 Bristol City Public Schools 80 VIRGINIA HIGH 44,533.01
102 Bristol City Public Schools 90 WASHINGTON LEE ELEM 44,176.89
103 Buena Vista City Public Schools 40 ENDERLY HEIGHTS ELEM 38,367.00
103 Buena Vista City Public Schools 61 PARRY MCCLUER MIDDLE 43,432.00
103 Buena Vista City Public Schools 62 PARRY MCCLUER HIGH 44,208.00
103 Buena Vista City Public Schools 70 FW KLING JR ELEM 43,555.00
104 Charlottesville City Public Schools 10 JOHNSON ELEM 53,157.45
104 Charlottesville City Public Schools 100 BUFORD MIDDLE 55,976.62
104 Charlottesville City Public Schools 110 WALKER UPPER ELEM 54,857.50
104 Charlottesville City Public Schools 120 JACKSON-VIA ELEM 54,888.40
104 Charlottesville City Public Schools 140 CHARLOTTESVILLE HIGH 56,615.31
104 Charlottesville City Public Schools 40 VENABLE ELEM 58,165.45
104 Charlottesville City Public Schools 50 CLARK ELEM 53,472.48
104 Charlottesville City Public Schools 70 BURNLEY-MORAN ELEM 55,340.10
104 Charlottesville City Public Schools 90 GREENBRIER ELEM 57,222.72
106 Colonial Heights City Public Schools 20 COLONIAL HEIGHTS MIDDLE 49,316.00
106 Colonial Heights City Public Schools 30 NORTH ELEM 49,226.00
106 Colonial Heights City Public Schools 40 COLONIAL HEIGHTS HIGH 51,092.00
106 Colonial Heights City Public Schools 50 LAKEVIEW ELEM 49,345.00
106 Colonial Heights City Public Schools 60 TUSSING ELEM 50,513.00
107 Covington City Public Schools 260 EDGEMONT PRIMARY 50,253.00
107 Covington City Public Schools 350 COVINGTON HIGH 52,587.00
107 Covington City Public Schools 360 JETER-WATSON INTERMEDIATE 50,136.00
108 Danville City Public Schools 1372 WESTWOOD MIDDLE 46,188.43
108 Danville City Public Schools 1374 GALILEO MAGNET HIGH 50,005.17
108 Danville City Public Schools 139 LANGSTON FOCUS 46,934.69
108 Danville City Public Schools 190 G.L.H. JOHNSON ELEM 45,002.14
108 Danville City Public Schools 20 FOREST HILLS ELEM 43,958.19
108 Danville City Public Schools 200 GROVE PARK PRESCHOOL 48,748.83
108 Danville City Public Schools 210 GEORGE WASHINGTON HIGH 51,216.56
108 Danville City Public Schools 220 WOODBERRY HILLS ELEM 43,560.22
108 Danville City Public Schools 250 PARK AVENUE ELEM 46,146.42
108 Danville City Public Schools 260 O. TRENT BONNER MIDDLE 43,433.32
108 Danville City Public Schools 30 THE NORTHSIDE PRESCHOOL 49,805.11
108 Danville City Public Schools 40 SCHOOLFIELD ELEM 47,964.93
108 Danville City Public Schools 490 E. A. GIBSON ELEM 45,432.81
109 Falls Church City Public Schools 240 MT. DANIEL SCHOOL 63,410.00
109 Falls Church City Public Schools 251 GEORGE MASON HIGH 73,582.00
109 Falls Church City Public Schools 252 MARY ELLEN HENDERSON MIDDLE 70,018.00
109 Falls Church City Public Schools 260 THOMAS JEFFERSON ELEM 72,567.00
109 Falls Church City Public Schools 270 JESSIE THACKREY PRESCHOOL 67,428.00
110 Fredericksburg City Public Schools 272 LAFAYETTE UPPER ELEM 52,555.14
FY 2015 Salary Survey - Avg Teacher Salary by School
January 14, 2015
Page 52

Division Name
School
Number School Name
Average
2014-2015
Salary
Virginia Department of Education
Average Teacher Salaries by School for School Year 2014-2015
The average salary calculation includes licensed elementary and secondary classroom teachers (regardless of fund source). Classroom teachers
include: regular K-12 education teachers, art, music, physical education, technology, remedial, gifted, mathematics, reading, special education, and ESL
teachers. Not included in the calculation are: teacher aides, guidance counselors or librarians.
To calculate each school’s average salary, the salaries of each teacher who works in the school were summed and divided by the FTE total of all
teachers (full-time and part-time) in the school.
110 Fredericksburg City Public Schools 273 WALKER-GRANT MIDDLE 48,257.32
110 Fredericksburg City Public Schools 30 ORIGINAL WALKER-GRANT 56,617.50
110 Fredericksburg City Public Schools 40 JAMES MONROE HIGH 55,497.02
110 Fredericksburg City Public Schools 50 HUGH MERCER ELEM 50,087.38
111 Galax City Public Schools 10 GALAX ELEM 43,247.00
111 Galax City Public Schools 31 GALAX HIGH 46,093.00
111 Galax City Public Schools 32 GALAX MIDDLE 44,336.00
112 Hampton City Public Schools 120 ARMSTRONG ELEM 45,714.00
112 Hampton City Public Schools 160 ABERDEEN ELEM 45,856.00
112 Hampton City Public Schools 180 SAMUEL P. LANGLEY ELEM 44,071.00
112 Hampton City Public Schools 210 MOTON EARLY CHILDHOOD CENTER 44,307.00
112 Hampton City Public Schools 250 JANE H. BRYAN ELEM 44,236.00
112 Hampton City Public Schools 260 ALFRED S. FORREST ELEM 46,756.00
112 Hampton City Public Schools 270 JOHN B. CARY ELEM 45,021.00
112 Hampton City Public Schools 280 HAMPTON HIGH 46,899.00
112 Hampton City Public Schools 30 FRANCIS ASBURY ELEM 46,202.00
112 Hampton City Public Schools 300 JEFFERSON DAVIS MIDDLE 46,118.00
112 Hampton City Public Schools 320 KECOUGHTAN HIGH 47,316.00
112 Hampton City Public Schools 330 BARRON ELEM 48,000.00
112 Hampton City Public Schools 350 BENJAMIN SYMS MIDDLE 45,568.00
112 Hampton City Public Schools 360 TUCKER-CAPPS ELEM 46,596.00
112 Hampton City Public Schools 370 PHILLIPS ELEM 46,175.00
112 Hampton City Public Schools 380 THOMAS EATON MIDDLE 45,970.00
112 Hampton City Public Schools 410 PAUL BURBANK ELEM 44,659.00
112 Hampton City Public Schools 420 CHRISTOPHER C. KRAFT ELEM 46,561.00
112 Hampton City Public Schools 430 BETHEL HIGH 47,528.00
112 Hampton City Public Schools 440 JOHN TYLER ELEM 46,615.00
112 Hampton City Public Schools 450 C. ALTON LINDSAY MIDDLE 45,364.00
112 Hampton City Public Schools 460 CAPTAIN JOHN SMITH ELEM 46,389.00
112 Hampton City Public Schools 470 BOOKER ELEM 47,347.00
112 Hampton City Public Schools 490 LUTHER W. MACHEN ELEM 44,855.00
112 Hampton City Public Schools 50 PHOEBUS HIGH 46,944.00
112 Hampton City Public Schools 500 A.W.E. BASSETTE ELEM 47,308.00
112 Hampton City Public Schools 510 CESAR TARRANT ELEM 45,860.00
112 Hampton City Public Schools 640 HUNTER B ANDREWS 44,449.00
112 Hampton City Public Schools 650 GEORGE P PHENIX ELEM 44,889.00
112 Hampton City Public Schools 70 FRANCIS W. JONES MAGNET MIDDLE 45,838.00
112 Hampton City Public Schools 80 WILLIAM MASON COOPER ELEM 47,154.00
113 Harrisonburg City Public Schools 110 SMITHLAND ELEM 44,981.97
113 Harrisonburg City Public Schools 111 SKYLINE MIDDLE 46,635.25
113 Harrisonburg City Public Schools 12 HARRISONBURG HIGH 47,134.02
113 Harrisonburg City Public Schools 191 STONE SPRING ELEM 46,790.59
113 Harrisonburg City Public Schools 30 WATERMAN ELEM 47,289.34
113 Harrisonburg City Public Schools 50 KEISTER ELEM 46,760.62
113 Harrisonburg City Public Schools 60 SPOTSWOOD ELEM 44,820.01
113 Harrisonburg City Public Schools 80 THOMAS HARRISON MIDDLE 47,160.53
114 Hopewell City Public Schools 110 CARTER G. WOODSON MIDDLE 49,179.00
114 Hopewell City Public Schools 120 HOPEWELL HIGH 51,964.00
114 Hopewell City Public Schools 140 HARRY E. JAMES ELEM 49,834.00
114 Hopewell City Public Schools 151 WOODLAWN PRE-SCHOOL LRNG CTR. 49,914.00
114 Hopewell City Public Schools 40 DUPONT ELEM 48,625.00
114 Hopewell City Public Schools 70 PATRICK COPELAND ELEM 49,233.00
115 Lynchburg City Public Schools 1102 HERITAGE ELEM 44,434.68
FY 2015 Salary Survey - Avg Teacher Salary by School
January 14, 2015
Page 53

Division Name
School
Number School Name
Average
2014-2015
Salary
Virginia Department of Education
Average Teacher Salaries by School for School Year 2014-2015
The average salary calculation includes licensed elementary and secondary classroom teachers (regardless of fund source). Classroom teachers
include: regular K-12 education teachers, art, music, physical education, technology, remedial, gifted, mathematics, reading, special education, and ESL
teachers. Not included in the calculation are: teacher aides, guidance counselors or librarians.
To calculate each school’s average salary, the salaries of each teacher who works in the school were summed and divided by the FTE total of all
teachers (full-time and part-time) in the school.
115 Lynchburg City Public Schools 130 HERITAGE HIGH 48,306.46
115 Lynchburg City Public Schools 170 PAUL LAURENCE DUNBAR MID. FOR INNOV. 43,135.97
115 Lynchburg City Public Schools 190 ROBERT S. PAYNE ELEM 45,942.28
115 Lynchburg City Public Schools 250 WILLIAM M. BASS ELEM 44,920.55
115 Lynchburg City Public Schools 260 E.C. GLASS HIGH 46,111.85
115 Lynchburg City Public Schools 270 PERRYMONT ELEM 43,982.34
115 Lynchburg City Public Schools 290 BEDFORD HILLS ELEM 44,833.82
115 Lynchburg City Public Schools 300 SHEFFIELD ELEM 48,142.41
115 Lynchburg City Public Schools 330 PAUL MUNRO ELEM 46,259.28
115 Lynchburg City Public Schools 340 SANDUSKY MIDDLE 47,807.95
115 Lynchburg City Public Schools 350 LINKHORNE MIDDLE 47,651.85
115 Lynchburg City Public Schools 360 LINKHORNE ELEM 45,488.25
115 Lynchburg City Public Schools 370 SANDUSKY ELEM 45,662.80
115 Lynchburg City Public Schools 70 DEARINGTON ELEM/INNOVATION 42,903.68
115 Lynchburg City Public Schools 90 T.C. MILLER ELEM FOR INNOVAT. 44,726.67
116 Martinsville City Public Schools 10 MARTINSVILLE MIDDLE 44,053.00
116 Martinsville City Public Schools 110 MARTINSVILLE HIGH 45,291.00
116 Martinsville City Public Schools 222 ALBERT HARRIS ELEM 43,686.00
116 Martinsville City Public Schools 223 PATRICK HENRY ELEM 45,091.00
116 Martinsville City Public Schools 224 CLEARVIEW EARLY CHILDHOOD CTR. 42,787.00
117 Newport News City Public Schools 1070 WARWICK HIGH 48,772.00
117 Newport News City Public Schools 1080 HILTON ELEM 51,381.00
117 Newport News City Public Schools 110 B.T. WASHINGTON MIDDLE 51,504.00
117 Newport News City Public Schools 1120 NEWSOME PARK ELEM 47,377.00
117 Newport News City Public Schools 1150 RIVERSIDE ELEM 47,865.00
117 Newport News City Public Schools 1170 CARVER ELEM 50,536.00
117 Newport News City Public Schools 1180 LEE HALL ELEM 49,001.00
117 Newport News City Public Schools 1210 HIDENWOOD ELEM 49,432.00
117 Newport News City Public Schools 1220 MENCHVILLE HIGH 50,737.00
117 Newport News City Public Schools 1230 RICHNECK ELEM 49,503.00
117 Newport News City Public Schools 1240 HORACE H. EPES ELEM 48,630.00
117 Newport News City Public Schools 1250 B.C. CHARLES ELEM 48,970.00
117 Newport News City Public Schools 1260 ETHEL M. GILDERSLEEVE MIDDLE 48,455.00
117 Newport News City Public Schools 1270 HOMER L. HINES MIDDLE 47,859.00
117 Newport News City Public Schools 1290 KILN CREEK ELEM 47,111.00
117 Newport News City Public Schools 130 MAGRUDER ELEM 50,242.00
117 Newport News City Public Schools 1393 CRITTENDEN MIDDLE 47,482.00
117 Newport News City Public Schools 1395 HERITAGE HIGH 51,481.00
117 Newport News City Public Schools 1396 WOODSIDE HIGH 49,050.00
117 Newport News City Public Schools 1398 DEER PARK ELEM 48,275.00
117 Newport News City Public Schools 1400 MARY PASSAGE MIDDLE 48,385.00
117 Newport News City Public Schools 1402 DENBIGH EARLY CHILDHOOD CENTER 49,045.00
117 Newport News City Public Schools 1404 ACHIEVABLE DREAM ACADEMY 47,849.00
117 Newport News City Public Schools 1405 ACHIEVABLE DREAM MIDDLE/HIGH 49,667.00
117 Newport News City Public Schools 1407 GENERAL STANFORD ELEM 46,583.00
117 Newport News City Public Schools 1408 GATEWOOD ACADEMY 51,114.00
117 Newport News City Public Schools 1409 LEE HALL EARLY CHILDHOOD CENTER 46,869.00
117 Newport News City Public Schools 1410 WATKINS EARLY CHILDHOOD CENTER 49,264.00
117 Newport News City Public Schools 1411 JOHN MARSHALL EARLY CHILDHOOD CTR 48,574.00
117 Newport News City Public Schools 150 OLIVER C. GREENWOOD ELEM 47,471.00
117 Newport News City Public Schools 20 J.M. DOZIER MIDDLE 49,277.00
117 Newport News City Public Schools 200 L.F. PALMER ELEM 47,593.00
117 Newport News City Public Schools 250 SEDGEFIELD ELEM 48,720.00
FY 2015 Salary Survey - Avg Teacher Salary by School
January 14, 2015
Page 54
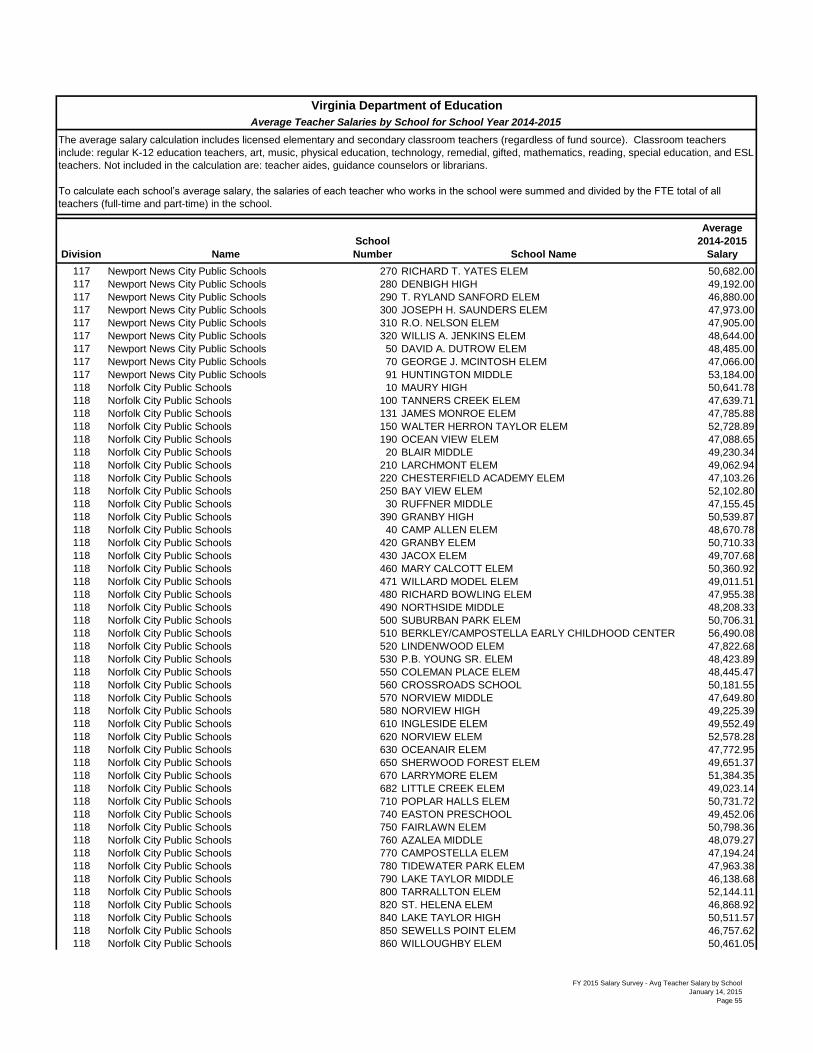
Division Name
School
Number School Name
Average
2014-2015
Salary
Virginia Department of Education
Average Teacher Salaries by School for School Year 2014-2015
The average salary calculation includes licensed elementary and secondary classroom teachers (regardless of fund source). Classroom teachers
include: regular K-12 education teachers, art, music, physical education, technology, remedial, gifted, mathematics, reading, special education, and ESL
teachers. Not included in the calculation are: teacher aides, guidance counselors or librarians.
To calculate each school’s average salary, the salaries of each teacher who works in the school were summed and divided by the FTE total of all
teachers (full-time and part-time) in the school.
117 Newport News City Public Schools 270 RICHARD T. YATES ELEM 50,682.00
117 Newport News City Public Schools 280 DENBIGH HIGH 49,192.00
117 Newport News City Public Schools 290 T. RYLAND SANFORD ELEM 46,880.00
117 Newport News City Public Schools 300 JOSEPH H. SAUNDERS ELEM 47,973.00
117 Newport News City Public Schools 310 R.O. NELSON ELEM 47,905.00
117 Newport News City Public Schools 320 WILLIS A. JENKINS ELEM 48,644.00
117 Newport News City Public Schools 50 DAVID A. DUTROW ELEM 48,485.00
117 Newport News City Public Schools 70 GEORGE J. MCINTOSH ELEM 47,066.00
117 Newport News City Public Schools 91 HUNTINGTON MIDDLE 53,184.00
118 Norfolk City Public Schools 10 MAURY HIGH 50,641.78
118 Norfolk City Public Schools 100 TANNERS CREEK ELEM 47,639.71
118 Norfolk City Public Schools 131 JAMES MONROE ELEM 47,785.88
118 Norfolk City Public Schools 150 WALTER HERRON TAYLOR ELEM 52,728.89
118 Norfolk City Public Schools 190 OCEAN VIEW ELEM 47,088.65
118 Norfolk City Public Schools 20 BLAIR MIDDLE 49,230.34
118 Norfolk City Public Schools 210 LARCHMONT ELEM 49,062.94
118 Norfolk City Public Schools 220 CHESTERFIELD ACADEMY ELEM 47,103.26
118 Norfolk City Public Schools 250 BAY VIEW ELEM 52,102.80
118 Norfolk City Public Schools 30 RUFFNER MIDDLE 47,155.45
118 Norfolk City Public Schools 390 GRANBY HIGH 50,539.87
118 Norfolk City Public Schools 40 CAMP ALLEN ELEM 48,670.78
118 Norfolk City Public Schools 420 GRANBY ELEM 50,710.33
118 Norfolk City Public Schools 430 JACOX ELEM 49,707.68
118 Norfolk City Public Schools 460 MARY CALCOTT ELEM 50,360.92
118 Norfolk City Public Schools 471 WILLARD MODEL ELEM 49,011.51
118 Norfolk City Public Schools 480 RICHARD BOWLING ELEM 47,955.38
118 Norfolk City Public Schools 490 NORTHSIDE MIDDLE 48,208.33
118 Norfolk City Public Schools 500 SUBURBAN PARK ELEM 50,706.31
118 Norfolk City Public Schools 510 BERKLEY/CAMPOSTELLA EARLY CHILDHOOD CENTER 56,490.08
118 Norfolk City Public Schools 520 LINDENWOOD ELEM 47,822.68
118 Norfolk City Public Schools 530 P.B. YOUNG SR. ELEM 48,423.89
118 Norfolk City Public Schools 550 COLEMAN PLACE ELEM 48,445.47
118 Norfolk City Public Schools 560 CROSSROADS SCHOOL 50,181.55
118 Norfolk City Public Schools 570 NORVIEW MIDDLE 47,649.80
118 Norfolk City Public Schools 580 NORVIEW HIGH 49,225.39
118 Norfolk City Public Schools 610 INGLESIDE ELEM 49,552.49
118 Norfolk City Public Schools 620 NORVIEW ELEM 52,578.28
118 Norfolk City Public Schools 630 OCEANAIR ELEM 47,772.95
118 Norfolk City Public Schools 650 SHERWOOD FOREST ELEM 49,651.37
118 Norfolk City Public Schools 670 LARRYMORE ELEM 51,384.35
118 Norfolk City Public Schools 682 LITTLE CREEK ELEM 49,023.14
118 Norfolk City Public Schools 710 POPLAR HALLS ELEM 50,731.72
118 Norfolk City Public Schools 740 EASTON PRESCHOOL 49,452.06
118 Norfolk City Public Schools 750 FAIRLAWN ELEM 50,798.36
118 Norfolk City Public Schools 760 AZALEA MIDDLE 48,079.27
118 Norfolk City Public Schools 770 CAMPOSTELLA ELEM 47,194.24
118 Norfolk City Public Schools 780 TIDEWATER PARK ELEM 47,963.38
118 Norfolk City Public Schools 790 LAKE TAYLOR MIDDLE 46,138.68
118 Norfolk City Public Schools 800 TARRALLTON ELEM 52,144.11
118 Norfolk City Public Schools 820 ST. HELENA ELEM 46,868.92
118 Norfolk City Public Schools 840 LAKE TAYLOR HIGH 50,511.57
118 Norfolk City Public Schools 850 SEWELLS POINT ELEM 46,757.62
118 Norfolk City Public Schools 860 WILLOUGHBY ELEM 50,461.05
FY 2015 Salary Survey - Avg Teacher Salary by School
January 14, 2015
Page 55

Division Name
School
Number School Name
Average
2014-2015
Salary
Virginia Department of Education
Average Teacher Salaries by School for School Year 2014-2015
The average salary calculation includes licensed elementary and secondary classroom teachers (regardless of fund source). Classroom teachers
include: regular K-12 education teachers, art, music, physical education, technology, remedial, gifted, mathematics, reading, special education, and ESL
teachers. Not included in the calculation are: teacher aides, guidance counselors or librarians.
To calculate each school’s average salary, the salaries of each teacher who works in the school were summed and divided by the FTE total of all
teachers (full-time and part-time) in the school.
118 Norfolk City Public Schools 880 BOOKER T. WASHINGTON HIGH 48,635.11
118 Norfolk City Public Schools 90 GHENT SCHOOL 49,512.20
119 Norton City Public Schools 20 J.I. BURTON HIGH 41,820.95
119 Norton City Public Schools 40 NORTON ELEM 40,709.57
120 Petersburg City Public Schools 110 A.P. HILL ELEM 48,390.02
120 Petersburg City Public Schools 121 PEABODY MIDDLE 51,625.76
120 Petersburg City Public Schools 130 WALNUT HILL ELEM 44,922.69
120 Petersburg City Public Schools 160 WESTVIEW EARLY CHILDHOOD ED. CTR. 45,593.33
120 Petersburg City Public Schools 170 ROBERT E. LEE ELEM 46,326.86
120 Petersburg City Public Schools 180 J.E.B. STUART ELEM 46,806.90
120 Petersburg City Public Schools 200 PETERSBURG HIGH 48,653.85
120 Petersburg City Public Schools 211 VERNON JOHNS JR. HIGH 46,627.13
121 Portsmouth City Public Schools 1130 CRADOCK MIDDLE 47,440.04
121 Portsmouth City Public Schools 1400 JAMES HURST ELEM 53,373.69
121 Portsmouth City Public Schools 160 CHURCHLAND PRIMARY & INTERMEDIATE 49,574.83
121 Portsmouth City Public Schools 1630 HODGES MANOR ELEM 54,471.24
121 Portsmouth City Public Schools 1650 LAKEVIEW ELEM 50,676.21
121 Portsmouth City Public Schools 1660 WOODROW WILSON HIGH 52,920.66
121 Portsmouth City Public Schools 1766 BRIGHTON ELEM 48,932.48
121 Portsmouth City Public Schools 1767 EMILY SPONG PRESCHOOL CENTER 53,312.24
121 Portsmouth City Public Schools 1768 MOUNT HERMON PRESCHOOL CENTER 54,232.25
121 Portsmouth City Public Schools 1769 VICTORY ELEM 49,869.86
121 Portsmouth City Public Schools 1770 OLIVE BRANCH PRESCHOOL CTR 50,318.68
121 Portsmouth City Public Schools 190 DOUGLASS PARK ELEM 51,453.61
121 Portsmouth City Public Schools 210 WESTHAVEN ELEM 48,282.62
121 Portsmouth City Public Schools 230 JOHN TYLER ELEM 51,999.64
121 Portsmouth City Public Schools 240 I.C. NORCOM HIGH 52,386.94
121 Portsmouth City Public Schools 290 SIMONSDALE ELEM 50,972.03
121 Portsmouth City Public Schools 310 WM. E. WATERS MIDDLE 51,067.09
121 Portsmouth City Public Schools 320 CHURCHLAND MIDDLE 50,065.23
121 Portsmouth City Public Schools 321 CHURCHLAND ACADEMY ELEM 50,764.04
121 Portsmouth City Public Schools 322 CHURCHLAND PRESCHOOL CTR 52,594.06
121 Portsmouth City Public Schools 500 CHURCHLAND HIGH 52,812.07
121 Portsmouth City Public Schools 60 PARK VIEW ELEM 50,683.14
121 Portsmouth City Public Schools 650 CHURCHLAND ELEM 51,696.27
122 Radford City Public Schools 10 BELLE HETH ELEM 43,895.50
122 Radford City Public Schools 20 MCHARG ELEM 47,981.08
122 Radford City Public Schools 41 RADFORD HIGH 49,753.87
122 Radford City Public Schools 42 JOHN N. DALTON INT. 49,688.25
123 Richmond City Public Schools 100 BELLEVUE ELEM 47,167.22
123 Richmond City Public Schools 1080 ELKHARDT MIDDLE 49,526.86
123 Richmond City Public Schools 1100 BROAD ROCK ELEM 47,703.51
123 Richmond City Public Schools 130 OVERBY-SHEPPARD ELEM 49,726.66
123 Richmond City Public Schools 1400 ELIZABETH D. REDD ELEM 48,270.49
123 Richmond City Public Schools 1440 E.S.H. GREENE ELEM 49,052.04
123 Richmond City Public Schools 1470 G.H. REID ELEM 47,756.77
123 Richmond City Public Schools 1480 SOUTHAMPTON ELEM 51,577.14
123 Richmond City Public Schools 1510 HUGUENOT HIGH 53,126.58
123 Richmond City Public Schools 1630 FRED D. THOMPSON MIDDLE 49,862.04
123 Richmond City Public Schools 1640 J.B. FISHER ELEM 49,524.50
123 Richmond City Public Schools 170 BLACKWELL ELEM 49,055.54
123 Richmond City Public Schools 1710 J.L. FRANCIS ELEM 47,869.45
123 Richmond City Public Schools 20 THOMAS JEFFERSON HIGH 51,806.21
FY 2015 Salary Survey - Avg Teacher Salary by School
January 14, 2015
Page 56

Division Name
School
Number School Name
Average
2014-2015
Salary
Virginia Department of Education
Average Teacher Salaries by School for School Year 2014-2015
The average salary calculation includes licensed elementary and secondary classroom teachers (regardless of fund source). Classroom teachers
include: regular K-12 education teachers, art, music, physical education, technology, remedial, gifted, mathematics, reading, special education, and ESL
teachers. Not included in the calculation are: teacher aides, guidance counselors or librarians.
To calculate each school’s average salary, the salaries of each teacher who works in the school were summed and divided by the FTE total of all
teachers (full-time and part-time) in the school.
123 Richmond City Public Schools 200 WILLIAM FOX ELEM 48,747.45
123 Richmond City Public Schools 210 SWANSBORO ELEM 46,061.99
123 Richmond City Public Schools 230 GINTER PARK ELEM 51,600.21
123 Richmond City Public Schools 290 GEORGE MASON ELEM 49,161.48
123 Richmond City Public Schools 30 ALBERT HILL MIDDLE 49,605.63
123 Richmond City Public Schools 3105 LUCILLE M. BROWN MIDDLE 47,682.20
123 Richmond City Public Schools 3106 LINWOOD HOLTON ELEM 49,665.90
123 Richmond City Public Schools 3107 MILES JONES ELEM 49,938.15
123 Richmond City Public Schools 311 GEORGE W. CARVER ELEM 48,845.63
123 Richmond City Public Schools 3110 RICHMOND ALTERNATIVE 50,663.16
123 Richmond City Public Schools 3119 PATRICK HENRY SCHOOL OF SCIENCE AND ARTS 44,888.73
123 Richmond City Public Schools 3200 RICHMOND CAREER EDUCATION & EMPLOYMENT (CHARTER SCHOOL)43,659.84
123 Richmond City Public Schools 330 OAK GROVE/BELLEMEADE ELEM 48,384.60
123 Richmond City Public Schools 390 J.E.B. STUART ELEM 49,682.73
123 Richmond City Public Schools 452 RICHMOND COMMUNITY HIGH 53,491.55
123 Richmond City Public Schools 470 HENDERSON MIDDLE 47,525.56
123 Richmond City Public Schools 480 THOMAS C. BOUSHALL MIDDLE 48,702.86
123 Richmond City Public Schools 50 BINFORD MIDDLE 50,657.14
123 Richmond City Public Schools 580 MARY MUNFORD ELEM 53,534.01
123 Richmond City Public Schools 600 JOHN B. CARY ELEM 51,403.06
123 Richmond City Public Schools 621 FRANKLIN MILITARY ACADEMY 48,701.38
123 Richmond City Public Schools 650 WOODVILLE ELEM 47,402.90
123 Richmond City Public Schools 660 WESTOVER HILLS ELEM 48,569.47
123 Richmond City Public Schools 690 MAYMONT PRE-K CENTER 54,469.44
123 Richmond City Public Schools 710 FAIRFIELD COURT ELEM 49,260.95
123 Richmond City Public Schools 730 JOHN MARSHALL HIGH 48,333.35
123 Richmond City Public Schools 741 GEORGE WYTHE HIGH 49,756.63
123 Richmond City Public Schools 750 AMELIA STREET SP. ED. 51,825.09
123 Richmond City Public Schools 770 MARTIN LUTHER KING JR. MIDDLE 48,363.36
123 Richmond City Public Schools 830 CHIMBORAZO ELEM 46,306.75
123 Richmond City Public Schools 850 ARMSTRONG HIGH 50,742.61
123 Richmond City Public Schools 90 OPEN HIGH 52,894.43
124 Roanoke City Public Schools 110 HIGHLAND PARK ELEM 46,542.11
124 Roanoke City Public Schools 150 WOODROW WILSON MIDDLE 48,263.24
124 Roanoke City Public Schools 20 CRYSTAL SPRING ELEM 48,398.46
124 Roanoke City Public Schools 210 BRECKINRIDGE MIDDLE 44,462.33
124 Roanoke City Public Schools 220 ROANOKE ACADEMY FOR MATH & SCIENCE ELEM 43,748.51
124 Roanoke City Public Schools 230 STONEWALL JACKSON MIDDLE 44,972.16
124 Roanoke City Public Schools 240 PRESTON PARK ELEM 47,602.15
124 Roanoke City Public Schools 280 LUCY ADDISON AEROSPACE MAGNET MIDDLE 43,913.17
124 Roanoke City Public Schools 300 GARDEN CITY ELEM 43,629.83
124 Roanoke City Public Schools 310 GRANDIN COURT ELEM 46,574.35
124 Roanoke City Public Schools 320 ROUND HILL ELEM 43,855.31
124 Roanoke City Public Schools 340 LINCOLN TERRACE ELEM 44,808.61
124 Roanoke City Public Schools 350 WESTSIDE ELEM 43,775.76
124 Roanoke City Public Schools 370 MONTEREY ELEM 43,432.20
124 Roanoke City Public Schools 380 FISHBURN PARK ELEM 45,778.59
124 Roanoke City Public Schools 390 PATRICK HENRY HIGH 49,202.89
124 Roanoke City Public Schools 400 WILLIAM FLEMING HIGH 46,575.89
124 Roanoke City Public Schools 410 FAIRVIEW ELEM 48,308.55
124 Roanoke City Public Schools 420 HURT PARK ELEM 46,918.05
124 Roanoke City Public Schools 450 JAMES MADISON MIDDLE 43,707.25
124 Roanoke City Public Schools 50 FALLON PARK ELEM 47,336.29
FY 2015 Salary Survey - Avg Teacher Salary by School
January 14, 2015
Page 57

Division Name
School
Number School Name
Average
2014-2015
Salary
Virginia Department of Education
Average Teacher Salaries by School for School Year 2014-2015
The average salary calculation includes licensed elementary and secondary classroom teachers (regardless of fund source). Classroom teachers
include: regular K-12 education teachers, art, music, physical education, technology, remedial, gifted, mathematics, reading, special education, and ESL
teachers. Not included in the calculation are: teacher aides, guidance counselors or librarians.
To calculate each school’s average salary, the salaries of each teacher who works in the school were summed and divided by the FTE total of all
teachers (full-time and part-time) in the school.
124 Roanoke City Public Schools 60 MORNINGSIDE ELEM 45,454.74
124 Roanoke City Public Schools 70 VIRGINIA HEIGHTS ELEM 46,242.43
124 Roanoke City Public Schools 90 WASENA ELEM 46,388.72
126 Staunton City Public Schools 110 SHELBURNE MIDDLE 44,824.46
126 Staunton City Public Schools 30 ROBERT E. LEE HIGH 45,003.58
126 Staunton City Public Schools 40 A. R. WARE ELEM 43,678.17
126 Staunton City Public Schools 41 STAUNTON PRESCHOOL PROGRAMS 45,304.29
126 Staunton City Public Schools 70 BESSIE WELLER ELEM 45,450.22
126 Staunton City Public Schools 90 THOMAS C. MCSWAIN ELEM 45,988.69
127 Suffolk City Public Schools 210 ELEPHANT'S FORK ELEM 47,386.13
127 Suffolk City Public Schools 220 NANSEMOND PARKWAY ELEM 48,713.47
127 Suffolk City Public Schools 230 KILBY SHORES ELEM 52,886.38
127 Suffolk City Public Schools 240 NANSEMOND RIVER HIGH 48,998.98
127 Suffolk City Public Schools 300 LAKELAND HIGH 48,785.54
127 Suffolk City Public Schools 330 MACK BENN JR. ELEM 48,818.48
127 Suffolk City Public Schools 370 JOHN F. KENNEDY MIDDLE 48,072.67
127 Suffolk City Public Schools 380 JOHN YEATES MIDDLE 48,955.14
127 Suffolk City Public Schools 390 FOREST GLEN MIDDLE 48,237.58
127 Suffolk City Public Schools 391 NORTHERN SHORES ELEM 48,768.13
127 Suffolk City Public Schools 393 KING`S FORK MIDDLE 50,908.06
127 Suffolk City Public Schools 395 KING`S FORK HIGH 47,140.63
127 Suffolk City Public Schools 440 CREEKSIDE ELEM 45,230.62
127 Suffolk City Public Schools 450 HILLPOINT ELEM 47,694.43
127 Suffolk City Public Schools 47 PIONEER ELEM 48,983.92
127 Suffolk City Public Schools 50 BOOKER T. WASHINGTON ELEM 49,363.03
127 Suffolk City Public Schools 70 OAKLAND ELEM 47,800.63
127 Suffolk City Public Schools 80 DRIVER ELEM 49,123.00
127 Suffolk City Public Schools 90 FLORENCE BOWSER ELEM 48,081.91
128 Virginia Beach City Public Schools 10 GREEN RUN HIGH 53,225.00
128 Virginia Beach City Public Schools 100 THREE OAKS ELEM 56,206.00
128 Virginia Beach City Public Schools 1020 NEW CASTLE ELEM 54,570.00
128 Virginia Beach City Public Schools 1030 LANDSTOWN HIGH 55,224.00
128 Virginia Beach City Public Schools 1041 CORPORATE LANDING ELEM 53,602.00
128 Virginia Beach City Public Schools 1050 GREEN RUN COLLEGIATE 51,414.00
128 Virginia Beach City Public Schools 106 DIAMOND SPRINGS ELEM 50,529.00
128 Virginia Beach City Public Schools 115 BAYSIDE 6TH GRADE CAMPUS 47,443.00
128 Virginia Beach City Public Schools 130 W.T. COOKE ELEM 53,468.00
128 Virginia Beach City Public Schools 140 VIRGINIA BEACH MIDDLE 52,218.00
128 Virginia Beach City Public Schools 20 WHITE OAKS ELEM 54,157.00
128 Virginia Beach City Public Schools 230 CREEDS ELEM 56,038.00
128 Virginia Beach City Public Schools 280 BAYSIDE ELEM 52,449.00
128 Virginia Beach City Public Schools 290 SEATACK ELEM AN ACHIEVABLE DREAM ACADEMY 55,964.00
128 Virginia Beach City Public Schools 30 FRANK W. COX HIGH 55,545.00
128 Virginia Beach City Public Schools 300 SHELTON PARK ELEM 49,935.00
128 Virginia Beach City Public Schools 321 PRINCESS ANNE HIGH 56,035.00
128 Virginia Beach City Public Schools 330 LINKHORN PARK ELEM 54,217.00
128 Virginia Beach City Public Schools 340 PRINCESS ANNE ELEM 53,111.00
128 Virginia Beach City Public Schools 350 THALIA ELEM 53,847.00
128 Virginia Beach City Public Schools 360 JOHN B. DEY ELEM 51,811.00
128 Virginia Beach City Public Schools 390 WOODSTOCK ELEM 54,362.00
128 Virginia Beach City Public Schools 40 CENTERVILLE ELEM 52,780.00
128 Virginia Beach City Public Schools 400 THOROUGHGOOD ELEM 51,519.00
128 Virginia Beach City Public Schools 410 KEMPSVILLE MEADOWS ELEM 55,973.00
FY 2015 Salary Survey - Avg Teacher Salary by School
January 14, 2015
Page 58

Division Name
School
Number School Name
Average
2014-2015
Salary
Virginia Department of Education
Average Teacher Salaries by School for School Year 2014-2015
The average salary calculation includes licensed elementary and secondary classroom teachers (regardless of fund source). Classroom teachers
include: regular K-12 education teachers, art, music, physical education, technology, remedial, gifted, mathematics, reading, special education, and ESL
teachers. Not included in the calculation are: teacher aides, guidance counselors or librarians.
To calculate each school’s average salary, the salaries of each teacher who works in the school were summed and divided by the FTE total of all
teachers (full-time and part-time) in the school.
128 Virginia Beach City Public Schools 420 KING'S GRANT ELEM 55,495.00
128 Virginia Beach City Public Schools 430 GREAT NECK MIDDLE 53,607.00
128 Virginia Beach City Public Schools 440 FLOYD KELLAM HIGH 56,009.00
128 Virginia Beach City Public Schools 450 KEMPSVILLE ELEM 55,311.00
128 Virginia Beach City Public Schools 460 LUXFORD ELEM 52,409.00
128 Virginia Beach City Public Schools 470 WILLIAMS ELEM 49,105.00
128 Virginia Beach City Public Schools 490 PEMBROKE ELEM 54,131.00
128 Virginia Beach City Public Schools 50 SALEM MIDDLE 55,266.00
128 Virginia Beach City Public Schools 500 MALIBU ELEM 51,778.00
128 Virginia Beach City Public Schools 510 TRANTWOOD ELEM 55,400.00
128 Virginia Beach City Public Schools 520 LYNNHAVEN ELEM 53,909.00
128 Virginia Beach City Public Schools 530 BAYSIDE HIGH 53,660.00
128 Virginia Beach City Public Schools 540 HERMITAGE ELEM 54,641.00
128 Virginia Beach City Public Schools 550 ARROWHEAD ELEM 54,707.00
128 Virginia Beach City Public Schools 560 WINDSOR WOODS ELEM 53,356.00
128 Virginia Beach City Public Schools 580 KINGSTON ELEM 54,905.00
128 Virginia Beach City Public Schools 590 ALANTON ELEM 55,638.00
128 Virginia Beach City Public Schools 60 BIRDNECK ELEM 55,547.00
128 Virginia Beach City Public Schools 600 HOLLAND ELEM 51,559.00
128 Virginia Beach City Public Schools 610 FIRST COLONIAL HIGH 53,860.00
128 Virginia Beach City Public Schools 620 KEMPSVILLE HIGH 54,883.00
128 Virginia Beach City Public Schools 630 BROOKWOOD ELEM 50,437.00
128 Virginia Beach City Public Schools 640 PLAZA MIDDLE 51,445.00
128 Virginia Beach City Public Schools 660 PEMBROKE MEADOWS ELEM 52,095.00
128 Virginia Beach City Public Schools 670 WINDSOR OAKS ELEM 52,242.00
128 Virginia Beach City Public Schools 680 POINT O' VIEW ELEM 52,820.00
128 Virginia Beach City Public Schools 690 KEMPSVILLE MIDDLE 54,379.00
128 Virginia Beach City Public Schools 692 PROVIDENCE ELEM 51,556.00
128 Virginia Beach City Public Schools 700 BAYSIDE MIDDLE 49,580.00
128 Virginia Beach City Public Schools 710 NEWTOWN ELEM 49,560.00
128 Virginia Beach City Public Schools 720 COLLEGE PARK ELEM 49,591.00
128 Virginia Beach City Public Schools 730 LYNNHAVEN MIDDLE 54,383.00
128 Virginia Beach City Public Schools 740 INDEPENDENCE MIDDLE 52,316.00
128 Virginia Beach City Public Schools 750 PRINCESS ANNE MIDDLE 54,493.00
128 Virginia Beach City Public Schools 760 NORTH LANDING ELEM 55,829.00
128 Virginia Beach City Public Schools 770 GREEN RUN ELEM 54,510.00
128 Virginia Beach City Public Schools 780 FAIRFIELD ELEM 54,947.00
128 Virginia Beach City Public Schools 790 BRANDON MIDDLE 56,189.00
128 Virginia Beach City Public Schools 80 KEMPS LANDING/OLD DONATION SCHOOL 56,580.00
128 Virginia Beach City Public Schools 800 INDIAN LAKES ELEM 52,942.00
128 Virginia Beach City Public Schools 810 ROSEMONT ELEM 49,986.00
128 Virginia Beach City Public Schools 820 PARKWAY ELEM 54,602.69
128 Virginia Beach City Public Schools 830 SALEM ELEM 54,602.67
128 Virginia Beach City Public Schools 840 ROSEMONT FOREST ELEM 58,314.00
128 Virginia Beach City Public Schools 850 SALEM HIGH 52,841.00
128 Virginia Beach City Public Schools 870 GLENWOOD ELEM 53,183.00
128 Virginia Beach City Public Schools 880 OCEAN LAKES ELEM 53,845.00
128 Virginia Beach City Public Schools 900 RED MILL ELEM 55,473.00
128 Virginia Beach City Public Schools 910 TALLWOOD ELEM 54,532.00
128 Virginia Beach City Public Schools 920 TALLWOOD HIGH 51,720.00
128 Virginia Beach City Public Schools 931 LANDSTOWN MIDDLE 55,304.00
128 Virginia Beach City Public Schools 932 LANDSTOWN ELEM 53,475.00
128 Virginia Beach City Public Schools 940 STRAWBRIDGE ELEM 53,849.00
FY 2015 Salary Survey - Avg Teacher Salary by School
January 14, 2015
Page 59

Division Name
School
Number School Name
Average
2014-2015
Salary
Virginia Department of Education
Average Teacher Salaries by School for School Year 2014-2015
The average salary calculation includes licensed elementary and secondary classroom teachers (regardless of fund source). Classroom teachers
include: regular K-12 education teachers, art, music, physical education, technology, remedial, gifted, mathematics, reading, special education, and ESL
teachers. Not included in the calculation are: teacher aides, guidance counselors or librarians.
To calculate each school’s average salary, the salaries of each teacher who works in the school were summed and divided by the FTE total of all
teachers (full-time and part-time) in the school.
128 Virginia Beach City Public Schools 960 OCEAN LAKES HIGH 53,726.00
128 Virginia Beach City Public Schools 970 LARKSPUR MIDDLE 53,593.00
128 Virginia Beach City Public Schools 980 CORPORATE LANDING MIDDLE 56,920.00
128 Virginia Beach City Public Schools 990 CHRISTOPHER FARMS ELEM 55,950.00
130 Waynesboro City Public Schools 580 WENONAH ELEM 43,669.00
130 Waynesboro City Public Schools 600 WAYNESBORO HIGH 47,792.00
130 Waynesboro City Public Schools 620 WAYNE HILLS CTR 53,333.00
130 Waynesboro City Public Schools 630 WESTWOOD HILLS ELEM 47,015.00
130 Waynesboro City Public Schools 640 KATE COLLINS MIDDLE 47,649.00
130 Waynesboro City Public Schools 650 BERKELEY GLENN ELEM 48,839.00
130 Waynesboro City Public Schools 751 WILLIAM PERRY ELEM 45,113.00
131 Williamsburg-James City County Public Schools 10 MATTHEW WHALEY ELEM 48,386.00
131 Williamsburg-James City County Public Schools 100 TOANO MIDDLE 50,190.00
131 Williamsburg-James City County Public Schools 190 J BLAINE BLAYTON ELEM 48,904.00
131 Williamsburg-James City County Public Schools 191 LOIS HORNSBY MIDDLE 51,463.00
131 Williamsburg-James City County Public Schools 201 JAMES RIVER ELEM 47,914.00
131 Williamsburg-James City County Public Schools 202 JAMESTOWN HIGH 51,799.00
131 Williamsburg-James City County Public Schools 203 STONEHOUSE ELEM 52,064.00
131 Williamsburg-James City County Public Schools 204 WARHILL HIGH 47,654.00
131 Williamsburg-James City County Public Schools 205 MATOAKA ELEM 52,143.00
131 Williamsburg-James City County Public Schools 40 CLARA BYRD BAKER ELEM 53,417.00
131 Williamsburg-James City County Public Schools 50 RAWLS BYRD ELEM 51,364.00
131 Williamsburg-James City County Public Schools 60 BERKELEY MIDDLE 50,121.00
131 Williamsburg-James City County Public Schools 70 NORGE ELEM 51,680.00
131 Williamsburg-James City County Public Schools 80 D.J. MONTAGUE ELEM 50,739.00
131 Williamsburg-James City County Public Schools 90 LAFAYETTE HIGH 52,687.00
132 Winchester City Public Schools 20 VIRGINIA AVE. CHARLOTTE DEHART ELEM 50,822.00
132 Winchester City Public Schools 40 JOHN HANDLEY HIGH 52,268.00
132 Winchester City Public Schools 50 GARLAND R. QUARLES ELEM 50,578.00
132 Winchester City Public Schools 60 JOHN KERR ELEM 49,162.00
132 Winchester City Public Schools 70 DANIEL MORGAN MIDDLE 50,160.00
132 Winchester City Public Schools 80 FREDERICK DOUGLASS ELEM 50,726.00
135 Franklin City Public Schools 10 S.P. MORTON ELEM 45,717.00
135 Franklin City Public Schools 20 FRANKLIN HIGH 45,954.00
135 Franklin City Public Schools 561 JOSEPH P. KING JR. MIDDLE 45,975.00
136 Chesapeake City Public Schools 10 OSCAR SMITH MIDDLE 51,009.00
136 Chesapeake City Public Schools 100 DEEP CREEK HIGH 53,705.00
136 Chesapeake City Public Schools 110 WESTERN BRANCH PRIMARY 52,037.00
136 Chesapeake City Public Schools 120 GREAT BRIDGE HIGH 52,989.00
136 Chesapeake City Public Schools 140 GREENBRIER PRIMARY 52,431.00
136 Chesapeake City Public Schools 160 NORFOLK HIGHLANDS PRIMARY 51,155.00
136 Chesapeake City Public Schools 200 RENA B WRIGHT PRIMARY 53,572.00
136 Chesapeake City Public Schools 210 DEEP CREEK ELEM 56,725.00
136 Chesapeake City Public Schools 280 HICKORY MIDDLE 53,742.00
136 Chesapeake City Public Schools 340 HICKORY ELEM 52,169.00
136 Chesapeake City Public Schools 40 THURGOOD MARSHALL ELEM 48,687.00
136 Chesapeake City Public Schools 50 GEORGE W CARVER INT 49,144.00
136 Chesapeake City Public Schools 560 CRESTWOOD MIDDLE 51,794.00
136 Chesapeake City Public Schools 590 GREAT BRIDGE MIDDLE 53,612.00
136 Chesapeake City Public Schools 600 SOUTHWESTERN ELEM 54,043.00
136 Chesapeake City Public Schools 610 DEEP CREEK MIDDLE 50,982.00
136 Chesapeake City Public Schools 620 SOUTHEASTERN ELEM 55,200.00
136 Chesapeake City Public Schools 630 B M WILLIAMS PRIMARY 53,103.00
FY 2015 Salary Survey - Avg Teacher Salary by School
January 14, 2015
Page 60

Division Name
School
Number School Name
Average
2014-2015
Salary
Virginia Department of Education
Average Teacher Salaries by School for School Year 2014-2015
The average salary calculation includes licensed elementary and secondary classroom teachers (regardless of fund source). Classroom teachers
include: regular K-12 education teachers, art, music, physical education, technology, remedial, gifted, mathematics, reading, special education, and ESL
teachers. Not included in the calculation are: teacher aides, guidance counselors or librarians.
To calculate each school’s average salary, the salaries of each teacher who works in the school were summed and divided by the FTE total of all
teachers (full-time and part-time) in the school.
136 Chesapeake City Public Schools 640 EDWIN W CHITTUM ELEM 53,872.00
136 Chesapeake City Public Schools 660 DEEP CREEK CENTRAL ELEM 51,599.00
136 Chesapeake City Public Schools 680 GREAT BRIDGE PRIMARY 54,142.00
136 Chesapeake City Public Schools 700 CRESTWOOD INTERMEDIATE 49,964.00
136 Chesapeake City Public Schools 710 INDIAN RIVER MIDDLE 54,360.00
136 Chesapeake City Public Schools 720 G A TREAKLE ELEM 52,966.00
136 Chesapeake City Public Schools 730 PORTLOCK PRIMARY 51,278.00
136 Chesapeake City Public Schools 740 WESTERN BRANCH MIDDLE 53,704.00
136 Chesapeake City Public Schools 750 SPARROW ROAD INTERMEDIATE 51,222.00
136 Chesapeake City Public Schools 770 BUTTS ROAD PRIMARY 54,138.00
136 Chesapeake City Public Schools 80 OSCAR F SMITH HIGH 51,425.00
136 Chesapeake City Public Schools 810 WESTERN BRANCH INT 52,341.00
136 Chesapeake City Public Schools 820 GEORGETOWN PRIMARY 51,787.00
136 Chesapeake City Public Schools 830 INDIAN RIVER HIGH 56,586.00
136 Chesapeake City Public Schools 840 WESTERN BRANCH HIGH 52,005.00
136 Chesapeake City Public Schools 850 GREAT BRIDGE INT 51,511.00
136 Chesapeake City Public Schools 860 BUTTS ROAD INT 53,244.00
136 Chesapeake City Public Schools 870 GREENBRIER INT. 49,752.00
136 Chesapeake City Public Schools 890 HICKORY HIGH 52,056.00
136 Chesapeake City Public Schools 90 CAMELOT ELEM 52,539.00
136 Chesapeake City Public Schools 900 CEDAR ROAD ELEM 52,051.00
136 Chesapeake City Public Schools 920 HUGO A OWENS MIDDLE 52,873.00
136 Chesapeake City Public Schools 950 GRASSFIELD ELEM 52,325.00
136 Chesapeake City Public Schools 960 GRASSFIELD HIGH 49,509.00
136 Chesapeake City Public Schools 971 TRUITT INTERMEDIATE 49,107.00
136 Chesapeake City Public Schools 972 GREENBRIER MIDDLE 54,437.00
136 Chesapeake City Public Schools 973 JOLLIFF MIDDLE 53,693.00
137 Lexington City Public Schools 1390 HARRINGTON WADDELL ELEM 54,698.00
137 Lexington City Public Schools 1440 LYLBURN DOWNING MIDDLE 56,698.00
139 Salem City Public Schools 100 ANDREW LEWIS MIDDLE 53,406.00
139 Salem City Public Schools 460 WEST SALEM ELEM 52,872.00
139 Salem City Public Schools 550 EAST SALEM ELEM 48,472.00
139 Salem City Public Schools 580 SOUTH SALEM ELEM 51,552.00
139 Salem City Public Schools 70 SALEM HIGH 51,640.00
139 Salem City Public Schools 90 G.W. CARVER ELEM 53,206.00
142 Poquoson City Public Schools 10 POQUOSON HIGH 49,139.00
142 Poquoson City Public Schools 130 POQUOSON MIDDLE 47,694.00
142 Poquoson City Public Schools 150 POQUOSON ELEM 43,959.00
142 Poquoson City Public Schools 160 POQUOSON PRIMARY 48,052.00
143 Manassas City Public Schools 10 WEEMS ELEM 56,604.00
143 Manassas City Public Schools 20 RICHARD C. HAYDON ELEM 66,788.00
143 Manassas City Public Schools 310 JENNIE DEAN ELEM 60,323.00
143 Manassas City Public Schools 370 OSBOURN HIGH 61,726.00
143 Manassas City Public Schools 470 BALDWIN ELEM 59,945.00
143 Manassas City Public Schools 60 GEORGE CARR ROUND ELEM 66,930.00
143 Manassas City Public Schools 70 GRACE E. METZ MIDDLE 63,646.00
143 Manassas City Public Schools 80 MAYFIELD INTERMEDIATE 60,632.00
144 Manassas Park City Public Schools 30 MANASSAS PARK HIGH 60,795.47
144 Manassas Park City Public Schools 31 MANASSAS PARK MIDDLE 58,544.88
144 Manassas Park City Public Schools 420 MANASSAS PARK ELEM 57,006.95
144 Manassas Park City Public Schools 522 COUGAR ELEM 58,856.56
202 Colonial Beach Public Schools 21 COLONIAL BEACH HIGH 38,706.77
202 Colonial Beach Public Schools 22 COLONIAL BEACH ELEM 43,206.75
FY 2015 Salary Survey - Avg Teacher Salary by School
January 14, 2015
Page 61

Division Name
School
Number School Name
Average
2014-2015
Salary
Virginia Department of Education
Average Teacher Salaries by School for School Year 2014-2015
The average salary calculation includes licensed elementary and secondary classroom teachers (regardless of fund source). Classroom teachers
include: regular K-12 education teachers, art, music, physical education, technology, remedial, gifted, mathematics, reading, special education, and ESL
teachers. Not included in the calculation are: teacher aides, guidance counselors or librarians.
To calculate each school’s average salary, the salaries of each teacher who works in the school were summed and divided by the FTE total of all
teachers (full-time and part-time) in the school.
207 West Point Public Schools 280 WEST POINT ELEM 35,109.00
207 West Point Public Schools 290 WEST POINT HIGH 40,843.00
207 West Point Public Schools 391 WEST POINT MIDDLE 34,026.00
218 Virginia School for the Deaf and Blind-Staunton 4011 VIRGINIA SCHOOL FOR DEAF 46,429.00
218 Virginia School for the Deaf and Blind-Staunton 4013 VIRGINIA SCHOOL FOR BLIND 44,390.00
917 Department of Juvenile Justice 101 YVONNE B. MILLER HIGH SCHOOL 58,607.33
FY 2015 Salary Survey - Avg Teacher Salary by School
January 14, 2015
Page 62

Mandate for the Reporting Requirement
Item 136, paragraph B.12., Chapter 3, 2014 Special Session I Acts of Assembly
The Superintendent of Public Instruction shall provide a report annually, no later than
the first day of the General Assembly session, on the status of teacher salaries, by
local school division, to the Governor and the Chairmen of the Senate Finance and
House Appropriations Committees. In addition to information on average salaries by
school division and statewide comparisons with other states, the report shall also
include information on starting salaries by school division and average teacher salaries
by school.
FY 2014 Salary Survey - Appendix A
January 14, 2015
Page 63

Expenditure Category Function Object Total Amount
Classroom Instruction Salaries and Wages 61100 1120 4,945,634,443.25
Classroom Instruction Supplemental Salaries and Wages 61100 1620 94,452,846.62
Guidance Services Instructional Salaries and Wages 61210 1120 218,986,307.87
Homebound Instruction Salaries and Wages 61230 1120 14,239,339.81
Media Services Instructional Salaries and Wages 61320 1120 9,436,409.84
Media Services Librarian Salaries and Wages 61320 1122 108,975,170.75
Technology Classroom Instruction Salaries and Wages 68100 1120 60,051,795.18
Technology Instructional Support Salaries and Wages 68200 1120 27,625,099.21
Contingency Reserve Instructional Salaries and Wages 69000 1120 -
Contingency Reserve Supplemental Salaries and Wages 69000 1620 -
5,479,401,412.53
FTE Category Function Object Total Amount
Instructional Classroom - Teacher 61100 1120 93,999.18
Guidance Counselors 61210 1120 3,714.32
Homebound Instructional 61230 1120 534.94
Media Instructional 61320 1120 185.28
Media Librarian 61320 1122 1,890.94
Technology Classroom Instruction 68100 1120 1,049.75
Technology Instructional Support 68200 1120 440.06
Contingency Reserve Instructional 69000 1120 -
Contingency Reserve Librarian 69000 1122 -
101,814.47
$53,818
Expenditure Category Function Object Total Amount
Office of the Principal, Principal Salaries and Wages 61410 1126 190,196,797.78
Contingency Reserve, Principal Salaries and Wages 69000 1126 -
190,196,797.78
FTE Category Function Object Total Amount
Principals 61410 1126 1,993.02
Contingency Reserve Principals 69000 1126 -
1,993.02
$95,431Total reported compensation expenditures are divided by the total reported
FTEs to calculate the statewide average salary for fiscal year 2014:
Fiscal Year 2014 Average Teacher Salary Calculations:1
Total reported salary and wage expenditures from the following Annual School Report Financial Section
(ASRFIN) expenditure categories are summed:
Total reported FTEs from the following ASRFIN FTE categories are summed:
Total reported compensation expenditures are divided by the total reported
FTEs to calculate the statewide average salary for fiscal year 2014:
Total reported FTEs from the following ASRFIN FTE categories are summed:
TOTAL:
TOTAL:
TOTAL:
TOTAL:
Fiscal Year 2014 Average Principal Salary Calculations:1
Total reported salary and wage expenditures from the following Annual School Report Financial Section
(ASRFIN) expenditure categories are summed:
FY 2015 Salary Survey - Appendix B - Calculations
January 14, 2015
Page 64

Expenditure Category Function Object Total Amount
Office of the Principal, Assistant Principal Salaries and
Wages61410 1127 201,090,772.86
Contingency Reserve, Assistant Principal Salaries and
Wages69000 1127 -
201,090,772.86
FTE Category Function Object Total Amount
Assistant Principals 61410 1127 2,519.15
Contingency Reserve Assistant Principals 69000 1127 -
2,519.15
$79,825
TOTAL:
Fiscal Year 2014 Average Assistant Principal Salary Calculations:1
Total reported compensation expenditures from the following Annual School Report Financial Section
(ASRFIN) expenditure categories are summed:
Total reported FTEs from the following ASRFIN FTE categories are summed:
1 Includes school divisions and regional programs.
Total reported compensation expenditures are divided by the total reported
FTEs to calculate the statewide average salary for fiscal year 2014:
TOTAL:
FY 2015 Salary Survey - Appendix B - Calculations
January 14, 2015
Page 65