Embed Size (px)
Citation preview


SEPV Dixieland West Project Location
Proposed KOPs

SEPV Dixieland West
#1. Intersection of Evan Hewes and Carriso Avenue. One looking north, one looking west.
HDR approved this view for KOP#2 - Looking north

#1. Intersection of Evan Hewes and Carriso Avenue. One looking north, one looking west.
KOP#2 - Looking west

#2. From about the mid-point of Imperial Lakes boundary looking east towards the project.

SEPV Dixieland East Project Location
Proposed KOPs

SEPV Dixieland East
#1. At the Westside Main Canal (or perhaps a little further east) along Evan Hewes. Looking north/west.

#2. At the intersection of Evan Hewes and Brown Rd – looking west or north.


LESA ASSESSMENT SEPV DIXIELAND EAST PROJECT
(Portions of NW/4 Section 07, T16S, R12E, SBB&M)
IMPERIAL COUNTY, CALIFORNIA
April 2015
EMA Report No. 2316-1-03
Prepared for:
SEPV Imperial, LLC 11726 San Vicente Blvd, Suite 414
Los Angeles, CA 90049
ENVIRONMENTAL MANAGEMENT ASSOCIATES


i
LAND EVALUATION AND SITE ASSESSMENT MODEL
SEPV DIXIELAND EAST PROJECT (Portions of NW/4 Section 07, T16S, R12E, SBB&M)
IMPERIAL COUNTY, CALIFORNIA
The Land Evaluation and Site Assessment (LESA) model is an approach for rating the relative quality of land resources based upon specific measurable features. The LESA model was first developed by the federal Natural Resources Conservation Service (NRCS) in 1981. It was subsequently adapted in 1990 by the California Department of Conservation to evaluate land use decisions that affect the conversion of agriculture lands in California. The formulation of the California LESA Model is intended to provide lead agencies under the California Environmental Quality Act (CEQA) with an optional methodology to ensure that significant effects on the environment of agricultural land conversions are quantitatively and consistently considered in the environmental review process.
For determining the potential CEQA significance resulting from the conversion of agricultural lands to some other purpose, the California Agricultural LESA Model has developed Scoring Thresholds which are used to compare the Final LESA Score and the Weighted Factor Scores for the Project with suggested Scoring Decisions. These LESA Scores do not take into consideration any proposed mitigation measures or other factors that might affect a lead agency’s determination of the significance of the agricultural lands conversion impact under CEQA.
The information provided on the following pages present documentation of the LESA assessment prepared using the California Agricultural LESA Model for the SEPV Dixieland East Project (Project) (APN 051-047-001, APN 051-047-002, APN 051-035-001 and APN 051-035-002). The proposed SEPV Dixieland East Project would be constructed on approximately 25 acres of privately owned land located in southwest Imperial County, California, located approximately 12 miles west of the city of El Centro and approximately 0.1 mile north of the junction of State Highway 80 and Brown Road (Figure 1 and Figure 2). The Project is bounded on the east by Canal Street and on the west by the undeveloped street, Broadway Street.


LESA ASSESSMENT
SEPV IMPERIAL, LLC SEPV DIXIELAND EAST PROJECT IMPERIAL COUNTY, CALIFORNIA
TABLE OF CONTENTS Page
SUMMARY ..................................................................................................................................... i
LIST OF FIGURES ........................................................................................................................ ii
LIST OF APPENDICES ................................................................................................................. ii
1. CALIFORNIA LAND EVALUATION AND SITE ASSESSMENT MODEL ...................... 3 A LAND CAPABILITY CLASSIFICATION (“LCC”) ..........................................................3 B STORIE INDEX RATING ............................................................................................3 C PROJECT SIZE RATING .............................................................................................6 D WATER RESOURCES AVAILABILITY RATING ....................................................7 E SURROUNDING AGRICULTURAL LAND RATING ..............................................8 F SURROUNDING PROTECTED RESOURCE LAND RATING ................................8 G WEIGHTING OF FACTORS AND FINAL LESA SCORE ......................................10
LIST OF FIGURES
Page Figure 1: Location Map .................................................................................................................. 1 Figure 2: Development Area Map on an Aerial Photographic Base .............................................. 2 Figure 3: Development Area Soils Maps .................................................................................... 4, 5 Figure 4: Zone of Influence ............................................................................................................ 9
LIST OF APPENDICES
APPENDIX A: SEPV DIXIELAND EAST PROJECT SOILS DETAILS
ii


_̂SEPV Dixieland East Project
SEPV_Dixieland_East_Location_V03
_̂ SEPV Dixieland East Project
µDate: 4/8/2015Author: Carey, D.
0 3.5 7 10.5 141.75Miles
Coordinate System: NAD 1983 UTM Zone 11NProjection: Transverse MercatorNorth American 1983
SEPV Dixieland EastLocation Map

SEPV_Dixieland_East_Aerial_View_V03.1
Project Locations
µDate: 4/10/2015Author: Carey, D.
0 0.1 0.2 0.3 0.40.05Miles
Coordinate System: NAD 1983 UTM Zone 11NProjection: Transverse MercatorNorth American 1983
SEPV Dixieland EastAerial View

A B C D E F G H
Soil Map Unit*Project Acres
****Proportion of Project Area
LCC** (nonirrigated)
LCC Rating (nonirrigated)***
LCC Score (C x E)
Storie Index**
Storie Index Score (C x G)
121 22.6 0.894 VIIe 10 8.94 54 48.27122 2.7 0.106 VIIw 10 1.06 75 7.96
Totals 25.3 1.000 LCC Total Score 10.00Storie Index Total Score
56.23
Total Project Area (acres)=
25.3
**** Total acreage of each soil unit on each lot (Figures 3a, 3b).
Land Evaluation Worksheet
* The Soil Map Unit information and acreage were determined from the current soil survey information available at the USDA Natural Resources Conservation Service website: http://websoilsurvey.nrcs.usda.gov/app/WebSoilSurvey.aspx (Figure 3).** The Land Capability Classification and Storie Index information was obtained from the current soil survey information available at the USDA Natural Resources Conservation Service website: http://websoilsurvey.nrcs.usda.gov/app/WebSoilSurvey.aspx (Appendix A).*** The LCC Rating for nonirrigated land was determined from the LCC Point Rating Table 2 from the LESA Instruction Manual (California Department of Conservation 1997).


I J KLCC Class I-II LCC Class III LCC Class IV-VIII
Project Acres per LCC Class 22.6Project Acres per LCC Class 2.7
Total Project Acres per LCC Class 0 0 25* Project Size Scores 0 0 0
Highest Project Size Score 0
Site Assessment Worksheet 1Project Size Score*
* Project Size Score was determined from the Project Size Scoring Table from the LESA Instruction Manual (California Department of Conservation 1997).

A B C D E
Project Portion
Water SourceProportion of Project Area
Water Availability Score*
Weighted Availability
Score (C x D)
1Neither irrigated nor dryland production
feasible1.0 0 0
23456
(Must Sum to 1.0)Total Water
Resource Score0
Site Assessment Worksheet 2Water Resources Availability
* The Water Availability Score was determined using the Water Resources Availability Scoring Table from the LESA Instruction Manual (California Department of Conservation 1997) using data provided by SEPV.

A B C D E F G
Total AcresAcres in
Agriculture
Acres of Protected Resource
Land
Percent in Agriculture
(B/A)
Percent Protected Resource
Land (C/A)
515.1 132 0 25.6 0 0 0
Surrounding Parcels***
AcresProtected Resource
Land?
Percent Protected Resource
Land
Acres in Protected
Land
Agricultural Land?
Percent Agricultural
Land
Acres of Agriculture
051-092-011 3.8 N 0 0 N 0 0.0
051-051-002 4.1 N 0 0 N 0 0.0
051-084-002 8.2 N 0 0 N 0 0.0
051-092-010 2.0 N 0 0 Y 100 2.0
051-092-014 5.9 N 0 0 Y 100 5.9
051-081-003 1.5 N 0 0 N 0 0.0
051-084-003 2.5 N 0 0 N 0 0.0
051-051-003 1.1 N 0 0 N 0 0.0
051-081-002 4.5 N 0 0 N 0 0.0
051-091-001 6.1 N 0 0 N 0 0.0
051-081-001 1.7 N 0 0 N 0 0.0
034-360-042 69.5 N 0 0 N 0 0.0
034-360-039 28.1 N 0 0 N 0 0.0
034-360-037 5.6 N 0 0 N 0 0.0
034-390-025 114.5 N 0 0 N 0 0.0
034-390-026 38.1 N 0 0 N 0 0.0
051-020-028 30.9 N 0 0 Y 100 30.9
051-020-027 63.7 N 0 0 Y 100 63.7
051-020-003 29.4 N 0 0 Y 100 29.4
051-084-001 3.1 N 0 0 N 0 0.0
All Resident Lots 90.9 N 0 0 N 0 0.0
Total 515.1 Total 0 Total 132
***The Imperial County Assessors website was accessed to identify the surrounding parcel numbers (http://www.co.imperial.ca.us/assessor/). The percentage of agriculture was determined from a map overlay used to estimate the proportion of land in agriculture and the California Department of Conservation Important Farmland Map Series.
Site Assessment Worksheet 3Surrounding Agricultural Land & Surrounding Protected Resource Land
Surrounding Agricultural Land Score (From LESA
Manual Table 6)
* In conformance with the instructions in the LESA Instruction Manual (California Department of Conservation 1997), the Zone of Influence was determined by drawing the smallest rectangle that could completely encompass the entire Project Area. A second rectangle was then drawn which extended one quarter mile on all sides beyond the first rectangle. The Zone of Influence is represented by the entire area of all parcels with any lands inside the outer rectangle, less the area of the proposed project (Figure 4).
** The LESA Instruction Manual (California Department of Conservation 1997) describes Protected Resource Land as those lands with long term use restrictions that are compatible with or supportive of agricultural uses of land. Included among them are the following: Williamson Act contracted lands; Publicly owned lands maintained as park, forest, or watershed resources; and Lands with agricultural, wildlife habitat, open space, or other natural resource easements that restrict the conversion of such land to urban or industrial uses.
Surrounding Protected
Resource Land Score (From LESA Manual
Table 7)**
Zone of Influence*

SEPV_Dixieland_East_LESA_ZOI_V03
SEPV Dixieland East Project RectangleZone of Influence (1/4 Mile)Influenced ParcelsParcel Boundariesµ
Date: 4/9/2015Author: Carey, D.
0 0.1 0.2 0.3 0.40.05Miles
Coordinate System: NAD 1983 UTM Zone 11NProjection: Transverse MercatorNorth American 1983
SEPV Dixieland EastZone of Influence
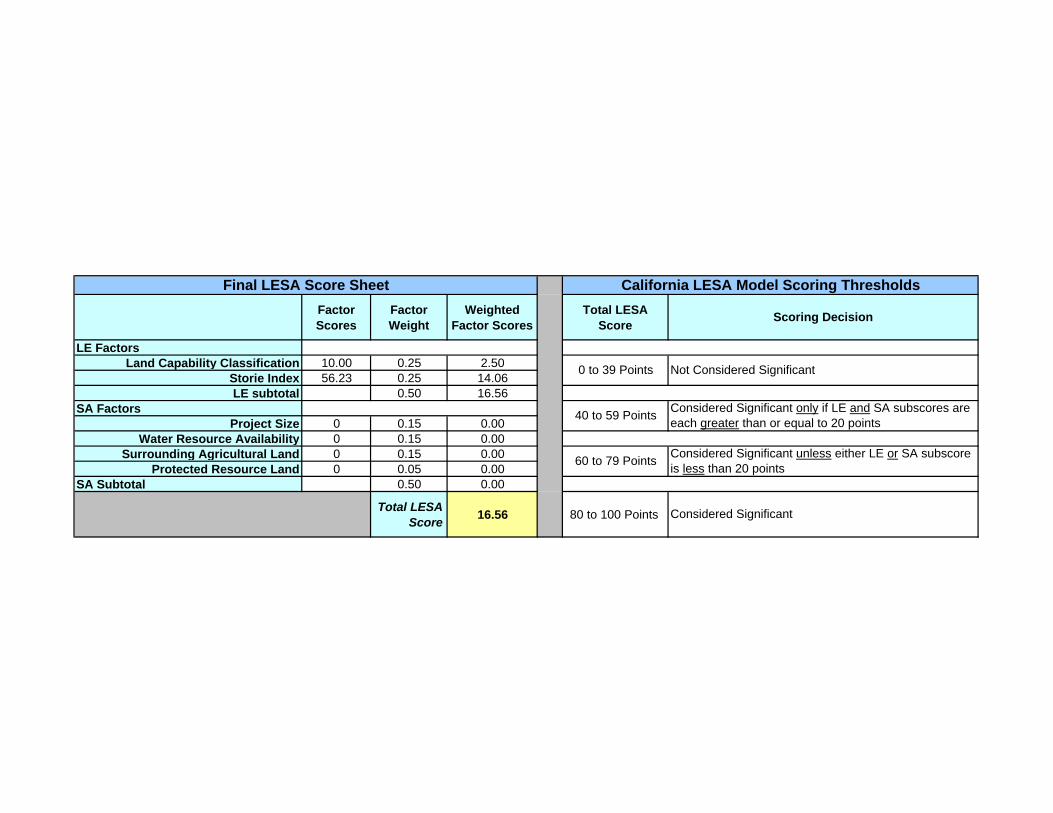
Factor Scores
Factor Weight
Weighted Factor Scores
Total LESA Score
LE FactorsLand Capability Classification 10.00 0.25 2.50
Storie Index 56.23 0.25 14.06LE subtotal 0.50 16.56
SA FactorsProject Size 0 0.15 0.00
Water Resource Availability 0 0.15 0.00Surrounding Agricultural Land 0 0.15 0.00
Protected Resource Land 0 0.05 0.00SA Subtotal 0.50 0.00
Total LESA Score
16.56 80 to 100 Points
Not Considered Significant
Considered Significant unless either LE or SA subscore is less than 20 points
Considered Significant
60 to 79 Points
Final LESA Score Sheet California LESA Model Scoring Thresholds
0 to 39 Points
40 to 59 Points
Scoring Decision
Considered Significant only if LE and SA subscores are each greater than or equal to 20 points

APPENDIX A: SEPV DIXIELAND EAST PROJECT SOILS DETAILS