Embed Size (px)
Citation preview
166
C h a p t e r 4
AEOLIAN PROCESSES IN PROCTOR CRATER ON MARS: 2. MESOSCALE MODELING OF DUNE-FORMING WINDS
Lori K. Fenton and Mark I. Richardson
Division of Geological and Planetary Sciences, California Institute of Technology, Pasadena, California
Anthony D. Toigo
Center for Radiophysics and Space Research, Cornell University, Ithaca, New York
Abstract. Both atmospheric modeling and spacecraft imagery of Mars are now
of sufficient quality that the two can be used in conjunction to acquire an
understanding of regional- and local-scale aeolian processes on Mars. We apply a
mesoscale atmospheric model adapted for use on Mars to Proctor Crater, a
150 km diameter crater in the southern highlands. Proctor Crater contains
numerous aeolian features that indicate wind direction, including a large dark
dunefield with reversing transverse and star dunes containing three different
slipface orientations, small and older bright duneforms that are most likely
transverse granule ripples, and seasonally erased dust devil tracks. Results from
model runs spanning an entire year with a horizontal grid spacing of 10 km
predict winds aligned with two of the three dune slipfaces as well as spring and
summer winds matching the dust devil track orientations. The primary (most
prevalent) dune slipface direction corresponds to a fall and winter westerly wind
created by geostrophic forces. The tertiary dune slipface direction is caused by
spring and summer evening katabatic flows down the eastern rim of the crater,
influencing only the eastern portion of the crater floor. The dunes are trapped in

167
the crater because the tertiary winds, enhanced by topography, counter transport
from the oppositely oriented primary winds, which originally carried sand into the
crater. The dust devil tracks are caused by light spring and summer westerly
winds during the early afternoon caused by planetary rotation. The secondary
dune slipface direction is not predicted by model results from either the Mars
MM5 or the GFDL Mars GCM. The reason for this is not clear, and the wind
circulation pattern that creates this dune slipface is not well constrained. The
Mars MM5 model runs do not predict stresses above the saltation threshold for
dune sand of the appropriate size and composition. As with previous work, the
calculated wind velocities are too low, which may be caused by too large a grid
spacing.
1. Introduction
The dominance of wind action over other contemporary surface processes on
Mars became evident during the Mariner 9 mission in 1971–1972 [e.g., McCauley et
al., 1972; Sagan et al., 1972; Smith, 1972; Cutts and Smith, 1973; Arvidson, 1974].
Wind circulation patterns determine the location and magnitude of sources, sinks,
and transport pathways of particulate materials. Because of this coupling between
surface materials and the atmosphere, the study of one is not complete without
the study of the other. In particular, dune morphology is dependent on winds
that are strong enough to saltate sand. Thus a study of dune morphology leads to
an understanding of the orientations of strong local winds. Furthermore, there
are few wind measurements available for use as “ground truth” of atmospheric
models. Aeolian features are often aligned with the winds that formed them,
providing the only indicator of surface wind direction than spans the globe. Thus
a comparison of modeled wind predictions with orientations of surface features is
the only current verification technique for both the modeled surface winds and

168
the applied boundary layer scheme. It is the atmospheric counterpart to surficial
geology that is discussed in this work.
Shortly after the discovery of sand dunes on Mars, experimental work in wind
tunnels began in order to better understand the physics behind sand saltation
under Martian atmospheric conditions [Iversen et al., 1973; Iversen et al., 1976]. The
results indicate that there are many differences in the mechanics of saltation on
Mars and Earth. Greeley et al. [1980] found that threshold friction speeds an order
of magnitude larger than those measured on the Earth are required to move
similarly sized sand grains on Mars (u*t of 0.22 m s-1 for Earth versus 2.2 m s-1 for
Mars). Iversen and White [1982] improved on previous work, producing new
empirical relations for threshold friction speeds. They found that saltating
particles on Mars would have longer path lengths than those on Earth, and that
this parameter varies with temperature and atmospheric conditions. In addition,
White [1979] showed that although it takes stronger winds to saltate sand on
Mars, once saltation begins, the sand flux on Mars would be significantly higher
than that on Earth. Now that sand grain sizes and compositions are being
constrained using Thermal Emission Spectrometer (TES) data from the Mars
Global Surveyor (MGS), a more precise estimate of saltation threshold stresses
may be utilized in detecting sand saltation and calculating sand mass fluxes.
In the last decade, atmospheric models have been applied in conjunction with the
results from wind tunnel experiments to better understand aeolian processes on
Mars. Greeley et al. [1993] used a Mars general circulation model (GCM) to study
the correlation of surface wind patterns to aeolian features with measurable wind
orientations. They found that bright depositional streaks correspond well to the
southern summer Hadley circulation, but that dark erosional streaks and yardangs
did not agree well with any modeled winds above the saltation threshold. Fenton
and Richardson [2001b] later found that a higher time resolution (hours rather than

169
days) in a Mars GCM resolved the nighttime winds that correlated well with dark
erosional streaks, implying that temporal and spatial resolution in models is one
of the keys to understanding some of the previously unexplained aeolian features.
Yardang orientations remain unaligned with current winds, but some of these
features may be so old that they were formed under ancient and unconstrained
wind conditions that cannot be properly modeled without further information.
Other applications of modeling the Martian surface on a regional or global scale
have included finding bimodal winds in an area where longitudinal dunes indicate
such a wind regime should exist [Lee and Thomas, 1995]; locating global sand
sources and sinks [Anderson et al., 1999]; and looking for changes in surface wind
patterns caused by variations in orbital parameters [Fenton and Richardson, 2001b].
With the advent of mesoscale atmospheric models, the circulation of a small
region can be examined in high-resolution detail for the first time. These models
can be used in concert with spacecraft data, and in particular MOC NA (Mars
Orbiter Camera Narrow Angle) images, which can provide detailed wind
orientations at the scale of tens of meters. Comparing the two provides not only a
verification of the mesoscale model and the GCM to which it is coupled, but also
an understanding of the source of the winds that influence the surface. This in
turn can lead to a better understanding of landscape morphology and the sources
and sinks of mobile material. Recently, a mesoscale model has been applied over
a crater and a valley, demonstrating that topographic and diurnal effects dominate
the local windflow on Mars [Greeley et al., 2001]. A mesoscale model applied over
the Antarctic ice sheets has recently been used as an analog to the north polar
residual ice cap on Mars in order to explain the presence of most of the surface
features [Howard, 2000]. Mesoscale airflow has been modeled over a typical crater
to show that the highest wind stresses correlate with the downwind crater rim,
consistent with erosion patterns observed in small craters [Kuzmin et al., 2001]. It

170
Fig. 4.1. Proctor Crater is a 150 km diameter crater with an interior dark dunefield, located in the southern highlands ~900 km west of Hellas Basin (see inset.)
has become clear that models with both higher spatial and temporal resolution
are necessary to understand local and even regional wind patterns.
This work is the second of two papers describing aeolian processes in Proctor
Crater, a 150 km diameter crater in the ancient cratered highlands of Noachis
Terra (see Fig. 4.1). The first paper, Fenton [2003] (hereafter called Paper 1),
discusses the morphology, composition, thermal properties, and stratigraphic
history of the floor materials within Proctor Crater. With use of a number of
different data sets in conjunction, it is shown in Paper 1 that the sedimentary
history of Proctor Crater has involved a complex interaction of accumulating and
eroding sedimentation. Aeolian features spanning much of the history of the
crater interior dominate its surface, including large erosional pits, hundreds of
meters of stratified beds of aeolian sediments, sand dunes, erosional and

171
depositional streaks, dust devil tracks, and small bright bedforms that are
probably granule ripples. In this work we apply a mesoscale model to the
atmosphere above Proctor Crater in order to determine how modeled winds
correspond to the aeolian features described in Paper 1. First we review the
orientations of aeolian features found in Paper 1, with an additional discussion
regarding evidence for seasonally reversing slipfaces found in newly released
MOC NA images. We then describe the mesoscale model and how the resulting
wind predictions correlate to known surface features. We discuss seasonal and
daily wind changes and the spatial variation of wind patterns on the Proctor
Crater floor. Using sand grain density and particle sizes estimated in Paper 1 we
discuss the likelihood of sand lifting under the predicted wind conditions.
2. MOC NA Observations of Proctor Crater Dunes
2.1 Measured Orientations
Wind orientations are visible in at least three different types of aeolian features: in
the large dark dunefield in the center of the crater floor, in dust devil tracks that
cover the floor during the spring and summer, and in small bright duneforms that
are nearly ubiquitous on the crater floor. Each type of feature indicates a different
time scale, indicating either recent or ancient winds. For example, dust devil
tracks form and are subsequently obliterated each year, and therefore the winds
that move dust devils downwind must be currently active. However, the large
dark dunes may move on timescales of thousands of years or more, and thus may
reflect older winds. Some of the bright duneforms may be ancient stabilized
features, possibly indicative of winds dating to hundreds of thousands of years or
more. Each type of feature and the wind information it provides is discussed in
detail below. A summary of the results is presented in Table 4.1.
2.1.1 Dark Dunes. As discussed in Paper 1, the dark dunefield in the floor of
Proctor Crater (see Fig. 4.1) displays three slipface orientations. Slipfaces are

172
Table 4.1. Current wind regime in Proctor Crater (based on MOC NA images) Wind Locale Features reflecting
wind direction Time of occurrence
Primary (WSW: 239º ± 18º)
Entire crater floor Dune slipfaces, Bright duneforms Dust devil tracks
Fall and winter afternoon geostrophic-induced westerlies (strong) Sprint and summer early afternoon westerlies from planetary rotation (weak)
Secondary (ESE: 110º ± 18º)
Central and western portion of dunefield
Dune slipfaces ?
Tertiary (ENE: 75º ± 9º)
Eastern portion of dunefield, possibly eastern portion of crater floor
Dune slipfaces, Bright duneforms (?)
Spring and summer evening katabatic flow (strong)
produced by two processes. In the lesser process, grains are deposited by a sand-
laden wind, coating the lee side of a dune. However, the morphology of the lee
side of a dune is usually dictated by sand flow, produced by the avalanching of
sand which is oversteepened by the downwind movement of sand from the stoss
(windward slope). Continued avalanching produces the characteristic slipfaces
that are used both to identify dunes and to determine the wind orientation,
because slipfaces are always oriented transverse to the wind (i.e., they dip
downwind).
Figure 4.2a shows a rose diagram (i.e., a histogram on a polar plot) of the
measured slipface dip orientations, or downwind directions, from Paper 1. Each
of the three slipface orientations is labeled with a mean and standard deviation
formative wind orientation (note that although the rose diagram shows
downwind slipface directions, following the geological convention, the labeled
wind orientations refer to the upwind directions, following the meteorological
convention). The three directions are labeled primary, secondary, and tertiary
based on their spatial frequency within the dunefield. The primary dune slipfaces

173
Fig. 4.2. Rose diagrams showing the azimuthal orientations of a.) dune slipfaces, b.) dust devil tracks, and c.) bright duneforms as measured in MOC NA images.
are created by winds from the WSW. These slipfaces are visible throughout the
dunefield. Falling dunes on the eastern sides of hills and cliffs southwest (i.e.,
upwind) of the dunefield are aligned with this wind, and have been interpreted in
Paper 1 as the winds that carried the dark dune sand to its current location from
the southwest. The secondary winds are consistent with winds from the ESE.
They are prevalent throughout all but the easternmost portion of the dunefield,
and dominate in the form of transverse dunes along the west-northwest edge of

174
the dunefield. A large dark streak of sand emanating from the northern tip of the
dunefield is aligned with the secondary wind (see Fig. 4.1). The tertiary slipfaces
indicate winds from the ENE. They are only present on the easternmost edge of
the dunefield, where they are the principal dune-shaping winds. The tri-
directional wind regime observed in the Proctor Crater dunefield is also a
convergent wind regime, indicating that the dunefield resides in a location on the
crater floor with zero or low net transport. As discussed in Paper 1, the transverse
reversing and star dunes found in the dunefield are consistent with the observed
convergent wind regime.
Individual images of dunes generally do not provide information on the season or
local time of the winds that influence them. However, they do provide the
orientations of the winds that last influenced them, which may indicate dune
activity ranging from saltation up to and during the data acquisition to indurated
surfaces that reflect ancient and now defunct wind systems. Therefore, in order
to interpret the Proctor Crater dune slipface orientations in terms of the current
wind circulation patterns, it must first be established that the dunes are currently
active. The Proctor Crater dunes are free of dust accumulations that mantle the
local surface each year, and although the surrounding crater floor becomes
covered with dust devil tracks each spring and summer, the dunes display few
such dust devil tracks. This suggests that the dunes are active, clearing away dust
fallout with sand saltation, and that any dust devils that pass over dark sand leave
behind no tracks because there is no dust left to be cleared away. Furthermore,
the dune thermal inertia indicates the dunes are made of coarse-grained sand,
consistent with previous measurements and predictions (see Paper 1). Thick dust
deposits on the dunes would lower the thermal inertia to a value consistent with
dust grains (besides being unlikely based on the low albedo of the dunes), and
dune cementation would increase the thermal inertia to a value too large to be
indicative of sand-sized grains. In addition, there are few if any indications of

175
hillslope erosion on the dunes or softening of slipface brinks, both of which are
consistent with their being currently active. Thus the evidence suggests that each
of the three measured slipface orientations corresponds to present-day winds.
2.1.2 Dust devil tracks. Dust devil tracks were identified in most of the spring
and summer images on the Proctor Crater floor. They form first over dark
patches of sand in the springtime, eventually spreading over much of the crater
floor as the season progresses. Tracks overlap one another but generally are not
erased within a single summer season. By the following year the tracks have been
erased, indicating that fresh tracks form each year after new dust fallout has
accumulated on the crater floor.
Most dust devil tracks are oriented WSW–ENE (see Fig. 4.2b). Because of a lack
of obvious starting and ending points of the dust devil tracks, it is difficult to
determine which direction the dust devils moved and thus the ambient wind
direction in the early afternoon during spring and summer. No actual dust devils
were imaged in Proctor Crater. However, as discussed in Paper 1, there is one
springtime image showing dust devil tracks forming on a dark sand patch and
moving downwind, pushed by winds from the WSW. Thus it is likely that all of
the dust devil tracks, which form in the same season and during the same time of
day, indicate winds from the WSW.
Dust devil tracks are visible throughout the spring and summer seasons in
seventeen different images. It is possible that the mean wind direction drifts as
the season progresses, perhaps reflecting changes in the strength of Hadley
circulation or tidal flow. Thus we measured the mean orientations of the dust
devil tracks as a function of Ls, including tracks from newly released images
acquired during the second Martian summer. Where the dust devil tracks were
plentiful, only the longest and most prominent tracks were measured. Where the

176
dust devils were faint and scarce, as was the case for all wintertime tracks, all
visible tracks were measured. It is not clear whether tracks observed during the
winter are fresh features or relics from the previous summer season. As a result,
there is a measurement bias towards larger, longer-lasting dust devils during the
spring and summer and towards small and potentially old tracks during the
winter. The results are shown in Fig. 4.3, with small dots marking the orientation
of individual dust devil tracks and large asterisks indicating the mean track
orientation in each image. As with Fig. 4.2b, all tracks are assumed to be oriented
Fig. 4.3. Dust devil orientation as a function of season. Dots represent individual track orientations; large stars indicate mean orientations across a single MOC NA image.
between 0º and 180º, thus avoiding the directional ambiguity. Although there is a
wide distribution is track orientations, they generally tend to cluster between 45º
and 135º. The mean orientations in each image are always near 90º. Both of these
observations are consistent with the WSW–ENE orientation shown in Fig. 4.2b.

177
Thus, according to the MOC NA images, there is no observable change in dust
devil orientation in Proctor Crater during the year, indicating that the mean
daytime wind direction during the spring and summer and possibly during the
winter is fairly constant.
2.1.3 Bright duneforms. Bright duneforms cover much of the floor of Proctor
Crater. They are visible in the interdunes in the large dark dunefield, indicating
that these features were present before dark sand entered the crater. Although
they are an order of magnitude smaller than the dark dunes, they are relatively
immobile, indicating that they are either smaller stabilized dunes or very large
granule ripples. The TES bolometric albedos of these features range from 0.12–
0.14, making them “bright” relative to the dark dunes that have an albedo ranging
from 0.06–0.12. For these reasons, they are referred to in this work as “bright
duneforms” or “bright bedforms.” They are most likely some sort of ripple,
because there is an example shown in Paper 1 of a large dark barchan eroding
bright duneforms as it slowly migrates by, only to have a few small features
similar to the bright duneforms reform in its wake after it passed by. If these
duneforms are in fact small dunes, then they would quickly migrate by the large
dark dunes in an active wind regime. If most of the bright duneforms are simply
stabilized dunes, then these features could not be recreated after being destroyed,
as observed. Therefore these features are most likely very large granule ripples,
which may migrate more slowly than dunes and yet still remain active.
The bright duneforms seem to be symmetric with no obvious slipfaces at the
resolution of MOC NA images, making it difficult to determine whether they are
aligned parallel or transverse to the local winds. Granule ripples tend to be
transverse to the wind [Sharp, 1963], so if these features are ripples, as proposed,
then they are probably transverse as well. Figure 4.2c shows a rose diagram of the
along-crest direction of the bright duneforms. If they are transverse then they

178
were formed by winds from either the WSW or the ENE. These directions are
consistent with both the primary and tertiary slipfaces found in the dark dunes. It
is possible that where the primary winds dominate, the bright duneforms were
created by winds from the WSW, and that where the tertiary winds dominate, the
bright duneforms were created by winds from the ESE. Some of the bright
duneforms may be ancient features, far older than the dark dunefield. If this is the
case then they reflect ancient winds, indicating that wind circulation patterns have
changed little since they were created.
2.2 Annual Slipface Reversal
Although dune slipface orientations show the predominating wind directions that
influence the dunefield, they do not indicate the season or time of day in which
these winds blow. In fact, without evidence for recent dune movement, it is
difficult to prove conclusively that these slipfaces were not formed by ancient
winds that no longer blow, and that the dunes are not largely dormant. The
paucity of erosional features on the dunes supports the idea that the dunes are
not stabilized, relic features. In addition, movement of dunes the size of those in
the Proctor dunefield could take a century or more to identify using data with the
currently available image resolution, and thus their lack of movement cannot be
used to conclude that they are stabilized.
However, there is evidence for slipface reversal in dunes on the eastern edge of
the Proctor dunefield that clearly indicates dune activity within the timespan of
the MGS mission. The eastern portion of the dunefield consists of relatively
smaller dunes with visible interdune areas, in contrast to the huge dunes atop the
50 m deep mound of sand found in the central and western-central portions of
the dunefield (see Fig. 12 of Fenton [2003]). The eastern part of the dunefield is
likely a younger offshoot of the main accumulation of sand. At some point, winds
from the southwest (the primary winds) blew sand from the main dunefield to

179
the northeast, where it halted upon encountering east-northeasterly winds (the
tertiary winds), which only influence the eastern part of the dunefield. Here the
dark sand is largely balanced between the primary and tertiary winds, producing
reversing transverse dunes common to the dunefield.
In Paper 1, bright material was described on slipfaces of double-sided barchans at
the eastern edge of the dunefield. This bright material was attributed to the
erosion of nearby underlying bright bedforms, which have a rounded appearance
consistent with deflation and abrasion. It is only off the eastern edge of the
dunefield that the bright bedforms have this rounded appearance, and it is only at
the eastern edge of the dunefield that the dark barchans display bright slipfaces.
This bright material cannot be residual frost because it is visible even in
summertime images, when the surface is far too warm to support either CO2 or
H2O frost.
The slipface containing bright material switches sides of the double-sided
barchans, as shown in Fig. 4.4. Figure 4.4 compares two overlapping MOC
Narrow Angle images of the same area at different times of the year. Figure 4.4a
shows mid-fall frosted dune surfaces with bright material on northeast slopes.
Figure 4.4b shows an overlapping image from the following year during the late
spring, with fully defrosted dune surfaces bearing bright material on western
slopes. Note that although the solar azimuth is similar in Figs. 4.4a and 4.4b, the
solar altitude is much higher in Fig. 4.4b leading to fewer shadows and an
increased emphasis on albedo contrast. The albedo contrast in Fig. 4.4b is
enhanced by the lack of frost cover present in Fig. 4.4a. Figures 4.4c and 4.4d
illustrate the slipface brinks and accumulations of bright material with colors
corresponding to the formative wind directions (yellow is primary, magenta is
tertiary). Figure 4.4e shows both slipface directions, emphasizing that they are on

180
Fig. 4.4. Reversing slipfaces on dunes at the eastern edge of the dunefield. a.) MOC NA M1900307 during the fall and b.) MOC NA E0902707 during the spring show the same area with bright accumulations on opposing slipfaces. c.) and d.) illustrate the locations of slipface brinks and bright accumulations. e.) shows both sets of slipfaces and bright material. Note the slight shifting of one slipface brink in the upper right.

181
opposite sides of the barchans. Typical terrestrial reversing dunes switch sides
with opposing seasonal winds, erasing the old slipface from the preceding season.
The dunes in Proctor Crater display both slipfaces at different seasons, indicating
that the slipfaces are not fully erased by opposing winds, leading to seasonally
activated slipfaces. The fact that seasonal slipfaces are not fully erased may be
caused by some amount of internal cementation of the dune, or by the fact that
the slipfaces are too large to be demolished in a single Martian season.
In Figure 4.4c, one dune in the upper right corner of the image has two slipface
brinks drawn on it. The more southwesterly and larger slipface corresponds to
that in Figure 4.4a, and the smaller and more northeasterly brink corresponds to
that in Figure 4.4b. This shift in slipface position probably indicates movement of
this slipface toward the northeast between mid-fall and the following spring,
although the dune itself has not shifted position. This movement indicates a shift
of 13 to 37 m, depending on where along the brinks the movement is measured.
Such a shift indicates strong and persistent seasonal winds. No other slipfaces in
the frame moved and no dunes changed position, suggesting that movement of
this type is rare.
Figure 4.4 indicates that between mid-fall and late spring, the prevailing winds
change direction and that both winds influence the dunes. Bright material is likely
blown from the stoss (upwind) slope onto the slipface along with any loose dark
sand from the dune surface. If the dark sand on the dunes is mobile then an
explanation must be found for why mobile bright material does not mix with the
dark sand as it moves back and forth over the dune. Rather, the bright material
remains on the surface, unmixed and unburied. It is possible that the dark sand in
the dune is somewhat indurated, and that only the bright sand is moving back
and forth as the seasons progress. However, the thermal inertia of the Proctor
Crater dunes is consistent with loose, coarse sand (see Paper 1 and references

182
within). It is more likely that some amount of dark sand moves back and forth
over the dune as the winds shift, but that the bright material is more easily
mobilized by the wind, and thus is the last to settle onto the slipfaces as the winds
decrease. This may indicate that the bright saltating material is made of smaller or
less dense particles, causing them to saltate under lighter winds than the coarse
basaltic grains comprising the dark sand.
Six MOC Narrow Angle images pass over the eastern edge of the Proctor Crater
dunefield, imaging slipfaces at different seasons. Following the hypothesis that
the bright material accumulates on the downwind side of the dunes, the dunes in
this region are influenced currently by the primary and tertiary winds. Figure 4.5
shows each inferred wind orientation as a function of Ls, labeled by the MOC
Fig. 4.5. MOC NA frames showing accumulations of bright material on oppositely oriented slipfaces. Horizontal red lines correspond to the three dune slipface orientations.

183
NA frame in which it was found. The red lines mark the three mean and standard
deviation dune slipface directions. Reading from this plot, the primary slipfaces
are active throughout fall and winter, and the tertiary slipfaces are active during
spring and summer. MOC frame M0702777 from Ls = 206.68º appears to have
bright material on both slipfaces, and likely indicates a transition time between
the two seasonal wind regimes. As discussed next, the modeled winds reflect the
activity of these slipfaces.
3. Mesoscale Modeling of Surface Winds
3.1 The Mars MM5
Mesoscale atmospheric models are tools that have recently been made applicable
to Martian conditions. These models function similarly to Mars GCM’s, but they
can examine atmospheric patterns that vary from the synoptic (1000’s km) down
to the microscale (10’s m). The goal of applying a mesoscale model to Proctor
Crater is to determine how well predicted wind directions correlate with dune
slipface orientations.
We applied the Mars MM5, developed from the PSU/NCAR 5th Generation
Mesoscale Model (MM5) by Toigo [2001]. The model is nonhydrostatic and uses
terrain-following sigma coordinates. Initial and boundary conditions are provided
by the Geophysical Fluid Dynamics Laboratory (GFDL) Mars General
Circulation Model (GCM), which inherently couples the Mars MM5 to the GCM.
The boundary layer parameterization scheme used in the Mars MM5 is that used
in the Medium Range Forecast (MRF) [Hong and Pan, 1996], which has been
modified for Martian surface conditions [Toigo, 2001].
Most of the Martian-specific parameterizations used in the Mars MM5 are taken
directly from the GFDL Mars GCM. Radiative transfer is modeled using the
scheme of Wilson and Hamilton [1996], which involves solar absorption by CO2

184
and atmospheric dust of two particle sizes. The surface is represented by a
MOLA topographic map [Smith et al., 2001]; albedo maps by Pleskot and Miner
[1981], Paige et al. [1994], and Paige and Keegan [1994]; and thermal inertia maps
from Palluconi and Kieffer [1981] and Vasavada et al. [2000]. Ground temperatures
are calculated using a 12-layer subsurface heat diffusion model that uses initial
temperatures from the GCM.
We ran twelve 10-day simulations equally distributed around the Martian year.
Twenty-four pressure levels were defined, from near the surface (~50 m height)
to the top at ~80 km above the surface. Horizontally, we used a 50 x 50
horizontal point grid with a resolution of 10 km. The grid was centered on
Proctor Crater and it extended more than one crater diameter in each direction to
avoid potential edge effects. The timestep used in the simulations was 5 seconds,
and parameters such as wind velocity and stress were saved once every hour as
instantaneous values. In the past, hourly averaged values have been commonly
used to provide a representative set of parameters. However, in this case the
instantaneous values at the top of each hour were used instead to avoid washing
out varying parameters that can be caused by using mean values.
3.2 Model Results
3.2.1 Seasonal Winds. Because the strongest daily winds are those that will
move the most sand, it is these winds that will most affect dune morphology.
Therefore we first discuss the orientations of the winds with the strongest daily
stresses. These maximum winds are shown in Fig. 4.6 as a function of Ls and
wind orientation. Daily maximum winds are indicated by black boxes with sizes
that correspond to wind stress, which is discussed in more detail in Section 3.2.3.
The time of year included in each model run is shown as a blue shaded strip. The
three mean wind directions observed in the dunefield and their standard
deviations are indicated and labeled in red.
185
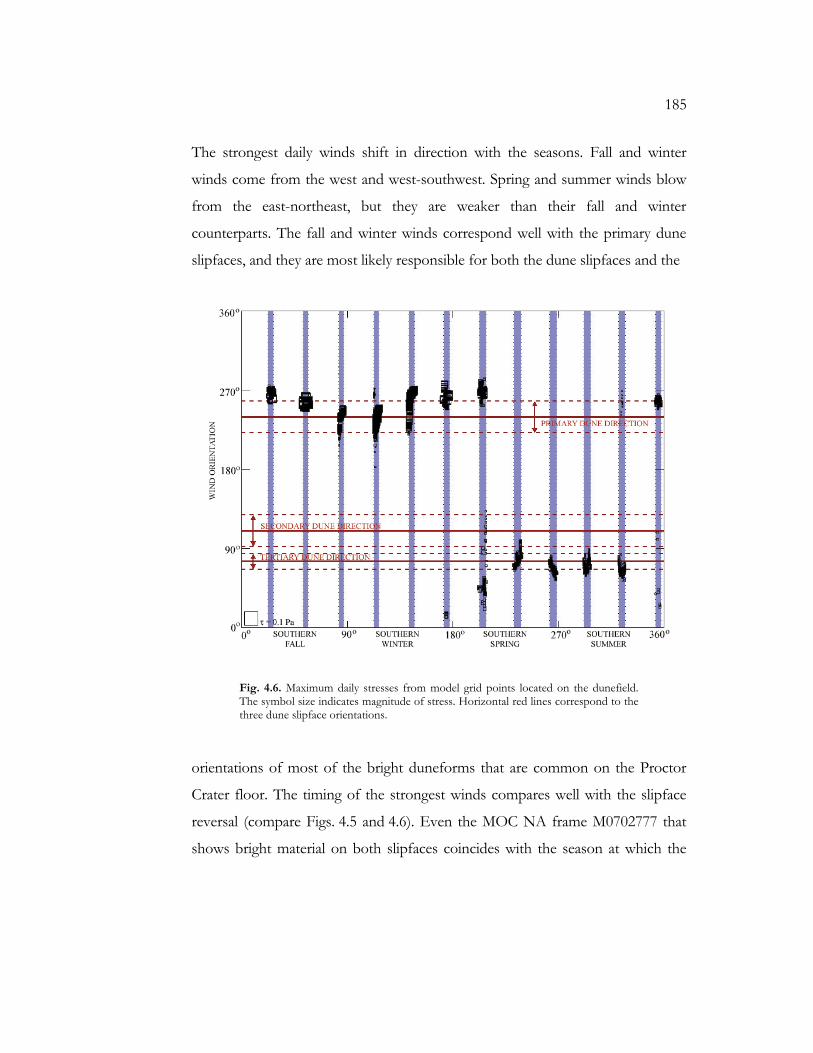
The strongest daily winds shift in direction with the seasons. Fall and winter
winds come from the west and west-southwest. Spring and summer winds blow
from the east-northeast, but they are weaker than their fall and winter
counterparts. The fall and winter winds correspond well with the primary dune
slipfaces, and they are most likely responsible for both the dune slipfaces and the
Fig. 4.6. Maximum daily stresses from model grid points located on the dunefield. The symbol size indicates magnitude of stress. Horizontal red lines correspond to the three dune slipface orientations.
orientations of most of the bright duneforms that are common on the Proctor
Crater floor. The timing of the strongest winds compares well with the slipface
reversal (compare Figs. 4.5 and 4.6). Even the MOC NA frame M0702777 that
shows bright material on both slipfaces coincides with the season at which the

186
strongest daily winds switch direction, indicating that this image has caught the
dunes during a transition from one wind regime to the other.
Dust devil tracks are also aligned with the primary wind, but they are generally
only visible in spring and summertime images, indicating that this fall and winter
wind is not responsible for creating the majority of dust devil tracks. The dunes
do become covered in CO2 frost during the winter, which may inhibit sand
activity, precluding the winter winds from producing slipfaces. However, MOC
NA images show fully frosted dunes only for the time period between Ls = 50º–
145º, with partial frost lasting until Ls = 165º. According to the model results in
Fig. 4.6, the primary winds blow from Ls = 350º to 200º.Therefore even if the
frost cover temporarily stabilizes the dunes, the winds before and after the period
of frost cover may account for the observed dune activity.
The winds in general are stronger during the winter, which likely indicates why
they produce the most common slipfaces in the dunefield. However, the tertiary
winds appear to dominate on the eastern edge of the dunefield, where these
slipfaces are larger and the outlines of the barchan dunes appear to emphasize the
tertiary winds. Further examination of the physics of saltation may explain why
the tertiary winds have more control over the dunes they affect than the primary
winds (see Section 3.2.3).
The secondary winds, from the ESE, are absent from Fig. 4.6. They are also
absent from the dunes in Fig. 4.4, but this is on the eastern edge of the dunefield
where slipfaces oriented with secondary winds are not present. It is not clear why
the ESE winds do not appear as the strongest winds at some point of the year,
but it may be that they are produced by slightly weaker winds at some point
during the day that does not appear in Fig. 4.6. Therefore, before we can state

187
that the model does not predict the secondary winds, we must discuss wind
orientation and strength as a function of time over the course of the day.
3.2.2. Daily Winds. To understand changes in winds during the day, we saved
hourly winds when running Mars MM5 over Proctor Crater. The strongest daily
winds correspond to two of the three observed dune slipface directions, but they
do not explain the missing secondary winds that produce another dune slipface
direction in the dunefield. They also do not explain the orientation of dust devil
tracks during the spring and summer, which seem to be oriented 180º from the
strongest winds during that season. Hourly winds during each model run show
much more detail than in Fig. 4.6. The origins of the observed winds are
discussed below in Section 3.2.4.
Figure 4.7 shows the orientation of winds over the Proctor crater dunefield for
each hour in each model run. A total of twenty-five grid points in the model were
located over the dunefield, and each point is plotted in Fig. 4.7. As with Fig. 4.6,
the three mean and standard deviation slipface directions are marked, and the
black boxes indicating modeled winds are scaled by wind stress. Each model run
is shown separately and labeled, although all ten days included in each run are
shown in a single plot. Spring and summer model runs clearly show tertiary winds
during the evening hours, and WSW winds during the daytime. The evening
winds are the strongest winds of the day, as shown in Fig. 4.6, but the early
afternoon winds correspond well with the dust devil track orientations.
Fall and winter winds that are aligned with primary winds are the strongest of the
year, and they blow during the afternoon. Winds from the WSW occur
throughout the year, but they become much stronger during the fall and winter.
Thus a weak WSW produces dust devil tracks during the spring and summer, and
a strong WSW wind creates slipfaces during the fall and winter.

188

189
Fig. 4.7. Modeled hourly wind orientations over the dunefield for each model run. Data symbols are scaled by the magnitude of stress.

190
None of the daily winds indicate any alignment with slipfaces oriented to
secondary winds, suggesting that perhaps these winds no longer blow. However,
the slipfaces made by ESE winds are crisp and uneroded, implying that they
probably not relics of an old wind regime. There are winds that briefly align with
these secondary winds during the time of transition between the winter and
summer circulation patterns (see Fig. 4.7 at Ls = 352º–358º and 172º–178º) and in
the late afternoon during the summer (see Fig. 4.7 at Ls = 232º–239º, 262º–269º,
and 292º–298º). But these winds are not strong and do not appear to be part of
any persistent and unidirectional wind pattern. It may be that a full year’s run
would produce a time when the secondary winds dominate, although the model
runs here appear to be fairly representative of modeled winds throughout the
Martian year.
3.2.3. Wind Stresses. Although the modeled winds may align with observed
wind features, only winds above a particular threshold stress value are strong
enough to initiate saltation. Some wind features, such as dust devil tracks, do not
rely on sand saltation, and in these cases the modeled stress is not a directly
relevant parameter. However, saltation initiation is important for explaining
features such as dunes, which are morphologically controlled solely by sand
saltation. Iversen and White [1982] conducted wind tunnel experiments, finding an
empirical relation for the saltation threshold under Martian atmospheric
conditions. They found that the threshold varied as a function of particle size,
particle density, atmospheric temperature, and atmospheric pressure. Because the
saltation threshold is sensitive to so many parameters, it is crucial to constrain
these values in order to determine whether the mesoscale model truly predicts the
saltation of sand within the Proctor Crater dunefield.
In Paper 1, thermal inertia values derived from TES led to an estimated effective
sand grain size for the Proctor Crater dunes of 740 ± 170 µm. In addition, the

191
compositional analysis described in Paper 1 indicated that the dunefield is almost
exclusively composed of basalt grains, where the basalt is inferred from the
identification of pyroxene and plagioclase in TES spectra. In this work we assume
the grains have a density typical of terrestrial basalt (3200 kg m-3), although it is
possible that the sand could be composed of grains with a lower bulk density (e.g.,
scoria). Modeled surface air pressures and air temperatures vary with local time
and season. In the early afternoon during the southern winter solstice, when the
primary winds dominate over all other winds crossing the dunefield, the air
temperature is ~155 K and the air pressure is 6 mbar. In the evening hours
during the southern summer solstice, when the tertiary winds blow, the air
temperature is ~235 K and the air pressure is 6 mbar. It is interesting to note that
the daytime winter air pressure is roughly equivalent to the evening summertime
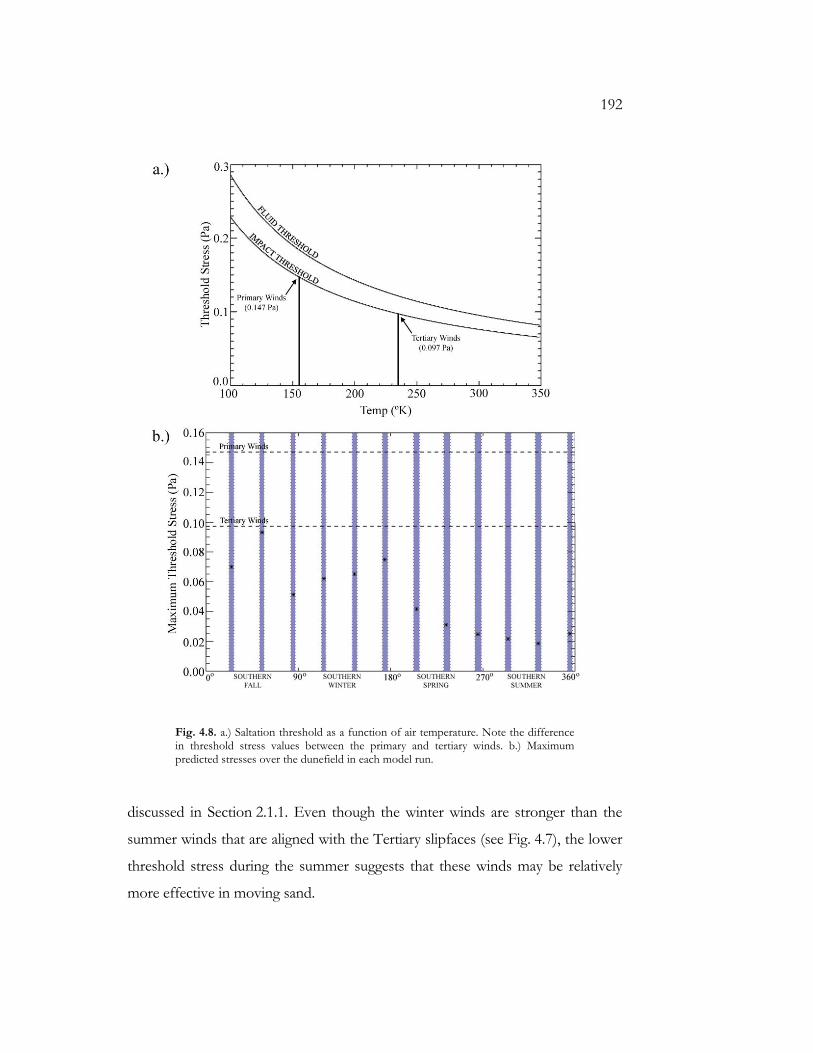
air pressure. Figure 4.8a shows the saltation stress threshold for 740 µm diameter
basalt grains at an air pressure of 6 mbar as a function of near-surface air
temperature based on the relation by Iversen and White [1982]. The upper curve
indicates the fluid stress threshold, or the stress required by the air alone to lift
grains in to saltation. The lower curve indicates the impact stress threshold, or the
stress necessary to saltate grains from the impact of already saltating grains. The
impact stress threshold may be considered roughly equivalent to ~0.8 that of the
fluid stress threshold [Bagnold, 1941; Andersen and Haff, 1988; Toigo et al., 2002a].
Because movement from such impacts is the mechanism that causes most grains
to saltate, the impact stress threshold is considered to be the most representative
threshold stress value. Figure 4.8a shows the estimated threshold stress values for
typical conditions under which both the primary and tertiary winds blow. In the
winter the stress required to lift the dune sand is 1.5 times that required in the
summer, indicating that conditions leading to saltation vary with the seasons in
Proctor Crater. This difference may explain why the tertiary winds dominate over
the primary winds in dune morphology on the eastern edge of the dunefield, as
192
Fig. 4.8. a.) Saltation threshold as a function of air temperature. Note the difference in threshold stress values between the primary and tertiary winds. b.) Maximum predicted stresses over the dunefield in each model run.
discussed in Section 2.1.1. Even though the winter winds are stronger than the
summer winds that are aligned with the Tertiary slipfaces (see Fig. 4.7), the lower
threshold stress during the summer suggests that these winds may be relatively
more effective in moving sand.

193
Although winds predicted by the Mars MM5 are well aligned with two observed
slipface orientations, the calculated wind stresses are not high enough to predict
sand saltation. Figure 4.8b shows the maximum calculated wind stresses over the
dunefield in each of the twelve model runs. Even though the winter winds are the
strongest of the year, they are still not above the lower summertime saltation
threshold. There are a number of reasons why the model may not be predicting
winds that are strong enough to saltate sand. The first and most obvious reason is
that the grid spacing of 10 km by 10 km is too large to capture local wind gusts,
with each grid point representing an average predicted wind over a 100 km2 area.
This is a problem that has plagued modelers applying GCM wind predictions to
sand saltation [e.g., Greeley et al,. 1993; Anderson et al., 1999; Toigo et al., 2002b]. A
recent sensitivity study of model resolution in a terrestrial mesoscale model
indicates that predicted wind stresses are more accurate at higher resolutions in
which the topography is better defined [Liu and Westphal, 2001]. Thus model
resolution appears to be a significant factor in predicting wind strength, and this
may be the case for our model runs as well. A second possibility is that during the
model runs, although the timestep was 5 seconds, we only outputted winds from
the top of each hour to conserve disk space. It may be that winds above the
saltation threshold would have been captured if instead the strongest winds of
each hour were considered, because rare wind gusts may produce saltation. We
consider the 10 km scale of the model runs in this work to be the source of the
problem of weak winds.
3.2.4. Spatial Variation and Origin of Wind Orientations. The primary winds
appear to influence dunes, falling dunes, and bright duneforms throughout the
interior of Proctor Crater. The tertiary dunes only affect the eastern edge of the
dunefield and perhaps the orientations of some of the bright duneforms in the
eastern portion of the crater floor. Modeled winds should reflect this pattern if
they truly represent actual surface winds.

194
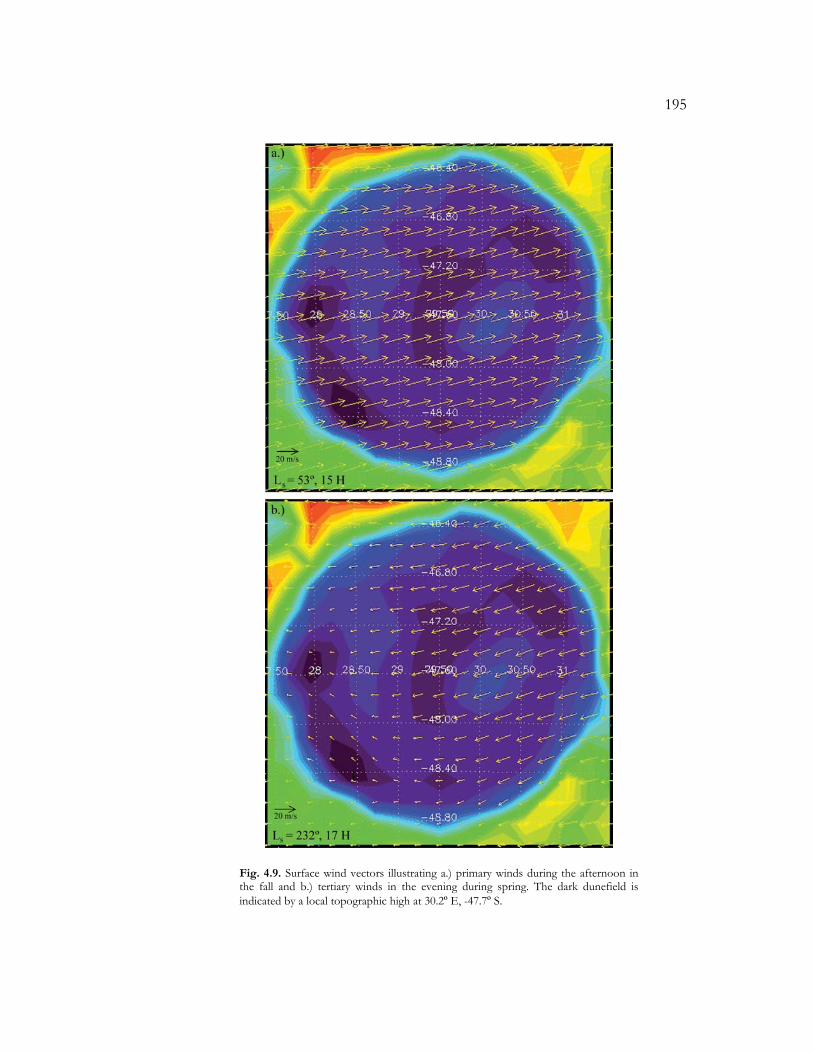
Figure 4.9 shows two maps of instantaneous winds. The winds are superimposed
on a MOLA elevation map, with violets and blues indicating low elevations. The
dunefield is visible as a lighter blue mound at 30.2º E, -47.7º S. Figure 4.9a shows
afternoon winds during fall, when the primary winds blow (see Fig. 4.7). The
arrows represent the velocities of the lowest-level winds, at a height of ~250 m.
The winds across the whole area are oriented from the WSW, indicating that the
primary winds do in fact influence the entire crater floor. These fall and winter
winds are simply midlatitude westerlies created by a geostrophic force that is
strengthened by the strong latitudinal temperature gradient present in the winter
hemisphere. The slight deflection to the south is caused by the presence of the
Hellas basin some 900 km to the east, which warps the approaching winds.
Figure 4.9b shows another wind map, this time from the early evening hours
during the spring. Strong winds from the east-northeast dominate the eastern
portion of the crater. These are the tertiary winds that control dune morphology
on the eastern edge of the dunefield. As the evening progresses, the ENE winds
sweep across the crater floor until they are the sole winds blowing in this area, but
the fact that they blow for a longer period of time in the eastern part of the crater
floor likely explains why they are only visible there. This set of winds is caused by
the diurnal tide, in which winds east of the subsolar (noonday) point surge
towards this point to fill the vacuum caused by rising air in the summer noontime
heat. Furthermore, as the ENE winds cross the eastern rim of Proctor Crater,
they encounter relatively warmer air rising from the crater floor ~1500 m below.
The air spills beneath this lighter air into the crater in a katabatic flow,
accelerating down and across the crater floor. It is these winds that explain why
sand has become trapped in Proctor Crater: the primary winds blew sand into the
crater from the WSW, but the sand stopped when it encountered the tertiary
winds from the ENE that effectively stop dune migration to the east. Sand
outside the crater does experience ENE winds at this time of year, but on the
195
Fig. 4.9. Surface wind vectors illustrating a.) primary winds during the afternoon in the fall and b.) tertiary winds in the evening during spring. The dark dunefield is indicated by a local topographic high at 30.2º E, -47.7º S.

196
intercrater plains these winds are not enhanced by topography as they are in the
floor of Proctor Crater, and so sand did not accumulate on the intercrater plains.
Material that was not trapped in craters in Noachis Terra most likely continued to
migrate downwind and was likely trapped in the Hellas basin to the east.
Another way to show the spatial distribution of wind orientations across the
dunefield is to show rose diagrams for each grid point in the model run.
Figure 4.10a shows a rose diagram for each such grid point summed over each of
the twelve model runs. The histograms show frequency of wind orientation
without regard to wind strength, and thus they emphasize wind persistence. The
outer white ring outlines the Proctor Crater rim, and the smaller inner ring
defines the edge of the dunefield. Like the histograms of surface feature
orientations, these rose diagrams show the downwind direction (for example, an
accumulation of winds oriented to the north in these diagrams indicates winds
blowing from the south). In most areas of the crater floor, winds from the WSW
dominate over all other wind directions throughout the year. In no cases are
secondary winds, from the ESE, present in any quantity. In the northwest and
southeast edges of the crater floor, a northwesterly wind predominates, but it is
not reflected in any observed aeolian feature on the surface. These winds are
likely too weak to carry sand or scour material from the surface, but they do
occur frequently enough to appear on this figure.
A better way to emphasize the variation in wind variation is to subtract from all
grid points the histogram from a single control grid point. Figure 4.10b shows the
cumulative winds at each grid point minus the winds at the control point, which
we chose from the center of the dunefield (marked in boldface). Thus all of the
differenced rose diagrams show winds with respect to those predicted over the
center of the dunefield. Note that the scale of the histograms, marked on the left,
varies from one plot to the next. Compared to Fig. 4.10a, the variation in wind

197
Fig. 4.10. a.) Rose diagram of all wind orientations in all model runs for each grid point across the crater, and b.) the same differenced with a control rose diagram from the center of the dunefield (marked in boldface). The crater rim and dunefield are outlined in white. c.) and d.) show the same as a.) and b.), zoomed in on the dunefield. Note that these diagrams indicate downwind direction.
orientation from point to point in Fig. 4.10b is much more visible. The center of
the crater has winds fairly similar to those observed on the dunefield. The
northwesterly winds at the northwestern and southeastern edge of the crater are
much easier to discern. Tertiary winds from the ENE are clearly more common
in the eastern portion of the crater floor, precisely where aeolian features in MOC
images indicate that they exist. The primary winds are more persistent at the edge

198
of the crater, in the southeast, than elsewhere, which may indicate that more
erosion and sand migration is occurring near the edge of the crater floor than
downwind near the dunefield.
Figure 4.10c shows summed rose diagrams for all model runs over the dunefield,
with the dunefield outlined in a thick white ring. The dunefield itself shows rose
diagrams that appear to vary little from point to point. The primary winds, from
the WSW, are clearly the most frequent winds that blow over the dunefield.
When the control point is subtracted from the rose diagrams, more detail appears
(see Fig. 4.10d). The tertiary winds from the ENE influence the eastern portion
of the dunefield, which is consistent with the distribution of the tertiary dune
slipfaces. The northwesterly wind that appeared in Fig. 4.10a and 4.10b appears
again on the eastern edge of the dunefield, again reflecting frequent but weak
winds that cannot saltate sand.
On the northwest edge of the dunes, there are signs of winds that are aligned
with the mysterious secondary winds. This is the portion of the dunefield in
which the secondary-facing dune slipfaces dominate. The ESE winds in
Fig. 4.10d are caused by winds in transition from one dominant direction to
another. For example, modeled winds correlate with the secondary winds in the
late afternoon during spring and summer as winds shift from the early and mid
afternoon WSW winds that produce dust devil tracks to the evening ENE tertiary
winds (see Fig. 4.7b–d). In addition, modeled winds aligned with the secondary
winds occur in the evening during the seasonal transition from the winter to
summer wind regime (see Fig. 4.7a and 4.7l) and again during the transition from
the summer to the winter wind regime (see Fig. 4.7f). The winds are not strong in
either case, and they do not persist in the direction of the secondary winds for
any length of time. Thus although some winds aligned with the secondary winds

199
are predicted by the model, they are not likely responsible for forming the
observed slipfaces.
4. Discussion and Conclusion
The Mars MM5 model runs predict and explain the wind patterns behind two of
three observed dune slipface orientations as well as dust devil track orientations.
However, it does not produce winds matching a third dune slipface orientation of
any strength or duration. One possible explanation for the missing secondary
winds is that the Mars MM5 model runs covered too small a domain and thus did
not account for regional effects that might influence wind directions, such as the
deep Hellas basin 900 km to the east. One way to check for such an inconsistency
is to compare the Mars MM5 results to those from a GCM.
The primary and tertiary winds, as well as the WSW summer winds that produce
dust devil tracks, are visible in GCM wind predictions as well as in Mars MM5
model runs. Fenton and Richardson [2001b] made global predictions of surface
winds using the GFDL Mars GCM. The average southern fall and winter winds
at the location of Proctor Crater (47.5º S, 30º E) are from the WNW to WSW,
fairly consistent with the primary winds (see Figs. 1a and 1b of Fenton and
Richardson [2001b]). Summer evening winds come from the ENE following the
diurnal tide, and summer afternoon winds come from the WSW following a
deflection of Hadley circulation winds (see Plates 1c and 1d of Fenton and
Richardson [2001b]). The daytime wind that Fenton and Richardson [2001b] found
matched bright streaks is responsible for creating dust devil tracks, and the
evening wind that they found matched dark streaks is the tertiary wind that also
produces one of the dune slipface directions. Modeled winds aligned with the
secondary winds are absent from the GFDL Mars GCM runs as well as the Mars
MM5 runs described here. Therefore, the Mars MM5 runs are consistent with

200
global model results, and no large-scale effects have been erased by the use of a
small domain.
Further possible sources of the secondary winds must be considered. For
example, there may be unusual but strong storms that occasionally pass through
the area, with wind gusts that carry large quantities of sand. Such storms may be
infrequent enough that they are not predicted by GCM’s, but of enough strength
that the secondary slipfaces are maintained.
If the secondary winds are instead produced by a common annually-reproduced
wind pattern, then a method must be found for discovering why they are not
represented in this work. A number of craters in Noachis Terra contain
dunefields, each of which has slipfaces indicating the strongest surface winds that
influence the area. If these secondary winds persist throughout the region,
perhaps to different degrees in different dunefields, then an understanding of the
regional distribution of winds can be gained. A potential way to resolve the issue
of the missing wind is to model winds over nearby craters to determine if these
secondary winds are predicted elsewhere, and how well those predictions match
the dune morphology.
Regardless of the missing secondary wind, the Mars MM5 successfully predicts all
other wind orientations indicated by aeolian features on the surface. The primary
winds are fall and winter afternoon westerlies that dominate the crater floor. The
tertiary winds are spring and summer evening easterly katabatic flows that are
concentrated in the eastern portion of the crater floor, consistent with observed
dune slipfaces. These tertiary winds also explain the trapping of sand in crater
floors, for they oppose the primary winds that move sand through the area. The
tertiary winds are present throughout the region but they are only strong enough
on the crater floors to counter the strong primary winds. Dust devil tracks are

201
produced by weak early afternoon westerly spring and summer winds produced
by planetary rotation. The Mars MM5 results explain the source of the winds that
produce aeolian features, making it a useful tool for understanding and predicting
aeolian processes on the Martian surface.
5. Acknowledgements
We would like to thank Arden Albee for a helpful review of the manuscript, and
Shawn Ewald for keeping the model chugging along.