Embed Size (px)
Citation preview

Division of Emergency Management 2018 Statewide Emergency Shelter Plan
2018
Statewide Emergency Shelter Plan
January 31, 2018
Rick Scott Wesley Maul Governor Director

Division of Emergency Management 2018 Statewide Emergency Shelter Plan Table of Contents Page Table of Contents List of Appendices, Tables and FiguresExecutive Summary i 1.0 INTRODUCTION 1-1 1.1 Purpose of Statewide Emergency Shelter Plan 1-1 1.2 Background and Chronology 1-1 1.3 Statutory Considerations 1-3 2.0 EDUCATIONAL FACILITIES AS EMERGENCY SHELTERS 2-1 2.1 Public Shelter Design Criteria 2-1 2.2 Exemption Criteria 2-2 2.3 Exemption Process 2-9 2.4 Estimate of School District Compliance with EHPA Code 2-9 3.0 REGIONAL HURRICANE EVACUATION SHELTER REQUIREMENTS 3-1 3.1 Methodology for Calculating Regional and County Hurricane
Evacuation Shelter Status 3-2
3.2 3.3 3.4
Location and Square Footage of Existing and Needed Shelters County Hurricane Evacuation Shelter Status Pet-Friendly Shelter Availability
3-4 3-4
3-7 4.0 TYPES OF PUBLIC FACILITIES THAT SHOULD COMPLY WITH
PUBLIC SHELTER DESIGN CRITERIA 4-1
4.1 Public Schools and Colleges 4-1 4.2 Charter Schools 4-2 4.3 State Universities 4-2 4.4 State and Local Public Facilities 4-3
5.0 RECOMMENDED SOURCES OF FUNDING 5-1 5.1 Public Schools, Colleges and University Facilities 5-1
6.0 STATEWIDE PROGRESS TOWARD ELIMINATING THE PUBLIC HURRICANE EVACUATION SHELTER SPACE DEFICIT
6-1
7.0 CONCLUSIONS 7-1 APPENDICES

Division of Emergency Management 2018 Statewide Emergency Shelter Plan
List of Appendices Appendix A: List of Hurricane Evacuation Shelters by County, Location and Capacity Appendix B: 2010 FBC—Building, Section 453.25 Public Shelter Design Criteria Appendix C ARC 4496 - Standards for Hurricane Evacuation Shelter Selection Appendix D: Acronyms Appendix E: Glossary Appendix F:
Mass Care Standards and Indicators, Version 011-072209
Appendix G: Guidance for Implementation of Public Shelter Design Criteria Appendix H: Hurricane Evacuation Shelter Net Usability Multiplication Factor Estimates for
Department of Education Facilities Appendix I: Department of Education Memorandum on Hurricane Shelters in New Educational
Facilities, dated October 31, 2001 Appendix J: Hurricane Shelter Demand Study Table Appendix K: Guidance for Selection of Impact Resistant Constructed Wall and Roof Assemblies Appendix L1: Appendix L2:
ADA Checklist for Existing Facilities The ADA and Emergency Shelters: Access for All in Emergencies and Disasters

Division of Emergency Management 2018 Statewide Emergency Shelter Plan
List of Tables Page Table EX-1: Regional Summaries of Hurricane Shelter Demand, Capabilities, ii and Deficits / Sufficient Capacities Table 3-1: Shelter Demand/Capacity In Spaces 3-9 Table 3-2: Shelter Demand/Capacity In Square Feet 3-12 Table 6-1: Hurricane Shelter Deficit Reduction Cumulative Progress (1995-2018) 6-3 Table G-1: Equivalent Basic Wind Speed Conversions G-6 Table G-2: Florida Shelter Occupant Space Calculation Recommendations G-14 with FNSS for Dormitory Area Table G-3: Estimate of Minimum Daily Drinking Water Needs G-15 in Unconditioned Shelters Table G-4: Comparison of Florida’s EHPA to the International Code Council’s G-20 ICC 500 Hurricane Shelter Standard Table K-1: Windborne Debris Impact Criteria Comparisons for Vertical Surfaces K-3 Table K-2: Windborne Debris Impact Criteria Comparisons for Horizontal Surfaces K-4

Division of Emergency Management 2018 Statewide Emergency Shelter Plan
List of Figures Page Figure 2-1: Regional Hurricane Evacuation Shelter Space Deficit / Sufficient Status 2-7 of General Population Shelters Figure 2-2 Regional Hurricane Evacuation Shelter Space Deficit / Sufficient Status 2-8 of Special Needs Shelters Figure 3-1: Regional Planning Council (RPC) Regions of Florida 3-1 Figure 3-2: County Hurricane Evacuation Shelter Space Deficit / Sufficient Status 3-5 of General Population Shelters Figure 3-3: County Hurricane Evacuation Shelter Space Deficit / Sufficient Status 3-6
of Special Needs Shelters Figure 3-4: Florida Counties with Designated Pet-Friendly Shelters 3-8 Figure 6-1: Projected Hurricane Shelter Deficit Reduction 6-6 Figure G-1: ICC 500 Hurricane Design Wind Speed Map G-3 Figure G-2: ASCE 7-2010 and 2014 Florida Building Code—Building, G-4 Risk Category IV Design Wind Speed Map Figure G-3: ASCE 7-2010 and 2014 Florida Building Code—Building, G-5 Risk Category IV Design Wind Speed Map (Wind-Borne Debris Region)

Division of Emergency Management 2018 Statewide Emergency Shelter Plan
i
EXECUTIVE SUMMARY
Pursuant to §1013.372(2) and §252.385(2)(b), Florida Statutes, (F.S.) the Division of Emergency Management (Division) is responsible for preparing a Statewide Emergency Shelter Plan (the Plan). The Plan is a guide for local emergency planning. It also provides advisory assistance to school districts contemplating construction of educational facilities and the need to provide public shelter space within those facilities. The Plan is submitted to the Governor and Cabinet for approval by January 31 of each even-numbered year. The Plan identifies the general location and square footage of existing general population (GP) and special needs shelter (SpNS) space, by Regional Planning Council (RPC) region, and needed space during the next five (5) years. The Plan also includes information on the availability of shelters that accept pets. In accordance with the statute, the Plan must:
Identify the general location and square footage of existing shelters by RPC regions;
Identify the general location and square footage of needed shelters by RPC regions for the next five years;
Identify the types of facilities which should be constructed to comply with the public shelter design criteria; and
Recommend an appropriate and available source of funding for the additional cost of constructing emergency shelters within those public facilities.
With publication of the 2006 Plan, the Division began monitoring the status of the statewide inventory of SpNS. Historically, SpNS had been included in total population hurricane evacuation shelter demand estimates and hurricane evacuation shelter capacities. Given the findings from the 2004 hurricane season where about half of the designated SpNS were located in facilities that did not meet the same minimum hurricane safety criteria as GP shelters, the Division was asked to separate the two shelter types and monitor progress towards improving SpNS hurricane safety, client capacity and provision of standby electric power supported air-conditioning.
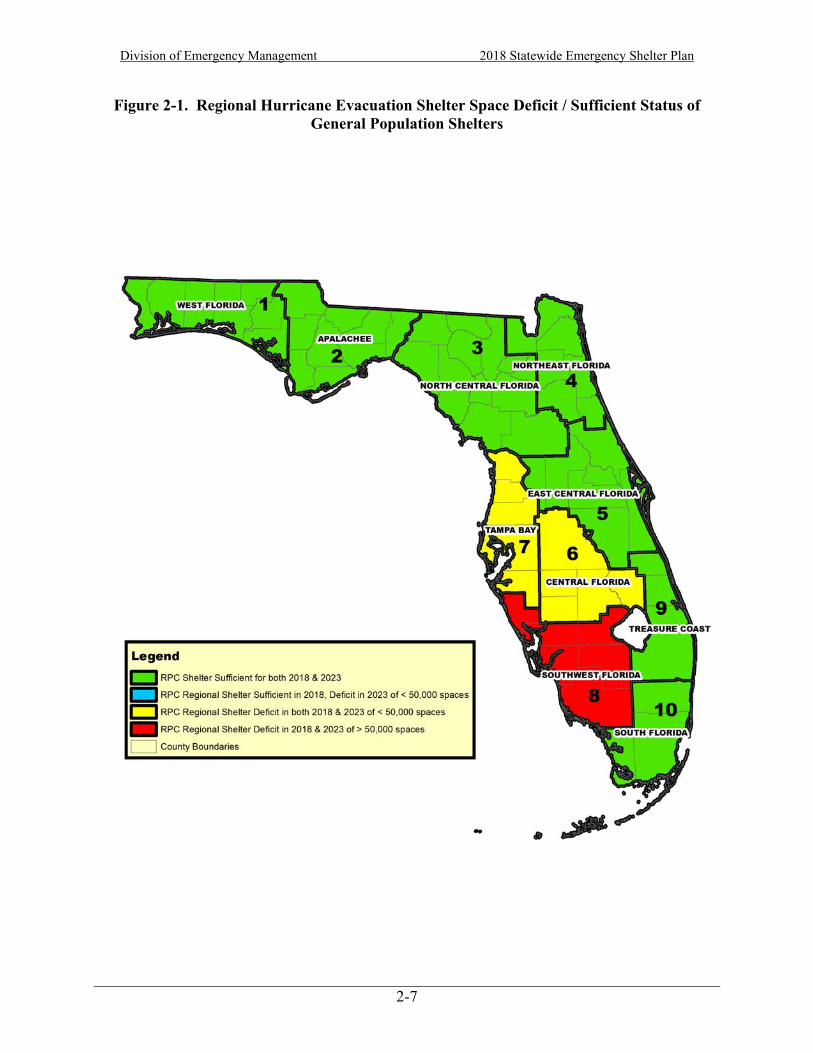
Table EX-1 provides a regional summary of the projected regional hurricane evacuation shelter space demands for 2018 and 2023, the quantity of recognized hurricane evacuation shelter spaces per region, and if there is a deficit or sufficient capacity of spaces per region. At this time, seven (7) RPC regions have a sufficient capacity of GP hurricane evacuation shelter space in 2018 (West Florida/Region 1, Apalachee/Region 2, North Central Florida/Region 3, Northeast Florida/Region 4, East Central Florida/Region 5, Treasure Coast/Region 9 and South Florida/Region 10). Nine (9) out of ten (10) RPC regions continue to have a deficit of SpNS spaces in 2018.

2018Category 5
Shelter Demand, persons
2023Category 5
Shelter Demand, persons
2018Risk Shelter
Capacity, persons
2018 Shelter Deficits / Sufficient Capacity, persons
2023Shelter
Deficits / Sufficient Capacity, persons
2018Category 5
Shelter Demand,
clients
2023Category 5
Shelter Demand,
clients
2018Risk Shelter
Capacity, clients
2018Shelter
Deficits / Sufficient Capacity, persons
2023Shelter
Deficits / Sufficient Capacity, persons
1 West Florida (WF) 33,253 33,719 80,036 46,783 46,317 2,899 2,940 2,785 (114) (155)
2 Apalachee (APAL) 12,861 13,091 43,061 30,200 29,970 2,541 2,612 811 (1,730) (1,801)
3 North Central Florida (NCF) 52,316 52,629 67,329 15,013 14,700 3,396 3,419 3,021 (375) (398)
4 Northeast Florida (NEF) 82,319 82,744 138,671 56,352 55,927 5,742 5,847 4,627 (1,115) (1,220)
5 East Central Florida (ECF) 155,001 156,053 176,597 21,596 20,544 9,109 9,175 7,167 (1,942) (2,008)
6 Central Florida (CF) 66,478 67,479 51,898 (14,580) (15,581) 4,960 5,050 1,424 (3,536) (3,626)
7 Tampa Bay (TB) 174,867 177,669 159,991 (14,876) (17,678) 8,597 8,759 8,536 (61) (223)
8 Southwest Florida (SWF) 148,168 148,987 25,220 (122,948) (123,767) 8,696 8,748 110 (8,586) (8,638)
9 Treasure Coast (TC) 48,723 49,538 115,912 67,189 66,374 6,272 6,395 3,251 (3,021) (3,144)
10 South Florida (SF) 128,744 129,097 144,042 15,298 14,945 4,455 4,466 4,979 524 513
TOTALS: 902,730 911,006 1,002,757 100,027 91,751 56,667 57,411 36,711 (19,956) (20,700)
Table EX-1.Regional Summaries of Hurricane Shelter Demands and Deficits / Sufficient Capacities for 2018 though 2023
General Population and Special Needs Shelters
RPC Region RPC Region Name
General Population Shelter Demand and Capacities Special Needs Shelter Demand and Capacities
Division of E
mergency M
anagement
2018 S
tatewide E
mergency Shelter P
lan
ii

Division of Emergency Management 2018 Statewide Emergency Shelter Plan
iii
Based upon currently available information, RPC regions 1, 2, 3, 4, 5, 9 and 10 will continue to have sufficient GP space through 2023. The SpNS regional hurricane evacuation shelter space deficit situation is projected to continue through 2023. The projections do not assume addition of new space to regional inventories through 2023. Addition of new shelter facilities and/or local designation of new space could significantly reduce or eliminate the projected deficits.
The types of public facilities that should be constructed to comply with public shelter design criteria include all facilities that are subject to be used as public hurricane evacuation shelters under the authority of §252.385(4)(a), F.S; that is, public schools, community or state colleges, universities, and other facilities owned by state and local governments. When appropriately located, designed and constructed, the following types of facilities are normally considered suitable for use as public hurricane evacuation shelters:
Community and civic centers, meeting halls, gymnasiums, auditoriums, cafeterias and open floor multipurpose facilities, exhibition halls, sports arenas, field houses, conference and training centers, certain classroom buildings, and other public assembly facilities.
The types of facilities that are not appropriate for use as public shelters are due to the following elements:
Location (facilities within Category A, B or C hurricane evacuation zones, and possibly Category D and E, flooding isolation, presence of certain hazardous materials, low evacuation demand, etc.),
Size (e.g., less than 2,000 square feet of usable floor area), or Other characteristics (e.g., incompatibility of facility’s normal use or availability with
mass care function, long-range planning considerations, etc.).
During preparation of this Plan, the Division conducted a survey to estimate the compliance rate of school districts adhering to the statutory and code requirements of the public shelter design criteria for new school facilities construction. In 2001, the State Auditor General had a finding that, of the new schools reviewed, only 65 percent appeared to comply with the public shelter design criteria. Between 2001 and 2009 the Division observed a similar compliance rate of 65 percent. The compliance with the law has improved. For last year’s survey (Fiscal year 2015-2016) the Department of Education reported a finding of 100 percent compliance in the regions where the requirement applies and new facilities are being built.
District school boards have generally been reporting that the construction cost premium
for incorporating the criteria is about three (3) to nine (9) percent. This is not necessarily an insignificant cost that must be borne by state and local agencies. Therefore, §1013.372(2), F.S. requires that the Division recommend an appropriate and available source of funding for the additional cost of constructing emergency shelters. The Division recommends the use of existing capital outlay funds as they are an appropriate and available source of funding.
The Division has statutory duty and authority to administer a statewide program to
eliminate the deficit of “safe” hurricane evacuation shelter space. To ensure consistency with state and national standards, guidelines and “best practices,” the Division has recognized the

Division of Emergency Management 2018 Statewide Emergency Shelter Plan
iv
American Red Cross (ARC) Standards for Hurricane Evacuation Shelter Selection (ARC 4496) as the minimum hurricane evacuation shelter survey criteria. Therefore, at a minimum, meeting ARC 4496 criteria is a required condition for a public facility to be described as “safe,” “suitable” or “appropriate” during preparation of this Plan.
To accomplish this duty, the Division has implemented a multifaceted program. This program includes: 1) survey of existing buildings, both public and private, to identify suitable shelter capacity; 2) where cost effective (and practical), support mitigation and retrofitting of existing facilities to increase shelter capacity; 3) construction of new facilities to meet the public shelter design criteria; 4) shelter demand reduction through improved hurricane hazard models and behavioral studies; and 5) improve public information/education to reduce unnecessary “shadow” evacuations.
While regional deficits do remain, Florida’s deficit of general population hurricane evacuation shelter space on a statewide aggregate basis has now been eliminated. However, a deficit of special needs hurricane evacuation shelter space persists. The Division’s hurricane evacuation shelter survey and retrofit program identified, created or otherwise documented 539,793 hurricane evacuation shelter spaces that meet ARC 4496 guidelines. Public school new construction programs have created an additional 465,675 hurricane evacuation shelter spaces. Therefore, by the 2018 hurricane season, Florida will have a total of 1,039,468 shelter spaces that meet ARC 4496 guidelines. The perceived public shelter demand resulting from hurricane evacuation has been significantly reduced over the past 15 years due to improvements in public education and information, and more accurate storm surge/evacuation zone modeling with the use of the LiDAR (Light Detection and Ranging). The 2010 Statewide Regional Evacuation Studies (SRES) resulted in a statewide aggregate hurricane evacuation shelter space demand reduction. Florida’s hurricane evacuation shelter space demand for 2018 is 959,397.
With publication of this Plan, Florida now has 43 counties with sufficient capacity of GP hurricane evacuation shelter space. The counties with sufficient GP space include: Alachua, Baker, Bay, Bradford, Brevard, Broward, Calhoun, Columbia, Dixie, Duval, Escambia, Flagler, Gadsden, Gilchrist, Glades, Hamilton, Hardee, Hendry, Hillsborough, Holmes, Indian River, Jackson, Jefferson, Lafayette, Lake, Leon, Levy, Liberty, Madison, Martin, Nassau, Okaloosa, Orange, Osceola, Palm Beach, Saint Johns, Saint Lucie, Santa Rosa, Seminole, Taylor, Union, Walton, and Washington.
There are fewer counties, 30, with a sufficient capacity of SpNS hurricane evacuation shelter space. The counties with a sufficient capacity of SpNS space include: Baker, Brevard, Broward, Citrus, Clay, Columbia, DeSoto, Escambia, Flagler, Gilchrist, Glades, Hamilton, Hardee, Hernando, Hillsborough, Indian River, Lafayette, Leon, Levy, Manatee, Martin, Miami-Dade, Osceola, Pasco, Putnam, Saint Johns, Santa Rosa, Union, Volusia and Washington.
As Florida’s hurricane vulnerable population continues to grow, it is vitally important that construction of hurricane evacuation shelters and retrofitting of existing buildings be considered a priority. If Florida is to meet its goal of eliminating the hurricane evacuation shelter space deficit in every region of the state, the incorporation of public shelter design criteria into new construction, retrofitting of suitable existing buildings, and continued use of improved hurricane evacuation studies and new technologies must continue to be accomplished. The overall result of full implementation of the Division’s hurricane evacuation shelter deficit

Division of Emergency Management 2018 Statewide Emergency Shelter Plan
v
reduction strategy is a greater level of emergency preparedness, a more efficient capability for responding to incidents and a greater ability to meet the needs of disaster survivors.

Division of Emergency Management 2018 Statewide Emergency Shelter Plan
1-1
1.0 INTRODUCTION 1.1 Purpose of Statewide Emergency Shelter Plan Pursuant to §1013.372(2), and §252.385(2)(b), Florida Statutes (F.S.), the Statewide Emergency Shelter Plan (Plan) is prepared and submitted to the Governor and Cabinet for approval. The Plan provides information on existing and needed hurricane evacuation shelter space requirements. This information is then used by district school boards, college boards of trustees, university boards of trustees and emergency management agencies in planning for the construction of new educational facilities to comply with the public shelter design criteria. "Board," unless otherwise specified, means a district school board, a college board of trustees, and a university board of trustees. This Plan, once approved, will determine which regions and counties are required to construct new educational facilities to comply with the public shelter design criteria. The Plan includes: the general location and square footage of existing general population and special needs shelters (SpNS) by region and county; the general location and square footage of needed general population and SpNS by region and county for the next five years; the types of facilities that should comply with the public shelter design criteria; and recommends an appropriate and available source of funding for the additional cost of constructing public hurricane evacuation shelters in those public facilities.
Since promulgation of the public shelter design criteria in 1997, the Division has routinely received requests for guidance on certain aspects of the criteria. Therefore, this Plan also includes advisory guidance by the Division on subjects relating to implementation of the criteria; such as, minimum mass care/human needs requirements not specified in the code, explanation of exemption criteria, etc. The guidance is not intended to be a comprehensive commentary of the criteria, but is limited to subjects pertinent to the most frequently asked questions. This Plan also includes a brief progress summary of statewide hurricane evacuation shelter space deficit elimination. 1.2 Background and Chronology
On August 24, 1992, Hurricane Andrew made landfall in South Florida as a Category 5 hurricane. Winds in excess of 155 miles per hour spread inland, causing catastrophic damage in Miami-Dade County and other South Florida areas. It has been estimated that 750,000 persons were ordered to evacuate coastal areas, inland flood prone areas and manufactured homes. In some cases, spontaneous (or “shadow”) evacuation of persons outside of areas ordered to evacuate also occurred. Though many evacuees sought shelter in motels or the homes of family and friends, many also sought safety in public shelter facilities in the affected area, and in communities along evacuation routes throughout the state. This unprecedented relocation of Florida’s residents and visitors in the face of an impending natural disaster stretched the resources of State, local, and private agencies to provide public shelter.

Division of Emergency Management 2018 Statewide Emergency Shelter Plan
1-2
Post-disaster evaluations of evacuation and sheltering operations by the Governor's Disaster Planning and Response Review Committee, also known as the “Lewis Commission,” identified the lack of adequate and appropriate public shelter space as a critical planning issue. The Lewis Commission Report served as the driving force behind the adoption of Chapter 93-211, Laws of Florida, and subsequent revisions to Chapters 235, 240 and 252, Florida Statutes. The educational facilities sections of Chapters 235 and 240 have been superseded by Chapter 1013. Based on those revisions, the Legislature stated its intent that Florida eliminate its deficit of safe public hurricane evacuation shelter space in every region of the State.
The statute directed the Department of Education to develop standards for a public shelter
design criteria in consultation with boards, county emergency management offices, and the Division of Emergency Management. The new criteria were to be designed to ensure that appropriate new educational facilities can serve as public shelters for emergency management purposes. After promulgation of the criteria, all new educational facilities, or appropriate areas within facilities, for which a design contract was entered into after the effective date of inclusion in State Requirements for Educational Facilities (SREF), must be built in compliance with the criteria. The facility may be exempted with concurrence of the applicable local emergency management agency or the Division.
The Department of Education entered into a contract with the University of Florida,
School of Building Construction, to prepare the public shelter design criteria. The university assembled an advisory committee consisting of members from Federal, State and local emergency management agencies, architects, engineers, academia, district school boards and the American Red Cross (ARC). The task before the advisory committee was to develop criteria that balanced the need to provide a relatively safe and self-sufficient facility, with the need for cost-effective designs and construction methods.
The advisory committee incorporated not only its collective knowledge, experience and
existing national codes and standards, but also consulted with Texas Tech and Clemson Universities for severe storm research findings, and with relevant publications, such as the American Red Cross’ Mass Care—Preparedness and Operations (ARC 3031, superseded by ARC 3041), Guidelines for Hurricane Evacuation Shelter Selection (ARC 4496), and the Department of Energy’s (DOE) Standard Natural Phenomena Hazards Design and Evaluation Criteria (DOE-STD-1020).
The product of this process is a set of comprehensive design criteria that includes
structural enhancements, potable water and sanitary requirements, provisions for standby emergency power, and other considerations that improve survivability and shelter management operations. The promulgation process began in 1994, and was adopted into SREF on April 28, 1997. Subsequently, along with other sections of SREF, the criteria were incorporated into Chapter 423 of the Florida Building Code, which became effective March 1, 2002, and then Chapter 453 of the 5th Edition (2014) on June 30, 2015. This provided a seamless continuation of the criteria for new school construction projects. The public shelter design criteria code provisions in effect at the time of publication of this Plan can be seen in Appendix B.

Division of Emergency Management 2018 Statewide Emergency Shelter Plan
1-3
The public shelter program lessons learned from Hurricane Andrew were further reiterated during the 2004 and 2005 hurricane seasons. During these two seasons alone, approximately 15 million people in Florida were under evacuation orders due to eight (8) hurricanes and two (2) tropical storms. During 2004 and 2005, nearly every county in Florida was under hurricane or inland high wind warnings at some time, prompting mandatory evacuation orders for their coastal storm surge, inland flood vulnerable and manufactured home residents. More than 1,200 shelters were opened, which safely protected about 300,000 evacuees. In preparation for Hurricane Irma in 2017, evacuations were ordered in nearly all of Florida’s 67 counties. The orders affected more than 6 million vulnerable citizens. About 200,000 sheltered across the state.
In a large-scale emergency, the availability of shelter space is a statewide challenge.
Even if some individual counties have a sufficient capacity of shelter space, deficits in other counties have statewide implications that will have to be addressed. Evacuees that cannot find shelter space within their own county or region will leave those areas in search of viable shelter alternatives elsewhere. Thus, implementation of the public shelter design criteria in new educational facilities is a critical component of Florida’s hurricane evacuation shelter space deficit elimination program. 1.3 Statutory Considerations
There are several statutory authorities that are applicable for implementation of the public shelter design criteria. The following statutes have been selected to provide context for decisions relating to planning and exemption of educational facilities. 252.38 Emergency management powers of political subdivisions.--Safeguarding the life and property of its citizens is an innate responsibility of the governing body of each political subdivision of the state. (1) COUNTIES.-- (d) During a declared state or local emergency and upon the request of the director of a local emergency management agency, the district school board or school boards in the affected area shall participate in emergency management by providing facilities and necessary personnel to staff such facilities. Each school board providing transportation assistance in an emergency evacuation shall coordinate the use of its vehicles and personnel with the local emergency management agency.
§252.38, F.S. provides that “Safeguarding the life and property of its citizens is an innate responsibility of the governing body of each political subdivision of the state.” This places the duty for evacuating and sheltering at-risk citizens during an emergency or disaster upon county governing boards (i.e., Board of County Commissioners). To expand and expedite locally available resources to meet an emergency need, the Legislature directed that during a declared state or local emergency, district boards will upon request participate in emergency management by providing facilities, personnel, equipment and vehicles.

Division of Emergency Management 2018 Statewide Emergency Shelter Plan
1-4
District public schools are the primary source of public shelter during tropical weather related emergencies, currently accounting for about 97 percent of statewide hurricane evacuation shelter space. Therefore, it can be presumed that public schools will be used as hurricane evacuation shelters, and often staffed by district personnel. It can also be presumed that public schools will be opened as shelters regardless of the storm’s forecasted intensity and track. Therefore, it is critical that new school facilities be appropriately designed and located to serve the required emergency function.
252.385 Public shelter space.-- (1) It is the intent of the Legislature that this state not have a deficit of safe public hurricane evacuation shelter space in any region of the state by 1998 and thereafter. (2)(a) The division shall administer a program to survey existing schools, universities, community colleges, and other state-owned, municipally owned, and county-owned public buildings and any private facility that the owner, in writing, agrees to provide for use as a public hurricane evacuation shelter to identify those that are appropriately designed and located to serve as such shelters. The owners of the facilities must be given the opportunity to participate in the surveys. The state university boards of trustees, district school boards, community college boards of trustees, and the Department of Education are responsible for coordinating and implementing the survey of public schools, universities, and community colleges with the division or the local emergency management agency. (b) By January 31 of each even-numbered year, the division shall prepare and submit a statewide emergency shelter plan to the Governor and Cabinet for approval, subject to the requirements for approval in s. 1013.37(2). The plan shall identify the general location and square footage of special needs shelters, by regional planning council region, during the next 5 years. The plan shall also include information on the availability of shelters that accept pets. The Department of Health shall assist the division in determining the estimated need for special needs shelter space and the adequacy of facilities to meet the needs of persons with special needs based on information from the registries of persons with special needs and other information. (4)(a) Public facilities, including schools, postsecondary education facilities, and other facilities owned or leased by the state or local governments, but excluding hospitals, hospice care facilities, assisted living facilities, and nursing homes, which are suitable for use as public hurricane evacuation shelters shall be made available at the request of the local emergency management agencies. The local emergency management agency shall coordinate with these entities to ensure that designated facilities are ready to activate prior to a specific hurricane or disaster. Such agencies shall coordinate with the appropriate school board, university, community college, state agency, or local governing board when requesting the use of such facilities as public hurricane evacuation shelters.

Division of Emergency Management 2018 Statewide Emergency Shelter Plan
1-5
§252.385, F.S. states the intent of the Legislature to eliminate the deficit of “safe” public hurricane evacuation shelter space. The Division was given both the duty and authority to administer a statewide program to survey public facilities and identify those that are appropriately designed and located to serve as public shelters. To ensure consistency with state and national standards, codes, guidelines and “best practices,” the Division has recognized ARC 4496 as the minimum hurricane evacuation shelter safety criteria. Therefore, at a minimum, meeting the intent of ARC 4496 is a required condition for a public facility to be described as “safe,” “suitable” or “appropriate” for recognition as a public hurricane evacuation shelter in this Plan. The public hurricane evacuation shelter capacities listed as “suitable” in this Plan are recognized by the Division as meeting ARC 4496 hurricane safety criteria.
Appendix A identifies the statewide inventory of facilities recognized as meeting the intent of ARC 4496 in their pre-survey existing condition (i.e., “as-is”), facilities that have been retrofitted to meet ARC 4496, and facilities that have been constructed to meet ARC 4496. New school facilities that are reported by district school boards and local emergency management agencies as having been constructed to the public shelter design criteria are generally recognized by the Division to meet ARC 4496, though storm surge flooding hazards may limit recognition in some cases to exiting storm tracks only.
The Division does not certify, approve or designate hurricane evacuation shelters. Through its survey program, the Division provides data and assistance to local emergency managers, who then use the ARC 4496 criteria as one factor in the selection of public shelters. In addition to the ARC 4496 ranking, local emergency managers consider other factors in the selection process, such as, type of event requiring shelter (known or perceived hazards and risks); location; available staffing, equipment and material resources; internal/external movement circulation; availability of adequate toilets and sanitation; feeding capabilities; standby or emergency electric power capability; types of spaces available and their configuration and contents; type and condition of roof covering; etc. When anticipated demand exceeds available ARC 4496 shelter space capacity, local emergency managers may select other facilities that afford the best available protection and features.
With the amendment of §252.385(2)(b), F.S. in 2006, the Plan is required to include information on the availability of pet-friendly public shelters as well as capacity of SpNS. The Department of Health is required to assist in determining need and adequacy of facilities for SpNS.
§252.385(4)(a), F.S. makes available all suitable public facilities owned or leased by state or local government agencies upon request of the applicable local emergency management agency. This broadens the types of facilities that can be used by emergency management officials in a declared emergency, and is consistent with the Division’s authority to survey all appropriate public facilities for use as public hurricane evacuation shelters.

Division of Emergency Management 2018 Statewide Emergency Shelter Plan
1-6
1013.372 Education facilities as emergency shelters.— (1) The Department of Education shall, in consultation with boards and county and state emergency management offices, include within the standards to be developed under this subsection public shelter design criteria to be incorporated into the Florida Building Code. The new criteria must be designed to ensure that appropriate new educational facilities can serve as public shelters for emergency management purposes. A facility, or an appropriate area within a facility, for which a design contract is entered into after the effective date of the inclusion of the public shelter criteria in the code must be built in compliance with the amended code unless the facility or a part of it is exempted from using the new shelter criteria due to its location, size, or other characteristics by the applicable board with the concurrence of the applicable local emergency management agency or the Division of Emergency Management. Any educational facility located or proposed to be located in an identified category 1, 2, or 3 evacuation zone is not subject to the requirements of this subsection. If the regional planning council region in which the county is located does not have a hurricane evacuation shelter deficit, as determined by the Division of Emergency Management, educational facilities within the planning council region are not required to incorporate the public shelter criteria.
As directed by law, the Department of Education was required to develop criteria, in consultation with district boards and state and local emergency management offices, to ensure that appropriate new educational facilities can serve as public shelters for emergency management purposes. The criteria are required to be incorporated into the Florida Building Code (i.e., s. 453.25, Florida Building Code--Building), and all new facilities for which a design contract is entered into after incorporation of the criteria into the code must be built in compliance with the criteria. The public shelter design criteria are applicable to both district school board and community or state college facilities, and became effective on April 28, 1997. These criteria were also codified into the Florida Building Code--Building on March 1, 2002.
§1013.372(1), F.S. allows a board to exempt a facility from the criteria if the location, size or other characteristics is inappropriate for use as a public shelter. A facility that is located, or proposed to be located, in a Regional Planning Council region that is determined by the Division to have a sufficient capacity of hurricane evacuation shelter space may also be exempted. It is unlawful and a violation of the Florida Building Code for a board to exempt a new educational facility from the criteria without the written concurrence of the applicable local emergency management agency or the Division.
§1013.74(4), F.S., provide state university boards of trustees statutory duties similar as those of district public schools and community or state colleges. State universities, in consultation with state and local emergency management agencies, are directed to assess existing facilities to identify the extent to which each campus has public hurricane evacuation shelter space. Each campus is then responsible for developing a five-year capital improvements program that identifies potential new and retrofitted facilities that can be used as public hurricane evacuation shelters. All campus buildings for which a design contract is entered into after July 1, 2001 are required to be constructed to the standard.

Division of Emergency Management 2018 Statewide Emergency Shelter Plan
1-7
1013.74 University authorization for fixed capital outlay projects.— (4) The university board of trustees shall, in consultation with local and state emergency management agencies, assess existing facilities to identify the extent to which each campus has public hurricane evacuation shelter space. The board shall submit to the Governor and the Legislature by August 1 of each year a 5-year capital improvements program that identifies new or retrofitted facilities that will incorporate enhanced hurricane resistance standards and that can be used as public hurricane evacuation shelters. Enhanced hurricane resistance standards include fixed passive protection for window and door applications to provide mitigation protection, security protection with egress, and energy efficiencies that meet standards required in the 130-mile-per-hour wind zone areas. The board must also submit proposed facility retrofit projects to the Division of Emergency Management for assessment and inclusion in the annual report prepared in accordance with s. 252.385(3). Until a regional planning council region in which a campus is located has sufficient public hurricane evacuation shelter space, any campus building for which a design contract is entered into subsequent to July 1, 2001, and which has been identified by the board, with the concurrence of the local emergency management agency or the Division of Emergency Management, to be appropriate for use as a public hurricane evacuation shelter, must be constructed in accordance with public shelter standards.
The statute indicates that a university board of trustees may exempt a facility from the
criteria with the concurrence of the applicable local emergency management agency or the Division. A facility that is proposed to be located in a Regional Planning Council region that is determined by the Division to have a sufficient capacity of hurricane evacuation shelter space may also be exempted. As with district school boards and Community Colleges, it is unlawful for a university board of trustees to exempt a new campus facility from the criteria without the written concurrence of the applicable local emergency management agency or the Division.
381.0303 Special Needs Shelters. -- (2)(d) Local emergency management agencies shall be responsible for the designation and operation of special needs shelters during times of emergency or disaster and the closure of the facilities following an emergency or disaster. The local health department and emergency management agency shall coordinate these efforts to ensure the appropriate designation and operation of special needs shelters. County health departments shall assist the local emergency management agency with regard to the management of medical services in special needs shelters.
§381.0303(2)(d), F.S. requires local emergency management agencies to designate public
SpNS. The Department of Health (through County Health Departments) is assigned the duty to assist with managing the medical service needs of the clients.
The Division strongly recommends that as with general population public hurricane
evacuation shelters, SpNS hurricane evacuation shelters designated by local emergency management agencies should at a minimum meet the ARC 4496 hurricane safety criteria, and preferably designed and constructed to higher performance codes and standards; such as the Public Shelter Design Criteria or the International Code Council’s storm shelter standard (ICC 500).

Division of Emergency Management 2018 Statewide Emergency Shelter Plan
2-1
2.0 EDUCATIONAL FACILITIES AS EMERGENCY SHELTERS
The Public Shelter Design Criteria, which are also known as Enhanced Hurricane Protection Area (EHPA), were designed to ensure that appropriate new educational facilities can serve as public shelters for emergency management purposes. The EHPA code provisions can be found in §453.25, 2017 Florida Building Code—Building, 6th Edition. Public educational facilities primarily serve an educational purpose. During a declared state of emergency these facilities may function as public shelters. The public shelter function is a lawfully authorized function. During a declared state or local emergency public shelter functions can supersede normal educational functions. Therefore, consideration of the emergency management purpose is a critical component in the design of new educational facilities. The following sections will provide consultative (or advisory) guidance for implementing the criteria. 2.1 Public Shelter Design Criteria
The EHPA ensure that new educational facilities meet or exceed applicable national design and construction standards, guidelines and “best practices.” The EHPA have been designed to significantly enhance occupant safety and building integrity. One of the main objectives of the EHPA is to ensure that these facilities continue to serve the public after exposure to a major hurricane.
It is highly recommended that during the design process that facility owners, planners and
designers incorporate the American Red Cross’ ARC 4496 in the planning process for an EHPA. See Appendix C. ARC 4496 is the minimum hurricane evacuation shelter safety guideline used by the Division, American Red Cross and local emergency management officials for surveying and ranking public hurricane evacuation shelters. ARC 4496 requires that public hurricane evacuation shelters be designed, constructed and capable of withstanding wind loads according to the American Society of Civil Engineers Standard 7, Minimum Design Loads for Buildings and Other Structures (ASCE 7). The Division endorses this recommendation.
Please review Appendix G for additional advisory guidance on design criteria, including wind and debris impact resistance, foundation and floor slab elevation, location and site requirements, shelter occupant capacity, plumbing and sanitation, electrical standby and emergency power systems, and emergency management considerations. There are other useful resources to be considered in the EHPA design process, such as the Federal Emergency Management Agency’s (FEMA) publication Design and Construction Guidance for Community Safe Rooms (FEMA 361).
SpNS should meet the same hurricane safety criteria as general population shelters (ARC
4496 and other state and national public shelter criteria). Following the 2004 hurricane season, the Division and Department of Health, in consultation with the Executive Office of the Governor, issued a memorandum stating an expectation that SpNS be located in facilities that at a minimum meet the ARC 4496 hurricane safety criteria, that SpNS client occupied areas have

Division of Emergency Management 2018 Statewide Emergency Shelter Plan
2-2
standby power supported air-conditioning, and that client shelter spaces be based on 60 square feet per client (20 square feet is used for general population shelter spaces). The 60 square feet of space includes an allowance for care-givers and medical equipment. 2.2 Exemption Criteria
All new educational facilities must be designed and constructed to comply with the EHPA criteria unless specifically exempted by the board with written concurrence of the applicable local emergency management agency or the Division. See §1013.372, F.S.
It is unlawful and a violation of the Florida Building Code for a board to exempt a
new educational facility from the criteria without the written concurrence of the applicable local emergency management agency or the Division. The fact that the EHPA criteria may increase the cost of construction of a facility, by itself, is not a factor that will be considered for an exemption by the Division. Cost of construction may only be considered as one of a number of factors when selecting which new facilities are to be designed and constructed to meet the EHPA criteria. Selection may be based upon cost-effectiveness, greatest provision of shelter space, and other factors that enhance shelter usefulness.
The EHPA requirement applies to any building construction project that is “new
construction,” as defined in §1013.01(14), F.S. and s. 453.5.8, Florida Building Code—Building. That is, any construction of a building or unit of a building in which the entire work is new, or an entirely new addition connected to an existing building. This includes replacement buildings and new buildings and additions constructed on existing campuses. The EHPA requirement also applies to reuse and prototype plans, since they are required to be code updated with each new project.
The EHPA requirement is not limited to rooms or spaces defined as “core facilities” in §1013.01(5), F.S. The statutory definition is intended for educational facilities purposes, and defines “core facilities” to be media centers, cafeterias, toilet facilities and circulation space (e.g., corridors, lobbies, etc.) §1013.372(1), F.S. states that “A facility, or an appropriate area within a facility…must be built in compliance with the (EHPA criteria) unless the facility or a part of it is exempted…” The statute does not limit EHPA’s to “core facilities,” but permits use of an entire facility, or appropriate areas within a facility.
Both the Florida Statutes and the Florida Building Code provide factors to consider in exempting an educational facility from complying with the criteria. ARC 4496 may also provide supplemental guidance to consider in the exemption process. The following subsections provide advisory guidance when considering an exemption request.

Division of Emergency Management 2018 Statewide Emergency Shelter Plan
2-3
2.2.1 Location
In general, there are five factors to be considered when making an exemption request due to location: 1) location of the proposed EHPA site within an identified Category 1, 2 or 3 (or A, B or C) evacuation zone; 2) location subject to hurricane-related rainfall or storm surge flooding or isolation; 3) location on a coastal barrier island; 4) location within the evacuation zone of facilities that manufacture, use or store certain types and quantities of hazardous materials; and 5) low evacuation demand.
Category 1, 2 or 3 Evacuation Zone: New educational facilities located or proposed to
be located in an identified A, B or C hurricane evacuation zone are exempt from the EHPA criteria. “Evacuation Zones” are areas designated to be evacuated for particular hurricane scenarios to protect an at-risk population from flooding. Evacuation zones are developed taking into consideration all populated areas having a significant risk of flooding, areas not subject to flooding but may be cut-off or completely surrounded or isolated by flooded areas, and the need to be easily communicated to the public.
Evacuation zones are applicable to coastal counties, and possibly counties adjacent to
Lake Okeechobee. Evacuation zones include areas that are subject to storm surge inundation, as predicted by the National Weather Service’s Sea, Lake and Overland Surges from Hurricanes (SLOSH) model. Hurricane evacuation zones A, B and C are subject to evacuation during land-falling major hurricanes, as well as paralleling and exiting major hurricanes.
Category 4 and 5 hurricanes are relatively uncommon events, and based upon the storm
track heading with respect to coastline (i.e., land-falling, paralleling or exiting), hurricane evacuation zones D and E may not be inundated by storm surge. Therefore, new educational facilities proposed to be located in D and E evacuation zones are not statutorily exempt from the EHPA criteria.
Also, to facilitate communication of evacuation orders to the public during an emergency,
hurricane evacuation zones are typically established using geographic, jurisdictional or transportation/utility boundaries and landmarks that are known and readily identified by the local population. Therefore, hurricane evacuation zone boundaries may extend further inland than the SLOSH model predicted inundation areas. New educational facilities proposed to be located in a evacuation zones D and E may in fact be outside of the SLOSH predicted inundation areas. EHPA’s located in D and E hurricane evacuation zones may provide emergency managers with additional sheltering options.
The 2010 Statewide Regional Evacuation Studies (SRES) introduce alphabetic
Evacuation Zones (A-E) across the State. For planning purposes, the reference to areas to be evacuated from a Category 1 hurricane is Evacuation Zone A, reference to areas to be evacuated in advance of a Category 2 hurricane is Evacuation Zone B, and reference to areas to be evacuated from a Category 3 hurricane is Evacuation Zone C. Similarly, references to evacuation areas from Category 4 or 5 hurricanes are Evacuation Zones D or E respectively.

Division of Emergency Management 2018 Statewide Emergency Shelter Plan
2-4
Category 4/5-related exemption decisions will be dependent upon the magnitude of the county and regional hurricane evacuation shelter space deficit, local logistical support capabilities and the availability of suitable alternatives (either in-place, or within the framework of a five-year plan.)
Rainfall or storm surge flooding or isolation: New educational facilities proposed to be located in areas subject to flooding or isolation due to rainfall or storm surge related flooding may be inappropriate for use as public hurricane evacuation shelters. Rainfall flooding includes closed-basin ponding, riverine and containment failure of dams and reservoirs. Extended-periods of isolation of a shelter population presents logistical challenges for emergency managers and mass care support agencies, which normally prefer equally suitable buildings not subject to flooding or isolation. The challenges include staff rotation, resupply of food, water and other consumables, emergency medical assistance, sanitation, security concerns, communication, etc. Flooding and isolation-related exemption decisions will be dependent upon the magnitude of the county and regional hurricane evacuation shelter space deficit, design and construction standards of the facility, shelter floor elevation, local logistical support capabilities and the availability of appropriate alternatives (either in-place, or within the framework of a five-year plan.)
Coastal Barrier Island: Coastal barrier islands are often less than two (2) miles wide
with very low ground elevations above mean sea level (AMSL). As such, they are exceptionally at-risk to storm surge inundation, isolation, and exposure to the full force of hurricane winds. ARC 4496 also states that hurricane evacuation shelters must not to be located on barrier islands. Therefore, facilities on coastal barrier islands are often subject to an exemption from the EHPA criteria. Coastal barrier island exemption decisions will be dependent upon the magnitude of the county and regional hurricane evacuation shelter space deficit, shelter floor elevation, local logistical support capabilities and the availability of appropriate alternatives (either in-place, or within the framework of a five-year plan.) The Division uses §161.54(2), F.S., to provide a definition for coastal barrier islands.
Hazardous Materials: Location of a proposed new educational facility within the Vulnerability Zone (VZ) of facilities that manufacture, use or store certain types and quantities of hazardous materials may make it unsuitable for use as public hurricane evacuation shelter. Just as with flooding isolation concerns, the possible impact of a hazardous materials spill or release presents public safety and logistical challenges to emergency managers and mass care support agencies. In addition to the challenges listed for flooding isolation, hazardous materials emergencies include detecting and warning of presence of a hazard, and implementing shelter-in-place or evacuation actions. However, most facilities with reportable quantities of hazardous materials are considered a low risk of hurricane-related spill or release due to presence of mitigation measures (e.g., limited quantities of materials, hardening of containment structures, etc.)
Hazardous materials-related exemption decisions will be dependent upon the potential for
and probable impact of a hurricane-related spill or release, potential hurricane evacuation shelter’s distance from hazardous materials facility, guidance from Local Emergency Planning Committee (LEPC) and local fire department, magnitude of the county and regional hurricane evacuation shelter space deficit, detection and warning capabilities, local logistical support capabilities and the availability of appropriate alternatives (either in-place, or within the framework of a five-year plan.)

Division of Emergency Management 2018 Statewide Emergency Shelter Plan
2-5
It should be noted that many educational facilities use or store hazardous materials that are used for janitorial services and maintenance, vocational or laboratory uses, refrigeration, water treatment, etc. Such materials are normally very limited in quantity, and suitably stored or protected, and therefore rarely a significant consideration for an exemption. The Division recommends consultation with the applicable LEPC and local fire department to determine appropriate precautionary measures.
Low Evacuation Demand: New educational facilities proposed to be located in areas with low evacuation demand may be considered for an EHPA exemption. Emergency managers and other mass care providers prefer to locate hurricane evacuation shelters in close proximity to the evacuees they will serve. Therefore, the emergency management agency may reduce the EHPA floor area square footage requirement to meet local evacuation demand needs, or possibly exempt the entire facility if a suitable alternative is available. Low evacuation demand exemption decisions will be dependent upon the magnitude of the county and regional hurricane evacuation shelter space deficit, local shelter demand needs and the availability of appropriate alternatives (either in-place, or within the framework of a five-year plan.) 2.2.2 Size
The required size of a hurricane evacuation shelter is very dependent upon local circumstances. To effectively utilize available resources and operational plans (e.g., staffing, feeding, security, etc.), a hurricane evacuation shelter located in an area with low evacuation demand can be significantly smaller than a facility located near a highly populated hurricane evacuation zone. Public hurricane evacuation shelters can range from as small as about 50 spaces to mega-shelters as large as several thousand spaces.
§252.385(4)(b), F.S. can serve as a guide when establishing a minimum size criterion for
public hurricane evacuation shelters. This statute applies to suitable Department of Management Services owned or leased facilities, and requires that the facility have a minimum of 2,000 square feet of net floor area. The required minimum net floor area can be in a single room, or a combination of rooms each having a minimum of 400 square feet of net floor area. At 20 square feet per shelter space, this translates into a minimum capacity of about 100 spaces.
Therefore, to be consistent with §252.385(4)(b), F.S., the Division generally considers new educational facilities with less than 2,000 square feet of net floor area to be small enough for an exemption.
2.2.3 Other Considerations “Other Considerations” is interpreted to mean any factor that is determined to make the facility inappropriate for use as a public hurricane evacuation shelter. This will generally be related to incompatibility of a facility’s normal function or availability with public shelter operations.

Division of Emergency Management 2018 Statewide Emergency Shelter Plan
2-6 2-6
As examples, the following types of spaces are normally excluded during calculation of net usable occupant capacity of a hurricane evacuation shelter, and are therefore often avoided by emergency managers when selecting shelters:
Mechanical, plumbing, electrical, telephone and communication equipment rooms, storage rooms and closets, exterior/outside circulation and corridors, restrooms and shower areas, kitchen and food preparation rooms, science labs, computer and information technology labs, vocational and industrial technology labs and shops, library and media rooms, exercise rooms with fixed equipment, administrative office and support areas, data and word processing rooms and areas, record vaults, mail rooms, custodial rooms and work areas, medical clinic and first aid rooms, residential and dormitory rooms, radio or television broadcast facilities, attics and crawl spaces, etc.
New educational facilities that are designed exclusively to serve these functions may be
exempted from complying with the EHPA criteria. Other considerations may also include local strategies and long-range plans. As
an example, to reduce costs and maximize hurricane evacuation shelter usefulness, a board and local emergency management agency may agree (in writing) that 100 percent of the floor area of new high schools will be constructed to the EHPA criteria, instead of the minimum of 50 percent, in exchange for reducing or eliminating EHPA requirements for middle and elementary schools. The proposed plan eliminates the county hurricane evacuation shelter space deficit, plus creates additional space toward reducing the regional deficit, within about five years. Thus the long-range plan achieves statutory intent, and exemptions for applicable middle and elementary schools are appropriate. 2.2.4 Alterations, Maintenance or Repair of Existing Buildings
Florida Statutes and the Florida Building Code both state that the EHPA criteria apply to “new educational facilities.” Therefore, renovations, remodeling, maintenance and repair of existing buildings, as defined in §1013.01, F.S. and s. 453.5, Florida Building Code--Building, are exempt from compliance with the EHPA criteria.
2.2.5 No Regional Deficit of “Safe” Hurricane Evacuation Shelter Space
§1013.372, F.S. states that new educational facilities proposed to be located in a Regional Planning Council (RPC) region that does not have a hurricane evacuation shelter space deficit are not required to incorporate the EHPA criteria. The hurricane evacuation shelter space deficit determination is established by biennial publication and approval of this Plan, which guides exemption decisions over a five year planning period. As can be seen in Figure 2-1, seven (7) RPC regions have sufficient capacity of GP hurricane evacuation shelter space in 2018, which includes RPC regions 1, 2, 3, 4, 5, 9 and 10. Based upon currently available information, a sufficient capacity of spaces will continue in RPC regions 1, 2, 3, 4, 5, 9 and 10 through 2023. However, as can be seen in Figure 2-2 there is a sufficient capacity of SpNS spaces in only one (1) region, region 10. The SpNS space deficits are projected to continue into 2023 if no new space is added to the inventory.
Division of Emergency Management 2018 Statewide Emergency Shelter Plan
2-7
Figure 2-1. Regional Hurricane Evacuation Shelter Space Deficit / Sufficient Status of General Population Shelters

Division of Emergency Management 2018 Statewide Emergency Shelter Plan
2-8 2-8
Figure 2-2. Regional Hurricane Evacuation Shelter Space Deficit / Sufficient Status of Special Needs Shelters

Division of Emergency Management 2018 Statewide Emergency Shelter Plan
2-8 2-9
2.3 Exemption Process
In accordance with §1013.372, F.S. and S. 453.25, Florida Building Code--Building, the following procedure is recommended by the Division when requesting exemptions from the public shelter design criteria/EHPA requirement: 1. The board must notify the local emergency management agency of all educational
facility construction projects that meet the definition of new construction.
2. The board must evaluate each new educational facility construction project to determine if a statutory or code specified exemption to the criteria is applicable.
3. If an exemption is not requested, the board should consult with the local
emergency management agency to identify those areas of the new facilities that will maximize public shelter capacity, and meet the needs of both the educational and emergency management purpose.
4. If the board requests an exemption, the request must be prepared and submitted in
writing to either the local emergency management agency or the Division. The request must identify the specific statutory or code factor(s) to be considered for the exemption, and provide appropriate supporting documentation.
5. If the local emergency management agency or the Division concurs with the
exemption request, a written response stating the concurrence will exempt the new educational facility from the criteria.
6. If the local emergency management agency or the Division does not concur in
writing with the exemption request, then the board must comply with the criteria. 2.4 Estimate of School District Compliance with EHPA Requirements (2015-2016)
In 2001, staff from the Auditor General’s Office performed a hurricane shelter and grant
management operational audit of the Department of Community Affairs. See Auditor General Report No. 02-055, dated October, 2001. In Finding No. 2 of the report, the Auditor General found that a significant number of new educational facilities, constructed by district school boards and community colleges, had not complied with the public shelter design criteria, and had not received an exemption (written) by local emergency management agencies or the Division. Given the projected deficits of public hurricane shelter space in this state, the Auditor General indicated that steps must be taken to remedy the situation.
The Auditor General recommended that the Division, in consultation with the State
Legislature, Florida Department of Education and local emergency management officials, continue its efforts to ensure compliance with the provisions of the law. Subsequently, the Department of Education distributed memorandum number DPBM No. 02-42 (from Wayne V.

Division of Emergency Management 2018 Statewide Emergency Shelter Plan
2-8 2-10
Pierson, dated October 31, 2001) that reiterated the necessity for compliance with the statute. A copy of memorandum DPBM No. 02-42 is included in Appendix I. Since distribution of the Auditor General’s report and the Department of Education’s memorandum in 2001, the Division has taken additional steps to encourage compliance with the EHPA criteria through the emergency management community. In 2003, with the assistance of the Department of Education, the Division compiled a list of new school facilities from the Florida Inventory of School Houses (FISH) with construction years between 2000 and 2003. Unless exempted, these school facilities were lawfully required to incorporate the EHPA criteria. The lists were forwarded to local emergency managers to assist them in determining local compliance, as well as assist in identifying additional unreported shelter capacity. The Division also annually requests hurricane shelter capacity data from local emergency management agencies that is sorted to differentiate new school EHPA’s, retrofit, and “as-is” (i.e., ARC 4496 hurricane shelter facilities that are not classified as a retrofit or EHPA) shelter space. This data is used to monitor progress toward eliminating county-level, regional and statewide hurricane shelter space deficits. The data also provides a means of tracking EHPA productivity on an annual basis.
The Division substantially revised the 2004 Plan to incorporate guidance to assist local school boards and emergency managers with implementing the criteria. The Division and Department of Education also participated in presentations and workshops at conferences that included the topic of EHPA construction requirements, code compliance and implementation strategies. The conferences were attended by emergency managers and their shelter program partners, school board officials, code enforcement officials, architects and engineers (e.g., National Hurricane Conference, Governor’s Hurricane Conference, Florida Emergency Preparedness Association Meetings, etc.)
From 2000 through 2009 the Division observed similar results to those of Auditor
General staff in 2000. Therefore, the 2004 through 2010 Plans reported a cumulative average of about 65 percent compliance.
In preparation for the 2018 Plan, the Division again collaborated with the Department of
Education to compile a list of new EHPA school buildings from the FISH data. However, for the 2018 Plan, the list of new buildings was limited to those constructed in 2015-2016 with at least 4,000 net square feet. The Department of Education reported a finding of 100 percent compliance in the regions where the requirement applies and new facilities were being built. Universities and community or state colleges were not included primarily due to the fact that FISH data is limited to K-12. Universities and colleges only account for about two (2) percent of recognized hurricane evacuation shelter space.
The Division will continue to coordinate with the Department of Education and local
emergency managers to monitor and improve compliance.

Division of Emergency Management 2018 Statewide Emergency Shelter Plan
3-1
3.0 REGIONAL HURRICANE EVACUATION SHELTER REQUIREMENTS
The Florida Statewide Regional Evacuation Studies (SRES) were updated in 2015 and some of the peninsula studies were updated in 2017 due to new storm information from the National Hurricane Center. Data from the SRES, University of Florida Bureau and Economic and Business Research, and coordination with County Emergency Management Agencies was utilized for estimating the projections in the 2018 Statewide Emergency Shelter Plan. The overall population projected in the 2018 SESP 20,481,201. County Emergency Managements provided input on their Shelter Demand Projections. County Emergency Managements are seeking similar trends for planning purposes but they have the advantage of being more familiar with local issues in their jurisdiction. Counties which provided input are marked with (*) in Appendix J. The SRES regions are RPC regions. The RPC regions and their respective counties are shown in Figure 3-1 for illustration purposes.
Figure 3-1. Regional Planning Councils of Florida

Division of Emergency Management 2018 Statewide Emergency Shelter Plan
3-2
3.1 Methodology for Calculating Regional and County Hurricane Evacuation Shelter Status
Location and Square Footage of Existing Shelters. The location and square footage of existing shelters can be found in Appendix A, which provides a detailed inventory of hurricane evacuation shelter locations and capacities within each region and county. The tables in Appendix A use the term “risk” shelters. Risk shelters include those shelter spaces recognized by the Division as meeting ARC 4496 hurricane safety guidelines and identified as appropriate for use during a hurricane impact. The term “risk” shelter is further defined in Appendix E.
Location and Square Footage of Needed Shelters. Region/County estimates for Shelter
Capacity, Shelter Demands, and Shelter Surpluses/Deficits are provided in Table 3-1 and are based on Saffir-Simpson Hurricane Intensity Category 5 evacuation worst case scenario. Results contained in Table 3-1 for 2018 and 2023 are displayed in number of persons. Region/County square feet estimates for 2018 and 2023, using the same Category 5 worst case scenario, are provided in Table 3-2.
Shelter Demand Sources/Results by County. The 2018 through 2023 county shelter
demand estimates for vulnerable populations are provided for Category 5. Vulnerable populations are defined as populations located in storm surge vulnerable areas (coastal and inland lake or river), rainfall flood prone areas and those living in mobile or manufactured housing. Source data for these estimates, including demographics, estimated percent vulnerable populations, estimated percent of vulnerable populations expected to seek public shelter, and other sources are shown in Appendix J.
The 2018 through 2023 population estimates utilized information from the SRES and University of Florida’s Bureau of Economic and Business Research (BEBR) coordination with County Emergency Managements. The Statewide Regional Evacuation Studies used the following guiding principles for the demographic analysis:
1. The best available data should be used for creating housing unit counts and population
estimates, housing unit and population projections, and demographic profiles. 2. All regional studies use the April 1, 2012 BEBR of baseline for housing unit and
population estimates. Determining County Shelter Capacities. County shelter capacity data for all 67 counties were updated by local emergency management agencies through 2011. Since 1995, Florida has been implementing ARC 4496 hurricane evacuation shelter criteria and Florida’s Model Hurricane Evacuation Shelter Selection Guidelines. Therefore, based upon subsequent results of regional and county hurricane evacuation shelter surveys, local emergency management agencies were requested to provide shelter inventory capacities based on those facilities that met the required ARC 4496 standards, and separately those facilities that did not.
Those facilities that have not yet been surveyed, and therefore have not yet been documented to meet the above standards, were designated as facilities not meeting the ARC 4496 standards. The Division has standardized a consistent methodology of calculating shelter capacities across the state for the purpose of this Plan. For each shelter, a net square footage for the building was derived from the Florida Department of Education’s FISH database, including only those room types listed in Appendix H of this Plan. See Appendix H. Then, each room’s square footage was multiplied by a usability factor based on room type.

Division of Emergency Management 2018 Statewide Emergency Shelter Plan
3-3
This generated a “dormitory” or square footage area that is usable as clear shelter space. This
figure was then divided by 20 square feet per person for general population risk shelters and 60 square feet per client for special needs risk shelters. These are the square footages and capacities used to calculate the Hurricane evacuation shelter deficit reduction in this Plan.
The Division recognizes that many counties have local preferences and practices that may further limit usage of buildings. For example, one county may choose to utilize only hallways, gyms or cafeterias, even though the rest of the building (i.e., classrooms) also meets ARC 4496 guidelines. In some cases, the limiting factor is the number of available staff, i.e., they can staff for only 500 people in a given location, even though they have space for many more. Also the local shelter capacity at a specific building may exceed local need. In recognition of these and other variances, the Division has included a column titled “Local Planned Usage” in the individual county tables in Appendix A. However, it should be noted that the capacities calculated per the method in the paragraph above, still exist and could, in an emergency, be utilized and therefore are counted toward elimination of the regional and county hurricane evacuation shelter space deficit.
Determining County Shelter Demand. The hurricane evacuation shelter demand percentage for each county reflects the percentage of a county’s vulnerable population that is projected to seek public shelter. These percentages are based on the conclusions of the behavioral analyses conducted for each of the regional evacuation studies. The analyses utilize survey and statistical methodologies to estimate behavioral responses to various hurricane scenarios. It is important to note that results obtained by a survey do not always correlate to actual behavior. What people say they will do during a “blue sky” survey often differs from actual behavior, which is influenced by a number of factors. Strength of storm, time since most recent significant disaster, and previous experience (or lack of) with tropical weather are just a few factors that influence a person’s decision to evacuate or seek shelter. Hence, shelter demand may fluctuate over time. All estimates are based on a worst case storm scenario and optimal compliance with local evacuation orders. Most of the behavioral analyses in the state have been prepared on a regional basis by Hazards Management Group (HMG) and are therefore a consistent benchmark relative to the survey methodologies and statistical applications. The public shelter use percentages in the behavioral section of the regional hurricane evacuation study are combined with local income characteristics in the hurricane risk area (two important variables in determining public shelter use) to calculate shelter demand numbers. For this Plan, these data served as the basis for estimating the shelter demand for coastal and inland counties between 2018 and 2023. The same methodology for projecting the vulnerable population during this period was used to calculate the estimated shelter demand figures for those years. The Shelter Demand for the Persons with Special Needs (PSN) is also utilized information from the SRES with adjustments directed by County Emergency Management Offices.

Division of Emergency Management 2018 Statewide Emergency Shelter Plan
3-4
3.2 Location and Square Footage of Existing and Needed Shelters
Tables 3-1 and 3-2 provide information regarding location and shelter occupant capacity of
both existing and needed hurricane evacuation shelters (i.e., risk shelters) for each of the 67 Florida counties. The tables also show which regions of the state have a deficit of hurricane evacuation shelter space. 3.3 County Hurricane Evacuation Shelter Status Though the EHPA codes are only required by statute in regions with deficits of hurricane evacuation shelter space, individual counties within such regions do continue to have deficits. All evacuations are managed locally, and state and county emergency managers and their partners need to continue to build shelter capacity for individual counties. Figure 3-2 provides sufficiency/deficit status for GP hurricane evacuation shelters for individual counties, and Figure 3-3 provides sufficiency/deficit status for SpNS hurricane evacuation shelters.
The color codes are keyed to individual county sheltering capability. For Figure 3-2, the green color code for GP shelters represents sufficient capacity to provide at least 20 sq.ft. of net usable floor area per demand evacuee, which is the minimum floor space required by the hurricane provisions of both EHPA codes and ICC 500 standard. The yellow color code represents sufficient capacity to provide at least 15 sq.ft. of net usable floor area per demand evacuee, which is the less-than-preferred short-term minimum floor space established as part of the ARC 4496 least-risk decision making process. The red color code indicates insufficient floor space for even the ARC short-term minimum recommendation.
For Figure 3-3, the green color code for SpNS represents sufficient capacity to provide at least 60 sq.ft. of net usable floor area per demand client. This is the minimum floor space recommended by the Division, Department of Health and partner agencies for SpNS. The yellow color code represents sufficient capacity to provide at least 40 sq.ft. of net usable floor area per demand client, which is the less-than-preferred short-term minimum used in historical plans. The red color code indicates insufficient floor space for even the obsolete historical minimum recommendation.
State and local emergency managers and other public officials prefer that persons ordered to
evacuate for a hurricane stay within their home county if possible, region if necessary, and not evacuate long distances. Counties with deficits are still in need of additional hurricane evacuation shelter space.

Division of Emergency Management 2018 Statewide Emergency Shelter Plan
3-5
Figure 3-2. County Hurricane Evacuation Shelter Space Deficit / Sufficient Status of General
Population Shelters

Division of Emergency Management 2018 Statewide Emergency Shelter Plan
3-6
Figure 3-3. County Hurricane Evacuation Shelter Space Deficit / Sufficient Status of
Special Needs Shelters

Division of Emergency Management 2018 Statewide Emergency Shelter Plan
3-7
3.4 Pet-Friendly Shelter Availability A recurrent concern noted during past hurricanes is the need to provide shelters for domestic companion animals (pets). In many cases, pet-owners are unwilling to go to shelters during hurricanes due to the lack of facilities to keep their pets. Most shelters will only allow service animals. In some counties provisions have been made at local Agricultural Centers for horses and large animals. In a few cases, rooms (e.g., locker rooms) were set aside in hurricane evacuation shelters for pets that were brought anyway. Pursuant to §252.385(2)(b), F.S., this Plan includes information on the availability of shelters that accept pets. Statewide, 32 counties provide a limited number of pet-friendly hurricane evacuation shelters that meet minimum hurricane safety criteria (i.e., ARC 4496). The pet-friendly counties have a total human occupant capacity of 641,426 spaces. The pet-friendly shelters are designated with an “A” under the column titled: “General (G), PSN (P), Pet-Friendly (A)” in Appendix A: “List of Hurricane Evacuation Shelters by County, Location and Capacity.” Another 9 counties indicate they have designated pet-friendly hurricane evacuation shelters, but they do not meet minimum hurricane safety criteria. There are 30 counties without pet-friendly shelters.
Figure 3-2 provides a summary of the counties with designated pet-friendly shelters. NOTE: For clarification, the Division defines “Pet-Friendly Shelters” as public shelters that have made arrangements to accept pets. Normally this includes setting aside separate areas within the public shelter or adjacent facilities with cages to control pets and isolate them from the sheltering public. Those shelters that are only for pets (not accompanied by owners) are classified as “Pet Storage Facilities” and not included as Pet Friendly Shelters. There are 3 counties with Pet Storage Facilities, totaling 33,820 space for people in the county.

Division of Emergency Management 2018 Statewide Emergency Shelter Plan
3-8
Figure 3-4. Florida Counties with Designated Pet-Friendly Shelters

Division of Emergency Management 2018 Statewide Emergency Shelter Plan
3-9
2018Category 5Shelter DemandIn People
2023Category 5Shelter DemandIn People
2018 Risk Shelter Capacity In People
2018 Shelter Surplus/ Deficit in People
2023 Shelter Surplus/ Deficit in People
2018Category 5Shelter DemandIn Clients
2023Category 5Shelter DemandIn Clients
2018 Risk Shelter Capacity In Clients
2018Shelter Surplus/ Deficit in Clients
2023 Shelter Surplus/ Deficit in Clients
Bay 1 6,443 6,533 15,928 9,485 9,395 1,712 1,736 301 (1,411) (1,435)
Escambia 1 10,680 10,830 25,218 14,538 14,388 500 507 1,160 660 653
Holmes 1 991 1,005 1,332 341 327 121 123 38 (83) (85)
Okaloosa 1 5,927 6,010 11,493 5,566 5,483 100 101 82 (18) (19)
Santa Rosa 1 5,875 5,957 12,067 6,192 6,110 150 152 940 790 788
Walton 1 1,807 1,832 9,205 7,398 7,373 150 152 92 (58) (60)
Washington 1 1,530 1,551 4,793 3,263 3,242 166 168 172 6 4
33,253 33,719 80,036 46,783 46,317 2,899 2,940 2,785 (114) (155)
Calhoun 2 1,019 1,032 2,996 1,977 1,963 91 92 0 (91) (92)
Franklin 2 319 325 0 (319) (325) 214 218 0 (214) (218)
Gadsden 2 3,275 3,360 6,153 2,878 2,793 632 649 0 (632) (649)
Gulf 2 532 542 460 (72) (82) 208 212 0 (208) (212)
Jackson 2 1,757 1,769 3,831 2,074 2,062 143 144 33 (110) (111)
Jefferson 2 664 687 809 145 122 278 288 0 (278) (288)
Leon 2 3,987 3,994 26,427 22,440 22,433 600 612 705 105 93
Liberty 2 467 495 1,585 1,118 1,090 275 292 73 (202) (219)
Wakulla 2 844 886 800 (44) (86) 100 105 0 (100) (105)
12,864 13,091 43,061 30,197 29,969 2,541 2,612 811 (1,730) (1,801)
Alachua 3 11,864 11,923 11,896 32 (27) 1,200 1,206 621 (579) (585)
Bradford 3 1,287 1,304 2,260 973 956 167 169 161 (6) (8)
Columbia 3 4,661 4,716 4,730 69 14 438 443 596 158 153
Dixie 3 1,832 1,850 6,810 4,978 4,960 142 143 120 (22) (23)
Gilchrist 3 1,123 1,131 3,027 1,904 1,896 76 77 102 26 25
Hamilton 3 1,038 1,048 1,239 201 191 76 77 76 0 (1)
Lafayette 3 609 611 698 89 87 13 13 60 47 47
Levy 3 4,184 4,203 5,322 1,138 1,119 19 19 136 117 117
Madison 3 1,259 1,268 4,208 2,949 2,940 67 67 28 (39) (39)
Marion 3 18,166 18,257 17,247 (919) (1,010) 1,000 1,005 940 (60) (65)
Suwannee 3 3,872 3,885 3,484 (388) (401) 92 92 50 (42) (42)
Taylor 3 1,713 1,721 4,144 2,431 2,423 63 63 0 (63) (63)
Union 3 708 713 2,264 1,556 1,551 43 43 131 88 88
52,316 52,629 67,329 15,013 14,700 3,396 3,419 3,021 (375) (398)
Region 1 Subtotals
Region 2 Subtotals
General Population Shelter Demand/Capacity Special Needs Shelter Demand/Capacity
Table 3‐1 (1)
County RPC
Region #
Region 3 Subtotals

Division of Emergency Management 2018 Statewide Emergency Shelter Plan
3-10
2018Category 5Shelter DemandIn People
2023Category 5Shelter DemandIn People
2018 Risk Shelter Capacity In People
2018 Shelter Surplus/ Deficit in People
2023 Shelter Surplus/ Deficit in People
2018Category 5Shelter DemandIn Clients
2023Category 5Shelter DemandIn Clients
2018 Risk Shelter Capacity In Clients
2018Shelter Surplus/ Deficit in Clients
2023 Shelter Surplus/ Deficit in Clients
Baker 4 2,618 2,631 3,459 841 828 79 79 79 0 (0)
Clay 4 11,281 11,326 9,152 (2,129) (2,174) 250 251 335 85 84
Duval 4 40,802 41,088 53,407 12,605 12,319 4,262 4,292 2,658 (1,604) (1,634)
Flagler 4 6,227 6,258 45,438 39,211 39,180 328 400 658 330 258
Nassau 4 5,318 5,334 5,563 245 229 208 209 156 (52) (53)
Putnam 4 4,748 4,748 4,621 (127) (127) 100 100 145 45 45
St Johns 4 11,325 11,359 17,031 5,706 5,672 515 517 596 81 79
82,319 82,744 138,671 56,352 55,927 5,742 5,847 4,627 (1,115) (1,220)
Brevard 5 31,469 31,563 39,964 8,495 8,401 2,090 2,096 2,330 240 234
Lake 5 24,960 25,334 27,646 2,686 2,312 1,414 1,435 314 (1,100) (1,121)
Orange 5 27,952 28,184 29,957 2,005 1,773 3,800 3,832 1,402 (2,398) (2,430)
Osceola 5 10,151 10,202 23,939 13,788 13,737 660 663 1,331 671 668
Seminole 5 11,445 11,466 31,126 19,681 19,660 750 751 300 (450) (451)
Sumter 5 9,786 9,818 1,286 (8,500) (8,532) 32 32 0 (32) (32)
Volusia 5 39,238 39,485 22,679 (16,559) (16,806) 363 365 1,490 1,127 1,125
155,001 156,053 176,597 21,596 20,544 9,109 9,175 7,167 (1,942) (2,008)
Desoto 6 3,159 3,244 2,542 (617) (702) 120 123 211 91 88
Hardee 6 2,167 2,210 4,687 2,520 2,477 36 37 75 39 38
Highlands 6 11,553 11,634 8,513 (3,040) (3,121) 285 287 75 (210) (212)
Okeechobee 6 7,342 7,584 1,639 (5,703) (5,945) 1,273 1,315 0 (1,273) (1,315)
Polk 6 42,257 42,806 34,517 (7,740) (8,289) 3,246 3,288 1,063 (2,183) (2,225)
66,478 67,479 51,898 (14,580) (15,581) 4,960 5,050 1,424 (3,536) (3,626)
General Population Shelter Demand/Capacity Special Needs Shelter Demand/Capacity
Table 3‐1 (2)
County RPC
Region #
Regiona 4 Subtotals
Region 5 Subtotals
Region 6 Subtotals

Division of Emergency Management 2018 Statewide Emergency Shelter Plan
3-11
2018Category 5Shelter DemandIn People
2023Category 5Shelter DemandIn People
2018 Risk Shelter Capacity In People
2018 Shelter Surplus/ Deficit in People
2023 Shelter Surplus/ Deficit in People
2018Category 5Shelter DemandIn Clients
2023Category 5Shelter DemandIn Clients
2018 Risk Shelter Capacity In Clients
2018Shelter Surplus/ Deficit in Clients
2023 Shelter Surplus/ Deficit in Clients
Citrus 7 13,314 13,374 3,647 (9,667) (9,727) 60 60 208 148 148
Hernando 7 11,565 11,609 9,056 (2,509) (2,553) 44 44 411 367 367
Hillsborough 7 52,316 52,515 85,288 32,972 32,773 2,927 2,938 3,250 323 312
Manatee 7 24,200 25,981 15,819 (8,381) (10,162) 600 700 933 333 233
Pasco 7 31,294 31,569 18,956 (12,338) (12,613) 966 975 1,466 500 491
Pinellas 7 42,178 42,621 27,225 (14,953) (15,396) 4,000 4,042 2,268 (1,732) (1,774)
174,867 177,669 159,991 (14,876) (17,678) 8,597 8,759 8,536 (61) (223)
Charlotte 8 12,089 12,180 0 (12,089) (12,180) 1,277 1,287 0 (1,277) (1,287)
Collier 8 29,964 30,129 5,784 (24,180) (24,345) 2,011 2,022 0 (2,011) (2,022)
Glades 8 1,594 1,597 4,133 2,539 2,536 19 19 110 91 91
Hendry 8 3,285 3,312 6,263 2,978 2,951 204 206 0 (204) (206)
Lee 8 71,410 71,681 500 (70,910) (71,181) 3,285 3,297 0 (3,285) (3,297)
Sarasota 8 29,826 30,088 8,540 (21,286) (21,548) 1,900 1,917 0 (1,900) (1,917)
148,168 148,987 25,220 (122,948) (123,767) 8,696 8,748 110 (8,586) (8,638)
Indian River 9 5,805 5,950 10,356 4,551 4,406 501 514 582 81 68
Martin 9 5,331 5,448 19,211 13,880 13,763 400 409 1,369 969 960
Palm Beach 9 29,754 30,111 69,460 39,706 39,349 2,520 2,550 800 (1,720) (1,750)
St. Lucie 9 7,833 8,029 16,885 9,052 8,856 2,851 2,922 500 (2,351) (2,422)
48,723 49,538 115,912 67,189 66,374 6,272 6,395 3,251 (3,021) (3,144)
Broward 10 28,299 28,356 58,954 30,655 30,598 1,277 1,280 1,550 273 270
Miami‐Dade 10 97,855 98,149 84,486 (13,369) (13,663) 2,717 2,725 3,308 591 583
Monroe 10 2,590 2,593 602 (1,988) (1,991) 461 462 121 (340) (341)
128,744 129,097 144,042 15,298 14,945 4,455 4,466 4,979 524 513
TOTAL Statewide 902,730 911,006 1,002,757 100,024 91,751 56,667 57,411 36,711 (19,956) (20,700)
Region 7 Subtotals
General Population Shelter Demand/Capacity Special Needs Shelter Demand/Capacity
Table 3‐1 (3)
County RPC
Region #
Region 10 Subtotals
Region 8 Subtotals
Region 9 Subtotals

Division of Emergency Management 2018 Statewide Emergency Shelter Plan
3-12
2018Category 5Shelter DemandIn People
2023Category 5Shelter DemandIn People
2018 Risk Shelter Capacity In People
2018 Shelter Surplus/ Deficit in People
2023 Shelter Surplus/ Deficit in People
2018Category 5Shelter DemandIn Clients
2023Category 5Shelter DemandIn Clients
2018 Risk Shelter Capacity In Clients
2018Shelter Surplus/ Deficit in Clients
2023 Shelter Surplus/ Deficit in Clients
Bay 1 128,860 130,664 318,560 189,700 187,896 102,720 104,158 18,060 (84,660) (86,098)
Escambia 1 213,600 216,590 504,360 290,760 287,770 30,000 30,420 69,600 39,600 39,180
Holmes 1 19,820 20,097 26,640 6,820 6,543 7,260 7,362 2,280 (4,980) (5,082)
Okaloosa 1 118,540 120,200 229,860 111,320 109,660 6,000 6,084 4,920 (1,080) (1,164)
Santa Rosa 1 117,500 119,145 241,340 123,840 122,195 9,000 9,126 56,400 47,400 47,274
Walton 1 36,140 36,646 184,100 147,960 147,454 9,000 9,126 5,520 (3,480) (3,606)
Washington 1 30,600 31,028 95,860 65,260 64,832 9,960 10,099 10,320 360 221
665,060 674,371 1,600,720 935,660 926,349 173,940 176,375 167,100 (6,840) (9,275)
Calhoun 2 20,380 20,645 59,920 39,540 39,275 5,460 5,531 0 (5,460) (5,531)
Franklin 2 6,380 6,508 0 (6,380) (6,508) 12,840 13,097 0 (12,840) (13,097)
Gadsden 2 65,440 67,207 123,060 57,620 55,853 37,920 38,944 0 (37,920) (38,944)
Gulf 2 10,640 10,832 9,200 (1,440) (1,632) 12,480 12,705 0 (12,480) (12,705)
Jackson 2 35,140 35,386 76,620 41,480 41,234 8,580 8,640 1,980 (6,600) (6,660)
Jefferson 2 13,280 13,745 16,180 2,900 2,435 16,680 17,264 0 (16,680) (17,264)
Leon 2 79,740 79,880 528,540 448,800 448,660 36,000 36,720 42,300 6,300 5,580
Liberty 2 9,340 9,900 31,700 22,360 21,800 16,500 17,490 4,380 (12,120) (13,110)
Wakulla 2 16,880 17,724 16,000 (880) (1,724) 6,000 6,300 0 (6,000) (6,300)
257,220 261,826 861,220 604,000 599,394 152,460 156,690 48,660 (103,800) (108,030)
Alachua 3 237,280 238,466 237,920 640 (546) 72,000 72,360 37,260 (34,740) (35,100)
Bradford 3 25,740 26,082 45,200 19,460 19,118 10,020 10,153 9,660 (360) (493)
Columbia 3 93,220 94,320 94,600 1,380 280 26,280 26,590 35,760 9,480 9,170
Dixie 3 36,640 37,006 136,200 99,560 99,194 8,520 8,605 7,200 (1,320) (1,405)
Gilchrist 3 22,460 22,613 60,540 38,080 37,927 4,560 4,591 6,120 1,560 1,529
Hamilton 3 20,760 20,968 24,780 4,020 3,812 4,560 4,606 4,560 0 (46)
Lafayette 3 12,180 12,220 13,960 1,780 1,740 780 783 3,600 2,820 2,817
Levy 5 83,680 84,057 106,440 22,760 22,383 1,140 1,145 8,160 7,020 7,015
Madison 3 25,180 25,351 84,160 58,980 58,809 4,020 4,047 1,680 (2,340) (2,367)
Marion 5 363,320 365,137 344,940 (18,380) (20,197) 60,000 60,300 56,400 (3,600) (3,900)
Suwannee 3 77,440 77,696 69,680 (7,760) (8,016) 5,520 5,538 3,000 (2,520) (2,538)
Taylor 3 34,260 34,414 82,880 48,620 48,466 3,780 3,797 0 (3,780) (3,797)
Union 3 14,160 14,256 45,280 31,120 31,024 2,580 2,598 7,860 5,280 5,262
1,046,320 1,052,586 1,346,580 300,260 293,994 203,760 205,113 181,260 (22,500) (23,853)Region 3 Subtotals
Region 1 Subtotals
Region 2 Subtotals
County RPC
Region #
General Population Shelter Demand/Capacity Special Needs Shelter Demand/Capacity
Table 3‐2 (1)

Division of Emergency Management 2018 Statewide Emergency Shelter Plan
3-13
2018Category 5Shelter DemandIn People
2023Category 5Shelter DemandIn People
2018 Risk Shelter Capacity In People
2018 Shelter Surplus/ Deficit in People
2023 Shelter Surplus/ Deficit in People
2018Category 5Shelter DemandIn Clients
2023Category 5Shelter DemandIn Clients
2018 Risk Shelter Capacity In Clients
2018Shelter Surplus/ Deficit in Clients
2023 Shelter Surplus/ Deficit in Clients
Baker 4 52,360 52,622 69,180 16,820 16,558 4,740 4,764 4,740 0 (24)
Clay 4 225,620 226,522 183,040 (42,580) (43,482) 15,000 15,060 20,100 5,100 5,040
Duval 4 816,040 821,752 1,068,140 252,100 246,388 255,720 257,510 159,480 (96,240) (98,030)
Flagler 4 124,540 125,163 908,760 784,220 783,597 19,680 24,000 39,480 19,800 15,480
Nassau 4 106,360 106,679 111,260 4,900 4,581 12,480 12,517 9,360 (3,120) (3,157)
Putnam 4 94,960 94,969 92,420 (2,540) (2,549) 6,000 6,001 8,700 2,700 2,699
St Johns 4 226,500 227,180 340,620 114,120 113,441 30,900 30,993 35,760 4,860 4,767
1,646,380 1,654,887 2,773,420 1,127,040 1,118,533 344,520 350,844 277,620 (66,900) (73,224)
Brevard 5 629,380 631,268 799,280 169,900 168,012 125,400 125,776 139,800 14,400 14,024
Lake 5 499,200 506,688 552,920 53,720 46,232 84,840 86,113 18,840 (66,000) (67,273)
Orange 5 559,040 563,680 599,140 40,100 35,460 228,000 229,892 84,120 (143,880) (145,772)
Osceola 5 203,020 204,035 478,780 275,760 274,745 39,600 39,798 79,860 40,260 40,062
Seminole 5 228,900 229,312 622,520 393,620 393,208 45,000 45,081 18,000 (27,000) (27,081)
Sumter 5 195,720 196,366 25,720 (170,000) (170,646) 1,920 1,926 0 (1,920) (1,926)
Volusia 5 784,760 789,704 453,580 (331,180) (336,124) 21,780 21,917 89,400 67,620 67,483
3,100,020 3,121,053 3,531,940 431,920 410,887 546,540 550,504 430,020 (116,520) (120,484)
Desoto 6 63,180 64,886 50,840 (12,340) (14,046) 7,200 7,394 12,660 5,460 5,266
Hardee 6 43,340 44,207 93,740 50,400 49,533 2,160 2,203 4,500 2,340 2,297
Highlands 6 231,060 232,677 170,260 (60,800) (62,417) 17,100 17,220 4,500 (12,600) (12,720)
Okeechobee 6 146,840 151,686 32,780 (114,060) (118,906) 76,380 78,901 0 (76,380) (78,901)
Polk 6 845,140 856,127 690,340 (154,800) (165,787) 194,760 197,292 63,780 (130,980) (133,512)
1,329,560 1,349,583 1,037,960 (291,600) (311,623) 297,600 303,010 85,440 (212,160) (217,570)
Regiona 4 Subtotals
Region 5 Subtotals
Region 6 Subtotals
County RPC
Region #
General Population Shelter Demand/Capacity Special Needs Shelter Demand/Capacity
Table 3‐2 (2)

Division of Emergency Management 2018 Statewide Emergency Shelter Plan
3-14
2018Category 5Shelter DemandIn People
2023Category 5Shelter DemandIn People
2018 Risk Shelter Capacity In People
2018 Shelter Surplus/ Deficit in People
2023 Shelter Surplus/ Deficit in People
2018Category 5Shelter DemandIn Clients
2023Category 5Shelter DemandIn Clients
2018 Risk Shelter Capacity In Clients
2018Shelter Surplus/ Deficit in Clients
2023 Shelter Surplus/ Deficit in Clients
Citrus 7 266,280 267,478 72,940 (193,340) (194,538) 3,600 3,616 12,480 8,880 8,864
Hernando 7 231,300 232,179 181,120 (50,180) (51,059) 2,640 2,650 24,660 22,020 22,010
Hillsborough 7 1,046,320 1,050,296 1,705,760 659,440 655,464 175,620 176,287 195,000 19,380 18,713
Manatee 7 484,000 519,620 316,380 (167,620) (203,240) 36,000 42,000 55,980 19,980 13,980
Pasco 7 625,880 631,388 379,120 (246,760) (252,268) 57,960 58,470 87,960 30,000 29,490
Pinellas 7 843,560 852,417 544,500 (299,060) (307,917) 240,000 242,520 136,080 (103,920) (106,440)
3,497,340 3,553,378 3,199,820 (297,520) (353,558) 515,820 525,544 512,160 (3,660) (13,384)
Charlotte 8 241,780 243,593 0 (241,780) (243,593) 76,620 77,195 0 (76,620) (77,195)
Collier 8 599,280 602,576 115,680 (483,600) (486,896) 120,660 121,324 0 (120,660) (121,324)
Glades 8 31,880 31,937 82,660 50,780 50,723 1,140 1,142 6,600 5,460 5,458
Hendry 8 65,700 66,245 125,260 59,560 59,015 12,240 12,342 0 (12,240) (12,342)
Lee 8 1,428,200 1,433,627 10,000 (1,418,200) (1,423,627) 197,100 197,849 0 (197,100) (197,849)
Sarasota 8 596,520 601,769 170,800 (425,720) (430,969) 114,000 115,020 0 (114,000) (115,020)
2,963,360 2,979,749 504,400 (2,458,960) (2,475,349) 521,760 524,871 6,600 (515,160) (518,271)
Indian River 9 116,100 119,003 207,120 91,020 88,118 30,060 30,812 34,920 4,860 4,109
Martin 9 106,620 108,966 384,220 277,600 275,254 24,000 24,528 82,140 58,140 57,612
Palm Beach 9 595,080 602,221 1,389,200 794,120 786,979 151,200 153,014 48,000 (103,200) (105,014)
St. Lucie 9 156,660 160,577 337,700 181,040 177,124 171,060 175,337 30,000 (141,060) (145,337)
974,460 990,766 2,318,240 1,343,780 1,327,474 376,320 383,690 195,060 (181,260) (188,630)
Broward 10 565,980 567,112 1,179,080 613,100 611,968 76,620 76,773 93,000 16,380 16,227
Miami‐Dade 10 1,957,100 1,962,971 1,689,720 (267,380) (273,251) 163,020 163,509 198,480 35,460 34,971
Monroe 10 51,800 51,864 12,040 (39,760) (39,824) 27,660 27,694 7,260 (20,400) (20,434)
2,574,880 2,581,947 2,880,840 305,960 298,893 267,300 267,976 298,740 31,440 30,764
TOTALS Statewide 18,054,600 18,220,146 20,055,140 2,000,540 1,834,994 3,400,020 3,444,617 2,202,660 (1,197,360) (1,241,957)
Region 9 Subtotals
Region 10 Subtotals
Region 7 Subtotals
Region 8 Subtotals
County RPC
Region #
General Population Shelter Demand/Capacity Special Needs Shelter Demand/Capacity
Table 3‐2 (3)

Division of Emergency Management 2018 Statewide Emergency Shelter Plan
4-1
4.0 TYPES OF PUBLIC FACILITIES THAT SHOULD COMPLY WITH
PUBLIC SHELTER DESIGN CRITERIA By statute, all appropriate public facilities are subject to being used as public hurricane evacuation shelters in a declared state or local emergency. See §252.385, F.S. Therefore, any appropriate new public facility should include emergency shelter criteria. This includes not only public educational facilities, but also certain types of state and local government facilities. In general, facilities that are designed for public assembly, either as a primary or auxiliary use, may be appropriate for use as public shelters during an emergency. At this time, only public educational facilities are subject to the EHPA criteria by statute and code. This is primarily due to the fact that public educational facilities account for about 99 percent of current public hurricane evacuation shelter space, and relatively few other state and local facilities are appropriate for use as public shelters.
The public shelter space may be located in a single building or a campus or office center with multiple buildings, placed in a single large room or multiple medium sized rooms in close proximity to each other, or in one or more stories of multistory buildings. Preferably the buildings will have a means of inside circulation and convenient access to toilets and hand washing facilities.
To determine if a proposed new public facility should be subject to the EHPA criteria, regardless of non-educational function or agency with ownership, the proposed facility should be reviewed based upon the exemption criteria given in Section 2.2 of this Plan. Facilities not subject to an exemption may be appropriate for use as public hurricane evacuation shelters. The decision to incorporate emergency shelter criteria into a new public facility must be coordinated with the local emergency management agency(s) or the Division. 4.1 Public Schools and Community Colleges
District public schools (K-12) are the primary source of public hurricane evacuation shelter space in Florida, accounting for about 97 percent of current capacity. This is due to the fact that schools are widely distributed in populated areas, school facilities are designed for large assembly occupancies with many inherent mass care features (e.g., adequate quantity of toilets, dining/feeding areas, etc.), access to the facilities can be coordinated through a single local agency, etc. The types of school buildings that are potentially appropriate for use as public shelters include gymnasiums, cafeteria/dining, multipurpose, auditoriums and certain classroom buildings.
Community or state colleges account for only about one (1) percent of current public shelter capacity. Colleges are regionally distributed, and potentially located in areas with high demands for public hurricane evacuation shelter space. As with K-12 public schools, colleges are normally designed for large assembly occupancies and possess many inherent mass care features. The types of college buildings that are potentially appropriate for use as public shelters include gymnasiums, cafeterias, multipurpose facilities, auditoriums and certain classroom buildings.
Division of Emergency Management 2018 Statewide Emergency Shelter Plan
4-2
4.2 Charter Schools
Charter schools have a general exemption from meeting many of the requirements of K-12 public schools under §1002.33(16)(a), F.S. However, §1002.33(18), F.S., requires charter schools that are not conversion schools (therefore, startup charter schools) to utilize facilities which comply with the generally applicable provisions of the Florida Building Code, but not the State Requirements for Educational Facilities. Privately owned charter school facilities are not required to be designated as emergency shelters under §1013.372, F.S. Pursuant to §252.385, F.S. an owner of a privately-owned charter school facility may agree in writing to use the facility as a public hurricane evacuation shelter. 4.3 State Universities
State university facilities account for only about one (1) percent of current public hurricane evacuation shelter capacity. Unlike K-12 public schools and colleges, state university campuses may not be as widely distributed, though several are potentially located in areas with high demands for public hurricane evacuation shelter space (e.g., Florida International University, University of South Florida, etc.) Main campuses and some satellite campuses may have several appropriate buildings concentrated in one (or more) proximate geographic area. This concentration of shelter spaces reduces staffing and logistical resource demands of a sheltering operation.
State university facilities are typically designed for large assembly occupancies,
with many having inherent mass care features. The types of university buildings that are potentially appropriate for use as public shelters include gymnasiums, field houses and sports arenas, cafeterias or dining rooms, multipurpose facilities, auditoriums and certain classroom buildings. State universities must consider two separate populations when developing their public shelter strategies: 1) campus staff, faculty and their families, and students (both commuters and residential); and 2) the general public. University facilities may be designated for sole use by one population, or concurrent use by both populations, at the discretion of the university board with the concurrence of local emergency management agency or the Division. Residential facilities are not normally subject to the EHPA, but incorporation of the criteria into new residential housing or dormitories (or portions thereof) will free up additional hurricane evacuation shelter space for the general public in appropriate non-residential facilities.

Division of Emergency Management 2018 Statewide Emergency Shelter Plan
4-3
4.4 State and Local Public Facilities
Local public facilities account for about one (1) percent of current public hurricane evacuation shelter capacity. Given their administrative function (and essential emergency function of certain facilities) most state-owned, county-owned and municipally-owned facilities are not appropriate for use as public hurricane evacuation shelters. Administrative office and support areas, data and word processing rooms and areas, record vaults, etc., are exempt from the EHPA. However, certain other types of public facilities may be appropriate, such as community or civic centers, libraries with training or educational rooms, meeting halls, auditoriums, exhibition halls, sports arenas, conference or training centers, and other public assembly facilities.

Division of Emergency Management 2018 Statewide Emergency Shelter Plan
5-1
5.0 RECOMMENDED SOURCES OF FUNDING
School districts have historically reported that the construction cost premium for incorporating the EHPA code provisions can range from less than one (1) to more than 20 percent, though typical cost was about three (3) to nine (9) percent. For most new facilities, this appeared to translate into a construction cost premium of less than $900,000. These are not necessarily inconsequential costs that must be borne by State and local governments. Therefore, as required by §1013.372(2), F.S., the Division suggests use of existing state capital outlay to fund the additional cost of constructing hurricane evacuation shelters in public schools.

Division of Emergency Management 2018 Statewide Emergency Shelter Plan
. 6-1
6.0 STATEWIDE PROGRESS TOWARD ELIMINATING THE PUBLIC
HURRICANE EVACUATION SHELTER SPACE DEFICIT The Florida Division of Emergency Management is charged under §252.385, F.S. to administer a statewide program to eliminate the deficit of “safe” hurricane evacuation shelter space. The Division has taken several steps to implement the program. First, by conducting a survey of existing buildings, both public and private, to identify suitable shelter capacity. Second, where cost effective (and practical), support mitigation and retrofitting of facilities to increase shelter capacity. Third, require construction of new educational facilities to meet the EHPA code provisions. Fourth, conduct research to clearly identify demand. And fifth, improve public information/education to reduce shelter demand from evacuees not required to evacuate or “shadow” evacuations.
Since 1995, the Division has been performing a survey of existing designated and
potential hurricane evacuation shelters. The initial findings of the survey were not encouraging. The vast majority of the designated hurricane evacuation shelters were in buildings that did not appear to meet the intent of ARC 4496 hurricane safety criteria. As examples, the pre-survey designated hurricane evacuation shelters rarely had adequate (if any) window protection (83 percent without protection), and were often constructed to old wind codes with long span roofs (41 percent with long span) and unreinforced masonry walls (43 percent with unreinforced masonry). The initial results of the survey began, for the first time, to quantify the actual condition of Florida’s public hurricane evacuation shelter inventory, instead of relying on anecdotal concerns that had been expressed for more than 20 years. However, during the survey process, hundreds of thousands of spaces were identified that only required minor retrofitting (e.g., window and door protection) to meet the ARC 4496 criteria.
Between 1995 and 2000, the reported hurricane evacuation shelter space deficit
increased considerably; from about 361,000 spaces in 1996 to more than 1.5 million in 2000. During this time-frame, less than 200,000 hurricane evacuation shelter spaces that met minimum hurricane evacuation shelter safety criteria could be documented. The spaces that could be documented were located primarily in the southeastern and east-central coastal regions of the state. This capacity was principally the result of post-Hurricane Andrew federal Hazard Mitigation Grant Program (HMGP) funding of public school window protection projects. Other than federal HMGP funds, no significant source of funding had been identified to support the minor retrofit projects being documented during the survey process.
Concurrently, §235.26(9)(a), F.S. (superseded by §1013.372(1), F.S.) stated that
all new educational facilities for which a design contract was entered into after July 1, 1995 were required to incorporate the public shelter design criteria. However, the criteria did not become effective until April 28, 1997. It is not unusual for there to be a three-year delay between promulgation of a building code (or rule) and availability of the first group of compliant facilities. Therefore, minimal progress was made prior to 2000 via construction of new public schools to the EHPA code provisions.

Division of Emergency Management 2018 Statewide Emergency Shelter Plan
. 6-2
By 2000, the reported hurricane evacuation shelter space deficit peaked as the
strategy originally directed by Chapter 93-211, Laws of Florida, began to produce results. As a benchmark, the 2000 Plan reported that Florida had a statewide hurricane evacuation shelter space deficit of more than 1.5 million spaces. This reported deficit affected every region of the state, but especially the southern and central regions of the peninsula. This did not imply that in any given storm that 1.5 million evacuees would simultaneously seek public shelter, but reflected the State’s cumulative hurricane evacuation shelter space deficit. State and local emergency managers and other public officials prefer that persons ordered to evacuate for a hurricane stay within their home county or region, and not evacuate long distances. The 2000 Plan’s published statewide and regional deficits served to quantify the challenge that lay ahead. In 1999, the State Legislature appropriated more than $2.2 million to support a hurricane evacuation shelter retrofitting initiative. The appropriation stipulated that the funds be used to shutter school buildings for use as hurricane evacuation shelters. The Division used the 1999 Shelter Retrofit Report to identify and prioritize projects to receive the funds. A total of 58 projects were selected, which created an estimated 34,928 spaces. In 2000, the State Legislature appropriated an additional $18 million (combined Federal, State and local funds) to complete the projects listed in the 1999 Shelter Retrofit Report. The 2000 appropriation included funds from the Hurricane(s) Floyd and Irene (Federal HMGP declaration), which were earmarked to support the state’s effort to reduce the deficit of hurricane evacuation shelter space. Since 1995, through Federal, State, and local retrofitting of appropriate facilities, Florida has created a total of 464,500 public hurricane evacuation shelter spaces. The “Retrofitted / Mitigated Capacity Gained” column of Table 6-1 demonstrates county-by-county progress toward eliminating the hurricane evacuation shelter space deficit by retrofitting appropriate facilities to meet ARC 4496. Retrofitted facilities account for about 45 percent of the state’s total capacity of ARC 4496 hurricane evacuation shelter spaces. The majority of this retrofit capacity has been created since 1999. Though regions and counties with the greatest deficits received priority for available retrofit funds, there has been a more widespread distribution of the retrofit funds due to the statewide nature of the deficit. Some of the retrofitted facilities have less than preferred mass care characteristics (e.g., inconveniently located toilet facilities, etc.), but the retrofit program produced a rapid improvement in the safety of Florida’s hurricane evacuation shelter inventory. Creation of hurricane evacuation shelter capacity through construction of new school facilities to the EHPA criteria has also increased since 1999. Local emergency management and school board officials have reported that 465,675 EHPA shelters spaces have been created. The “EHPA Capacity Gained” column of Table 6-1 demonstrates county-by-county progress toward eliminating the hurricane evacuation shelter space deficit via EHPA construction. The application of the EHPA criteria has been inconsistent across the state, with several counties reporting construction of relatively few (if any) EHPA spaces. EHPA spaces account for about 45 percent of the state’s total capacity of ARC 4496 hurricane evacuation shelter spaces.

Division of Emergency Management 2018 Statewide Emergency Shelter Plan
6-3
Some 109,293 spaces were identified through surveys as meeting ARC 4496
guidelines (“As-Is”) without further need for retrofitting. These facilities, however, do not necessarily meet all the EHPA code requirements. These As-Is or Pre-Mitigation ARC 4496 spaces account for about 10 percent of the state’s total spaces.
Totals Per County
As-Is or Pre-Mitigation ARC 4496 Capacity (persons)
EHPA 2018Capacity Gained
(persons)
Retrofitted / Mitigated Capacity Gained
(persons)
Total 2018ARC 4496 Spaces
ALACHUA 1,050 1,600 9,867 12,517BAKER 203 306 3,029 3,538BAY 329 956 14,944 16,229BRADFORD 0 161 2,260 2,421BREVARD 1,566 12,063 28,665 42,294BROWARD 500 60,004 0 60,504CALHOUN 90 1,058 1,848 2,996CHARLOTTE 0 0 0 0CITRUS 0 208 3,647 3,855CLAY 0 3,776 5,711 9,487COLLIER 0 0 5,784 5,784COLUMBIA 0 3,609 1,717 5,326DESOTO 0 151 2,602 2,753DIXIE 120 2,992 3,818 6,930DUVAL 8,811 15,341 31,913 56,065ESCAMBIA 4,388 1,803 20,187 26,378FLAGLER 21,925 2,707 21,464 46,096FRANKLIN 0 0 0 0GADSDEN 0 3,565 2,588 6,153GILCHRIST 0 0 3,129 3,129GLADES 0 2,374 1,869 4,243GULF 232 228 0 460HAMILTON 0 1,196 119 1,315HARDEE 139 4,623 0 4,762HENDRY 939 1,000 4,324 6,263HERNANDO 911 8,051 506 9,467HIGHLANDS 2,176 275 6,137 8,588HILLSBOROUGH 446 64,253 23,839 88,538HOLMES 0 1,191 179 1,370INDIAN RIVER 295 0 10,643 10,938JACKSON 0 3,365 499 3,864JEFFERSON 0 809 0 809LAFAYETTE 111 0 647 758LAKE 1,106 24,546 2,308 27,960LEE 0 0 500 500
TABLE 6-1 Hurricane Evacuation Shelter Spaces Identified Since 1995 (1)

Division of Emergency Management 2018 Statewide Emergency Shelter Plan
6-4
Totals Per County
As-Is or Pre-Mitigation ARC 4496 Capacity (persons)
EHPA 2018Capacity Gained
(persons)
Retrofitted / Mitigated Capacity Gained
(persons)
Total 2018ARC 4496 Spaces
LEON 822 1,245 25,065 27,132LEVY 0 354 5,104 5,458LIBERTY 0 822 836 1,658MADISON 0 0 4,236 4,236MANATEE 0 13,625 3,127 16,752MARION 629 10,257 7,301 18,187MARTIN 4,686 10,047 5,847 20,580MIAMI-DADE 17,733 20,007 50,054 87,794MONROE 0 0 723 723NASSAU 0 3,925 1,794 5,719OKALOOSA 6,454 0 5,121 11,575OKEECHOBEE 0 1,315 324 1,639ORANGE 2,055 28,829 475 31,359OSCEOLA 0 7,160 18,110 25,270PALM BEACH 1,038 48,355 20,867 70,260PASCO 166 14,844 5,412 20,422PINELLAS 11,954 7,472 10,067 29,493POLK 1,007 33,157 1,416 35,580PUTNAM 0 1,271 3,495 4,766SAINT JOHNS 6,517 4,811 6,299 17,627SAINT LUCIE 3,584 4,388 9,413 17,385SANTA ROSA 704 5,471 6,832 13,007SARASOTA 1,278 5,019 2,243 8,540SEMINOLE 1,087 1,206 29,134 31,426SUMTER 367 200 719 1,286SUWANNEE 0 3,484 50 3,534TAYLOR 0 0 4,144 4,144UNION 0 54 2,341 2,395VOLUSIA 2,614 8,878 12,677 24,169WAKULLA 0 800 0 800WALTON 1,262 5,269 2,766 9,297WASHINGTON 0 1,199 3,766 4,965
Grand Totals 109,293 465,675 464,500 1,039,468
TABLE 6-1 Hurricane Evacuation Shelter Spaces Identified Since 1995 (2)

Division of Emergency Management 2018 Statewide Emergency Shelter Plan
6-5
Through research Florida has been able to increase its understanding of shelter
demand. By more accurately identifying demand the State is able to plan for anticipated need thus reducing its hurricane shelter deficit. Through the technologies applied to this effort, such as LiDAR, and improved SLOSH computer models, the Division is able to more precisely determine which areas are vulnerable to hurricane storm surge. These improved techniques are the results of the 2010 SRES. In the past, studies were conducted only regionally and sporadically when funding was available. Methodologies varied to meet the needs at the time. As of 2010, all RPC regions are held to a statewide methodology statutorily mandated in §163.3178(2)(d)F.S.
Historically, 25 percent or more of the estimated evacuating population were projected to seek safety in public shelters. Many of the post-1998 Hurricane Evacuation Studies, including the 2010 Behavioral Data from the SRES, are now indicating that fewer than 15 percent of the vulnerable population will seek public shelter for a Category 5 hurricane.
The 2004 hurricane season provides an example of relatively low public shelter use. Though none of the storms made landfall as a Category 5 hurricane, two storms approached Florida at near Category 5 strength before making landfall as a Category 3 and 4; Hurricane Ivan and Hurricane Charley respectively. During Hurricane Ivan, an estimated 544,900 persons were under evacuation orders and only 33,472 evacuees were housed in public shelters (6 percent). During Hurricane Charley, although it rapidly intensified only a few hours before landfall, there were an estimated 2.7 million persons under evacuation orders and only 102,094 evacuees were housed in public shelters (3.75 percent). While these examples alone are not evidence of a decrease in demand, they do show that under many circumstances public shelter demand is lower.
In 2017, Hurricane Irma resulted in 54 of 67 counties ordering evacuations. Approximately 3.8 million people were under evacuation orders but the shadow evacuation raised estimates to 6.8 million evacuees. Approximately 200,000 sheltered across the state.
Since publication of the 2000 Plan, the statewide average estimated demand has fallen from about 24 percent to about eight (8) percent. The practical effect is an apparent statewide reduction in hurricane shelter space demand since 2000, which has resulted in a general decrease in the need to invest public funds to create the additional “bricks-and-mortar” shelter spaces.
The Division has also developed a public information program to compliment the other hurricane evacuation shelter deficit reduction efforts. The Division educates residents on the hazards they face and how to best deal with them. A key issue is whether or not to evacuate and, if so, to where. Education on the hazards and how they affect a community lead to residents making better-informed decisions in a crisis. That effort is being supported by public service announcements, hurricane expositions, training of local responders and volunteers, and through emergency messages during times of crisis. This is expected to be a long-term process that will help to reduce the need for public hurricane evacuation shelter space.

Division of Emergency Management 2018 Statewide Emergency Shelter Plan
6-6
As seen in Table 6-1, since 1999 the Division’s hurricane evacuation shelter
survey and retrofit program has identified, created or otherwise documented 573,793 hurricane evacuation shelter spaces that meet ARC 4496 guidelines. Public school new construction programs have created an additional 465,675 hurricane evacuation shelter spaces. Therefore, Florida will have a total of 1,039,468 shelter spaces that meet ARC 4496 guidelines in 2018.
The demand for hurricane evacuation shelter space has also been significantly
reduced over the past fourteen years due to improvements in public information, storm hazard models and more accurate census data. Since 2000, Florida’s deficit of hurricane evacuation shelter space has been eliminated on a statewide aggregate basis. However, individual regions remain in a hurricane evacuation shelter space deficit.
With publication of this Plan, Florida now has 43 counties with sufficient capacity
of GP hurricane evacuation shelter space. The counties with sufficient GP space include: Alachua, Baker, Bay, Bradford, Brevard, Broward, Calhoun, Columbia, Dixie, Duval, Escambia, Flagler, Gadsden, Gilchrist, Glades, Hamilton, Hardee, Hendry, Hillsborough, Holmes, Indian River, Jackson, Jefferson, Lafayette, Lake, Leon, Levy, Liberty, Madison, Martin, Nassau, Okaloosa, Orange, Osceola, Palm Beach, Saint Johns, Saint Lucie, Santa Rosa, Seminole, Taylor, Union, Walton, and Washington.
There are fewer counties, 30, with a sufficient capacity of SpNS hurricane evacuation shelter space. The counties with a sufficient capacity of SpNS space include: Baker, Brevard, Broward, Citrus, Clay, Columbia, DeSoto, Escambia, Flagler, Gilchrist, Glades, Hamilton, Hardee, Hernando, Hillsborough, Indian River, Lafayette, Leon, Levy, Manatee, Martin, Miami-Dade, Osceola, Pasco, Putnam, Saint Johns, Santa Rosa, Union, Volusia and Washington.
Figure 6-1. Projected Hurricane Shelter Deficit Reduction

Division of Emergency Management 2018 Statewide Emergency Shelter Plan
7-1
7.0 CONCLUSIONS
As a result of Hurricane Andrew and the Lewis Commission Report, the State of Florida recognized the necessity of providing safe hurricane evacuation shelter space for its residents during disasters. In support of this goal, the Division, every two years, submits to the Governor and Cabinet, the Statewide Emergency Shelter Plan. The Plan identifies the general location and square footage of existing GP and SpNS by RPC region, and needed GP and SpNS space during the next five (5) years. The Plan also includes information on the availability of shelters that accept pets. The Department of Health assisted the Division in determining the estimated need for SpNS hurricane evacuation shelter space.
The 2018 Plan shows that Florida on a statewide aggregate basis has eliminated the deficit GP public hurricane evacuation shelter space. However, a deficit of SpNS spaces continues to exist. Since 1995, more than 1,039,468 hurricane evacuation shelter spaces have been identified, created through retrofitting of existing buildings, or through new construction (e.g., EHPA). As the Division continues to study the trends in evacuating behavior, it is estimated that Florida’s public hurricane evacuation shelter demand will continue to be reduced statewide. Since 2004, Florida’s statewide aggregate public hurricane evacuation shelter space demand has been reduced to 959,397. In contrast, there was an estimated hurricane evacuation shelter demand of 1,776,606 shelter spaces in 2000.
However, there are still three (3) regions of the state that currently have a deficit of GP hurricane evacuation shelter space. Nine (9) regions currently have deficits of SpNS space. Regions that currently have an adequate number of hurricane evacuation shelter spaces will need to maintain the inventory. Over time, current hurricane evacuation shelter buildings may (or will) be decommissioned due to age and other issues; such as, remodeling or reuse that’s incompatible with mass care shelter operations, removal or deterioration of window protection products; etc. There may also be changes in storm hazard maps (e.g., SLOSH, national flood insurance maps, etc.) that could affect their recognition as meeting hurricane safety criteria. Thus, even though the aggregate statewide deficit of GP space has been eliminated in the 2018 Plan, a “maintenance level” of shelter space production will be necessary to avoid falling back into a deficit situation.