Embed Size (px)
Citation preview

109 J. Asian Dev. Stud, Vol. 2, Issue 2, (June 2013) ISSN 2304-375X
Dividend Policy and Share Price Volatility
O. J. ILABOYA1 and M. AGGREH
2
Abstract We examined the relationship between dividend policy and share price volatility across
companies listed in the Nigerian Stock Exchange Market. 26 sampled firms across a number
of sectors were selected through simple random sampling technique over a period (2004 –
2011). Our model specification captured share price volatility (P.vol) as the dependent
variable, while dividend yield (Dyld) and dividend payout ratio (Payout) were the
independent variable; firm size (size), long-term debt (Debt), earnings volatility (E.vol) and
asset growth rate (AsGRt) were the control variables. For robustness purposes, the
regression analysis was conducted using the pooled OLS and Panel EGLS. We also
conducted various tests (i.e. Multicollinearity, Heteroskedasticity, Autocorrelation and
Model specification tests) using Eviews 7.0. Our finding indicated that dividend yield exerts
a positive and significant influence on share price volatility of firms while dividend payout
exerts a negative and insignificant influence on share price volatility. We recommended
therefore that companies should be consciously meticulous in their thoughts on efficient
approach to maximizing the wealth of shareholders and simultaneously meeting the
company’s needs to finance its investments.
Keywords: Dividend Policy, Share Price Volatility, Autocorrelation, Heteroskedasticity.
1. Introduction Corporate financial management involves three important decisions namely; financing
decision, investment decision, and dividend decision (Baker & Wurgler, 2004). The latter is
the focus of this study. With regards to dividend payments, business managers must approach
this decision strategically. Managers must not only consider the question of how much of the
company’s earnings are needed for investment, but also take into consideration the possible
effect of their decisions on share prices (Bishop, Crapp, Faff, & Twite, 2000). The basic
question that arose in respect of dividend payment was: Should the firm distribute all or
proportion of earned profits in the form of dividends to the shareholders; or should it be
ploughed back into the business? In answering this question, different dividend policies have
been adopted by different firms. Dividend policy is the action program used by a firm to
decide how much of its residual profits should be paid out to shareholders in dividends. In
any circumstance, the portion of the residual profits not paid as dividend is referred to as
retained earnings. Dividends are usually distributed in the form of cash (cash dividends) or
share (share/stock dividends). Therefore, dividend payout ratio indicates the proportion of
total residual profits distributed as dividend to shareholders (Oyejide, 1976; Fama & French,
1988; Bali, 2003; Gill, Biger & Tibrewala, 2010).
Dividend has been adjudged to be the catalyst for the movement of firms’ share prices. The
theories that exist within the framework of dividend and dividend policy, and empirical
researches thereon, have demonstrated positive linear relationship between dividend payment
and share price volatility (Alli, Khan & Ramirez, 1993; Allen & Rachim, 1996; Adelegan,
1 Department of Accounting, Faculty of Management Sciences, University of Benin, Benin City, Nigeria.
email: [email protected]; [email protected] 2 Department of Accounting, Faculty of Management Sciences, University of Benin, Benin City, Nigeria.
email: [email protected]; [email protected]

110 J. Asian Dev. Stud, Vol. 2, Issue 2, (June 2013) ISSN 2304-375X
2000; Anil & Kapoor, 2008). The volatility of stock prices has been of concern to
researchers. Stock return volatility which represents the variability of stock price changes
could be perceived as a measure of risk faced by investors. In financial markets, volatility
clustering emerges when a high return (positive or negative) is more likely to be followed by
another high return, or when a low return (positive or negative) is more likely to be followed
by another low return. volatility-clustering is a natural result of a price formation process
with heterogeneous beliefs across traders, and that volatility clustering is not attributable to
an autocorrelated news-generation process around public information such as macroeconomic
news releases or firms’ earnings releases.
Mandelbrot (1963); Fama (1965); Black, (1976), Rajni and Mahendra (2007) noted that stock
price volatility tends to rise when new information is released into the market, however the
extent to which it rises is determined by the relevance of that new information as well as the
degree in which the news surprise investors. The focus of this study was to examine the
impact of dividend policy on stock price volatility in Nigeria. The existing empirical evidence
so far is observed to be vacillating and largely polarized. The arguments have been between
theories that suggest that divided policy has no effect on stock prices (Irrelevance theory) and
those who think otherwise. Hence, the broad objective of this study was to examine with
empirical evidence from a developing economy (Nigeria) dividend policy and share price
volatility. More specifically, the objectives were to:
1. ascertain the relationship between dividend yield and share price volatility;
2. determine the effect of dividend payout on the volatility of share price; and
3. examine the relationship between firm’s debt and share price volatility.
The remainder of this study is organized as: section 2 addressed empirical evidence on
dividend policy and share price volatility. Section 3 presented methodological issues with
emphasis on data and model specification and estimation techniques. Section 4 focused on
presentation and analysis. Section 5 highlighted the summary, conclusion and
recommendations.
2. Empirical Evidence on Dividend Policy and Share Price Volatility 2.1 Dividend Policy and Share Price Volatility
According to Allen and Rachim (1996), paying large dividends reduces risk and thus
influence stock price (Gordon, 1963) and is a proxy for the future earnings (Baskin, 1989). A
number of theoretical mechanisms have been suggested that cause dividend yield and payout
ratios to vary inversely with common stock volatility. These are duration effect, rate of return
effect, arbitrage pricing effect and information effect. Duration effect implies that high
dividend yield provides more near term cash flow. If dividend policy is stable, high dividend
stocks will have a shorter duration. Gordon Growth Model can be used to predict that high-
dividend will be less sensitive to fluctuations in discount rates and thus ought to display
lower price volatility. Agency cost argument, as developed by Jensen and Meckling (1976)
proposed that dividend payments reduce costs and increase cash flow, that is payment of
dividends motivates managers to disgorge cash rather than investing at below the cost of
capital or wasting it on organizational inefficiencies (Rozeff, 1982 and Easterbrook 1984).
Some authors have stressed the importance of information content of dividend (Asquith &
Mullin, 1983; Born, Moser & officer 1983). Black and Scholes (1974) found no relationship
between dividend policy and stock prices. Their results further explained that dividend policy
does not affect the stock prices and it depends on investors’ decision to keep either high or
low yielding securities; return earned by them in both cases remains the same. Miller and
Rock (1985) suggested that dividend announcements provide the missing pieces of

111 J. Asian Dev. Stud, Vol. 2, Issue 2, (June 2013) ISSN 2304-375X
information about the firm and allows the market to estimate the firm’s current earnings.
Investors may have greater confidence that reported earnings reflect economic profits when
announcements are accompanied by ample dividends.
Baskin (1989) took a slightly different approach and examined the influence of dividend
policy on stock price volatility, as opposed to stock returns. He advanced four basic models
which related dividends to stock price risk. He called these as: the duration effect, the rate of
return effect, the arbitrage pricing effect and the informational effect. The difficulty in many
empirical works examining the linkage between dividend policy and stock volatility or
returns lies in the setting up of adequate control over the factors that influence both. For
example, the accounting system generates information on several relationships that are
considered by many to be measures of risk. Baskin (1989) suggested the use of the following
control variables in testing the significance of the relationship between dividend yield and
price volatility; operating earnings, the size of the firm, the level of debt, the payout ratio and
the level of growth. So he had tried to explain the underlying linkage between dividend
policies (dividend yield and dividend payout ratio) and stock price risk in his empirical work
on USA.
2.2 Dividend Yield and Share Price Volatility Allen and Rachim (1996) observed no relationship between the dividend yield and stock
market price even after studying 173 Australian listed stocks but it showed positive relation
between stock prices and size, earnings and leverage and negative relation between stock
prices and payout ratio. Baskin (1989) examined 2344 U.S common stocks from the period of
1967 to 1986, and found a significant negative relationship between dividend yield and stock
prices.
Adesola and Okwong (2009) found that dividend policy is significantly associated with
earnings, earnings per share and previous year dividends but discovered that growth and size
had no effect on dividend policy.
Akbar and Baig (2010) studied a sample of 79 companies listed at Karachi Stock Exchange
for the period of 2004 to2007. Results of their study showed that announcement of dividends;
either cash dividend or stock dividend or both had positive effect on stock prices. Nazir,
Nawaz, Anwar, and Ahmed (2010) studied the effect of dividend policy on stock prices.
Results of their study showed that dividend payout and dividend yield had significant effect
on stock prices while size and leverage had negative insignificant effect. Earning and growth
had positive significant effect on stock prices.
Khan, Aamir, Qayyum, Nasir, and Khan (2011) studied the effect of dividend payment on
stock prices by taking a sample of fifty five companies listed at Karachi Stock Exchange.
Results of their study showed that dividend yield, earnings per share, return on equity and
profit after tax were positively related to stock prices while retention ratio had negative
impact on Stock Prices.
Okafor, Mgbame, and Chijoke-Mgbame, (2011) examined the relationship between dividend
policy and share price changes in the Nigerian Stock Exchange market using a multiple
regression analysis. Dividend yield showed a negative impact on share price risk while
dividend payout ratio, showed negative influence in some years. The study supports the fact
that dividend policy is relevant in determining share price changes for a sample of firms
listed in the Nigerian Stock Exchange.
2.3 Firm Size and Share Price Volatility Ho (2002) used the panel data approach and fixed effect regression model to study the
relevance of dividend policy. Results of his study showed a positive relation between

112 J. Asian Dev. Stud, Vol. 2, Issue 2, (June 2013) ISSN 2304-375X
dividend policy and size of Australian firm and liquidity of Japanese firms. He observed a
negative relation between dividend policy and risk in case of only Japanese firms.
Kashif, (2011) empirically investigated the factors that determine the dividend payout
decisions in Pakistan’s Engineering sector by using the data of thirty-six firms listed on
Karachi Stock Exchange from the period 1996 to 2008. The results suggested that the
previous dividend per share, earnings per share, profitability, cash flow, sales growth, and
size of the firm were the most critical factors determining dividend policy in the Engineering
sector of Pakistan.
Contrary to Al-Kuwari (2009) and Glen, Karmokolias, Miller, and Shah (1995), Aivazian,
Booth, and Cleary (2003) found no difference in the dividend pattern of firms in emerging
market with U.S firms. The higher the earnings of a firm, the greater the size. Firms with
foreign ownership prefer to distribute a higher and constant amount in dividend payouts
according to their earnings and size (Eriotis 2005).
2.4 Earnings and Share Price Volatility Kanwal, Muhammad, Arslan, Adeel and Maryam, (2011) attempted to explain the effect of
dividend announcements on stock prices of Chemical and Pharmaceutical industries of
Pakistan. A sample of twenty five companies listed at KSE-100 Index was taken from the
period of 2001 to 2010. The result of the study was based on fixed and random effect model
which is applied on panel data to explain the relationship between dividends and stock prices
after controlling for variables like earnings per share, retention ratio and return on equity. The
results indicated that cash dividend, retention ratio and return on equity had significant
positive relation with stock market prices and significantly explained the variations in the
stock prices of Chemical and Pharmaceutical sector of Pakistan while earnings per share and
stock dividends had negative insignificant relation with stock prices.
3. Methodology
3.1 Data and Model Specification
We employed a cross-sectional research design using secondary data from the Nigerian Stock
Exchange (NSE), annual reports of randomly selected sampled firms and the Central Bank of
Nigeria (CBN) Statistical Bulletin. Based on yearly observation of publicly listed firms over
the period (2004 – 2011), we selected twenty-six (26) firms, using convenient random
sampling technique.
For purpose of the study, an econometric model was specified and estimated. The model
examines the relationship between share price volatility (P.vol) and dividend policies
(dividend yield (Dyld), dividend payout ratio (Payout)), with some control variable (firm size
(size), Debt (debt), earnings volatility (E.vol) and asset growth rate (AsGRt)). This model
was adopted from the studies of Baskin (1989) and Hashemijoo, Ardekani and Younesi
(2012), and modified to suit our specific purpose.
P.voli = a0 + a1Dyldi + a2Payouti + a3Sizei + a4Debti + a5E.voli + a6AsGRti +
where P.voli = Share Price Volatility, Dyldi = Dividend yield, Payouti =Dividend payout
ratio, Sizei = Size of the firm, Debti =Long-term debt, EVi = Earnings Volatility, AsGRti
=Asset growth rate, = Stochastic Error Term, Apriori expectation; α0 , ..., α6 > 0.

113 J. Asian Dev. Stud, Vol. 2, Issue 2, (June 2013) ISSN 2304-375X
3.1 MEASUREMENT OF VARIABLES Variable
Measurement
Share Price Volatility, (Pvoli)
Dividend yield (Dyldi)
Dividend payout ratio (Payouti)
Size of the firm, ( Sizei)
Long-term debt (Debti)
Earnings Volatility (EVi )
Asset growth rate (AsGRti)
Source: Baskin (1989) and Hashemijoo et al., (2012)
P.vol:Share price volatility; Hi :Highest stock price for year i; Li :Lowest stock price for year
i; Dyldl : Dividend yield; Di: Dividend Paid in year i; MVi :Market value of firm at the end of
year i; DPSi :Dividend per share in year i; MPSi :Market price per share in year i; Ei :Net
profit after tax for the year i; Ri : Ratio of operating income to total asset for year i; :
; LDi : Long-term debt at the end of year i; Asseti :Total Asset at the end of year
i; i : Change of total asset in year i; Asseti: Total Asset at the beginning of year i; and
i (from 1 – 7) indicates years from 2005 to 2011. We used both Cochrane Orcutt and the
EGLS techniques in this study to control for the suspected serial correlation in the model.
4. Presentation and Analyses of Result
Table 1: Descriptive statistics
PVOL DYLD PAYOUT SIZE DEBT EVOL ASGRT
Mean 0.274 0.248 0.0598 0.373 0.019 0.0353 0.026
Median 0.248 0.011 0.0347 0.446 0.009 0.0232 0.018
Maximum 0.681 5.443 1.626 3.856 0.148 0.754 0.295
Minimum 0.000 0.000 -0.493 -2.639 0.000 0.000 -0.142
Std. Dev. 0.146 0.561 0.178 1.524 0.024 0.0622 0.045
Jarque-Bera 6.333 13192.23 13161.5 2.504 695.342 73531.9 640.077
Probability 0.042 0.000 0 0.286 0.000 0.000 0.000
bservations 181 181 181 181 181 181 181
Source: Researchers Computation (2013)
Where PVOL= share price volatility, DYLD= Dividend Yield, PAYOUT=Dividend Payout
ratio SIZE= Firm Size, DEBT = Debt, EVOL=Earnings Volatility, ASGRT=Asset Growth.

114 J. Asian Dev. Stud, Vol. 2, Issue 2, (June 2013) ISSN 2304-375X
As observed in Table 1, the standard deviation, maximum, minimum and median values for
PVOL stood at 0.146, 681, 0.000 and 0.248 respectively with an average volatility rate of
over 27% for the study period. The mean value for DYLD stood at 0.248 and suggests a
dividend yield of about 24% over the study period with a standard deviation of 0.561. The
maximum, minimum and median values for the period under review were 5.443, 0.000 and
0.011 respectively. The mean value for PAYOUT stood at 0.0598 which suggest a dividend
payout average of about 5.9% with a standard deviation stood of 0.178. The maximum,
minimum and median values were 1.626, -0.493 and 0.0347 respectively. SIZE was observed
to have a mean value of 0.373 and a standard deviation of 1.524. The maximum, minimum
and median values were 3.856, -2.639 and 0.446 respectively. DEBT is observed to have a
mean value of 0.019 and a standard deviation of 0.024. The maximum, minimum and median
values were 0.148, 0.00 and 0.009 respectively. EVOL is observed to have a mean value of
0.035 which suggest an average earnings volatility rate of about 3.5% and a standard
deviation of 0.06. The maximum, minimum and median values were 0.754, 0.00 and 0.023
respectively. Finally, ASGRT was observed to have a mean value of 0.026 which suggest an
average asset growth rate of about 2.6% and a standard deviation of 0.045.The maximum,
minimum and median values were 0.295, -0.142 and 0.018 respectively. The Jarque-Bera
statistic and p-value for all the variables suggest that the series indicates that the data satisfies
normality with no likelihood of outliers in the series except for size which suggest that the
series do not appear normal.
Table 2: Pearson Correlation Results
PVOL DYLD PAYOUT SIZE DEBT EVOL ASGRT
PVOL 1
DYLD 0.079 1
PAYOUT -0.061 -0.015 1
SIZE -0.223 0.051 -0.012 1
DEBT 0.173 -0.054 0.027 -0.139 1
EVOL -0.027 0.050 -0.071 -0.028 0.268 1
ASGRT 0.108 -0.014 0.107 0.052 -0.010 -0.081 1
Source: Researchers Computation (2013)
As observed from the result in table 2, PVOL and DYLD were observed to be positively
correlated (0.079). PAYOUT was observed to be negatively correlated with PVOL (-0.061)
and with DYLD (-0.015). SIZE was observed to be negatively correlated with PVOL (-0.223)
and PAYOUT (-0.012) but positively correlated with DYLD (0.051). DEBT was positively
correlated with PVOL (0.173), PAYOUT (0.027) but was however observed to be negatively
correlated with DYLD (-0.054) and SIZE (-0.139). EVOL also appears to be positively
correlated with DYLD (0.050) and DEBT (0.268). It however appeared to be negatively
correlated with PVOL (-0.027), PAYOUT (-0.071) and SIZE (-0.028). Finally, ASGRT was
positively correlated PVOL (0.108), PAYOUT (0.107), and SIZE (0.052) but negatively
correlated with DYLD (-0.014), DEBT (-0.010) and EVOL (-0.081). The correlation
coefficients suggested that none of the variables suffered the problem of multicollinearity.

115 J. Asian Dev. Stud, Vol. 2, Issue 2, (June 2013) ISSN 2304-375X
4.1 Step Wise Regression Test In this study, we adopted the stepwise forward regression to determine the best model by
comparing R2
value for the possible model as shown in the table 3 below.
Table 3: Step wise Regression
SIZE PAYOUT EVOL DYLD DEBT ASGRT R2
-0.018 0.130
-0.018 -0.884 0.143
-0.018 -0.086 -0.064 0.143
-0.017 -0.087 -0.068 0.032 0.156
-0.014 -0.086 -0.179 0.032 1.237 0.185
-0.015 -0.092 -0.164 0.032 1.237 0.222 0.191
Source: Researchers Computation (2013)
The model with the highest R2
(0.191) value is that which incorporates both the explanatory
and control variables. Thus based on the stepwise forward regression, all the explanatory
variables were included in the model.
4.2 Diagnostic Test Results Before conducting the regression analysis, we examined the OLS assumptions. Namely:
Multicollinearity, Heteroskedasticity, Autocorrelation and Model specification tests. The
various tests were conducted using Eviews 7.0. The results and analysis are presented below;
i. Multicollinearity Test We investigated the collinearity status of the variables using the Variance Inflation Factor
(VIF) tests. Basically, VIFs above 10 are seen as a cause of concern (Landau and Everitt,
2003). As observed (see appendix 1), none of the variables had VIF’s values exceeding 10.
Hence, none gave serious indication of multicollinearity.
ii. Heteroskedasticity Test
The ARCH test was performed on the residuals as a precaution with a lag specification of 2.
The results showed probabilities in excess of 0.05, which leads us to reject the presence of
heteroscedasticity in the residuals. (See appendix 2)
iii. Serial Correlation Test With a lag specification of 2, the Lagrange Multiplier (LM) test result showed evidence of the
presence of serial correlation in the residuals of the model as the probabilities (Prob. F, Prob.
Chi-Square) were less than 0.05(see appendix 3). In correcting for the suspected serial
correlation in the model, we adopted the Cochrane Orcutt method which implies including an
autoregressive (AR) term as part of the exogenous variables and re-estimating the model.
However, in the case of panel data (with effects) where the inclusion of AR terms is not
allowed, we applied the EGLS (Estimated General Least Squares).
iv. Model Specification test The results showed high probability values that were greater than 0.05, meaning that there
was no significant evidence of model miss-specification. (See appendix 4)
4.3 Regression Analysis The regression results conducted to examine the causal-relationship between dividend policy
and share price volatility. The Cochrane Orcutt method EGLS without lags of the dependent
variables was utilized in this study to control for the suspected serial correlation in the model.
For robustness purposes, the regression analysis was conducted Using the pooled OLS, and
116 J. Asian Dev. Stud, Vol. 2, Issue 2, (June 2013) ISSN 2304-375X
the panel OLS (with effects). Before, performing the regression (panel) we first conducted
the Hausman test to identify the effects applicable to the data. (See Table 4).
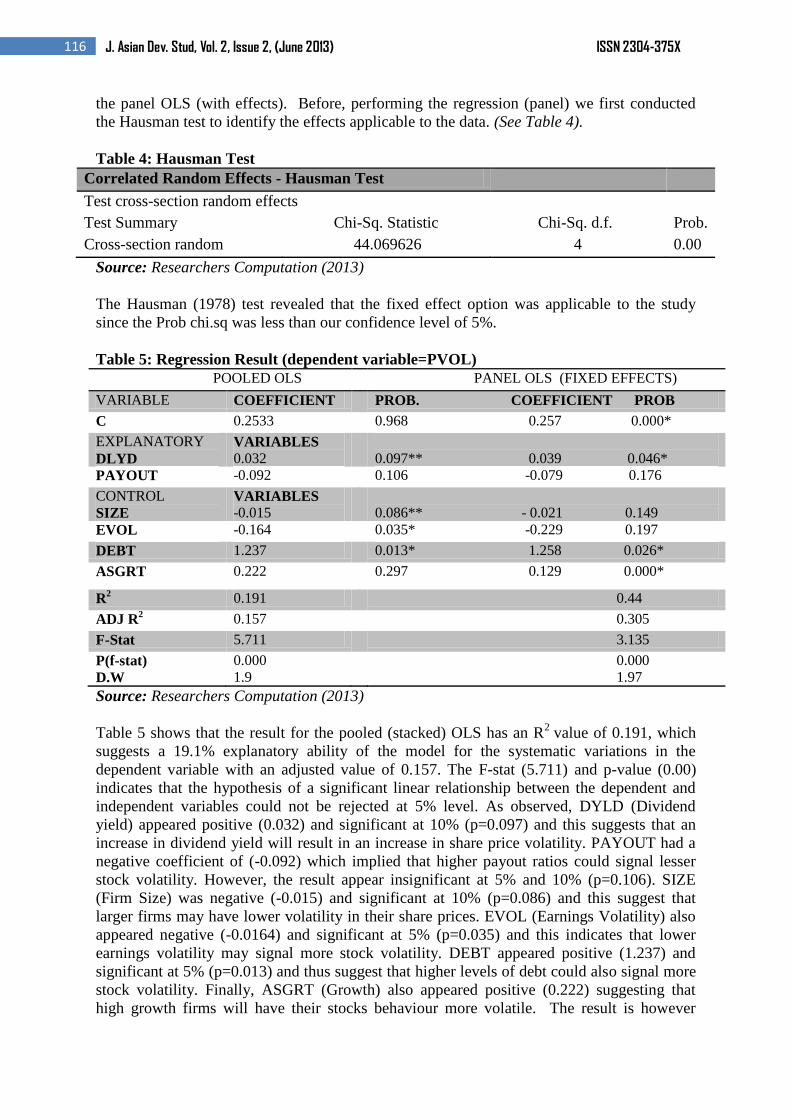
Table 4: Hausman Test
Correlated Random Effects - Hausman Test
Test cross-section random effects
Test Summary Chi-Sq. Statistic Chi-Sq. d.f. Prob.
Cross-section random 44.069626 4 0.00
Source: Researchers Computation (2013)
The Hausman (1978) test revealed that the fixed effect option was applicable to the study
since the Prob chi.sq was less than our confidence level of 5%.
Table 5: Regression Result (dependent variable=PVOL)
POOLED OLS PANEL OLS (FIXED EFFECTS)
VARIABLE COEFFICIENT PROB. COEFFICIENT PROB
C 0.2533 0.968 0.257 0.000*
EXPLANATORY
DLYD
VARIABLES
0.032
0.097** 0.039 0.046*
PAYOUT -0.092 0.106 -0.079 0.176
CONTROL
SIZE
VARIABLES
-0.015
0.086** - 0.021 0.149
EVOL -0.164 0.035* -0.229 0.197
DEBT 1.237 0.013* 1.258 0.026*
ASGRT 0.222 0.297 0.129 0.000*
R2 0.191 0.44
ADJ R2 0.157 0.305
F-Stat 5.711 3.135
P(f-stat)
D.W
0.000
1.9
0.000
1.97
Source: Researchers Computation (2013)
Table 5 shows that the result for the pooled (stacked) OLS has an R2
value of 0.191, which
suggests a 19.1% explanatory ability of the model for the systematic variations in the
dependent variable with an adjusted value of 0.157. The F-stat (5.711) and p-value (0.00)
indicates that the hypothesis of a significant linear relationship between the dependent and
independent variables could not be rejected at 5% level. As observed, DYLD (Dividend
yield) appeared positive (0.032) and significant at 10% (p=0.097) and this suggests that an
increase in dividend yield will result in an increase in share price volatility. PAYOUT had a
negative coefficient of (-0.092) which implied that higher payout ratios could signal lesser
stock volatility. However, the result appear insignificant at 5% and 10% (p=0.106). SIZE
(Firm Size) was negative (-0.015) and significant at 10% (p=0.086) and this suggest that
larger firms may have lower volatility in their share prices. EVOL (Earnings Volatility) also
appeared negative (-0.0164) and significant at 5% (p=0.035) and this indicates that lower
earnings volatility may signal more stock volatility. DEBT appeared positive (1.237) and
significant at 5% (p=0.013) and thus suggest that higher levels of debt could also signal more
stock volatility. Finally, ASGRT (Growth) also appeared positive (0.222) suggesting that
high growth firms will have their stocks behaviour more volatile. The result is however

117 J. Asian Dev. Stud, Vol. 2, Issue 2, (June 2013) ISSN 2304-375X
statistically insignificant at 5% and 10% levels (p=0.297). The D. W statistics of 1.9 indicates
the absence of serial correlation of the residuals in the model.
In line with the Hausman test result, the fixed effects panel data analysis was conducted and
the results appeared to perform better and explains a significantly higher proportion of
systematic variations in the dependent variable than the pooled (stacked) OLS and panel
OLS without effects. This suggests that the impact of dividend policy on share price
volatility in our sample is influenced by cross-section specific effects. As observed, the R2
value improved considerably to 0.44 which suggested that the fixed effects Panel regression
explains about 44% of the systematic variations in the dependent variable with an adjusted
value of 0.305. The F-stat (21.279) and p-value (0.00) indicated that the hypothesis of a
significant linear relationship between the dependent and independent variables cannot be
rejected at 5% level. An evaluation of the effects of the explanatory variables revealed that
DYLD (Dividend yield) appeared positive (0.039) and significant at 5% (p=0.046). Hence we
rejected the null hypothesis (H1) of no significant relationship between dividend yield and
share price volatility at 5% level. The center-point of most researches on dividend policy and
share prices has been either to support or to refute the irrelevance theory proposed by Miller
and Modigliani (1961).
4.4 Discussion of Findings Our result revealed that DYLD (Dividend yield) appeared positive (0.039) and significant at
5% (p=0.046) and as such refutes the irrelevance theory. The finding is in line with that of
Hussainey et al., (2011) but is however at variance with Baskin, (1989) who reported a
significant negative association between dividend yield and volatility of stock prices. The
findings of Baker and Powell, (1999) also show that dividend policy has impact on value of
firm. Our finding is also in tandem with that of Travlos, Trigeorgis, and Vafeas, (2001) which
provides strong evidence for refuting the irrelevance hypothesis. Also similar to our finding is
that of Suleman et al., (2011) conducted for firms on the Karachi Stock for the period of 2005
to 2009 which found that share price volatility has significant positive relationship with
dividend yield. PAYOUT appeared negative (-0.079) and insignificant at 5% and 10%.
Hence we accepted the hypothesis (H2) of no significant relationship between dividend
payout and share price volatility. The finding for PAYOUT seems to support the irrelevancy
theory that in a perfect market, dividend policy does not affect the shareholder’s return.
Uddin and Chowdhury, (2005) also found that dividend payout does not provide value gain
for investors and shareholders. Of the control variables included in the model, DEBT
appeared to impact positively on stock price volatility (1.258) and is also significant at 5%
level (0.026). Hence, we rejected the null hypothesis (H3) of no significant relationship
between Debt and volatility of share prices. In addition, ASGRT (Asset Growth) impacted
positively on stock price volatility (0.129) and was also significant at 5% level (0.00). SIZE
(Firm Size) appeared negative (-0.021) and insignificant at 5 and 10% (p=0.149) EVOL
(Earnings Volatility) also appeared negative (-0.229) and insignificant at 5% and 10% levels
(p=0.197).
5. Summary of Findings, Conclusion and Recommendations 5.1 Summary of Findings
We made the following findings:
1. Expectedly, we found that dividend yield exerts a positive and significant influence on
share price volatility having reported a coefficient of 0.032 at 10% (p=0.097) significant
level.

118 J. Asian Dev. Stud, Vol. 2, Issue 2, (June 2013) ISSN 2304-375X
2. Surprisingly, we found that the influence of dividend payout on share price volatility was
negative and insignificant at 5% and 10% respectively (p=0.106), having reported a
coefficient of -0.092.
3. We also found a positive relationship between debt of the firm and the volatility of the
share price, significant at 5% (p=0.013) with a coefficient of 1.237.
4. Firm Size appeared negative (-0.015) and significant at 10% (p=0.086)
5. Earnings Volatility also appeared negative (-0.0164) and significant at 5% (p=0.035)
6. ASGRT (Growth) was positive (0.222) but was however statistically insignificant at 5%
and 10% levels (p=0.297).
5.2 Conclusion The broad objective of this study was to examine the impact of dividend policy on share price
volatility with a focus on companies listed on the Nigerian Stock Exchange market. For this
purpose, a sample of 26 companies was examined by applying multiple regressions for a
period of seven years from 2005 to 2011. The primarily regression model was expanded by
adding control variables including size, earning volatility, debt and growth. The empirical
results of this study showed mixed findings between the measures of dividend policy
(dividend yield and payout ratio) and their impact on share price volatility. While dividend
yield appeared positive and significant, payout ratio appeared negative and insignificant. Of
the control variables included in the model, DEBT appeared to impact positively on stock
price volatility and was also significant at 5%. ASGRT (Asset Growth) impacted positively
on stock price volatility and was also significant at 5% level. SIZE (Firm Size) and EVOL
(Earnings Volatility) were both negative and insignificant.
5.3 Recommendations The impact of cash dividend policy on the current prices of company shares is considered to
be very important, not only for policy makers, but also for investors, portfolio managers, and
researchers interested in the performance of capital markets. Though the finding show mixed
results in the effects of dividend yield and dividend payout ratio, the study recommends that
whatever ideology that a firm chooses to adopt between the two extreme theories; (that
dividend does not affect the value of the company as the company‘s value will not be affected
by how earned profits are divided but rather affected by the ability to achieve profits on one
hand and the opinion that dividends affect the company‘s value through an increase or
decrease in the demand for the company on the other), companies should be consciously
meticulous in their thoughts on efficient approach to maximizing the wealth of shareholders
and simultaneously meeting the company’s needs to finance its investments.
References Adelegan, O. J (2000). An empirical analysis of the relationship between cash flows and
dividend changes. A paper presented at the 23rd Annual Congress of the European
Accounting Association, Munich, Germany p.5.
Adesola, W. A., & Okwong, A. E. (2009). An Empirical Study of Dividend Policy of
Quoted Companies in Nigeria. Global Journal of Social Sciences , 8 (1), 85-101.
Aivazian, V., Booth, L. & Cleary, S. (2003) Do Emerging Market Firms Follow Different
Dividend Policies from U.S. Firms?, The Journal of Financial Research, 26, 371-87.
Akbar M & Baig H. H. (2010) Reaction of Stock Prices to Dividend Announcements and
Market Efficiency in Pakistan, The Lahore Journal of Economics, 15 , 1 (Summer), 103-
125, retrieved (7/02/2013) from: http://ebookbrowse.com/ gdoc.php

119 J. Asian Dev. Stud, Vol. 2, Issue 2, (June 2013) ISSN 2304-375X
Al-Kuwari, D. (2009) Determinants of the Dividend Policy in Emerging Stock
Exchanges: The Case of GCC Countries, Global Economy & Finance Journal, 2(2), 38-
63.
Allen, D. E., & Rachim, V. S. (1996). Dividend Policy and Stock Price Volatility:
Australian Evidence. Applied Financial Economics , 6 (2), 175-188.
Alli, K. L., Khan, A. Q. & Ramirez, G. G. (1993). Determinants of corporate dividend
policy: a factorial analysis. The Financial Review, 28, 523-547.
Al-Malkawi, H. N. (2007) “Determinants of Corporate Dividend Policy in Jordan: An
Application of the Tobit Model” Journal of Economic and Administrative Sciences,
23(2), 44-70.
Anil, K. & Kapoor, S. (2008). Determinants of dividend payout ratios - a study of Indian
information technology sector. International Research Journal on Finance & Economics,
15, 1-9.
Asquith P. & Mullins D. W. Jr. (1983), The Impact of Initiating Dividend Payments on
Shareholders' Wealth, The Journal of Business, 56 (1), 77 – 96.
Baker, H. K., & Powell, G. E. (1999). How corporate managers view dividend policy.
Quarterly Journal of Business and Economics, 17-35.
Baker, M. & Wurgler, J. (2004). A catering theory of dividends. Journal of Finance,
59(3), 1125–1165.
Bali, R. (2003). An empirical analysis of stock returns around dividend changes. Applied
Economics, 35, 51-61.
Baskin, J. (1989). Dividend Policy and the Volatility of Common Stock. Journal of
Portfolio Management , 3 (15), 19-25.
Berenson, M. L., Levine, D. M. & Krehbiel, T. C. (2009) Basic business statistics:
Bhattacharya, S. (1979). Imperfect Information, Dividend Policy, and The Bird in the
Hand Fallacy. The Bell Journal of Economics, 10(1), 259-270.
Bishop, S. R., Crapp, H. R., Faff, R. W., & Garry J. Twite, G. J. (2000). Corporate
Finance. Sydney: Prentice Hall Inc.
Black, F. (1976). Studies in Stock Price Volatility Changes. In American Statistical
Association, Proceedings of the Business and Economic Statistics Section, 177-181.
Black, F., & Scholes, M. (1974). The Effects of Dividend Yield and Dividend Policy on
Common Stock Prices and Returns. Journal of Financial Economics, 1 (1): 1-22.
Born, J. A.; Moser, J. T. and Officer, D. T. (1988), Changes in Dividend Policy and
Subsequent Earnings: How Reliable are the ‘Signals’ We Receive from Dividends?
Journal of Portfolio Management, 14 (4): 56-62.
DeAngelo H , DeAngelo L and Skinner D (1996), “Reversal of Fortune, Dividend
Signalling and the Disappearance of Sustained Earnings Growth”, Journal of Financial
Economics, 40, 341-371.
Easterbrook, F. H. (1984). Two Agency-Cost Explanations of Dividends. American
Economic Review 74, 650-59.
Engle, K. M. (1982). Empirical evidence on dividends as a signal of firm value. Journal
of Financial and Quantitative Analysis, 17(4), 471-500
Eriotis, N. (2005) The effect of distributed earnings and size of the firm to its dividend
policy: Some Greek data, International Business and Economics Journal, 4(1): 67-74.
Fama, E. F. & French, K. R. (1988). Dividend yield and expected stock returns. The
Journal of Financial Economics, 22, 3-25.
Fama, E. F. & French, K. R. (2001). Disappearing dividends: changing firm
characteristics or lower propensity to pay? Journal of Financial Economics, 60, 3-43.

120 J. Asian Dev. Stud, Vol. 2, Issue 2, (June 2013) ISSN 2304-375X
Fama, E. F., (1965), The behavior of stock market prices, Journal of Business, 38, 34-
105.
Gill, A., Biger, N. and Tibrewala, R. (2010). Determinants of dividend payout ratios:
evidence from United States. The Open Business Journal, 3, 8-14.
Glen, J., Karmokolias, Y., Miller, R. & Shah, S. (1995). Dividend policy and behaviour in
emerging markets, IFC Discussion Paper No. 26, www.ifc.org
Gordon, M. J. (1959). Dividends, earnings and stock prices. Review of Economics and
Statistics, 41 (2), Part 1, 99-105.
Gordon, M. J. (1959). Dividends, earnings, and stock prices. The Review of Economics
and Statistics, 41(2), 99-105.
Gordon, M. J., 1963, Optimal investment and financing policy, Journal of Finance 18,
264-272.
Greene W. H. (1990) A gamma-distributed stochastic frontier model, Journal of
Econometrics, 46, North-Holland, New York University , 141-163, retrieved (7/02/2013)
from: http://pages.stern.nyu.edu
Gujarati, D. N. & Porter, D. C. (2009) Basic econometrics, Boston: McGraw-Hill.
Guo, H. (2002), Stock market returns, volatility and future output, ST. Louis: Federal
Bank of St Louis.
Hashemijoo M., Ardekani A. & Younesi N (2012). The Impact of Dividend Policy on
Share Price Volatility in the Malaysian Stock Market, Journal of Business Studies
Quarterly, 4 (1), 111-129, retrieved (22/12/2012) from: www.jbsq.org-ISSN 2152-1034
Hausman, J.A., (1978). Specification Tests in Econometrics, Econometrica. 46, 1251–
1271, Retrieved (2/11/2012) from: http://ssrn.com
Hussainey, K., Mgbame, C. O., & Chijoke-Mgbame, A. M. (2011). Dividend Policy and
Share Price Volatility: UK Evidence. Journal of Risk Finance , 12 (1),
Jensen, M.C. and Meckling W. H. (1976), Theory of the firm: Managerial behaviour,
agency costs and ownership structure, Journal of Financial Economics 3 (4), 305-360.
John, K. and J. Williams, 1985, Dividends, Dilution, and Taxes: A Signaling Equilibrium,
Journal of Finance 40, 1053-1070.
Johnston J, DiNardo J (1997) Econometric methods. New York: McGraw-Hill.
Kashif, I. (2011). Determinants of Dividend Payout Policy: A case of Pakistan
Engineering Sector. The Romanian Economic Journal. 41, 47 - 50
Keele, L. & Kelly N. J. (2006). Dynamic Models for Dynamic Theories: The ins and outs
of lagged dependent variables. Political Analysis 14, 186 – 205.
Khan, K. I., Aamir, M., Qayyum, A., Nasir, A., & Khan, M. I. (2011). Can Dividend
Decisions Affect the Stock Prices: A Case of Dividend Paying Companies of KSE.
International Research Journal of Finance and Economics (76), 67-74.
Kinder, C. (2002). Estimating Stock Volatility: mimeo.
Lease, R., John, K., Kalay, A., Loewenstein, U. & Sarig, O. (2000). Dividend Policy: It’s
impact on firm value. Boston, MA: Harvard Business School Press.
Linter, J. (1962) "Dividends. earnings, leverage, stock prices & supply of capital to
corporations, The Review of Economics and Statistics, 46, 97 – 113.
Lintner J. (1962). Dividends, earnings, leverage, stock prices and supply of capital to
corporations. Review of Economics and Statistics 44 (3), 243–69.
Lintner, J. (1956). Distribution of incomes of corporations among dividends, retained
earnings and taxes. American Economic Review 46:2, 97–113.
Maddala, G. S. (1977). Econometrics, New York. McGraw-Hill.
Mandelbrot B. B. (1963). The variation of certain speculative prices, Journal of Business,
36 (4), 392–417.

121 J. Asian Dev. Stud, Vol. 2, Issue 2, (June 2013) ISSN 2304-375X
Miller, M. H & K. Rock. (1985). Dividend policy under asymmetric information. Journal
of Finance 40:1031-1051.
Miller, M. H., & Modigliani, F. (1961). Dividend policy, growth, and the valuation of
shares. the Journal of Business, 34(4), 411-433.
Nazir, M. S., Nawaz, M. M., Anwar, W., & Ahmed, F. (2010). Determinants of stock
price volatility in karachi stock exchange: The Mediating Role of Corporate Dividend
Policy. International Research Journal of Finance and Economics (55), 100-107.
Nishat, M. & Irfan, C. M. (2004) Dividend policy and stock price volatility in Pakistan,
PIDE-19th Annual General Meeting and Conference 13-15
Okafor, C. A., Mgbame, C.O., & Chijoke-Mgbame, A. M. (2011). Dividend policy and
share price volatility in Nigeria. Journal of Research in National Development, 9 (1), 202
– 210.
Oyejide T. A. (1976). Company dividend policy in Nigeria: an empirical analysis.
Nigerian Journal of Economics & Social Studies, 18(2), 179.
Rajni, M. & Mahendra, R. (2007). Measuring Stock Market Volatility in an Emerging
Economy. International Research Journal of Finance & Economics, 8,126-133
Ramsey, J. B. (1969): Test for Specification error in Classical Linear Least Squares
Regression Analysis, Journal of the Royal Statistical Society, Series B. 31, 350-371.
Ramsey, J. B., & Schmidt, P. (1976). Some further results in the use of OLS and BLUS
residuals in specification error tests. Journal of the American Statistical Association, 71,
389-390.
Rozeff, M.S., (1982), Growth, beta and agency costs as determinants of dividend payout
ratios, Journal of Financial Research, 5 (3), 249-259.
Suleman, M., Asghar, M., Ali Shah, S., & Hamid, K. (2011). Impact of dividend policy
on stock price risk: empirical evidence from equity market of Pakistan. Far East Journal
of Psychology and Business, 4 (1) 45 – 52.
Travlos, N., Trigeorgis, L., & Vafeas, N. (2001). Shareholder wealth effects of dividend
policy changes in an emerging stock market: The case of Cyprus. Multinational Finance
Journal, 5(2), 87-112.
Uddin, M. H., & Chowdhury, G. M. (2005). Effect of dividend announcement on
shareholders’ value: Evidence from Dhaka Stock Exchange. Journal of Business
Research, 7, 61 – 72.
APPENDICES
Appendix 1: Variance Inflation Factor test for Multicollinearity Coefficient Centered
Variable Variance VIF
SIZE 4.87E-05 1.025126
PAYOUT 0.003538 1.019341
EVOL 0.031019 1.095748
DYLD 0.000351 1.008899
DEBT 0.21328 1.105274
ASGRT 0.054689 1.021578
C 0.000278 NA
Source: Researcher’s Computation (2013)

122 J. Asian Dev. Stud, Vol. 2, Issue 2, (June 2013) ISSN 2304-375X
Appendix 2: ARCH test for Heteroskedasticity
F-statistic 1.9053 Prob. F(4,15) 0.246
Obs*R-squared 1.9182 Prob. Chi-Square(4) 0.244
Source: Researcher’s Computation (2013)
Appendix 3: Breusch-Godfrey Serial Correlation LM Test
Breusch-Godfrey Serial Correlation LM Test:
F-statistic 0.5035 Prob. F(2,15) 0.00
Obs*R-squared 1.509 Prob. Chi-Square(2) 0.00
Source: Researcher’s Computation (2013)
Appendix 4: Ramsey-Reset Test for Model Specification
Ramsey RESET Test
Specification: AUDFEE C FIRMSIZE COMPLEXITY PAT
Value df Probability
t-statistic 1.642226 10 0.1316
F-statistic 2.696905 (1, 10) 0.1316
Source: Researcher’s Computation (2013)