Embed Size (px)
Citation preview

1
DIVIDEND DISTRIBUTIONS AND CLOSED-END FUND DISCOUNTS
Ted Day, George Z. Li, and Yexiao Xu◊
This version: August 2007
Abstract The unrealized capital gains hypothesis of Malkiel (1977) is one of the most important explanations for the level of closed-end fund discounts. However, empirical tests of this hypothesis have provided conflicting results. This may be due to the fact that the timing of future realizations of capital gains is uncertain, making their impact on discounts difficult to assess. This paper takes an alternative approach to examining the impact of unrealized capital gains on closed-end fund discounts. We argue that since dividend distributions by closed-end funds often include cash flows generated by the realization of previously unrealized capital gains, the magnitude of quarterly dividend distributions will tend to be associated with changes in the level of unrealized capital gains embedded in the prices of closed-end shares. Therefore, the tax liability hypothesis implies that dividend distributions will be associated with changes in closed-end fund discounts. Using an event study approach to examine the behavior of closed-end fund discounts around dividend distributions, we show that the periodic dividend distributions by closed-end funds explain a significant portion of the short-run fluctuations in discounts.
◊ Day and Xu are with the School of Management, the University of Texas at Dallas, and Li is at the School of Business, New Jersey City University. We are grateful to Rick Green, Jeff Pontiff, Harold Zhang, and seminar participants at Oklahoma University, 2008 American Finance Association Conference for helpful comments. The address of the corresponding author is: Yexiao Xu, School Of Management, The University of Texas at Dallas, PO Box 688, Richardson, Texas 75080, USA; Email: [email protected]
2
1. Introduction
Since Pratt’s (1966) finding on closed-end fund discounts, much research has been devoted
to understanding why the shares of closed-end mutual funds often trade at a discount of 10
percent or more to their net asset value (NAV). Although a variety of explanations (both
rational and irrational) for this phenomenon have been offered, the observed discounts on
closed-end funds have never been fully explained. One important explanation is related to
how closed-end funds distribute income to shareholders. The Investment Company Act of
1940 requires that closed-end funds pay out at least 90% of realized capital gains and
dividend income to shareholders on a regular basis as dividend distributions. Compliance
with this provision permits closed-end funds to pass their tax liabilities through to investors,
thereby avoiding double taxation of investment income. However, the unrealized capital
gains that a fund carries at any given time represent a potential tax liability for future
investors in the fund. Thus, the existence of unrealized capital gains implies that a fund’s
policies regarding the realization of capital gains and the timing of distributions may affect
discounts.
The overhanging tax liability for unrealized capital gains is one of the earliest and most
important explanations for the level of discounts. This hypothesis is based on the
observation that investors acquire a contingent capital gains tax liability by purchasing shares
of closed-end funds holding securities that have appreciated in value. If the fund realizes and
distributes these gains, shareholders must pay capital gains taxes. Since new investors do not
benefit from the capital gains that accrued during prior periods, the tax liabilities arising from
the realization of these gains are a deadweight loss. Consequently, investors should price
closed-end funds with overhanging tax liabilities at a discount to NAV.

3
Empirical evidence regarding the unrealized capital gains hypothesis is mixed. Malkiel
(1977) and Fredman and Scott (1991) find that unrealized capital gains are positively
correlated with the discounts for closed-end funds. However, studies such as Pratt (1966),
Lee, Shleifer and Thaler (1991), and Pontiff (1995) find no evidence that unrealized capital
gains have any impact on the discounts for closed-end funds. Moreover, the unrealized
capital gains hypothesis is irrelevant for funds traded in some non-US financial markets. For
example, closed-end funds in Great Britain are not permitted to distribute capital gains to
their shareholders. Consequently, unrealized capital gains should have fewer tax
consequences for investors who purchases shares in British closed-end funds. Similarly,
Chen, Oliver and Xu (2004) note the Chinese government does not impose a tax on capital
gains. Despite these differences in tax policy, the discounts on closed-end funds in non-US
financial markets are remarkably similar to their American counterparts. Of course, other
non-tax related factors could have played a more significant role in causing the discounts.
The inconclusive nature of the empirical findings regarding the impact of unrealized
capital gains may be due to the capital-gains lock-in effect proposed by Klein (2001). Klein
argues that investors who hold stocks that have appreciated in value will be reluctant to sell
their shares, preferring to avoid the realization of taxable capital gains. This reluctance
creates a scarcity in the supply of such stocks, forcing investors who wish to purchase these
stocks to pay a premium, other things being equal. When this argument is extended to
closed-end funds, it is unclear whether the lock-in effect or the overhang of unrealized
capital gains has the dominant impact in equilibrium. Thus, the impact of unrealized capital
gains on the magnitude of discounts of closed-end funds remains an open question.

4
This paper develops an alternative approach to test the tax liabilities hypothesis by
focusing on changes in closed-end fund’s future tax liabilities and the associated impact on
the dynamics of closed-end fund discounts. Although the literature on closed-end fund
discounts has focused on the level of the discount, understanding why closed-end fund
discounts fluctuate over time is of equal importance. Our analysis is based on the premise
that the magnitude of quarterly dividend distributions is correlated with changes in the level
of unrealized capital gains embedded in the prices of closed-end fund shares. Since the
potential future tax liabilities of closed-end funds depend on the level of unrealized capital
gains, dividend distributions will tend to be associated with changes in closed-end discounts
if the tax liability hypothesis has empirical validity.1 We implement this approach using an
event study approach that examines the discount patterns around the periodic dividend
distribution events by closed-end funds. By converting dividend distributions by closed-end
funds to a common time scale, we are able to link a significant portion of the short-run
fluctuations in closed-end discounts to periodic dividend distributions. In particular, our
empirical results suggest that 70% of the variation in discounts can be explained by the
changes in closed-end fund’s overhanging tax liability associated with dividend distributions.
The paper is organized as follows. In the next section, we apply both the Malkiel and
Klein models to closed-end dividend distributions in order to provide a framework for
discussing short-term fluctuations in closed-end fund discounts. We also discuss the
possibility that the dynamics of closed-end fund discounts are related to the investment
opportunities forgone while closed-end funds hold the dividends that accumulate between 1 From a tax-saving perspective, the embedded losses should have an opposite effect on closed-end fund discounts. However, not like capital gains which are required to be distributed to investors, capital losses can either be used to offset capital gains of a fund, or carried over by the fund if not used up. Therefore, we focus on the net effect when a fund distributes income.

5
distributions. Section 3 discusses the sources of the data that we use and identifies three
testable implications of our model. The empirical results based on our event study analysis
of the relation between dividend distributions and closed-end fund discounts are presented in
section 4. Section 5 concludes the paper.

6
2. Understanding Short-term Discount Dynamics
Malkiel’s (1977) model of closed-end discounts focuses on the demand by investors to
purchase shares of closed-end funds, providing an approximation for the impact of the
expected future present value of the tax payments due to unrealized capital gains and losses
on the discount to NAV at which a closed-end fund should trade.2 On the supply side,
Klein’s (2001) argument implies that the shareholders of closed-end funds whose prices have
appreciated due to the unrealized capital gains on the underlying portfolio will require a
premium to sell their shares due to the tax liability created by the realization of a taxable
gain, thereby reducing the total discount to NAV for closed-end funds that have appreciated
in value. The common feature of these two models is the contingent tax liability associated
with future realizations of unrealized capital gains. However, the timing of these future
realizations is uncertain, making an assessment of their precise impact on closed-end
discounts difficult. This timing uncertainty may explain the conflicting nature of the
empirical results found in the literature.
The impact of uncertainty about the timing of future capital gains realizations on the
empirical analysis of closed-end discounts may be substantially reduced by focusing on the
relation between dividend distributions and changes in discounts. Since the Investment
Company Act mandates that closed-end funds distribute 90% of their income, closed-end
funds must make regular distributions of both dividends and realized capital gains if they
decide to realize gains. For this reason, the magnitude of cash distributions by closed-end
funds will be strongly correlated with short-run changes in the level of unrealized capital 2 Embedded losses are valuable to future fund investors because of tax benefits. However, closed-end funds report their unrealized capital gains net of capital losses. In addition, if a fund cannot distribute realized losses, realizing or not realizing capital losses have not direct impact to investors. Therefore, as we focus on changes in unrealized capital gains, we will not separately investigate the impact of gains versus losses.

7
gains. Therefore, the analysis of the relation between changes in closed-end fund discounts
and the distribution of dividends may provide new evidence on the validity of the tax liability
hypothesis. By contrast, trying to tie the level of discounts to total unrealized capital gains is
problematic. Capital gains accumulating during future holding periods may be realized prior
to today’s unrealized capital gains when current buyers happen to be the future sellers. In
this case the current buyers should have no tax disadvantages. By focusing on the time series
of cash distributions and the dynamics of the discount during the event window surrounding
the distribution of closed-end fund dividends, we circumvent the need to address the
simultaneous impact of current and anticipated future tax liabilities on demand and supply.
The data that we use to implement this approach includes a subset of the data used by
Chay, Choi and Pontiff (2006) to examine the value of tax-timing options that are dissipated
when capital gains are distributed directly to shareholders. However, whereas Chay et. al.
infer the value of tax timing options by examining the ex-dividend day behavior of share
prices, we focus on the dynamics of closed-end discounts as the overhanging unrealized
capital gains are reduced by distributing the accumulated capital gains to shareholders.
2.1. Another look at the Malkiel model
Although we focus on changes in discounts, the unrealized capital gain model of Malkiel
(1977) helps us to understand the general direction of the tax effects. Based on the
assumption that buyers determine the prices of closed-end fund shares, he developed a model
focuses on the tax disadvantage to a buyer who purchases shares with unrealized capital
gains. In particular, he assumed a constant net asset value V,3 with the tax basis of the fund’s
3 The potential growth opportunities of a fund are irrelevant since future growth will affect only the capital gains that may be realized after the purchase of the shares.

8
portfolio being B, the capital-gains tax rate of τ, and the discount rate of r. If the fund
realizes the overhanging capital gains of (V–B) evenly over the next nd periods, the present
value of the associated tax liability is ∑= +
−=
dn
ii
d
rnBVTL
1 1 )(/)(τ . Given that the fund price is P,
there will be a capital loss of (V–B) [=P– (P– (V–B))] when the shares of the fund are sold in
ns (>nd) periods. At this time the investor will receive a tax deduction that has a current
present vale of snr
BVTC)(
)(+−
=1τ . The price an investor is willing to pay should reflect the present
value of the anticipated tax liability, so that the current price should be, P = V – (TL – T C).
Therefore, the percentage discount (V – P) / V that will be required for the buyer to be
willing to purchase the close-end fund shares is
( )( ) ( )
1 if 01
11
111≠<>
⎥⎥⎦
⎤
⎢⎢⎣
⎡
+−⎟⎟⎠
⎞⎜⎜⎝
⎛
+−−=
−= sdnn
d
nnrrrn
BVV
PVsd
,τδ . (1)
In other words, an investor who decides to purchase shares of a closed-end fund will insist on
a discount to the underlying net asset value.4 Equation (1) suggests that the magnitude of
this discount will depend on both the amount of built-in unrealized capital gains (V–B) and
the policies of the fund regarding the realization and distribution of these gains during future
periods, as well as a marginal investor’s expected holding period.
The Malkiel model does not explicitly account for the fact that the prices of closed-
end shares are jointly determined by the supply and demand for shares. The impact of
unrealized capital gains on potential sellers (the current fund shareholders) must be
considered as well. For simplicity, assume that the current shareholders of the fund enjoy the
4 The price differential does not constitute an arbitrage opportunity except for investors who do not pay any taxes.

9
capital gain of (V-B). Any sale of these appreciated shares will cause existing shareholders
to immediately incur a personal tax liability for the realization of a capital gain of (V–B). It
is easy to show that the taxes from such an immediate sale of closed-end shares would
exceed the expected present value of the taxes that would be paid if either the shares were
sold at a later date, or if the fund were to realize and distribute the overhanging capital gains
before shares are sold.5 Consequently, Klein (2001) argues that the shareholders in the fund
will prefer to avoid an immediate realization of a taxable gain unless they are paid a premium
price for their shares. That is, a fund’s existing shareholders are in a sense ‘locked-in’ to
holding the fund’s shares by their aversion to the realization of a taxable gain.
The overhanging tax liability will shift the demand curve for a closed-end fund
downwards, while the ‘lock-in’ effect will push the corresponding supply curve to the left.
The net effect on the price of the fund and therefore the fund’s discount depends on the
relative magnitudes of these shifts. The prevalent view in the literature is that the effect of
the overhanging tax liability is stronger than the ‘lock-in’ effect, given that the stocks held by
close-end funds are also subject to the ‘lock-in’ effect. However, the relative strength of
these two competing effects is ultimately an empirical question. In order to avoid the
ambiguity, we focus on discount changes due to changes in the unrealized capital gains lead
by dividend events instead of on discount levels.
2.2. Closed-end discount dynamics and changes in overhanging tax liabilities
The Malkiel and Klein models share the intuitive logic that the level of the discount for a
closed-end fund is related to the level of unrealized capital gains. Since in general we are
unable to observe either the accumulation of unrealized capital gains or the timing with
5 In this case, the present value of the tax liability (TL) is identical to that for new buyers.

10
which closed-end funds realize and distribute these gains, obtaining precise estimates of the
relation between the closed-end discounts and the level of unrealized capital gains is a
challenge. Moreover, the net impact from these two competing effects is difficult to predict
a priori. At the same time, a comparative static analysis of equation (1) suggests that
changes in a fund’s unrealized capital gains will be accompanied by a change in the discount
at which the fund trades. Given that closed-end funds regularly distribute dividends from
realized capital gains for various reasons and/or dividends from the underlying assets, the
total amount of unrealized capital gains will change over time as the fund distributes these
cash flows to shareholders.
There are at least three factors that might affect discounts on the ex-dividend day.
First, other things being equal, there should be a tendency for changes in unrealized capital
gains to be associated with the accumulation and distribution of closed-end dividends.
Therefore, when equation (1) holds, there is a tax overhang effect in that a dividend
distribution reduces the unrealized gains, which translates into a drop in the discount.
Second, the discount could widen mechanically. On the ex-dividend day for a closed-end
fund, the net asset value of the fund (V) will mechanically drop by the dividend amount D.
Other things being equal, if the fund’s price falls by the full amount of the dividend, the
discount on the fund should rise mechanically since V
PVDV
DPDV −>
−−−− )()( . Finally, in
the presence of Klein’s tax ‘lock-in’ effect, the fund price will not drop by the full dividend
amount of D on the ex-dividend day,6 which attenuates the potential increase in discounts,
6 Of course, if the realized gains do not belong to the majority current shareholders of the fund, the ‘lock-in’ effect will be weaker. Also, for an existing investor even with embedded losses, she will be indifferent to sell shares before or after dividend distribution if dividend taxes and capital gains taxes are similar or there is tax ‘lock-in’ effect.

11
making the mechanical effect less significant. In this case, both the tax ‘lock-in’ effect and
the tax overhang effect work in the same direction on the ex-dividend day changes in
discounts.
The preceding discussion implies that closed-end fund discounts should decline on
the ex-dividend day whenever the tax overhang and ‘lock-in’ effects dominate the
mechanical effect of the reduction in the fund’s NAV caused by the dividend distribution. In
other words, the condition,
1 ,)()(])([)(DV
DLPVDV
DDLPDVV
PVpostpre −
+−−=
−+−−−−
=>−
=κκδδ
holds if and only if,
,κδ +< Lpre
where δpre, δpost, L, and κ are the pre- and post-dividend discount rate, the percentage ‘lock-
in’ effect, and the percentage tax overhang effect, respectively. If there are no tax effects (L
= κ = 0), the above condition fails which implies that discounts should actually increase on
the ex-dividend day. In practice, however, this condition is easily satisfied given the average
closed-end discount of 10% and the sizable ‘lock-in’ effect noted in Klein (2001). These
considerations motivate the following hypothesis:
Hypothesis 1: Closed-end discounts fall on the ex-dividend date to the lowest level
of the quarter.
Discounts might also change during the dividend accumulation period. Consider a
simple case where a fund with a quarterly required return of r pays a dividend of D each
quarter. If we ignore the impact of taxes for the moment, the simple Gordon model suggests
that the price of the fund will be constant at,
12
rDV = . (2)
Equation (2) gives the ex-dividend price of the fund at the end of each quarter following the
payment of the quarterly dividend of D. During each quarter, the price of the fund should
increase steadily at a rate of r as the payment of the end of quarter dividend draws nearer. In
other words, the fund price should rise to (V+D) at the end of each quarter just prior to the
payment of the quarterly dividend.
Due to continuously compounding returns, the Gordon model in equation (2) implies
that there should be a gradual accumulation of unpaid dividends during the period prior to
the ex-dividend day. For investors considering the purchase of the shares prior to the ex-
dividend day, these unpaid dividends represent unrealized gains in the same sense as
unrealized capital gains. The overhanging tax liability associated with this accumulation of
unpaid dividends will contribute to a gradual increase in the discount as the ex-dividend date
approaches. Thus, closed-end discounts should increase from the beginning to the end of a
quarter.
To be consistent we should consider whether Klein’s tax ‘lock-in’ effect might have
any systematic impact on closed-end fund discounts during the period leading up to the ex-
dividend date. Due to their institutional characteristics, closed-end funds collect and hold
dividend distributions from the assets held in their portfolios. In the presence of a ‘lock-in’
effect, the fund’s NAV, which equals to the market prices of the underlying assets plus the
undistributed dividends, should be even higher than would otherwise be the case7 when an
7 The price of closed-end shares should have also been altered by the ‘lock-in’ effect if investors had perfect information about the portfolio composition of the fund at every moment. Unfortunately, this information is only available once every quarter.

13
underlying asset of a fund goes ex-dividend. Thus, discounts should tend to rise from the
beginning of the quarter through to the end even in the presence of a ‘lock-in’ effect8. This
proposition regarding the time series behavior of discounts can be stated as the following
hypothesis:
Hypothesis 2: Closed-end discounts increase from ex-dividend date until just prior to
the ex-dividend date for the next distribution.
Our analysis and equation (1) also suggest that the discount level depends on the level
of unrealized capital gains. In other words, changes in discounts should be proportional to
changes in unrealized gains—which essentially equal to the amount of the dividend given the
overhanging tax liability triggered by the distribution. One caveat is that not all the gains
distributed by a fund are taxable. For example, a fund that follows a strict dividend
distribution policy might on occasion liquidate assets in order to pay a dividend. Fortunately,
over 97% of the dividend events in our sample are taxable.9 Therefore, we will ignore this
problem in our empirical analysis. A more significant issue with respect to tax liabilities is
the taxation of dividends paid by international funds, which will be treated more carefully in
the next section.
The magnitude of changes in discounts might also be related to fund returns through
the potential loss of the investment opportunities. In practice, the stocks held by mutual
funds distribute their dividends prior to distributions by the fund, so that when one of the
stocks in the fund’s portfolio distributes a dividend, the fund’s holdings of cash increase.
This interim accumulation of cash by the fund forces investors to forgo the investment
8 A similar argument has been used made by Pontiff (1995) to explain the predictability of discounts. 9 Our sample includes 2364 distribution events, of which 2300 represent taxable distributions, including 1692 ordinary dividend distributions and 608 capital gains distributions.

14
opportunities they would be afforded if they held the same investment in individual stocks
directly in their personal accounts. For this reason, rational investors will demand a discount
to compensate for the loss of liquidity and potential investment opportunities. For simplicity,
assume there are N stocks that make dividend distributions at one of N evenly spaced points
within each quarter. If each stock distributes a dividend of d(=D/N), at point n, the total
forgone gain at the end of each quarter is,
[ ] [ ] rDNDNNr
NrNrdFO N
N
n
nNN 2
1)/1(/11)/1(
1
≈⎥⎦⎤
⎢⎣⎡ −−+=−+=∑
=
− . (3)
Note that in the expression above we assume that the investors’ opportunity cost is equal to
the fund’s expected return, which can be estimated by, for example, the CAPM model.
Equation (3) implies that the magnitude of changes in discounts should also be related to
fund expected returns. These considerations suggest the following hypothesis:
Hypothesis 3: The ex-dividend day decline in closed-end discounts is positively
correlated with both closed-end funds’ expected returns and the size of the dividend
distribution.
Hypothesis 3 provides a novel approach to examining the determinants of the changes in
discounts for individual funds. In particular, these predictions differ from Pontiff (1996),
who argues that closed-end fund discounts are a manifestation of mispricing based on his
finding that the negative correlation between discounts and future returns cannot be fully
explained by a variety of proxies for closed-end funds’ liquidity and risk. To the extent that
closed-end discounts are due to mispricing, the absolute value of discounts should be
positively related to the costs of arbitrage, including any holding costs. Pontiff (2006) notes
that holding costs are negatively related to the dividends on a security, which implies that

15
there should be a negative relation between the absolute level of discounts and the size of the
dividend distribution at any given time, in contrast to the predictions of Hypothesis 3.
We use the event study approach to study the first two hypotheses on the aggregate
level. In contrast, given that Hypothesis 3 focuses on the correlation between dividend
distributions (or past returns) and the magnitude of closed-end discounts, we examine this
hypothesis at the individual fund level. Note that both equations (1) and (3) suggest that
changes in closed-end discounts from the beginning of a quarter to the end are related to both
the amount of the dividends paid and the returns to the closed-end fund.
In this study, we emphasize the impact of the timing of the tax liability related to
dividend distributions rather than the level of unrealized capital gains that has been the focus
of much of the previous research on closed-end discounts. The rationale for our approach is
the fact that there can be no tax liability until the capital gains are realized. In reality,
investors are not necessarily averse to funds with large unrealized capital gains. If a fund
never distributes these unrealized capital gains, the fund’s investors will never be subject to
taxes on any of the gains that accrued prior to the purchase of their shares in the fund.
Moreover, a fund’s operation is continuous. In addition to unrealized capital gains that may
have accumulated during past periods, shareholders expect capital gains to accumulate
during future periods as well. By focusing on the dynamics of closed-end discounts, we have
no need to determine whether the realization of gains in any given period represents a
realization of capital gains from prior periods or a realization of capital gains from the
current period. For this reason, it is more fruitful to study the impact of dividend distribution
on closed-end fund discounts rather than unrealized capital gains.

16
As is the case for mature corporations, closed-end funds usually prefer a smooth
dividend distribution policy, adjusting their payout ratios based on the expectation of future
dividends relative to the magnitude of prior dividend distributions. If discounts vary with
dividend accumulation and distribution, then closed-end discounts should be persistent. This
implication is consistent with the existing literature that finds discounts to be mean-reverting.
In the following section we describe the data and methodology that we use to test the
implications of our arguments regarding the dynamics of closed-end fund discounts.

17
3. Data and Testing Methodology
The analysis presented in the previous section suggests that the timing of the dividend
distributions from closed-end funds can be used to study the dynamics of closed-end funds’
discounts. This follows from the fact that the realization of formerly unrealized capital gains
is tied to dividend distributions by the requirement that mutual funds distribute 90 percent of
all income to shareholders. Further, irrespective of the existence of unrealized capital gains,
our analysis implies that the delay in distributing dividends from the stocks held in closed-
end portfolios will have a non-negligible effect on closed-end discounts. Thus, we propose
to examine the relation between the time series of weekly fluctuations in the discounts for
closed-end funds and the accumulation and distribution of dividends from the underlying
closed-end fund portfolios.
The “dynamics” of discounts we focus on are somewhat unconventional. Rather than
focusing on lead-lag relationships and the persistence of the discounts, we try to understand
why discounts fluctuate in the first place. From a theoretical perspective, the two driving
forces identified in the previous section are the potential tax liability for the realization of
capital gains and forgone investment opportunities. We should observe both of these effects
around the dividend distribution events. Our first hypothesis is intended to test whether
dividend distributions have a significant impact on closed-end fund discounts. In order to
understand the discount fluctuations observed in weekly data, we have argued that dividend
accumulation and distribution should co-move with discounts over time, which is our second
hypothesis. These two hypotheses can be investigated in detail using the event study
approach. Our third hypothesis focuses on the discount fluctuations on individual fund
level. The remainder of this section describes the research design for testing our hypotheses.

18
3.1. Methodology
Our first two hypotheses predict that discounts will change as a result of dividend
distribution events. In aggregate, the changing pattern of the discounts during the period
surrounding dividend distributions can be analyzed using an event study methodology. To
implement this approach, we identify each dividend distribution date for all funds in our
sample. As is standard in the event study literature, we denote each ex-dividend week as t =
0, with the weeks immediately prior and subsequent to the ex-dividend week denoted
respectively as t = -1 and t = 1, and so on. This conversion of the time series of weekly fund
discounts to an event time defined relative to the ex-dividend date for distributions permits us
to examine the dynamic of discounts over an event window running from t = -26 to t = 26.10
If discounts are largely determined by the embedded capital gains liability, dividend
distribution events should have greater impact to funds with large discounts, other things
being equal. In other words, the magnitude of discounts can serve as a proxy for the size of
unrealized capital gains. Quantitatively, we can examine the statistical significance of the
relation between changes in closed-end discounts around distribution events relative to their
pre-event level of discounts by running the regression:
iiidrop εβδαδ ++= − ,2, , (4)
where δi = discount level of the i-th fund at dividend distribution week,
δ-2,i = discount level of the i-th fund two weeks before dividend distribution,
δ2,i = discount level of the i-th fund two weeks after dividend distribution,
10 It will not affect the event study results whether a fund makes quarterly or semi-annual distributions. However, the discount pattern at t = -13 or t = 13 will not repeat that of at t = 0 since not all the funds have quarterly distribution events.
19
δdrop = δ-2,i – δi or δdrop = δ-2,i – δ2,i .
In this case, the coefficient β in equation (4) should be positive from above discussion.
The regression specification above relates changes in closed-end discounts during the
two-week period prior to the ex-dividend date to the level of the discount. Note that since
the NAVs used to estimate closed-end fund discounts are reported at weekly intervals, it is
possible that in some cases the NAVs reported at t = -1 may already reflect an adjustment for
the dividend to be paid to the shareholders of record on the ex-dividend date. To capture the
impact of any such adjustments, we use the decline in the discount from t= -2 to date t = 0 as
the dependent variable in the regression specification above.
The event study approach permits us to identify the general response pattern with
which discounts adjust to changes in the unrealized capital gains that we conjecture to be
associated with dividend distributions. Equally important is the determination of whether
differences in the amount of dividend distributions affect the magnitude of discount changes,
which is the Hypothesis 3. This provides one additional step in further understanding the
importance of the potential future tax liabilities related to unrealized capital gains. To test
our hypothesis, we can study the relation of drops in discounts to dividend yields and fund
returns through the following regressions:
ii
iDPidrop P
D εβαδ ++=− ,2
, , and (5)
iiPRidrop R εβαδ ++= ,, , (6)
iiPRi
iDPidrop R
PD εββαδ +++=−
,,2
, , and (7)
where RP,i = the i-th fund’s quarterly return before dividend distribution,

20
P-2,i = price level of the i-th fund at two weeks before dividend distribution.
Given the regression specification above, we run cross-sectional regressions for each quarter.
The time series of estimates for the beta coefficients in these regressions is then used to
provide an additional test of our hypotheses.
3.2. Description of data
There are two general classes of closed-end funds: Equity Funds and Bond Funds. Like
most research on closed-end funds we examine only equity funds. More specifically, we
study funds that invest predominantly in common stocks. The underlying assets of those
funds are well diversified. Thus, problems associated with the estimation of non-market risk
are reduced.
Equity funds can be further classified into Domestic Equity Funds, which invest
primarily in the U.S. equity market, and World Equity Funds, which focus on foreign equity
markets. Depending on the investment objectives, the universe of U.S. equity funds
includes:
(a) General Equity funds investing predominantly in US diversified stocks;
(b) Specialized Equity funds invest in specific industry sectors of the US market such as
petroleum and real estate;
(c) Income and Preferred Stock funds investing in high yield common and preferred
stocks;
(d) Convertible Securities funds that invest in convertible securities.
The use of these objective classifications as the basis for the selection of the sample of
equity mutual funds used to test our hypothesis presents several problems. For example,

21
funds included in categories such as Income and Preferred Stock, and Convertible Securities
may sometimes invest in common stocks, even though their stated objectives are very similar
to those for bond funds. Further, funds categorized as the General Equity Funds may at
times invest a majority of their assets in fixed income securities. For these reasons, our
primary sample selection criterion is that the fund invests predominantly in common stocks.
In particular, we adopt the following sample selection criteria:
(1) Invest more than seventy percent of assets in common stocks;11
(2) Have a performance history longer than six months during the 1993-2002 period;
(3) Have a ticker or CRSP permanent identification number (PERMNO);
(4) Make either quarterly or semi-annual dividend distributions.12
Based on these criteria, we were able to create a sample of 124 closed-end funds including
78 World Equity funds and 46 U.S. equity funds.
Morningstar provides weekly NAV and market price data.13 To assure the integrity
of our data, we compare the NAV reported by Morningstar with NAV data collected from
the WSJ. Further, we compare the market prices reported by Morningstar with the price data
included in the CRSP mutual fund database. These checks on the data enable us to correct
for occasional errors and to adjust the fund NAV’s for stock splits and distributions. These
data are used to calculate the returns based on NAV, returns based on fund prices and the
respective fund discounts.
11 Most of these funds are under the categories of General Equity Funds and World Equity in the WSJ report. However, some specialized funds, such as preferred funds and convertible funds that invest predominantly in US equity, are also added into our sample. 12 Funds with monthly dividend distributions that have characteristics of bond funds are deleted. 13 We are grateful to Morningstar for making the data available to us.

22
Closed-end funds usually begin trading at a premium before subsequently trading at a
discount to NAV as the fund becomes more seasoned. When funds are terminated through
either liquidation or open-ending, their share prices rise and any discount is eliminated.
Therefore, to avoid any bias in our analysis of discounts, we exclude both the six months of
data following the inception of the fund and the last six months of data prior to the fund’s
termination.

23
4. Empirical Results
In this section we first describe the characteristics of our sample to show that our data is
comparable to that used in other studies. We then discuss our empirical results, which are
based on the changes in closed-end discounts during the event window surrounding dividend
distributions. Finally, we discuss the implications of the results of a variety of cross-
sectional regressions of closed-end discounts and test the robustness of our results.
4.1. The characteristics of the closed-end fund sample
Our sample consists of 124 domestic and international equity funds for the ten-year sample
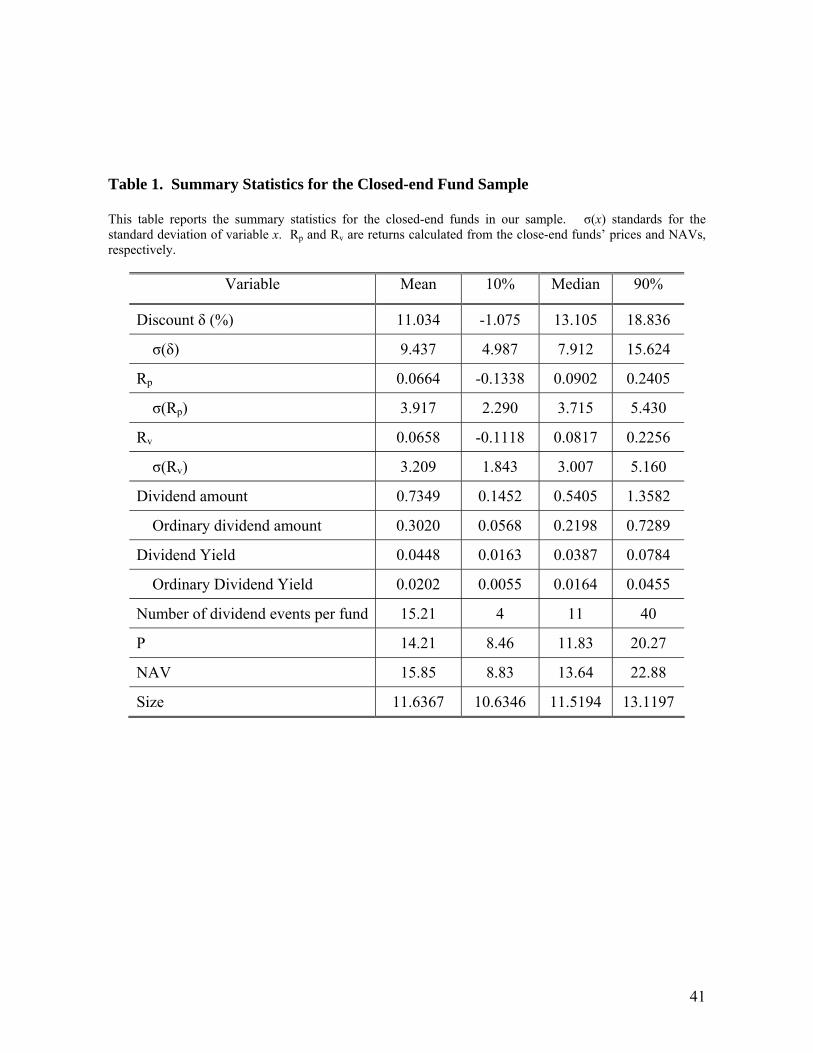
period from 1993 to 2002. The summary statistics presented in Table 1 show that the
average discount for the closed-end funds included in our sample was 11.0%, which is
slightly greater than the historical average of 10%. The median for the average discount on
the funds in our sample is 13.1%, indicating that most of these funds traded at discounts
rather than premiums. Note that discounts fluctuated considerably during the sample period,
as evidenced by the fact that the average standard deviation of the discount on the funds in
our sample is 9.4%, with a median discount of 7.9% indicating that the distribution of
discount volatility for our fund sample is skewed to the left.
Insert Table 1 approximately here
The average weekly returns for the funds in our sample are similar in magnitude to
the average returns computed using changes in the NAV for the underlying assets, with an
average weekly return of roughly 0.066%. The similarity between NAV-based returns and
the returns based on closing prices suggests persistence in closed-end fund discounts, which
in turn implies that the standard deviations for the discounts of individual closed-end funds

24
should be proportional to the standard deviation of the innovations in the discount that are
the focus of our analysis. Further, as should be expected given the volatility of the discounts
for our sample of funds, the weekly fund returns based on closing prices, with an average
standard deviation of 3.9%, are more volatile than the returns computed from the NAVs for
the respective funds, which have an average weekly standard deviation of 3.2%. Pontiff
(1997) has referred to this empirical finding as the “excess volatility” in the closed-end fund
market. Note that since the median fund return exceeds the mean fund return, the returns for
the funds in our sample are negatively skewed.
The average number of dividend distribution events for our fund sample is 15,
ranging from 4 to 40. The average dividend yield is 4.48%, with an average yearly cash
distribution is $0.74, including $0.43 of special dividends. The average fund has an NAV of
$14.21 per share and an average size of $12 million. These sample characteristics are similar
to those for the samples used by most of the frequently cited studies of closed-end funds.
4.2. Understanding the pattern changes in closed-end fund discounts
Hypothesis 1 states that the ex-dividend date should coincide with a decline in closed-end
fund discounts to their lowest level during the quarter, while Hypothesis 2 states that closed-
end fund discounts will increase from the ex-dividend date until just prior to the ex-dividend
date for the next distribution. To test these two hypotheses, we compute an aggregate
discount for the 124 funds in our sample during the event window surrounding their
respective dividend distribution events. The event-time behavior for the weekly mean,
median and the cross-sectional standard deviation for the percentage discounts of the funds
in our sample are plotted in Figure 1.
25
A careful examination of Figure 1 supports Hypothesis 1. As predicted, the
aggregate discount shown in Panel A of Figure 1 declines during the event window
surrounding dividend distributions, with the cross-sectional average discount reaching its
maximum of 10.1% roughly two weeks before the ex-dividend week. Panel A of Table 2
reports that the average discount then falls to 9.3% during the ex-dividend week, and
continues to drop for two weeks following the ex-dividend week to a low of 8.6%. The 15%
decline in the aggregate discount for our sample supports Hypothesis 1. Such a change is
statistically significant as shown later in this section. Note also that the decline in the
aggregate discount is net of mechanical effect. In fact, the mechanical effect should cause
the aggregate discount to rise by 4.5% on ex-dividend day using the summery statistics in
Table 1. The event window behavior of the median discount for our sample depicted in Panel
B of Figure 1 exhibits a similar pattern, suggesting that the event window decline in the
discount cannot be attributed to the variation in the discounts for a small subset of our
sample.
Note that since the NAVs used in estimating closed-end fund discounts are reported
at weekly intervals, it is possible that the event week NAVs reported by some of the funds in
our sample were adjusted to reflect dividend payments occurring prior to the ex-dividend
day. For this reason, our sample may exhibit an artificial tendency for the average discount
to begin declining during the week prior to the ex-dividend week. However, the continuation
of the decline in the discount during the two-week period following the event week suggests
a delayed reaction in the prices of closed-end funds. Note that the observed variation in
discounts cannot be mechanically attributed to gradual changes in fund NAVs. If changes in
fund NAVs were responsible for the observed pattern, the average discount would show a

26
steady but gradual decline instead of the rather precipitous pattern observed in Panel A of
Figure 1.
Insert Figure 1 approximately here
The event window behavior of discounts is also consistent with Hypothesis 2 in that
the average discount gradually increases following the event date, exactly as predicted. This
supports our argument that following a dividend distribution each fund begins to accumulate
dividends again because of continuously compounded returns. Since one can consider these
unpaid dividends as the unrealized capital gains, the average closed-end discount begins to
increase again.
The final panel displayed in Figure 1 (Panel C) shows that the cross-sectional
dispersion of discounts increases during the distribution week as the average discount
declines. From tax perspective, this phenomenon is consistent with the risk sharing story of
Dai, Shackelford, and Zhang (2007). One can consider that having tax liability is just like
sharing part of the income risk with the government. After dividend distribution, risk sharing
reduces which increases the relative risk of individual investors. Such a finding could also
be purely mechanical if closed-end discounts reflected a constant dollar difference between
fund prices and NAVs, as would be the case if discounts were determined by the present
value of a fund’s future management fees. However, if the dollar value of discounts
remained constants, then closed-end discounts would increase as fund prices and NAV’s
declined during the distribution week. Thus, our finding that the average closed-end
discount declines during the distribution period suggests that the increased dispersion of
closed-end discounts is related to some fundamental economic force. For example, an
increase in the dispersion of discounts might be consistent with the fact that U.S. investors

27
believe that closed-end funds holding foreign stocks are subject to greater uncertainty.
Therefore, dividend distributions might convey information that is reflected in the relatively
greater variation in the discounts for these funds. That is, the cross-sectional variation in
discounts might be driven by the non-U.S. equity funds in our sample. We address this issue
by examining discounts for non-U.S. and domestic closed-end funds separately. Our results,
which are not reported here, show increased volatility for the discounts for non-U.S. funds
but not for U.S. funds.
The quarterly frequency of distributions by companies that pay dividends raises a
question regarding whether the average closed-end discount should be expected to revert to
the same level every 13 weeks, in contrast to the pattern displayed in Panel A of Figure 1
showing that the average discount falls to a low point every 52 weeks. The magnitude and
significance of the week 0 decline in the discount relative to the decline that we find at either
t =-13 or t = +13 is due to the distribution policies followed by mutual funds. In particular,
most of the funds in our sample make only semi-annual or in some cases annual
distributions. Since these less frequent distributions that include a large capital-gain-related
component are less likely to be preceded or followed by a distribution including a capital-
gain-related component of a similar magnitude, the decline in the discount at both t = -13
and t = +13 is guaranteed to be less pronounced than the decline observed at date 0.
We examine the relative impact of clustering capital gains distributions and the
infrequent dividend effect by plotting the event-time behavior of the average discounts for
the subset of funds that pay quarterly dividends. The results are plotted in Figure 2 for three
subsets of closed-end funds in our sample: the 15 funds making quarterly dividend
distributions, the 12 US funds that make quarterly dividend distributions, and all 46 U.S.

28
closed-end funds. The event-time pattern of fluctuations in the average discount for the 15-
fund and 12-fund sub-samples depicted in Panels A and C of Figure 2 are similar to those for
the overall sample shown in Figure 1. The percentage declines in the average discount
during four-week period surrounding the event week are respectively 10.3% and 12.7% for
the 15-fund and 12-fund sub-samples. These results are respectively reported in Panel B and
Panel D of Table 2. Note that the average discount of 3.82% for U.S. closed-end funds
making quarterly cash distributions is less than half the average discount of 7.80% for 46
U.S. closed-end funds in our sample reported in Panel C of Table 2. This result may be
attributable to a tendency for funds making more frequent distributions to either realize
capital gains on a more regular basis, or to cater to a shareholder clientele willing to pay a
relative premium for more frequent distributions. Alternatively, frequent income
distributions might be associated with a lesser degree of information asymmetry if the
distribution event conveys information. Since this is not the focus of the paper, we will not
explore further.
Insert Figure 2 approximately here
Compared to the overall sample, the subset of closed-end funds making quarterly
distributions exhibit a more pronounced decline in their average discount at weeks t = -13
and t = +13. However, while there appears to be a 13-week periodicity to fluctuations in the
average discount for funds making quarterly distributions, the low point for the average
discount just subsequent to the event week at t =0 appears to be significantly less than the
corresponding low point for the average discount relative to weeks t = -13 and t = 13.
Further, although the decline in the average discount at dates t = -13 and t = +13 appear to
be more pronounced than the corresponding declines in the average discount for the

29
complete sample, the low point to the periodic cycle for the average discount continues to
occur two weeks following the distribution week at t = 2. This finding is most likely due to
the concentration of capital gain distributions at the event week resulting from the conversion
of each distribution date to event time as was noted previously.14
The tax liability explanation that we propose to explain the short-run variation in the
discounts for closed-end funds has greater relevance for funds that trade in the U.S. market.
Further, since most previous research on closed-end fund discounts has focused on domestic
funds, we perform a separate analysis of the discount pattern for the U.S. equity funds. The
event-time behavior of the average discount for U.S. equity funds is plotted in Panel B of
Figure 2. The pattern surrounding the ex-dividend week is very similar to that shown in
Panel A of Figure 1 for the full sample. However, although the percentage decline in the
average discount for U.S. funds is only 10.8%, compared to a percentage decline in the
discount of 14.9% for the overall sample, the decline in the average discount for U.S. funds
during the two weeks following the distribution week appears to be much smaller than that
for the overall sample. That is, any delay in the reaction to closed-end distributions appears
to be confined primarily to the foreign close-end funds in our example. In addition, we see a
much clearer up and down pattern for the preceding and subsequent thirteen-week quarters.
This result represents a strong piece of evidence in support of our second hypothesis.
We have argued that an important component to the distribution-week decline in the
average closed-end discount is the impact of the distribution of previously unrealized capital
gains. To support this conjecture we perform several additional experiments. Since our
14 Presumably, using daily data will help. However, NAV information is only available on weekly frequency. This phenomenon might also be related to dividend declaration date.

30
arguments regarding the relation between closed-end discounts and dividend distributions
both rely on the magnitude of the cash distribution, we first investigate whether the decline in
the average discount during the event window is related to the magnitude of cash
distributions. In general, closed-end funds make two types of cash distributions—ordinary
dividend and special dividend distributions, special distributions being two to five times
larger than dividend distributions in most cases. Since U.S. equity funds make more regular
quarterly dividend distribution and more annual special dividend distributions than their
foreign counterparts, we focus our analysis on the U.S. equity funds.15
A plot of the average closed-end discount during the event period surrounding special
dividend distributions is presented in Panel A of Figure 3. Panel B of Figure 3 plots the
average closed-end discount during the event window surrounding the distribution week for
ordinary dividends. A comparison of these plots shows that the distribution-week decline in
the discount associated with special dividend distributions is more than twice as large as the
decline associated with ordinary dividend distributions. The results presented in Panels E
and F of Table 2 show that this finding is due in part to the fact that the average discount of
14.9% for funds whose distributions are limited to special dividends is nearly twice as large
as the average discount of 7.6% for funds that make only ordinary distributions. However,
the fact that the relative decline in the discount for funds making special distributions is
11.1%, compared to a 9.8% relative decline for funds making ordinary distributions shows
that special distributions tend to have both a larger absolute and a larger percentage impact
on the discount, consistent with our arguments regarding the importance of changes in
15 Ordinary dividends are usually income distributions which are distributed quarterly, while most special dividends are capital gains distributions that are usually distributed annually.

31
unrealized capital gains in explaining fluctuations in closed-end discounts. Such sizable
differences are unlikely to be associated with factors other than the dividend-related issues
that we have suggested.
Insert Figure 3 approximately here
The fact that special dividend distributions occur once a year implies that there
should be no repetition of the sharp decline in the average discount either 13 weeks prior or
13 weeks subsequent to the special distribution week, as we have found for funds that pay
quarterly dividends. Instead, we should observe a graduate increase in the average discount
throughout the year, precisely as shown in the Panel A of Figure 3. In contrast, the decline in
the average discount following ordinary dividend distributions is repeated every quarter, with
relatively smooth increases in the average discount followed by a relatively sharp decline
during the period surrounding the distribution week, as shown by the Panel B in Figure 3. If
the pattern in the discount that we have noted were related to factors other than dividend
distributions, these factors would be reflected in the pattern of the discounts shown in the
first panel of Figure 3 at dates t = -13 and t = +13, which does not appear to be the case.
4.2. The cross-sectional regression results for changes in closed-end fund discounts
A cross-sectional regression analysis permits us to rigorously test Hypothesis 3 by exploring
the role of both returns and the level of dividends in explaining the ex-dividend day decline
in discounts that we have documented empirically. The rationale for our tests of Hypothesis
3 is the fact that dividend announcements by closed-end funds may have high information
content, reducing the asymmetry in information between investors in the underlying assets
relative to investors in the fund following the announcement date. That is, the information

32
conveyed to a fund’s investors by the dividend declaration could potentially reduce a fund’s
discount to NAV. Note that there are usually more than fourteen days between the dividend
declaration date and the ex-dividend date. Further, it is important to note that the tax
regulations and tax rates that are imposed on international funds and their investors differ
from those that apply to investors in U.S. funds. Therefore, we might expect to observe a
somewhat different pattern in the discounts for international funds during the event window
surrounding distributions. For this reason, the regression specification that we use to test
Hypothesis 3 includes a dummy variable “Dy” to capture the incremental impact of
differences in foreign tax rules on the discount pattern for international funds.
The average closed-end discount should in theory reach a low point during the ex-
dividend week. However, Figures 1 through 3 reveal that the average discount declines to its
lowest level roughly two weeks following the dividend distribution. This could be due to the
fact that investors who sold the fund two weeks prior to the distribution week to avoid the
decline in the discount are subject to the anti-wash sale rule.16 For this reason, we measure
the decline in the discount using both the two-week decline of (δ-2 – δ) and the four-week
decline of (δ-2 – δ2). The results of our analysis are reported in Table 3.
Insert Table 3 approximately here
Panel A of Table 3 shows that the decline in the average discount based on the two-
week and four-week measures are respectively 0.70% and 0.96% for domestic funds. When
compared to the average discount for U.S. equity funds of 8.5%, the decline in the average
discount is substantial, providing direct support for Hypothesis 1. Consistent with the
analysis of Figures 1 and 2, the decline in the average discount is significantly greater for
16

33
international funds than for domestic funds, with the dummy variable for regression
specifications 1 and 2 reflecting a differential two-week and four-week declines in the
average discount for international funds relative to domestic funds of 0.38% and 1.52%.
This result is partly due to the fact that international funds make more special dividend
distributions, which are usually much larger than ordinary dividend distributions, which
implies that we should observe a larger decline in the average discount for international
funds, other things being equal.
Given the average change in the discount for closed-end equity funds, we can
examine the role of the overhanging capital gains liability in explaining the distribution-week
decline in discounts by regressing the decline in the discount on the level of the discount as
of two weeks prior to the distribution date, as given by the regression specification in
equation (4). These results are reported in Panel B of Table 3. The respective estimates of
the cross-sectional regression coefficients for the level of the discount in explaining the two-
week and four-week declines in the discount are respectively 0.049 and 0.084, which are
both significant at the 1% level for domestic funds. To put these estimates in perspective, the
estimated regression coefficients imply that the discount for a fund whose discount equals
the average of 8.5% for U.S. closed-end equity funds would have conditional expected two-
week and four-week declines of 0.42% and 0.71%, respectively accounting for more than
50% of the average two- and four-week declines in the discount, which provides further
support for Hypothesis 1.
The estimated coefficient for the interaction variable representing the differential
impact of the pre-distribution level of the discount for international funds provides an
estimate of the incremental impact of the level of the discount on the respective decline in the

34
average discounts for international and domestic funds. As shown in Panel B of Table 3,
both regression coefficients are negative and statistically significant at the 1% level. Further,
note that the relative magnitude of the estimated coefficients for the level of the discount and
the interaction term for international funds suggests that that the domestic funds having
larger pre-distribution discounts have a larger decline in their discounts while the reverse
appears to be true for foreign funds. This suggests that the decline in the discount for
international funds has a strong mechanical component, once we control for the level of the
discount.
We also test whether changes in discounts are related to dividend yield, as measured
by the ratio of fund dividends to share price using the regression specifications in equations
(5) and (6). Our results reveal a direct link between the magnitude of the decline in the
discounts for individual funds and their dividend yields, just as predicted by Hypothesis 3.
The results in Panel C of Table 2 show that the drop in the discount has significant positive
correlation with the dividend yield, with estimated regression coefficients for the respective
two-week and four-week changes in discounts on the respective dividend yields of 0.16 and
0.14 for domestic funds. Thus, a one percent difference in a fund’s dividend yield is
consistent with a roughly 15 basis point difference in the change in the discount by the end of
the distribution period. Moreover, the dividend effect is stronger for domestic funds than for
international funds as indicated by the negative coefficient in the interaction term. This is
due to the fact that taxes are deducted from the dividend distributions for international funds,
although a tax credit can be claimed when the investor’s tax return is filed.
The lost investment opportunities hypothesis that we suggest implies that past returns
proxy for the opportunity cost of the investment opportunities lost while accumulations of
35
the dividend-related cash flows are held by closed-end funds. Thus, the discounts for funds
having greater past returns should exhibit greater percentage declines during the dividend
event window. We test this hypothesis by using equation (3) to regress both the two-week
and four-week measures for changes in discounts on the cumulative returns from week t = -
13 to week t = -2, where the event-window returns are excluded from the computation of the
past returns that we use as a proxy for opportunity costs to avoid spurious correlation
between our proxy for opportunity costs and the change in the discount.
The results reported in Panel D of Table 3 show that the relation between the prior
returns and both the two-week and four-week measures for the decline in the discount are
weak for domestic funds. This could also due to the fact that fund performance is not
persistent. Moreover, the incremental impact of our proxy for shareholders’ opportunity cost
is negative for international funds. The respective coefficient estimates for these regressions
of -0.0365 and -0.0973 are both statistically significant at the 1% level, indicating that
smaller past returns are associated with larger percentage declines in closed-end discounts,
which runs counter to Hypothesis 3. This result is consistent with the argument that negative
returns are costly for investors in international funds who are unable to realize losses by
trading the individual shares held by the funds. When an international fund has low to
negative returns, investors in international funds will have an incremental cash outflow due
to the automatic tax deductions at the time of the dividend distribution. Alternatively, it
could due to investors selling shares to take tax losses. However, to the extent that closed-
end funds are reluctant to realize losses or when such losses are treated asymmetrically under
foreign tax rules, investors in international closed-end funds may be unable to offset these

36
taxes by realizing capital losses, generating an incremental increase in the discount relative to
domestic funds around distribution events.
The mechanisms by which dividend yields and fund returns affect changes in
discounts are very different. However, these two variables could potentially reflect the same
underlying effect. We control for this possibility by using a multivariate cross-sectional
regression to assess the simultaneous effects of these two variables. The results are reported
in Panel E of Table 3. Except for small changes in the estimated coefficients, these results
are very similar to those from the corresponding univariate regressions. Thus, the evidence
is consistent with Hypothesis 3. Note that based on the coefficient estimates reported in
Panel F of Table 3 and the magnitudes of the respective means and medians for the
explanatory variables reported in Table 1, the tax effect appears to be relatively more
important than lost investment opportunities in explaining the decline in the discount.
One competing explanation for the changes in the closed-end discounts that we have
examined is related to the possibility that closed-end fund shares are mispriced. To the
extent that closed-end discounts and premia are due to mispricing, the magnitude of the
apparent arbitrage opportunity will be directly related to the associated holding costs.
However, given that holding costs will be reduced by the dividend yields on the funds
associated with the respective discounts, Pontiff argues that the size of the discount should be
negatively correlated with dividend yield.
We examine the empirical validity of this alternative explanation by running a cross-
sectional regression of the discount on the dividend yield for the respective funds. These
results are reported in Panel F of Table 3. Note that since this alternative explanation bears
no direct link to the tax liability hypothesis, the hypothesized cross-sectional relation should

37
be stable across domestic and international funds. Based on the full sample of 124 closed-
end funds, we find that the absolute value of the discount is positively correlated with
dividend yields, with an estimated coefficient estimate of 0.2118, which is significant at the
1% level. The finding that closed-end discounts are positively related to dividend yield
suggests that the decline in the discount following dividend distributions is not primarily
attributable to the pre-distribution mispricing of the respective funds. We can examine the
cross-sectional stability of this relation across domestic and international funds using a
regression specification that includes an interaction term to capture the differential impact of
dividend yield on the discounts for international funds. Although the inclusion of this
interaction term reduces the significance of the estimated regression coefficient for dividend
yield to the 10% level, the magnitude of the interaction term is small and statistically
insignificant. The change in the significance of the dividend yield coefficient is likely due to
the difference in the average value of the discounts for the international and domestic funds
in our sample, which is captured by the dummy variable that indicates whether a fund is
domestic or international. Our finding that the pre-distribution magnitude of closed-end
discounts is positively related to closed-end dividend yields is not consistent with the relation
between holding costs and closed-end discounts implied by the mispricing hypothesis. Thus,
the evidence that we provide in support of the tax liability hypothesis appears to be robust to
alternative explanations.

38
5. Concluding Comments
Closed-end investment companies have survived as an investment vehicle for more than a
century. However, despite the speed of innovation in financial markets, the discounts in the
pricing of closed-end funds have remained relatively constant. While many explanations for
this phenomena, both economic and behavioral, have been offered over the years, the
discounts for closed-end funds remain a puzzle to both academia and industry practitioners.
The most plausible explanation for closed-end discounts seems to be Malkiel’s
insight that discounts should be related to the expected tax liabilities associated with
unrealized capital gains. However, empirical support for this hypothesis is weak or
conflicting. This research has implemented an alternative approach to testing the validity of
the Malkiel model. In particular, we argue that the lack of empirical support for Malkiel’s
unrealized capital gains model may be due to the inability to estimate the expected present
value of the capital gains taxes that will ultimately be paid on closed-end funds’ unrealized
capital gains. Given the difficulties inherent in constructing adequate proxies for the
expected present value of this overhanging tax liability, we argue that it is more fruitful to
examine the relation of dividend distributions and closed-end fund discounts. Since the
magnitude of quarterly dividend distributions will tend to be positively correlated with
reductions in the unrealized capital gains embedded in closed-end portfolios, quarterly
dividend distributions should tend to be associated with short-run declines in the discounts
on closed-end funds.
Our approach differs from those in the existing literature, which examine the
correlation between the respective levels of discounts and dividends in that we use an event
study approach to study the dynamics of closed-end discounts. By matching the time-series

39
of discounts for individual closed-end funds with the associated time series of dividend
distributions, we are able to link changes in discounts to cash distributions and the implicit
changes in the funds’ overhanging tax liability on unrealized capital gains. Our results
suggest that a significant portion of the short-run fluctuations in closed-end discounts is
related to cash distributions. In particular, we have shown that there is a significant decline
in closed-end discounts during the event window surrounding cash distributions, followed by
a gradual increase in the discount to a peak that occurs just prior to the subsequent
distribution.
We find similar discount patterns during the event windows leading up to both
ordinary and special distributions. However, our results show a greater relative change in the
average discount following special distributions, consistent with the observation that special
distributions reduce the funds’ overhanging liability for capital gains taxes by distributing
larger amount of previously unrealized capital gains. However, we also find that changes in
discounts are positively correlated with the magnitude of dividend yield across funds,
consistent with the proposition that dividend announcements reduce the asymmetry in
information between investors in the underlying assets relative to investors in the fund,
thereby reducing closed-end fund discounts. Finally, we have shown that the decline in the
discount is positively related to past fund returns, consistent with our argument that some
small portion of closed-end discounts is related to the opportunity cost of the investment
opportunities lost while accumulations of the dividend-related cash flows are held by closed-
end funds.
Our results provide new evidence on the importance of the anticipated tax liability for
unrealized capital gains in explaining the discounts for closed-end funds. Further, the

40
method that we use to examine short-run fluctuations in discounts permits us to examine the
significance of several additional factors that appear to be useful in explaining the discounts
on closed-end funds, shedding additional light on the role of dividends in explaining the
discounts for closed-end funds.
41
Table 1. Summary Statistics for the Closed-end Fund Sample
This table reports the summary statistics for the closed-end funds in our sample. σ(x) standards for the standard deviation of variable x. Rp and Rv are returns calculated from the close-end funds’ prices and NAVs, respectively.
Variable Mean 10% Median 90%
Discount δ (%) 11.034 -1.075 13.105 18.836
σ(δ) 9.437 4.987 7.912 15.624
Rp 0.0664 -0.1338 0.0902 0.2405
σ(Rp) 3.917 2.290 3.715 5.430
Rv 0.0658 -0.1118 0.0817 0.2256
σ(Rv) 3.209 1.843 3.007 5.160
Dividend amount 0.7349 0.1452 0.5405 1.3582
Ordinary dividend amount 0.3020 0.0568 0.2198 0.7289
Dividend Yield 0.0448 0.0163 0.0387 0.0784
Ordinary Dividend Yield 0.0202 0.0055 0.0164 0.0455
Number of dividend events per fund 15.21 4 11 40
P 14.21 8.46 11.83 20.27
NAV 15.85 8.83 13.64 22.88
Size 11.6367 10.6346 11.5194 13.1197

42
Table 2. Discount during Dividend Distribution Period
This table reports the discount level and change during the dividend distribution period. δ denotes the discount level at the Ex-dividend week, while δ-2 and δ2 represent the discount level three weeks before and two weeks after the dividend distribution, respectively. All numbers are in percentage.
Average Level of Discounts Relative Change
δ-2 δ-1 δ0 δ1 δ2
Change δ-2 – δ2
(δ-2 – δ2)/ δ-2
Panel A: All 124 funds
Mean Discount 10.09 9.66 9.31 9.13 8.59 1.506 14.93
Media Discount 11.58 11.29 10.86 10.66 10.14 1.433 12.38
Discount Volatility 11.76 11.74 12.15 12.19 12.23 -0.473
Panel B: 15 Funds With Quarterly Dividend Distributions
Mean Discount 5.71 5.49 5.27 5.32 5.12 0.588 10.30
Panel C: All 46 U.S. Funds
Mean Discount 8.45 8.08 7.80 7.81 7.54 0.909 10.75
Panel D: 12 U.S. Funds with Quarterly Dividend Distributions
Mean Discount 4.29 4.02 3.82 3.86 3.74 0.545 12.70
Panel E: U.S. Funds with Special Dividend Distributions
Mean Discount 14.85 13.71 13.42 13.79 13.21 1.645 11.08
Panel F: U.S. Funds with Ordinary Dividend Distributions
Mean Discount 7.57 7.33 7.05 7.12 6.83 0.738 9.75

43
Table 3. Testing the Significance of Discount Change during Dividend Distribution Period This table reports the significance in discount change during the dividend distribution period in terms of the pure level change, the relative change, and in relation with dividend yield. δ denotes the discount level at the Ex-dividend week, while δ-2 and δ2 represent the discount level two weeks before and two weeks after the dividend distribution, respectively. δ-2 - δ and δ-2 – δ2 thus are different measure of drops in discounts. Dividend yields (D/P-2) are calculated as dividend amount D over the fund price two weeks before the Ex-dividend week. Fund return Rp is the cumulative return from week (-13) to week (-2). “Dy” is a dummy variable that equals one for international funds.
Independent Variable Equation No.
Dependent Variable Const. Dy δ-2 δ-2 *Dy (D/P)-2 (D/P)-2*Dy Rp Rp*Dy
Panel A: Testing discount changes δ-2 - δ 0.7061 0.3798 1 t-ratio 5.99 2.05 δ-2 – δ2 0.9622 1.5214 2 t-ratio 6.61 6.63
Panel B: Testing relative discount changes δ-2 - δ 0.2772 1.1963 0.0486 -0.0781 3 t-ratio 1.80 4.73 4.29 -4.98 δ-2 – δ2 0.2218 2.5489 0.0837 -0.1056 4 t-ratio 1.17 8.17 6.04 -5.49
Panel C: Explaining discount drops by dividend yield δ-2 - δ 0.1561 0.6364 0.1633 -0.0994 5 t-ratio 1.02 2.72 5.57 -2.66 δ-2 – δ2 0.4735 1.4461 0.1446 -0.0238 6 t-ratio 2.51 4.98 4.01 -0.52
Panel D: Explaining discount drops by return δ-2 - δ 0.6976 0.3620 0.0056 -0.04217 t-ratio 5.85 1.95 0.42 -2.62 δ-2 – δ2 0.9694 1.4220 -0.0047 -0.10208 t-ratio 6.74 6.32 -0.29 -5.28
Panel E: Explaining discount drops by dividend yield and Rp δ-2 - δ 0.1529 0.6545 0.1630 -0.1079 0.0025 -0.03719 t-ratio 1.00 2.80 5.58 -2.89 0.19 -2.33 δ-2 – δ2 0.4825 1.4656 0.1453 -0.0497 -0.0074 -0.095910 t-ratio 2.61 5.16 4.13 -1.10 -0.46 -5.00
Panel F: Testing the mispricing hypothesis |δ| 8.8953 0.2118 9 t-ratio 24.57 3.69 |δ| 7.5436 3.7321 0.1712 -0.0057 10 t-ratio 15.67 5.08 1.86 -0.05
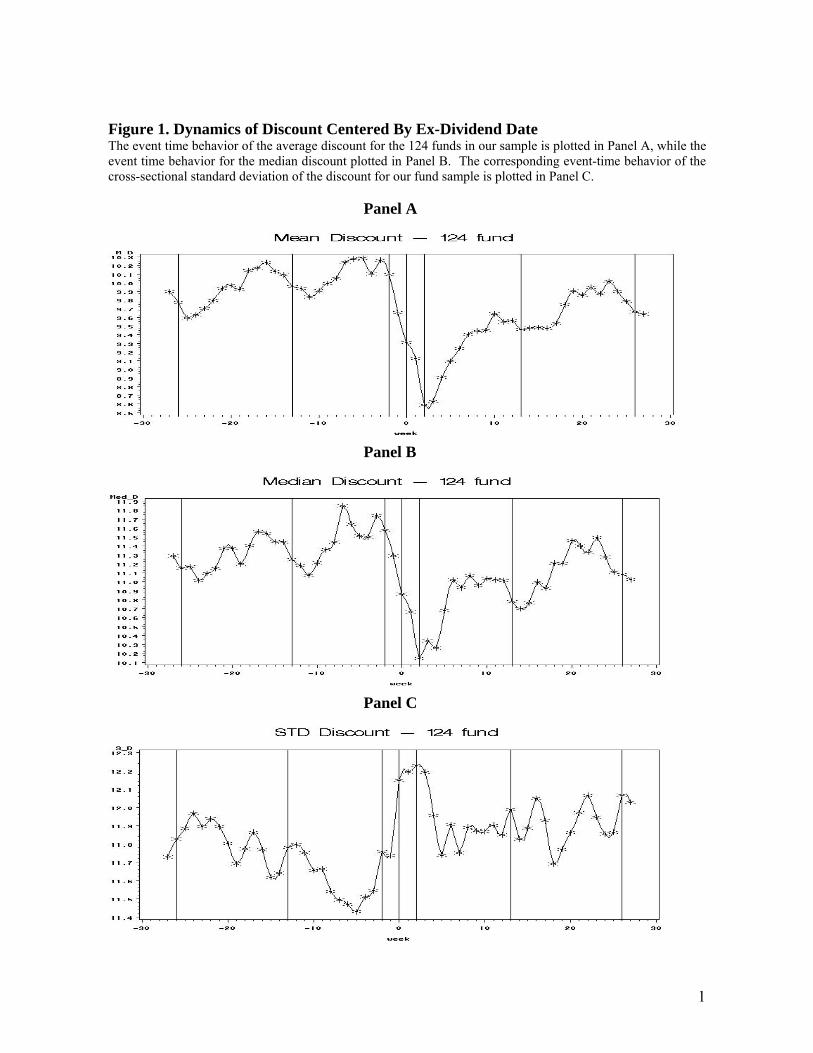
1
Figure 1. Dynamics of Discount Centered By Ex-Dividend Date The event time behavior of the average discount for the 124 funds in our sample is plotted in Panel A, while the event time behavior for the median discount plotted in Panel B. The corresponding event-time behavior of the cross-sectional standard deviation of the discount for our fund sample is plotted in Panel C.
Panel A
Panel B
Panel C

1
Figure 2. Event Time Dynamics of the Average Discount for Various Sub-Samples The event time behavior of the average discount for the 15 funds in our sample making quarterly dividend distributions is plotted in Panel A, while the average discount for the 46 US closed-end funds in our sample is plotted in Panel B. Panel C plots the average discount for the 12 US funds in our sample making quarterly dividend distributions.
Panel A
Panel B
Panel C

1
Figure 3. Dynamics of Discounts—Capital Gains versus Dividend Distributions Panel A plots the time series behavior of the average discount for the domestic funds in our sample during the event window surrounding special dividend distributions. Panel B plots the time series behavior of the average discount for the domestic funds in our sample during the event window surround the distribution of ordinary dividends.
Panel A:
Panel B:

References Brickley, James, Steven Manaster, and James Schallheim, 1991, The Tax-Timing Option and the Discounts on Closed-End Investment Companies, Journal of Business 64, 287–312. Chay, J.B., Choi, Dosoung and Pontiff, Jeffrey, 2006, Market Valuation of Tax-Timing Opitons: Evidence from Capital Gains Distributions, Journal of Finance 61, 837-865. Chen, Gongmeng, Oliver Rui, and Yexiao Xu, 2004, A First Look at Closed-end Funds in China, Working Paper, School of Management, The University of Texas at Dallas. Constantinides, George M., 1983, Capital Market Equilibrium with Personal Tax, Econometrica 51, 611–636. Constantinides, George M., 1984, Optimal Stock Trading with Personal Taxes: Implications for Prices and the Abnormal January Returns, Journal of Financial Economics 13, 65–90. Dimson, Elroy, and Carolina Minio-Kozerski, 1999, Closed-end funds: a survey, Financial Markets, Institutions & instruments 9(3), 1-41. Elton, Edwin J, and Martin J. Gruber, 1970, Marginal Stockholder Tax Rates and Clientele Effect, Review of Economics and Statistics 52, 68-74. Elton, Edwin J, Martin J. Gruber, and Christopher R. Blake, 1996, The persistence of Risk-Adjusted Mutual Fund Performance, Journal of Business 69, 133-157. Fredman, Albert and George Cole Scott, 1991, Investing in Closed-End Funds: Finding Value and Building Wealth, New York Institute of Finance, New York. Graham, John R., 2003, Taxes and Corporate Finance: A Review, Review of Financial Studies 16, 1075-1129. Koski, Jennifer Lynch, 1996, A Microstructure Analysis of Ex-Dividend Stock Price Behavior Before and After the 1984 and 1986 Tax Reform Acts, Journal of Business 69, 313-338 Koski, Jennifer Lynch, and John T. Scruggs, 1998, Who Trades Around the Ex-Dividend Day? Evidence from NYSE Audit File Data, Financial Management 27, 58-72. Kim, Chang-Soo, 1994, Investor Tax-Trading Opportunities and Discounts on Closed-End Mutual Funds, Journal of Financial Research 17, 65–75. Klein, Peter, 2001, The Capital Gain Lock-in Effect and Long-horizon Return Reversal, Journal of Financial Economics 59, 33-62.

3
Lee, Charles M.C., Andrei Shleifer, and Richard H. Thaler, 1991, Investor Sentiment and the Closed-End Fund Puzzle, Journal of Finance 46, 76–110. Malkiel, Burton G., 1977, The Valuation of Closed-End Investment-Company Shares, Journal of Finance 32, 847–858. Naranjo, Andy, M. Nimalendran, and Mike Ryngaert, 2000, Time variation of Ex-dividend day stock returns and corporate dividend capture: a reexamination, Journal of Finance 55, 2357-2372. Pontiff, Jeffrey, 1995, Closed-End Fund Premiums and Returns; Implications for Financial Market Equilibrium, Journal of Financial Economics 37, 341–367. Pontiff, Jeffrey, 1997, Excess Volatility and Closed-end Funds, American Economic Review 87, 155–169. Pontiff, Jeffrey, 2006, Costly Arbitrage and the Myth of Idiosyncratic Risk, Journal of Accounting and Economics 42, 35–52. Pratt, Eugene J., 1966, Myths Associated with Closed-End Investment Company Discounts, Financial Analysts Journal 22 79–82. Shackelford, Douglas A, and Terry Shevlin, 2001, Empirical tax research in accounting, Journal of Accounting and Economics 31, 321-387.