Embed Size (px)
Citation preview
Photos courtesy of Cenovus Energy Inc., TransCanada Corporation, Syncrude Canada Ltd.
JUNE 2018
DIVERSIFYING CANADA’SOIL AND GAS WORKFORCEA DECADE IN REVIEW

DIVERSIFYING CANADA’S OIL AND GAS WORKFORCE 2 JUNE 2018
Introduction ........................................................................................................ 3Diversity by the numbers ......................................................................................5Age: The grey wave and disappearing youth ............................................................5Women: Overall representation little changed .........................................................8Cultural diversity: Increases mirror Canada’s changing population .......................... 11
Share of immigrants and non-permanent residents grows ................................... 11Share of visible minorities nearly doubles ......................................................... 12Slower growth in representation of Indigenous Peoples ...................................... 13Share of persons with disabilities little changed ................................................. 14
Higher learning: Workforce became more educated ............................................... 15Moving forward ................................................................................................. 17Appendix A: Research notes and definitions .......................................................... 20Appendix B: Data tables ...................................................................................... 21Acknowledgements ............................................................................................. 25
Table of Contents

DIVERSIFYING CANADA’S OIL AND GAS WORKFORCE 3 JUNE 2018
INTRODUCTION
This report examines the oil and gas industry’s changing workforce2 through demographic shifts within age, sex, persons with disabilities, cultural diversity and educational attainment. The analysis focuses on the upstream and midstream oil and gas industry and its sub-sectors: exploration and production, both oil sands and non oil sands resources, oil and gas services and pipeline. Data from other trade-intensive industries and Canada’s total workforce are also presented in this report.3
Data from Statistics Canada’s Census 2006, the National Household Survey 2011 and Census 2016 were compared to provide a better understanding of how oil and gas workforce demographics shifted over the decade.
Labour Productivity in Canada’s Oil and Gas Industry, September 2017.1The workforce, also known as the labour force, refers to all persons who are either employed, or unemployed and actively seeking work.2For the purposes of this report, the workforce, also known as the labour force, refers to all persons who are either employed, or unemployed and actively seeking work.
3
Oil and gas companies and representatives from the three industry sub-sectors were approached to discuss their company’s demographic shifts, diversity and inclusion initiatives and the impact the latest downturn had on leadership support and resources for these programs. Non-profit organizations specializing in diversity and inclusion support to business were also consulted. Thirteen interviews were conducted in total.
Supplementary secondary research was also undertaken and involved reviewing company websites and other sources for diversity-related information. Refer to Appendix A for Research Notes & Definitions.
THE REPORT CONTAINS:
● Demographic analysis on key diversity groups in the oil and gas industry by sub-sector, as well as comparisons to Canada’s total workforce and other comparable trade-intensive industries in Canada
● Key trends that emerged from stakeholder consultations and secondary research
● The business case for diversity and inclusion
It has been an extraordinary and turbulent decade for Canada’s oil and gas industry. Periods of rapid and sustained expansion followed by contractions have transformed the industry. Since the steep decline of oil prices in late 2014, oil and gas companies and their service providers have learned to operate in a lower oil price market. They have done this by scrutinizing spending, implementing technologies and pursuing processes to improve productivity and boost efficiencies.1 Company restructuring and the recent protracted downturn led to changes in leadership and priorities, as well as reduced budgets and staff. This transformation had a significant impact not only on the workforce requirements of the industry, but also on the people who work in it.

DIVERSIFYING CANADA’S OIL AND GAS WORKFORCE 4 JUNE 2018
SPOTLIGHT: Despite periodic contractions, Canada’s oil and gas industry grew by 25,000 workers in 10 years
The oil and gas workforce expanded 15% in 10 years, from 165,000 workers in 2006 to 190,000 in 2016. This occurred despite employment declines during downturns.
Rising production levels increased the industry’s exploration and production’s workforce by 23% and nearly doubled the pipeline sector’s workforce. Oil and gas services, the largest employer in the industry, only grew by 5% from 2006 due to a number of factors, including constraints on capital spending and industry expansion, as well as changing technologies.
Figure 1: Canada’s oil and gas labour force, by year and sub-sector
Source: Census 2006 and Census 2016
2016
TOTAL: 164,800
88,900
72,500
8,400
Oil and gas servicesExploration and production (includes oil sands)
2006
TOTAL: 189,500
92,300
Pipeline
88,000 4,300
All workforce numbers have been rounded to the nearest hundred and therefore may not add up. Refer to Appendix B for complete data tables.

DIVERSIFYING CANADA’S OIL AND GAS WORKFORCE 5 JUNE 2018
10% 15%
26%
25%
24%
17% 7%
27%
27%
23%
2006 2016
n = 164,800 n = 189,500
15 to 24 years
25 to 34 years
35 to 44 years
45 to 54 years
55+ years
DIVERSITY BY THE NUMBERS
In order for companies to develop or improve upon diversity and inclusion strategies, it is important to first understand the baseline for the oil and gas industry, other comparable industries and Canada’s total labour force. A review of participation rates by underrepresented groups from Statistics Canada’s data for the census years 2006, 2011 and 2016 provides insight into diversity successes and opportunities for improvement. Refer to Appendix B for detailed data tables.
Age: The grey wave and disappearing youth
Figure 2: Canada’s oil and gas labour force, by census year and age group
Canada’s oil and gas workforce is aging (Figure 2). In 2016, 17% of the industry’s workforce was 55 or older, up considerably from 13% in 2011 and 10% in 2006.
This “grey wave” of workers suggests the rate of retirement is, or will be, increasing. The oil and gas industry will need to be prepared to hire more workers to replace these retirees even during periods of flat employment growth. This challenge has been made more difficult by a corresponding decline in youth workforce representation over the same period. Workers between the ages of 15 and 24 accounted for 15% of the oil and gas workforce in 2006 and 11% in 2011, but fell in 2016 to just 7%, less than half of what it was a decade earlier. This youth workforce decline is partly attributed to Canada’s aging population, but also to the recruitment challenges experienced during periods of
expansion and the sharp decline beginning in late 2014. During the most recent downturn, many younger, less experienced workers were let go.
The general trend of younger workers being “last in” and “first out” of the workforce has created a potential long-term structural problem for Canada’s oil and gas industry. Several employers interviewed for this report confirmed this “last in” and “first out” phenomenon is having an especially negative impact on young workers and expressed concern about reversing these losses over the longer term. One source indicated that in the current environment this also means “last back in” for young workers, as they do not have the skills to compete with the many more experienced workers still looking for employment.
The share of the oil and gas workforce for people between the ages of 25 and 54 remained relatively unchanged at about

DIVERSIFYING CANADA’S OIL AND GAS WORKFORCE 6 JUNE 2018
EXPLORATION AND PRODUCTION OIL AND GAS SERVICES PIPELINE
AGE GROUP 2006 2016 2006 2016 2006 2016
TOTAL WORKFORCE 72,500 (100%) 88,900 (100%) 88,000(100%) 92,300 (100%) 4,300 (100%) 8,400 (100%)
15-24 years 8,100 (11%) 4,600 (5%) 16,200 (18%) 7,400 (8%) 350 (8%) 520 (6%)
25-34 years 17,200 (24%) 22,700 (26%) 25,100 (28%) 25,400 (28%) 850 (20%) 2,300 (28%)
35-44 years 18,800 (26%) 24,400 (27%) 20,500 (23%) 24,100 (26%) 1,300 (29%) 2,300 (28%)
45-54 years 20,500 (28%) 21,700 (24%) 17,400 (20%) 19,800 (21%) 1,400 (33%) 1,900 (23%)
55+ years 7,800 (11%) 15,400 (18%) 8,800 (10%) 15,700 (17%) 440 (10%) 1,300 (16%)
Figure 3: Canada’s oil and gas labour force, by census year, sub-sector and age group
By comparison, other trade-intensive industries have been more successful at attracting and retaining a younger workforce. As of 2016, young workers 15 to 24 years of age had a higher workforce representation in agriculture, construction and manufacturing compared to oil and gas. Overall, young workers represented 14% of the total Canadian workforce in 2016, slightly lower than in 2006 at 16%.
The decline in the proportion of young workers, relative to other industries in Canada, suggests that they will – if they have not already – become discouraged from pursuing careers in oil and gas without a concerted effort to attract them. The shift towards hiring older workers also has implications for recruitment patterns and the potential to create hiring challenges once industry activity picks up further.
Figure 4: Share of younger and older workers across Canada and in select trade-intensive industries in 2016
75% between 2006 and 2016. However, as the underrepresented younger cohort ages, the proportion of workers with the required skills and experience to lead, manage and train new workers is likely to proportionately diminish. This will create the potential for new workforce challenges and could result in limited capacity for internal training and workforce development.
All the sub-sectors of the oil and gas industry experienced the same aging trend in their workforces between 2006 and 2016. All three saw an increase of 6 to 7 percentage points in the proportion of the workforce who were 55 years old or older (Figure 3). However, they differed in terms of how their rates of youth workforce
representation changed. Young workers comprised 11% of the workforce in exploration and production in 2006, but just 5% in 2016. Similarly, the number of young workers declined from 18% to 8% of the oil and gas services workforce. The share of young workers among the pipeline sector’s workforce remained relatively stable between 2006 at 8% and 2016 at 6%. Meanwhile, there was a 10-percentage point decline in the proportion of pipeline workers between 45 and 54 years old.
With renewed activity and recruitment challenges within the oil and gas services sector, re-engaging and training the available pool of young workers would be a viable solution for the sector going forward.
All industries
55+ years15 to 24 years
Oil and gas Agriculture Utilities Construction Manufacturing
14%
21%
7%
17%14%
37%
6%
19%
11%
20%
9%
24%
Percentages have been rounded and may not add up to 100%
DIVERSIFYING CANADA’S OIL AND GAS WORKFORCE 7 JUNE 2018
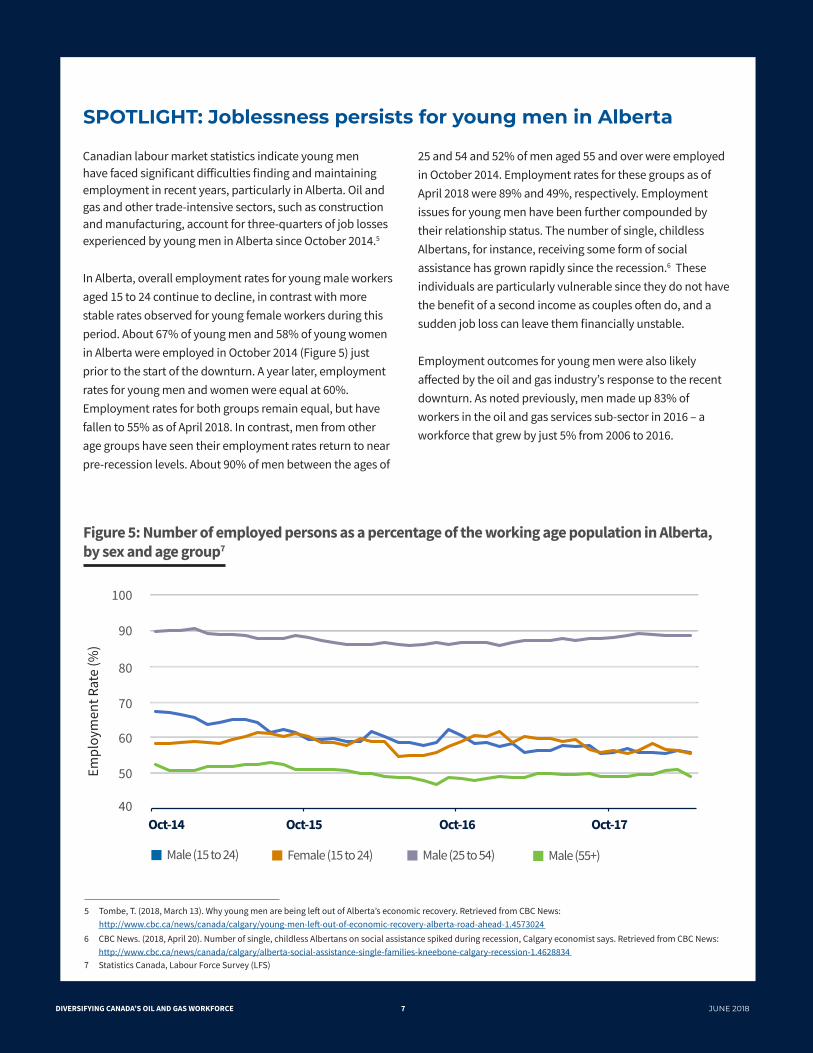
SPOTLIGHT: Joblessness persists for young men in Alberta
Figure 5: Number of employed persons as a percentage of the working age population in Alberta, by sex and age group7
Canadian labour market statistics indicate young men have faced significant difficulties finding and maintaining employment in recent years, particularly in Alberta. Oil and gas and other trade-intensive sectors, such as construction and manufacturing, account for three-quarters of job losses experienced by young men in Alberta since October 2014.5
In Alberta, overall employment rates for young male workers aged 15 to 24 continue to decline, in contrast with more stable rates observed for young female workers during this period. About 67% of young men and 58% of young women in Alberta were employed in October 2014 (Figure 5) just prior to the start of the downturn. A year later, employment rates for young men and women were equal at 60%. Employment rates for both groups remain equal, but have fallen to 55% as of April 2018. In contrast, men from other age groups have seen their employment rates return to near pre-recession levels. About 90% of men between the ages of
25 and 54 and 52% of men aged 55 and over were employed in October 2014. Employment rates for these groups as of April 2018 were 89% and 49%, respectively. Employment issues for young men have been further compounded by their relationship status. The number of single, childless Albertans, for instance, receiving some form of social assistance has grown rapidly since the recession.6 These individuals are particularly vulnerable since they do not have the benefit of a second income as couples often do, and a sudden job loss can leave them financially unstable.
Employment outcomes for young men were also likely affected by the oil and gas industry’s response to the recent downturn. As noted previously, men made up 83% of workers in the oil and gas services sub-sector in 2016 – a workforce that grew by just 5% from 2006 to 2016.
Tombe, T. (2018, March 13). Why young men are being left out of Alberta’s economic recovery. Retrieved from CBC News: http://www.cbc.ca/news/canada/calgary/young-men-left-out-of-economic-recovery-alberta-road-ahead-1.4573024
5
CBC News. (2018, April 20). Number of single, childless Albertans on social assistance spiked during recession, Calgary economist says. Retrieved from CBC News: http://www.cbc.ca/news/canada/calgary/alberta-social-assistance-single-families-kneebone-calgary-recession-1.4628834
6
Statistics Canada, Labour Force Survey (LFS)7
Empl
oym
ent R
ate
(%)
Oct-14 Oct-15 Oct-16 Oct-17
100
90
80
70
60
50
40
Male (15 to 24) Female (15 to 24) Male (25 to 54) Male (55+)

DIVERSIFYING CANADA’S OIL AND GAS WORKFORCE 8 JUNE 2018
Women: Overall representation little changed
In 2016 women made up just over one-fifth or 22% of the oil and gas workforce, little changed from 2006.
There is, however, a notable difference in gender representation among the oil and gas sub-sectors. In 2016, women made up 25% of exploration and production workers, 17% of oil and gas services workers and 34% of pipeline workers (Figure 6). The relatively low share of women in the services sector is attributed to the higher proportion of trades roles, which tend to be male dominated. In contrast, women accounted for over one-third of the pipeline workforce and that share is growing. The pipeline sector recorded the largest increase in the proportion of female workers between 2006 and 2016, rising from 30% to 34%. Over the same period, the services sector saw a 2-percentage point increase to 17% while exploration and production saw a 2-percentage point decline to 25%, following a rise to 28% in 2011.
Figure 6: Women’s share of Canada’s oil and gas labour force, by census year and sub-sector
Our core values are people, technology and profits. We hire talent where we work in line with our global diversity as well as our ambition to be an employer that is attractive to women. Our international, executive-led Gender Balance Committee continuously reviews industry trends, analyzes the issues and actively supports the recruitment and career development of women throughout the organization.”
“
— Schlumberger
IN OIL AND GAS WOMEN
2016: 40,6002006: 34,400
2006 2016
Oil and gas (total) Exploration andproduction
Oil and gas services Pipeline
21% 22%27% 25%
15% 17%
30%34%
WOMEN
TOTAL INDUSTRY: 40,600EXPLORATION AND PRODUCTION: 22,400OIL AND GAS SERVICES: 15,400PIPELINE: 2,800
IN OIL AND GAS (2016)
Layoffs resulting from the downturn, particularly from mergers and acquisitions (M&A), were reported by industry representatives as generally impacting female employees to a greater degree than men because eliminating duplicated functions meant that “shared services” departments such as human resources and communications were the subject of significant staff cuts. These departments, localized in the exploration and production sub-sector’s corporate head offices, typically have a higher concentration of female workers. This insight is reflected in the declining female representation noted for that sub-sector.
Initiatives to increase the number of women employed in various levels of management and in non-traditional occupations are often a focus for companies for reasons such as ease of measurement, direction from the board of directors, their level of representation in the workforce and the belief that this supply pool has the skills that companies need.
Due to differences in response rates between census questions, the total male and female population in 2016 is 187,300. This is lower than totals shown across other demographic groups.

DIVERSIFYING CANADA’S OIL AND GAS WORKFORCE 9 JUNE 2018
SPOTLIGHT: Proportion of women in STEM8 and leadership roles on par with share of men in similar roles
Men and women have typically held different occupational roles within the oil and gas workforce. Analyzing each gender’s occupational composition based on the skill types of the industry’s workforce in 2016 illustrates this trend. Women were predominantly employed in office-based roles while men were more likely to work in field-based roles. More than half (55%) of women were employed in occupations related to business, finance and administration in 2016 (Figure 7). A significant proportion of women were also employed in natural and applied sciences (17%) and management (9%) occupations, while all other skill types accounted for the remaining 19% of those employed in oil
and gas. The proportion of women working in management occupations (9%), however, was on par with the share of men employed in the same roles (10%).
By comparison, men accounted for a more evenly distributed occupational composition in 2016 (Figure 8). Men were most commonly employed in occupations involving field work, including roles related to trades, transport and equipment operation (26%), natural resources and agriculture (22%) and natural and applied sciences (19%). Notably, just 7% of men were employed in occupations related to business, finance and administration.
Science, technology, engineering and mathematics (STEM).8
Figures 7 & 8: Occupational distribution of Canada’s oil and gas labour force in 2016, women versus men
Manufacturing and utilities
Natural resources and agriculture
Trades, transport and equipment operators
Natural and applied sciences
Business, finance and administration
Management
Other 4%
10%
7%
19%
26%
22%
11%
WOMEN MEN
9%
55%
17%
4%
4%
3%
8%
n = 146,700n = 40,600
Percentages have been rounded and may not add up to 100%

DIVERSIFYING CANADA’S OIL AND GAS WORKFORCE 10 JUNE 2018
While women’s representation in the oil and gas industry has remained low relative to the general workforce, where women account for almost half of Canada’s total labour force, it is in line with many other trade-intensive industries such as construction and agriculture (Figure 9). Overall, there has been little change in gender representation in both the total Canadian workforce and the oil and gas workforce since 2006.
Figure 9: Female labour force distribution acrossCanada and in select industries in 2016
All industries Oil and gas Agriculture Utilities Construction Manufacturing
22%
48%
30% 27%
12%
28%
DIVERSIFYING CANADA’S OIL AND GAS WORKFORCE 11 JUNE 2018
Cultural diversity: Increases mirror Canada’s changing population
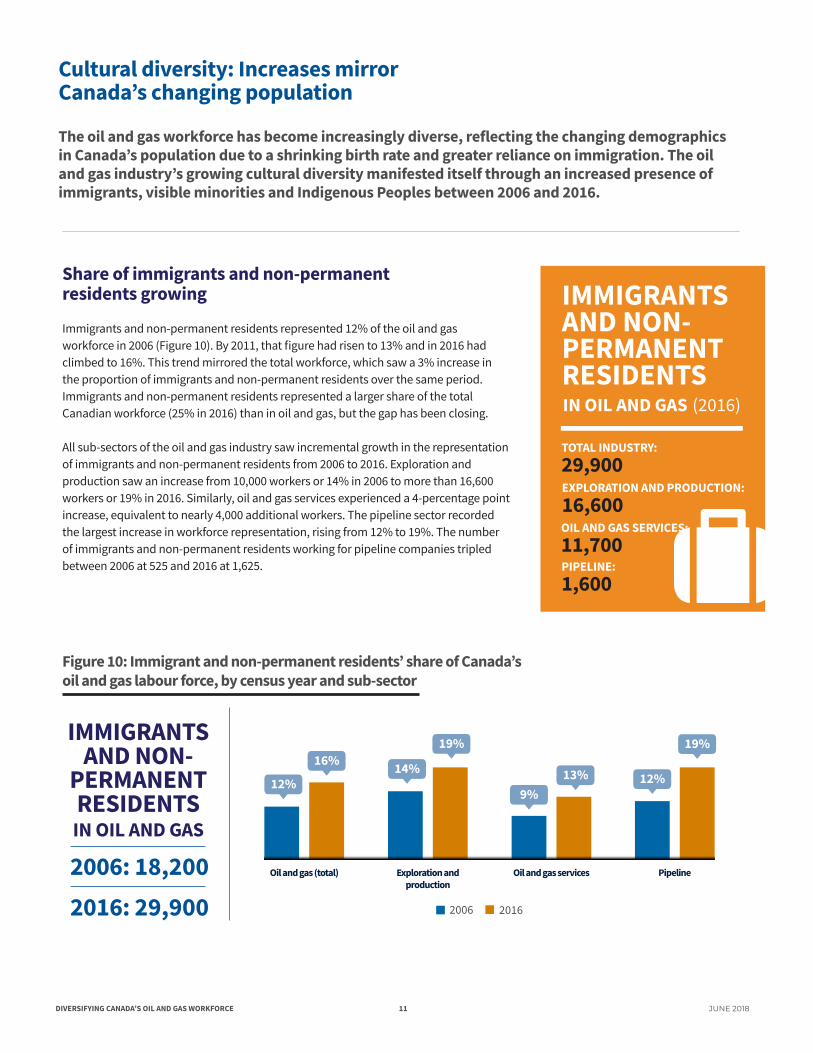
Immigrants and non-permanent residents represented 12% of the oil and gas workforce in 2006 (Figure 10). By 2011, that figure had risen to 13% and in 2016 had climbed to 16%. This trend mirrored the total workforce, which saw a 3% increase in the proportion of immigrants and non-permanent residents over the same period. Immigrants and non-permanent residents represented a larger share of the total Canadian workforce (25% in 2016) than in oil and gas, but the gap has been closing.
All sub-sectors of the oil and gas industry saw incremental growth in the representation of immigrants and non-permanent residents from 2006 to 2016. Exploration and production saw an increase from 10,000 workers or 14% in 2006 to more than 16,600 workers or 19% in 2016. Similarly, oil and gas services experienced a 4-percentage point increase, equivalent to nearly 4,000 additional workers. The pipeline sector recorded the largest increase in workforce representation, rising from 12% to 19%. The number of immigrants and non-permanent residents working for pipeline companies tripled between 2006 at 525 and 2016 at 1,625.
The oil and gas workforce has become increasingly diverse, reflecting the changing demographics in Canada’s population due to a shrinking birth rate and greater reliance on immigration. The oil and gas industry’s growing cultural diversity manifested itself through an increased presence of immigrants, visible minorities and Indigenous Peoples between 2006 and 2016.
Share of immigrants and non-permanent residents growing
Figure 10: Immigrant and non-permanent residents’ share of Canada’soil and gas labour force, by census year and sub-sector
IN OIL AND GAS
2016: 29,9002006: 18,200
2006 2016
Oil and gas (total) Exploration andproduction
Oil and gas services Pipeline
12%
16% 14%
19%
9%13% 12%
19%IMMIGRANTSAND NON-
PERMANENTRESIDENTS
IMMIGRANTSAND NON-PERMANENTRESIDENTS
TOTAL INDUSTRY: 29,900EXPLORATION AND PRODUCTION: 16,600OIL AND GAS SERVICES: 11,700PIPELINE: 1,600
IN OIL AND GAS (2016)

DIVERSIFYING CANADA’S OIL AND GAS WORKFORCE 12 JUNE 2018
Figure 11: Labour force distribution by immigrant status across Canada and in select industries in 2016
Meanwhile, immigrants and non-permanent residents participated in the oil and gas workforce at rates similar to other trade-intensive industries (Figure 11). One notable exception was manufacturing, where nearly one-third (30%) of the workforce in 2016 was made up of immigrants or non-permanent residents. The comparatively high representation rate in manufacturing is likely a result of skill requirements and geographic distribution of employment opportunities.
As Canada continues to welcome individuals born abroad into its workforce, the presence of immigrants and non-permanent residents in the oil and gas industry is expected to maintain its current trajectory.
Along with immigrants, the oil and gas workforce increased its share of visible minorities (Figure 12). The portion of the industry’s workforce defined as visible minorities nearly doubled over the decade, rising from 11,500 in 2006 (7%) to 24,300 (13%) in 2016. This was a proportionately higher rate of workforce participation than Canada’s total workforce. Although the total workforce also saw a 6-percentage point increase in the share of visible minorities between 2006 (15%) and 2016 (21%), the proportionate number of visible minority workers grew by 52% in the last decade.
All three of the oil and gas sub-sectors saw an increase in visible minorities. In exploration and production, visible minorities rose from 9% in 2006 to 16% in 2016, an increase of more than 7,500 workers. Similarly, the participation rate of visible minorities in the oil and gas services workforce nearly doubled, from approximately 4,400 workers (5%) to just over 8,500 (9%). The pipeline sector had the largest increase of any sub-sector, where the share of visible minorities grew from 9% of the workforce to 19%. Visible minority workers in pipeline companies nearly quadrupled between 2006 and 2016, from fewer than 400 workers to over 1,500.
Share of visible minorities nearly doubles
Figure 12: Visible minorities’ share of Canada’s oil and gas labour force, by census year and sub-sector
VISIBLEMINORITIES
TOTAL INDUSTRY: 24,300EXPLORATION AND PRODUCTION: 14,200OIL AND GAS SERVICES: 8,600PIPELINE: 1,600
IN OIL AND GAS (2016)
2016: 24,300
IN OIL AND GAS
2006: 11,500
VISIBLEMINORITIES
2006 2016
Oil and gas (total) Exploration andproduction
Oil and gas services Pipeline
7%
13%9%
16%
5%9% 9%
19%
All industries Oil and gas Agriculture Utilities Construction Manufacturing
25%
16%13%
16%19%
30%
All workforce numbers have been rounded to the nearest hundred and therefore may not add up.
DIVERSIFYING CANADA’S OIL AND GAS WORKFORCE 13 JUNE 2018
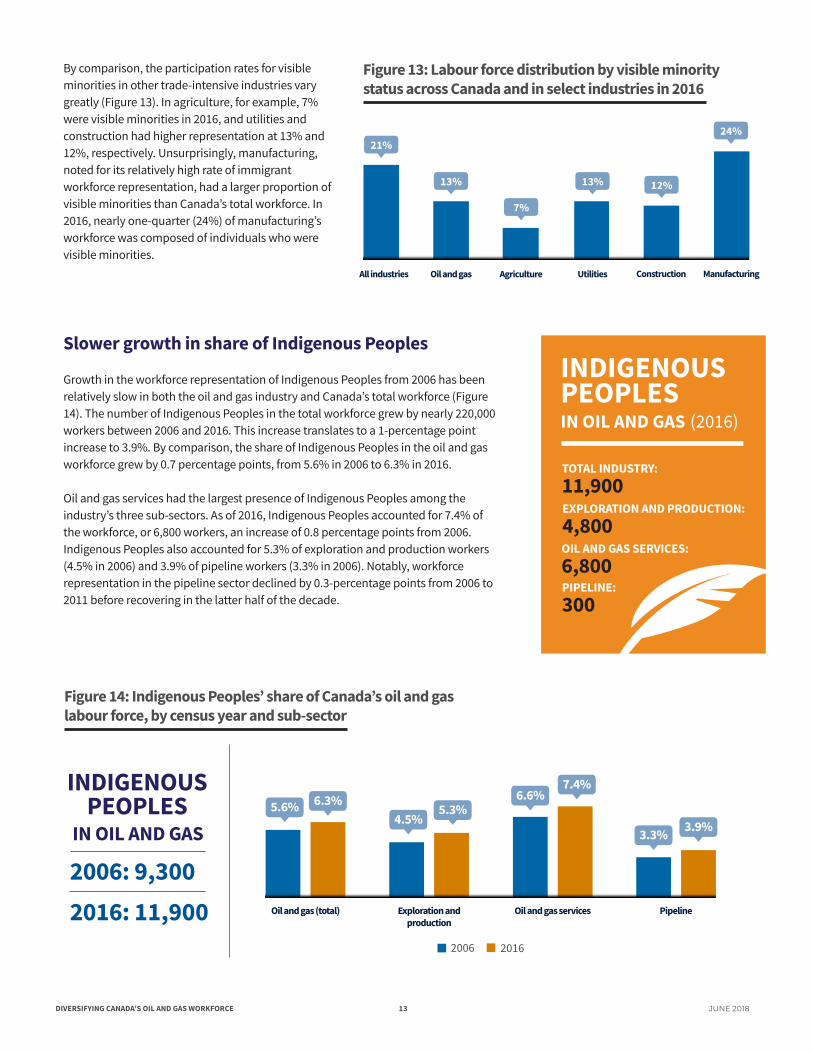
Figure 13: Labour force distribution by visible minority status across Canada and in select industries in 2016
By comparison, the participation rates for visible minorities in other trade-intensive industries vary greatly (Figure 13). In agriculture, for example, 7% were visible minorities in 2016, and utilities and construction had higher representation at 13% and 12%, respectively. Unsurprisingly, manufacturing, noted for its relatively high rate of immigrant workforce representation, had a larger proportion of visible minorities than Canada’s total workforce. In 2016, nearly one-quarter (24%) of manufacturing’s workforce was composed of individuals who were visible minorities.
Growth in the workforce representation of Indigenous Peoples from 2006 has been relatively slow in both the oil and gas industry and Canada’s total workforce (Figure 14). The number of Indigenous Peoples in the total workforce grew by nearly 220,000 workers between 2006 and 2016. This increase translates to a 1-percentage point increase to 3.9%. By comparison, the share of Indigenous Peoples in the oil and gas workforce grew by 0.7 percentage points, from 5.6% in 2006 to 6.3% in 2016.
Oil and gas services had the largest presence of Indigenous Peoples among the industry’s three sub-sectors. As of 2016, Indigenous Peoples accounted for 7.4% of the workforce, or 6,800 workers, an increase of 0.8 percentage points from 2006. Indigenous Peoples also accounted for 5.3% of exploration and production workers (4.5% in 2006) and 3.9% of pipeline workers (3.3% in 2006). Notably, workforce representation in the pipeline sector declined by 0.3-percentage points from 2006 to 2011 before recovering in the latter half of the decade.
Slower growth in share of Indigenous Peoples
Figure 14: Indigenous Peoples’ share of Canada’s oil and gas labour force, by census year and sub-sector
TOTAL INDUSTRY: 11,900EXPLORATION AND PRODUCTION: 4,800OIL AND GAS SERVICES: 6,800PIPELINE: 300
2016: 11,900
IN OIL AND GAS
2006: 9,300
INDIGENOUSPEOPLES
2006 2016
Oil and gas (total) Exploration andproduction
Oil and gas services Pipeline
5.6% 6.3%4.5%
5.3%6.6%
7.4%
3.3% 3.9%
INDIGENOUSPEOPLESIN OIL AND GAS (2016)
All industries Oil and gas Agriculture Utilities Construction Manufacturing
21%
13%
7%
13% 12%
24%

DIVERSIFYING CANADA’S OIL AND GAS WORKFORCE 14 JUNE 2018
Indigenous workforce representation has been comparatively higher in the oil and gas industry than other trade-intensive industries. By 2016, Indigenous Peoples made up 6.3% of the industry’s workforce. This compares to 5.2% in construction, 4.7% in agriculture, and 3.9% in the total Canadian workforce.
Figure 15: Labour force distribution by Indigenous Peoples status across Canada and in select industries in 2016
Share of persons with disabilities little changed
The meaning of the term disability is continually changing and the number of intellectual, physical and mental conditions that are referred to as disabilities is increasing. For the purpose of this report, persons with disabilities are defined as individuals aged 15 and over who reported that they “often” or “always” have difficulties with the activities of daily living (e.g. seeing, hearing, walking, learning, etc.) as a result of physical, mental or other health-related issues as per the StatsCan Census of Population.
Workforce representation for persons with disabilities in the oil and gas workforce was proportionately lower than Canada’s total workforce, with little to no change in representation over the decade. As of 2016, persons with disabilities accounted for
10.6% of the oil and gas industry’s workforce, or 20,000 workers. In 2011 this share was 10.7%, while in 2006 it was 10.4%. Meanwhile, persons with disabilities made up 12.6% of the total Canadian workforce as of 2016, the equivalent of 2.35 million workers. This share declined slightly from 2011, when it was 13.1%.
The proportion of each oil and gas sub-sector’s workforce composed of persons with disabilities ranged from 9.8% in exploration and production (8,700 workers) to 10.6% in pipeline (890 workers) to 11.3% in oil and gas services (10,450 workers).
Several companies interviewed indicated they do actively hire people with disabilities by carving out specific positions, providing workplace accommodations or working with non-profit associations that have employment-focused programs.
All industries Oil and gas Agriculture Utilities Construction Manufacturing
3.9%
6.3%
4.7%5.4% 5.2%
2.7%
Photo courtesy of Nexen
DIVERSIFYING CANADA’S OIL AND GAS WORKFORCE 15 JUNE 2018
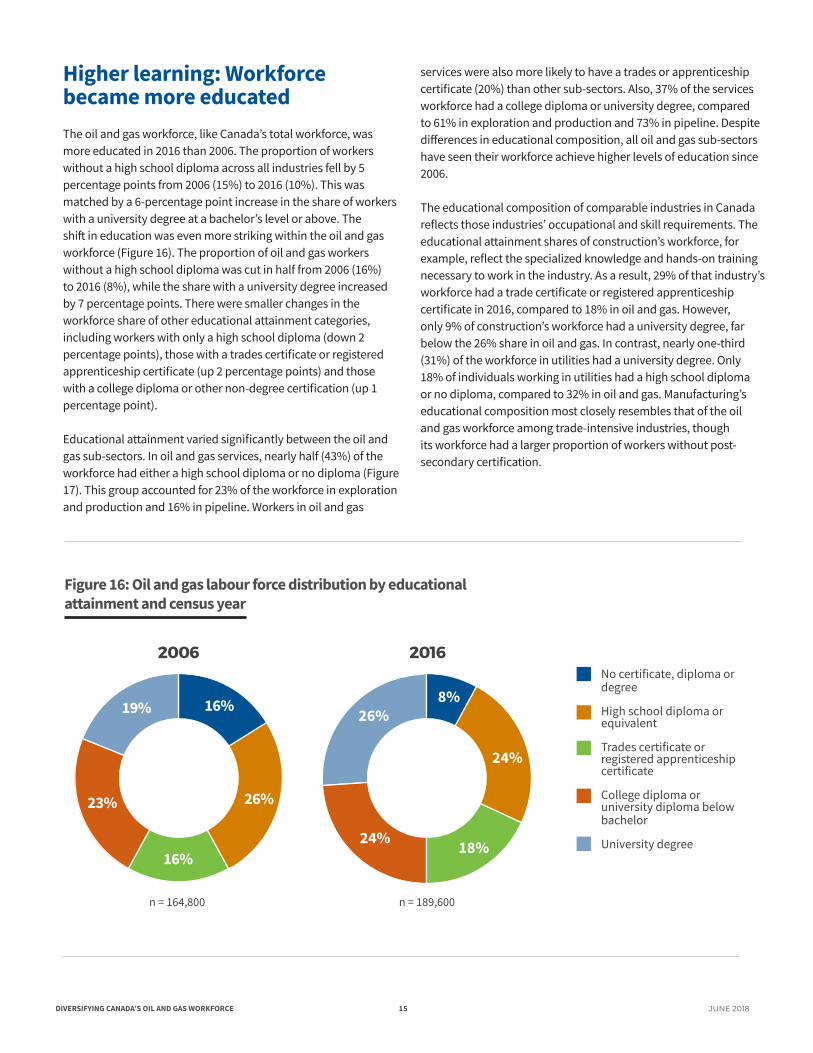
Higher learning: Workforce became more educatedThe oil and gas workforce, like Canada’s total workforce, was more educated in 2016 than 2006. The proportion of workers without a high school diploma across all industries fell by 5 percentage points from 2006 (15%) to 2016 (10%). This was matched by a 6-percentage point increase in the share of workers with a university degree at a bachelor’s level or above. The shift in education was even more striking within the oil and gas workforce (Figure 16). The proportion of oil and gas workers without a high school diploma was cut in half from 2006 (16%) to 2016 (8%), while the share with a university degree increased by 7 percentage points. There were smaller changes in the workforce share of other educational attainment categories, including workers with only a high school diploma (down 2 percentage points), those with a trades certificate or registered apprenticeship certificate (up 2 percentage points) and those with a college diploma or other non-degree certification (up 1 percentage point).
Educational attainment varied significantly between the oil and gas sub-sectors. In oil and gas services, nearly half (43%) of the workforce had either a high school diploma or no diploma (Figure 17). This group accounted for 23% of the workforce in exploration and production and 16% in pipeline. Workers in oil and gas
Figure 16: Oil and gas labour force distribution by educational attainment and census year
services were also more likely to have a trades or apprenticeship certificate (20%) than other sub-sectors. Also, 37% of the services workforce had a college diploma or university degree, compared to 61% in exploration and production and 73% in pipeline. Despite differences in educational composition, all oil and gas sub-sectors have seen their workforce achieve higher levels of education since 2006.
The educational composition of comparable industries in Canada reflects those industries’ occupational and skill requirements. The educational attainment shares of construction’s workforce, for example, reflect the specialized knowledge and hands-on training necessary to work in the industry. As a result, 29% of that industry’s workforce had a trade certificate or registered apprenticeship certificate in 2016, compared to 18% in oil and gas. However, only 9% of construction’s workforce had a university degree, far below the 26% share in oil and gas. In contrast, nearly one-third (31%) of the workforce in utilities had a university degree. Only 18% of individuals working in utilities had a high school diploma or no diploma, compared to 32% in oil and gas. Manufacturing’s educational composition most closely resembles that of the oil and gas workforce among trade-intensive industries, though its workforce had a larger proportion of workers without post-secondary certification.
19% 16%
26%
16%
23%
26%8%
24%
18%24%
No certificate, diploma or degree
High school diploma orequivalent
Trades certificate or registered apprenticeshipcertificate
College diploma oruniversity diploma below bachelor
University degree
2006 2016
n = 164,800 n = 189,600

DIVERSIFYING CANADA’S OIL AND GAS WORKFORCE 16 JUNE 2018
Figure 17: Labour force distribution by education in oil and gas sub-sectors in 2016
34%
4%
19%
27%
15%
Exploration andproduction
No certificate, diploma or degree
High school diploma or equivalent
Trades certificate or registered apprenticeshipcertificate
College diploma oruniversity diploma below bachelor
University degree
16% 13%
21%
20%
30%
Oil and gasservices
45%
2%14%
28%
11%
Pipeline
n = 88,900 n = 92,300 n = 8,400

DIVERSIFYING CANADA’S OIL AND GAS WORKFORCE 17 JUNE 2018
MOVING FORWARD
A demographic analysis of Canada’s oil and gas workforce illustrates that over a 10-year period the industry made some strides in becoming more diverse, but there is both an opportunity and a need for further improvement.
Representation of immigrants and non-permanent residents, visible minorities and Indigenous Peoples in oil and gas increased since 2006. The oil and gas workforce also increased its education, with workers more likely to have completed high school and attained post-secondary credentials by 2016.
But representation of other demographic groups, in particular women and persons with disabilities, changed little. Moreover, a concerning trend has developed with respect to the industry’s age profile. The share of the workforce aged 55 or older increased significantly from 2006 to 2016 while the share of younger workers declined, resulting in an aging workforce that is vulnerable to recruitment challenges. The downturn beginning in late 2014 and continuing through 2017 exacerbated this trend, as many younger workers were laid off and now lack the skills to compete for employment with experienced workers.
The downturn also negatively impacted leadership support and resources for diversity programs for oil and gas companies that were focused on their very survival. Several companies declined interviews for this report as they revisit their diversity programs, or could no longer provide the internal data measures. All those who were interviewed recognized the business imperative for a culture of diversity and inclusion.
With the economic and job recovery in Canada’s oil and gas industry slowly taking hold,9 there are already skills shortages in the oil and gas services sector – a sector that has lost many young workers and has attracted relatively fewer women.
There is one certainty: the rest of the industry will also face acute workforce challenges if activity picks up more. Even if it doesn’t, with the oil and gas workforce aging and a trend towards fewer young workers entering the field, the industry will need to find ways to renew its attraction and retention programs to reach out to all demographics.
To attract young workers, that may mean focusing on skills and competency training. Attracting women may mean adding mentoring or childcare programs. These challenges will only grow as potential workers question the viability of the oil and gas industry, and as competition from other industries intensifies.
The attractiveness of Canada’s oil and gas industry to workers after three years of contraction will be a topic of future research for PetroLMI.
While diversity in Canada’s oil and gas workforce may not have shifted significantly in the decade examined, attitudes have. In an Ernst & Young survey10 of the oil and gas industry, the consulting firm found “Respondents agree overwhelmingly (94%) that diversity of thought and experience are key to navigating the disruption in the industry. Developing diversity across a company isn’t a quick fix but is a long-term business imperative.”
In order for industry to re-emerge as an attractive career destination, it will need a renewed focus on improving the work environment and culture and providing the foundation for initiatives to improve diversity and inclusion.
The drilling industry’s perspective is that the labour market is in a major crunch. We have just gone through three years of the worst downturn and are coming out with major losses to our talent. Our Canadian dynamic makes it difficult to provide certainty of work and, adding to this, is the perception of our industry. Both challenges are affecting our attractiveness and we are seeing drastically reduced interest from the under 25 age group that is very important to the service sector as a whole.”
“
— Beaver Drilling
Canada’s Oil and Gas Employment and Labour Market Data Q1 2018, April 2018.9
http://www.ey.com/gl/en/industries/oil---gas/ey-diversity-boosts-performance-in-oil-and-gas 10

DIVERSIFYING CANADA’S OIL AND GAS WORKFORCE 18 JUNE 2018
SPOTLIGHT: Diversity and inclusion – a business imperative
These recognition programs most commonly, but not exclusively, include oil and gas companies that are part of the Federal Contractors Program,11 are global players or are federally regulated.12 The following companies were recognized by various 2018 award programs: Devon Canada, Enbridge Inc., Irving Oil, Keyera, Pembina Pipeline Corporation, Shell Canada and Vermilion Energy. Some companies also highlight their activities and achievements related to their work environment online.
A diverse and inclusive company builds trust and engagement within its workforce resulting in a high-performing, innovative and safe work culture.”
“
The business case for diversity and inclusion is well understood and embraced by many Canadian companies. This is evidenced by the extensive list of employer partners of the Canadian Centre for Diversity and Inclusion (CCDI), including some of Canada’s best known oil and gas companies. Industry representatives who participated in interviews for this report, including executives, affirmed the importance of diversity and inclusion to their business. In many cases it was embedded in all aspects of their business practices, with the belief that a diverse and inclusive company builds trust and engagement within its workforce resulting in a high-performing, innovative and safe work culture.
These companies often have employee-led networks and mentorship groups for women, parents, Indigenous Peoples, young professionals, immigrants, people with disabilities, LGBTQ employees and more. Some of these companies have made significant efforts to be recognized as having great workplaces or are cited as top employers or best-in-class diversity employers.
CCDI cites operational, financial, reputational, people and customer/stakeholder satisfaction as potential benefits that can be realized from diversity and inclusion initiatives.13 CCDI leaders say keeping people engaged contributes to lower turnover and a culture in which employees want to perform, speak out and offer ideas. Other research supports the notion that an inclusive workplace leads to “a tangible uplift in business performance when employees think that their workplace is highly committed to, and supportive of, diversity and they feel highly included.”14
According to interviewees, regulations and business agreements can often drive the need for companies to establish diversity and inclusion programs and practices. These can range from community benefits agreements and federal employment equity legislation to agreements with supplier and vendor companies. While improved diversity can lead to improved labour pool access and measurement results needed for regulations or agreements,
https://www.canada.ca/en/employment-social-development/programs/employment-equity/federal-contractor-program.html 11All inter-provincial pipeline companies are federally regulated.12Toolkit for developing a diversity and inclusion strategy; Canadian Council for Diversity and Inclusion; Sujay Vardhmane, September. 2017.13Waiter, is that inclusion in my soup? A new recipe to improve business performance; Deloitte Australia (Deloitte) and the Victorian Equal Opportunity and Human Rights Commission, May 2013.
14
most company representatives interviewed said their companies are putting greater emphasis on inclusion. Hiring a diverse workforce isn’t enough – creating an environment that values individuals and supports belonging and connectedness helps to establish a high-performing culture.
This is about more than equal opportunity or demographics. We are moving forward on integrating diversity and inclusion into our people processes and reducing the unconscious bias of employees and leaders across our company.”
“
— Suncor
Diversity + Inclusion = Business Performance

DIVERSIFYING CANADA’S OIL AND GAS WORKFORCE 19 JUNE 2018
Diversity + Inclusion = Innovation
As organizations continue to invest and implement new technologies, there is a resounding need to innovate. A more diverse workforce gives industry access to people who have different backgrounds, experiences and perspectives, bringing with them a diversity of thought. Organizations that employ people with similar backgrounds and experiences tend to create “like-thinking” cycles.
Diversity of thought from unique experiences and backgrounds also enhances innovation and competitiveness. Bringing multi-disciplinary, multi-national teams together with varied expertise, ages and sexes creates ideas that companies wouldn’t otherwise get. This desire for “out-the-box thinking” is why Shell, for instance, consciously creates diverse teams for scenario planning exercises.
When our workplace is inclusive, new perspectives and innovative ideas will surface, resulting in new technologies, product ideas, markets, and ways of doing business for our company.”
“
— Imperial
A culture where involvement and influence are supported, and input is valued, is a culture that also supports a safety culture, according to the interviewees. The industry’s safety culture is a natural starting point to include diversity and inclusion as core elements. One large oil and gas exploration company insists its suppliers take not only a safety orientation program, but also respect in the workplace training, which includes highlights of their commitment to diversity and treating people with dignity.
Safety also extends to issues around sexual misconduct and harassment. Diversity and inclusion programs can be useful tools to help companies and their employees address these concerns, particularly as legislative changes take effect that emphasize the need for companies to have appropriate programs in place.
Safety and inclusion go hand in hand and safety programs are a great way to reach out to people.”
“
— Imperial
Photo courtesy of Cenovus Energy Inc.
Diversity of perspective can set the stage for innovation. You can see this in practice at consulting firms.”
“
— Calgary Region Immigrant Employment Council (CRIEC)
Safety culture and inclusion go hand in hand
If you run a safe and reliable company you’ll produce products and make a profit. This is a company where people are both comfortable and expected to voice their perspectives and have them listened to. This is a company that is commited to diversity and inclusion.”
“
— Energy Safety Canada

DIVERSIFYING CANADA’S OIL AND GAS WORKFORCE 20 JUNE 2018
APPENDIX A: RESEARCH NOTES AND DEFINITIONSData on underrepresented groups were collected from Statistics Canada’s 2006 Census, the 2011 National Household Survey and 2016 Census releases and customized based on the North American Industry Classification System (NAICS) at the two and three digit levels. The three sub-sectors that compose the oil and gas industry are: oil and gas extraction (NAICS 211), support activities for mining and oil and gas extraction (NAICS 213), and pipeline transportation (NAICS 486). In this report, they are referred to as exploration and production, oil and gas services and pipeline, respectively. All workforce estimates related to NAICS 213 were reduced by 15% in order to capture only the support activities for the oil and gas industry.
The workforce, also known as the labour force, refers to all persons who are either employed, or unemployed and actively seeking work. This should not be confused with other PetroLMI reports, such as our Labour Market Outlooks, that typically present oil and gas employment numbers. The terms “workforce representation rate,” “proportion” and “share” are all used interchangeably in this report to refer to the number of individuals in the workforce belonging to a demographic group as a percentage of the overall workforce. For example, in 2016 there were 50,400 youth (aged 15 to 24) among the 189,500 people in the oil and gas workforce. Thus, the workforce representation rate/proportion/share of youth in the oil and gas workforce is 50,400 divided by 189,500, or 7%.
Statistics Canada defines immigrants as persons who have been granted the right to live in Canada permanently (including permanent residents), while non-permanent residents include persons from outside Canada who have a work or study permit or who are refugee claimants.
Statistics Canada uses the definition of visible minorities as set out by the Employment Equity Act, wherein visible minorities are “persons, other than Indigenous Peoples, who are non-Caucasian in race or non-white in colour.” In Canada, the population considered to be visible minorities predominantly includes individuals who are South Asian, Chinese, Black, Filipino, Latin American, Arab, Southeast Asian, West Asian, Korean or Japanese.
Indigenous Peoples refers to all persons who identify with the Aboriginal peoples of Canada, including those who are First Nations, Métis or Inuk (singular of Inuit), as well as those who are Registered or Treaty Indians (i.e., registered under the Indian Act of Canada). Statistics Canada notes that population estimates for this group may not be accurate due to the possibility of incomplete enumeration of certain communities (e.g., reserves, settlements).
Persons with disabilities are defined here as individuals aged 15 and over who reported that they “often” or “always” had difficulties with the activities of daily living (e.g., seeing, hearing, walking, learning, etc.) as a result of physical, mental or other health-related issues as per the Census of Population.
Statistics Canada measures educational attainment by asking Census of Population respondents to identify the highest level of education they have successfully completed. The educational attainment categories discussed in this section reflect those presented to respondents in the 2016 Census, except in three cases. First, the “Trades certificate or registered apprenticeship certificate” category aggregates the “Certificate of Apprenticeship or Certificate of Qualification” and “Other trades certificate or diploma” response categories found in the Census. Second, the “College diploma or university diploma below bachelor” category aggregates the “College, CEGEP or other non-university certificate or diploma” and “University certificate or diploma below bachelor level” response categories found in the Census. Finally, the “University degree” category aggregates the “Bachelor’s degree,” “University certificate or diploma above bachelor’s level,” “Degree in medicine, dentistry, veterinary medicine or optometry,” “Master’s degree” and “Earned doctorate” response categories found in the Census.
Oil and gas companies and representatives from all three industry sub-sectors were also approached to discuss their company’s demographic shifts, diversity and inclusion initiatives and the impact the downturn has had on leadership support and resources for these programs. Non-profit organizations specializing in diversity and inclusion support to business were also consulted. In total, 13 interviews were conducted.
Supplementary secondary research was also performed and involved reviewing company websites and other sources for diversity-related information.

DIVERSIFYING CANADA’S OIL AND GAS WORKFORCE 21 JUNE 2018
APPENDIX B: DATA TABLESThe values referenced throughout this report are rounded to the nearest hundred for readability purposes. The values presented in the data tables below are as provided by Statistics Canada for the exploration and production, and pipeline sub-sectors, as well as the total Canadian workforce (i.e., all industries). Data related to the oil and gas services sub-sector are rounded to a base of five. The oil and gas (total) column in each table refers to the sum of the counts in each sub-sector.
The total values for the same industry or sub-sector and Census year are not identical across data tables due to rounding of estimates and differences in response rates between Census questions.
AGE GROUP ALL INDUSTRIES OIL AND GAS(TOTAL)
EXPLORATION AND PRODUCTION
OIL AND GAS SERVICES
PIPELINE
2016
Total 18,268,120 (100%) 189,540 (100%) 88,900 (100%) 92,270 (100%) 8,370 (100%)
15 to 24 years 2,472,540 (14%) 12,495 (7%) 4,625 (5%) 7,355 (8%) 515 (6%)
25 to 34 years 3,839,085 (21%) 50,425 (27%) 22,715 (26%) 25,380 (28%) 2,330 (28%)
35 to 44 years 3,857,580 (21%) 50,855 (27%) 24,435 (27%) 24,110 (26%) 2,310 (28%)
45 to 54 years 4,195,960 (23%) 43,395 (23%) 21,715 (24%) 19,765 (21%) 1,915 (23%)
55 to 64 years 3,104,010 (17%) 28,630 (15%) 13,935 (16%) 13,470 (15%) 1,225 (15%)
65+ years 798,945 (4%) 3,740 (2%) 1,475 (2%) 2,190 (2%) 75 (1%)
2011
Total 17,587,615 (100%) 177,885 (100%) 82,360 (100%) 88,510 (100%) 7,015 (100%)
15 to 24 years 2,481,305 (14%) 19,065 (11%) 6,875 (8%) 11,685 (13%) 505 (7%)
25 to 34 years 3,597,970 (20%) 48,855 (27%) 20,890 (25%) 26,245 (30%) 1,720 (25%)
35 to 44 years 3,805,645 (22%) 42,595 (24%) 20,100 (24%) 20,685 (23%) 1,810 (26%)
45 to 54 years 4,441,310 (25%) 44,290 (25%) 23,090 (28%) 19,255 (22%) 1,945 (28%)
55 to 64 years 2,663,745 (15%) 20,165 (11%) 10,160 (12%) 9,005 (10%) 1,000 (14%)
65+ years 597,640 (3%) 2,915 (2%) 1,245 (2%) 1,635 (2%) 35 (0%)
2006
Total 16,861,175 (100%) 164,795 (100%) 72,465 (100%) 87,990 (100%) 4,340 (100%)
15 to 24 years 2,662,490 (16%) 24,675 (15%) 8,090 (11%) 16,240 (18%) 345 (8%)
25 to 34 years 3,366,330 (20%) 43,145 (26%) 17,225 (24%) 25,070 (28%) 850 (20%)
35 to 44 years 4,101,875 (24%) 40,570 (25%) 18,840 (26%) 20,455 (23%) 1,275 (29%)
45 to 54 years 4,142,400 (25%) 39,375 (24%) 20,500 (28%) 17,445 (20%) 1,430 (33%)
55 to 64 years 2,153,350 (13%) 14,645 (9%) 6,865 (9%) 7,365 (8%) 415 (10%)
65+ years 434,730 (3%) 2,380 (1%) 945 (1%) 1,410 (2%) 25 (1%)

DIVERSIFYING CANADA’S OIL AND GAS WORKFORCE 22 JUNE 2018
SEX ALL INDUSTRIES OIL AND GAS(TOTAL)
EXPLORATION AND PRODUCTION
OIL AND GAS SERVICES
PIPELINE
2016
Total 18,268,125 (100%) 187,315 (100%) 87,890 (100%) 91,040 (100%) 8,295 (100%)
Male 95,34,120 (52%) 146,750 (78%) 65,605 (75%) 75,665 (83%) 5,480 (66%)
Female 8,734,005 (48%) 40,565 (22%) 22,375 (25%) 15,375 (17%) 2,815 (34%)
2011
Total 17,587,615 (100%) 177,925 (100%) 82,355 (100%) 88,505 (100%) 7,065 (100%)
Male 9,191,175 (52%) 139,175 (78%) 59,405 (72%) 74,930 (85%) 4,840 (69%)
Female 8,396,440 (48%) 38,750 (22%) 22,950 (28%) 13,580 (15%) 2,220 (31%)
2006
Total 16,861,175 (100%) 164,790 (100%) 72,465 (100%) 87,985 (100%) 4,340 (100%)
Male 8,884,810 (53%) 130,375 (79%) 52,770 (73%) 74,575 (85%) 3,030 (70%)
Female 7,976,375 (47%) 34,410 (21%) 19,690 (27%) 13,410 (15%) 1,310 (30%)
IMMIGRANT STATUS
ALL INDUSTRIES OIL AND GAS(TOTAL)
EXPLORATION AND PRODUCTION
OIL AND GAS SERVICES
PIPELINE
2016
Total 18,268,120 (100%) 189,540 (100%) 88,895 (100%) 92,270 (100%) 8,375 (100%)
Non-immigrants 13,688,910 (75%) 159,605 (84%) 72,255 (81%) 80,600 (87%) 6,750 (81%)
Immigrants 4,322,270 (24%) 28,355 (15%) 15,725 (18%) 11,035 (12%) 1,595 (19%)
Non-permanent residents
256,940 (1%) 1,585 (1%) 915 (1%) 640 (1%) 30 (0%)
2011
Total 17,587,615 (100%) 177,930 (100%) 82,355 (100%) 88,510 (100%) 7,065 (100%)
Non-immigrants 13,552,550 (77%) 154,095 (87%) 68,715 (83%) 79,525 (90%) 5,855 (83%)
Immigrants 3,849,310 (22%) 21,870 (12%) 12,500 (15%) 8,240 (9%) 1,130 (16%)
Non-permanent residents
185,755 (1%) 1,965 (1%) 1,140 (1%) 745 (1%) 80 (1%)
2006
Total 16,861,185 (100%) 164,790 (100%) 72,465 (100%) 87,990 (100%) 4,335 (100%)
Non-immigrants 13,194,625 (78%) 146,550 (89%) 62,500 (86%) 80,240 (91%) 3,810 (88%)
Immigrants 3,547,050 (21%) 17,355 (11%) 9,510 (13%) 7,340 (8%) 505 (12%)
Non-permanent residents
119,510 (1%) 885 (1%) 455 (1%) 410 (0%) 20 (0%)

DIVERSIFYING CANADA’S OIL AND GAS WORKFORCE 23 JUNE 2018
INDIGENOUS PEOPLES
ALL INDUSTRIES OIL AND GAS(TOTAL)
EXPLORATION AND PRODUCTION
OIL AND GAS SERVICES
PIPELINE
2016
Total 18,268,125 (100%) 189,540 (100%) 88,900 (100%) 92,270 (100%) 8,370 (100%)
Indigenous identity
716,605 (4%) 11,875 (6%) 4,745 (5%) 6,800 (7%) 330 (4%)
Not-Indigenous identity
17,551,520 (96%) 177,665 (94%) 84,155 (95%) 85,470 (93%) 8,040 (96%)
2011
Total 17,587,615 (100%) 177,925 (100%) 82,355 (100%) 88,510 (100%) 7,065 (100%)
Indigenous identity
588,140 (3%) 10,185 (6%) 4,050 (5%) 5,920 (7%) 215 (3%)
Not-Indigenous identity
16,999,475 (97%) 167,740 (94%) 78,305 (95%) 82,585 (93%) 6,850 (97%)
2006
Total 16,861,180 (100%) 164,795 (100%) 72,465 (100%) 87,990 (100%) 4,340 (100%)
Indigenous identity
497,280 (3%) 9,265 (6%) 3,275 (5%) 5,845 (7%) 145 (3%)
Not-Indigenous identity
16,363,900 (97%) 155,530 (94%) 69,190 (95%) 82,145 (93%) 4,195 (97%)
VISIBLE MINORITIES
ALL INDUSTRIES OIL AND GAS(TOTAL)
EXPLORATION AND PRODUCTION
OIL AND GAS SERVICES
PIPELINE
2016
Total 18,268,120 (100%) 189,545 (100%) 88,895 (100%) 92,275 (100%) 8,375 (100%)
Visible minority 3,896,330 (21%) 24,290 (13%) 14,155 (16%) 8,565 (9%) 1,570 (19%)
Not a visible minority
14,371,790 (79%) 165,255 (87%) 74,740 (84%) 83,710 (91%) 6,805 (81%)
2011
Total 17,587,615 (100%) 177,935 (100%) 82,360 (100%) 88,505 (100%) 7,070 (100%)
Visible minority 3,131,630 (18%) 17,715 (10%) 10,735 (13%) 5,980 (7%) 1,000 (14%)
Not a visible minority
14,455,985 (82%) 160,220 (90%) 71,625 (87%) 82,525 (93%) 6,070 (86%)
2006
Total 16,861,180 (100%) 164,800 (100%) 72,470 (100%) 87,990 (100%) 4,340 (100%)
Visible minority 2,556,035 (15%) 11,475 (7%) 6,645 (9%) 4,435 (5%) 395 (9%)
Not a visible minority
14,305,145 (85%) 153,325 (93%) 65,825 (91%) 83,555 (95%) 3,945 (91%)

DIVERSIFYING CANADA’S OIL AND GAS WORKFORCE 24 JUNE 2018
DIFFICULTIES WITH ACTIVITIES OF DAILY LIVING
ALL INDUSTRIES
OIL AND GAS(TOTAL)
EXPLORATION AND PRODUCTION
OIL AND GAS SERVICES
PIPELINE
2016
Total 18,672,475 (100%) 189,550 (100%) 88,895 (100%) 92,280 (100%) 8,375 (100%)
Yes, always 1,618,130 (9%) 14,460 (8%) 6,470 (7%) 7,335 (8%) 655 (8%)
Yes, often 731,720 (9%) 5,575 (3%) 2,225 (3%) 3,115 (3%) 235 (3%)
Yes, sometimes 3,011,215 (16%) 27,415 (14%) 12,025 (14%) 14,350 (16%) 1,040 (12%)
No 13,227,620 (71%) 140,130 (74%) 66,845 (75%) 66,870 (72%) 6,415 (77%)
Not stated 83,790 (<1%) 1,970 (1%) 1,330 (1%) 610 (1%) 30 (<1%)
EDUCATIONAL ATTAINMENT
ALL INDUSTRIES OIL AND GAS(TOTAL)
EXPLORATION AND PRODUCTION
OIL AND GAS SERVICES
PIPELINE
2016
Total 18,268,120 (100%) 189,550 (100%) 88,895 (100%) 92,285 (100%) 8,370 (100%)
No certificate, diploma or degree
1,904,945 (10%) 15,815 (8%) 3,635 (4%) 12,030 (13%) 150 (2%)
High school diploma or equivalent
4,696,015 (26%) 46,075 (24%) 17,330 (19%) 27,610 (30%) 1,135 (14%)
Trades certificate or registered apprentice-ship certificate
1,942,660 (11%) 33,400 (18%) 13,655 (15%) 18,785 (20%) 960 (11%)
College diploma or university diploma below bachelor
4,607,250 (25%) 45,625 (24%) 23,945 (27%) 19,325 (21%) 2,355 (28%)
University degree 5,117,255 (28%) 48,635 (26%) 30,330 (34%) 14,535 (16%) 3,770 (45%)
2006
Total 16,861,185 (100%) 164,790 (100%) 72,470 (100%) 87,985 (100%) 4,335 (100%)
No certificate, diploma or degree
2,514,655 (15%) 25,850 (16%) 6,155 (8%) 19,395 (22%) 300 (7%)
High school diploma or equivalent
4,435,920 (26%) 43,370 (26%) 15,220 (21%) 27,330 (31%) 820 (19%)
Trades certificate or registered apprentice-ship certificate
1,998,630 (12%) 26,680 (16%) 10,515 (15%) 15,550 (18%) 615 (14%)
College diploma or university diploma below bachelor
4,219,810 (25%) 37,715 (23%) 19,910 (27%) 16,595 (19%) 1,210 (28%)
University degree 3,692,170 (22%) 31,170 (19%) 20,670 (29%) 9,110 (10%) 1,390 (32%)

DIVERSIFYING CANADA’S OIL AND GAS WORKFORCE 25 JUNE 2018
ACKNOWLEDGEMENTS
The Petroleum Labour Market Information (PetroLMI) gratefully acknowledges the Government of Canada’s department of Employment and Social Development Canada for the funding to undertake and complete this study.
PetroLMI is also grateful for the time and expertise provided by the following organizations:
• Beaver Drilling• Calgary Region Immigrant Employment Council (CRIEC)• Canadian Association of Oilwell Drilling Contractors (CAODC)• Canadian Centre for Diversity and Inclusion (CCDI)• Canadian Energy Pipeline Association (CEPA)• Enbridge Inc.• Energy Safety Canada• Imperial• Petroleum Services Association of Canada (PSAC)• Schlumberger• Shell Canada• Suncor Energy• Trican
PetroLMI also acknowledges the contributions of Prism Economics and Analysis, Cheryl Knight & Associates Ltd. and Ryan Isojima Design for assisting in the study and production of this report.
Disclaimer
This project is funded by the Government of Canada’s Sectoral Initiatives Program.
All rights reserved.
The reader of this report has permission to use “limited labour market information (or LMI) content” for general reference or educational purposes in the reader’s analysis or research reports. “Limited LMI Content” is defined as not exceeding 400 words or a maximum of two data tables or graphs per document. Where Limited LMI Content is used, the reader must cite the source of the Limited LMI Content as follows: Source (or “adapted from”): PetroLMI, name or product, catalogue, volume and issue numbers, reference period and page(s).
The reader of this report cannot:
• Market, distribute, export, translate, transmit, merge, modify, transfer, adapt, loan, rent, lease, assign, share, sub-license or make available to another person or entity, this report in any way, in whole or in part
• Use this report and its contents to develop or derive any other information product or information service for commercial distribution or sale
• Use this report and its contents in any manner deemed competitive with any other product or service sold by PetroLMI
The information and projections contained herein have been prepared with information sources PetroLMI has deemed to be reliable. PetroLMI makes no representations or warranties that this report is error free and therefore shall not be liable for any financial or other losses or damages of any nature whatsoever arising from or otherwise relating to any use of this document. The opinions and interpretations in this publication are those of PetroLMI and do not necessarily reflect those of the Government of Canada.
For more information, contact:Petroleum Labour Market Information(PetroLMI) Phone: 403-516-8100Email: [email protected]
Copyright © PetroLMI 2018Published June 2018

Photos courtesy of Nexen, TransCanada Corporation, Syncrude Canada Ltd.
[email protected] or toll free 1-866-537-12305055 11 Street NE, Calgary, AB T2E 8N4CareersinOilandGas.com
PetroLMI OverviewThe Petroleum Labour Market Information (PetroLMI) Division of Energy Safety Canada is a leading resource for labour market information and trends regarding Canada’s oil and gas industry. PetroLMI specializes in providing petroleum labour market data, analysis and insights, as well as occupation profiles and other resources.
Careers in Oil + Gas is a PetroLMI initiative and is Canada’s leading website for oil and gas labour market information and insights, as well as occupational tools and other resources for career and workforce planning.