Embed Size (px)
Citation preview

Contents lists available at ScienceDirect
Ecological Modelling
journal homepage: www.elsevier.com/locate/ecolmodel
Diverging distribution of seedlings and mature trees reflects recent climatechange in British Columbia
A.S. Mathysa,d,⁎, N.C. Coopsa, S.W. Simardb, R.H. Waringc, S.N. Aitkenb
a Department of Forest Resource Management, 2424 Main Mall, University of British Columbia, Vancouver, V6T 1Z4, CanadabDepartment of Forest and Conservation Sciences, 2424 Main Mall, University of British Columbia, Vancouver, V6T 1Z4, Canadac College of Forestry, Oregon State University, Corvallis, OR, 97331, United Statesd Center for International Forestry Research, Jalan CIFOR, Bogor Barat, 16115, Indonesia
A R T I C L E I N F O
Keywords:Process-based modelTree species distributions3-PG modelForest regenerationClimate change
A B S T R A C T
The composition and health of forests across western North America have shown signs of change over the lasthalf-century associated with altered climate conditions. Most models developed to predict responses to variationin climate assume that the ecological distribution of adult trees provides a sound basis for projecting potentialshifts in a species’ range. Under a dynamic climate, however, recently established seedlings may more closelyreflect changes in climate conditions. This study combined the simple, widely tested physiological model 3-PGwith an empirical regeneration dataset, composed of 21,097 plots, to assess regional scale changes in tree speciesdistributions across British Columbia, Canada. We geographically registered all plot locations to correspond withtopographically-adjusted 1 km monthly climatic data for the period 2000–2009. By comparing the distributionof seedlings to that of mature trees present in an earlier period (1950–1975), we could assess where alterations inthe environment have occurred, and the extent to which changes may make a species vulnerable to replacementin some places or likely to regenerate and migrate elsewhere. Decision tree models were developed to assess therelative importance of suboptimal temperatures, frost, soil water deficits and evaporative demand on the growthand distribution of four widely distributed species: Douglas-fir (Pseudotsuga menziesii), lodgepole pine (Pinuscontorta), western larch (Larix occidentalis), and subalpine fir (Abies lasiocarpa). Tree responses varied by species,with areas suitable for lodgepole pine experiencing the largest relative increase in summer drought and areasdominated by western larch experiencing the least. Those areas modelled as suitable for species range expan-sions occurred 79% (SD=16%) of the time in places where seedlings of a designated species were predicted in2000–2009 using the regeneration dataset. We conclude that employing seedling surveys in concert with treesurveys provide valuable ecological insights when predicting species responses to climate shifts.
1. Introduction
Forest ecosystems provide many important ecological benefits, in-cluding habitat for wildlife and a continued source of clean water andair (Bonan, 2008; Spittlehouse, 2008). Many local communities dependon forests for timber as well as for their cultural and spiritual values(Millennium Ecosystem Assessment, 2005). Maintaining these eco-system services requires an improved understanding of how forests areresponding to a changing climate.
Increases in disturbances caused by insect attacks (Raffa et al.,2008; Anderegg et al., 2015), diseases (Ramsfield et al., 2016; Woodset al., 2010), and wildfires (Westerling et al., 2006) are associated withclimatic variation over recent decades (IPCC, 2014). Small changes intemperature and precipitation impact seedlings more than adult trees,
whereas the opposite is the case with bark beetles and wind storms. Thelife stage of a species individual matters in predicting the future com-position of a forest (Bose et al., 2016; Bell et al., 2014; Niinemets,2010).
In some parts of a species’ range, a shift in climate may inducestress, while elsewhere conditions may improve, fostering range ex-pansion (Mathys et al., 2017; Coops et al., 2011; Rehfeldt et al., 2014;Gray and Hamann, 2013). Most species distribution modelling effortsattempt to include a large part, if not all, of a species’ natural range. Indoing this, there is an underlying assumption that the climatic envelopeencompassing the species’ range represents those niches where a spe-cies is able to survive in the presence of the existing complement oforganisms. This complement includes not only other tree species butbiological agents that limit tree growth and survival, including native
https://doi.org/10.1016/j.ecolmodel.2018.06.008Received 6 January 2018; Received in revised form 7 June 2018; Accepted 7 June 2018
⁎ Corresponding author at: Department of Forest Resource Management, 2424 Main Mall, University of British Columbia, Vancouver, V6T 1Z4, Canada.E-mail address: [email protected] (A.S. Mathys).
Ecological Modelling 384 (2018) 145–153
0304-3800/ © 2018 Elsevier B.V. All rights reserved.
T

and introduced herbivores and pathogens. Climate change may reduceniche space, not necessarily because a species might not grow as well,but because previously benign relationships become lethal.
The response of different tree species to climate can be character-ized by quantifying relationships between species occurrence and en-vironmental variables (Guisan and Thuiller, 2005). Data mining ap-proaches such as random forest algorithms have also been employed,first to accurately assess current patterns of a species’ distribution andthen to demarcate probable future habitat (Rehfeldt et al., 2014;Iverson et al., 2008). For example, Gray and Hamann (2013) used aclimate-envelope model with random forest algorithm to map the po-tential future distribution of major tree species in western NorthAmerica. Coops et al. (2009) introduced a hybrid modelling approachthat compared the environmental sensitivities of different western treespecies with those predicted using a process-based model para-meterized for a single, widely-distributed conifer (Pseudotsuga men-ziesii). An alternative approach, based on the observed growth of dif-ferent populations observed in common garden experiments, has beenused to predict responses to assisted migration of different genotypesunder a changing climate (Wang et al., 2010; O’Neill et al., 2008).Unfortunately, data requirements for genetics-based models limit theapproach to a few widely studied species (Aitken and Bemmels, 2016).
Although the majority of biologically-based climate-responsemodels rely on species occurrence data acquired for mature trees,Nitschke and Innes (2008) provide a notable exception by modellingspecies’ responses within their regeneration niche. We believe that amodelling approach based on the distribution of tree seedlings hasmerit because the fate of seedlings at the front or rear margin of aspecies distribution is a more sensitive harbinger of the future than theresponse of mature trees (Malcolm et al., 2002; Bell et al., 2014; Boseet al., 2016). By incorporating tree seedlings in species distributionmodels, we gain insights as to how climatic variation affects
reproductive success in both previously established and newly occupiedniches (Bose et al., 2016). To date, the paucity of seedling data haslimited our ability both to assess and model the effects of climatechange on forest composition at large spatial scales (Blanco et al., 2009;Weiskittel et al., 2011; Parmesan et al., 2011).
In this study, we took advantage of databases available both onseedlings and established trees. Using a hybrid model developed byCoops et al. (2009), we combined these geographically-registered da-tasets with physiologically-defined climatic variables to run decisiontree models for both seedlings and mature trees of four widely-dis-tributed species in British Columbia (BC). This hybrid model allowed usto combine process-based modeling with sophisticated machinelearning algorithms by relating species occurrences with the relativeimportance of four environmental limitations on photosynthesis ratherthan simply employing climatic data.
In an earlier study, Mathys et al. (2014) mapped the baseline dis-tribution of native tree species using climate and soil information withan average accuracy of 84%. The objective of this study was to refinethese models to evaluate the extent that predicted tree species shiftswere in agreement with seedling observations of four species. We fo-cused the area analysed on BC and selected interior and coastal Dou-glas-fir (Pseudotsuga menziesii (Mirb.) Franco var. glauca (Beissn.)Franco and Pseudotsuga menziesii (Mirb.) Franco var. menziesii, lodge-pole pine (Pinus contorta (Dougl.)), western larch (Larix occidentalis(Nutt)), and subalpine fir (Abies lasiocarpa (Hook.)) for the analysis.Finally, we inferred changes in environmental constraints on speciesdistributions over the past decade compared to baseline conditions(1950–1975).
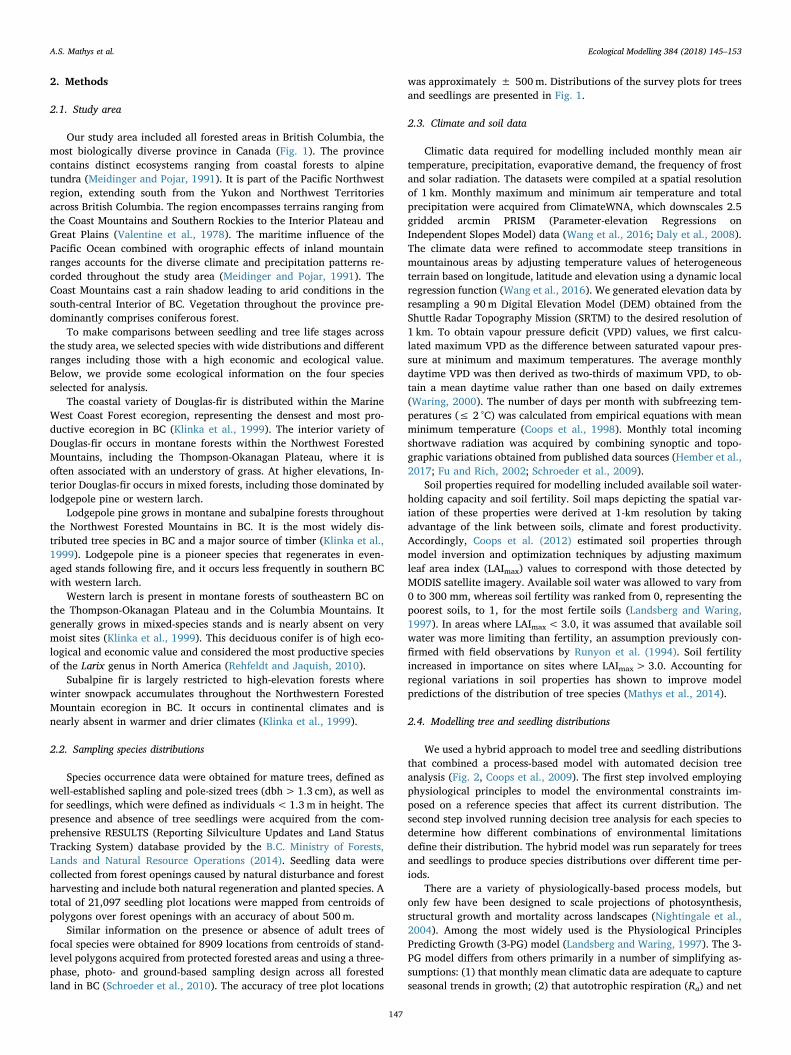
Fig. 1. Location of the survey plots of mature trees (purple) and seedlings (green) in British Columbia (For interpretation of the references to colour in this figurelegend, the reader is referred to the web version of this article.).
A.S. Mathys et al. Ecological Modelling 384 (2018) 145–153
146
2. Methods
2.1. Study area
Our study area included all forested areas in British Columbia, themost biologically diverse province in Canada (Fig. 1). The provincecontains distinct ecosystems ranging from coastal forests to alpinetundra (Meidinger and Pojar, 1991). It is part of the Pacific Northwestregion, extending south from the Yukon and Northwest Territoriesacross British Columbia. The region encompasses terrains ranging fromthe Coast Mountains and Southern Rockies to the Interior Plateau andGreat Plains (Valentine et al., 1978). The maritime influence of thePacific Ocean combined with orographic effects of inland mountainranges accounts for the diverse climate and precipitation patterns re-corded throughout the study area (Meidinger and Pojar, 1991). TheCoast Mountains cast a rain shadow leading to arid conditions in thesouth-central Interior of BC. Vegetation throughout the province pre-dominantly comprises coniferous forest.
To make comparisons between seedling and tree life stages acrossthe study area, we selected species with wide distributions and differentranges including those with a high economic and ecological value.Below, we provide some ecological information on the four speciesselected for analysis.
The coastal variety of Douglas-fir is distributed within the MarineWest Coast Forest ecoregion, representing the densest and most pro-ductive ecoregion in BC (Klinka et al., 1999). The interior variety ofDouglas-fir occurs in montane forests within the Northwest ForestedMountains, including the Thompson-Okanagan Plateau, where it isoften associated with an understory of grass. At higher elevations, In-terior Douglas-fir occurs in mixed forests, including those dominated bylodgepole pine or western larch.
Lodgepole pine grows in montane and subalpine forests throughoutthe Northwest Forested Mountains in BC. It is the most widely dis-tributed tree species in BC and a major source of timber (Klinka et al.,1999). Lodgepole pine is a pioneer species that regenerates in even-aged stands following fire, and it occurs less frequently in southern BCwith western larch.
Western larch is present in montane forests of southeastern BC onthe Thompson-Okanagan Plateau and in the Columbia Mountains. Itgenerally grows in mixed-species stands and is nearly absent on verymoist sites (Klinka et al., 1999). This deciduous conifer is of high eco-logical and economic value and considered the most productive speciesof the Larix genus in North America (Rehfeldt and Jaquish, 2010).
Subalpine fir is largely restricted to high-elevation forests wherewinter snowpack accumulates throughout the Northwestern ForestedMountain ecoregion in BC. It occurs in continental climates and isnearly absent in warmer and drier climates (Klinka et al., 1999).
2.2. Sampling species distributions
Species occurrence data were obtained for mature trees, defined aswell-established sapling and pole-sized trees (dbh>1.3 cm), as well asfor seedlings, which were defined as individuals< 1.3 m in height. Thepresence and absence of tree seedlings were acquired from the com-prehensive RESULTS (Reporting Silviculture Updates and Land StatusTracking System) database provided by the B.C. Ministry of Forests,Lands and Natural Resource Operations (2014). Seedling data werecollected from forest openings caused by natural disturbance and forestharvesting and include both natural regeneration and planted species. Atotal of 21,097 seedling plot locations were mapped from centroids ofpolygons over forest openings with an accuracy of about 500m.
Similar information on the presence or absence of adult trees offocal species were obtained for 8909 locations from centroids of stand-level polygons acquired from protected forested areas and using a three-phase, photo- and ground-based sampling design across all forestedland in BC (Schroeder et al., 2010). The accuracy of tree plot locations
was approximately ± 500m. Distributions of the survey plots for treesand seedlings are presented in Fig. 1.
2.3. Climate and soil data
Climatic data required for modelling included monthly mean airtemperature, precipitation, evaporative demand, the frequency of frostand solar radiation. The datasets were compiled at a spatial resolutionof 1 km. Monthly maximum and minimum air temperature and totalprecipitation were acquired from ClimateWNA, which downscales 2.5gridded arcmin PRISM (Parameter-elevation Regressions onIndependent Slopes Model) data (Wang et al., 2016; Daly et al., 2008).The climate data were refined to accommodate steep transitions inmountainous areas by adjusting temperature values of heterogeneousterrain based on longitude, latitude and elevation using a dynamic localregression function (Wang et al., 2016). We generated elevation data byresampling a 90m Digital Elevation Model (DEM) obtained from theShuttle Radar Topography Mission (SRTM) to the desired resolution of1 km. To obtain vapour pressure deficit (VPD) values, we first calcu-lated maximum VPD as the difference between saturated vapour pres-sure at minimum and maximum temperatures. The average monthlydaytime VPD was then derived as two-thirds of maximum VPD, to ob-tain a mean daytime value rather than one based on daily extremes(Waring, 2000). The number of days per month with subfreezing tem-peratures (≤ 2 °C) was calculated from empirical equations with meanminimum temperature (Coops et al., 1998). Monthly total incomingshortwave radiation was acquired by combining synoptic and topo-graphic variations obtained from published data sources (Hember et al.,2017; Fu and Rich, 2002; Schroeder et al., 2009).
Soil properties required for modelling included available soil water-holding capacity and soil fertility. Soil maps depicting the spatial var-iation of these properties were derived at 1-km resolution by takingadvantage of the link between soils, climate and forest productivity.Accordingly, Coops et al. (2012) estimated soil properties throughmodel inversion and optimization techniques by adjusting maximumleaf area index (LAImax) values to correspond with those detected byMODIS satellite imagery. Available soil water was allowed to vary from0 to 300 mm, whereas soil fertility was ranked from 0, representing thepoorest soils, to 1, for the most fertile soils (Landsberg and Waring,1997). In areas where LAImax< 3.0, it was assumed that available soilwater was more limiting than fertility, an assumption previously con-firmed with field observations by Runyon et al. (1994). Soil fertilityincreased in importance on sites where LAImax> 3.0. Accounting forregional variations in soil properties has shown to improve modelpredictions of the distribution of tree species (Mathys et al., 2014).
2.4. Modelling tree and seedling distributions
We used a hybrid approach to model tree and seedling distributionsthat combined a process-based model with automated decision treeanalysis (Fig. 2, Coops et al., 2009). The first step involved employingphysiological principles to model the environmental constraints im-posed on a reference species that affect its current distribution. Thesecond step involved running decision tree analysis for each species todetermine how different combinations of environmental limitationsdefine their distribution. The hybrid model was run separately for treesand seedlings to produce species distributions over different time per-iods.
There are a variety of physiologically-based process models, butonly few have been designed to scale projections of photosynthesis,structural growth and mortality across landscapes (Nightingale et al.,2004). Among the most widely used is the Physiological PrinciplesPredicting Growth (3-PG) model (Landsberg and Waring, 1997). The 3-PG model differs from others primarily in a number of simplifying as-sumptions: (1) that monthly mean climatic data are adequate to captureseasonal trends in growth; (2) that autotrophic respiration (Ra) and net
A.S. Mathys et al. Ecological Modelling 384 (2018) 145–153
147

primary production (NPP) are approximately equal fractions of grossphotosynthesis (GPP); and (3) that the proportion of NPP allocated toroots decreases linearly from 60% to ∼25% as nutrients, particularlynitrogen, become more available (Landsberg and Sands, 2011).
The 3-PG model calculates gross photosynthesis, canopy evapora-tion and transpiration, growth allocation and litter production atmonthly intervals. It reduces potential photosynthesis and transpirationby imposing restrictions on stomatal conductance through modifiers asdefined above between 0 and 1 for suboptimal temperatures, frost, highdaytime evaporative demand, and drought as imposed by a soil waterdeficit (Landsberg and Waring, 1997).
The soil water modifier is determined as a non-linear function of theratio of the amount of water available in the root zone compared to themaximum value, which is the difference between the water content atfield capacity and that at wilting point. The available water content iscalculated from knowledge of the previous month’s water storage, lessthe amount of the current month’s precipitation minus evaporation andtranspiration. Any excess water beyond field capacity drains below therooting zone or runs off the surface. Transpiration is calculated from thePenman–Monteith equation, which incorporates a canopy conductanceterm derived from stomatal conductance and LAI (Landsberg and
Waring, 1997; Monteith, 1965).Outputs of the 3-PG model include environmental constraints on
species growth such as mean monthly values of air temperature, fre-quency of frost, soil water and daytime VPD. These were normalized byassuming a continuous scale between 0 and 1, where factors causing nolimitations received a value of 1, while those preventing photosynthesisreceived a value of 0. We then averaged the monthly climatic growthmodifiers seasonally and annually for modelling purposes. We choseDouglas-fir as our reference species to parameterize the 3-PG model.Ideally, the parameterization would be carried out for each speciesindividually, however the comprehensive data required for this task isonly available for the most widely studied species. Instead, the relativeimportance of environmental constraints on other species was de-scribed, using decision tree analysis, in terms of how their tolerancesdeviated from optimal conditions of Douglas-fir.
Decision tree models were developed by combining presence andabsence data recorded in surveys with corresponding geographicallyregistered climatic data. Decision tree models defined areas where aspecies appeared to be well adapted as well as where it approached itsecological limits (Coops et al., 2009; Coops et al., 2011). To constructdecision tree models, we first extracted seasonal averages of climatemodifiers at each of the plots where a species was recorded. The relativeimportance of each of the seasonal environmental variables was thenranked using Decision Tree Regression software (DTREG, Sherrod,2010) to predict the presence and absence of each tree species acrossthe region. We built separate decision tree models for each set of surveydata. For mature trees, we used the climate growth modifiers producedfrom a decision tree analysis using monthly averaged climate data from1950 to 1975, whereas for seedlings, we used a more recent warmerand drier period from 2000 to 2009 (Waring et al., 2014). Model ac-curacies (Table 1) were evaluated using a 10-fold cross-validationtechnique (Breiman et al., 1984) and a Kappa statistic (κ).
We predicted the potential expansion or contraction of each treespecies’ range with 2000–2009 climatic data, using decision tree ana-lyses established under baseline conditions in the 1950–1975 period. Ifthe probability of a tree species’ occurrence was ≥70% in 2000–2009,while under baseline conditions it was predicted to be absent, we de-signated such areas as suitable for species expansion. Alternatively,species in areas where the environment was predicted to be no longerfavourable for a species 70% of the years since 2000 were consideredvulnerable to replacement by other species (Mathys et al., 2017).
The potential for range expansion under a rapidly changing climateis often much larger than can be attained, at least without assistedmigration. In recognition of this fact we set a limit of 200 m as themaximum distance a population of a tree species can migrate annually.This value was derived from information in the paleoecological records(Mathys et al., 2017, Davis,1989; Beckage et al., 2008). Finally, we usedthe decision tree models developed for seedlings in 2000–2009 to assessthe extent of agreement with decision tree models based on tree dataacquired in 1950–1975 and projected to the period of 2000–2009 toidentify areas of likely range expansion and contraction. In this paperwe did not attempt to predict the location of disturbances in response tovariation in climate (but see Waring et al., 2011, Waring and Coops,2016).
Fig. 2. Flow chart of hybrid modelling approach to simulate tree species dis-tributions. The process-based model 3-PG is first employed by using soil, cli-mate data and tree growth parameters as inputs. The resulting climatic growthmodifiers are then combined with tree species plots using automated decisiontree analysis.
Table 1Accuracies of decision tree models in predicting the occurrence of tree species in BC over the period of 1950–1975 and of seedlings during 2000–2009. Bracketsrepresent 95% confidence intervals.
Species Presence accuracy (%) Overall accuracy (%) κ
Tree Seedling Tree Seedling Tree Seedling
Subalpine fir 90 (± 2.0) 81 (± 1.1) 62 (± 1.0) 72 (± 0.6) 0.8147 0.6634Douglas fir 78 (± 1.6) 91 (± 0.5) 72 (± 0.9) 75 (± 0.6) 0.615 0.7079Western larch 94 (± 3.4) 86 (± 1.2) 83 (± 0.8) 69 (± 0.6) 0.9299 0.7631Lodgepole pine 78 (± 1.7) 79 (± 0.8) 61 (± 1.0) 67 (± 0.6) 0.515 0.4398
A.S. Mathys et al. Ecological Modelling 384 (2018) 145–153
148

3. Results
3.1. Changes to climatic growth modifiers
The importance of the assessed seasonal climatic modifiers, aver-aged across all plots, differed among species during the baseline period1950–1975 (Fig. 3). Both Douglas-fir and lodgepole pine were limitedmainly by suboptimal air temperature and frost in winter when thesemodifiers restricted growth by over 85%. Growth of these two specieswas not severally limited by soil water deficits (38%–39%) or eva-porative demand (29%–33%) in summer. On sites occupied by Douglas-fir, growth was also constrained by suboptimal temperatures and frostoccurrence in spring and fall, but the major limitations were imposed inwinter. The growth of subalpine fir in higher-elevation forests was se-verely restricted (> 82%) by low temperatures in spring and fall.Limitations from drought and high evaporative demand caused< 30%restrictions on subalpine fir growth during baseline conditions. Incontrast, western larch experienced soil water deficits during summerin southeastern BC that limited photosynthesis by up to 55%, whilefrost imposed> 20% reductions in growth in spring and fall.
Comparison of the two time periods (1950–1975 and 2000–2009)showed that the greatest mean differences of the seasonal modifiersoccurred predominantly in spring and summer at the surveyed plots(Fig. 4). Tree seedlings have been exposed to increased summer soilwater deficits under recent climate conditions than mature trees wereduring the earlier period (1950–1975). Summer VPD also showed somedecreases in 2000–2009 compared to baseline conditions. Springtimetemperatures and frost became less limiting between these periods,although on average they remained the most constraining environ-mental factors.
At the species level, both lodgepole pine and subalpine fir had thegreatest shift in mean seasonal modifier values, suggesting weakerconstraints from unfavourable spring temperature and frost but in-creased limitations by drought and vapour pressure deficits in2000–2009 compared to 1950–1975 (Fig. 5). Areas favourable for thesetwo species registered the largest relative increase from the effect ofdrought in summer, whereas those areas dominated by western larchexperienced the least. All species experienced a rise in spring tem-peratures across their current ranges, and these were most pronouncedfor subalpine fir and lodgepole pine, and least pronounced for Douglas-fir. In contrast, summer vapor pressure deficits increased the most in
areas occupied by lodgepole pine and least in areas favourable forwestern larch. With regard to limitations by spring frost, conditionsimproved the most for subalpine fir and changed the least for Douglas-fir. Environmental conditions in BC are improving for Douglas-fir assoils become drier and frost less frequent during the active growingseason.
3.2. Species vulnerability assessment
Vulnerability of tree species to a changing climate in 2000–2009compared to baseline conditions is shown in Fig. 6, illustrating clima-tically-suitable areas for species expansion as well as where a species ispredicted to encounter increased stress. Lodgepole pine was predictedto become increasingly stressed throughout its historic range in theInterior of BC with changing climate conditions (Fig. 6a). Approxi-mately 4% of its baseline distribution was classified as no longer sui-table with some areas (1%) becoming climatically suitable for rangeexpansion (Table 2). Western larch displayed the greatest potential for
Fig. 3. Mean seasonal variation in climatic growth modifiers for the mature trees: lodgepole pine, Douglas-fir, subalpine fir and western larch during the baselineperiod from 1950 to 1975 (0 = no growth and 1 = optimum conditions for growth).
Fig. 4. Shifts in mean (dots), median (line) and interquartile range (box) be-tween the two periods (1950-75 and 2000-09) for the seasonally-defined cli-matic growth modifiers: spring frost, spring temperature (temp), summer soilwater and summer vapour pressure deficit (VPD).
A.S. Mathys et al. Ecological Modelling 384 (2018) 145–153
149

range expansion (10%) of the four species analyzed in this study(Fig. 6b; Table 2). Western larch was projected to expand northwestfrom its historic range in Interior BC and displayed only limited stressunder recent climate conditions.
To assess model performance, we compared the areas of predictedspecies range expansions and contractions with habitat favourable forseedlings (Table 2; Fig. 6). In general, there was good agreement be-tween areas where trees were projected to expand or contract theirrange and the observed distribution of tree seedlings as simulated basedon records in the RESULTS database. The areas deemed suitable forexpansion agreed 79% on average with successful seedling establish-ment and areas classified as stressed had an average agreement of 77%with areas where the seedlings were absent.
4. Discussion
In this study, we applied an approach that identifies emerging shiftsin the distribution of species by comparing the observed distributionsand potential growth responses of two life stages: seedlings and trees.Information on seedling occurrences obtained from the regenerationdatabase served as a sensitive, early indicator of tree responses to cli-mate change. Estimates of species vulnerabilities from this study agreedwell in most cases with observed seedling establishment (Table 2). Thedistribution of subalpine fir seedlings displayed the lowest agreementwith areas we predicted as stressed. The lower number of tree plotscompared with those for seedlings may have led to a higher accuracy ofthe regeneration predictions (Table 2). In any case, our analysis sug-gests that the projected stress at these sites is not yet sufficiently severeto induce mortality of the species. In general, differences in the dis-tribution and climate exposures of seedlings compared to those of treesestablished last century provided evidence that some species expan-sions have already occurred in response to climate change (Lenoir et al.,2009).
Tree responses to changing environmental limitations during thetwo periods varied among the four species analysed. Both lodgepolepine and subalpine fir experienced the greatest changes in environ-mental constraints on sites where they currently occur and also had themost areas classified as stressed in the model predictions. In the past,sites occupied by these species experienced only limited soil waterdeficits. That situation is now changing, posing increased stress on thespecies. Although lodgepole pine is a widely distributed species adaptedto a range of environments (Klinka et al., 1999), warmer temperatures
and reduced frost can create an environment for both competing speciesand damaging biotic agents to thrive. In recent years, lodgepole pineforests have been exposed to increased bark beetle attack and diseasesthat have affected forest health and may limit their habitat in the future(Monserud et al., 2008, McKenney et al.,2007; Mathys et al., 2017,Carroll et al.,2006; Mather et al., 2010). In contrast, the two temperatespecies, Douglas-fir and western larch, both displayed the opportunityand capacity to expand northward as changing environmental condi-tions, such as increasing air temperatures and reduced snowpack, arelikely providing favourable conditions for this species to migrate.
Incorporating a large regeneration dataset together with climatedata in physiological modelling provided valuable information oncrucial environmental stressors impacting species distribution patterns.Results from this study indicated that warmer temperatures, reducedfrost, and increased drought occurred in some places in recent years,causing shifts in forest composition. All species analysed in this studybecame increasingly limited by soil water deficits, as environmentalfactors such as low temperatures and frost occurrences became lessconstraining with climate change. This greater exposure to summerdrought will be important to monitor to determine a species’ ability totolerate such changing conditions. Species that are more drought-adapted such as Douglas-fir have a competitive advantage as warmingtrends continue.
In agreement with this study, the suitable habitat of more southernspecies such as Douglas-fir and ponderosa pine has been projected toexpand northward and upward by Rehfeldt et al., (2014) and Gray andHamann (2013). These two studies projected an even greater northwardexpansion of Douglas-fir range within the Northwest Forested Moun-tains than our study, although at a lower frequency (< 5%) (Gray andHamann, 2013, Rehfeldt et al.,2014). The suitable habitat of westernlarch has also been previously predicted to expand northward in BC(Rehfeldt and Jaquish, 2010) and management practices now allowplanting small amounts of western larch north and west of its currentdistribution (Jaquish, 2010). Areas we classified as suitable for westernlarch expansion agreed well with the mapped guidelines for seedtransfers by Rehfeldt and Jaquish (2010), although we also predictedareas further northwest in the Thompson-Okanagan Plateau to becomesuitable with changing climate conditions.
Empirical studies that have analysed the distribution of trees andseedlings generally report migrations of species toward higher altitudesand latitudes (Woodall et al., 2009, Monleon and Lintz,2015; Lenoiret al., 2009), although caution has been expressed in using the
Fig. 5. Changes in seasonal climate growth modifiers for Douglas-fir, lodgepole pine, subalpine fir and western larch between 1950–1975 and 2000–2009. The errorbars represent the standard error. Positive values indicate that a modifier is becoming less limiting.
A.S. Mathys et al. Ecological Modelling 384 (2018) 145–153
150

distribution of different life stages as evidence of species range shifts(Sittaro et al., 2017). In the dry portions of western US, the distributionof tree seedlings was predicted to decline, especially in subalpine areas(Bell et al., 2014). The effects of climate change are greater at higheraltitudes, where tree species are most sensitive to changing conditions(Lenoir et al., 2009, Kullman, 2007). Unlike these empirical studies, our
approach allowed us to not only assess divergences in tree and seedlingdistributions but also to predict changes to the physiologically basedstresses that are limiting the species and offer some insights that maymodify forest management practices to buffer conditions against rapidchange.
It may be simplified to assume that species responses to changingenvironmental conditions are identical for seedlings and mature trees.Tree seedling distributions are not only affected by growth but also bygermination and success in establishment (Blanco et al., 2009), factorsthat are currently omitted by the 3-PG model. Nonetheless, the treeseedling inventory used in this study reflects the occurrences of thosespecies that had successfully established and survived in their naturalenvironment. The RESULTS database focused on areas that have un-dergone silvicultural activities for reforestation and that have beenplanted with seedlings. It would be valuable to also have informationavailable on natural regeneration in BC to compare with model pre-dictions. Still, the current dataset was useful in providing insights onthe actual inventory of regeneration in the province as influenced by
Fig. 6. Potential for range expansion and vulnerability of a) lodgepole pine and b) western larch based on 2000–2009 climatic conditions compared to conditionsduring 1950–1975 and suitable habitat for seedlings of c) lodgepole pine and d) western larch as predicted from RESULTS.
Table 2Percent agreement between modelled tree species vulnerabilities and areadeemed suitable or unsuitable for regeneration (2000–2009).
Species Expansion (%) Stress (%)
Projected Agreement Projected Agreement
Douglas-fir 5 92 1 99Lodgepole pine 1 62 4 82Western larch 10 67 2 99Subalpine fir 0 97 16 25Average 4 79 6 77
A.S. Mathys et al. Ecological Modelling 384 (2018) 145–153
151

forest management practices. Furthermore, seedlings were only plantedwithin current species ranges; thus species shifts, as identified in thisstudy, reflect climatic influences rather than changes in managementpractices.
Continuous forest monitoring in permanent plots at decadal inter-vals would improve our models in addition to our understanding of howa progressively changing climate impacts tree mortality and regenera-tion and thereby forest composition. It is also desirable to seek morerepresentative data on species growth, distribution, and site char-acteristics. We encourage a multitude of approaches to improve models,including those incorporating interactions with rising atmosphericconcentrations of CO2 (Waring and Gao, 2016) and genetic effects(Wang et al., 2010). Including forest disturbances in species distributionmodels should improve predictions of stresses that are expected to in-crease with climate change (Rehfeldt and Jaquish, 2010), for exampleby incorporating projections of fire occurrences (Waring and Coops,2016) or outbreaks of insects and pathogens (Woods et al., 2010,Mather et al., 2010). Incorporating a regeneration module within 3-PGwould also improve predictions by including microclimatic variation inlight and frost (Ribbens and Pacala, 1994; Canham et al., 1994). Itwould be more challenging to create a model that included the me-chanical limitations imposed by browsing, snow and ice (Holmgrenet al., 1997). The version of the 3-PG model used in this study is alsoonly applicable for conifer trees. Recently, the model has been modifiedto account for deciduous and mixed species forests by adjusting fordifferences in light absorption and within-canopy vertical gradients inclimate (Forrester and Tang, 2016). Differentiating soil water access forseedlings versus trees would also refine model predictions, as wehighlight the increased importance of drought on species growth. Forexample, young ponderosa pine trees have been found to be moresensitive to drought earlier in the season compared to older trees (Irvineet al., 2002). Accounting for differences in rooting depth with tree agecan contribute to improving predictions of species responses from re-generation to maturity.
This study highlighted how climate shifts are leading to changes intree species distribution patterns as affected by alterations of the en-vironmental limitations on species growth. Employing an extensiveregeneration dataset allowed us to compare and contrast predictedareas suitable for tree species range expansion with those where treeseedlings have been successfully established. While species such aslodgepole pine and subalpine fir likely experienced increased stresswith climate change, there was potential for species such as Douglas-firand western larch to expand their range as survival conditions im-proved. Knowledge of the crucial stressors on tree species and where toexpect potential for species range expansions can be useful for forestmanagers developing mitigation practices to climate change. The mostimportant contribution of our analysis is perhaps the approach itself,where the distribution of two life stages in a species are compared inreference to their appearance or absence on recorded plots over con-trasting periods, representing subtle but progressive shifts in climaticconditions. We hope to see the approach extended and tested morewidely in western North America and beyond.
Acknowledgements
We appreciate the support obtained by a Grant from the NationalAeronautics and Space Administration (NASA NNX11A029 G) toWaring as well as a Natural Sciences and Engineering Research Council(NSERC) Discovery Grant to Coops and an NSERC CGS and TerreWEBScholarship to Mathys. We are also thankful to Dan Turner, Matt LeRoyand Caroline Wood from the Ministry of Forests, Lands and NaturalResource Operations and Rural Development for providing the re-generation plot information from the RESULTS database. We thankMitchell Vartanian for editorial assistance and acknowledge the valu-able comments by two anonymous reviewers. We would also like toremember Dr. Thomas Hilker and thank him for all his research support
over the years.
References
Aitken, S.N., Bemmels, J.B., 2016. Time to get moving: assisted gene flow of forest trees.Evol. Appl. 9, 271–290.
Anderegg, W.R., et al., 2015. Tree mortality from drought, insects, and their interactionsin a changing climate. New Phytol. 208, 674–683.
B.C. Ministry of Forests, Lands and Natural Resource Operations, 2014. ResultsInformation Submission Specifications, Ed. 4a. Accessed 19 June, 2017. www.for.gov.bc.ca/HFP/publications/00220/RISS_gf_Edition_4a_2014_May.pdf.
Beckage, B., et al., 2008. A rapid upward shift of a forest ecotone during 40 years ofwarming in the Green Mountains of Vermont. Proc. Natl. Acad. Sci. U. S. A. 105,4197–4202.
Bell, D.M., Bradford, J.B., Lauenroth, W.K., 2014. Early indicators of change: divergentclimate envelopes between tree life stages imply range shifts in the western UnitedStates. Glob. Ecol. Biogeol. 23, 168–180.
Blanco, J., Welham, C., Kimmins, J., 2009. Guidelines for modeling natural regenerationin boreal forests. For. Chron. 85, 427–439.
Bonan, G.B., 2008. Forests and climate change: forcings, feedbacks, and the climatebenefits of forests. Science 320, 1444–1449.
Bose, A.K., Weiskittel, A., Wagner, R.G., Kuehne, C., 2016. Assessing the factors influ-encing natural regeneration patterns in the diverse, multi-cohort, and managed for-ests of Maine, USA. J. Veg. Sci. 27, 1140–1150.
Breiman, L., Friedman, J.H., Olshen, R.A., Stone, C.G., 1984. Classification andRegression Trees. Wadsworth International Group, Belmont, CA.
Canham, C.D., Finzi, A.C., Pacala, S.W., Burbank, D.H., 1994. Causes and consequences ofresource heterogeneity in forests: inter- specific variation in light transmission bycanopy trees. Can. J. For. Res. 24, 337–349.
Carroll, A.L., et al., 2006. Impacts of Climate Change on Range Expansion by theMountain Pine Beetle. Mountain Pine Beetle Initiative Working Paper 2006–14.Natural Resources Canada, Canadian Forest Service, Pacific Forestry Centre.
Coops, N.C., Waring, R.H., Landsberg, J.J., 1998. Assessing forest productivity inAustralia and New Zealand using a physiologically-based model driven with averagedmonthly weather data and satellite derived estimates of canopy photosynthetic ca-pacity. For. Ecol. Manage. 104, 113–127.
Coops, N.C., Waring, R.H., Schroeder, T.A., 2009. Combining a generic process pro-ductivity model and a statistical classification method to predict presence and ab-sence of tree species in the Pacific Northwest USA. Ecol. Model. 220, 1787–1796.
Coops, N.C., Waring, R.H., Beier, C., Roy-Jauvin, R., Wang, T., 2011. Modeling the oc-currence of fifteen coniferous tree species throughout the Pacific Northwest of NorthAmerica using a hybrid approach of a generic process-based growth model and de-cision tree analysis. Appl. Veg. Sci. 14, 401–414.
Coops, N.C., Waring, R.H., Hilker, T., 2012. Prediction of soil properties using a process-based forest growth model to match satellite-derived estimates of leaf area index.Remote Sens. Environ. 126, 160–173.
Daly, C., et al., 2008. Physiographically sensitive mapping of climatological temperatureand precipitation across the conterminous United States. Int. J. Climatol. 28,2031–2064.
Davis, M.B., 1989. Lags in vegetation response to greenhouse warming. Clim. Change 15,75–82.
Forrester, D.I., Tang, X., 2016. Analysing the spatial and temporal dynamics of speciesinteractions in mixed-species forests and the effects of stand density using the 3-PGmodel. Ecol. Model. 319, 233–254.
Fu, P., Rich, P.M., 2002. A geometric solar radiation model with applications in agri-culture and forestry. Comput. Electron. Agric. 37, 25–35.
Gray, L.K., Hamann, A., 2013. Tracking suitable habitat for tree populations under cli-mate change in western North America. Clim. Change 117, 289–303.
Guisan, A., Thuiller, W., 2005. Predicting species distribution: offering more than simplehabitat models. Ecol. Lett. 8, 993–1009.
Hember, R.A., Coops, N.C., Spittlehouse, D.L., 2017. Spatial and temporal variability ofpotential evaporation across North American forests. Hydrology 5. http://dx.doi.org/10.3390/hydrology4010005.
Holmgren, M., Scheffer, M., Huston, M.A., 1997. The interplay of facilitation and com-petition in plant communities. Ecology 78, 1966–1975.
IPCC, et al., 2014. Climate change 2014: impacts, adaptation, and vulnerability. Part A:global and sectoral aspects. In: Field, C.B. (Ed.), Contribution of Working Group II tothe Fifth Assessment Report of the Intergovernmental Panel on Climate Change.Cambridge University Press, Cambridge, UK, pp. 271–359.
Irvine, J., Law, B.E., Anthoni, P.M., Meinzer, F.C., 2002. Water limitations to carbonexchange in old-growth and young ponderosa pine stands. Tree Phys. 22, 189–196.
Iverson, L.R., Prasad, A.M., Matthews, S.N., Peters, M., 2008. Estimating potential habitatfor 134 eastern US tree species under six climate scenarios. For. Ecol. Manag. 254,390–406.
Jaquish, B., 2010. Review of British Columbia’s Contemporary and Projected WesternLarch Seed Planning Zones in Light of Climate Change. Research and KnowledgeManagement Branch, B.C. Ministry of Forests and Range, Kalamalka Forestry Centre,Vernon, B.C.
Klinka, K., Worrall, J., Skoda, L., Varga, P., Krajina, V.J., 1999. The Distribution andSynopsis of Ecological and Silvical Characteristics of Tree Species in BritishColumbia’s Forests, 2nd edn. Canadian Cartographics Ltd, Coquitlam, BC, Canada.
Kullman, L., 2007. Tree line population monitoring of Pinus sylvestris in the Swedishscandes, 1973-2005: implications for tree line theory and climate change ecology. J.Ecol. 95, 41–52.
Landsberg, J., Sands, P., 2011. Physiological Ecology of Forest Production: Principles,
A.S. Mathys et al. Ecological Modelling 384 (2018) 145–153
152

Processes and Modeling. London Academic Press, Oxford, UK, Elsevier Inc.Landsberg, J.J., Waring, R.H., 1997. A generalized model of forest productivity using
simplified concepts of radiation-use efficiency, carbon balance, and partitioning. For.Ecol. Manage. 95, 209–228.
Lenoir, J., Gégout, J.-C., Pierrat, J.-C., Bontemps, J.-D., Dhôte, J.-F., 2009. Differencesbetween tree species seedling and adult altitudinal distribution in mountain forestsduring the recent warm period (1986–2006). Ecography 32, 765–777.
Malcolm, J.R., Markhma, A., Neilson, R.P., Garaci, M., 2002. Estimated migration ratesunder scenarios of global climate change. J. Biogeogr. 29, 835–849.
Mather, W.J., Simard, S.W., Heineman, J.L., Sachs, D.L., 2010. Decline of young lodge-pole pine in southern interior British Columbia. For. Chron. 86, 484–497.
Mathys, A., Coops, N.C., Waring, R.H., 2014. Soil water availability effects on the dis-tribution of 20 tree species in western North America. For. Ecol. Manag. 313,144–152.
Mathys, A.S., Coops, N.C., Waring, R.H., 2017. An ecoregion assessment of projected treespecies vulnerabilities in western North America through the 21st century. Glob.Change Biol. 23, 920–932.
McKenney, D.W., Pedlar, J.H., Lawrence, K., Campbell, K., Hutchinson, M.F., 2007.Potential impacts of climate change on the distribution of North American trees.BioScience 57, 939–948.
Meidinger, D., Pojar, J., 1991. Ecosystems of British Columbia. Special Report Series No.6. BC Ministry of Forests, Victoria, BC.
Millennium Ecosystem Assessment (MA), 2005. Ecosystems and Human Well- Being:General Synthesis: A Report of the Millennium Ecosystem Assessment. Island Press,Washington, DC.
Monleon, V.J., Lintz, H.E., 2015. Evidence of tree species’ range shifts in a complexlandscape. PLoS ONE 10 (1), e0118069.
Monserud, R.A., Yang, Y., Huang, S., Tchebakova, N., 2008. Potential change in lodgepolepine site index and distribution under climate change in Alberta. Can. J. For. 38 (2),343–352.
Monteith, J.L., 1965. Evaporation and environment. In: In: Fogg, G.E. (Ed.), The State andMovement of Water in Living Organisms. Symposia of the Society for ExperimentalBiology 29. Cambridge University Press, Cambridge, UK, pp. 205–234.
Nightingale, J.M., Phinn, S.R., Held, A.A., 2004. Ecosystem process models at multiplescales for mapping tropical forest productivity. Prog. Phys. Geogr. 28, 241–281.
Niinemets, Ü., 2010. Responses of forest trees to single and multiple environmentalstresses from seedlings to mature plants: past stress history, stress interactions, tol-erance and acclimation. For. Ecol. Manage. 260, 1623–1639.
Nitschke, C.R., Innes, J.L., 2008. A tree and climate assessment tool for modeling eco-system response to climate change. Ecol. Model. 210, 263–277.
O’Neill, G.A., Hamann, A., Wang, T., 2008. Accounting for population variation improvesestimates of the impact of climate change on species’ growth and distribution. J.Appl. Ecol. 45, 1040–1049.
Parmesan, C., Duarte, C., Poloczanska, E., Richardson, A.J., Singer, M.C., 2011.Overstretching attribution. Nat. Clim. Change 1, 2–4.
Raffa, K.F., et al., 2008. Cross-scale drivers of natural disturbances prone to anthro-pogenic amplification: the dynamics of bark beetle eruptions. BioScience 58,501–517.
Ramsfield, T.D., Bentz, B.J., Faccoli, M., Jactel, H., Brockerhoff, E.G., 2016. Forest healthin a changing world: effects of globalization and climate change on forest insect andpathogen impacts. Forestry 89 (3), 245–252.
Rehfeldt, G.E., Jaquish, B.C., 2010. Ecological impacts and management strategies for
western larch in the face of climate-change. Mitig. Adapt. Strat. Glob. Change 15,283–306.
Rehfeldt, G.E., et al., 2014. Comparative genetic responses to climate for the varieties ofPinus ponderosa and Pseudotsuga menziesii: realized climate niches. For. Ecol.Manag. 324, 126–137.
Ribbens Jr, E., Pacala, S., 1994. Seedling recruitment in forests: calibrating models topredict patterns of tree seedling dispersion1. Ecology 75, 1794–1806.
Runyon, J., Waring, R.H., Goward, S.N., Welles, J.W., 1994. Environmental limits on netprimary production and light-use efficiency across the Oregon transect. Ecol. Appl. 4,226–237.
Schroeder, T., Hember, R., Coops, N., Liang, S., 2009. Validation of solar radiation sur-faces from MODIS and reanalysis data over topographically complex terrain. J. Appl.Meteorol. Climatol. 48, 2441–2458.
Schroeder, T.A., Hamann, A., Coops, N.C., Wang, T., 2010. Occurrence and dominance ofsix Pacific Northwest conifer species. J. Veg. Sci. 23, 586–596.
Sherrod, P.H., 2010. DTREG Manual. Accessed 23 June, 2017. https://www.dtreg.com/uploaded/downloadfile/DownloadFile_5.pdf.
Sittaro, F., Paquette, A., Messier, C., Nock, C.A., 2017. Tree range expansion in easternNorth America fails to keep pace with climate warming at northern range limits.Glob. Chang. Biol. 23, 3292–3301. http://dx.doi.org/10.1111/gcb.13622.
Spittlehouse, D.L., 2008. Climate Change, Impacts, and Adaptation Scenarios: ClimateChange and Forest and Range Management in British Columbia. Technical Report045. B.C. Ministry of Forests & Range, Research Branch, Victoria, BC.
Valentine, K.W.G., Sprout, P.N., Baker, T.E., Lavkulich, L.M., 1978. The Soil Landscapesof British Columbia. B.C. Ministry of Environment. Resource Analysis Branch.
Wang, T., O’Neill, G.A., Aitken, S.N., 2010. Integrating environmental and genetic effectsto predict responses of tree populations to climate. Ecol. Appl. 20, 153–163.
Wang, T., Hamann, A., Spittlehouse, D., Carroll, C., 2016. Locally downscaled and spa-tially customizable climate data for historical and future periods for North America.PLoS One 11, e0156720.
Waring, R.H., 2000. A process model analysis of environmental limitations on growth ofsitka spruce plantations in Great Britain. Forestry 73, 65–79.
Waring, R.H., Coops, N.C., 2016. Predicting large wildfires across western North Americaby modeling seasonal variation in soil water balance. Climate Change 135 (2),325–339.
Waring, R.H., Gao, L., 2016. Recent reduction in the frequency of frost accounts for mostof the increased growth of a high elevation spruce forest in northwestern China. Trees30, 1225–1236.
Waring, R.H., Coops, N.C., Running, S.W., 2011. Predicting satellite-derived patterns oflarge- scale disturbances in forests of the Pacific Northwest Region in response torecent climatic variation. Remote Sens. Environ. 115, 3554–3566.
Waring, R.H., Coops, N.C., Mathys, A., Hilker, T., Latta, G., 2014. Process-based modelingto assess the effects of recent climatic variation on site productivity and forestfunction across western North America. Forests 5, 518–534.
Weiskittel, A.R., Hann, D.W., Kershaw Jr, J.A., Vanclay, J.K., 2011. Forest Growth andYield Modeling. John Wiley & Sons, Chichester, UK.
Westerling, A.L., Hidalgo, H.G., Cayan, D.R., Swetnam, T.W., 2006. Warming and earlierspring increase western U.S. forest wildfire activity. Science 313, 940–943.
Woodall, C.W., et al., 2009. An indicator of tree migration in forests of the eastern UnitedStates. For. Ecol. Manag. 257, 1434–1444.
Woods, A.J., Heppner, D., Kope, H.H., Burleigh, J., Maclauchlan, L., 2010. Forest healthand climate change: a British Columbia perspective. For. Chron. 86, 412–422.
A.S. Mathys et al. Ecological Modelling 384 (2018) 145–153
153