Embed Size (px)
Citation preview

1
Divergences in Long Run Trends
in the Prices of Energy and Energy Services1
Roger Fouquet
London School of Economics; Basque Centre for Climate Change (BC3); IKERBASQUE (Basque
Foundation for Science). Email: [email protected].
Fouquet, R. (2011) ‘Divergences in long run trends in the prices of energy and
energy services.’ Review of Environmental Economics and Policy 5(2) 196-218.
This article presents new evidence on very long run trends in the prices of energy and energy services,
such as heat, power, transport and light, using seven hundred years of data for the United Kingdom. The
article has two main findings. First, it shows that, in general, there was an upward trend in average
energy prices before the Industrial Revolution and a decline afterwards, which was associated with the
shift from traditional energy sources to fossil fuels. In the second half of the twentieth century, however,
average energy prices did rise, reflecting not so much rising resource scarcity as greater value to
consumers, as they shifted to energy sources that provided the desired services more efficiently.
Second, the article highlights the dangers of focussing on the price of energy rather than the price of
energy services when considering the long run. The price of energy ignores major technological
improvements and their benefits to the consumer. This failure to focus on energy services is likely to lead
to incorrect estimates of consumer responsiveness to changes in price and income. The article suggests
that the inclusion of service prices and consumption variables would lead to more reliable models of long
run energy demand and forecasts of carbon dioxide emissions.
JEL Classification: E31, N53, O33, Q21, Q32, Q41, Q55, R41
1 I am grateful to Charlie Kolstad, Suzy Leonard, Tanya O´Garra, Mikel González-Eguino and two
referees for helpful comments.

2
Introduction
Rapidly rising energy prices in the first decade of the twenty-first century have led many
economists to examine related long run trends (Maugeri 2009). After all, the oil shocks of the 1970s left a
scar on the global economy by constraining growth for more than a decade and creating major structural
changes (Hamilton 2011). Looking further back, the ability to meet the energy needs of a growing
population and economy without raising long run prices has been central to improving human well-being
since the Industrial Revolution (Allen 2009).
A long line of economists have tried to understand the interaction between the demand for and the
supply of resources and to anticipate their prices in the long run. Thomas Malthus’ (1798) predictions –
which many cite when referring to economics as the ‘dismal science’ – and later, David Ricardo´s (1817)
analysis, suggested that as population grew, diminishing returns would set in, demand would outstrip
supply, and renewable resources would become increasingly scarce. Non-renewable resource theory has
offered similarly “dismal” prospects, since prices were expected to rise through time (Hotelling 1931).
However, ever since the publication of Howard Barnett and Chandler Morse´s (1963) influential book,
Scarcity and Growth, economists have generally been able to present a less gloomy message: although
energy and resource prices may rise in the future, the empirical evidence does not indicate a long-run
trend of increasing prices in the past.
The message from economists became even more upbeat following the publication of William
Nordhaus´ (1996) study on lighting, which took account of technological improvements. He pointed out
that using energy prices rather than energy service prices dramatically underestimated the decline in the
cost of lighting and the ensuing welfare gains to consumers over the last two hundred years.
The Nordhaus study provided concrete evidence of an issue that had been identified but not
properly estimated: that energy consumption was driven by the desire for energy services, such as space
and water heating, powering of appliances and lights, and transportation (Goldemberg et al 1985). To

3
provide these services, it is necessary to combine energy with the appropriate technology, be it a hammer
with muscular strength, a harness with horse power, sails with the wind, or a train with steam, diesel or
electricity. When the efficiency of the technology improves, the price of the service falls, even if the price
of the energy itself remains unchanged (Howarth 1997, Haas et al 2008). While, in the short run, the
differences between the prices of energy and energy services may be minor, over several decades, a
century, or more, the divergences can be very large.
Fouquet (2008) offered more comprehensive evidence on the importance of energy services by
estimating long run trends in the prices and consumption of heating, power, transport and lighting. The
study did not, however, explicitly discuss whether the problem of focussing on energy prices (rather than
energy service prices) applies to all energy services. The purpose of this article is to explicitly address this
issue by comparing long run trends in energy prices and energy service prices from the fourteenth century
to the present day, in what was to become the United Kingdom, and examining the tendencies of these
prices to diverge. Thus, this article extends the analysis in Nordhaus (1996) to all main energy services in
order to determine whether the problem of underestimating the long run decline in energy prices is a
general problem rather than one that is specific to lighting.
This article is a contribution to the literature that values and relies on historical evidence and long
run trends for economic analysis and understanding (see Nunn (2009) for a broad review). In the eyes of
many economists, the 1970s oil shocks created a structural break that implied that prior evidence or trends
were irrelevant to current energy markets. Yet, past experiences of resource scarcity and abundance,
market concentration and competition, or energy transitions are likely to exhibit commonalities that offer
lessons for the future. Similarly, studying long run trends in energy prices (or other economic variables)
that reach back before the 1970s can help to identify behavioural patterns over waves of economic and
technological development (or over a set of structural breaks), something that is not possible when using
shorter run evidence. The point here is that to focus only on the experiences and trends in the last few
decades is to ignore a great deal of information that can be helpful to understanding future energy

4
markets, conducting research on climate change, and informing policy advice. For instance, the insights
offered by historical evidence lead this article to conclude that when trying to understand and anticipate
long run trends in energy use and forecast carbon dioxide emissions, energy prices and consumption are
not the most appropriate variables to use to reflect consumer decisions – the prices of energy services
should be used instead.
The next section presents theoretical expectations and empirical findings about trends in energy
prices. The following section discusses the sources for the data on the United Kingdom and briefly
explains the methodology for estimating energy service prices. The subsequent sections present trends in
the prices of heating fuels and heating, other energy services, and ‘average’ energy. These findings
provide the context for a brief comment on past and future long run trends in energy prices. The final
section summarizes the findings, reflects on the implications of divergent trends in energy and energy
service prices, and provides some suggestions for future theoretical, empirical, and policy analysis.
The Price Signal: Theoretical Expectations and Empirical Findings
Trends in prices generally reflect changing value or scarcity. It is helpful to briefly examine how
energy prices might be expected to trend over time, not to delve deeply into the theory of resource
extraction, but rather to build a bridge between the theory and empirical evidence on price trend
determination. Three cases are particularly useful to consider: unlimited resources, renewable resources,
and non-renewable resources.
Unlimited Resources
The first case is one in which resources are effectively unlimited – either because production is
very small relative to the size of the resource base or producers do not perceive their resources to be
finite. The individual producer´s decision, which does not consider intertemporal extraction problems, is

5
to increase production until marginal costs equal the price - the standard profit maximisation decision in a
perfectly competitive market. In the long run, the price that the producer faces will tend to stabilise at the
lowest long run average cost, because firms will enter the market if the price rises any further, thus
increasing supply (Varian 1992).
In a growing economy, demand will tend to rise over time. The change in price will be a function
of the ratio of the change in demand to the change in supply. With effectively unlimited resources, capital
and labour, increases in demand will eventually be met by an expanding supply, and prices would not be
expected to rise in the long run.
Improvements in production processes may drive down production costs, causing prices to fall to
the new lowest long run average cost. Consumption may increase in response to the declining pressure on
prices, but unless demand is perfectly elastic, prices will fall. A more long term downward pressure on
demand could be driven by improvements in the efficiency of consumption. Working against this pressure
would be possible rebound effects and general economic growth, as well as supply adjustments.
Nevertheless, in the case of perfectly elastic production and an effectively unlimited supply of resources,
prices might be expected to fluctuate around a series of downward steps.
Limited Renewable and Non-Renewable Resources
If resources are limited and renewable, producers will tend to extract resources to ensure that the
rate of growth in the production of the resource is equivalent to the discount rate – the opportunity cost of
not harvesting and selling resources. In a growing economy, it would be expected that demand would
eventually reach the limit at which resources can be renewed and profitably harvested. Then, as demand
continues to grow, increases in the resource stock and efficiency improvements in production (as well as
on the demand-side) would be necessary to avoid demand outstripping supply. Otherwise, prices would
be forced upwards (Fisher 1981).

6
For the case in which resources are non-renewable, Hotelling´s (1931) principle proposes that the
incentive (for the producer) is to extract more resources as long as the rate of increase in future expected
net prices (that is, price minus costs) is lower than the discount rate. Expectations of relatively low future
net prices will encourage additional extraction today and tend to put upward pressure on current
production and supply. Rapid exploitation today means future fuel reserves will be lower, driving up
expectations of future prices. If the expected annual rise in net prices becomes greater than the discount
rate, managers will have an incentive to invest in fuel reserves by keeping them as stocks. Because these
stocks are limited, Hotelling´s principle suggests that net real prices will rise through time (Livernois
2009).
The basic model of resource extraction has been extended to incorporate several important
variables: the costs of exploration and extraction (the basic model assumes zero costs); the costs of a
‘back-stop’ technology (providing a more expensive yet inelastic fuel substitute); either increasing or
decreasing marginal costs of extraction (because of greater difficulty in extracting the next unit and
varying resource quality or due to technological improvements); changes in the discount rate; increases in
reserves or in demand; market structure such as monopolies or cartels; and uncertainty about demand,
reserves or institutions (Krautkraemer 1998).
All of these extensions to the basic model alter the optimal rate of extraction. For example, a
‘back-stop’ technology provides the upper limit for the cheaper fuel’s price; lower costs of extraction will
lower the initial price, but raise the rate of growth in future prices; higher discount rates will have a
similar effect; new discoveries will reduce the price range, as well as the rate; new demand will have the
opposite effect; and monopolies are likely to reduce the rate of extraction, creating a higher initial price
with a lower eventual price. Thus, all of these factors will play a role in determining the price path, which
may be rising, downward-sloping or U-shaped (Farzin 1992).

7
Empirical Evidence
Numerous studies have examined the long run trends in commodity, resource and energy prices
to identify whether, over time, resources within a growing economy have become increasingly scarce.
Potter and Christy (1962) and then Barnett and Morse (1963) undertook the first systematic studies of
long run price trends by analysing the real average costs for a number of mineral, agricultural and
renewable resources in the USA between 1870 and 1957. They found that all but three of the prices had
remained constant or fallen. The findings of these initial surveys were corroborated by Nordhaus (1974).
Smith (1979), Slade (1982), and Berck and Roberts (1996) studied non-renewable resource price trends
over periods of more than one hundred years. More detailed statistical analyses have found that the trends
tend to vary according to the samples. For example, Pindyck (1999) investigated US oil, coal and natural
gas prices over 127 years and found that, while a U-shaped regression could explain trends up until the
1980s, it over-estimated the prices in the last fifteen years of the twentieth century. Adelman (1995)
analysed consumer oil prices over eighty years and crude prices over more than one hundred and thirty
years, and concluded that it was difficult to reconcile the evidence with the theory that oil is a limited
resource. Reviews of the literature have argued that the discoveries of new deposits, shorter-term market
volatility, technological progress in exploration and in use, as well as the development of substitutes,
imply that the finiteness of resources does not directly influence the economic scarcity of the commodity
(Krautkraemer 1998, Livernois 2009).
One could argue, however, that one hundred years is too short a period to test the theory of scarce
resources and identify whether energy prices increase over time. Despite the difficulties of creating a long
time series, and the consistency of values within the series, longer series have been built. Hausman (1995)
spliced consumer and producer price series to create a very long run series from 1450 to 1988. He found
no support for the view that fuel prices were rising over the very long run, and that when individual fuel
prices have risen, consumers have switched away from the more expensive fuel.

8
Fouquet and Pearson (2003) examined trends in individual fuel and average energy prices from
1500. They found that there was little evidence of systematic or substantial rises in individual fuel prices.
However, the twentieth century was characterised by an increase in the real average price of energy.
During this period, energy systems were dramatically altered, with large scale substitution towards more
expensive fuels. This transformation was reflected in the growing share of petroleum, gas and ultimately
electricity in final user expenditure on energy over the period. Fouquet and Pearson (2003) proposed that,
rather than being associated with rising scarcity, this price increase may have been due to the rising value
placed on these higher quality energy sources by consumers. To test this proposition and help identify the
influence of energy transitions, as well as technological developments, on energy costs to the consumer,
this article builds on Nordhaus´s (1996) study of improvements in lighting over hundreds of years in
order to estimate the long run trends in the prices of energy services and compare them with their
respective energy prices.
Data and Methodology
Identifying trends in the evolution of the cost of energy services requires statistical information
on fuel prices and efficiencies. Schools, colleges, hospitals and government departments around the
United Kingdom offer remarkable records of the history of the country’s agricultural and energy prices,
going back almost one thousand years (Rogers 1886, Beveridge 1926, Mitchell 1988). The dataset used
for Clark (2007) fills in the gaps and improves the data on the prices of coal and firewood back to the year
1300. The volumes of the History of the British Coal Industry (particularly Hatcher 1993, Flinn 1984, and
Church 1987) pull together most statistics on coal prices over the last 500 years. The Statistical Abstracts
of the British Parliamentary Papers and then of the Ministry of Fuel and Power provide data beginning in
the mid-nineteenth century, and were forerunners of the current DECC´s Digest of United Kingdom
Energy Statistics, which provides annual data on all energy sources.

9
In order to convert the prices (and consumption) of fuels into their equivalents in energy services,
they must be combined with the energy efficiency of the equipment used. For example, in the eighteenth
century, a tonne of coal could be placed in a traditional fireplace and burnt, generating around ten percent
of a tonne of coal in useful heat. With this data, and knowing that the price of one tonne of coal (in year
2000 values) was equal to £145, one can estimate the price of one tonne of coal equivalent of useful heat
to be about £1,450. By the 1950s, coal fireplaces were reaching efficiencies of nearly 30 percent. Thus at
£100 (in 2000 values) per tonne of coal, the price of the ‘useful’ heating from one tonne of coal was £300
– nearly five times cheaper. The efficiency of the main heating technologies in Britain over the last five
centuries can be found in Billington (1982) and Crowley (2004). This approach also applies to lighting,
and the efficiency estimates of key technologies presented in Nordhaus (1996) are used.
Thus, the cost of heating or lighting using any particular technology can be calculated by
multiplying the energy price by the efficiency. Next, for each of the principal technologies, a model of the
growth in its adoption and its share of the energy service market was developed based on evidence about
energy consumption (Fouquet 2008). Thus, by combining the share of the market with the cost for each
technology, a relatively reliable average heating or lighting price can be estimated, comparable across
various waves of technological development.
For power, considerable information about energy equipment (e.g. horses, mills, steam engines)
was available (Thompson 1976, Langdon 2005, Crafts 2004). The price (in pence per kWh) was
calculated by combining the energy requirements to generate one kWh (found in Smil (1994)) with the
energy prices (in £ (2000) per tonne of oil equivalent). For most of the twentieth century, the power (e.g.
electricity) price was already available (from the standard energy statistics sources mentioned above) and
thus did not need to be calculated.
Early transport prices were estimated directly by breaking down land into pence per km (Jackman
1960, Masschaele 1993). Mitchell (1988) and DoT (2002) provide data on freight and passenger transport
10
in the second-half of the nineteenth and twentieth centuries. For power and transport, some prices are
based on the energy costs of using equipment (e.g. horse- or steam-power and cars), while others are
based on the price charged to the customer (e.g. horse-drawn, railways and electricity), including network
and capital investments, and reflecting supplier market power. This means that power and transport price
trends may be biased downwards during the transition to new technologies whose estimates are based on
energy costs.
Thanks to the dataset in Allen (2007), the costs of using different fuels and producing services
are broadly comparable across time, and prices are quoted in real terms for the year 2000. Further details
about the principal sources and methods used to assemble the data series associated with fuel prices and
technologies can be found in Fouquet (2008).
Despite the relative richness of the data, they should be interpreted with caution. Especially for
the early centuries, the data have often been drawn from the records of institutions that bought fuel in the
South of England, and so are not representative of Britain as a whole. In addition, where woodfuel was
collected rather than bought (such as in rural areas), data do not exist. Where woodfuel was bought, price
trends reflect freight distances and local resource availability2. As markets became more integrated due to
improvements in freight transport, and as consumers switched from wood to coal (a commercial product
initially sold from the North-East), prices become more nationally representative.
In some cases, a war (such as the civil war of 1642-6 or the two World Wars) affects price
estimates. For a few exceptional years (a total of four over the 700 years in the time series) there are no
coal price data.3 For these four years, the data are interpolations based on information for previous and
later years. However, these estimates do not alter the long run trends in prices.
2 Indeed, evidence of high woodfuel prices in particular towns and villages caused much debate about the existence
of a national energy crisis in the seventeenth century – now it is interpreted more as a reflection of the high cost of
transporting non-local woodfuel (Nef 1926, Hatcher 1993). 3 One such year is 1926, when there was a miners´ strike.
11
There are valid concerns about the representativeness of the data, about their comparability over
time and across technologies, and about major disruptive events. Nonetheless, the data do provide a clear
indication of the costs of different energy services over the centuries, which can be compared to present
day costs. These trends identify differences in orders of magnitude over several decades or from one
technological revolution to the next, which reflect genuine changes in the prices of energy services. Thus,
the reader is advised to focus on these broader trends, rather than on individual year-to-year changes.
Trends in the Prices of Fuels and Heating
This section presents evidence concerning long-run trends in the prices of both heating fuels and the
heating services they provide.
Woodfuel and Coal Prices
Figure 1 offers some evidence on long run trends in the prices of woodfuel and coal, the fuels that
historically provided the heat in homes and for industries. Woodfuel prices reflected market pressures.
For example, in the fourteenth century, the rising population put major pressures on woodfuel supplies.
After the Black Death, and the dramatic decline in population, woodfuel prices fell. Prices started rising
as the population grew again in the sixteenth century. The experience of the 1300s suggests that woodfuel
prices would have risen much higher in the sixteenth century (above £300 in real terms) if there had not
also been a shift towards coal during this time period.
The evidence on average coal prices suggests a rising trend in coal prices between 1600 and
1800. However, this hides the fact that the price series is an aggregate of prices in different regions of
England. Thus it is helpful to investigate what lies beneath this rising trend, to understand whether it
reflects rising scarcity or other forces. Beginning in 1500, coal prices in the North of England stayed close
to £40 (in 2000 values) per tonne for three hundred years (Clark 2007). This series follows the pithead

12
price, providing an indicator of the long run marginal cost of production. Thus, there is no evidence of
rising marginal costs of production over hundreds of years4.
Figure 1. Woodfuel and Coal Prices in England (1300-2000)
Source: Fouquet (2008), Clark (2007), Allen (2007)
Woodfuel
Coal
The rising trend in the national average price of coal between 1600 and 1800 (see Figure 1) does
not appear to be due to scarcity. Instead, it results first from the growth in coal consumption in London
(which increases the weighting of the London price series where prices were highest), and second, from
the increase in consumer prices (i.e. for London and the rest of England), not pithead prices. The main
4 In addition to regional variability in prices, coal quality differed greatly. Unfortunately, there is little information
on the long run trends for different varieties of coal. If such data existed, a hedonic price model could be used to
estimate, for instance, changes in consumer willingness to pay for low-smoke coal, such as anthracite, which could
then be used as an indicator of past demand for environmental quality.

13
reason for this rise in consumer prices was the imposition of taxes on coal beginning in the late
seventeenth century. By the mid-eighteenth century, taxes accounted for a third of the consumer price
(Hausman 1987 p.592).Thus, consumer coal prices increased as consumption grew, reflecting the
government´s ability to capture some of the consumer surplus associated with a relatively inelastic
demand.
At times, there was upward pressure on coal prices, but supply adjusted to accommodate demand.
In fact, after 1800, coal prices tended to fall, as new regions began to exploit coal resources, helped by the
invention of the steam engine which could pump out the water mechanically from ever-deeper coal mines.
Thus, the evidence here suggests that it is unwise to accept a simple theory of long run coal prices that
proposes an upward rising trend.
Heating Fuel Prices and Household Heating Prices
Figure 2 presents trends in the average price of fuels used for heating as well as trends in the
average price of household heating (i.e., the service provided by the fuels). Average heating fuel prices
are weighted by consumer expenditures (i.e. price multiplied by consumption) on the fuels. For the
fourteenth and fifteenth centuries, the weightings for 1500 were used because no consumption data were
available. Estimates suggest that, at the time, woodfuel was responsible for 98% of heating expenditure
(Fouquet 2008). Thus, between 1300 and 1550, woodfuel prices dominated, while afterwards, coal prices
increasingly dominated.
The next two centuries were associated with the transition to coal. Since the price of coal was
roughly half the price of woodfuel, the switch implies a declining trend in average prices, despite a rising
average coal price. Woodfuel and coal consumption were believed to be similar at the beginning of the
seventeenth century – each roughly equivalent to 0.5 million tonnes of oil equivalent (mtoe) (Hatcher
1993, Warde 2007, Fouquet 2008). But coal consumption had increased to more than 2 mtoe by 1700 and
to around 13 tmoe by 1800 (providing over 90% of heating energy). By 1900, coal use for domestic and

14
industrial heating was about 70 mtoe. In 2000, natural gas met 80% of domestic heating requirements and
60% of industrial needs, and total heating energy consumption was roughly 80 mtoe (Fouquet 2008).
Figure 2. Prices of Energy for Heating and Price of Household Heating in England (1300-2000)*
Heating
Energy for
Heating
Source: Fouquet (2008), Clark (2007), Allen (2007) * Five-year averages
The trend in average household heating prices is indicated on the right-hand axis in Figure 2.
These prices are estimated by combining the prices of individual fuels with the efficiency of the relevant
technologies. The average price is calculated by weighting the individual heating prices by household
expenditures on the different methods of heating. The unit of measurement is an effective tonne of oil
equivalent – that is, the heat produced from one tonne of oil, using equipment that has an efficiency of

15
100 percent. Thus, the lower the efficiency, the higher is the price of household heating (for a given fuel
price).
The trends in the price of heating followed the peaks and troughs in the price of heating fuels
between 1300 and 1800. However, in order to shift to coal, the far cheaper fuel, consumers also had to
switch to a less efficient technology – from the hearth to the fireplace, which could expel the noxious coal
smoke more effectively. This implies that over this 500 year period, the price of fuels fell more than the
price of heating. Nevertheless, this shift in fuels and technology still enabled heating prices to fall, which
would not have been possible if consumers had continued to use woodfuels.5
In the nineteenth century, the efficiency of heating equipment started to improve greatly, thanks
to the widespread adoption of the Rumford fireplace (Crowley 2004). In the twentieth century, the
improvement in efficiency intensified, and ultimately led to the cleaner and highly efficient natural gas
and electricity central heating boilers (Billington 1982). After the introduction of the Clean Air Act in
1956, (town and natural) gas and electricity consumption grew rapidly, and coal declined swiftly. Despite
falling gas and electricity prices between 1950 and 1970, per unit of energy, electricity was still five times
more expensive than coal, and natural gas was double the coal price. So, over the period, average heating
fuel prices tripled and heating prices increased by an estimated 50%, reflecting the cost associated with
meeting environmental standards. Nevertheless, despite the rapid shift towards more expensive energy
sources, household heating prices were nearly three times lower in 2000 than in 1900, the quality of
heating improved, and local environmental standards were being met.
5 The switch in domestic heating technology, coupled with the regional differences in coal prices mentioned earlier,
were key catalysts for the Industrial Revolution (Allen 2009 pp.80-105). The dearth of local woodfuel near London
created a demand for coal from the North-East of England. The London market, as an international centre of trade
with higher incomes, was willing to pay a higher price for heating fuels, and drove the expansion of the coal
industry in the North-East. London also drove the associated technological development of chimneys, fireplaces and
grates to burn coal in homes. Once the coal-burning home was refined, households across Britain could switch to
coal, driving the expansion of coal mining in the West of England, Wales, and Scotland. Closer to the pits, however,
the price of coal as a source of energy was very low (by international standards). Thus, in the eighteenth century,
after the invention and development of the coke-iron furnace, Western England had access to cheap coal for
smelting local iron, as well as for driving steam engines to spin cotton, and became the cradle of the Industrial
Revolution.
16
Just as Nordhaus (1996) found for lighting, in the long run, the price of the heating service fell far
more than the price of the energy source. In fact, in the case of heating, the average energy price actually
rose substantially, while heating prices only increased briefly following the introduction of environmental
legislation. Thus, together, the evidence makes a strong case for focussing on the service rather than on
the fuels.
Trends in the Prices of Energy and Energy Services
In this section, the prices of energy services other than heating (i.e., power, transport and lighting) are
examined and their long run price trends are compared with those for their related energy sources.
Power
Until the Industrial Revolution, animals, particularly horses, provided around 70 percent of all the
power needs in Britain (Fouquet 2008). The supply of energy (i.e., provender) for horses depended on
agriculture. During the sixteenth century, the prices of horse provender (i.e. a combination of hay, oats
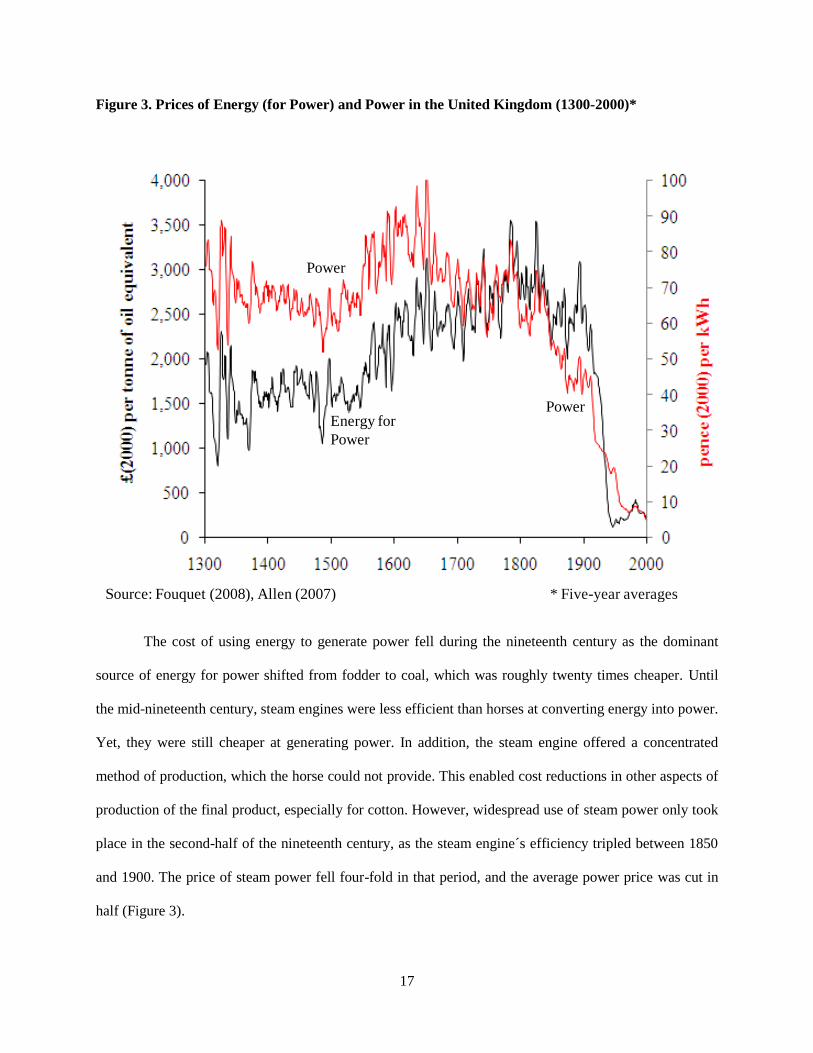
and peas) rose rapidly. Figure 3 (left-hand axis) reflects this rising trend in the prices of energy for power,
which was caused by the increased crops required to feed the growing populations of humans and
animals6.
The price of power (i.e., the energy service, shown on the right-hand axis) rose rapidly in the
sixteenth century, as the economy grew. From the mid-seventeenth century, the price of power (i.e. the
cost of using animals) started declining as better horse-breeding led to more efficient animals working the
land and in industry (Edwards 1988).
6 Here, human power and its related food requirements have been removed from the energy and power price series.
This is because humans provided around one-fifth of the power needs before the Industrial Revolution and also
supplied human capital, which was reflected in the wages and heavily distorted the average price of energy and
power. The costs of wind and water power, which provided around one-tenth of the power, are also not included
because of the difficulty in measuring them (see Fouquet (2008)).
17
Figure 3. Prices of Energy (for Power) and Power in the United Kingdom (1300-2000)*
Energy for
Power
Power
Power
* Five-year averagesSource: Fouquet (2008), Allen (2007)
The cost of using energy to generate power fell during the nineteenth century as the dominant
source of energy for power shifted from fodder to coal, which was roughly twenty times cheaper. Until
the mid-nineteenth century, steam engines were less efficient than horses at converting energy into power.
Yet, they were still cheaper at generating power. In addition, the steam engine offered a concentrated
method of production, which the horse could not provide. This enabled cost reductions in other aspects of
production of the final product, especially for cotton. However, widespread use of steam power only took
place in the second-half of the nineteenth century, as the steam engine´s efficiency tripled between 1850
and 1900. The price of steam power fell four-fold in that period, and the average power price was cut in
half (Figure 3).

18
Surprisingly, during the first half of the twentieth century, the average price of energy fell faster
than the price of the service. The principal explanation for this phenomenon is a technical one. Animals
still played a role in generating power at the beginning of the twentieth century. However, given their
inefficiency at converting energy into power, expenditure on provender was great (relative to animals’
share of power provision), which heavily weights the fuel price series, but not the power series - horses in
agriculture accounted for 60% of all expenditure on energy for power and 35% of all expenditure on
power in 19007. Following the First World War, the role of animals in power provision declined
significantly and had effectively disappeared by the mid-twentieth century. However, in the second half
of the twentieth century, this trend was reversed, with rising dependence on more expensive energy
sources (i.e., petroleum, then natural gas) for power generation, but cheaper electricity.
When examined over the period from 1700 (before the diffusion of the steam engine) to 2000, the
price of power fell more (a 16-fold decrease) than the price of the fuel (a 13-fold decrease)8. Both the
shorter and longer trends support Nordhaus´s (1996) view that it is necessary to focus on the services the
commodity provides rather than on the commodity itself. From the seventeenth century onwards, the
trends in the price of energy used for power and the price of power have been distinct. Moreover, in the
long run, using the former when it is the latter that drives the demand for power and the associated energy
is likely to lead to a misunderstanding of consumer responses.
7 Kander and Warde (2011) provide confirmation of these high energy needs.
8 When examining these trends, it is important to recall the procedure used here for estimating prices of energy
services. The prices of power from horses were measured by the costs of using them. This was the annualised cost of
using a horse (mostly provender and maintenance) divided by an estimate of the power generated in one year. For
steam engines, which dominated at the end of nineteenth century, similar annualised costs were estimated. For both
horses and steam engines, the exclusion of capital costs underestimates the full cost of generating power – but, only
by about 10 percent to 20 percent. For electricity, however, the price faced by the consumer was used. This price
includes the profits to the electricity producer and supplier, and the taxes imposed, as well as the costs of
maintaining reserve capacity and a complex supply network, and inefficiencies in distribution.

19
Freight and Passenger Transport
For transport, the long run trends in the prices of energy and freight services (see Figure 4)
diverge even more than they do for energy (for power) and power. Looking at the left-axis, we can see
that the price of energy for transport (fodder until the mid-nineteenth century, coal until the mid-twentieth
century, and then oil) followed a trend that is similar to the trend in the price of energy for power.
However, turning to the right axis, the price of transport services was dependent not only on the costs of
the fuel, but also on the quality of the transport infrastructure and network, whose declining quality
explains much of the rise in the prices of transport services in the sixteenth and seventeenth centuries.
This decline in quality resulted from the growing use of heavier and more damaging four-wheeled
wagons and the fact that, after King Henry VIII´s religious reformation and his dissolution of catholic
churches, there was an institutional vacuum associated with maintaining roads (Jackman 1960). Once
turnpikes (i.e. privately-provided public goods) were introduced more than a century later, quality
improved and prices fell. Prices fell further after the introduction of railways, and they have continued to
fall in the twentieth century.
Even though there was not a downward trend in energy prices (increasingly associated with oil)
in the second-half of the twentieth century, improvements in vehicle efficiency implied cheaper freight
transport services. Just as for heating and power, consumers experienced declining trends in the cost of
the service, despite rising or flat trends in energy prices. Once again, it would be misleading to use the
latter to study long run transport demand, and its related fuel consumption.
Data for passenger transport prices are only available starting at the beginning of the eighteenth
century, and follow a course that is similar to the trends for freight transport – a divergence in energy and
service prices appears, implying the same risk of using the wrong variables for analysing passenger
transport services.

20
Figure 4. Prices of Energy (for Freight Transport) and Freight Transport in the United Kingdom
(1300-2000)*
Energy for
Freight
Transport
Freight
Transport
Freight
Transport
* Five-year averagesSource: Fouquet (2008), Allen (2007)
Lighting
Looking at lighting, the price of energy declined from the fourteenth to the sixteenth century, as
the main source (tallow or animal fat) was relatively abundant (see Figure 5, left axis). The price then
stabilised and rose a little, as the growth in demand for lighting was greater than the increase in supply.
By the nineteenth century, new fuels (town gas, kerosene, and then electricity) were being used. At the
beginning of the transition, in the 1820s, town gas was more expensive per unit of energy than tallow
candles (averaging more than £3,000 (in 2000 values) and about £2,000 (in 2000 values) per tonne of oil
equivalent, respectively). Yet town gas lighting technology was twice as efficient at converting the fuel

21
into lighting as tallow candles. By 1850, town gas was half the price of tallow candles, per unit of energy,
and far more efficient.
Figure 5. Prices of Energy (for Lighting) and Lighting in the United Kingdom (1300-2000)*
Energy for
Lighting
Lighting
* Five-year averagesSource: Fouquet (2008), Allen (2007)**1 million lumen-hours is equivalent to
100 watt bulb burning for 100 hours
The growth of these other new energy sources was also associated with rapid declines in their
prices (see Figure 6). In the second half of the nineteenth century, kerosene, produced by refining crude
petroleum, was used for lighting, especially in poorer households, because of the low capital costs of
investing in oil lamps (compared with installing gas pipes and lamps). There was great volatility in the
beginning, but by 1900 the price of oil had fallen six fold and remained comparatively stable for more
than 50 years (Hamilton 2011). Like coal for heating in the seventeenth and eighteenth century, the strong
dependence on oil for transportation has led the British government to rapidly increase the tax rate over

22
the last twenty years – in 2000, three-quarters of the price of gasoline was revenue for the government
(Sterner 2007) - and the trend in prices reflects this process, rather than providing clear evidence of
growing long run resource scarcity. So, while many have focused on the volatility in petroleum prices in
the last few decades, and the signs of short run supply shortages associated mostly with political
disturbances, the history of petroleum has been (to a great extent) one of declining and then stable prices
with occasional peaks.
Figure 6. Prices of New Energy Sources in the United Kingdom (1820-2008)
Petroleum
ElectricityTown
Gas
Natural
Gas
Petroleum
Source: Fouquet (2008), Allen (2007)
In 1900, when electricity began to replace town gas (and kerosene) for lighting, it cost twenty-
five times more per unit of energy (electricity cost £10,000 (in 2000 values) per tonne of oil equivalent

23
and gas cost £390 (in 2000 values) per tonne of oil equivalent). At the time, electric lighting was seven
times more efficient. This means that at first, electric lighting was more expensive than gas lighting.
Nevertheless, it was still used in luxury homes, restaurants and theatres, where the novelty of the new
technology was highly valued (Schivelbusch 1988). By 1930, when a rapid switch was occurring,
electricity was still five times as expensive as gas, but electric lighting was ten times more efficient. Thus,
in the nineteenth and twentieth centuries, there was a shift to costlier fuels but cheaper lighting (Figure 5,
right-hand axis). The average price of energy for lighting hardly fell in the twentieth century, despite
rapid declines in the price of lighting (from £250 (in 2000 values) per million lumen-hours in 1900 to £15
(in 2000 values) in 1950 to £2 (in 2000 values) in 2000). Moreover, the increases in energy consumption
were far greater than the efficiency improvements (Fouquet and Pearson 2006). Thus, again, it would be
misleading to use energy prices rather than the price of energy services as a guide to understanding
energy demand and consumption.
Trends in the Average Prices of Energy and Energy Services
Given that energy is often discussed in its broadest terms, it is useful to examine and compare an
average price of energy and an average price of energy services. There are not sufficient data on
expenditure to complete full average price series back to 1300. Instead, the average prices of energy and
energy services associated with heat and power are presented (see Figure 7). The full average price of
energy and its related services can be examined beginning in 1700, when data on transport and lighting
expenditure became available (see Figure 8).
Over the very long run (see Figure 7), the broad trends for energy and service prices are similar: a
rising price for both energy and its services and then a declining price. This reflects the growing pressure
on land, as the population and the economy were growing in the early modern era, and then, in large part,

24
the transition from renewable sources of energy to fossil fuels – woodfuels to coal for heating and
especially provender to coal for power.
Figure 7. Average Prices of Energy and Energy Services (Heating and Power) in the United
Kingdom (1300-2000)*
Energy Services
(Heat and Power)
Energy
(Heat and Power)
* Five-year averagesSource: Fouquet (2008), Allen (2007)
However, the declines in the prices of energy and energy services began at different times. For
energy prices, the decline occurred at the beginning of the nineteenth century with the increased use of the
steam engine. The average series for energy in Figure 7 is heavily dominated by the price of power fuels
until the second half of the nineteenth century, as provender (as well as food and water power, which are
not included here) was replaced by cheaper coal. For heating and power services, there have also been

25
considerable improvements in energy efficiency since the Industrial Revolution, possibly triggered by
rising trends in energy prices. Yet, Figure 7 shows that the decline in the price of energy services began in
the mid-seventeenth century – when more efficient horses were being used. At the same time (but not
shown in Figure 7), transport services were also improving. Thus, within the confines of the renewable
energy system, there were attempts to resolve the problems posed by growing demands for resources.
Figure 8. Average Prices of Energy and Energy Services in the United Kingdom (1700-2008)
Energy
Energy Services
Source: Fouquet (2008), Allen (2007)
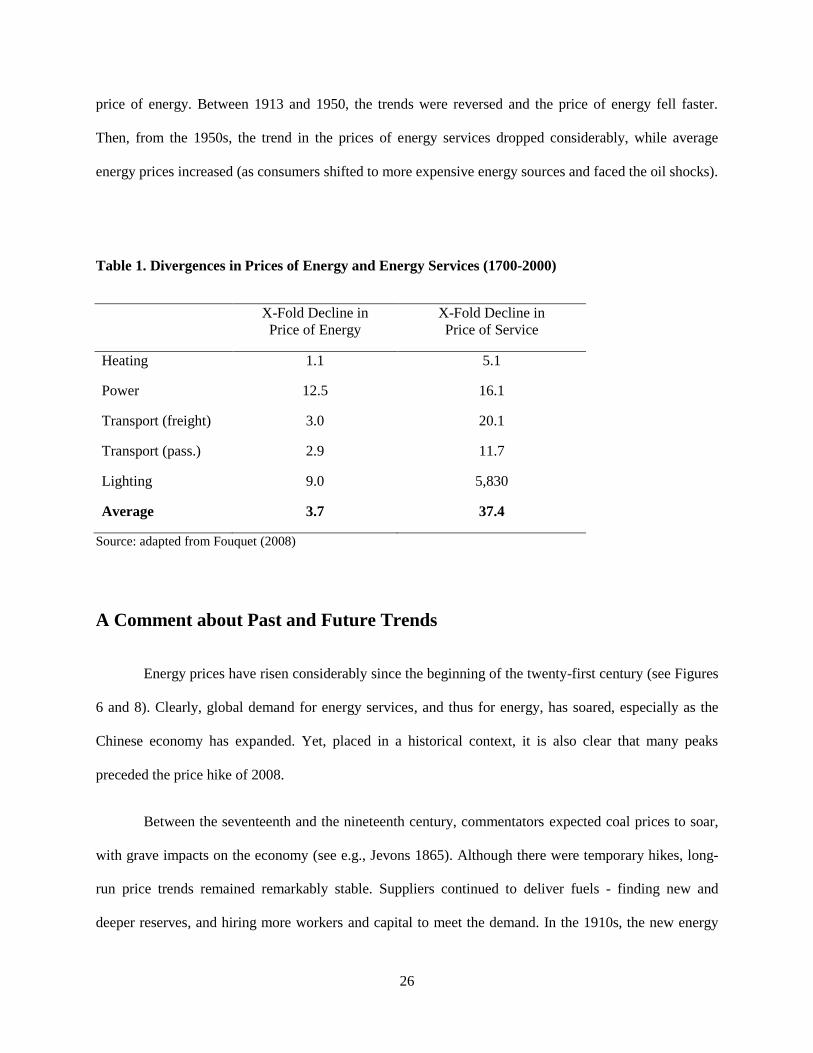
However, differences in the trends in the prices of energy and energy services are particularly
apparent since the Industrial Revolution and when the transport and lighting series are included (see
Figure 8 and Table 1). From 1760 to 1913, the average price of energy services fell much faster than the
26
price of energy. Between 1913 and 1950, the trends were reversed and the price of energy fell faster.
Then, from the 1950s, the trend in the prices of energy services dropped considerably, while average
energy prices increased (as consumers shifted to more expensive energy sources and faced the oil shocks).
Table 1. Divergences in Prices of Energy and Energy Services (1700-2000)
X-Fold Decline in
Price of Energy
X-Fold Decline in
Price of Service
Heating 1.1 5.1
Power 12.5 16.1
Transport (freight) 3.0 20.1
Transport (pass.) 2.9 11.7
Lighting 9.0 5,830
Average 3.7 37.4
Source: adapted from Fouquet (2008)
A Comment about Past and Future Trends
Energy prices have risen considerably since the beginning of the twenty-first century (see Figures
6 and 8). Clearly, global demand for energy services, and thus for energy, has soared, especially as the
Chinese economy has expanded. Yet, placed in a historical context, it is also clear that many peaks
preceded the price hike of 2008.
Between the seventeenth and the nineteenth century, commentators expected coal prices to soar,
with grave impacts on the economy (see e.g., Jevons 1865). Although there were temporary hikes, long-
run price trends remained remarkably stable. Suppliers continued to deliver fuels - finding new and
deeper reserves, and hiring more workers and capital to meet the demand. In the 1910s, the new energy

27
sources, petroleum and electricity, temporarily struggled to meet the rapidly increasing demand for
personal transport, power and lighting. Prices peaked, and in response, suppliers expanded petroleum and
electricity capacity to meet the new needs. Similarly, in the 1970s, observers feared permanently higher
energy prices (see e.g., Hamilton 2011). Yet, starting in the mid-1980s, nearly twenty years of low energy
prices followed - even for oil, the prices were equivalent to the average over the previous one hundred
years, despite having been heavily taxed. Thus, despite the many peaks in the past, markets adjusted.
Suppliers found new reserves and built greater infrastructure, and consumers, where possible, reduced
waste, increased efficiency, and shifted to cheaper sources. As a result, long run trends in individual
prices continued a relatively stable and slightly downward trend.
Based on this historical context, it is tempting to conclude that the future trend in individual
prices will be generally downwards, although peaks can be expected. The global recession is allowing
energy producers and suppliers time to expand reserves and infrastructure. Iraqi and Brazilian oil fields
may help (Maugeri 2009), and greater expansion of Russian and North African natural gas reserves will,
no doubt, also assist. In addition, the development of technologies aimed at tapping unconventional
natural gas reserves at low cost implies very large fossil fuel reserves (Stevens 2010).
In 2009, the current global primary modern (i.e., fossil fuel and primary electricity) energy
consumption was a little more than 11,000 mtoe (BP 2010). One estimate of global fossil fuel reserves is
close to 30 million mtoe (Rogner 2000 p.168). This is nearly 2,500 times the current annual global
primary energy consumption. Unconventional natural gas reserves are particularly important – roughly 80
percent of the total. But, even for oil reserves alone, the estimate is more than 450 times current annual
global oil consumption. Thus, even allowing for economic and population growth, fossil fuels are clearly
abundant, making the spectre of dwindling fossil fuel reserves unlikely (at least for a very long time).
Another phase of scarcity passed in 2010, as the global economy began to recover from the
recession, and a new period of relative abundance probably lies ahead – at least for a few years. This will

28
help boost growth around the world, which will generate greater demand for energy services and energy,
causing another phase of scarcity to ensue. Thus, it is tempting to expect, in the long run, cycles of
scarcity and abundance, along a slightly downward trend (Fouquet 2008).
Might the current process of internalising the external costs of carbon alter this expected trend?
The process of internalizing these costs will probably be a once-and-for-all shift, unless marginal damage
continues to increase. Thus, it seems appropriate to expect an upward rise in individual prices of energy,
especially sources with higher carbon contents. Both suppliers and consumers will respond and adjust by
favouring low carbon energy sources. This will in turn put downward pressure on high-carbon energy
prices and upward pressure on low-carbon energy prices. Finally, it is tempting to conclude that these
shifts and responses concerning carbon sources will occur within the context of long run prices of energy
declining gradually and long run prices of energy services declining faster.
Conclusions
The purpose of this paper has been to present evidence on trends in the prices of energy and
energy services from the fourteenth century to the present day, in what is now the United Kingdom, and
to examine the divergences in these two types of prices. This evidence has helped assess whether the
problem of incorrectly using long run price variables was related only to lighting or, more generally, to all
energy services.
There are inevitably questions about the reliability and accuracy of historical data. Some might
question the validity of creating a single price series for fuels, energy and associated services over such a
long period because of the inevitable geographical and measurement inconsistencies across data sources
(Hatcher 1993). Nevertheless, such price series clearly do provide an indication of the costs of heating a
home in the sixteenth century, lifting a tonne of grain in the seventeenth century, travelling to London in

29
the eighteenth century or illuminating a room in the nineteenth century, and enables us to compare them
with the equivalent costs at the beginning of the twenty-first century. Furthermore, given the nature of the
data and the findings, it is important for the reader to identify and examine trends and changes in orders of
magnitude rather than focus on prices in individual years.
Diverging Trends
The broad trend in British energy prices and their energy services over the last seven hundred
years was first upwards, as the expanding economy faced increasing pressures from its consumption of
mostly limited renewable energy resources, and then downwards, especially as fossil fuels replaced them
(see Figure 7).
Woodfuel prices in the 1300s and in the 1600s suggest rising population pressures led to higher
prices (see Figure 1). Similarly, the prices of fuels for power and transport (i.e., the provender for horses)
had been rising up to 1800, reflecting the growing pressure on land and, thus, agricultural products and
the lack of large-scale substitutes (see Figures 3 and 4). It appears that economic growth that was driven
by renewable energy sources resulted in higher energy prices – although it did not become an economy-
wide energy crisis as suggested by Nef (1926)9. In fact, it appears that there were attempts to find
solutions (e.g., better horse management and turnpikes) within the confines of the renewable energy
system and these appear to have lowered certain energy service prices from the seventeenth century on.
Yet, it is likely that without the switch to fossil fuels, economic growth in the United Kingdom (and
possibly many other economies) would have been severely constrained, the country would have faced
further increases in average energy and service prices, and the Industrial Revolution might not have
occurred (Allen 2009).
A key aspect of the transformations that took place during the nineteenth century was the
innovation, development or expansion of markets for a whole series of new energy sources and
9 Of course, these experiences in Britain – a small, densely populated island - do not imply that all economic growth
that depends on renewable resources is destined to suffer increasingly higher prices (Allen 2009, Fouquet 2011a).

30
technologies, enabling substitution and improved efficiency - possibly driven by rising agricultural and
renewable energy prices. The price of those new energy sources fell dramatically (see Figure 6) and have
continued to fall or have been stable, until recently. In the case of oil, just like coal in the seventeenth and
eighteenth century, the rising trend after the oil shocks in the 1970s was mostly due to increasing taxation.
Thus, the trends (and the explanations underlying them) in the United Kingdom over the last five hundred
years corroborates earlier studies (Adelman 1995, Livernois 2009), suggesting that, at least in the eyes of
the market, fossil fuel resources have so far been perceived to be `unlimited´.
The tendency to substitute energy sources towards cheaper or more valued energy services has
also had a strong influence on average energy prices (Fouquet 2010). In many cases, this has encouraged
substitution towards cheaper energy sources (such as the transition to coal). This implies that, even if
individual fuel prices may rise in the long run (and there is little evidence to support this for fossil fuels),
average energy prices will tend to fall. However, as in the case of the transition away from coal towards
gas, oil and electricity, this implies switching to more expensive energy sources and a rise in average
energy prices. Thus, energy transitions can either lower or raise average energy prices (depending on the
nature of the energy sources and technologies involved), but this occurs within the context of mostly
declining or stable individual energy prices.
Especially since Potter and Christy (1962) and Barnett and Morse (1963), economists have sought
to understand long run energy price trends and the forces driving them. Most studies of long run price
trends have been able to construct series of around 100 years, which should capture the impact of one or
two major technological developments. However, the ability to study longer run series raises the issue of
what variable should be of interest. For lighting, it was shown that, due to major innovation in the
efficiency of the consumption technology, the price of energy and of the service diverged considerably
(Nordhaus 1996). While the very broad trends in the prices of energy services are similar to their
respective energy prices (upwards then downwards), especially since the Industrial Revolution, this

31
analysis has found that their trends have diverged (see Figure 8). In other words, although lighting was
the most dramatic example (see Figure 5), the divergence is general rather than specific to lighting.
The last two hundred and fifty years has been a period of historically exceptional technological
innovation. The cost of generating services has changed greatly, not only as a result of changes in the
price of the resources, but also from the ability to use those resources more efficiently. In fact, in the case
of heating, power and transport in the second-half of the twentieth century, the average energy price was
rising, while the price of the service was rising only briefly, stable or falling due to the substitution of new
fuels that used more efficient technology – here the rising average energy price indicated not so much that
resources were increasingly scarce, but rather that consumers placed a higher value on the new fuels.
As discussed below, the tendency for economists to focus exclusively on long run trends in
energy prices could be responsible for misleading conclusions concerning consumer price indices, energy
markets, and climate policy, and reveals the need to improve our understanding of the long run forces that
drive energy service prices.
Theoretical Implications
Given the importance of long run trends in energy service prices and their divergence from long
run trends in their respective energy prices, it would be useful to develop a richer theoretical
understanding of why the long run price of energy services might be expected to decline. The current
study is not the place for such an analysis. It can only offer the following basic and simplified arguments
and implications. First, markets behave as if fossil fuel resources are unlimited, implying stable or even
declining long run individual energy prices (Adelman 1995, Livernois 2009). Second, markets for energy-
using equipment seek to improve efficiency, especially when spurred by short run energy price increases
(Fouquet 2008). Third, generally, the price of the service is the price of the fuel multiplied by the amount
of energy required to produce one unit of the service (Nordhaus 1996), with the former being stable or
declining and the latter declining. So, for any particular source and equipment combination, the medium
32
run trend in the price of energy services is downwards, and is especially pronounced shortly (perhaps a
decade) after a temporary individual energy price rise.
Fourth, a full energy transition only tends to occur when the new source and technology
combination result in a lower price for the service (Fouquet 2010). At the beginning of a transition, early
adopters may be willing to pay more for the additional attributes associated with the new source and
equipment combination, but the majority of consumers are likely to adopt and make the transition only
with lower service prices. Consequently, the average price of the energy service may be flat or even
slightly rising at the beginning of the transition (such as during the introduction of fireplaces, central
heating and steam engines). However, both because equipment manufacturers will seek to improve
efficiency (i.e. the second argument) and because a full transition will take place only if service prices fall
(i.e. the fourth argument), the long run price trend in energy services can be expected to decline.
Empirical Implications
Although in the long run, the price of energy and the price of energy services have diverged
significantly and can be expected to diverge in the future, economists still use commodity price series
rather than those for services, even when considering long run issues, mostly because of a lack of data.
This reliance on commodity prices may also be due to a lack of appreciation of the implication of not
using energy service prices.
Divergences between trends in the prices of energy and their related services have major
implications for the process of studying long run trends in energy markets and climate change. First, as
Nordhaus (1996) pointed out, focussing on energy prices in the long run dramatically underestimates the
welfare gains to the consumer and should affect traditional measures of the overall consumer price index.
The data examined here indicate that, in the long run, people have also been able to heat their homes,
push and pull objects, and move people and goods, as well as light their homes, far more cheaply than a
simple examination of the consumer price index would suggest. These services have radically altered
33
people’s lives. This evidence further supports the argument that we need to alter the way consumer price
indices are measured.
Second, there are important implications if the correct consumer price index in the past is lower
than originally thought and if it is also likely to be lower in the future than previously expected. One
implication is the interesting debate about the values of future environmental resources for assessing the
scale of damages that will be caused by climate change (Sterner and Persson 2008). The values will
depend, in part, on the relative (shadow) prices of those resources. Given that energy service prices and,
thus, to some extent, overall consumer price indices are likely to be lower in the future than might be
expected, the prices of environmental resources will probably be relatively higher. Thus, a better
understanding of long run prices is important for this debate.
Third, as a result of the radical price decreases, the incentive has been for the economy and
society to become more heat-, transport- and light-intensive in particular (see Table 1). Looking forward,
while more research is needed to ascertain whether heating and power prices will fall, we can anticipate
substantial further improvements in transport and lighting efficiency. Thus, the global economy is likely
to become even more mobile and dependent on lighting. This obviously has major implications for both
energy markets and climate change.
Fourth, building on this last point, modellers need to try to estimate the income and price
elasticity of the demand for heat, power, transport and light, as these drive the behaviour associated with
energy consumption and greenhouse gas emissions.10
After all, focussing only on energy rather than
energy services will produce misleading estimates of consumer responses to long run income, price and
efficiency changes.
Models of energy use and forecasts of greenhouse gas emissions have often been based on the
relationship between energy use, GDP growth, and fuel prices. Because of the lack of data and possibly
10
Until now, transport is the only service for which elasticities have been estimated (Small and Van Dender 2007).

34
the lack of awareness about the implications, energy service demand has been ignored. However, better
insights into future fuel use and emissions might come from understanding the two-stage relationship
between: (i) energy consumption, energy technologies and delivered energy services; (ii) and energy
service consumption, GDP growth and the prices of energy services. Inclusion of energy services in
models should improve our understanding of energy markets in both industrialised and developing
economies (Howarth 1997, Haas et al 2008).
Policy Implications
Historically, government decisions have, at times, considerably influenced the evolution of
energy markets (such as coal taxes in the eighteenth century) or their associated services (such as the
Reformation and its impact on roads). In addition to being aware of the long run impacts of their
decisions, it is important for governments to appreciate the difference between markets for energy and
markets for related services, and to consider how to decouple energy from its services. This would ensure
more carefully directed policies and, even though short-term fears about energy price hikes often have to
be appeased, help governments to develop long run strategies that meet the need for ‘sustainable’
services.
Furthermore, while the figures in this article identify long run trends in private marginal costs,
they ignore the external costs. For example, in the sixteenth century, the adoption of chimneys in
buildings allowed residents to externalise smoke and, thus, make the transition to cheaper, but more
polluting, coal. By the end of the nineteenth century, the accumulation of smoke emissions on cold,
windless days in British cities was responsible for externalising an estimated 70% of the social costs of
coal production and consumption, and imposing damages equivalent to 17.5% of GDP (Brimblecombe
1988, Fouquet 2011b). Thus, price evidence tells us little about trends in full social costs.
Similarly, persistently declining energy service prices (along with growing populations and
economies) have dramatically increased greenhouse gas emissions over the last two centuries, which are

35
now imposing costs associated with climate change (Tol 2002, Aroonruengsawat and Auffhammer 2010).
Governments need to appreciate that markets will be encouraged to consume more services, possibly
imposing very high external costs in the future.
Some might suggest that the current global economy is facing pressures on the atmosphere
similar to those experienced by the United Kingdom’s eighteenth century economy with respect to land.
The Industrial Revolution may have been triggered, in part, by rising long run energy and energy service
prices. The difference now, however, is that energy and energy service prices fail to signal atmospheric
scarcity. Instead, the economy is depending on governments to provide the correct signal to trigger a low-
carbon industrial revolution.
References
Adelman, M.A. 1995. Trends in the price and supply of oil. In The State of Humanity, J.L. Simon, ed..
Oxford: Basil Blackwell.
Allen, R.C. 2007. Pessimism Preserved: Real Wages in the British Industrial Revolution. Economics
Series Working Papers 314. University of Oxford. Department of Economics.
http://www.nuffield.ox.ac.uk/General/Members/allen.aspx
Allen, R.C. 2009. The British Industrial Revolution in Global Perspective. Cambridge: Cambridge
University Press.
Aroonruengsawat, A. and M. Auffhammer. 2010. ‘Impacts of Climate Change on Residential Electricity
Consumption: Evidence from Billing Data’ In Climate Change Past and Present: Uncertainty and
Adaptation. eds. G. Libecap and R.H. Steckel. Chicago. University of Chicago Press.

36
Barnett, H.J. and C. Morse .1963. Scarcity and Growth: The Economics of Natural Resource Scarcity.
Washington DC: Resources for the Future.
Beveridge, W. 1894. Prices and Wages in England: From the Twelfth to the Nineteenth Century. London:
Longmans, Green and Co.
Berck, P. and M. Roberts. 1996. Natural resource prices: will they ever turn up? Journal of
Environmental Economics and Management. 31(1): 65–78.
Billington, N.S. 1982. Building Services Engineering: a Review of its Development. Pergamon. London.
BP. 2010. BP Statistical Review of World Energy. London: BP.
Brimblecombe, P. 1987. The Big Smoke: A History of Air Pollution in London Since Medieval Times.
London. Methuen.
Church, R. (1987) The History of the British Coal Industry. Vol 3. 1830–1913. Clarendon Press. Oxford.
Clark, G. 2007. The long march of history: Farm wages, population, and economic growth, England
1209-1869. Economic History Review 60(1): 97-135.
Crafts, N.F.R. 2004. ‘Steam as a general purpose technology: a growth accounting perspective.’ The
Economic Journal 114(3).
Crowley, J.E. 2004. The Invention of Comfort: Sensibilities and Design in Early Modern Britain and
Early America. London: John Hopkins University Press.
DoT. 2002. GB Transport Statistics. HMSO. London.
Edwards, P.R. (1988) The Horse Trade in Tudor and Stuart England. Cambridge: Cambridge University
Press.

37
Farzin, Y.H. 1992. The time path of scarcity rent in the theory of exhaustible resource. The Economic
Journal. 102(4): 812–30.
Fisher, A.C. 1981. Resource and Environmental Economics. Cambridge: Cambridge University Press.
Flinn M.W. 1984. The History of the British Coal Industry. Vol 2. 1700-1830. Oxford: Clarendon Press.
Fouquet, R. 2008. Heat Power and Light: Revolutions in Energy Services. Cheltenham and Northampton,
MA, USA: Edward Elgar Publications.
Fouquet, R. 2010. The Slow Search for Solutions: Lessons from Historical Energy Transitions by Sector
and Service. Energy Policy. 38(10) 6586-96.
Fouquet, R. 2011a. ‘The Sustainability of `Sustainable´ Energy Use: Historical Evidence on the
Relationship between Economic Growth and Renewable Energy’ In I. Galarraga, M. González-Eguino
and A. Markandya. eds. Handbook of Sustainable Use of Energy. Edward Elgar Publications.
Cheltenham, UK, and Northampton, MA, USA.
Fouquet, R. 2011b. Long Run Dynamics of Energy-Related External Costs. BC3 Working Paper Series
2011-01. Basque Centre for Climate Change (BC3). Bilbao, Spain.
Fouquet, R. and P.J.G. Pearson. 2003. Five Centuries of Energy Prices. World Economics. 4(3): 93-119.
Fouquet, R. and P.J.G. Pearson. 2006. Long Run Trends in Energy Services: The Price and Use of
Lighting in the United Kingdom, 1300-2000. The Energy Journal. 25(1): 139-77.
Goldemberg, J., T.B. Johansson, A.K.N. Reddy and R.H. Williams. 1985. An End Use Oriented Energy
Strategy. Annual Review of Energy and the Environment. 10: 613-688.
Haas, R., N. Nakicenovic, A. Ajanovic. 2008. Towards sustainability of energy systems: A primer on how
to apply the concept of energy services to identify necessary trends and policies. Energy Policy. 36(11):
4012-4021.
38
Hamilton, J.D. Historical Oil Shocks. NBER Working Paper 16790. National Bureau of Economic
Research. Cambridge, MA.
Hatcher, J. 1993. The History of the British Coal Industry. Volume I. Oxford: Clarendon Press.
Hausman, W.J. 1987. The English Coastal Coal Trade, 1691-1910: How Rapid was Productivity Growth?
Economic History Review 40: 588-96.
Hausman, W.J. 1995. Long-term trends in energy prices. In The State of Humanity, ed. Simon, J.L.
Oxford: Basil Blackwell.
Hotelling, H. 1931. The Economics of Exhaustible Resources. Journal of Political Economy. 39: 137-
175.
Howarth, R.B. 1997, ‘Energy efficiency and economic growth.’ Contemporary Economic Policy 15(4) 1-
9.
Jackman, W.T. 1960. The Development of Transportation in Modern England. Frank Cass. London.
Jevons, W.S. (1865) The Coal Question: An Inquiry Concerning the Progress of the Nation, and the
Probable Exhaustion of Our Coal-Mines. Macmillan. London.
Kander, A. and P. Warde. 2011. ‘Energy availability from livestock and agricultural productivity in
Europe, 1815–1913: a new comparison.’ Economic History Review 64(1): 1-29.
Krautkraemer, J.A. 1998. Nonrenewable resource scarcity. Journal of Economic Literature. 36(3): 2065-
2107.
Langdon, J. 2005. Mills in the Medieval Economy: England 1300–1540. Oxford University Press. Oxford.
Livernois, J. 2009. On the empirical significance of the Hotelling Rule. Review of Environmental
Economics and Policy. 3(1): 22-41.

39
Masschaele, J. (1993) ‘Transport costs in medieval England.’ Economic History Review 46(2) 266–79.
Malthus, T.R. 1798. An Essay on the Principle of Population as it affects the Future Improvement of
Society. London: Ward Lock.
Maugeri, L. 2009. Understanding oil price behaviour through an analysis of a crisis. Review of
Environmental Economics and Policy. 3(2): 147-66.
Mitchell, B.R. 1988. British Historical Statistics. Cambridge: Cambridge University Press.
Nef, J.U. 1926. The Rise of the British Coal Industry. Volume I–II. London: Routledge and Sons.
Nordhaus, W.D. 1974. Resources as a constraint on growth. American Economic Review. 64: 22-6.
Nordhaus, W.D. 1996. Do real output and real wage measures capture reality? The history of lighting
suggests not. In The Economics of New Goods, ed. T.F. Breshnahan and R. Gordon. Chicago: Chicago
University Press.
Nunn, N. 2009. The Importance of History for Economic Development. Annual Review of Economics.
1(1): 65-92.
Pindyck, R.S. 1999. The long-run evolution of energy prices. The Energy Journal. 20(2): 64–78.
Potter, N. and F.T. Christy. 1962. Trends in Natural Resource Commodities. Baltimore: Johns Hopkins
University Press for Resources for the Future.
Ricardo, D. 1817. On the Principles of Political Economy and Taxation. London: John Murray.
Rogers J.E.T. 1865, 1882, 1886. A History of Agriculture and Prices in England. Vol I-VI. Oxford:
Clarendon Press.
Rogner, H.H. 2000. Energy resources and technology options (Ch. 5). In World Energy Assessment
(WEA), ed. J. Goldemberg, T.B. Johansson. New York: UNDP.

40
Schivelbusch, W. 1988. Disenchanted Night: The Industrialization of Light in the Nineteenth Century.
Oxford: Berg.
Small, K.A. and K. Van Dender. 2007. ‘Fuel Efficiency and Motor Vehicle Travel: The Declining
Rebound Effect.’ The Energy Journal 28(1): 25-52.
Smil, V. 1994. Energy in World History. Westview Press. Boulder, CO.
Smith, V.K. 1979. Natural Resource Scarcity: A Statistical Analysis. Review of Economics and Statistics.
61: 423-7.
Sterner, T. 2007. ‘Fuel taxes: An important instrument for climate policy.’ Energy Policy 35(6) 3194-
3202.
Sterner, T. and U.M. Persson. 2008. An even Sterner Review: Introducing relative prices into the
discounting debate. Review of Environmental Economics and Policy. 2(1): 61-76.
Stevens, P. (2010) The ‘Shale Gas Revolution’: Hype and Reality. Chatham House Report. London:
Chatham House.
Thompson, F.M.L. 1976. ‘Nineteenth century horse-sense.’ Economic History Review 39(1): 60–81.
Tol, R.S.J. 2002. Estimates of the damage costs of climate change: Part II. Dynamic Estimates.
Environmental and Resource Economics. 21, 135–160,
Warde, P. 2007. Energy Consumption in England & Wales 1560-2000. Napoli: Consiglio nazionale delle
ricerche.
Varian, H.R. 1992. Microeconomic Analysis. New York: W.W. Norton.