Embed Size (px)
Citation preview

DIURNAL VARIATION OF TROPICAL PRECIPITATION
USING FIVE YEARS TRMM DATA
A Thesis
by
QIAOYAN WU
Submitted to the Office of Graduate Studies ofTexas A&M University
in partial fulfillment of the requirements for the degree of
MASTER OF SCIENCE
August 2004
Major Subject: Atmospheric Sciences

DIURNAL VARIATION OF TROPICAL PRECIPITATION
USING FIVE YEARS TRMM DATA
A Thesis
by
QIAOYAN WU
Submitted to Texas A&M Universityin partial fulfillment of the requirements
for the degree of
MASTER OF SCIENCE
Approved as to style and content by:
Gerald R. North(Chair of Committee)
Kenneth P. Bowman(Member)
H. Joseph Newton(Member)
Richard Orville(Head of Department)
August 2004
Major Subject: Atmosopheric Sciences

iii
ABSTRACT
Diurnal Variation of Tropical Precipitation Using Five Years
TRMM Data. (August 2004)
Qiaoyan Wu, B.S., Nanjing University, China
Chair of Advisory Committee: Dr. Gerald R. North
The tropical Rainfall Measuring Mission (TRMM) Microwave Imager (TMI) and Pre-
cipitation Radar (PR) data are used in this study to reveal diurnal variations of precipitation
over the Tropics (30◦S − 30◦N) from January, 1998, to December 2002. The TMI data
were used for the regions over oceans and islands and the PR data was used over continents.
The observations are sorted regionally to examine the difference in diurnal cycle of rainfall
over ocean, island, and continental regions. The rain rate is averaged over individual two
hour intervals of local time in each region to include more observations in order to reduce
the sampling error. F-test is used to determine those regions whose diurnal cycle is detected
at the 95% confidence level.
In most oceanic regions there is a maximum at 0400 LST - 0700 LST. The amplitude
of diurnal variation over ocean regions with small total rain is a little higher than that of
the ocean regions with heavy total rain. The diurnal cycle peaks at 0700 LST - 0800 LST
over islands with rainfall variation similar to surrounding oceanic regions. A maximum
at 1400 LST - 1500 LST was found in areas over continents with heavy total rain, while
the maximum occured at 1900 LST - 2100 LST over continents with lesser total rain. The
amplitudes of variation over continents with heavy total rain and with small total rain do
not show significant differences. The diurnal cycle in in JJA (June, July, August) and DJF
(December, January, February) varies with latitude over continents. A seasonal cycle of
diurnal cycle can also be found in some oceanic regions. The diurnal cycle annual change

iv
is not evident over continents, while the diurnal cycle annual change over oceans exists in
some regions. Island regions in this paper exhibit no evident seasonal and annual diurnal
change.

v
ACKNOWLEDGMENTS
I am most grateful to my advisor and committee chair Dr. Gerald R. North for his
guidance, patience, and extraordinary support during this research. I would also like to
express my gratitude to my committee members Dr. Kenneth P. Bowman and H. Joseph
Newton for their generous help and advice. Thanks to Dr. Ha for the suggestions on the
statistic problem encountered . Other CSRP members: Neil Smith, J. Craig Collier and
Stephanie Tice also have been an incredible help to me. And last I want to thank my
parents for their love and support in my whole life.

vi
TABLE OF CONTENTS
CHAPTER Page
I INTRODUCTION . . . . . . . . . . . . . . . . . . . . . . . . . . 1
II PREVIOUS STUDIES . . . . . . . . . . . . . . . . . . . . . . . . 7
III DATA AND INSTRUMENT . . . . . . . . . . . . . . . . . . . . . 12
A. A Brief Mission Overview of TRMM . . . . . . . . . . . . . . 12B. TRMM Data . . . . . . . . . . . . . . . . . . . . . . . . . . . 14
IV METHODS . . . . . . . . . . . . . . . . . . . . . . . . . . . . . 16
A. Method to Detect Diurnal Cycle . . . . . . . . . . . . . . . . . 16B. F-test . . . . . . . . . . . . . . . . . . . . . . . . . . . . . . . 20
V RESULT . . . . . . . . . . . . . . . . . . . . . . . . . . . . . . . 24
A. Oceanic Regions . . . . . . . . . . . . . . . . . . . . . . . . . 24B. Continental Regions . . . . . . . . . . . . . . . . . . . . . . . 32C. Island Regions . . . . . . . . . . . . . . . . . . . . . . . . . . 33D. Seasonal and Annual Change . . . . . . . . . . . . . . . . . . . 35
VI CONCLUSIONS . . . . . . . . . . . . . . . . . . . . . . . . . . . 40
REFERENCES . . . . . . . . . . . . . . . . . . . . . . . . . . . . . . . . . . . 42
VITA . . . . . . . . . . . . . . . . . . . . . . . . . . . . . . . . . . . . . . . . . 45

vii
LIST OF FIGURES
FIGURE Page
1 The five year TRMM precipitation climatology from January, 1998 toDecember, 2002. . . . . . . . . . . . . . . . . . . . . . . . . . . . . . . 5
2 Regions chosen for the study with heavy rain and with light rain. . . . . . 6
3 The total pixel number observed in selected regions with the localtime of the day in TRMM data. . . . . . . . . . . . . . . . . . . . . . . 15
4 The confidence to detect the diurnal cycle using F-test in each region. . . 22
5 The regions with more than 95% confidence to detect diurnal cycle inFig. 4 kept for further statistical study. . . . . . . . . . . . . . . . . . . . 23
6 The rain rate with the local time of the day in East Tropics. . . . . . . . . 25
7 The same as Fig.6, except for the rain rate with the local time of theday in West Tropics . . . . . . . . . . . . . . . . . . . . . . . . . . . . 26
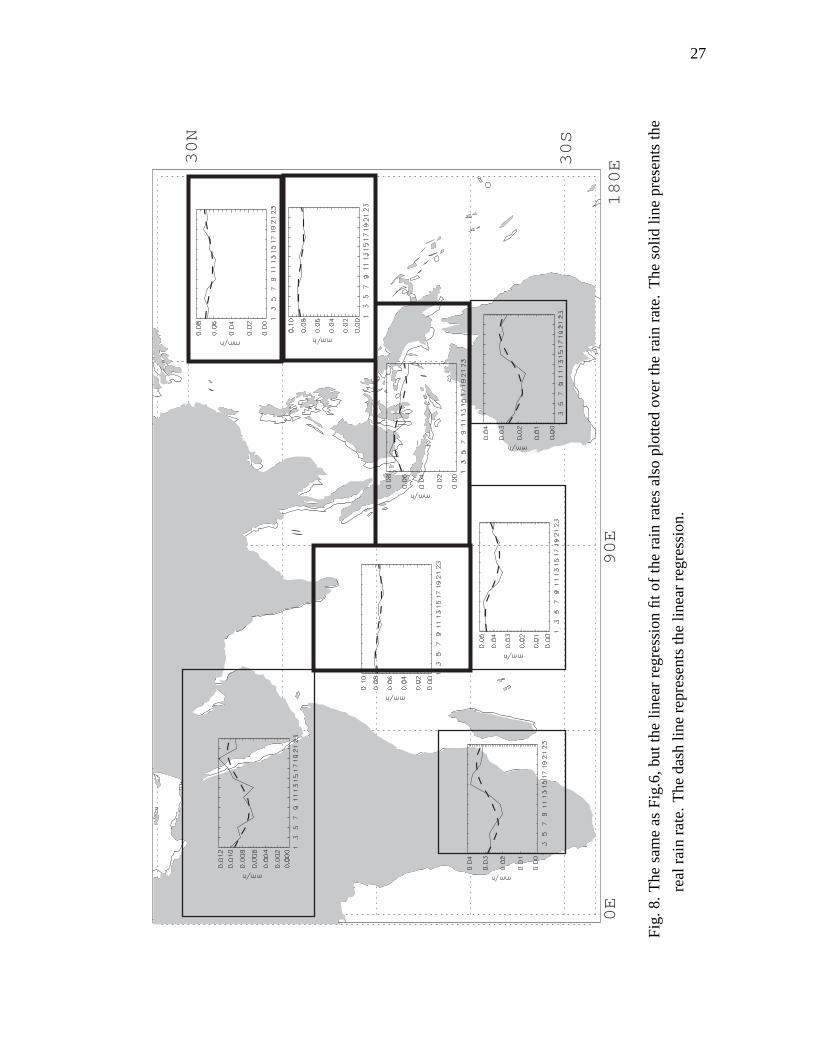
8 The same as Fig.6, except for the linear regression fit of the rain ratesalso plotted over the rain rate. . . . . . . . . . . . . . . . . . . . . . . . 27
9 The same as Fig.7, except for the linear regression fit of the rain ratesalso plotted over the rain rate. . . . . . . . . . . . . . . . . . . . . . . . 28
10 The local time when the maximum rain rate happens in each region. . . . 30
11 The ratio of precipitation variation to the mean rain rate in each region. . . 31
12 The rain rate with the time of the day in each season in East Tropics. . . . 36
13 The same as Fig. 12, except for the rain rate with the time of the dayin each season in West Tropics. . . . . . . . . . . . . . . . . . . . . . . 37
14 The rain rate with the time of the day in each year in East Tropics. . . . . 38

viii
FIGURE Page
15 The same as Fig. 14, except for the rain rate with the time of the dayin each year in West Tropics. . . . . . . . . . . . . . . . . . . . . . . . 39

1
CHAPTER I
INTRODUCTION
The atmosphere gets three fourths of its heat energy from the latent heat released by pre-
cipitation and two thirds of this precipitation falls in the Tropics. In turn the differences in
large-scale rainfall patterns and their associated energy releases affect the global circula-
tion. In many parts of the tropics the diurnal cycle and the annual cycle account for most
of the variation in weather, including precipitation. The ability to successfully explain the
variability of rainfall over short time scales, such as the diurnal cycle, serves as a useful
measure of understanding of the physics of the atmosphere. Knowledge of variation in
rainfall statistics with the time of day is also essential in interpreting non-geosynchronous
satellite estimates of rainfall, since these satellites view a given spot only intermittently,
and interpolating between the measurements should be adjusted according to the time of
day. An accurate representation of the diurnal cycle of precipitation also provides a key
test of many aspects of the physical parameterizations in a climate model, from radiative
transfer and surface exchanges through to boundary layer, convective, and cloud processes.
One of the priority science questions in the design of the Tropical Rainfall Measuring Mis-
sion (TRMM) was “what is the diurnal cycle of tropical rainfall and how does it vary in
space?” Simpson et al. (1988).
In the most basic sense, the diurnal cycle over land and large islands can be viewed as
a response to radiational forcing. As surface temperatures rise, instability and the resulting
convection increase, reaching a maximum in the late afternoon or early evening. With radi-
ational cooling of the land at night, convection decreases, reaching a minimum in the early
morning. The nocturnal cooling of existing cloud tops may result in destabilization and a
The format and style follow that of Journal of Climate .

2
secondary convection maximum during the night. Such nocturnal cooling might also result
in increased convection over water, reaching a maximum in early morning, then decreasing
throughout the day. The amplitude of the diurnal variation over water is generally believed
to be less than that over land, due to the smaller response of the water surface temperature
to radiational heating and cooling. This simple picture is complicated in most locations
by local forcing and prevailing wind patterns, which cause a complex pattern of diurnal
variations that are particularly noticeable when one examines data from individual stations
Meisner and Arkin (1987).
The diurnal cycle in tropical precipitation has been extensively studied using differ-
ent methods for a number of years. Weather ships data, surface rain accumulation, rain
gauge data, satellite infrared data, outgoing longwave radiation data, passive microwave,
radar data collected during GATE [GARP(Global Atmospheric Research Program) Atlantic
Tropical Experiment], and most recently TRMM data were used for the diurnal study. Most
of these works agree that the amplitude of the diurnal cycle of rainfall over continents is
larger than that over the open oceans. But regional differences in the rainfall diurnal cycle
exist over both ocean and land, leading to different explanations of the causal mechanisms.
With progress in satellite remote-sensing techniques of precipitation estimation, large-
scale patterns of rainfall can be monitored using rainfall estimates with improved accuracy
and spatial/temporal resolutions. The infrared observations from geostationary satellites
have high temporal sampling frequency, thus making it easier to study diurnal variations
on short timescales. But the infrared techniques, which use only information on cloud-
top temperature to determine surface rainfall, provide only “indirect” information about
rainfall. Passive microwave techniques, which obtain measurements that reflect the distri-
bution of hydrometeors within the cloud, are known to offer a more direct signal from the
rain layer. However, almost all the space platforms that carry such instruments were put in
sun-synchronous orbit, which allow just two samples of rainfall per day over a given loca-
3
tion. Recently some studies ( Adler et al. (1993), Negri et al. (2002), Xu et al. (1999), etc.)
have suggested a combination of multiple sources of satellite data to improve the accuracy
and resolution of rain estimates.
The tropical Rainfall Measuring Mission (TRMM, Simpson et al., 1988) satellite
launched in 1997 has provided five years (January 1998 to December 2002) of precipita-
tion rates distributed over regions between (38◦S and 38◦N) for our tropical precipitation
variation study. The non-sun-synchronous TRMM produces data from the first quantitative
spaceborne rain radar, the precipitation radar (PR), combined with data from the passive
TRMM microwave imager (TMI). TMI is the first passive microwave radiometer put into a
non-sun-synchronous orbit, allowing us the first opportunity to investigate complete diur-
nal variation of precipitation with more direct information on the rain layer than previous
infrared observations. The objective of this study is, by utilizing the advantages men-
tioned above, to provide a 5-year diurnal variation of precipitation with local time of day
on its latitudinal/regional characteristics over the tropical oceans using the TMI. Since the
“absorption-emission” passive microwave frequencies (less than 20GHz) do not work well
for precipitation measurements over land, we use the PR data of TRMM, instead of the
TMI data, to study the diurnal variation of precipitation over continents.
This study used five years of TRMM data, which is a longer record of data than the data
used by Nesbitt and Zipser (2003). TRMM measures rain rate by looking at the distribution
of hydrometeors within the cloud, offering a more direct measurement of the rain rate than
the infrared observations. And this study covers the global Tropics.
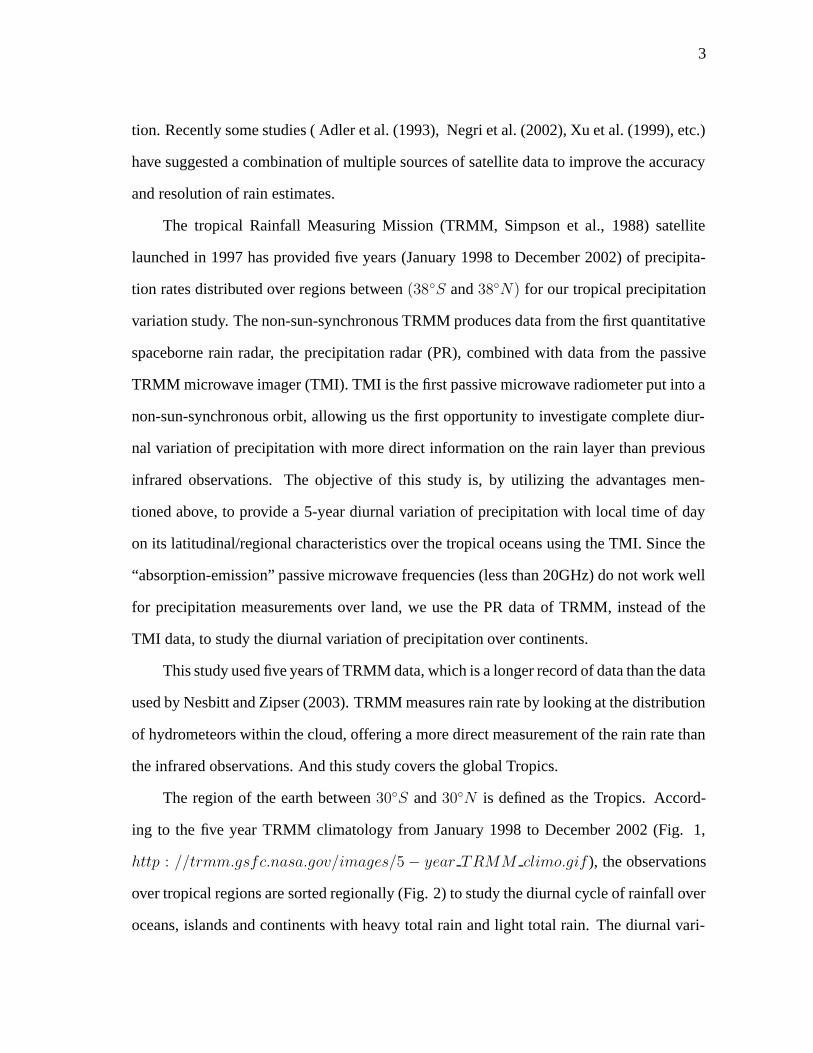
The region of the earth between 30◦S and 30◦N is defined as the Tropics. Accord-
ing to the five year TRMM climatology from January 1998 to December 2002 (Fig. 1,
http : //trmm.gsfc.nasa.gov/images/5 − year TRMM climo.gif ), the observations
over tropical regions are sorted regionally (Fig. 2) to study the diurnal cycle of rainfall over
oceans, islands and continents with heavy total rain and light total rain. The diurnal vari-

4
ation of rainfall rates is computed by classifying the TRMM observations into bins based
upon local hour and then performing an area average. To include more observations, in or-
der to reduce the sampling error, the rain rate was binned in two hour spans in each region.
The possibility of detecting the diurnal cycle in each region is studied by regression on di-
urnal sinusoids and tested by an F-test method. The regions with 95% or more confidence
of detecting the diurnal cycle are determined and mapped for future studies.

5
Fig.
1.T
hefiv
eye
arT
RM
Mpr
ecip
itatio
ncl
imat
olog
yfr
omJa
nuar
y,19
98to
Dec
embe
r,20
02.

6
30N
30S
180E 90W90E
Fig. 2. Regions chosen for the study with heavy rain and with light rain. The regions en-
closed with the heavy lines are the regions with heavy rain.

7
CHAPTER II
PREVIOUS STUDIES
The diurnal cycle of tropical rainfall and its variation in different regions remains an im-
portant question regarding global precipitation. A number of studies have focused on the
diurnal variation of precipitation over Tropics in the past few years. Over land, many stud-
ies used surface rain accumulation ( Dai et al. (1999); Gray and Jacobson (1977); Oki
and Musiake (1994)) and surface weather reports ( Dai (2001)). Because of the scarcity
of rainfall data over the oceans, different parameters have been used as rainfall proxies
to study the diurnal cycle. Surface weather reports ( Dai (2001)), rain gauge data ( Gray
and Jacobson (1977)), satellite infrared data ( Albright et al. (1985); Meisner and Arkin
(1987)), outgoing longwave radiation data ( Hartmann and Recker (1986)), passive mi-
crowave ( Sharma et al. (1991)), radar data collected during GATE ( McGarry and Reed
(1978)), TRMM data ( Nesbitt and Zipser (2003)), and various combined data ( Imaoka
and Spencer (2000); Sorooshian et al. (2002)) were used for the study. Most of these pre-
vious works agreed that the amplitude of the diurnal cycle of rainfall over the ocean is less
than that over the continents. And most of the studies found a rainfall maximum over the
oceans in the morning and a maximum in the afternoon over the continents. But regional
differences in the rainfall diurnal cycle remain to be examined over both the ocean and the
continent.
Gray and Jacobson (1977) found strong early morning maxima in deep convection in
the Tropics using gauge data collected at small, isolated tropical islands. In many places,
heavy rainfall was two or three times greater in the morning than in the late afternoon to
evening. The more intense the convection and the stronger the association with organized
weather systems, the more intense is the diurnal cycle. They attributed the difference to
the day versus night variations in the tropospheric radiative cooling between convective

8
weather systems and the surrounding cloud-free regions.
Dai (2001) used three-hourly present reports from about 15000 stations around the
globe and from the Comprehensive Ocean-Atmosphere Data Set from 1975 to 1997 to
analyze diurnal variations in the frequency of occurrence for various types of precipitation
and thunderstorm. Significant diurnal variations with amplitudes exceeding 20% of the
daily mean are found over much of the globe, especially over land areas and during summer.
Oki and Musiake (1994) used ground-based observations for more than 10 years
both in Japan and Malaysia to investigate the diurnal cycle. They found the diurnal cycle
of precipitation in Japan can be classified into three groups. The coastal regions have a
precipitation peak in the morning. In the inland region both morning and afternoon peaks
were found in June during the rainy season related to the southwest Asian monsoon. In
the third group, no morning peak was observed in the stations but a comparatively strong
evening peak occured. In the Malay Peninsula, the inland region has a pronounced peak of
rainfall at 1600 LST. The morning peak of precipitation is observed during the southwest
monsoon on the west coast and during the northeast monsoon season on the east coast.
Meisner and Arkin (1987) used three years of three-hourly infrared satellite data
from the American geostationary satellites to determine the large-scale spatial and temporal
variations in the diurnal cycle of tropical convective precipitation. They reported that the
summertime diurnal cycle over tropical continents is much stronger than that over tropical
oceans. They also found that diurnal cycle over ocean was evident only in the intertropical
convergence zone (ITCZ) and South Pacific convergence zone (SPCZ) with near-noontime
maximum.
Albright et al. (1985) used the fractional cold cloud coverage determined from the
GEOS-West geostationary satellite to study diurnal cycle over the central tropical Pacific.
In the ITCZ the cycle was found to have a distinct morning maximum and evening mini-
mum. In other areas, such as the SPCZ, an afternoon maximum was observed.

9
Hartmann and Recker (1986) estimated the diurnal harmonic in longwave emission
in the tropical belt relying on nine years of NOAA polar-orbiting satellite data. They found
a consistent diurnal variation in longwave emission over the regions of intense oceanic
convection as the ITCZ and SPCZ regions with a maximum in the morning (0600-1200
LST).
Sharma et al. (1991) examined the diurnal cycle using the Defense Meteorological
Satellite Program (DMSP) Special Sensor Microwave/Imager derived data from July 1987
to June 1988. By averaging over a large area to reduce the random errors in the estimates,
the average ratio of morning to afternoon rainfall was about 1.2.
McGarry and Reed (1978) used harmonic analysis to examine phase and normalized
amplitude of the diurnal variation in the convective activity and precipitation with radar data
collected during GATE. Afternoon maxima over the western Atlantic Ocean near African
coast was found in their work.
Nesbitt and Zipser (2003) combined TRMM satellite measurements from the PR
and TMI to yield a comprehensive 3-yr database of precipitation features throughout the
global Tropics. They found rainfall over the oceans has a significant diurnal cycle (varying
by 30%) that peaks in the early morning to predawn hours, with a minimum in the late
afternoon and a sharp early afternoon peak in overland rainfall at 1500 local time.
Imaoka and Spencer (2000) used the TRMM TMI and SSM/I combined data to reveal
diurnal variations of precipitations over the tropical oceans. In their study the diurnal vari-
ation over all the tropical oceans exhibits an amplitude of about ±14% of the mean, and it
peaks approximately at 0400-0700 LST and has its minimum at 1900-2100 LST. Observed
features of precipitation diurnal cycles have been used to examine physical processes in
atmospheric models and to diagnose model deficiencies.
Sorooshian et al. (2002) used rainfall data retrieved from combined GOES and TRMM
satellite to investigate the regional patterns of tropical rainfall diurnal cycles. Their result
10
shows that only the far eastern Pacific Ocean region of ITCZ displays a strong diurnal signal
in the boreal summer season. During DJF, Brazil, the northern two-thirds of South Amer-
ica, northern Australia, southwest of Borneo, New Guinea, and the Gulf of Carpentaria
exhibit strong day-time convective rainfall over land. and then new convection develops
strongly offshore.
Hendon and Woodberry (1993) used an index of deep convective activity and a global
cloud index to analyze the diurnal cycle of tropical convection. They conclude that over
the tropical oceans the diurnal cycle is weak. Nonetheless, oceanic convection exhibits a
detectable systematic diurnal fluctuation with maximum intensity in the early morning.
Numerical model studies using cloud resolving models and general circulation mod-
els have also been useful attempting to detect the diurnal cycle and diagnose the causes of
the diurnal cycle of convection over the Tropics. Liu and Moncrieff (1998) used idealized
two-dimensional cloud-resolving numerical models to investigate the diurnal variability of
deep tropical oceanic convection. A pronounced diurnal cycle was simulated for the highly
organized convection in strong ambient shear with a maximum around predawn and a min-
imum in the late afternoon. A similar diurnal variability was obtained for the less organized
non-squall cloud clusters without ambient shear characterized by more precipitation during
the night and early morning and less precipitation in the afternoon and evening. Randall
et al. (1991) used the University of California at Los Angeles/Colorado State University
general circulation model (GCM) for their simulation study. They showed a maximum of
precipitation in early morning over the ocean far from land.
While the models provide an attractive method for examining the physics of the diur-
nal cycle of precipitation, errors in model physics may lead to inappropriate conclusions
( Randall et al. (1991), Young and Slingo (2001)). Observed features of precipitation di-
urnal cycles then were used to examine physical processes in atmospheric models and to
diagnose model deficiencies. Randall et al. (1991) indicated that using diurnal features to

11
test a GCM has the advantage of obtaining meaningful results with relatively short sim-
ulations. Dai et al. (1999) analyzed the diurnal patterns of precipitation simulated from
the National Center for Atmospheric Research (NCAR) regional climate model (RegCM)
and found substantial weaknesses in modeling diurnal patterns of precipitation using all
three available cumulus convection schemes (Grell, Kuo, CCM3). They recommended that
more attention be devoted to the simulation of the diurnal cycle of precipitation in model
evaluation. Young and Slingo (2001) showed that analysis of diurnal cycle represents a
powerful tool for identifying and correcting model deficiencies. In the recent work, Col-
lier and Bowman (2004) compared hourly-averaged precipitation rates from an ensemble
of CCM3 simulation with observations from the TRMM satellite from January, 1998 to
August, 2001. In the work they found the model’s diurnal cycle is too strong over major
land massed and is too weak over many oceans. They also found the model-satellite phase
differences tend to be homogenous. The peak in the model’s diurnal harmonic consistently
precedes that of the observations nearly ererywhere. Since the model’s precipitation diurnal
cycle phase and amplitude biases likely have effects on its hydrologic cycle and its surface
and atmospheric energy budgets, they suggested that the causes for the model’s biases need
to be investigated.

12
CHAPTER III
DATA AND INSTRUMENT
A. A Brief Mission Overview of TRMM
TRMM is a joint mission between the National Aeronautical and Space Administration
(NASA) of the United States and the National Space Development Agency of Japan. The
satellite was launched on November 27th 1997 from Japan’s Tanegashima Space Center
aboard a Model H-II launch vehicle. The primary rainfall instruments on TRMM are the
TRMM Microwave Imager (TMI), the precipitation radar (PR), and the Visible and Infrared
Scanner (VIRS). In addition, the TRMM satellite carries two related Earth Observing Sys-
tem instruments: the Cloud and the Earth’s Radiant Energy System and the Lightning
Imaging Sensor. The TRMM satellite has been put in a non-sun-synchronous orbit with a
low inclination angle of 35◦ to the equatorial plane and at a low altitude of 350 km. The low
altitude ensures that the TRMM instruments are able to resolve the upwelling radiation over
small areas. This resolution also permits a more accurate retrieval of the precipitation over
an area while additionally allowing more spatial resolution of the field. Finally, the low
altitude helps to increase the return signal from the PR. These features ensure that within a
given period of time, a given area over the Tropics is observed by TRMM during different
local hours. The frequency and coverage of observations over an area depends upon the
latitude and size of averaging area. These orbital characteristics of TRMM observations
may prove to be valuable for the study of the diurnal variation of rainfall over the global
Tropics.
For this study, five years’ observations from TMI have been used for study of the di-
urnal variation over ocean and islands. TMI is a nine-channel passive microwave sensor
designed to provide quantitative rainfall information over a wide swath (≈ 780 km) under

13
the TRMM satellite. It measures radiances that are the end product of the integrated ef-
fect of electromagnetic absorption-emission and scattering through the precipitating cloud
along the sensor view path. The TMI is based on the design of the highly successful SSM/I,
which has been flying continuously on Defense Meteorological Satellites since 1987. TMI
measures the intensity of upwelling radiation at five separate frequencies: 10.7, 19.4, 21.3,
37, and 85.5 GHz. These frequencies are similar to those of SSM/I, except that TMI has
the additional 10.7 GHz channel, which improved the sensitivity of the TMI algorithm to
heavier rain rates. TMI also has a higher spatial resolution than the SSM/I due to its lower
orbit ( Kummerow et al. (1998)).
Since the absorption-emission passive microwave frequencies (less than 20GHz) do
not work well for precipitation measurements over land, we use the PR observation of
TRMM, instead of the TMI observation, to study the diurnal variation or precipitation over
land. Unlike the TMI, the PR is an active microwave sensor. The PR is the first rain radar
in space. It is a system that operates at 13.8 GHz (2.17 cm wavelength) as a 128 element
active phased antenna. When the PR is in observation mode it scans in the cross-track
direction over ±17◦, which is equivalent to a 215 km swath width array at the ground.
The PR also provides the three-dimensional structure of rainfall, particularly of the vertical
distribution and improves the overall TRMM precipitation retrieval accuracy by combined
use of active PR and passive TMI and VIRS sensor data ( Kummerow et al. (1998)).
The real-time processing and postprocessing of the TRMM science data are performed
by the TRMM Science Data and Information System (TSDIS). It produces a number of
rainfall products depending upon the combination of instruments and spatial and temporal
scales. For this study, we have the 3G68 products. It contains gridded values of the total
pixels (footprints), rainy pixels, mean rain rate, and percentage of convective rain from the
TMI algorithm 3G68 and the PR algorithm 3G68.
Satellite rainfall estimates have substantial random and possibly systematic errors. It is

14
important to validate satellite retrievals against other types of precipitation measurements,
including ground-based radars and traditional rain gauges. The validation dataset was prin-
cipally based on radar measurements but also included some rain gauge measurements.
Bias accuracy refers to the difference between sample mean satellite measurements and
sample mean validation measurements.
B. TRMM Data
The rainfall data used in this study is from the TRMM 3G68 combined rain rate product,
which was obtained from the TRMM Science Data and Information System (TSDIS). Data
are provided in 0.5◦ × 0.5◦ latitude-longitude grid boxes. The observation time for each
grid box is recorded to the nearest minute. The data include retrievals from three different
algorithms: the TMI, the PR, and the COMB (the combination of TMI and PR instruments).
In addition to the mean rain rate for the three algorithms, the 3G68 data set includes the
numbers of pixels observed by TMI, PR and COMB, the number of rainy pixels TMI, PR
and COMB observed, and the percentage of convective rain. For The 3G68 data is an
hourly gridded product, which includes 24 hourly grids in a single daily file, it can be used
for diurnal study. Fig. 3 shows the the total number of pixels observed in each two hour
bin in the selected regions. The flat histogram shows that the number of pixels observed in
each two hour interval are approximately the same. This indicates that there is no diurnal
bias in the sampling. Generally, the TRMM satellite is able to observe a given location in
the Tropics about once per day, at different times each day, with a cycle of 42 days, the
cycle of its orbital precession. Therefore, for the five-year period considered in this study
(January, 1998-December 2002), there are about 150 observations in each of the regions
we choose to study in every two hour span.

15
(a) (b)
(c) (d)
1 3 5 7 9 11 13 15 17 19 21 23
1 3 5 7 9 11 13 15 17 19 21 23
1 3 5 7 9 11 13 15 17 19 21 23
1 3 5 7 9 11 13 15 17 19 21 23
Fig. 3. The total pixel number observed in selected regions with the local time of the
day in TRMM data. The histogram in each box represents the exact observa-
tion in that region. The times in each histogram represent the mid-point time of
each time interval.(a) represents the of 0-60E,10-30N; (b) represents the region of
135-180E,0-15N; (c) represents the region of 135-180W,0-15S; (d) represents the
region of 135-180W,15-30S.

16
CHAPTER IV
METHODS
A. Method to Detect Diurnal Cycle
Measurements from low-earth orbiting satellites produce different types of problems due
to the discontinuous nature of the sampling process from such observing systems. Several
studies have addressed the question of whether TRMM can provide enough observations at
different local times to delineate the changes in average rainfall with time of day. Salby and
Callaghan (1997), in a study of how different satellite orbits interact with diurnal sampling,
emphasized that climatological studies using satellite data must be done with appropriate
averaging of the data in order to minimize biases in the average due to varying sample sizes
at different times of the day. Bell and Reid (1993) concluded before the launch of TRMM
satellite that the TMI would be able to determine the first harmonic of the diurnal cycle in
a 5◦ × 5◦ grid box from 1 month of data to an accuracy of about 25 percent of the mean
rain rate. This assumed rain with statistics like those of the rain data taken in the tropical
Atlantic during GATE.
A diurnal cycle, if it exists, would be represented by a change in the probability dis-
tribution of rain with the time of day. This study will concentrate on determining a single
aspect of this change: the variation of mean rain rate averaged in a certain area with the
local time of day. The method we used here to study the diurnal cycle and the sampling
error was discussed by Bell and Reid (1993).
The estimates for the area-averaged rainfall were defined as
RA(tm) =1
|A|∫
AR(X, tm)dX, (4.1)
within a given area A provided at observation times tm(m = 0, 1, . . .). These observation

17
times tm will be separated by intervals ranging from roughly 2 to 24 hours, depending on
the physical location of the area observed.
To see if the mean rain rate changes with the time of day the averages of the ob-
servations are found for the different intervals over the course of the day. We break the
day up into time intervals of equal duration (each of 2 hours length in this study), us-
ing t to denote the time interval whose midpoint is at time tm. In our work, local time
1, 3, 5, 7, 9, 11, 13, 15, 17, 19, 21, 23 represent the local time intervals 0−2, 2−4, 4−6, 6−8, 8− 10, 10− 12, 12− 14, 14− 16, 16− 18, 18− 20, 20− 22, 22− 24 respectively. Then
the interval averages can be written formally as
R(t) =1
nt
∑tm∈t
RA(tm), (4.2)
where the notation tm ∈ t denotes observations that fall within the interval t and nt is their
number,
nt =∑tm∈t
1. (4.3)
If there is a diurnal cycle, the climatic mean rainfall ER(t) will vary periodically during
the course of the day. The expectation here is a hypothetical average over a large number
of days but taken at the same time of day, with all other “climatologically influences” held
fixed. The diurnal cycle in r(t) = ER(t) can be expressed by a Fourier series,
r(t) = r0 + r1 cos(ωt − φ1) + r2 cos(2ωt − φ2) + . . . , (4.4)
where the first term r0 represents the daily mean rainfall.
ω = 2π(24h)−1 (4.5)
is the diurnal frequency, r1 and φ1 are amplitude and phase for simple sinusoidal variation
of the mean. The number of harmonics needed to describe the variation of r(t) is limited

18
by the number of intervals into which the day has been broken up. Harmonics higher than
the first few will be neglected in what follows.
We use the least-squares fit of r(t) to RA(tm) to determine the parameters of the ex-
pansion of Fourier expression (2.4). That is, the parameters can be obtained by minimizing
D2 =N∑
m=0
[RA(tm) − r(tm)]2, (4.6)
where N + 1 is the number of satellite observations. This approximation becomes exact as
the number of observations increases.
Since we are trying here to obtain an idea of the order of magnitude of the statistical
problem posed by the intermittent sampling of the satellite, we shall simplify it by making
that the satellite samples are at equally spaced intervals
tm = m�t, m = 0, . . . , 11. (4.7)
Here �t = 2.
The harmonic analysis of the diurnal cycle is cast in a form amenable to least squares
with linear coefficients by writing it as
r(t) ≈ r0 + c cosωt + s sin ωt, (4.8)
with c = r1 cos ωφ1 and s = r1 sin ωφ1. The higher harmonics in (4.4) are neglected, but
they can be treated as a straightforward generalization of the approach followed. It can also
be shown that if all hours of the day are equally sampled, estimates of the amplitudes of the
diurnal harmonics can be made independently of each other because the Fourier modes are
orthogonal. In our study the rain rates are sampled equally every 2 hours, so the mean r0
can be estimated independently of the first harmonic from a simple average of the data as
r0 =1
N + 1
N∑m=0
RA(tm). (4.9)

19
The least-squares estimates: s and c are
s = D−1(AccS − AscC), (4.10)
c = D−1(−AscS + AssC), (4.11)
where
D = AccAss − A2sc, (4.12)
and
Ass =∑
sin2 ωtm, (4.13)
Acc =∑
cos2 ωtm, (4.14)
Asc =∑
sin ωtm cos ωtm. (4.15)
S and C are the sine and cosine components of the rainfall data,
S =∑
sin(ωtm)[Rm(tm) − r0], (4.16)
C =∑
cos(ωtm)[Rm(tm) − r0], (4.17)
The estimated amplitude is r12 = s2 + c2 and the estimated phase is φ1 = tan−1(s/c).
The usual distribution theory for least-squares does not apply here because the observations
RA(tm) are correlated. Here S and C are sums of data extending over times much longer
than the correlation time of rain, and it is assumed that they contain enough effectively
independent observations to be approximately normally distributed, which was satisfied in
our study. It is also assumed that the time series of rain rates is sufficiently long that the
variances of s2 and c2 are approximately the same and that the correlation of s2 and c2 may
be neglected.
The climatic mean rainfall ER(t) will vary periodically during the course of the day if
there is a diurnal cycle. Whether the diurnal cycle can be detected or not can be verified by

20
whether the rain rate with the time of the day can be expressed as (4.8). We use the F-test
to show the confidence level the rain rate with the time of day can be expressed as (4.8).
The locations with diurnal cycle detected with 95% confidence were then mapped.
B. F-test
The periodic expression of precipitation rates r(t) in (4.8) is a multiple linear regression fit
to the climatological-mean and regional-mean hourly precipitation rates R(t). The precip-
itation rates here can be expressed with the regression expression r(t) as:
R(t) = r(t) + ε(t), (4.18)
ε(t) is a residual such that E[ε(t)] = 0, E[ε(t)2] = σ20 , and E[ε(t)ε(t
′)] = 0, t �= t
′.
If there is no diurnal cycle, then under these simplifying assumptions, s and c are ap-
proximately independent variables with zero mean. That’s there is no linear relationship
between the harmonic term and the mean precipitation rates when there is no diurnal cy-
cle. F static test is used for the test for significance of regression. The procedure is often
thought of as an overall test of regression model adequacy. The appropriate hypotheses are
H0: s = 0, c = 0,
H1: at least s or c �= 0,
Rejection of this null hypothesis implies that at least one of the regressors contributes sig-
nificantly to the regression model.
The test to verify the least-squares estimates of s and c satisfying the following condi-
tion:
(s − s)2 + (c − c)2 ≤ 4σ2
NF2,N−3(α), (4.19)
Where σ2 is the least-squares estimate of σ20 and the sample number N is equal 12 in this
study. F2,N−3 is the (1−α) cutoff value of the F distribution function with 2 (two parame-

21
ters, s and c, to be estimated) and 9 (12(samples)-3(coefficients)) degrees of freedom. Then
(1 − α)% represents the confidence level the null hypothesis can be rejected. It should be
noted here that F test assumes that the mean rain rates we fit to the linear regression are
independent and that the resulting residuals of the fit are normally distributed.
Fig. 4 shows the confidence level in each region the null hypothesis can be rejected,
that’s, the confidence level to detect the diurnal cycle in each region. The regions with more
than 95% or more confidence level are shown and numbered in Fig. 5.

22
30N
30S
180E
98.9
%
99.4
%99
.9%
99.8
%
94.0
%
98.4
%
98.0
%
99.5
% 99
.3%
80.0
%
93.3
%98
.6%
29.8
%
96.4
%
97.7
%
99.7
%98
.9%
97.8
%
86.1
%
81.3
%
96.7
%
97.7
70.2
%
58.5
%
90E
90W
Fig.
4.T
heco
nfide
nce
tode
tect
the
diur
nalc
ycle
usin
gF-
test
inea
chre
gion
.The
confi
denc
ein
each
box
repr
esen
tsth
eco
nfide
nce
inth
esp
ecifi
cre
gion
.The
regi
ons
encl
osed
with
the
heav
ylin
esar
eth
ere
gion
sw
ithhe
avy
rain
.

23
30N
30S
180E
90E
90W
1 2
3 4
5
6
7 89 1
01
1
12
13
14
15
16
Fig.
5.T
here
gion
sw
ithm
ore
than
95%
confi
denc
eto
dete
ctdi
urna
lcyc
lein
Fig.
4ke
ptfo
rfu
rthe
rst
atis
tical
stud
y.

24
CHAPTER V
RESULT
Chang et al. (1995) showed that the areas where the total rain is small, such as the Southern
Pacific and the Atlantic Ocean dry zone are the areas, in which the evening rain rate is
heavier than the morning rain rate. In order to study the influence of rain rate on the
rainfall diurnal cycle, the diurnal variation was studied in different regions with heavy total
rain and light total rain respectively. Based on the five year rainfall climatology, various
regions were selected whose characteristics were nearly homogenous and that represent
different climatic regimes.
Aware of the sampling constraint, in this paper the diurnal cycle was examined from
relatively large area composites of the 5-year record of TRMM data with 2-hour temporal
resolution and no less than 30◦ × 15◦ spatial resolution. Investigation of the diurnal cycle
on smaller spatial and temporal scales awaits the collection of more data. According to the
result of the F-test in the previous section (Fig. 4 and Fig. 5), this study focuses on the
areas, where the diurnal cycle can be detected with 95% or more confidence.
Variability of rainfall also occurs on longer timescales other than diurnally. Nondiur-
nal rainfall enhancements from passing easterly wave disturbances, midlatitude shortwave
troughs, and other phenomena like the Madden-Julian oscillation are aliased in our long-
term averages ( Nesbitt and Zipser (2003)). As Nesbitt and Zipser did, no attempts to
remove these variations caused by these phenomena are made in our results, nor are the
phenomena believed to significantly alter our conclusions.
A. Oceanic Regions
Fig. 6 and Fig. 7 show the histogram of hourly rain rates in each region. In the figure the
time represents the local time in each region. The rain rate is larger in the morning than in

25
0E
90
E1
80
E30
N
30
S
Fig.
6.T
hera
inra
tew
ithth
elo
cal
time
ofth
eda
yin
Eas
tT
ropi
cs.
The
regi
ons
over
ocea
nsan
dis
land
sus
eT
MI
data
and
the
regi
onov
erco
ntin
ents
use
PRda
ta.T
hetim
esin
the
figur
ere
pres
entt
hem
id-p
oint
inea
chtim
ein
terv
al.T
here
gion
sin
side
encl
osed
with
heav
ylin
esar
ere
gion
sw
ithhe
avy
rain
.

26
18
0W
90
W0
W
30
N
30
S
Fig.
7.T
hesa
me
asFi
g.6,
butt
hera
inra
tew
ithth
elo
calt
ime
ofth
eda
yin
Wes
tTro
pics
27
0E
90
E1
80
E30
N
30
S
Fig.
8.T
hesa
me
asFi
g.6,
butt
helin
ear
regr
essi
onfit
ofth
era
inra
tes
also
plot
ted
over
the
rain
rate
.T
heso
lidlin
epr
esen
tsth
e
real
rain
rate
.T
heda
shlin
ere
pres
ents
the
linea
rre
gres
sion
.

28
18
0W
90
W0
W
30
N
30
S
Fig.
9.T
hesa
me
asFi
g.7,
butt
helin
ear
regr
essi
onfit
ofth
era
inra
tes
also
plot
ted
over
the
rain
rate
.T
heso
lidlin
epr
esen
tsth
e
real
rain
rate
.T
heda
shlin
ere
pres
ents
the
linea
rre
gres
sion
.

29
the afternoon in most of the ocean regions. Except in the high latitudes of South Pacific
Ocean, the diurnal cycle peaks at about 0930 LST was found and in the high latitudes of
East Pacific Ocean, the diurnal cycle was found to peak at about 2330 LST. The sinusoidal
plot of the rain rate in Fig. 8 and Fig. 9 also clearly shows the diurnal with a maximum
in the early morning and a minimum in the later afternoon, as shown in the histogram
figure, except for the high latitudes of the South Pacific Ocean and the high latitudes of
East Pacific Ocean. This result does not indicate a relation between the diurnal cycle and
the rain rate in the ocean region as suggested in Chang et al. (1995). Studying the peak
of precipitation features with and without Mesoscale Convective Systems (MCS) over the
ocean, Nesbitt and Zipser (2003) concluded the diurnal cycle of rainfall over the ocean is
almost completely due to an increase of the number of systems, not the rain rates contained
in them. Dai (2001) obtained similar patterns derived from global surface weather reports.
The results in the present study confirm this conclusion.
Fig. 10 shows the exact time when the maximum rain rate occurred as indicated on
a 24-hour clock in each region. This result agrees with most previous work, except in
some regions. In previous works, besides Chang et al. (1995) found afternoon maxima in
the dry ocean zone, afternoon maxima ( Albright et al. (1985)) or near noontime maxima
( Meisner and Arkin (1987)) in the SPCZ region were also found. McGarry and Reed
(1978)) showed afternoon maxima over the western Atlantic Ocean near the African coast.
Meisner and Arkin (1987) showed that the diurnal cycle over ocean was evident only in the
ITCZ, which does not agree with this paper either.
Fig. 11 shows the ratio of diurnal variation to the mean rain rate. This ratio is much
lower for the ocean regions than those of the land. In general, the ratio of variation is a
little higher in the dry regions than in the regions with heavy rain. Our observed amplitude
variation is not as large as in the results of Gray and Jacobson (1977) who showed that
heavy rainfall was two or three times greater in the morning than in the late afternoon

30
30N
30S
180E
24 12
1806
24 12
1806
24 12
1806
24 12
1806
24 12
1806
24 12
1806
24 12
1806
24 12
1806
24 12
1806
24 12
1806
24 12
1806
24 12
1806
24 1212
1806
18
24 12
06
12
06
24
18
24 12
1806
90E
90W
Fig.
10.T
helo
cal
time
whe
nth
em
axim
umra
inra
teha
ppen
sin
each
regi
on.
The
regi
ons
encl
osed
with
heav
ylin
esar
ere
gion
s
with
heav
yra
in.

31
30N
30S
180E
22.4
%
21.9
%13
.2%
26.3
%
11.7
%
10.3
%
6.9%
13.4
%
5.8%
10.6
%
7.0%
5.1%
5.6%
7.2%
21.4
%
17.0
%
90E
90W
Fig.
11.T
hera
tioof
prec
ipita
tion
vari
atio
nto
the
mea
nra
inra
tein
each
regi
on.
The
regi
ons
encl
osed
with
heav
ylin
esar
eth
e
regi
ons
with
heav
yra
in.
32
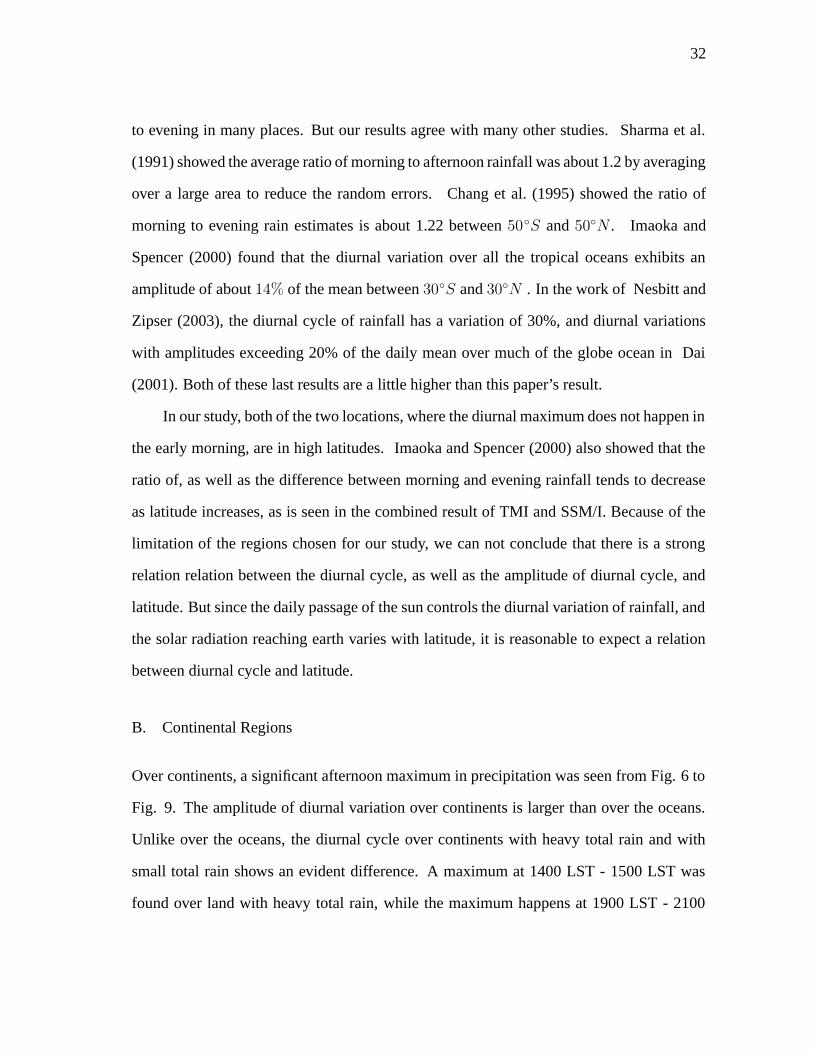
to evening in many places. But our results agree with many other studies. Sharma et al.
(1991) showed the average ratio of morning to afternoon rainfall was about 1.2 by averaging
over a large area to reduce the random errors. Chang et al. (1995) showed the ratio of
morning to evening rain estimates is about 1.22 between 50◦S and 50◦N . Imaoka and
Spencer (2000) found that the diurnal variation over all the tropical oceans exhibits an
amplitude of about 14% of the mean between 30◦S and 30◦N . In the work of Nesbitt and
Zipser (2003), the diurnal cycle of rainfall has a variation of 30%, and diurnal variations
with amplitudes exceeding 20% of the daily mean over much of the globe ocean in Dai
(2001). Both of these last results are a little higher than this paper’s result.
In our study, both of the two locations, where the diurnal maximum does not happen in
the early morning, are in high latitudes. Imaoka and Spencer (2000) also showed that the
ratio of, as well as the difference between morning and evening rainfall tends to decrease
as latitude increases, as is seen in the combined result of TMI and SSM/I. Because of the
limitation of the regions chosen for our study, we can not conclude that there is a strong
relation relation between the diurnal cycle, as well as the amplitude of diurnal cycle, and
latitude. But since the daily passage of the sun controls the diurnal variation of rainfall, and
the solar radiation reaching earth varies with latitude, it is reasonable to expect a relation
between diurnal cycle and latitude.
B. Continental Regions
Over continents, a significant afternoon maximum in precipitation was seen from Fig. 6 to
Fig. 9. The amplitude of diurnal variation over continents is larger than over the oceans.
Unlike over the oceans, the diurnal cycle over continents with heavy total rain and with
small total rain shows an evident difference. A maximum at 1400 LST - 1500 LST was
found over land with heavy total rain, while the maximum happens at 1900 LST - 2100

33
LST over land with small total rain. This result agrees with the work of Nesbitt and
Zipser (2003) as well. Studying the number of variations of precipitation features with
and without ice scattering over land and mean conditional rain rate, they observed that
increased numbers of systems containing higher rain rates control the diurnal rainfall cycle
for over-land precipitation features with and without ice scattering. In their work, they
found that there is a sharp early afternoon peak at 1500 LST in over-land rainfall within
a given latitude band. Dai (2001) obtained a similar global result. A relative minimum
of precipitation of total rain in the morning around 0900 LST was found in Nesbitt and
Zipser (2003). In this paper a relative minimum of precipitation was also found in the bin
of 0800 LST - 1000 LST in the heavy rain region in Fig. 6. It also agrees with their work.
Sorooshian et al. (2002) found the convection over the Amazon maximizing from 1600
to 1800 linked to afternoon heating, leading to a precipitation maximum is a little later
compared with our work.
Unlike the ocean, the ratio of variation to the mean rain rate over continents with heavy
total rain and with small total rain does not show much difference in Fig. 11. In Nesbitt
and Zipser (2003), the precipitation over land has a magnitude variation of 125%, which is
larger than our result.
C. Island Regions
The Maritime Continent region in Southeast Asia represents a unique geographic region
that contains large islands, narrow peninsulas, and complex terrain surrounded by large
oceanic and continental areas. In our data, only the south part of the Maritime Continent
showed a statistically significant feature. In this work, the peak rainfall over islands is at
about 0800 LST, which is a little later than the time the ocean maximum happens and is
much earlier than that time for land. The ratio of diurnal variation over islands is also more

34
similar to that of ocean than that of continents. Since the region chosen to study island
diurnal cycle is with heavy rain, then the ratio of variation of islands is larger than that of
ocean with heavy and less than that of land with heavy of rain.
Gray and Jacobson (1977) found that some tropical islands exhibit both morning
and afternoon maxima, and attributed this to the combination of maritime and continental
forcings. Sorooshian et al. (2002) found the occurrence of convection strongly centered on
1500 during the midafternoon over Malaysia. Oki and Musiake (1994) found the diurnal
cycle of precipitation in Japan can be classified into three groups. The coastal regions have
precipitation peak in the morning. In the inland region both morning and afternoon peaks
were found in June, when it is a rainy season related to the southwest Asian monsoon. In
the third group, no morning peak was observed in the stations but a comparatively strong
evening peak. In the Malay Peninsula, the inland region has a pronounced peak of rainfall
at 1600 LST. The morning peak of precipitation is observed during the southwest monsoon
on the west coast and during the northeast monsoon season on the east coast. Combined
these works with the result in this paper, it suggests that in an extension of island alone the
precipitation shows a afternoon diurnal peak as continents. But this will be influenced by
monsoon and land-sea breezes, that’s morning precipitation peak can be observed in the
coastal regions and morning-afternoon double peaks in inland regions. When we study the
Maritime continent region as a whole, which includes oceans, islands and continents, it
represents a precipitation diurnal feature similar to that of ocean.
After checking all the rain rate in each region in each time interval, we found the diurnal
cycle discussed previously was not caused simply by the passing of some storms.

35
D. Seasonal and Annual Change
Since the daily passage of the sun controls the diurnal variation of rainfall, it is reason-
able to expect a weaker diurnal signal during the winter season, regardless of its precise
mechanism. Fig. 12 and Fig. 13 show the rain rate diurnal cycle in each season. Over con-
tinents, the rain rate diurnal cycle in JJA is weaker than the other seasons in the Southern
Hemisphere. While in North Africa the diurnal cycle in JJA is evident. This shows that
the diurnal cycle over continents in JJA is stronger with latitude as we move northward.
The same feature can be seen from DJF season. The diurnal cycle over continents in DJF
weakens with latitude moving northward. Over the islands, the variation is almost the same
in each of the four seasons. Over the ocean, in some regions, the variation is almost the
same over different seasons. In some regions, the variation is different in some seasons
from the others. The diurnal cycle in the spring season shows a midnight maximum over
the Northeast Pacific ocean region. The diurnal cycle in the winter season exhibits the
morning maximum over the Indian ocean region and the south Atlantic Ocean region. Due
to the smaller response of water surface temperature to radiational heating and cooling, the
seasonal change over oceans with latitude is not so evident as that over continents. There
is no clear conclusion to be drawn here. But we can conclude that there is a diurnal cy-
cle seasonal change in some ocean regions. Some data sets used in previous studies only
include part of the year, such as GATE, which only has summer observations, the diurnal
cycle detected in these works may not represent the diurnal cycle over the whole year.
Fig. 14 and Fig. 15 show the rain rate in each year from 1998 to 2002. There is no
evident diurnal cycle that can be detected in some years in the ocean regions. But in most
continental regions the diurnal detected in an individual year agrees with the diurnal cycle
in the five-year averages. In the island region in this study the diurnal cycle detected in a
single year also agrees the diurnal cycle in five-year averages.

36
0E
90
E1
80
E
30
N
30
S
Fig.
12.T
hera
inra
tew
ithth
etim
eof
the
day
inea
chse
ason
inE
astT
ropi
cs.T
hebl
ack
line
repr
esen
tsth
era
inra
tein
MA
M;T
he
red
line
for
JJA
;T
hegr
een
line
for
SON
;T
hebl
uelin
efo
rD
JF.T
here
gion
sen
clos
edw
ithhe
avy
lines
are
the
regi
ons
with
heav
yra
in.

37
18
0W
90
W0
W
30
N
30
S
Fig.
13.
The
sam
eas
Fig.
12,b
utth
era
inra
tew
ithth
etim
eof
the
day
inea
chse
ason
inW
estT
ropi
cs.

38
0E
90
E1
80
E
30
N
30
S
Fig.
14.T
hera
inra
tew
ithth
etim
eof
the
day
inea
chye
arin
Eas
t.T
hebl
ack
line
repr
esen
tsth
era
inra
tein
year
1998
;T
he
yello
wlin
efo
rye
ar19
99;
The
gree
nlin
efo
rth
eye
ar20
00;
The
red
line
for
the
year
2001
;T
hebl
uefo
rth
eye
ar20
02.
The
regi
ons
encl
osed
with
heav
ylin
esar
eth
ere
gion
sw
ithhe
avy
rain
.

39
18
0W
90
W0
W
30
N
30
S
Fig.
15.
The
sam
eas
Fig.
14,b
utth
era
inra
tew
ithth
etim
eof
the
day
inea
chye
arin
Wes
tTro
pics
.

40
CHAPTER VI
CONCLUSIONS
Data from the TMI and PR sensors of TRMM have been analyzed for the period from Jan
1998 to Dec 2002 over the tropical region between 30◦S and 30◦N to study the diurnal
variability of rainfall. The observations are sorted according to ocean, island and continen-
tal surfaces. Considering the sampling characteristics of TRMM, the rain rate is binned in
two-hour intervals of local time in each specific area. A maximum in precipitation at 0400
LST - 0700 LST was found in most ocean regions. The amplitude of variation over the
dry ocean zones is a little higher than that over the oceanic regions with heavy total rain.
The diurnal cycle peaks at 0700 LST - 0800 LST in regions including islands with rainfall
variation similar to oceanic regions. A maximum at 1400 LST - 1500 LST was found over
continents with heavy total rain, while the maximum occurred at 1900 LST - 2100 LST
in the dry continental regions. The amplitude of variation over continents with heavy total
rain and with light total rain do not show distinguishable differences. The diurnal cycle
in in JJA and DJF varies with latitude over continents. The diurnal cycle seasonal change
can also be found in some ocean regions. A diurnal cycle annual change is not evident
over continents, while the diurnal cycle annual change over oceans exists in some regions.
Island regions in this study show no evident seasonal or annual diurnal change.
Even though the sampling considerations suggest that the TRMM satellite can detect
the diurnal cycle of rainfall using five years of data in the regions chosen for the study, in
some cases the inferred diurnal variations may be erroneous. As the averaging area be-
comes smaller or the averaging period becomes shorter, the error may increase and there-
fore the combination becomes more important. The TRMM observations should be used
in addition to the data from other satellites to minimize the effect of discrepancies between
satellite sampling and rainfall activity in the later work. This particular case demands that

41
a suitable approach must be adopted to determine the diurnal variations of rainfall robustly
and with certainty. One possible approach may be the use of TRMM data in combination
with data from other satellites with similar sensors, such as SSM/I.
The regions chosen in the study are limited. With more data accumulated or with data
combined TRMM data with other satellite data to reduce the sampling error, more regions
can be used for study and more diurnal features can be concluded. With more regions
for the study in the further work, the relation between diurnal cycle and latitude can be
confirmed.

42
REFERENCES
Adler, R. F., A. J. Negri, P. R. Keehn, and I. M. Hakkarinen, 1993: Estimate of monthly
rainfall over Japan and surrounding waters from a combination of low-orbit microwave
and geosynchronous IR data. J. Appl. Meteor., 32, 335–356.
Albright, M. D., E. E. Recker, R. J. Reed, and R. Dang, 1985: The diurnal variation of
deep convection and inferred precipitation in the central tropical Pacific during January-
February 1979. Mon. Wea. Rev., 113, 1663–1680.
Bell, T. L. and N. Reid, 1993: Detecting the diurnal cycle of rainfall using satellite obser-
vations. J. Appl. Meteor., 32, 311–322.
Chang, A. T., L. S. Chiu, and G. Yang, 1995: Diurnal cycle of oceanic precipitation from
SSM/I data. Mon. Wea. Rev., 123, 3371–3380.
Collier, J. C. and K. P. Bowman, 2004: The diurnal cycle of tropical precipitation in a
general circulation model. J. Geophys. Res., submitted.
Dai, A., 2001: Global precipitation and thunderstorm frequencies. Part II: Diurnal varia-
tions. J. Climate, 14, 1112–1128.
Dai, A., F. Giorgi, and K. E. Trenberth, 1999: Observed and model-simulated diurnal cycles
of precipitation over the contiguous United States. J. Geophys. Res., 104, 6377–6402.
Gray, W. M. and R. W. Jacobson, 1977: Diurnal variation of deep cumulus convection.
Mon. Wea. Rev., 105, 1171–1188.
Hartmann, D. L. and E. E. Recker, 1986: Diurnal variation of outgoing longwave radiation
in the tropics. J. Climate Appl. Meteor., 25, 800–812.

43
Hendon, H. H. and K. Woodberry, 1993: The diurnal cycle of tropical convection. J. Geo-
phys. Res., 98, 16623–16637.
Imaoka, K. and R. W. Spencer, 2000: Diurnal variation of precipitation over the tropical
oceans observed by TRMM/TMI combined with SSM/I. J. Climate, 13, 4149–4158.
Kummerow, C. D., W. Barnes, T. Kozu, J. Shiue, and J. Simpson, 1998: The tropical
rainfall measuring mission (TRMM) sensor package. J. Atmos. Ocean. Tech., 15, 809–
817.
Liu, C. and M. W. Moncrieff, 1998: A numerical study of the diurnal cycle tropical oceanic
convection. J. Atmos. Sci., 55, 2329–2344.
McGarry, M. M. and R. J. Reed, 1978: Diurnal variations in convective activity and pre-
cipitation during phases II and III of GATE. Mon. Wea. Rev., 106, 101–113.
Meisner, B. and P. Arkin, 1987: The relationship between large-scale convective rainfall
and cold cloud over the Western Hemisphere during 1982-84. Mon. Wea. Rev., 115, 51–
74.
Negri, A. J., L. Xu, and R. F.Alder, 2002: A TRMM-calibrated infrared rainfall algorithm
applied over Brazil. J. Geophys. Res., doi:10.1029/2000JD000265.
Nesbitt, S. W. and E. J. Zipser, 2003: The diurnal cycle of rainfall and convective intensity
according to three years of TRMM measurements. J. Climate, 16, 1456–1475.
Oki, T. and K. Musiake, 1994: Seasonal change of the diurnal cycle of precipitation over
Japan and Malaysia. J. Appl. Meteor., 33, 1445–1463.
Randall, D. A., Harshvardhan, and D. A. Dazlich, 1991: Diurnal variability of the hydro-
logical cycle in a general circulation model. J. Atmos. Sci., 48, 40–62.

44
Salby, M. L. and P. Callaghan, 1997: Sampling error in climate properties derived from
satellite measurements: Consequences of undersampled diurnal variability. J. Climate,
10, 18–36.
Sharma, A. K., T. C. Chang, and T. T. Wilheit, 1991: Estimation of the diurnal cycle of
oceanic precipitation from SSM/I data. Mon. Wea. Rev., 119, 2168–2175.
Simpson, J., R. F. Adler, and G. R. North, 1988: A proposal tropical rainfall measurement
mission (TRMM) satellite. Bull. Am. Meteorol. Soc., 69, 278–294.
Sorooshian, S., X. Gao, K. Hsu, R. A. Maddox, Y. Hong, H. V. Gupta, and B. Imam,
2002: Diurnal variability of tropical rainfall retrieved from combined GOES and TRMM
satellite information. J. Climate, 15, 983–1001.
Xu, L., X. Gao, S. Sorooshian, P. A. Arkin, and B. Imam, 1999: A microwave infrared
threshold technique to improve the GOES precipitation index. J. Appl. Meteor., 38, 569–
579.
Young, G. Y. and J. Slingo, 2001: The diurnal cycle in the tropics. Mon. Wea. Rev., 129,
784–801.

45
VITA
Qiaoyan Wu was born in Yiwu, Zhejiang Province, China on January 26, 1980. In
July of 2001 she graduated from Nanjing University with a Bachelor of Science in Atmo-
spheric Sciences. From September 2001 to July 2002 she was a member of Key Laboratory
for Mesoscale Severe Weather in Nanjing University. In August 2002 she came to Texas
A&M University as a graduate student. She may be reached at Department of Atmospheric
Sciences, Texas A&M University,77843 through 2004 to 2007.