Embed Size (px)
Citation preview

Wood Burner Testing Christchurch 2009:
Diurnal variation in emissions, wood use, indoor temperature and factors influencing start-up
Prepared for Ministry of Science and Innovation
June 2012

© All rights reserved. This publication may not be reproduced or copied in any form without the permission of the copyright owner(s). Such permission is only to be given in accordance with the terms of the client’s contract with NIWA. This copyright extends to all forms of copying and any storage of material in any kind of information retrieval system.
Whilst NIWA has used all reasonable endeavours to ensure that the information contained in this document is accurate, NIWA does not give any express or implied warranty as to the completeness of the information contained herein, or that it will be suitable for any purpose(s) other than those specifically contemplated during the Project or agreed by NIWA and the Client.
Authors/Contributors: Emily Wilton Jeff Bluett
For any information regarding this report please contact: Guy Coulson Group Manager, Air Quality Scientist Urban Air Quality & Health +64-9-375 4503 [email protected] National Institute of Water & Atmospheric Research Ltd 41 Market Place Auckland Central 1010 Private Bag 99940 Newmarket Auckland 1149 Phone +64-9-375-2050 Fax +64-9-375-2051
NIWA Client Report No: AKL 2012-020 Report date: June 2012 NIWA Project: ATHS12101

Wood Burner Testing Christchurch 2009:
Contents
Executive summary .............................................................................................................. 5
1 Introduction ................................................................................................................. 7
1.1 Background .......................................................................................................... 7
1.2 Real life emissions testing of domestic wood burners........................................... 8
1.3 Current study objectives ....................................................................................... 9
2 Method ......................................................................................................................... 9
2.1 Sampling programme ........................................................................................... 9
2.2 Data collected ...................................................................................................... 9
2.3 Data Analysis ..................................................................................................... 11
3 Results ....................................................................................................................... 11
3.1 Temporal and house to house variations in PM10 emissions ............................... 11
3.2 Wood fuel use by householders ......................................................................... 15
3.3 Impacts of wood burner use on indoor temperature, CO, PM10 and RH .............. 19
3.4 Factors influencing start up ................................................................................ 20
3.5 Factors influencing burn duration and fuel consumption ..................................... 26
4 Conclusion................................................................................................................. 28
5 Recommendations .................................................................................................... 30
6 Acknowledgements ................................................................................................... 31
7 References ................................................................................................................. 32
Appendix A Daily household data for households three and six ................................. 34
Tables Table 3-1: Hourly average PM10 emissions (g/hr) and average household diurnal
profile in emissions (% daily total per hour). 13
Table 3-2: Summary burner and fuel data. 14
Table 3-3: Summary wood consumption. 16
Table 3-4: Wood moisture and emissions data 2007 and 2009 testing. 18

Wood Burner Testing Christchurch 2009:
Figures Figure 3-1: Daily variations in particulate emissions from wood burners. 12
Figure 3-2: Average daily emissions profile for households. 12
Figure 3-3: Diurnal variation in average flue particulate, flue temperature, indoor PM10 and wood use per household. 15
Figure 3-4: Comparison of wood moisture content and emission rate (g/kg dry). 17
Figure 3-5: Daily variations in wood use and impacts on room temperature, indoor relative humidity and indoor CO concentrations. 20
Figure 3-6: Influence of ambient temperature variables on fire start up time. 22
Figure 3-7: Influence of room temperature on start time. 24
Figure 3-8: Start times by day of the week. 25
Figure 3-9: Influence of ambient temperature on burn duration. 26
Figure 3-10: Influence of ambient temperature on fuel consumption. 27
Figure A-1: Daily household data for household three. 35
Figure A-2: Daily household data for household six. 36
Reviewed by Approved for release by
Guy Coulson……………………… Ken Becker…………………… Formatting checked by
Beverley Wilson..…………………

Wood Burner Testing Christchurch 2009: 5
Executive summary The objective of this study is to utilise the data collected in the Christchurch 2009 real life
study to provide further improvement to emission inventories by:
• Determining a diurnal profile for PM10 emissions from domestic home heating.
• Measuring the weight of wood used by householders to heat their homes
• Assessing the impacts of wood burner use on indoor temperature, relative humidity,
CO and PM10
• Investigating factors that influence the start-up of domestic woodburners
This report summarises data relating to emissions from wood burners, operational aspects
such as daily burner operation and fuel consumption and influences of burner operation on
variables such as temperature and indoor air quality that was collected as part of the real-life
emissions monitoring programme undertaken in Christchurch in 2009.
Data were collected from six households with 1.5 and 1.0 g/kg compliant wood burners over
a week during winter 2009 in Christchurch. Measurements of flue particulate, flue
temperature, indoor temperature, indoor carbon monoxide, indoor relative humidity and wood
use were collected at one minute intervals throughout the day. In addition indoor particulate
concentrations were measured at two households.
Flue particulate data were collated to give an average temporal profile of emissions from
domestic home heating. This is a major advancement in our understanding of daily
variations in emissions from wood burners and will be of value to those requiring details of
hourly emissions from this source for atmospheric dispersion modelling. One limitation in
this profile however, is the small sample size and it is recommended that the profile be
refined with the addition of further sampling.
The average amount of fuel used per day was collected via electronic scales located under
the wood basket. The average daily fuel consumption for all households was 15.4 kilograms
per day. This is consistent with values estimated for Christchurch in the early 2000s (as
reported in Wilton, 2004) but lower than the 23 kilograms per day assumed in the
Environment Canterbury projections modelling (Angie Scott, pers comm. 2005). Further
sampling of wood use in households in Christchurch is recommended to provide a more
robust estimate of daily fuel consumption.
In previous studies the moisture content of the wood had an impact on particulate emissions.
In this study the average moisture content of the wood for each household was estimated
based on measurements of three wood samples per household. The average wood moisture
contents per household ranged from 15% to 23%. Wood fuel moisture did not appear to be a
major determinant of particulate emissions in the six households in this study. However
detailed analysis similar to that carried out for the 2007 study was not undertaken owning to
the relatively small number of households.
6 Wood Burner Testing Christchurch 2009:
Start-up times were evaluated to determine if variables such as ambient temperature or room
temperature were key determinants of use of the wood burners. In the absence of any
relationships between these variables it is assumed that individual lifestyle factors, such as
work schedules, have the greatest influence on start time.
A key concern highlighted in the 2007 testing is the variability in average emissions from
NES compliant burners from different locations in New Zealand. It is uncertain whether
some location specific factors are influencing emissions from different urban areas or
whether the differences are a function of the small sample sizes. To date, 24 households
with NES compliant burners have been tested. Further tests are required and additional
investigations into location specific factors are recommended.
An evaluation of particulate emissions from the testing programme was reported in Bluett &
Meyer (2011). They found an average emission rate from this study of 7 g/kg and that
combining the results of this testing with previous studies raised the average emission rate
from NES compliant burners from 3.3 g/kg to 4.3 g/kg (wet weight).
The impact of variability in the emission factor and the operational aspects examined in this
report on current emission inventories is minimal as few areas have a high proportion of NES
compliant burners (the main exception being Christchurch). The potential impact on
management options assessments is much greater, however, as such assessments are very
sensitive to changes in emission factors for NES compliant burners. Because of the potential
variability in inter-household emission rates and inter-region variability, a multi tool approach
to evaluating the effectiveness of management options is recommended. Investigations into
regional emission rates, evaluation of trends in both concentrations and emissions and
consideration of the inclusion of management options to minimise the impact of gross
emitters in Regional Plans is recommended.

Wood Burner Testing Christchurch 2009: 7
1 Introduction
1.1 Background In New Zealand, concentrations of particulate matter (PM10) regularly exceed the National
Environmental Standard (NES) of 50 µg/m3 (24 hour average) in urban areas. The main
source of PM10 is solid fuel burning for domestic home heating. Wood burning is the major
contributor in most areas, although on the West Coast and in Southland domestic coal
burning is the key concern in many towns.
To address the ambient PM10 problem at a national level, the NES also contains a design
standard for new woodburner installations in urban areas. From September 2005, all
woodburners installed on properties less than 2 ha in size have been required to have a
thermal efficiency greater than 65% and emission rate less than 1.5 g/kg, when tested to
AS/NZS4012 and AS/NZS4013 respectively. It is essential to identify the real life emissions
from these low emission woodburners, because in many urban areas further management
measures are necessary to achieve air quality objectives.
The main tool for determining sources of emissions and subsequently assessing the
effectiveness of management options are emission inventories.
When constructing emission inventories, fuel use data are usually obtained and emissions
are then estimated via the application of emission factors that specify grams of particulate
emitted for every kilogram of fuel burnt (g/kg). Emission inventories are essential for local
authorities to identify the dominant sources that contribute to exceedances of the air quality
guidelines and standards. Projections models are also commonly used tools and provide
local authorities with predictions of future emissions under various management scenarios.
The decisions that Councils make to address air quality issues will often be based on
emissions inventories and projections models.
The quality of both emission inventories and projections models depend on emission factors
and fuel use data. Representative emissions estimates and accurate fuel use data are
therefore essential for local authorities to effectively manage air quality issues. Using
inaccurate emission factors and fuel use data will lead to poor and potentially ineffective
estimation of the reductions in PM10 emissions required to meet NES and regional plan air
quality targets.
To enhance the quality of emission inventories and projections models a number of studies
have been undertaken to measure the real life emissions from wood burners.

8 Wood Burner Testing Christchurch 2009:
1.2 Real life emissions testing of domestic wood burners A number of studies have been carried out in New Zealand on emissions from older wood
burners (Wilton et. al, 2006) and from NES compliant wood burners (Smith et. al. 2008,
Wilton & Bluett, 2010, Kelly, et. al., 2007).
In 2007, real life emission testing was carried out in 18 households spread across Nelson,
Taumarunui and Rotorua. The method for the former work is detailed in Smith, et. al., 2008.
The objective of that study was to identify an appropriate PM10 emission factor for
representing low emission woodburners in dispersion modelling applications and emission
inventories. Average dry weight and average wet weight emission factors were calculated
for each woodburner in the study. The mean emission factor for dry weight was 4.6 g/kg and
the mean emission factor for wet wood was 3.3g/kg
The report found that the in situ wet-weight emission factor of 3.3 g/kg is around three times
smaller than the emission factor of 11 g/kg identified for pre-1994 woodburners (Wilton et al.
2006). The 2006 testing was aligned with the Ministry for the Environment (MfE) “warm
homes” pilot project for Tokoroa for 2005 which replaced 19 existing older burners and open
fires (in separate households) with NES compliant burners, wood pellet fires and non-solid
fuel alternatives.
The main factors influencing emissions from the 2006 testing of older wood burners were
average flue temperature and flue oxygen. Operational aspects that influenced these
variables were kilograms of fuel burnt, sample duration, fuel moisture content, operational
setting, and number of pieces and weight of wood used throughout the sample period.
A further study of operational factors influencing particulate emissions was carried out based
on the 2007 testing of NES compliant burners (Wilton & Bluett, 2010). The key determinants
influencing emissions from that study were found to be wood moisture, flue temperature, and
oxygen, which explained 67% of the variability. Of these wood moisture had the greatest
influence resulting in 43% of the variability. The majority (72%) of households in the survey
did not appear to increase their fuel consumption when the daily temperature decreased.
In 2009, real life emission testing was carried out in 6 households in Christchurch The
approach used differed to that undertaken in 2007 and particulate emission data were
collected with a one minute resolutions. The method for this work is detailed in Meyer, et. al.,
2008. The objective of that study was to identify an appropriate PM10 emission factor for
representing low emission woodburners in dispersion modelling applications and emission
inventories. The results of this investigation are presented in Bluett and Meyer (2011).
Average mean wet weight emission factors were calculated for the woodburners monitored in
the study as 7.3g/kg .

Wood Burner Testing Christchurch 2009: 9
1.3 Current study objectives The objective of this study is to utilise the data collected in the Christchurch 2009 real life
study to provide further improvement to emission inventories by:
• Determining a diurnal profile for PM10 emissions from domestic home heating.
• Measuring the weight of wood used by householders to heat their homes
• Assessing the impacts of wood burner use on indoor temperature, relative humidity,
CO and PM10
• Investigating factors that influence the start-up of domestic woodburners
2 Method
2.1 Sampling programme The monitoring took place in Christchurch between 26 May and the 19 August 2009. Two
emission test units were deployed to sample the emissions of six houses (each test unit
monitored three houses). The test houses were randomly chosen from Christchurch City
Council records which showed which homes had installed what type of wood burner over the
last five years. A total of 20 houses were invited to participate in the test programme. As an
incentive the householders were offered a small gratuity for agreeing to host the test kit.
Approximately 12 householders accepted the invitation, of which six houses proved to be
practical test sites. Four of these houses had installed wood burners that meet the
Environment Canterbury 1.0 g/kg laboratory emission test standard and two houses had
wood burners that meet the National Environmental Standard 1.5 g/kg laboratory emission
test standard. The householders were instructed to operate their wood burners as they would
under normal circumstances.
2.2 Data collected The domestic wood burner emission monitoring system used in this study is described in
detail in Meyer et al., (2008). The following section provides a brief overview of the major
system components. The wood-heater emissions monitoring system comprises three units: a
smoke sampling unit, an analysis unit, and a power supply. The smoke sampler consists of a
1.2 m flue extension, 150 mm in diameter with a 100 mm orifice plate fitted 100 mm from one
end. The orifice plate provides the means of measuring the flue gas volumetric flow rate.
Flue temperature is measured using paired 1/16” stainless steel sheathed type K
thermocouples. Flue gas flow rate is determined by the pressure differential across the orifice
plate. Midway along the flue extension a smoke sample is drawn via inlet driven by a venturi.
Clean air at a dewpoint of approximately 4oC powers the venturi jet and also dilutes the
smoke sample to reduce its dewpoint.

10 Wood Burner Testing Christchurch 2009:
The smoke sample is not drawn from the flue under iso-kinetic conditions. If the particles
being sampled were large and had relatively high momentum, this could potentially lead to a
distortion of both the mass concentration and particle size distribution of samples. However
the particles being sampled are less than 2.5 µm in diameter and therefore any potential
distortion created by non-iso-kinetic sampling is considered to be minimal.
Two airstreams are drawn from the primary diluter to the analysis unit. The sample air stream
for particle analysis is drawn through ¼” copper tubing where it is further diluted in the
analysis unit to bring the particle concentration into the measurement range of the particle
analyser (DustTrak, TSI, USA). The diluter is a loop injector which pulses 5 ml of sample gas
into a stream of clean air. The loop volume, the injection valve duty cycle, and the flow rate of
the dilution air were selected to produce a dilution ratio of approximately 1: 80. The sample
airstream for CO and CO2 analysis is drawn through ¼” PFA Teflon to the analysis unit
where it is filtered and further diluted before passing to the CO2 and CO sensors. CO2
concentration is measured by NDIR (Gascard II, 10,000 ppm range, Edinburgh Instruments,
UK) and CO is measured with Polytron-2 electrochemical sensor (0-1000 ppm range,
DrägerSensor CO – 68 09 605, Draeger, PA, USA).
All critical air flow rates, temperature and humidity are measured. The particle, chemical, flow
and temperature sensor signals are monitored using appropriate industrial data acquisition
interface devices (ADAM model 4017, 4017+,4018, and 4069, Advantech, OH, USA). The
analysis unit is located at ground level; external to the house but as close to the flue as
practicable. This unit houses all the air supplies, pumps, filters, zero scrubbers, analytical
sensors, data acquisition system and controller, and telemetry. Power to the system is
supplied by a high capacity battery charger, supplying a series of DC to-DC converters which
in turn provide regulated power to the system components. A 12V 80Ah low maintenance
lead/acid battery connected in parallel to the power supply provides limited backup power in
the event of a power failure.
A dual tracer method was developed for calculating PM10 emission factors from CO and CO2
data collected by the real-world sampling method. This method used for calculating PM10
emission factors is detailed in Meyer et al., (2008).
Indoor PM10 measurements were made using a TSI AM510 ‘Sidepak’ aerosol monitor set to
log at one minute intervals. The method is an integrating nephelometer, which measures
light scattering and is not directly comparable to reference methods. In the absence of a
source specific adjustment factor to relate light scattering to mass (for wood burning) the
default setting was used. As this is based on Arizona road dust and is unlikely to be
appropriate for wood combustion, in this study the measurements made are treated as
relative rather than absolute.

Wood Burner Testing Christchurch 2009: 11
2.3 Data Analysis The main analysis methods used were examination of temporal profiles either on a daily
basis or averaged hourly (typically for each household) across the study period. These
included evaluations of parameters for hours when the wood burner was and wasn’t
operating. The variable used as an indicator of this was flue temperature and a value of 50
degrees was selected as an indicator. This value was selected after examining start up and
background flue temperature profiles in conjunction with other data such as fuel loading,
PM10 emissions and room temperature.
3 Results
3.1 Temporal and house to house variations in PM10 emissions
3.1.1 Diurnal variation of PM10 emissions from wood burners
The diurnal variation in particulate emissions was assessed by averaging particulate data
(g/hr) for each household by hour of the day. These were then averaged to give an overall
average for households across the study (Figure 3.1). The above distribution is weighted
more towards the diurnal profiles for the higher emitting households. This method of
averaging is appropriate to derive an average profile for emission inventory or modelling
purposes because higher emitting households will have greater influence on diurnal
variations in PM10 concentrations. An alternative averaging method is shown in Figure 3.2.
This shows the average household emissions profile, assuming they all have the same
emission rate. The latter method provides a better indication of the average household
emissions profile.
Figure 3.1 and 3.2 demonstrate that the results provide good resolution of emission rates at
the 1-hour averaging period and that there is considerable variation in hourly PM emissions
throughout the day. The hours 00:00 to 14:00 have relatively low emission rates, the
emission rates increase rapidly from about 15;00 to 18:00, then on weekdays drop off quickly
and constantly to a low level at midnight.

12 Wood Burner Testing Christchurch 2009:
Figure 3-1: Daily variations in particulate emissions from wood burners.
Figure 3-2: Average daily emissions profile for households.
Differences between weekday and weekend burner use are reflected in Figures 3.1 and 3.2.
While generally similar the wood burner start-up appears delayed in the weekend, relative to
weekdays and wood burner use appears to be prolonged in the weekend with a second
evening peak in emissions occurring around 10pm, most probably associated with an
additional late evening loading of the firebox.
Table 3.1 details the hourly average particulate emissions from Figure 3.1 based on grams
per hour (g/hr) and as a percentage of total emissions.
0
5
10
15
20
25
30
35
40
45
0:0
0
2:0
0
4:0
0
6:0
0
8:0
0
10
:00
12
:00
14
:00
16
:00
18
:00
20
:00
22
:00
gra
ms
pe
r h
ou
r
All days
Weekdays
Weekends
0%
2%
4%
6%
8%
10%
12%
14%
0:0
0
2:0
0
4:0
0
6:0
0
8:0
0
10
:00
12
:00
14
:00
16
:00
18
:00
20
:00
22
:00
Pe
rce
nta
ge
of
da
ily
em
issi
on
s
All days
Weekdays
Weekends

Wood Burner Testing Christchurch 2009: 13
Hour 0:00 1:00 2:00 3:00 4:00 5:00 6:00 7:00 8:00 9:00 10:00 11:00 12:00
All days g/hr 3.8 3.5 3.6 4.5 1.4 0.3 2.8 3.3 6.4 7.3 3.7 5.5 7.1
Weekdays g/hr 4.4 4.8 2.7 5.2 1.9 0.3 3.2 3.3 7.8 8.2 5.1 3.0 4.8
Weekends g/hr 2.6 0.3 6.1 2.5 0.2 0.1 1.8 3.0 3.6 4.9 0.7 10.4 11.9
All days % daily total/hr 1.8% 1.8% 2.0% 3.0% 0.9% 0.1% 1.1% 1.6% 2.8% 3.5% 1.6% 1.8% 2.7%
Weekdays % daily total/hr 2.0% 2.5% 1.5% 3.2% 1.1% 0.2% 1.3% 1.8% 4.0% 4.6% 2.6% 1.6% 2.6%
Weekends % daily total/hr 2.3% 0.2% 4.7% 2.8% 0.2% 0.1% 0.7% 0.8% 1.0% 1.0% 0.3% 2.2% 3.3%
Hour 12:00 13:00 14:00 15:00 16:00 17:00 18:00 19:00 20:00 21:00 22:00 23:00 00:00
All days g/hr 7.1 5.2 7.2 8.9 13.1 21.5 16.8 15.6 13.4 13.5 19.4 9.1 7.1
Weekdays g/hr 4.8 6.1 4.6 8.2 12.3 21.6 13.1 12.4 13.6 10.5 9.1 4.7 4.8
Weekends g/hr 11.9 3.2 12.6 9.4 14.5 20.5 25.9 22.1 13.2 19.5 41.0 18.6 11.9
All days % daily total/hr 2.7% 2.5% 3.9% 4.5% 6.3% 12.7% 10.1% 8.8% 7.2% 6.5% 8.6% 4.0% 2.7%
Weekdays % daily total/hr 2.6% 3.3% 3.3% 4.6% 6.8% 13.3% 8.8% 8.4% 8.0% 6.2% 5.7% 2.7% 2.6%
Weekends % daily total/hr 3.3% 1.4% 4.2% 3.0% 4.9% 12.3% 13.1% 8.8% 6.3% 5.8% 13.0% 7.5% 3.3%
Table 3-1: Hourly average PM10 emissions (g/hr) and average household diurnal profile in emissions (% daily total per hour).

Wood Burner Testing Christchurch 2009: 14
3.1.2 Household variability in emissions
The average particulate emission rate per household (g/kg) is shown in Table 3.2 with
summary burner and fuel data.
House Burner type Category Lab test average 4013
Wood moisture content
Test emissions
Test emissions
g/kg (dry) g/kg (dry) % g/kg (dry) g/kg (wet)
1 Ethos IS100 1.0 0.6 15% 7 6
2 Woodsman Matai 1.0 0.8 17% 6 6
3 Ethos IS100 1.0 0.6 16% 12 9
4 Kent Signature 1.0 0.9 23% 23 18
5 Masport LE 3000 Provincial 1.5 1.2 22% 2 1
6 Hewitson Firenzo Contessa EF - Clean Air 1.5 23% 5 4
Table 3-2: Summary burner and fuel data.
The availability of hourly particulate emissions data allows for a comparison of temporal
profiles in a number of variables potentially providing insight into inter-household variability in
emissions. Figure 3.3 shows averaged particulate, flue temperature, indoor PM10 and wood
use data for each household by hour of the day.
Figure 3.3. shows that there is considerable house-to-house variation in the averaged
particulate, flue temperature, and wood use data. The cause of the variability in particulate
emissions is not characterised by the variables illustrated. Household four which has the
highest PM10 emissions, uses the burner for the longest amount of time per day (20 hours on
average) but has the second lowest wood burning rate (1.2 kg/ hour) which may be indicative
of a greater use of a low (more oxygen starved) wood burner setting.
Figure 3.3 also shows that the addition of fuel at start up and during the burn process and the firebox temperature at the time the wood is loaded have the most influence on peaks in emissions. For example for household three, increases in wood use around 2pm result in an increase in flue temperature and PM10 emissions, and a decrease in wood use around 8pm is accompanied by a decrease in flue temperature and PM10 emissions. In comparison, with household four both flue temperature and PM10 emissions increase from 6-7am when wood is loaded on the fire but once the flue temperature reaches around 100 degrees C additional fuel loading does not have as much impact on PM10 emissions until around 10pm when a peak in fuel loading results in a spike in PM10.

Wood Burner Testing Christchurch 2009: 15
Figure 3-3: Diurnal variation in average flue particulate, flue temperature, indoor PM10 and wood use per household.
3.2 Wood fuel use by householders
3.2.1 Weight of wood
The average amount of wood burnt by householders per day in this type of study is of value
for validation of fuel use estimates from emission inventory studies. In the inventory surveys
households are typically asked about their daily fuel consumption, often in terms of the
average number of logs put on a fire per day (e.g., Wilton, 2011). The information is then
converted to an estimated daily fuel consumption based on an assumed average log weight.
This method is based on average daily use only and does not provide an estimate of the
weight of wood burned by domestic wood burners on a specific day. It encompasses a
reasonable amount of uncertainty as it relies on households estimates of fuel consumption
rather than direct measurement.
0
0.5
1
1.5
2
2.5
3
0
20
40
60
80
100
120
140
160
180
2000
:00
2:0
0
4:0
0
6:0
0
8:0
0
10
:00
12
:00
14
:00
16
:00
18
:00
20
:00
22
:00
Wo
od
use
kg
/hr
PM
g/h
r a
nd
Flu
e T
em
pe
ratu
re ◦
C
Flue Temp Flue PM Wood use
House 1
0
0.5
1
1.5
2
2.5
3
0
20
40
60
80
100
120
140
160
180
200
0:0
0
2:0
0
4:0
0
6:0
0
8:0
0
10
:00
12
:00
14
:00
16
:00
18
:00
20
:00
22
:00
Wo
od
use
kg
/hr
PM
g/h
r a
nd
Flu
e T
em
pe
ratu
re ◦
C
Flue Temp Flue PM Wood use
House 2
0
0.5
1
1.5
2
2.5
3
0
50
100
150
200
250
300
350
400
0:0
0
2:0
0
4:0
0
6:0
0
8:0
0
10
:00
12
:00
14
:00
16
:00
18
:00
20
:00
22
:00
Wo
od
use
kg
/hr
PM
g/h
r a
nd
Flu
e T
em
pe
ratu
re ◦
C,
Ind
oo
r P
M µ
g/m
3
Flue Temp Flue PM Indoor PM Wood use
House 3
0
0.5
1
1.5
2
2.5
3
0
20
40
60
80
100
120
140
160
180
200
0:0
0
2:0
0
4:0
0
6:0
0
8:0
0
10
:00
12
:00
14
:00
16
:00
18
:00
20
:00
22
:00
Wo
od
use
kg
/hr
PM
g/h
r a
nd
Flu
e T
em
pe
ratu
re ◦
C
Flue Temp Flue PM Wood use
House 4
0
0.5
1
1.5
2
2.5
3
0
20
40
60
80
100
120
140
160
180
200
0:0
0
2:0
0
4:0
0
6:0
0
8:0
0
10
:00
12
:00
14
:00
16
:00
18
:00
20
:00
22
:00
Wo
od
use
kg
/hr
PM
g/h
r a
nd
Flu
e T
em
pe
ratu
re ◦
C
Flue Temp Flue PM Wood use
House 5
0
0.2
0.4
0.6
0.8
1
1.2
1.4
1.6
1.8
2
0
50
100
150
200
250
300
350
400
0:0
0
2:0
0
4:0
0
6:0
0
8:0
0
10
:00
12
:00
14
:00
16
:00
18
:00
20
:00
22
:00
Wo
od
use
kg
/hr
PM
g/h
r a
nd
Flu
e T
em
pe
ratu
re ◦
C,
Ind
oo
r P
M µ
g/m
3
Flue Temp Flue PM Indoor PM Wood use
House 6
16 Wood Burner Testing Christchurch 2009:
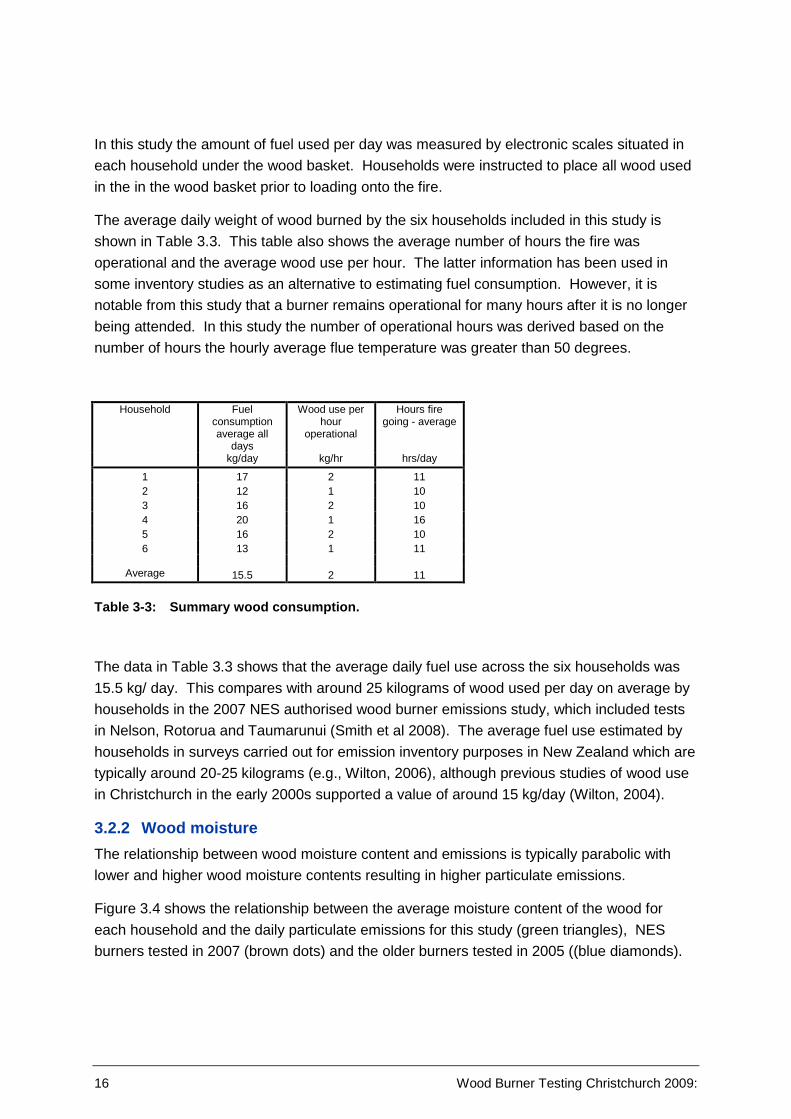
In this study the amount of fuel used per day was measured by electronic scales situated in
each household under the wood basket. Households were instructed to place all wood used
in the in the wood basket prior to loading onto the fire.
The average daily weight of wood burned by the six households included in this study is
shown in Table 3.3. This table also shows the average number of hours the fire was
operational and the average wood use per hour. The latter information has been used in
some inventory studies as an alternative to estimating fuel consumption. However, it is
notable from this study that a burner remains operational for many hours after it is no longer
being attended. In this study the number of operational hours was derived based on the
number of hours the hourly average flue temperature was greater than 50 degrees.
Household Fuel consumption average all
days
Wood use per hour
operational
Hours fire going - average
kg/day kg/hr hrs/day
1 17 2 11 2 12 1 10 3 16 2 10 4 20 1 16 5 16 2 10 6 13 1 11
Average 15.5 2 11
Table 3-3: Summary wood consumption.
The data in Table 3.3 shows that the average daily fuel use across the six households was
15.5 kg/ day. This compares with around 25 kilograms of wood used per day on average by
households in the 2007 NES authorised wood burner emissions study, which included tests
in Nelson, Rotorua and Taumarunui (Smith et al 2008). The average fuel use estimated by
households in surveys carried out for emission inventory purposes in New Zealand which are
typically around 20-25 kilograms (e.g., Wilton, 2006), although previous studies of wood use
in Christchurch in the early 2000s supported a value of around 15 kg/day (Wilton, 2004).
3.2.2 Wood moisture
The relationship between wood moisture content and emissions is typically parabolic with
lower and higher wood moisture contents resulting in higher particulate emissions.
Figure 3.4 shows the relationship between the average moisture content of the wood for
each household and the daily particulate emissions for this study (green triangles), NES
burners tested in 2007 (brown dots) and the older burners tested in 2005 ((blue diamonds).

Wood Burner Testing Christchurch 2009: 17
Figure 3-4: Comparison of wood moisture content and emission rate (g/kg dry).
Figure 3.4 shows that in the Tokoroa older burners study (Wilton, et. al., 2005) the typical
parabolic curve with lower and higher wood moisture contents resulting in higher particulate
emissions occurred. This result was not observed in the 2007 testing of NES compliant wood
burners in Nelson, Rotorua and Taumarunui. . The reason for the latter outcome was
uncertain. The 2009 data shows that a rather narrow range of wood moisture content was
used (15 to 23%) compared to previous studies. The 2009 results suggest that over the
moisture content range 15 to 23% emissions are high relative to wood moisture content
compared with the earlier 2007 testing of NES compliant burners.
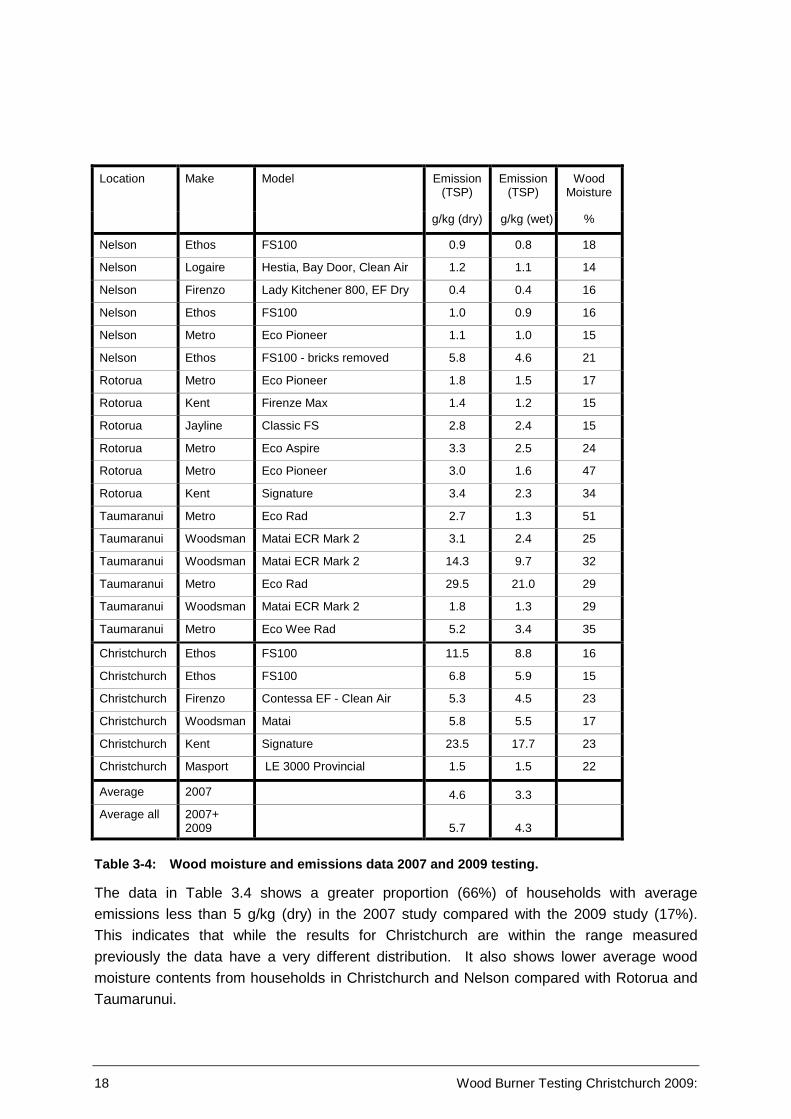
Table 3.4 compares the average wood moisture and the average particulate emissions (dry
weight) from the 2007 and 2009 testing of NES compliant burners.
0
5
10
15
20
25
30
35
0 10 20 30 40 50 60
PM
em
issi
on
rat
e g
/kg
(dry
wei
gh
t)
Wood Moisture content %
Tokoroa 2005 (older burners) NES 2007 burners Christchurch 2009
18 Wood Burner Testing Christchurch 2009:
Location Make Model Emission (TSP)
Emission (TSP)
Wood Moisture
g/kg (dry) g/kg (wet) %
Nelson Ethos FS100 0.9 0.8 18
Nelson Logaire Hestia, Bay Door, Clean Air 1.2 1.1 14
Nelson Firenzo Lady Kitchener 800, EF Dry 0.4 0.4 16
Nelson Ethos FS100 1.0 0.9 16
Nelson Metro Eco Pioneer 1.1 1.0 15
Nelson Ethos FS100 - bricks removed 5.8 4.6 21
Rotorua Metro Eco Pioneer 1.8 1.5 17
Rotorua Kent Firenze Max 1.4 1.2 15
Rotorua Jayline Classic FS 2.8 2.4 15
Rotorua Metro Eco Aspire 3.3 2.5 24
Rotorua Metro Eco Pioneer 3.0 1.6 47
Rotorua Kent Signature 3.4 2.3 34
Taumaranui Metro Eco Rad 2.7 1.3 51
Taumaranui Woodsman Matai ECR Mark 2 3.1 2.4 25
Taumaranui Woodsman Matai ECR Mark 2 14.3 9.7 32
Taumaranui Metro Eco Rad 29.5 21.0 29
Taumaranui Woodsman Matai ECR Mark 2 1.8 1.3 29
Taumaranui Metro Eco Wee Rad 5.2 3.4 35
Christchurch Ethos FS100 11.5 8.8 16
Christchurch Ethos FS100 6.8 5.9 15
Christchurch Firenzo Contessa EF - Clean Air 5.3 4.5 23
Christchurch Woodsman Matai 5.8 5.5 17
Christchurch Kent Signature 23.5 17.7 23
Christchurch Masport LE 3000 Provincial 1.5 1.5 22
Average 2007 4.6 3.3
Average all 2007+ 2009
5.7 4.3
Table 3-4: Wood moisture and emissions data 2007 and 2009 testing.
The data in Table 3.4 shows a greater proportion (66%) of households with average
emissions less than 5 g/kg (dry) in the 2007 study compared with the 2009 study (17%).
This indicates that while the results for Christchurch are within the range measured
previously the data have a very different distribution. It also shows lower average wood
moisture contents from households in Christchurch and Nelson compared with Rotorua and
Taumarunui.

Wood Burner Testing Christchurch 2009: 19
3.3 Impacts of wood burner use on indoor temperature, CO, PM10
and RH Consideration of the wider impacts of domestic home heating is important in the
management of overall health impacts. Wider impacts include warm/ cold homes, indoor air
quality, climate changes impacts, energy efficiency and socio economic effects. Use of wood
burners for home heating provides a cost effective heating option for households but also
has impacts on indoor temperature, CO, PM10 and RH.
Figure 3.5 shows daily variations in fuel loading and indoor air parameters averaged for each
household. As expected, wood loading corresponds with an increase in indoor temperature,
a decrease in indoor relative humidity and an increase in indoor CO concentrations. The
decrease in relative humidity (air dampness) occurs as a result of the increased temperature.
Concentrations of CO increase as products of combustion escape the firebox and enter the
room. A warmer, less damp room means fewer temperature related health impacts.
However, increases in indoor CO and PM10 may increase health impacts.
For households three and six indoor particulate measurements were also taken at one
minute intervals. The average of these for each hour of the day during the sampling period is
also shown in Figure 3.5. For both households the trends in indoor PM10 were similar to
trends in fuel loading. Longley & Gadd (2011) compare indoor and ambient PM10
concentrations and show some similarities in variations in concentrations between hourly
average indoor and ambient PM10 for household three when the burning peaks are removed.
One difference between the two households noted in this study was the difference in PM10
concentrations at times when the burners were not operating. For household three the
average indoor PM10 concentration when the fire was not operating was around 20% of the
concentration occurring when the fire was operating compared with 60% for household six.
The extent to which this relates to higher ambient contributions, as a result of the different
average use patterns1 of the burners (6am – 9pm versus 3pm to 12pm) or different ambient
concentrations or other factors such as other indoor sources is unknown.
More detail on PM10 concentrations, in particular minute averages, comparison to ambient
concentrations and the decay curves following loading of the firebox is given in Longley &
Gadd (2011). Daily average data for households three and six showing the variability in
indoor and flue particulate as well as wood use, indoor CO and temperature are shown in
Appendix A.
1 The average ambient PM10 concentrations when the fire was operating was 39 µg m-3 for household three and 22 µg m-3 for household six.

20 Wood Burner Testing Christchurch 2009:
Figure 3-5: Daily variations in wood use and impacts on room temperature, indoor relative humidity and indoor CO concentrations.
3.4 Factors influencing start up
3.4.1 Ambient temperature
To investigate whether ambient temperature has an influence on when people light their
fires, the relationship between ambient temperature and fire light up time was evaluated by
comparing ambient temperature variables relative to fire light up time. Ambient temperature
variables considered included; hourly average temperature, time at light up, minimum hourly
average temperature for the day, and daily average temperature.
Figure 3.6 shows the start-up times for each household as dots. The first, second and third
panel in Figure 3.6 show start up times against the average daily ambient temperature, the
ambient temperature at start up and the minimum hour average temperature during the day
respectively.
0
0.5
1
1.5
2
2.5
3
0
10
20
30
40
50
60
70
0:0
0
2:0
0
4:0
0
6:0
0
8:0
0
10
:00
12
:00
14
:00
16
:00
18
:00
20
:00
22
:00
Wo
od
use
kg
/hr,
CO
pp
m
Te
mp
era
ture
◦C
, R
H %
Room Temp RH Wood use Indoor CO
House 1
0
0.5
1
1.5
2
2.5
3
0
10
20
30
40
50
60
70
0:0
0
2:0
0
4:0
0
6:0
0
8:0
0
10
:00
12
:00
14
:00
16
:00
18
:00
20
:00
22
:00
Wo
od
use
kg
/hr,
CO
pp
m
Te
mp
era
ture
◦C
, R
H %
Room Temp RH Wood use Indoor CO
House 2
0.0
0.5
1.0
1.5
2.0
2.5
3.0
0
50
100
150
200
250
300
350
400
0:0
0
2:0
0
4:0
0
6:0
0
8:0
0
10
:00
12
:00
14
:00
16
:00
18
:00
20
:00
22
:00
Wo
od
use
kg
/hr,
CO
pp
m
Te
mp
era
ture
◦C
, R
H %
, In
do
or
PM
µg
/m3
Room Temp RH Indoor PM Wood use Indoor CO
House 3
0
0.5
1
1.5
2
2.5
3
0
10
20
30
40
50
60
70
0:0
0
2:0
0
4:0
0
6:0
0
8:0
0
10
:00
12
:00
14
:00
16
:00
18
:00
20
:00
22
:00
Wo
od
use
kg
/hr,
CO
pp
m
Te
mp
era
ture
◦C
, R
H %
Room Temp RH Wood use Indoor CO
House 4
0
0.5
1
1.5
2
2.5
3
0
10
20
30
40
50
60
70
0:0
0
2:0
0
4:0
0
6:0
0
8:0
0
10
:00
12
:00
14
:00
16
:00
18
:00
20
:00
22
:00
Wo
od
use
kg
/hr,
CO
pp
m
Te
mp
era
ture
◦C
, R
H %
Room Temp RH Wood use Indoor CO
House 5
0.0
0.5
1.0
1.5
2.0
2.5
3.0
0
10
20
30
40
50
60
70
80
90
0:0
0
2:0
0
4:0
0
6:0
0
8:0
0
10
:00
12
:00
14
:00
16
:00
18
:00
20
:00
22
:00
Wo
od
use
kg
/hr,
CO
pp
m
Te
mp
era
ture
◦C
, R
H %
, In
do
or
PM
µg
/m3
Room Temp RH Indoor PM Wood use Indoor CO
House 6

Wood Burner Testing Christchurch 2009: 21
The data in Figure 3.6 shows that average daily temperature was a poor predictor of start-up
time with the best correlation being for household six (r2 = 0.13). Ambient temperature at
start up time may have had some influence on start-up time for household five (r2 = 0.35,
linear trend shown in Figure 3.6) and possibly household six (r2 = 0.2) but does not appear to
be an influencing factor for other households. Minimum daily temperature appeared
unrelated to start up time.

22 Wood Burner Testing Christchurch 2009:
Figure 3-6: Influence of ambient temperature variables on fire start up time.
0
2
4
6
8
10
12
140 2 4 6 8
10
12
14
16
18
20
22
Am
bie
nt
tem
pe
ratu
re ◦
C
Start-up time - hour
Average daily temperature
Household 1
Household 2
Household 3
Household 4
Household 5
Household 6
-2
0
2
4
6
8
10
12
14
16
0 2 4 6 8
10
12
14
16
18
20
22
Am
bie
nt
tem
pe
ratu
re ◦
C
Start-up time - hour
Ambient temperature at start up
Household 1
Household 2
Household 3
Household 4
Household 5
Household 6
Linear (Household 5)
-4
-2
0
2
4
6
8
10
12
0 2 4 6 8
10
12
14
16
18
20
22A
mb
ien
t te
mp
era
ture
◦C
Start up time - hour
Minimum hourly average temperature per day
Household 1
Household 2
Household 3
Household 4
Household 5
Household 6

Wood Burner Testing Christchurch 2009: 23
3.4.2 Room temperature
Figure 3.7 shows the influence of room temperature on the start times of the fires for each
household. Figure 3.7 shows the start-up times for each household as dots. The first, second
and third panel in Figure 3.7 show start up times against the room temperature at the time of
start-up, minimum room temperature for the day, and the average room temperature for
hours when the fire was not lit respectively.
For households one and six there is a reasonable correlation between the time the fire was
started and the room temperature at that time (trend lines shown in Figure 3.7). However,
this may just reflect normal daily changes in indoor temperatures, with colder temperatures in
the morning. No other room temperature variables were found to be good predictors of start-
up time. Poor correlations were observed for other households with any variables. Generally
these variables do not appear to be reliable predictors of fire start time.

24 Wood Burner Testing Christchurch 2009:
Figure 3-7: Influence of room temperature on start time.
0
5
10
15
20
250 2 4 6 8
10
12
14
16
18
20
22
Ro
om
te
mp
era
ture
◦C
Start-up time - hour
Room temperature time startedHousehold 1
Household 2
Household 3
Household 4
Household 5
Household 6
Linear
(Household 1)Linear
(Household 6)
0
5
10
15
20
25
0 2 4 6 8
10
12
14
16
18
20
22
Ro
om
te
mp
era
ture
◦C
Start-up time - hour
Minimum room temperature during day
Household 1
Household 2
Household 3
Household 4
Household 5
Household 6
0
5
10
15
20
25
0 2 4 6 8
10
12
14
16
18
20
22
Ro
om
te
mp
era
ture
◦C
Start-up time - hour
Average room temperature - fire not going
Household 1
Household 2
Household 3
Household 4
Household 5
Household 6

Wood Burner Testing Christchurch 2009: 25
3.4.3 Time of day
The time of day the fire was started up for each household for each day of the week (Sunday
= 1) is shown in Figure 3.8. Most households were reasonably consistent with start-up time
suggesting that perhaps lifestyle is a key determinant of start-up time. Household one shows
variability in start time with the majority of days having the fire lit around 5pm and the
remainder anytime during the day with no apparent weekend/ weekday patterns.
Households two and three typically start their fires between 2pm and 5pm on weekdays and
earlier in the weekends. Households four and six had the greatest frequency of early start
ups (6-9am) and the greatest variability in start times (with household one), while household
five typically started the fire between 7pm and 9pm.
Lifestyle factors appear to play a role in the time of day a fire is started. However, the
lifestyle factors that influence start time clearly vary between households limiting the ability to
make more general predictions about fire start times based on these data.
Figure 3-8: Start times by day of the week.
0
5
10
15
20
0 1 2 3 4 5 6 7
Ho
ur
of
sta
rt u
p
Day of the week
Household 1
Household 2
Household 3
0
5
10
15
20
0 1 2 3 4 5 6 7
Ho
ur
of
sta
rt u
p
Day of the week
Household 4
Household 5
Household 6

26 Wood Burner Testing Christchurch 2009:
3.5 Factors influencing burn duration and fuel consumption Data were evaluated to determine if a colder day meant a fire was used for longer or more fuel was burnt. Variables considered included minimum hourly average temperature and daily average temperature. Figure 3.9 shows the influence of ambient temperature on burn duration. Figure 3.10 shows influence of ambient temperature on fuel consumption.
Figure 3-9: Influence of ambient temperature on burn duration.
0
2
4
6
8
10
12
14
0 2 4 6 8
10
12
14
16
18
20
22
Am
bie
nt
tem
pe
ratu
re ◦
C
Burn duration - hours
Average daily temperature
Household 1
Household 2
Household 3
Household 4
Household 5
Household 6
Linear (Household 6)
-4
-2
0
2
4
6
8
10
12
0 2 4 6 8
10
12
14
16
18
20
22
Am
bie
nt
tem
pe
ratu
re ◦
C
Burn duration - hours
Minimum hourly average temperature per day
Household 1
Household 2
Household 3
Household 4
Household 5
Household 6

Wood Burner Testing Christchurch 2009: 27
Figure 3-10: Influence of ambient temperature on fuel consumption.
Figures 3.9 and 3.10 show that average daily temperature may have had some influence on
the burn duration for household six (r2 = 0.4, linear trend shown in Figure 3.9) and fuel
consumption (r2 = 0.1) but was not consistently an influencing factor for other households.
Minimum hourly average temperature per day did not appear to be an influencing factor on
burn duration or fuel consumption for any households.
0
2
4
6
8
10
12
140 2 4 6 8
10
12
14
16
18
20
22
Am
bie
nt
tem
pe
ratu
re ◦
C
Fuel consumption - kg/day
Average daily temperature
Household 1
Household 2
Household 3
Household 4
Household 5
Household 6
-4
-2
0
2
4
6
8
10
12
0 2 4 6 8
10
12
14
16
18
20
22
Am
bie
nt
tem
pe
ratu
re ◦
C
Fuel consumption - kg/day
Minimum hourly average temperature per day
Household 1
Household 2
Household 3
Household 4
Household 5
Household 6

28 Wood Burner Testing Christchurch 2009:
4 Conclusion • This study evaluates operational, emissions and indoor data collected from six
Christchurch households during the “real life” emissions testing of NES authorised
wood burners during 2009. The main objective of the wider programme was to
evaluate emissions from the burners to assist with the science of emission factors
from NES compliant and 1.0 g/kg wood burners (Bluett, et. al., 2010). The objective
of this study is to utilise the data collected in the Christchurch 2009 real life study to
provide further improvement to emission inventories by:
• Determining a diurnal profile for PM10 emissions from domestic home heating.
• Measuring the weight of wood used by householders to heat their homes
• Assessing the impacts of wood burner use on indoor temperature, relative humidity,
CO and PM10
• Investigating factors that influence the start-up of domestic woodburners
A daily particulate profile was established and will be of value in determining emissions
profiles for inventories or modelling. This hour-by-hour profile is more detailed than the 24-
hour average period used in many inventories to date. It is noted, however, that the profile
relies on emissions from just six households and more testing is required to refine the profile
derived.
The average fuel consumption per household for this study was 15.5 kg/day. Use of this
value is limited by the small sample size. However, results are consistent with studies done
in the early 2000s (as reported in Wilton, 2004). The value of 15.5 is lower than the 23
kilograms per day assumed in the Environment Canterbury projections modelling (Angie
Scott, pers comm. 2005). Further measurements of the average daily fuel consumption are
recommended for Christchurch.
Previous studies have identified wood moisture content, flue temperature and flue oxygen to
be the key determinants of PM10 emissions from solid fuel burners. In this study behavioural
factors such as burner start up time, burner duration and fuel consumption were evaluated
along with temporal relationships between emissions and other variables.
For most households start up time, burn duration or fuel consumption did not appear to be
consistently influenced by temperature (indoor or ambient) and start times appeared to be
mostly related to lifestyle factors. The exceptions were household five for which start up time
may have been influenced by the temperature at start up and household six for which burn
duration was influenced by average ambient temperature.
A key concern highlighted in the 2007 testing was the variability in average emissions from
NES compliant burners from different locations in New Zealand. While results from this

Wood Burner Testing Christchurch 2009: 29
study are within the ranges of those observed previously they are much higher than the
average for the Nelson testing. It is uncertain whether some location specific factors are
influencing emissions from different urban areas or whether the differences are a function of
the small sample sizes. To date, 24 households with NES compliant burners have been
tested. Further tests are required and additional investigations into location specific factors
are recommended.

30 Wood Burner Testing Christchurch 2009:
5 Recommendations • Further studies of daily average fuel consumption in Christchurch and other places be
carried out.
• Data on indoor PM10 concentrations be further analysed to better characterise the
relationship between ambient PM10 concentrations and indoor concentrations and to
examine potential influences of non-solid fuel burning indoor sources.
• Councils give consideration to measures to improve the quality of wood burnt,
specifically the moisture content (e.g., good wood scheme for Nelson), and options
for ensuring appropriately sized wood burners are installed and operated well.
• Further emission testing be carried out to:
- assist in the development of more robust emission factor for NES compliant
burners
- determine potential inter Region variability in PM10 emissions
- further characterise the temporal profile of emissions from wood burners

Wood Burner Testing Christchurch 2009: 31
6 Acknowledgements The emission monitoring, and paper write up was funded by the Foundation for Research Science and Technology’s Healthy Urban Atmosphere air quality research programme (contract number C01X813).
Co-funding and technical assistance was provided for the emission testing by Environment Canterbury.
CSIRO for their generous loan of the real-world sampling kits.
Colin Grace (NIWA) and Donna Rowan (Environment Canterbury) for their enthusiasm, expertise and many hours hard work in preparing and operating the real-world sampling kits.
The six householders (who remain anonymous) are thanked for their participation and
assistance in this project.
Wood Burner Testing Christchurch 2009: 32
7 References
Bluett, J. and Meyer, M., 2011. Measurement of Real-world particulate emissions from
domestic wood burners – Christchurch 2009. 20th International Clean Air and Environment
Conference. Auckland 31 July to 2 August 2011. ISBN 978-0-9806045-1-1.
Kelly C., Mues S. and Webley W. (2007) Real life emissions testing of wood burners in
Tokoroa. Ministry for the Environment Warm Homes technical report no. ME814
McCauley M., and Scott A. (2006) Inventory of emissions to air in Waimate, Ashburton,
Kaiapoi and Rangiora, 2004. Environment Canterbury report no. R06/24.
Metcalfe J.L., Fisher G.W., Sherman M.W. and Kuschel G.I. (2006) Auckland air emissions
inventory: 2004. Auckland Regional Council technical publication 292.
Meyer, M.; Luhar, A.; Gillett, R,; Keywood, M. 2008. Measurements of real world PM10
emission factors and emission profiles from wood-heaters by in situ source monitoring and
atmospheric verification methods.
http://www.environment.gov.au/atmosphere/airquality/research/carp.html
Scott A. (2005) Real life emissions from residential wood burning appliances in New
Zealand. Ministry for the Environment Sustainable Management Fund report, ID number
2205.
Scott A. and Gunatilaka M. (2004) 2002 Christchurch inventory of emissions to air.
Environment Canterbury report no. R04/03.
Smith J., Bluett J., Wilton E., Mallett T., (2008) In home testing of particulate emissions from
NES compliant woodburners: Nelson, Rotorua and Taumarunui2007. NIWA report number
CHC2008-092.
Wilton E. (2003) Emission inventories for PM10 in New Zealand. Air quality technical report
no. 38 prepared for the Ministry for the Environment.
Wilton, E., 2004, Summary of 2001 Air plan projections. Unpublished paper prepared for
Environment Canterbury.
Wilton E. (2005a) Hamilton emission inventory 2005. Environment Waikato technical report
no. TR05/52R.
Wilton E. (2005b) Air emission inventory – Hawkes Bay 2005. Hawkes Bay Regional
Council.
Wilton E. (2005c) Warm Homes Technical Report: Home Heating Methods and Fuels in New
Zealand. Air quality technical report prepared for the Ministry for the Environment.
Wood Burner Testing Christchurch 2009: 33
Wilton E., Smith J., Dey K. and Webley W. (2006) Real life testing of woodburner emissions.
Clean Air and Environmental Quality 40(4), 43-47.
Wilton E., (2006) Air emission inventory Nelson 2006. Nelson City Council.
Wilton E., and Baynes, M., (2008) Air Emission Inventory – Masterton 2008. Greater
Wellington Regional Council.
Wilton, E., & Bluett, J., 2010, Factors influencing particulate emissions from low emission
woodburners in Nelson, Rotorua and Taumarunui- 2007. NIWA report number AKL2012-013
Wilton, E., 2011, Emission inventory for Invercargill and Gore. Environment Southland Technical Report.

34 Wood Burner Testing Christchurch 2009:
Appendix A Daily household data for households three and six

Wood Burner Testing Christchurch 2009: 35
Figure A-1: Daily household data for household three.
0.0
1.0
2.0
3.0
4.0
5.0
6.0
0
50
100
150
200
250
300
0.0
0
2.0
0
4.0
0
6.0
0
8.0
0
10
.00
12
.00
14
.00
16
.00
18
.00
20
.00
22
.00
PM
g/
min
& m
g/m
3,
CO
pp
m,
wo
od
use
kg/
hr
Tem
pe
ratu
re ◦
C
3/07/2009
Room Temp
Flue Temp
PM-g/min
Indoor CO
Wood use
PM-Indoor
0.0
0.5
1.0
1.5
2.0
2.5
3.0
3.5
4.0
4.5
0
50
100
150
200
250
0.0
0
2.0
0
4.0
0
6.0
0
8.0
0
10
.00
12
.00
14
.00
16
.00
18
.00
20
.00
22
.00
PM
g/
min
& m
g/m
3,
CO
pp
m,
wo
od
use
kg/
hr
Tem
pe
ratu
re ◦
C
4/07/2009
Room Temp
Flue Temp
PM-g/min
Indoor CO
Wood use
PM-Indoor
0.0
0.5
1.0
1.5
2.0
2.5
3.0
3.5
4.0
4.5
5.0
0
50
100
150
200
250
0.0
0
2.0
0
4.0
0
6.0
0
8.0
0
10
.00
12
.00
14
.00
16
.00
18
.00
20
.00
22
.00
PM
g/m
in &
mg
/m
3C
O p
pm
, wo
od
use
kg/
hr
Te
mp
era
ture
◦C
5/07/2009
Room Temp
Flue Temp
PM-g/min
Indoor CO
Wood use
PM-Indoor
0.0
1.0
2.0
3.0
4.0
5.0
6.0
7.0
8.0
0
50
100
150
200
250
0.0
0
2.0
0
4.0
0
6.0
0
8.0
0
10
.00
12
.00
14
.00
16
.00
18
.00
20
.00
22
.00
PM
g/m
in &
mg
/m
3,
CO
pp
m,
wo
od
use
kg/
hr
Te
mp
era
ture
◦C
6/07/2009
Room Temp
Flue Temp
PM-g/min
Indoor CO
Wood use
PM-Indoor
0.0
1.0
2.0
3.0
4.0
5.0
6.0
0
50
100
150
200
250
0.0
0
2.0
0
4.0
0
6.0
0
8.0
0
10
.00
12
.00
14
.00
16
.00
18
.00
20
.00
22
.00
PM
g/
min
& m
g/m
3,
CO
pp
m,
wo
od
use
kg/
hr
Tem
pe
ratu
re ◦
C
7/07/2009
Room Temp
Flue Temp
PM-g/min
Indoor CO
Wood use
PM-Indoor
0.0
0.5
1.0
1.5
2.0
2.5
3.0
3.5
4.0
4.5
5.0
0
50
100
150
200
250
0.0
0
2.0
0
4.0
0
6.0
0
8.0
0
10
.00
12
.00
14
.00
16
.00
18
.00
20
.00
22
.00
PM
g/
min
& m
g/m
3,
CO
pp
m,
wo
od
use
kg/
hr
Tem
pe
ratu
re ◦
C
8/07/2009
Room Temp
Flue Temp
PM-g/min
Indoor CO
Wood use
PM-Indoor
0.0
0.5
1.0
1.5
2.0
2.5
3.0
3.5
4.0
0
50
100
150
200
250
0.0
0
2.0
0
4.0
0
6.0
0
8.0
0
10
.00
12
.00
14
.00
16
.00
18
.00
20
.00
22
.00
PM
g/
min
& m
g/m
3,
CO
pp
m,
wo
od
use
kg/
hr
Tem
pe
ratu
re ◦
C
9/07/2009
Room Temp
Flue Temp
PM-g/min
Indoor CO
Wood use
PM-Indoor
0.0
1.0
2.0
3.0
4.0
5.0
6.0
7.0
0
50
100
150
200
250
0.0
0
2.0
0
4.0
0
6.0
0
8.0
0
10
.00
12
.00
14
.00
16
.00
18
.00
20
.00
22
.00
PM
g/
min
& m
g/m
3,
CO
pp
m,
wo
od
use
kg/
hr
Tem
pe
ratu
re ◦
C
10/07/2009
Room Temp
Flue Temp
PM-g/min
Indoor CO
Wood use
PM-Indoor
0.0
1.0
2.0
3.0
4.0
5.0
6.0
0
50
100
150
200
250
300
0.0
0
2.0
0
4.0
0
6.0
0
8.0
0
10
.00
12
.00
14
.00
16
.00
18
.00
20
.00
22
.00
PM
g/m
in &
mg
/m
3,
CO
pp
m,
wo
od
use
kg
/h
r
Te
mp
era
ture
◦C
11/07/2009
Room Temp
Flue Temp
PM-g/min
Indoor CO
Wood use
PM-Indoor
0.0
0.5
1.0
1.5
2.0
2.5
3.0
3.5
4.0
4.5
0
50
100
150
200
250
300
0.0
0
2.0
0
4.0
0
6.0
0
8.0
0
10
.00
12
.00
14
.00
16
.00
18
.00
20
.00
22
.00
PM
g/
min
& m
g/m
3,
CO
pp
m,
wo
od
use
kg/
hr
Tem
pe
ratu
re ◦
C
13/07/2009
Room Temp
Flue Temp
PM-g/min
Indoor CO
Wood use
PM-Indoor
0.0
1.0
2.0
3.0
4.0
5.0
6.0
0
50
100
150
200
250
0.0
0
2.0
0
4.0
0
6.0
0
8.0
0
10
.00
12
.00
14
.00
16
.00
18
.00
20
.00
22
.00
PM
g/m
in &
mg
/m
3,
CO
pp
m,
wo
od
use
kg
/h
r
Te
mp
era
ture
◦C
12/07/2009
Room Temp
Flue Temp
PM-g/min
Indoor CO
Wood use
PM-Indoor
0.0
1.0
2.0
3.0
4.0
5.0
6.0
0
50
100
150
200
250
0.0
0
2.0
0
4.0
0
6.0
0
8.0
0
10
.00
12
.00
14
.00
16
.00
18
.00
20
.00
22
.00
PM
g/
min
& m
g/m
3,
CO
pp
m,
wo
od
use
kg/
hr
Tem
pe
ratu
re ◦
C
14/07/2009
Room Temp
Flue Temp
PM-g/min
Indoor CO
Wood use
PM-Indoor

36 Wood Burner Testing Christchurch 2009:
Figure A-2: Daily household data for household six.
0.0
0.5
1.0
1.5
2.0
2.5
3.0
3.5
4.0
0
50
100
150
200
250
0.0
0
2.0
0
4.0
0
6.0
0
8.0
0
10
.00
12
.00
14
.00
16
.00
18
.00
20
.00
22
.00
PM
g/
min
& m
g/m
3,
CO
pp
m,
wo
od
use
kg
/h
r
Te
mp
era
ture
◦C
6/08/2009
Room Temp
Flue Temp
PM-g/min
Indoor CO
Wood use
Indoor PM
0.0
0.5
1.0
1.5
2.0
2.5
3.0
3.5
4.0
0
50
100
150
200
250
300
0.0
0
2.0
0
4.0
0
6.0
0
8.0
0
10
.00
12
.00
14
.00
16
.00
18
.00
20
.00
22
.00
PM
g/
min
& m
g/m
3,
CO
pp
m,
wo
od
use
kg
/h
r
Te
mp
era
ture
◦C
7/08/2009
Room Temp
Flue Temp
PM-g/min
Indoor CO
Wood use
Indoor PM
0.0
0.5
1.0
1.5
2.0
2.5
3.0
3.5
4.0
0
50
100
150
200
250
300
0.0
0
2.0
0
4.0
0
6.0
0
8.0
0
10
.00
12
.00
14
.00
16
.00
18
.00
20
.00
22
.00
PM
g/m
in &
mg
/m
3,
CO
pp
m,
wo
od
use
kg
/h
r
Te
mp
era
ture
◦C
8/08/2009
Room Temp
Flue Temp
PM-g/min
Indoor CO
Wood use
Indoor PM
0.0
0.1
0.2
0.3
0.4
0.5
0.6
0.7
0.8
0
5
10
15
20
25
30
35
40
0.0
0
2.0
0
4.0
0
6.0
0
8.0
0
10
.00
12
.00
14
.00
16
.00
18
.00
20
.00
22
.00
PM
g/m
in &
mg
/m
3,
CO
pp
m,
wo
od
use
kg
/h
r
Te
mp
era
ture
◦C
9/08/2009
Room Temp
Flue Temp
PM-g/min
Indoor CO
Wood use
Indoor PM
0.0
0.5
1.0
1.5
2.0
2.5
3.0
3.5
4.0
4.5
0
50
100
150
200
250
0.0
0
2.0
0
4.0
0
6.0
0
8.0
0
10
.00
12
.00
14
.00
16
.00
18
.00
20
.00
22
.00
PM
g/
min
& m
g/m
3,
CO
pp
m,
wo
od
use
kg
/h
r
Te
mp
era
ture
◦C
10/08/2009
Room Temp
Flue Temp
PM-g/min
Indoor CO
Wood use
Indoor PM
0.0
0.1
0.2
0.3
0.4
0.5
0.6
0.7
0.8
0.9
1.0
0
20
40
60
80
100
120
140
160
0.0
0
2.0
0
4.0
0
6.0
0
8.0
0
10
.00
12
.00
14
.00
16
.00
18
.00
20
.00
22
.00
PM
g/
min
& m
g/m
3,
CO
pp
m,
wo
od
use
kg
/h
r
Te
mp
era
ture
◦C
11/08/2009
Room Temp
Flue Temp
PM-g/min
Indoor CO
Wood use
Indoor PM
0.0
1.0
2.0
3.0
4.0
5.0
6.0
7.0
0
50
100
150
200
250
300
0.0
0
2.0
0
4.0
0
6.0
0
8.0
0
10
.00
12
.00
14
.00
16
.00
18
.00
20
.00
22
.00
PM
g/
min
& m
g/m
3,
CO
pp
m,
wo
od
use
kg
/h
r
Te
mp
era
ture
◦C
12/08/2009
Room Temp
Flue Temp
PM-g/min
Indoor CO
Wood use
Indoor PM
0.0
0.5
1.0
1.5
2.0
2.5
3.0
0
50
100
150
200
250
300
0.0
0
2.0
0
4.0
0
6.0
0
8.0
0
10
.00
12
.00
14
.00
16
.00
18
.00
20
.00
22
.00
PM
g/
min
& m
g/m
3,
CO
pp
m,
wo
od
use
kg
/h
r
Te
mp
era
ture
◦C
13/08/2009
Room Temp
Flue Temp
PM-g/min
Indoor CO
Wood use
Indoor PM
0.0
0.5
1.0
1.5
2.0
2.5
3.0
0
50
100
150
200
250
300
0.0
0
2.0
0
4.0
0
6.0
0
8.0
0
10
.00
12
.00
14
.00
16
.00
18
.00
20
.00
22
.00
PM
g/m
in &
mg
/m
3, C
O p
pm
, w
oo
d u
se
kg/
hr
Te
mp
era
ture
◦C
14/08/2009
Room Temp
Flue Temp
PM-g/min
Indoor CO
Wood use
Indoor PM
0.0
0.5
1.0
1.5
2.0
2.5
3.0
3.5
4.0
4.5
0
50
100
150
200
250
300
0.0
0
2.0
0
4.0
0
6.0
0
8.0
0
10
.00
12
.00
14
.00
16
.00
18
.00
20
.00
22
.00
PM
g/m
in &
mg
/m
3, C
O p
pm
, w
oo
d u
se
kg/
hr
Te
mp
era
ture
◦C
15/08/2009
Room Temp
Flue Temp
PM-g/min
Indoor CO
Wood use
Indoor PM
0.0
0.5
1.0
1.5
2.0
2.5
3.0
3.5
4.0
4.5
5.0
0
50
100
150
200
250
300
0.0
0
2.0
0
4.0
0
6.0
0
8.0
0
10
.00
12
.00
14
.00
16
.00
18
.00
20
.00
22
.00
PM
g/
min
& m
g/m
3,
CO
pp
m,
wo
od
use
kg
/h
r
Te
mp
era
ture
◦C
16/08/2009
Room Temp
Flue Temp
PM-g/min
Indoor CO
Wood use
Indoor PM
0.0
0.5
1.0
1.5
2.0
2.5
3.0
3.5
4.0
0
50
100
150
200
250
0.0
0
2.0
0
4.0
0
6.0
0
8.0
0
10
.00
12
.00
14
.00
16
.00
18
.00
20
.00
22
.00
PM
g/
min
& m
g/m
3,
CO
pp
m,
wo
od
use
kg
/h
r
Te
mp
era
ture
◦C
17/08/2009
Room Temp
Flue Temp
PM-g/min
Indoor CO
Wood use
Indoor PM