Embed Size (px)
Citation preview

Biogeosciences, 9, 3231–3246, 2012www.biogeosciences.net/9/3231/2012/doi:10.5194/bg-9-3231-2012© Author(s) 2012. CC Attribution 3.0 License.
Biogeosciences
Distributions of dissolved trace metals (Cd, Cu, Mn, Pb, Ag) in thesoutheastern Atlantic and the Southern Ocean
M. Boye1, B. D. Wake1,2, P. Lopez Garcia2,3, J. Bown1, A. R. Baker4, and E. P. Achterberg2
1Institut Universitaire Europeen de la Mer (IUEM) UMS3113, Laboratoire des Sciences de l’Environnement MarinUMR6539, Technopole Brest Iroise, 29280 Plouzane, France2School of Ocean & Earth Science, National Oceanography Centre Southampton, University of Southampton, SouthamptonSO14 3ZH, UK3Universidad de Las Palmas de Gran Canaria, 35017 Las Palmas, Spain4School of Environmental Sciences, University of East Anglia, Norwich, UK
Correspondence to:M. Boye ([email protected])
Received: 8 March 2012 – Published in Biogeosciences Discuss.: 21 March 2012Revised: 12 July 2012 – Accepted: 14 July 2012 – Published: 23 August 2012
Abstract. Comprehensive synoptic datasets (surface waterdown to 4000 m) of dissolved cadmium (Cd), copper (Cu),manganese (Mn), lead (Pb) and silver (Ag) are presentedalong a section between 34◦ S and 57◦ S in the southeast-ern Atlantic Ocean and the Southern Ocean to the south offSouth Africa. The vertical distributions of Cu and Ag displaynutrient-like profiles similar to silicic acid, and of Cd simi-lar to phosphate. The distribution of Mn shows a subsurfacemaximum in the oxygen minimum zone, whereas Pb concen-trations are rather invariable with depth. Dry deposition ofaerosols is thought to be an important source of Pb to surfacewaters close to South Africa, and dry deposition and snow-fall may have been significant sources of Cu and Mn at thehigher latitudes. Furthermore, the advection of water massesenriched in trace metals following contact with continentalmargins appeared to be an important source of trace elementsto the surface, intermediate and deep waters in the southeast-ern Atlantic Ocean and the Antarctic Circumpolar Current.Hydrothermal inputs may have formed a source of trace met-als to the deep waters over the Bouvet Triple Junction ridgecrest, as suggested by relatively enhanced dissolved Mn con-centrations. The biological utilization of Cu and Ag was pro-portional to that of silicic acid across the section, suggestingthat diatoms formed an important control over the removalof Cu and Ag from surface waters. However, uptake by dino-and nano-flagellates may have influenced the distribution ofCu and Ag in the surface waters of the subtropical Atlanticdomain. Cadmium correlated strongly with phosphate (P),
yielding lower Cd / P ratios in the subtropical surface waterswhere phosphate concentrations were below 0.95 µM. Thegreater depletion of Cd relative to P observed in the WeddellGyre compared to the Antarctic Circumpolar Current couldbe due to increase Cd uptake induced by iron-limiting con-ditions in these high-nutrient–low-chlorophyll waters. Simi-larly, an increase of Mn uptake under Fe-depleted conditionsmay have caused the highest depletion of Mn relative to P inthe surface waters of the Weddell Gyre. In addition, a cellu-lar Mn-transport channel of Cd was possibly activated in theWeddell Gyre, which in turn may have yielded depletion ofboth Mn and Cd in these surface waters.
1 Introduction
Our understanding of the biogeochemical cycles of trace el-ements and their influence on the oceanic productivity in thehigh-nutrient–low-chlorophyll region of the Southern Oceanis still limited, with perhaps the exception of iron (Fe) (Mar-tin et al., 1990; de Baar et al., 2005; Boyd et al., 2007). Cer-tain trace metals have profiles that are nutrient-like, like cad-mium (Cd) and copper (Cu), which is indicative of their in-volvement in biological cycles (Boyle, 1988; Boyle and Ed-mond, 1975). In contrast, other metals have a scavenged-typebehavior like lead (Pb; Flegal and Patterson, 1983) or behavein a conservative manner like uranium (Bruland and Lohan,2003). Elements such as manganese (Mn) can be considered
Published by Copernicus Publications on behalf of the European Geosciences Union.

3232 M. Boye et al.: Distributions of dissolved trace metals
hybrid-type metals at high latitudes, as their distribution iscontrolled by both biological uptake and scavenging pro-cesses (Bruland and Lohan, 2003). Furthermore, the oceanicbehavior of other trace metals like silver (Ag) is still notwell understood, with little data on Ag distributions in theglobal ocean, notably in the Southern Hemisphere (Zhang etal., 2004). Despite major advances on the biological involve-ment of trace metals and their geochemical dynamics in theocean, basic knowledge is still lacking on their biogeochem-ical cycles. For instance, there are only a few comprehensivedatasets of Mn (Middag et al., 2011a), and of Cu, Cd and Pb(Loscher, 1999; Ellwood, 2008) for the Southern Ocean. Theexternal sources of trace metals to the southeastern Atlanticand the Southern Ocean are not well constrained. Recentwork suggests the importance of advection of water massesenriched in trace metals following contact with continentalmargins (Bown et al., 2011; Chever et al., 2010), in additionto atmospheric depositions to surface waters and inputs fromhydrothermal vents to bottom waters (Middag et al., 2011a;Klunder et al., 2011). The coupling between trace and ma-jor nutrients cycles, such as the correlations between Cd andphosphate (PO4) in the Southern Ocean (de Baar et al., 1994;Elderfield and Rickaby, 2000), indicates the removal of tracenutrients in surface waters due to phytoplankton uptake andtheir later sinking and remineralisation in deep waters. How-ever, our knowledge of this coupling is still limited to a smallnumber of trace elements. Such correlations have been used,alongside Cd / Ca ratios preserved in foraminifera tests, toreconstruct past changes in ocean circulation and nutrientsdistributions (Boyle, 1988). Furthermore, laboratory studies(Sunda and Huntsman, 2000) and shipboard incubation ex-periments (Cullen et al., 2003) have demonstrated the rela-tionships between certain trace nutrients for phytoplanktonuptake. For example, the depletion of Cd before that of PO4appears to be linked to Fe limitation in the Southern Oceansurface waters (Ellwood, 2008). Thus, a synoptic observationof trace nutrient distributions will increase our understand-ing of the coupling between the biogeochemical cycles ofthe trace nutrients in the Southern Ocean.
The emergence of new methods for trace metals analy-sis, such as isotope dilution-inductively coupled plasma massspectrometry (ID-ICPMS) now allows us to achieve multi-element analyses with low limits of detection (Milne et al.,2010). The ID-ICPMS method has been employed here tofurther assess the biogeochemical cycles of Cd, Cu, Pb, Mnand Ag along a section in the southeastern Atlantic Oceanand the Southern Ocean south off South Africa during theInternational Polar Year in 2008. The survey area includescontrasting biogeochemical domains with the oligotrophicsubtropical South Atlantic in the north, through to the high-nutrient–low-chlorophyll region of the Southern Ocean in thesouthern part of the section (Le Moigne et al., 2012). Further-more, the section crosses one of the most dynamic and vari-able ocean domains in the world where the South Atlantic,Southern Ocean and Indian waters converge (Boebel et al.,
2003). The distributions of the dissolved trace metals Cd, Cu,Mn, Pb, and Ag are discussed in combination with their at-mospheric inputs, and the biogeochemical and physical fea-tures of the study region in order to determine the sources ofthese trace elements, their coupling with the major nutrientsand the connection between their biogeochemical cycles.
2 Methods
2.1 Study area
Water samples were collected at twelve deep stations locatedin the southeast Atlantic and Atlantic sector of the South-ern Ocean during the multidisciplinary MD 166 BONUS-GoodHope cruise. The cruise took place during the Interna-tional Polar Year in the austral summer 2008 (8 February–24 March 2008) aboard the FrenchR/V Marion Dufresne II(Fig. 1). The samples were collected from the shelf regionoff the South African coast to 57◦ S in the Weddell Gyre atthe southern end of the section. The twelve stations consistedof seven LARGE stations (L#), sampled at up to ten depthsto ∼ 2200 m, and five SUPER stations (S#), sampled at upto twenty depths to∼ 4000 m. The station locations, oceano-graphic fronts and regions are marked on Fig. 1.
2.2 Sample collection
Samples were collected using acid-cleaned 12 l GO-FLObottles (General Oceanics) modified with PTFE O-rings,mounted on a Kevlar wire and triggered using Teflon-coatedmessengers. The GO-FLO bottles were immediately trans-ferred into a pressurized clean container (class 100) for sub-sampling. The samples were then collected in acid-cleaned250 ml low-density polyethylene bottles (LDPE, Nalgene)after online filtration with a 0.22 µm Sartobran 300 (with0.4 µM pre-filter, Sartorius) cartridge filter under pure N2pressure (filtered 99.99 % N2, 1 bar). Each sample was thenacidified to pH∼ 1.9 on board in a laminar flow hood(class 100) with nitric acid (ultrapure HNO®3 , Merck) andstored in double bags in the dark at ambient temperature untiltheir analyses in the shore-based laboratory about 22 monthsafter their collection.
2.3 Trace metal determination
Concentrations of dissolved trace metals (Cd, Pb, Cu) weredetermined by ID-ICPMS, and the mono-isotopic elementMn was analysed using a standard addition approach fol-lowed by ICPMS detection, following the methods describedin Milne et al. (2010). The analysis was conducted fol-lowing an offline preconcentration/matrix removal step ona Toyopearl AF-650M chelate resin column (Milne et al.,2010). Briefly, 15 ml of the acidified sample in an acid-cleaned 30 ml FEP bottle (Nalgene) was spiked with 100 µlof a multi-element standard of isotopes (containing the stable
Biogeosciences, 9, 3231–3246, 2012 www.biogeosciences.net/9/3231/2012/

M. Boye et al.: Distributions of dissolved trace metals 3233
Fig. 1. Location of the stations sampled for dissolved Ag, Cd, Cu,Mn and Pb during the MD166 BONUS-GoodHope cruise. Blackcircles designate the LARGE stations (L) and white circles the SU-PER stations (S). The positions of fronts are also shown, with thesouthern branch of the Subtropical Front (S-STF,∼ 42◦2′ S), theSubantarctic Front (SAF, 44◦2′ S), the Polar Front (PF, 50◦22.4′ S),the Southern ACC Front (SACCF,∼ 51◦52′ S) and the SouthernBoundary of the ACC (Sbdy,∼ 55◦54.3′ S). From their geographi-cal positions, stations L1, S1 and L2 were in the Subtropical Zone(STZ), S2 was on the northern side of the Subantarctic Zone (SAZ),stations L3, L4, S3 and L5 were within the Polar Frontal Zone, sta-tion L6 was on the northern flank of PF, S4 was on the SACCF,station L7 was at the SBdy, and station S5 was in the northernbranch of the Weddell Gyre. Figure prepared using Ocean DataView (Schlitzer, 2012).
isotopes65Cu, 111Cd and207Pb; ISOFLEX, San Francisco,CA, USA) enriched over their natural abundance. A workingsolution of65Cu, 111Cd and207Pb was prepared in 0.024 Multrapure HNO3 (Romil, Cambridge UK), and the exact con-centration of the enriched isotope spikes in the mixed solu-tion was determined by ICP optical emission spectroscopy(OES) against known natural standards (10 mg l−1, ICP HighPurity Standards) (Milne et al., 2010). Addition of the iso-tope spike to the sample contributed 60 pM Cd, 37 pM Pb and1.13 nM Cu. In addition, standard additions of Mn were per-formed on sub-sets of the same seawater sample. The spikedsamples were left for overnight equilibration. Subsequently,the samples were buffered to pH∼ 6.2 using 2 M ammo-nium acetate, prepared with ultrapure acetic acid and ammo-nia (Romil, Cambridge, UK). The buffered sample was thenpumped over the preconcentration column, at 2 ml min−1.The column was rinsed with 1 ml de-ionised water to re-move salts, and subsequently the metals were eluted using1 ml of 1 M HNO3 (Romil ultrapure HNO3). The eluentwas collected into acid cleaned autosampler polypropylene
vials (OmniVials; 4 ml) and capped. Prior to loading of thenext sample, the column was washed with an acid solution(1.5 M HCl) to remove residual trace elements. The extractedsamples were analysed using a ThermoFisher Scientific Ele-ment II ICP-MS (E2 Bremen, Germany). The sample was in-troduced via a 100 µl Teflon nebuliser connected to a quartzspray chamber. Measurements for Cd and Pb were performedin low resolution mode (R = 300); whereas all other ele-ments were measured in medium resolution (R = 4000).
Silver (Ag) was measured separately by ID-ICPMS withpreconcentration on an anion-exchange column (Yang andSturgeon, 2002; Barriada et al., 2007). In this method about20 ml of the acidified sample was placed in an acid cleanedvial and spiked with109Ag stable isotope (75 µl of∼ 5 nMsolution in 0.024 M HNO3 per 20 ml sample, 18.7 pM). Thesolution was allowed to equilibrate overnight. The samplewas then pumped at 3 ml min−1 through a 1 cm long, 85 µMinternal volume minicolumn (Global FIA, Inc., Fox Island,WA, USA) filled with a strong anion-exchange resin (Dowex1X8, 200–400 mesh; Supelco, Bellefonte, CA, USA). Thesample was eluted using 2 ml of 1.2 M HNO3 (Romil SpA).Measurements were performed using an X-SERIES 2 ICP-MS (Thermo Fisher Scientific, Bremen, Germany) in thestandard configuration, interfaced with an ASX-510 au-tosampler (Cetac, Omaha, Nebraska, USA). The concentra-tion of the109Ag spike solution was determined using ICP-OES.
The accuracy and precision of the methods wereassessed by analyses of SAFe (Sampling and Anal-ysis of iron) and GEOTRACES reference samples(http://www.geotraces.org/science/intercalibration/322-standards-and-reference-materials), and results arereported in Table 1. The values determined using theID-ICPMS method show good consistency with the reportedconsensus values for dissolved Cd and Pb (Table 1). Thereis no consensus value for dissolved Ag yet, hence thedata recorded in this work may provide a basis for lateranalyses of the reference samples. Dissolved Cu concen-trations determined by ID-ICPMS were lower comparedto the consensus values, especially in the deep samples(Table 1), possibly because the samples were not exposedto UV-irradiation prior their analyses (Milne et al., 2010).Dissolved Mn detected by ICPMS yielded higher concen-trations than the consensus values (Table 1), in line with thegeneral trend that shows higher dissolved Mn concentrationsusing methods based upon ICP-MS as compared to thosebased upon catalytic-enhanced flow injection (http://www.geotraces.org/images/stories/documents/intercalibration/Files/ReferenceSamplesNovember11/SAFeRef Mn.pdf).
The complete database of the dissolved concentrations ofCd, Cu, Mn, Ag and Pb at the stations LARGE and SU-PER can be obtained viahttp://www.obs-vlfr.fr/proof/php/xdatalist.php?xxop=bonusgh&xxcamp=bonusgh, and will beavailable at the international GEOTRACES datacenter (http://www.bodc.ac.uk/geotraces/).
www.biogeosciences.net/9/3231/2012/ Biogeosciences, 9, 3231–3246, 2012

3234 M. Boye et al.: Distributions of dissolved trace metals
Table 1.Comparison of dissolved Cd, Cu, Pb and Ag analyses obtained in the present study by the ID-ICPMS method and of dissolved Mnobtained by the internal standard addition and ICPMS detection, with the consensus values reported by the SAFe project (in the surface-Sand deep-D2 samples) and in the North Atlantic GEOTRACES (in the surface-GS and deep-GD samples) Reference Samples (updated inNovember 2011). All± terms represent standard deviation from average values.
SAFe concentration Consensus value SAFe GEOTRACES concentration Consensus value GEOTRACES
S D2 S D2 GS GD GS GD
Cd0.77± 0.96 pM 1034± 15 pM
1.00± 0.2 pM 986± 27 pM2.86± 0.37 pM 287± 7 pM 2.4± 0.4 pM 273± 6 pM
(n = 4) (n = 8) (n = 3) (n = 4)
Cu0.56± 0.03 nM 1.39± 0.13 nMa
0.51± 0.05 nM 2.25± 0.11 nM0.72± 0.07 nMa 1.12± 0.04 nMa 0.83± 0.08 nM 1.55± 0.13 nM
(n = 10) (n = 9) (n = 4) (n = 4)
Mn0.93± 0.06 nM 0.49± 0.07 nM
0.79± 0.06 nMb 0.35± 0.06 nMb Not measured Not measured1.45± 0.17 nM 0.21± 0.04 nM
(n = 4) (n = 4)
Pb51.2± 2.2 pM 36.3± 1.4 pM
47.6± 2.4 pM 27.7± 1.8 pM31.1± 1.6 pM 43.8± 3.2 pM 29.5± 2.1 pM 42.2± 1.3 pM
(n = 11) (n = 7) (n = 4) (n = 4)
Ag3.5± 0.7 pM 26.2± 0.9 pM
No value No value2.7± 0.9 pM 13.1± 1.0 pM
No value No value(n = 3) (n = 5) (n = 3) (n = 4)
a The UV oxidation of the samples might be required to obtain an accurate value for dissolved Cu using this method (Milne et al., 2010).b In general, methods based upon ICP-MS yield higher dissolved Mn concentrations than methods based upon catalytic-enhanced flow injection. Furthermore, there are significantdifferences between UV treatment and non-UV treated samples for dissolved Mnhttp://www.geotraces.org/images/stories/documents/intercalibration/Files/ReferenceSamplesNovember11/SAFeRef Mn.pdf.
2.4 Aerosol sampling and analysis
Aerosol samples were collected onto single 20× 25 cmWhatman 41 filters using a Tisch TSP high volume aerosolcollector operating at a flow rate of∼ 1 m3 min−1 (Bakeret al., 2007). Due to the very low aerosol concentrations inthe study region, collection times for each sample were rela-tively long (2–3 days), and the collector was only used whenthe ship was heading into the prevailing wind in order toavoid contamination from the ship. Collection filters wereextensively acid-washed before use, with 0.5 M Aristar HCl,0.1 M Aristar HCl (Rickli et al, 2010), followed by a furtherwash with 0.1 M Suprapure HCl, which was carried out in atrace metal clean laboratory.
After collection, samples were sealed in plastic bags andimmediately frozen at−16◦C for return to the shore labora-tory. One quarter of each aerosol filter was extracted into 1 Mammonium acetate solution for between 1 and 2 h and thesolution filtered through 0.2 µM minisart filters (Sartorius),as described in Baker et al. (2007). Soluble Mn, Cu, Pb, Cdand Ag were then determined by ICP-OES (Mn and Cu) andICP-MS (Pb, Cd, Ag). Concentrations of Cd and Ag werebelow analytical detection limits (0.05–0.2 pmol m−3) in allcases. Concentrations ranges for the other elements were0.8–4.8 pmol m−3 (Mn), 4.3–13 pmol m−3 (Cu) and 0.27–0.83 pmol m−3 (Pb). Here we estimate the dry deposition fluxof these elements as the product of their aerosol concentra-tions and a dry deposition velocity. We used an estimated drydeposition velocity of 0.3 cm s−1, a value appropriate for el-ements likely to be chiefly associated with fine mode aerosol(Duce et al., 1991). We emphasize that dry deposition veloc-ities are probably uncertain to plus or minus a factor of 2–3(Duce et al., 1991), hence our calculated dry fluxes should beconsidered as order of magnitude estimates.
Atmospheric deposition of trace metals is also likely tooccur through wet deposition. Attempts to sample rain andsnow during the cruise were unsuccessful and we are there-fore unable to make direct estimates of the magnitude of thiswet flux. However, the northern part of the transect is rela-tively dry (Xie and Arkin, 1997) and wet deposition likelymakes a less significant contribution there than in the south(Baker et al., 2010).
3 Results
3.1 Hydrography
A comprehensive description of the hydrography along themeridional section of this voyage is given in Bown etal. (2011). Further details are provided for the 2004 oc-cupation of this CLIVAR GoodHope Line in Gladyshev etal. (2008). Briefly, the Subtropical Zone (STZ) extendedto the southern branch of the Subtropical Front (S-STF;∼ 42◦ S), including stations L1, S1 and L2 (Fig. 1). Despiteits geographical location, S2 exhibitedS andT signaturesof subtropical waters (Bown et al., 2011), and this stationwill be discussed within the subtropical domain. The sub-tropical domain in the Cape Basin region is characterizedby a very complex dynamic regime (Lutjeharms and Van-ballegooyen, 1988; Gordon et al., 1992). The central wa-ter layer was mainly occupied by waters of Indian origin(Gordon et al., 1992). Antarctic Intermediate Water of In-dian Ocean origin (I-AAIW) was observed at depths between800 and 1200 m in the region close to Africa (stations L1and S1), whereas another variety of AAIW was observed tothe south (at L2 and S2) featuring AAIW formed in the sub-antarctic region of the southwest Atlantic (A-AAIW; Piola
Biogeosciences, 9, 3231–3246, 2012 www.biogeosciences.net/9/3231/2012/

M. Boye et al.: Distributions of dissolved trace metals 3235
Fig. 2. Diagrams of potential temperature (◦C) versus salinity in the whole water column (left panel) and in deep waters (right panel) at thestations sampled for trace metals determination (CTD data and validation from Branellec et al., 2010; Kermabon and Arhan, 2008).
and Gordon, 1989) (Fig. 2). The Upper Circumpolar DeepWater was found at a depth range of∼ 1200–1500 m, andcharacterized by its oxygen minimum (160–180 µmol kg−1).The complex water mass structure observed at L1 and S1 waslikely transported by the Agulhas Current and rings, whereasit may originate from the southwest Atlantic (A-UCDW) atL2 and S2. At greater depths, a diluted variety of the NorthAtlantic Deep Water was observed which was transportedalong the southwest African continental shelf (SE-NADW;Arhan et al., 2003; Gladyshev et al., 2008) and characterisedby its S signature (Fig. 2) and an oxygen maximum at 2000–3200 m depth at S1 and S2. Near the seafloor an old vari-ety of Antarctic Bottom Water (AABW) was observed in theCape Basin abyssal plain at S1. In the Antarctic Circumpo-lar Current (ACC; Fig. 1), the surface water was marked bya southward decrease of temperature from 4◦C (L5) to 2◦C(S4) and lowS (Fig. 2). Below the surface mixed layer, A-AAIW was observed; this water mass subducted northwardalong the Subantarctic Front (SAF). At greater depths theAntarctic Winter Waters (AAWW; characterized by aT min-imum; Fig. 2), the A-UCDW, and a diluted variety of NADWwhich flows along the continental slope of South America be-fore being injected in the ACC in the southwestern Atlantic(SW-NADW; Whitworth and Nowlin, 1987) were observednorth of the Polar Front (PF). South of the PF, another vari-ety of UCDW which had passed through the Drake Passage(DP-UCDW) was identified by a core of low oxygen water(stations L6, S4 and L7). There deep waters exhibited prop-erties of Lower Circumpolar Deep Waters (LCDW; Fig. 2).Finally, south of the Southern Boundary of the ACC (SBdy),the near surface waters may have been in contact with thewestern continental margin of the Antarctic Peninsula, whilethe deeper waters may have been in contact with the north-ern topographic limit of the Weddell Basin (Orsi et al., 1993;Meredith et al., 2000). Near the seafloor a fresher and colder
variety of AABW was observed south of the ACC domain,as compared to AABW observed in the Cape Basin abyssalplain and on the northern flank of the Mid-Atlantic Ridge(Fig. 2).
3.2 Dissolved copper
The vertical distributions of dissolved Cu displayed nutrient-like behavior with lower concentrations in surface waters andincreasing levels with depth (Figs. 3 and 4). There was a clearnorth–south gradient in the ACC and the Weddell Gyre wa-ters, with the southern waters having higher concentrationscompared to the north of the area (Fig. 3). This gradient fol-lowed that of silicate (Fig. 4). The highest Cu concentrationsin surface waters were recorded in the northern branch ofthe Weddell Gyre (Fig. 3). In contrast, in the subtropical wa-ters the dissolved Cu concentrations decreased in southwarddirection, and were lowest in the south of this domain (atstations L2 and S2) where enhanced chlorophylla concen-trations were observed along the section (Le Moigne et al.,2012). Deep maxima of Cu were observed in the cores of I-AAIW and SE-NADW (at S1), A-AAIW (at L3, L4 and L5),A-UCDW (at L3), and DP-UCDW (at S4) (Figs. 3 and 4).
3.3 Dissolved silver
Vertical distributions of dissolved Ag generally showedlower concentrations in surface waters and increasing con-centrations with depth (Fig. 3), similar to silicate (Fig. 4).There was a general north–south trend in the Ag concentra-tions along the section, with the concentrations of Ag beinggenerally lower in the subtropical domain than in the ACC(Fig. 3). Relative Ag minima were observed at several sta-tions at depths between 150 and 350 m (Figs. 3 and 4) co-inciding with oxygen minima (see dissolved O2 profiles inBown et al., 2011), whereas relative maxima were recorded
www.biogeosciences.net/9/3231/2012/ Biogeosciences, 9, 3231–3246, 2012

3236 M. Boye et al.: Distributions of dissolved trace metals
Fig. 3. Contour plots of dissolved copper (Cu, in nM), silver (Ag, in pM), lead (Pb, in pM), cadmium (Cd, in pM) and manganese (Mn,in nM) along the MD166 BONUS-GoodHope section between the southeastern Atlantic and the Southern Ocean. The positions of L and Sstations and the fronts are indicated. The colour map gridding is based on the sampling resolution along the section of∼ 2600 km that wasachieved with 12 stations separated on average by∼ 2.2◦ latitude, with a total of 160 sampling depths. Figure prepared using Ocean DataView (Schlitzer, 2012).
in deeper waters in the cores of the different varieties ofUCDW – UCDW which was transported by the Agulhas Cur-rent (at S1), of southwest Atlantic origin (at S2), and whichhad passed through the Drake Passage (at S4 and L7). Con-versely, Ag was relatively depleted in the cores of SE-NADW(at S1 and S2) and SW-NADW (L3 to L5).
3.4 Dissolved lead
The distributions of Pb were rather constant with depthacross the section (with concentrations ranging between 10.2and 32.3 pM), with the exception of the two northern stationsclosest to South Africa (L1 and S1) where Pb concentrationswere much higher in the top 100 m depth (e.g. 37–55 pM)than in deeper waters (Fig. 3). Enrichment in the core of I-AAIW was observed at S1 station (Fig. 3). The lowest con-centrations of Pb at depth (7.1–12.0 pM) were observed atthe Southern Boundary of the ACC (station L7; Fig. 3).
3.5 Dissolved cadmium
Dissolved Cd concentrations increased markedly with depth(Fig. 3), similar to the major nutrient phosphate (Fig. 4).There was an obvious north–south gradient in the sur-face concentrations of Cd, similar to phosphate (Fig. 4),with lower concentrations in the northern waters (as low as3.8 pM) as compared to much higher Cd concentrations inthe southern waters of up to 895 pM at the ACC SouthernBoundary (Figs. 3 and 4). However, the surface Cd concen-trations in the Weddell Gyre were different from this pattern,since they were generally lower than the values recorded onthe southern side of the ACC, south of the PF (Fig. 3).
3.6 Dissolved manganese
The vertical distributions of dissolved Mn generally showedlow concentration in surface waters, a subsurface maxi-mum in the oxygen minimum zone deepening southwards,and rather constant and low deep water concentrations inthe range of or below the surface values (Figs. 3 and 4).
Biogeosciences, 9, 3231–3246, 2012 www.biogeosciences.net/9/3231/2012/
M. Boye et al.: Distributions of dissolved trace metals 3237
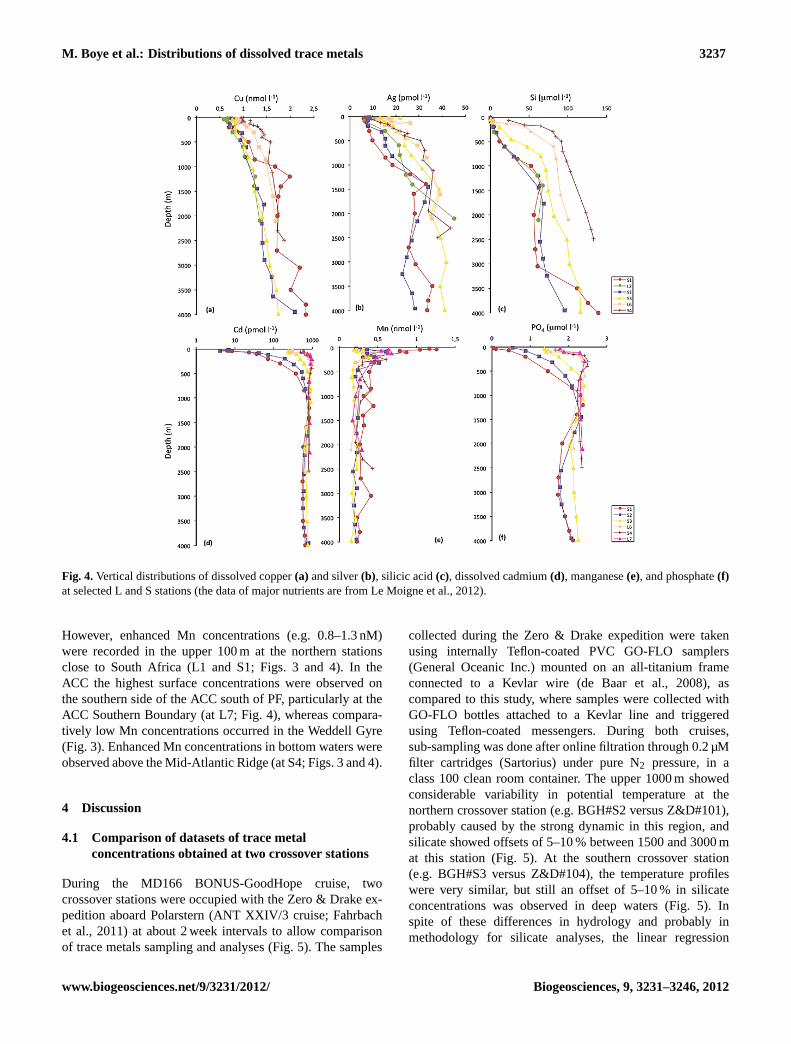
Fig. 4.Vertical distributions of dissolved copper(a) and silver(b), silicic acid(c), dissolved cadmium(d), manganese(e), and phosphate(f)at selected L and S stations (the data of major nutrients are from Le Moigne et al., 2012).
However, enhanced Mn concentrations (e.g. 0.8–1.3 nM)were recorded in the upper 100 m at the northern stationsclose to South Africa (L1 and S1; Figs. 3 and 4). In theACC the highest surface concentrations were observed onthe southern side of the ACC south of PF, particularly at theACC Southern Boundary (at L7; Fig. 4), whereas compara-tively low Mn concentrations occurred in the Weddell Gyre(Fig. 3). Enhanced Mn concentrations in bottom waters wereobserved above the Mid-Atlantic Ridge (at S4; Figs. 3 and 4).
4 Discussion
4.1 Comparison of datasets of trace metalconcentrations obtained at two crossover stations
During the MD166 BONUS-GoodHope cruise, twocrossover stations were occupied with the Zero & Drake ex-pedition aboard Polarstern (ANT XXIV/3 cruise; Fahrbachet al., 2011) at about 2 week intervals to allow comparisonof trace metals sampling and analyses (Fig. 5). The samples
collected during the Zero & Drake expedition were takenusing internally Teflon-coated PVC GO-FLO samplers(General Oceanic Inc.) mounted on an all-titanium frameconnected to a Kevlar wire (de Baar et al., 2008), ascompared to this study, where samples were collected withGO-FLO bottles attached to a Kevlar line and triggeredusing Teflon-coated messengers. During both cruises,sub-sampling was done after online filtration through 0.2 µMfilter cartridges (Sartorius) under pure N2 pressure, in aclass 100 clean room container. The upper 1000 m showedconsiderable variability in potential temperature at thenorthern crossover station (e.g. BGH#S2 versus Z&D#101),probably caused by the strong dynamic in this region, andsilicate showed offsets of 5–10 % between 1500 and 3000 mat this station (Fig. 5). At the southern crossover station(e.g. BGH#S3 versus Z&D#104), the temperature profileswere very similar, but still an offset of 5–10 % in silicateconcentrations was observed in deep waters (Fig. 5). Inspite of these differences in hydrology and probably inmethodology for silicate analyses, the linear regression
www.biogeosciences.net/9/3231/2012/ Biogeosciences, 9, 3231–3246, 2012
3238 M. Boye et al.: Distributions of dissolved trace metals
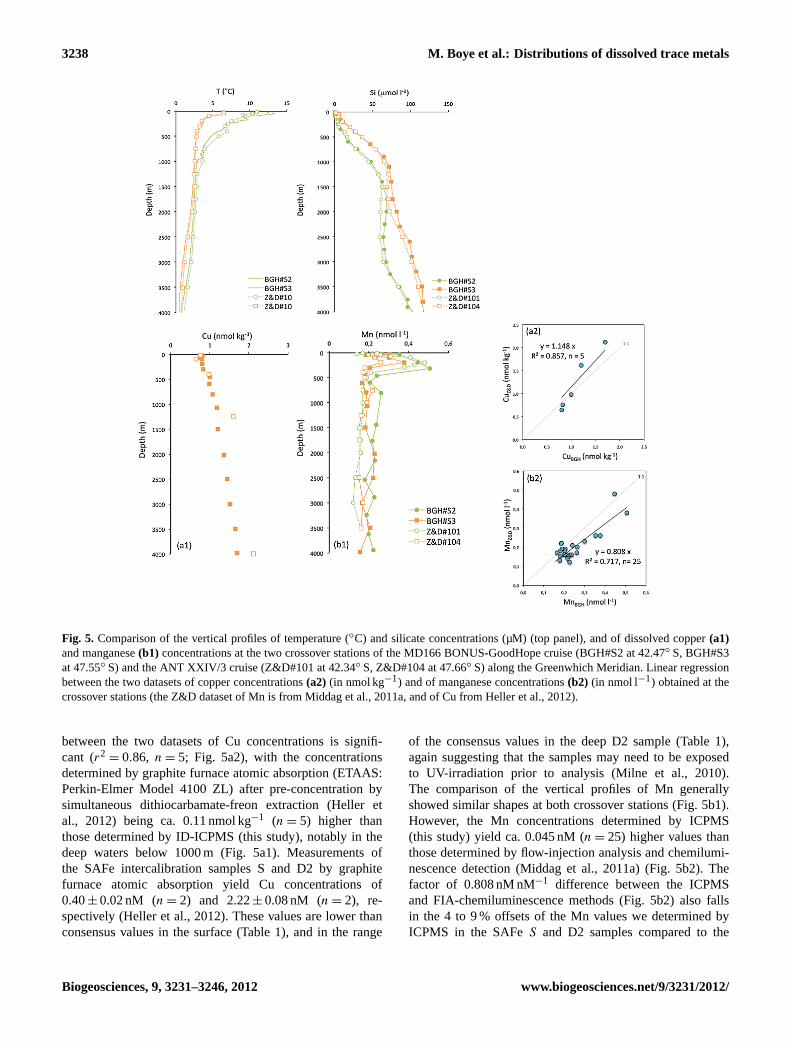
Fig. 5. Comparison of the vertical profiles of temperature (◦C) and silicate concentrations (µM) (top panel), and of dissolved copper(a1)and manganese(b1) concentrations at the two crossover stations of the MD166 BONUS-GoodHope cruise (BGH#S2 at 42.47◦ S, BGH#S3at 47.55◦ S) and the ANT XXIV/3 cruise (Z&D#101 at 42.34◦ S, Z&D#104 at 47.66◦ S) along the Greenwhich Meridian. Linear regressionbetween the two datasets of copper concentrations(a2) (in nmol kg−1) and of manganese concentrations(b2) (in nmol l−1) obtained at thecrossover stations (the Z&D dataset of Mn is from Middag et al., 2011a, and of Cu from Heller et al., 2012).
between the two datasets of Cu concentrations is signifi-cant (r2
= 0.86, n = 5; Fig. 5a2), with the concentrationsdetermined by graphite furnace atomic absorption (ETAAS:Perkin-Elmer Model 4100 ZL) after pre-concentration bysimultaneous dithiocarbamate-freon extraction (Heller etal., 2012) being ca. 0.11 nmol kg−1 (n = 5) higher thanthose determined by ID-ICPMS (this study), notably in thedeep waters below 1000 m (Fig. 5a1). Measurements ofthe SAFe intercalibration samples S and D2 by graphitefurnace atomic absorption yield Cu concentrations of0.40± 0.02 nM (n = 2) and 2.22± 0.08 nM (n = 2), re-spectively (Heller et al., 2012). These values are lower thanconsensus values in the surface (Table 1), and in the range
of the consensus values in the deep D2 sample (Table 1),again suggesting that the samples may need to be exposedto UV-irradiation prior to analysis (Milne et al., 2010).The comparison of the vertical profiles of Mn generallyshowed similar shapes at both crossover stations (Fig. 5b1).However, the Mn concentrations determined by ICPMS(this study) yield ca. 0.045 nM (n = 25) higher values thanthose determined by flow-injection analysis and chemilumi-nescence detection (Middag et al., 2011a) (Fig. 5b2). Thefactor of 0.808 nM nM−1 difference between the ICPMSand FIA-chemiluminescence methods (Fig. 5b2) also fallsin the 4 to 9 % offsets of the Mn values we determined byICPMS in the SAFeS and D2 samples compared to the
Biogeosciences, 9, 3231–3246, 2012 www.biogeosciences.net/9/3231/2012/
M. Boye et al.: Distributions of dissolved trace metals 3239
consensus values (Table 1). Measurements of the SAFe in-tercalibration samples S and D2 by FIA-chemiluminescencemethod yield Mn concentrations of 0.73± 0.004 nM (n = 1)and 0.32± 0.01 nM (n = 37), respectively (Middag et al.,2011a), in excellent agreement with the consensus values(Table 1); yet, the consensus values are partly dependenton the values reported by Middag et al. (2011a), whereasthey are independent of the ones we measured (Table 1).Comparison of two Cd datasets at the southern crossover sta-tion showed a good agreement between the isotope dilutionthermal ionization mass spectrometry method (O. Baars,personnal communication, 2012) and the ID-ICPMS method(this study) (data not shown). Overall, there is fairly goodagreement for Cu and Mn (and Cd) between the two cruises,with some further investigation needed to determine thesources of difference.
4.2 Imprints of the continental margin–open oceanexchanges and external sources
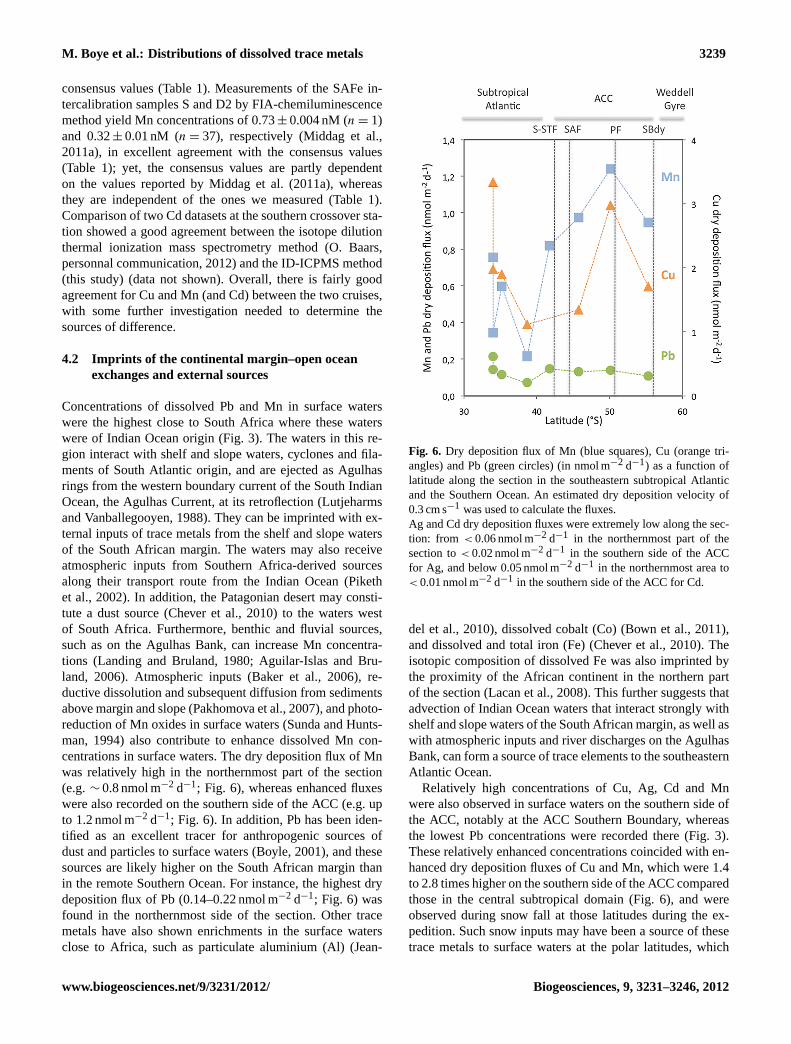
Concentrations of dissolved Pb and Mn in surface waterswere the highest close to South Africa where these waterswere of Indian Ocean origin (Fig. 3). The waters in this re-gion interact with shelf and slope waters, cyclones and fila-ments of South Atlantic origin, and are ejected as Agulhasrings from the western boundary current of the South IndianOcean, the Agulhas Current, at its retroflection (Lutjeharmsand Vanballegooyen, 1988). They can be imprinted with ex-ternal inputs of trace metals from the shelf and slope watersof the South African margin. The waters may also receiveatmospheric inputs from Southern Africa-derived sourcesalong their transport route from the Indian Ocean (Pikethet al., 2002). In addition, the Patagonian desert may consti-tute a dust source (Chever et al., 2010) to the waters westof South Africa. Furthermore, benthic and fluvial sources,such as on the Agulhas Bank, can increase Mn concentra-tions (Landing and Bruland, 1980; Aguilar-Islas and Bru-land, 2006). Atmospheric inputs (Baker et al., 2006), re-ductive dissolution and subsequent diffusion from sedimentsabove margin and slope (Pakhomova et al., 2007), and photo-reduction of Mn oxides in surface waters (Sunda and Hunts-man, 1994) also contribute to enhance dissolved Mn con-centrations in surface waters. The dry deposition flux of Mnwas relatively high in the northernmost part of the section(e.g.∼ 0.8 nmol m−2 d−1; Fig. 6), whereas enhanced fluxeswere also recorded on the southern side of the ACC (e.g. upto 1.2 nmol m−2 d−1; Fig. 6). In addition, Pb has been iden-tified as an excellent tracer for anthropogenic sources ofdust and particles to surface waters (Boyle, 2001), and thesesources are likely higher on the South African margin thanin the remote Southern Ocean. For instance, the highest drydeposition flux of Pb (0.14–0.22 nmol m−2 d−1; Fig. 6) wasfound in the northernmost side of the section. Other tracemetals have also shown enrichments in the surface watersclose to Africa, such as particulate aluminium (Al) (Jean-
Fig. 6. Dry deposition flux of Mn (blue squares), Cu (orange tri-angles) and Pb (green circles) (in nmol m−2 d−1) as a function oflatitude along the section in the southeastern subtropical Atlanticand the Southern Ocean. An estimated dry deposition velocity of0.3 cm s−1 was used to calculate the fluxes.Ag and Cd dry deposition fluxes were extremely low along the sec-tion: from < 0.06 nmol m−2 d−1 in the northernmost part of thesection to< 0.02 nmol m−2 d−1 in the southern side of the ACCfor Ag, and below 0.05 nmol m−2 d−1 in the northernmost area to< 0.01 nmol m−2 d−1 in the southern side of the ACC for Cd.
del et al., 2010), dissolved cobalt (Co) (Bown et al., 2011),and dissolved and total iron (Fe) (Chever et al., 2010). Theisotopic composition of dissolved Fe was also imprinted bythe proximity of the African continent in the northern partof the section (Lacan et al., 2008). This further suggests thatadvection of Indian Ocean waters that interact strongly withshelf and slope waters of the South African margin, as well aswith atmospheric inputs and river discharges on the AgulhasBank, can form a source of trace elements to the southeasternAtlantic Ocean.
Relatively high concentrations of Cu, Ag, Cd and Mnwere also observed in surface waters on the southern side ofthe ACC, notably at the ACC Southern Boundary, whereasthe lowest Pb concentrations were recorded there (Fig. 3).These relatively enhanced concentrations coincided with en-hanced dry deposition fluxes of Cu and Mn, which were 1.4to 2.8 times higher on the southern side of the ACC comparedthose in the central subtropical domain (Fig. 6), and wereobserved during snow fall at those latitudes during the ex-pedition. Such snow inputs may have been a source of thesetrace metals to surface waters at the polar latitudes, which
www.biogeosciences.net/9/3231/2012/ Biogeosciences, 9, 3231–3246, 2012

3240 M. Boye et al.: Distributions of dissolved trace metals
was further supported by air mass back-trajectories using theNOAA HYSPLIT model (see in Klunder et al., 2011) and in-dependent records of elevated concentrations of Mn (Middaget al., 2011a) and other lithogenic trace metals such as dis-solved Co (Bown et al., 2011) and dissolved Al (Middag etal., 2011b). However, the dry deposition can account only fora small fraction of the elevated concentrations of Co (Bownet al., 2011) and Mn (Middag et al., 2011a) at those lati-tudes. The lateral advection from the Drake Passage in thefast eastwards flowing ACC and the upwelling of enrichedCircumpolar Deep Water south of the PF have to be takeninto account to explain the enhanced Co and Mn concentra-tions in these surface waters (Bown et al., 2011; Middag etal., 2011a), and therefore to account for the higher concen-trations of the other trace metals. Conversely, the remotenessof anthropogenic sources, as exemplified by the low dry at-mospheric Pb flux (0.11–0.14 nmol m−2 d−1; Fig. 6) and as-sociated with relative intensification of scavenging processesdriven by high export of particles at those latitudes inferredby 234Th/238U measurements (Planchon et al., 2012), mayhave led to the extremely low Pb concentrations at depth.
Shelf-to-open ocean mixing and advection of watermasses that have been in contact with continental marginsand slopes may well have caused the relative maxima of Pb,Cu and Ag observed in intermediate and deep waters acrossthe section (Fig. 3). For instance, enrichment of these met-als in the cores of I-AAIW and A-UCDW may partly reflectsediment and benthic inputs, as well as entrainment of othershelf inputs from the southern margin of South Africa andfrom the region of formation of A-UCDW in the southwestAtlantic (Whitworth and Nowlin, 1987). Such processes havealso been suggested to account for the intermediate and deeprelative maxima of particulate Al (Jeandel et al., 2010), dis-solved Co (Bown et al., 2011) and dissolved Fe (Chever etal., 2010) along the section. Interestingly, Cu showed a linearcorrelation with Ag in the water column of the ACC domainof the section (Ag = 20.61· Cu + 2.12 pM nM−1; r2
= 0.52;n = 81), which can further support the use of the Ag–Curelationship as a potential tracer of water masses (Sanudo-Wilhelmy et al., 2002; Ranville and Flegal, 2005). Despitethe enrichment of Ag at intermediate depths in the watermasses that have been in contact with the continental mar-gin and shelf boundary, its concentrations were relatively de-pleted in the core of NADW, which had been transportedalong the southwest African continental shelf or along thecontinental slope of South America (Fig. 3). Similarly, lowdissolved Ag concentrations were recorded in the deep wa-ters of the southeastern Atlantic (Flegal et al., 1995). In fact,it is possible that there is a systematic enrichment of Ag in thedeep waters from the North Atlantic towards the North Pa-cific along the global ocean deep circulation pathway (Zhanget al., 2004). Deep Ag distributions may hence further reflectwater mass ages and long-term mixing of deep waters.
In bottom waters there were relatively higher dissolved Mnconcentrations (0.30–0.43 nM) over the Bouvet Triple Junc-
tion ridge crest at 51.85◦ S (e.g. station S4; Fig. 3) comparedto the other stations at comparable depths (< 0.25 nM). Bot-tom Mn maxima (> 1 nM) were reported in a dataset of dis-solved Mn obtained at higher vertical and horizontal resolu-tions at the latitudes of 53–54◦ S, and were deemed to befrom hydrothermal inputs (Middag et al., 2011a). The in-puts coincided with enhanced concentrations of dissolvedFe (Klunder et al., 2011). It is thus possible that the en-hanced deep Mn concentrations we recorded over the Bou-vet Triple Junction were due to hydrothermal inputs. How-ever, the strongest feature was missed because of the poorsampling resolution, notably due to the lack of a samplingstation in the center of the hydrothermal plume.
4.3 Relationships between Cu, Ag, Mn, Cd andmajor nutrients in the subtropical Atlantic watersand the Southern Ocean
4.3.1 The silver and silicic acid relationship
Dissolved Ag showed a significant linear relationship withsilicic acid (Si) in the water column of the subtropical domainand the Southern Ocean, excluding the data from the WeddellGyre (Fig. 7a). A good linear correlation between Ag and Siwas also reported previously for the Atlantic, with an overalllower Ag / Si ratio (0.11 pM µM−1; Flegal et al., 1995) thanobserved in our study (e.g. 0.21 pM µM−1; Fig. 7a). A linearrelationship was also obtained in the South and equatorialPacific, with a slope higher than in the Atlantic and muchgreater concentrations in the surface waters (Zhang et al.,2004). It is thought that the Ag distribution is primarily con-trolled by uptake by diatoms with subsequent dissolution atdepth of biogenic opal (Kramer et al., 2011). However, in theNorth Pacific Ag and Si were also positively correlated, butthe relationship was not linear (Zhang et al., 2004; Kramer etal., 2011), indicating that Ag is not simply incorporated intothe siliceous frustule of diatoms (Zhang et al., 2004) and thatthe ocean Ag cycle may be more complicated. For instance,it has been shown that Ag can be accumulated not only indiatoms but also in dinoflagellates (Fisher and Wente, 1993).Dinoflagellates were abundant in the southernmost subtropi-cal region of the section (Beker and Boye, 2010), and incor-poration of Ag in these organisms may have played a rolein reducing the surface Ag concentrations (Fig. 3). Further-more, depletion of Ag relative to silicic acid was observedat intermediate depths in the North Pacific and related tolow dissolved oxygen concentrations, with a suggested re-moval of Ag by scavenging and/or precipitation with sulfidesthat may account for the curvature in the Ag–Si relationship(Kramer et al., 2011; Zhang et al., 2004). Relative minima ofAg were observed in the oxygen-depleted zone in our study(Fig. 3). However, the oxygen concentration in this part of thewater column was relatively high along the section across thesubtropical southeast Atlantic (e.g.> 230 µM) and the South-ern Ocean (e.g.> 170 µM) compared with the North Pacific
Biogeosciences, 9, 3231–3246, 2012 www.biogeosciences.net/9/3231/2012/

M. Boye et al.: Distributions of dissolved trace metals 3241
Fig. 7. Relationships among the concentrations of Ag (in pM)(a), Cu (in nM) (b) and silicic acid (Si; in µM); and Cd (in pM)(c), Mn (innM) (d) and phosphate (P04; in µM) along the section between the southeastern Atlantic and the Southern Ocean. The coloured symbolsstand for each station.
(e.g. 150 µM; Kramer et al., 2011), potentially leading to aminor removal of Ag in those waters.
4.3.2 The copper and silicic acid relationship
Dissolved Cu showed a strong linear correlation withSi in the water column across the section, with aslightly lower Cu / Si ratio in the ACC and WeddellGyre (e.g. 0.007 nM µM−1) than in the subtropical waters(e.g. 0.011 nM µM−1; Fig. 7b). Strong linear relationshipsbetween Cu and Si were previously observed in the At-lantic sector of the Southern Ocean with higher Cu / Si ra-tios (e.g. 0.013–0.018 nM g µM−1) in the relatively produc-tive Polar Frontal region during spring (Loscher, 1999), com-pared to those in the diatom post-bloom area centered on thePolar Front (e.g. 0.004 nM µM−1) during our late summer ex-pedition (Le Moigne et al., 2012). The seasonal decrease ofthe Cu / Si ratio over the diatom productive season is prob-ably due to preferential Si uptake by diatoms in the upperwater column and Cu scavenging in deeper waters, as wellas to a longer retention of Cu compared to Si during dis-solution of the diatom frustules in the sediments (Loscher,1999). The decrease in Cu / Si ratio in the Polar Frontal re-gion over the productive season also coincided with a de-crease of Cu concentrations in surface waters from about
1.5 nM (Loscher, 1999) to about 0.9 nM (this study, stationL6; Fig. 3). In a section across the Subantarctic zone in theAustralian sector of the Southern Ocean, the decrease in Cuconcentrations between summer and winter conditions wasless pronounced (e.g. 0.1–0.2 nM), and was correlated witha drawdown of PO4 by about 0.4 µM (Ellwood, 2008). Thelow Cu / Si ratio and the relative depletion of Cu observedin the vast post-diatom bloom area centered on the PolarFront coincided with depletion of dissolved Fe in the sur-face waters (< 0.25 nM; Chever et al., 2010). The relativelow concentrations of both Cu and Fe in these surface wa-ters indicate an involvement of Cu in the Fe uptake processof oceanic diatoms (Maldonado et al., 2006). The relation-ship between the uptake of Cu and Fe by diatoms couldnot be observed in the HNLC surface waters where Cu con-centrations increased southwards (Fig. 3), in contrast to Fe(Chever et al., 2010). Differences in biogeochemical cyclingof Fe and Cu, especially due to external sources and mixedlayer recycling processes, as well as particle reactivity maycause the different trends observed in surface waters of theHNLC area. The Cu / Si depletion ratio was slightly higherin the subtropical waters than in the ACC and Weddell Gyre,where the ratios were similar to the global relationship ob-tained along the section (Fig. 7b). The strongest removalof Cu was observed in the southernmost subtropical region
www.biogeosciences.net/9/3231/2012/ Biogeosciences, 9, 3231–3246, 2012
3242 M. Boye et al.: Distributions of dissolved trace metals
(Fig. 3), where nanoflagellates dominated the phytoplanktonassemblage and dinoflagellates were also abundant (Bekerand Boye, 2010). Dinoflagellates and nanoflagellates, suchas prasinophyceae, have a relatively higher Cu cellular quotacompared to diatoms (Ho et al., 2003). Hence, this observa-tion suggests that other taxa than diatoms are able to con-trol the removal of Cu from the surface waters such as in thesoutheastern Atlantic Ocean, and therefore the Cu / Si ratio.
4.3.3 The cadmium and phosphate relationship
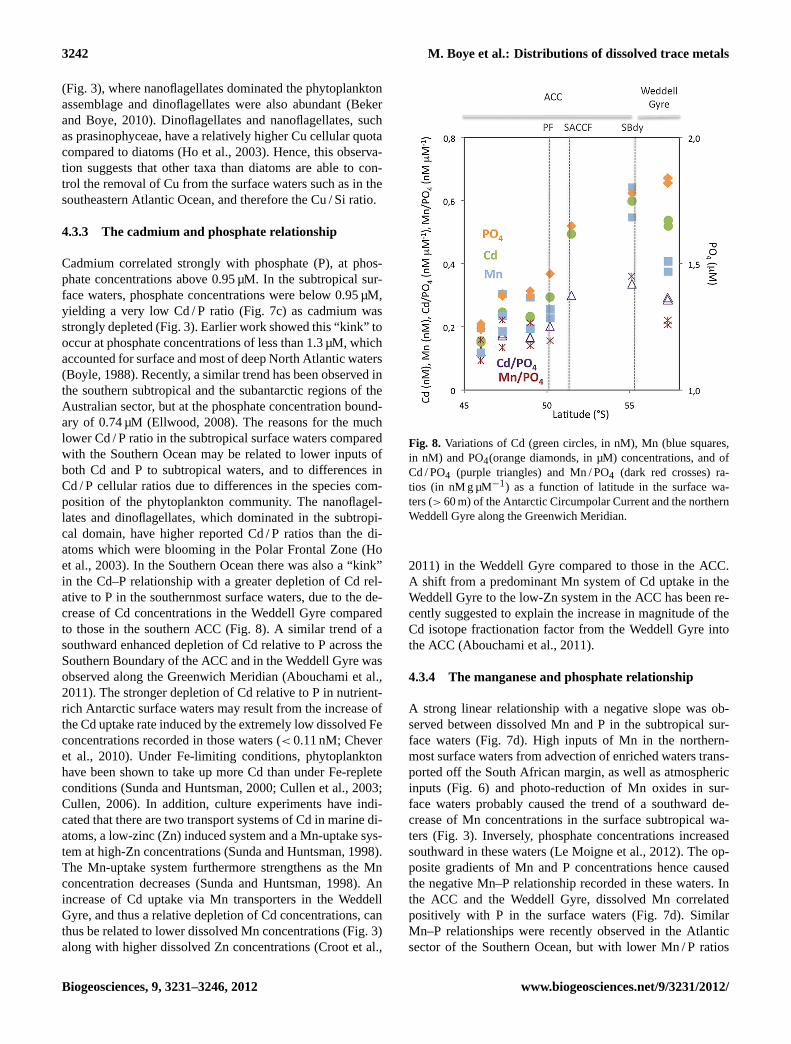
Cadmium correlated strongly with phosphate (P), at phos-phate concentrations above 0.95 µM. In the subtropical sur-face waters, phosphate concentrations were below 0.95 µM,yielding a very low Cd / P ratio (Fig. 7c) as cadmium wasstrongly depleted (Fig. 3). Earlier work showed this “kink” tooccur at phosphate concentrations of less than 1.3 µM, whichaccounted for surface and most of deep North Atlantic waters(Boyle, 1988). Recently, a similar trend has been observed inthe southern subtropical and the subantarctic regions of theAustralian sector, but at the phosphate concentration bound-ary of 0.74 µM (Ellwood, 2008). The reasons for the muchlower Cd / P ratio in the subtropical surface waters comparedwith the Southern Ocean may be related to lower inputs ofboth Cd and P to subtropical waters, and to differences inCd / P cellular ratios due to differences in the species com-position of the phytoplankton community. The nanoflagel-lates and dinoflagellates, which dominated in the subtropi-cal domain, have higher reported Cd / P ratios than the di-atoms which were blooming in the Polar Frontal Zone (Hoet al., 2003). In the Southern Ocean there was also a “kink”in the Cd–P relationship with a greater depletion of Cd rel-ative to P in the southernmost surface waters, due to the de-crease of Cd concentrations in the Weddell Gyre comparedto those in the southern ACC (Fig. 8). A similar trend of asouthward enhanced depletion of Cd relative to P across theSouthern Boundary of the ACC and in the Weddell Gyre wasobserved along the Greenwich Meridian (Abouchami et al.,2011). The stronger depletion of Cd relative to P in nutrient-rich Antarctic surface waters may result from the increase ofthe Cd uptake rate induced by the extremely low dissolved Feconcentrations recorded in those waters (< 0.11 nM; Cheveret al., 2010). Under Fe-limiting conditions, phytoplanktonhave been shown to take up more Cd than under Fe-repleteconditions (Sunda and Huntsman, 2000; Cullen et al., 2003;Cullen, 2006). In addition, culture experiments have indi-cated that there are two transport systems of Cd in marine di-atoms, a low-zinc (Zn) induced system and a Mn-uptake sys-tem at high-Zn concentrations (Sunda and Huntsman, 1998).The Mn-uptake system furthermore strengthens as the Mnconcentration decreases (Sunda and Huntsman, 1998). Anincrease of Cd uptake via Mn transporters in the WeddellGyre, and thus a relative depletion of Cd concentrations, canthus be related to lower dissolved Mn concentrations (Fig. 3)along with higher dissolved Zn concentrations (Croot et al.,
Fig. 8. Variations of Cd (green circles, in nM), Mn (blue squares,in nM) and PO4(orange diamonds, in µM) concentrations, and ofCd / PO4 (purple triangles) and Mn / PO4 (dark red crosses) ra-tios (in nM g µM−1) as a function of latitude in the surface wa-ters (> 60 m) of the Antarctic Circumpolar Current and the northernWeddell Gyre along the Greenwich Meridian.
2011) in the Weddell Gyre compared to those in the ACC.A shift from a predominant Mn system of Cd uptake in theWeddell Gyre to the low-Zn system in the ACC has been re-cently suggested to explain the increase in magnitude of theCd isotope fractionation factor from the Weddell Gyre intothe ACC (Abouchami et al., 2011).
4.3.4 The manganese and phosphate relationship
A strong linear relationship with a negative slope was ob-served between dissolved Mn and P in the subtropical sur-face waters (Fig. 7d). High inputs of Mn in the northern-most surface waters from advection of enriched waters trans-ported off the South African margin, as well as atmosphericinputs (Fig. 6) and photo-reduction of Mn oxides in sur-face waters probably caused the trend of a southward de-crease of Mn concentrations in the surface subtropical wa-ters (Fig. 3). Inversely, phosphate concentrations increasedsouthward in these waters (Le Moigne et al., 2012). The op-posite gradients of Mn and P concentrations hence causedthe negative Mn–P relationship recorded in these waters. Inthe ACC and the Weddell Gyre, dissolved Mn correlatedpositively with P in the surface waters (Fig. 7d). SimilarMn–P relationships were recently observed in the Atlanticsector of the Southern Ocean, but with lower Mn / P ratios
Biogeosciences, 9, 3231–3246, 2012 www.biogeosciences.net/9/3231/2012/

M. Boye et al.: Distributions of dissolved trace metals 3243
(e.g. 0.36 nM µM−1 in the surface ACC, and 0.39 nM µM−1
in the surface Weddell Gyre; Middag et al., 2011a) com-pared to the value in this work obtained at a lower spa-tial resolution and without the exclusion of the highest Mnvalues at the ACC Southern Boundary (e.g. 0.56 nM µM−1;Fig. 7d). The mean Mn / P depletion ratio observed in thesurface waters of the ACC and northeastern side of theWeddell Gyre (e.g. 0.56 nM µM−1) was in the range of el-emental ratio in diatoms (0.42 nM µM−1; Twining et al.,2004) and of the elemental ratio measured with bulk analy-sis of natural phytoplankton assemblages from the SouthernOcean (1.68 nM µM−1; Cullen et al., 2003), but somewhathigher than the Redfield ratio (∼ 0.4 nM µM−1; Bruland etal., 1991). Furthermore, there was a greater depletion of Mnrelative to P in the southernmost surface waters beyond theACC Southern Boundary, as seen for Cd, due to lower Mnconcentrations in the Weddell Gyre compared to those in thesouthern ACC (Fig. 8). This feature was not directly appar-ent in the global relationship obtained for surface waters ofthe Southern Ocean (Fig. 7d), due to the limited dataset forthe Weddell Gyre. Nevertheless, the increase in Mn uptake inthe Weddell Gyre was further supported by a lower slope inthe Mn–P relationship in the Weddell Gyre along the Green-wich Meridian compared to the higher slope obtained in theACC waters (Middag et al., 2011a). An increase of the Mnrequirement by diatoms under Fe-depleted conditions (Peersand Price, 2004) can cause the increase of Mn uptake rateand consequently the highest depletion of Mn relative to Pin the surface waters of the Weddell Gyre, since extremelylow dissolved Fe concentrations were recorded in these wa-ters (<0.11 nM; Chever et al., 2010). In addition, the cellu-lar Mn-transport channel of Cd (Sunda and Huntsman, 1998)was possibly activated in the Weddell Gyre, since dissolvedZn concentrations were higher there compared to the concen-trations in the ACC (Croot et al., 2011). In turn, the higheruptake rate of Mn due to low Fe conditions and the inductionof a Mn-uptake system may have caused a greater depletionof Mn relative to P in the Weddell Gyre.
5 Conclusions
The advection of water masses enriched in trace metals fol-lowing contact with continental margins can be an impor-tant source of trace elements to the surface and intermedi-ate waters of the southeast Atlantic Ocean. South Africanmargins have been identified as a source of trace metals tothe subtropical Atlantic, in addition to atmospheric deposi-tion. Furthermore, transport of trace elements from sourceregions in the Drake Passage and southwestern Atlantic inthe fast eastward-flowing jet of the ACC forms a pathwayto the Greenwich Meridian. Synoptic analyses of trace el-ements, as first assessed in this work, and of isotopes willfurther help to identify the external sources of trace metals toour study region and allow us to understand the boundary ex-change processes that determine the oceanic budget of trace
metals (Lacan and Jeandel, 2001). In addition, hydrothermalinputs above the Mid-Atlantic Ridge can also be a sourceof trace elements like Mn, and deserve further investigation.Hydrothermal vents can significantly contribute to the traceelements inventory in the ocean, as suggested for dissolvedFe (Tagliabue et al., 2010). The strong and different relation-ships between trace elements and major nutrients in the dif-ferent biogeochemical domains of the subtropical Atlantic,the ACC and the Weddell Gyre illustrated the variety of bi-ological requirements of trace metals by the different phyto-plankton assemblages. It also indicated that the biogeochem-ical cycles of these trace elements can be connected in thewater column through their capability of activating or substi-tuting in the phytoplankton uptake systems. The metal inter-plays can be an important adaptation to life in ocean surfacewaters where these trace nutrients are often depleted (Saitoet al., 2010). Synoptic records of various trace nutrients willfurther help in revealing their specific and tight couplings inphytoplankton growth, productivity and diversity.
Supplementary material related to this article isavailable online at:http://www.biogeosciences.net/9/3231/2012/bg-9-3231-2012-supplement.pdf.
Acknowledgements.We gratefully acknowledge the Cap-tain P. Courtes, the officers and crew members of the FrenchR/VMarion Dufresne II for their wonderful work at sea during theMD166 BONUS-GoodHope cruise. H. Leau and P. Sangiardi(IPEV, France) are also thanked for their logistical and technicalsupport during the operations at sea. M. Boye extends specialthanks to S. Speich (LPO, France) for her partnership in thecoordination of the BONUS-GoodHope project and cruise; and tocollaborators M. Arhan (LPO, France) and F. Dehairs (VUB, Bel-gium) for their help and advices in conducting the scientific strategyduring the cruise. This investigation was supported by the FrenchLEFE National Program of Institut des Sciences de l’Univers duCentre National de la Recherche Scientifique (INSU-CNRS), theNational Agency for Research Funding (ANR-07-BLAN-0146),IFREMER and the French Polar Institut (IPEV). We acknowledgethe GO-FLO sampling team: F. Chever, E. Bucciarelli, F. Lacan,G. Sarthou, A. Radic. Thanks to Patrick Laan and J. Andy Miltonfor assistance in analysis, and Angie Milne and Bill Landing fortheir help with setting up the ID-ICPMS technique. Special thanksto our fellows from the NIOZ team led by H. de Baar on board ofthe R/V Polarsternfor synoptic work and extension of the sectiontowards Antarctica along the Greenwich Meridian during theInternational Polar Year. The Postdoctoral Fellowship of B. W. wassupported by the Network of Excellence EUR-OCEANS, theANR-07-BLAN-0146 project and the University of Southampton.Ph.D. fellowship of J. B. was supported by the Region Bretagne.This work is a contribution to the International Polar Year andGEOTRACES programs.
Edited by: F. Dehairs
www.biogeosciences.net/9/3231/2012/ Biogeosciences, 9, 3231–3246, 2012

3244 M. Boye et al.: Distributions of dissolved trace metals
The publication of this article is financed by CNRS-INSU.
References
Abouchami, W., Galer, S. J. G., de Baar, H. J. W., Alderkamp, A.C., Middag, R., Laan, P., Feldmann, H., and Andreae, M. O.:Modulation of the Southern Ocean cadmium isotope signatureby ocean circulation and primary productivity, Earth Planet. Sci.Lett., 305, 83–91, 2011.
Aguilar-Islas, A. M. and Bruland, K. W.: Dissolved manganese andsilicic acid in the Columbia River plume: a major source to theCalifornia current and coastal waters off Washington and Ore-gon, Mar. Chem., 101, 233–247, 2006.
Arhan, M., Mercier, H., and Park, Y. H.: On the deep water circu-lation of the eastern South Atlantic Ocean, Deep-Sea Res. Pt. I,50, 889–916, 2003.
Baker, A. R., Jickells, T. D., Witt, M., and Linge, K. L.: Trends inthe solubility of iron, aluminium, manganese and phosphorus inaerosol collected over the Atlantic Ocean, Mar. Chem., 98, 43–58, 2006.
Baker, A. R., Weston, K., Kelly, S. D., Voss, M., Streu, P., and Cape,J. N.: Dry and wet deposition of nutrients from the tropical At-lantic atmosphere: links to primary productivity and nitrogen fix-ation, Deep-Sea Res. Pt. I, 54, 1704–1720, 2007.
Baker, A. R., Lesworth, T., Adams, C., Jickells, T. D.,and, Ganzeveld, L.: Estimation of atmospheric nutrient in-puts to the Atlantic Ocean from 50◦ N to 50◦ S based onlarge-scale field sampling: Fixed nitrogen and dry deposi-tion of phosphorus, Global Biogeochem. Cy., 24, GB3006,doi:10.1029/2009GB003634, 2010.
Barriada, J. L., Tappin, A. D., Evans, E. H., and Achterberg, E.P.: Dissolved silver measurements in seawater, Trac-Trend. Anal.Chem., 26, 809–817, 2007.
Beker, B. and Boye, M.: Phytoplankton assemblages in the SouthernOcean during the International Polar Year, AGU OS10 ScientificProgram, Ocean Sciences Conference (AGU/ASLO), Portland,USA, 2010.
Boebel, O., Lutjeharms, J., Schmid, C., Zenk, W., Rossby, T., andBarron, C.: The Cape Cauldron: a regime of turbulent inter-oceanexchange, Deep-Sea Res. Pt. II, 50, 57–86, 2003.
Bown, J., Boye, M., Baker, A., Duvieilbourg, E., Lacan, F., LeMoigne, F., Planchon, F., Speich, S., and Nelson, D. M.: Thebiogeochemical cycle of dissolved cobalt in the Atlantic and theSouthern Ocean south off the coast of South Africa, Mar. Chem.,126, 193–206, 2011.
Boyd, P. W., Jickells, T., Law, C. S., Blain, S., Boyle, E. A., Bues-seler, K. O., Coale, K. H., Cullen, J. J., de Baar, H. J. W., Fol-lows, M., Harvey, M., Lancelot, C., Levasseur, M., Owens, N.P. J., Pollard, R., Rivkin, R. B., Sarmiento, J., Schoemann, V.,Smetacek, V., Takeda, S., Tsuda, A., Turner, S., and Watson, A.J.: Mesoscale iron enrichment experiments 1993–2005: Synthe-sis and future directions, Science, 315, 612–617, 2007.
Boyle, E. A.: Cadmium: chemical tracer of deepwater paleoceanog-raphy, Paleoceanography, 3, 471–489, 1988.
Boyle, E. A.: Anthropogenic trace elements in the ocean, in: Ency-clopedia of Ocean Sciences, edited by: Steele, J. H. and Turekain,K. K., Academic Press, 162–169, 2001.
Boyle, E. and Edmond, J. M.: Copper in surface waters south ofNew Zealand, Nature, 253, 107–109, 1975.
Branellec, P., Arhan, M., and Speich, S.: Projet GoodHope, cam-pagne Bonus-GoodHope, rapport de donnees CTD-O2, Rapportinterne OPS/LPO 10-02, IFREMER Edition, 2010.
Bruland, K. W. and Lohan, M. C.: Controls of Trace Metals in Sea-water, Treatise on Geochemistry, edited by: Elderfield, H., Else-vier Science Ltd., Cambridge, 2003.
Bruland, K. W., Donat, J. R., and Hutchins, D. A.: Interactive in-fluences of bioactive trace-metals on biological production inoceanic waters, Limnol. Oceanogr., 36, 1555–1577, 1991.
Chever, F., Bucciarelli, E., Sarthou, G., Speich, S., Arhan, M., Pen-ven, P., and Tagliabue, A.: Physical speciation of iron in the At-lantic sector of the Southern Ocean, along a transect from thesubtropical domain to the Weddell Sea Gyre, J. Geophys. Res.Ocean, 115, C10059,doi:10.1029/2009JC005880, 2010.
Croot, P. L., Baars, O., and Streu, P.: The distribution of dissolvedzinc in the Atlantic sector of the Southern Ocean, Deep-Sea Res.Pt. II, 58, 2707–2719, 2011.
Cullen, J. T.: On the nonlinear relationship between dissolved cad-mium and phosphate in the modern global ocean: could chroniciron limitation of phytoplankton growth cause the kink?, Limnol.Oceanogr., 51, 1369–1380, 2006.
Cullen, J. T., Chase, Z., Coale, K. H., Fitzwater, S. E., and Sherrell,R. M.: Effect of iron limitation on the cadmium to phosphorusratio of natural phytoplankton assemblages from the SouthernOcean, Limnol. Oceanogr., 48, 1079–1087, 2003.
de Baar, H. J. W., Saager, P. M., Nolting, R. F., and van der Meer,J.: Cadmium versus phosphate in the world ocean, Mar. Chem.,46, 261–281, 1994.
de Baar, H. J. W., Boyd, P. W., Coale, K. H., Landry, M. R., Tsuda,A., Assmy, P., Bakker, D. C. E., Bozec, Y., Barber, R. T., Brzezin-ski, M. A., Buesseler, K. O., Boye, M., Croot, P. L., Gervais,F., Gorbunov, M. Y., Harrison, P. J., Hiscock, W. T., Laan, P.,Lancelot, C., Law, C. S., Levasseur, M., Marchetti, A., Millero,F. J., Nishioka, J., Nojiri, Y., van Oijen, T., Riebesell, U., Ri-jkenberg, M. J. A., Saito, H., Takeda, S., Timmermans, K. R.,Veldhuis, M. J. W., Waite, A. M., and Wong, C.-S.: Synthesis ofiron fertilization experiments: from the Iron Age in the Age ofEnlightenment, J. Geophysical Res.-Ocean., 110, 1–24, 2005.
de Baar, H. J. W., Timmermans, K. R., Laan, P., De Porto, H. H.,Ober, S., Blom, J. J., Bakker, M. C., Schilling, J., Sarthou, G.,Smit, M. G., and Klunder, M.: Titan: A new facility for ultracleansampling of trace elements and isotopes in the deep oceans in theinternational Geotraces program, Mar. Chem., 111, 4–21, 2008.
Duce, R. A., Liss, P. S., Merrill, J. T., Atlas, E. L., Buat-Menard, P.,Hicks, B. B., Miller, J. M., Prospero, J. M., Arimoto, R., Church,T. M., Ellis, W., Galloway, J. N., Hansen, L., Jickells, T. D.,Knap, A. H., Reinhardt, K. H., Schneider, B., Soudine, A., Tokos,J. J., Tsunogai, S., Wollast, R., and Zhou, M.: The atmosphericinput of trace species to the world ocean, Global Biogeochem.Cy., 5, 193–259, 1991.
Elderfield, H. and Rickaby, R. E. M.: Oceanic Cd / P ratio and nutri-ent utilization in the glacial Southern Ocean, Nature, 405, 305–
Biogeosciences, 9, 3231–3246, 2012 www.biogeosciences.net/9/3231/2012/

M. Boye et al.: Distributions of dissolved trace metals 3245
310, 2000.Ellwood, M. J.: Wintertime trace metal (Zn, Cu, Ni, Cd, Pb and
Co) and nutrient distributions in the Subantarctic Zone between40–52◦ S; 155–160◦ E, Mar. Chem., 112, 107–117, 2008.
Fahrbach, E., de Baar, H. J. W., Garcon, V. C., and Provost, C.:Introduction to physics, carbon dioxide, trace elements and iso-topes in the Southern Ocean: The Polarstern expeditions ANT-XXIV/3 (2008) and ANT-XXIII/3 (2006), Deep-Sea Res. Pt. II,58, 2501–2508, 2011.
Fisher, N. S. and Wente, M.: The release of trace elements by dyingmarine phytoplankton, Deep-Sea Res. Pt. I, 40, 671–694, 1993.
Flegal, A. R. and Patterson, C. C.: Vertical concentration profiles oflead in the Central Pacific at 15◦ N and 20◦ S, Earth Planet. Sci.Lett., 64, 19–32, 1983.
Flegal, A. R., Sanudo-Wilhelmy, S. A., and Scelfo, G. M.: Silver inthe eastern Atlantic Ocean, Mar. Chem., 49, 315–320, 1995.
Gladyshev, S., Arhan, M., Sokov, A., and Speich, S.: A hydro-graphic section from South Africa to the southern limit of theAntarctic Circumpolar Current at the Greenwich meridian, Deep-Sea Res. Pt. I, 55, 1284–1303, 2008.
Gordon, A. L., Weiss, R. F., Smethie, W. M., and Warner, M. J.:Thermocline and Intermediate Water Communication betweenthe South-Atlantic and Indian Oceans, J. Geophys. Res.-Ocean.,97, 7223–7240, 1992.
Heller, M. I., et al.: Copper speciation and distribution in the Wed-dell Sea and Drake Passage, Deep-Sea Res. Pt. I., in prep., 2012.
Ho, T.-Y., Quigg, A., Finkel, Z. V., Milligan, A. J., Wyman, K.,Falkowski, P. G., and Morel, F. M. M.: The elemental composi-tion of some marine phytoplankton, J. Phycol., 39, 1145–1159,2003.
Jeandel, C., Lacan, F., and Labatut, M.: Trace element con-centrations of the suspended particles in the Southern Ocean(Bonus/GoodHope transect), AGU OS10 Scientific Program,Ocean Sciences Conference (AGU/ASLO), Portland, USA,2010.
Kermabon, C. and Arhan, M.: SBE9+: validation et reduction desdonnees, Rapport interne OPS/LPO 08-04, IFREMER Edition,2008.
Klunder, M., Laan, P., Middag, R., de Baar, H. J. W., and van Ooi-jen, J. C.: Distributions and sources of dissolved iron over aprime meridian transect in the Southern Ocean, Deep-Sea Res.Pt. II, 58, 2678–2694, 2011.
Kramer, D., Cullen, J.T., Christian, J.R., Johnson, W.K., and Ped-ersen, T.F.: Silver in the subarctic northeast Pacific Ocean: ex-plaining the basin scale distribution of silver, Mar. Chem., 123,133–142, 2011.
Lacan F. and Jeandel C.: Tracing Papua New Guinea imprint onthe central Equatorial Pacific Ocean using neodymium isotopiccompositions and Rare Earth Element patterns, Earth Planet. Sci.Lett., 186, 497–512, 2001.
Lacan, F., Radic, A., Jeandel, C., Poitrasson, F., Sarthou, G.,Pradoux, C., and Freydier, R.: Measurement of the isotopic com-position of dissolved iron in the open ocean, Geophys. Res. Lett.,35, L24610,doi:10.1029/2008GL035841, 2008.
Landing, W. M. and Bruland, K. W.: Manganese in the North Pa-cific, Earth Planet. Sci. Lett., 49, 45–56, 1980.
Le Moigne, F. A. C., Boye, M., Masson, A., Corvaisier, R., Grosst-effan, E., Gueneugues, A., and Pondaven, P.: Description of thebiogeochemical features of the subtropical southeastern Atlantic
and the Southern Ocean south off South Africa during the australsummer of the International Polar Year, Biogeosciences Discuss.,9, 5011–5048,doi:10.5194/bgd-9-5011-2012, 2012.
Loscher, B. M.: Relationships among Ni, Cu, Zn, and major nutri-ents in the Southern Ocean, Mar. Chem., 67, 67–102, 1999.
Lutjeharms, J. R. E. and Vanballegooyen, R. C.: The Retroflec-tion of the Agulhas Current, J. Phys. Oceanogr., 18, 1570–1583,1988.
Maldonado, M. T., Allen, A. E., Chong, J. S., Lin, K., Leus, D.,Karpenko, N., and Harris, S. L.: Copper-dependent iron transportsystem in coastal and oceanic diatoms, Limnol. Oceanogr., 51,1729–1743, 2006.
Martin, J. H., Gordon, R. M., and Fitzwater, S. E.: Iron in Antarcticwaters, Nature, 345, 156–158, 1990.
Meredith, M., Locarnini, R., Van Scoy, K., Watson, A., Hey-wood, K., and King B.: On the sources of Weddell GyreAntarctic Bottom Water, J. Geophys. Res., 105, 1093–1104,doi:10.1029/1999JC900263, 2000.
Middag, R., de Baar, H. J. W., Laan, P., Cai, P. H., and van Ooijen,J. C.: Dissolved manganese in the Atlantic sector of the SouthernOcean, Deep-Sea Res. Pt. II, 58, 2661–2667, 2011a.
Middag, R., van Slooten, C., de Baar, H. J. W., and Laan, P.: Dis-solved aluminium in the Southern Ocean, Deep-Sea Res. Pt. II,58, 2647–2660, 2011b.
Milne, A., Landing, W., Bizimisb, M., and Mortona, P.: Determina-tion of Mn, Fe, Co, Ni, Cu, Zn, Cd and Pb in seawater using highresolution magnetic sector inductively coupled mass spectrome-try (HR-ICP-MS), Anal. Chim. Acta, 665, 200–207, 2010.
Orsi, A. H., Nowlin, W. D., and Whitworth III, T.: On the circulationand stratification of the Weddell Gyre, Deep-Sea Res. Pt. I, 40,169–203, 1993.
Pakhomova, S. V., Hall, P. O. J., Kononets, M. Yu., Rozanov, A.G., Tengberg, A., and Vershinin, A. V.: Fluxes of iron and man-ganese across the sediment-water interface under various redoxconditions, Mar. Chem., 107, 319–331, 2007.
Peers, G. and Price, N. M.: A role for manganese in superox-ide dismutases and growth of iron-deficient diatoms, Limnol.Oceanogr., 49, 1774–1783, 2004.
Piketh, S., Swap, R., Maenhaut, W., Annegarn, H., and For-menti, P.: Chemical evidence of long-range atmospheric trans-port over southern Africa, J. Geophys. Res., 107, 4817,doi:10.1029/2002JD002056, 2002.
Piola, A. R. and Gordon, A. L.: Intermediate Waters in the South-west South-Atlantic, Deep-Sea Res., 36, 1–16, 1989.
Planchon, F., Cavagna, A.-J., Cardinal, D., Andre, L., Dehairs,, F.:Late summer particulate organic carbon export and twilight zoneremineralisation in the Atlantic sector of the Southern Ocean,Biogeosciences Discuss., 9, 3423–3477,doi:10.5194/bgd-9-3423-2012, 2012.
Ranville, M. A. and Flegal, A. R.: Silver in the NorthPacific Ocean, Geochem. Geophy. Geosy., 6, Q03M01,doi:10.1029/2004GC000770, 2005.
Rickli, J., Frank, M., Baker, A. R., Aciego, S., de Souza, G.,Georg, R. B., and Halliday, A. N.: Hafnium and neodymiumisotope distribution in surface waters of the eastern AtlanticOcean: Implications for sources and inputs of trace met-als to the ocean, Geochim. Cosmochim. Ac., 74, 540–557,doi:10.1016/j.gca.2009.10.006, 2010.
www.biogeosciences.net/9/3231/2012/ Biogeosciences, 9, 3231–3246, 2012
3246 M. Boye et al.: Distributions of dissolved trace metals
Saito, M. A., Goepfert, T. J., Noble, A. E., Bertrand, E. M., Sed-wick, P. N., and DiTullio, G. R.: A seasonal study of dissolvedcobalt in the Ross Sea, Antarctica: micronutrient behavior, ab-sence of scavenging, and relationships with Zn, Cd, and P, Bio-geosciences, 7, 4059–4082,doi:10.5194/bg-7-4059-2010, 2010.
Sanudo-Wilhelmy, S. A., Olsen, K. A., Scelfo, J. M., Foster, T.D., and Flegal, A. R.: Trace metal distribution off the AntarcticPeninsula in the Weddell Sea, Mar. Chem., 77, 157–170, 2002.
Schlitzer, R.: Ocean Data View,http://odv.awi.de, 2012.Sunda, W. G. and Huntsman, S. A.: Photoreduction of manganese
oxides in seawater, Mar. Chem., 61, 133–152, 1994.Sunda, W. G. and Huntsman, S. A.: Processes regulating cellular
metal accumulation and physiological effects: phytoplankton asmodel systems, Sci. Total Environ., 219, 165–181, 1998.
Sunda, W. G. and Huntsman, S. A.: Effect of Zn, Mn, and Fe onCd accumulation in phytoplankton: Implications for oceanic Cdcycling, Limnol. Oceanogr., 45, 1501–1516, 2000.
Tagliabue, A., Bopp, L., Dutay, J.-C., Bowie, A. R., Chever, F.,Jean-Baptiste, P., Bucciarelli, E., Lannuzel, D., Remenyi, T.,Sarthou, G., Aumont, O., Gehlen, M., and Jeandel, C.: Hy-drothermal contribution to the oceanic dissolved iron inventory,Nat. Geosci., 3, 252–256, 2010.
Twining, B. S., Baines, S. B., and Fisher, N. S.: Elemental sto-ichiometries of individual plankton cells collected during theSouthern Ocean Iron Experiment (SOFEX), Limnol. Oceanogr.,49, 2115–2128, 2004.
Whitworth, T. and Nowlin, W. D.: Water masses and currents of theSouthern Ocean at the Greenwich meridian, J. Geophys. Res.-Ocean., 92, 6462–6476, 1987.
Xie, P. and Arkin, P. A.: Global Precipitation: A 17-Year MonthlyAnalysis Based on Gauge Observations, Satellite Estimates, andNumerical Model Outputs, B. Am. Meteorol. Soc., 78, 2539–2558, 1997.
Yang, L. and Sturgeon, R. E.: On-line determination of sil-ver in sea-water and marine sediment by inductively coupledplasma mass spectrometry, J. Anal. Atom. Spectrom., 17, 88–93,doi:10.1039/B109409M, 2002.
Zhang, Y., Obata, H., and Nozaki, Y.: Silver in the Pacific Oceanand the Bering Sea, Geochem. J., 38, 623–633, 2004.
Biogeosciences, 9, 3231–3246, 2012 www.biogeosciences.net/9/3231/2012/