Embed Size (px)
Citation preview

CO 00
Bulletin 36 Part 5
(of 7 Parts)
THE SHOCK AND VIBRATION
BULLETIN
JANUARY 1967
A Publication of THE SHOCK AND VIBRATION
INFORMATION CENTER Naval Research Laboratory, Washington, D.C.
f;
Office ot The Director of Defense Research and Engineering
r \
rn^^c a^
DISTRIBUTION OF THIS DOCUMENT IS UNLIMITED
mmwi mm F

...
THIS DOCUMENT IS BEST QUALITY AVAILABLE. THE COPY
FURNISHED TO DTIC CONTAINED
A SIGNIFICANT NUMBER OF
PAGES WHICH DO NOT
REPRODUCE LEGIBLYo

Bulletin 36 Part 5
(of 7 Parts)
THE SHOCK AND VIBRATION
BULLETIN
JANUARY 1967
A Publication of THE SHOCK AND VIBRATION
INFORMATIOxN CENTER Naval Research Laboratory, Washington, D.C.
The 36th Symjjosium on Shock and Vibration was held in Los Angeles, California, on 18-20 October 1966. The U.S. Air Force was host.
Office of The Director of Defense Research and Engineering
SYMPOSIUM MANAGEMENT
The Shock and Vibration Informacion Center
William W. Mutch, Director
Henry C. Pusey, Coordinator
Rudolph H. Volin, Coordinator
Jean B. Goldbecker, Editor
Katherine G. Jahnel, Administrative Secretary
36th Program Committee
William R. Forlifer, NASA Goddard Space Flight Center
Edward H. Schell, Air Force Flight Dynamics Laboratory
George Stathopoulos, Naval Ordnance Laboratory
James M. Taylor, U.S. Army Missile Command
Air Force Liaison
Los Angeles Scientific and Technical Liaison Office, Research and Technology Division, Air Force Systems Command
Lt. Col. Kenneth W. Cook
Arthur E. Kimberly
Bulletin Production
Graphic Arts Branch, Technical Information Division, Naval Research Laboratory
*
CONTENT^
PART 5
Analysia and Prediction
METHOD FOR IMPROVING A DYNAMIC MODEL USING EXPERIMENTAL TRANSIENT RESPONSE DATA \ 1
Ching-u Ip, Eli P. Howard, and Richard J. Sylvester, Aerospace Corporation, San Bernardino, California
DIGITAL ANALYSIS OF FATIGUE DAMAGE TO A MULTI-MODAL SYSTEM SUBJECTED TO LOGARITHMICALLY SWEPT SINUSOIDAL VIBRATION SPECTRA^ 17
Seymour Fogelson, The Marquardt Corporation, Van Nuys, California
"ANALYSIS OF VIBRATION DISTRIBUTIONS IN COMPLEX STRUCTURES; 41 Eric E. Ungar, Bolt Beranek and Newman Inc., Cambridge, Massachusetts, and Terry D. Scharton, Bolt Beranek and Newman Inc., Van Nuys, Califoraia
DYNAMIC ANALYSIS OF CONTINUUM BODIES BY THE DIRECT STIFFNESS METHOD'. . . 55 W. E. Baker, Rocketdyne, Division of North American Aviation, McGregor, Texas/ and J.M. Daly, Arde Engineering Company, Asheville, North Carolina
MIN-MAX RESPONSE PROBLEMS OF DYNAMIC SYSTEMS AND COMPUTATIONAL SOLUTION TECHNIQUES 69
Eugene Sevin and Walter Pilkey, IIT Research Institute, Chicago, Illinois
STRAIN RESPONSE OF SIMPLY SUPPORTED BEAMS TO POINT AND ACOUSTIC LOADING ; 77 Tony L. Parrott and Joseph A. Dris'chler, NASA Langley Research Center, Langley Station, Hampton, Virginia
PREDICTION OF FLIGHT VIBRATION LEVELS FOR THE SCOUT LAUNCH VEHICLE •. . . 85 Robert B. Best, LTV Aerospace Corporation, LTV Astronautics Division, Dallas, Texas
RESPONSE OF STRUCTURAL COMPONENTS OF A LAUNCH VEHICLE TO IN-FLIGHT ACOUSTIC AND AERODYNAMIC ENVIRONMENTS ' 97
Khushi L. Chandiramani and Richard H. Lyon, Bölt Beranek and Newman Inc., Cambridge, Massachusetts
^DYNAMIC VIBRATIONS OF THICK-WALLED ELASTIC ANISOTROPIC CYLINDERS AND SPHERES WITH INTERNAL DAMPING ' f 107
G-briel Cinelli, Argonne National Laboratory, Argonne, Illinois
i EFFECT OF ASYMMETRICAL TRAPEZOIDAL PULSE ON SINGLE-DEGREE-OF-FREEDOM SYSTEMS >) 119
H. Saundcrs, General Electric Company, Philadelphia, Pennsylvania
PAPERS APPEARING IN PART 1 Part 1 - Confidential (Titles Unclassified)
DYNAMIC DESIGN ANALYSIS METHOD PREDICTION VERSUS TEST MEASUREMENT OF SHIPBORNE EQUIPMENT RESPONSE
R. O, Belsheim and A. F. Dick, Naval Research Laboratory, Washington, D.C.
COMPARISON OF SHOCK MOTIONS INDUCED BY AIR BLAST AND UNDERWATER EXPLOSIONS Robert E. Fuss and Kenneth T. Cornelius, David Taylor Model Basin, Washington, D.C.
ANALYSIS OF 21B WEAPONS SKID FOR VERTICAL SHOCK John W. McNabb, Northern Ohio University, Ada, Ohio
in

NERVA NUCLEAR REACTOR VIBRATION ANALYSIS AND TEST PROGRAM WITH EMPHASIS ON NONLINEAR RESPONSES
R. D. Burack, D, F. Miller, xnd A. F. Maguire, Westinghouse Electric Corporation, Pittsburgh, Pennsylvania
RECENT SOVIET RESEARCH IN SHOCK, VIBRATION. AND NONLINEAR MECHANICS David B. Singer, Aerospace Corporation. San Bernardino. California
PAPERS APPEAPvING IN PART 2
Opening Session
THE CHALLENGE OF THE SECOND HALF OF THE DECADE R. G. Loewy, University of Rochester, Rochester, New York
SHOCK AND VIBRATION - A PERSPECTIVE Alan Powell, David Taylor Model Basin, Washington, D.C.
i Shock
YIELDING EFFECTS ON SHOCK SPECTRA William R. Mentzer, Jr., Bowles Engineering Corporation, Silver Spring, Maryland, and Patrick F. Cunniff, University of Maryland, College Park, Maryland
SHOCK SPECTRA OF PRACTICAL SHAKER SHOCK PULSES John R. Fagan and An'.hony S. Baran, Radio Corporation of America, Princeton, New Jersey
TRANSDUCER SHOCK STUDY Arthur D. Carlson and Robert J. McGrsttan, General Dynamics, Electric Boat Division, Groton, Connecticut
DIRECT MEASUREMENT OF 5"/54 GUN SETBACK ACCELERATION Peter S. Hughes and Luigi A. Vagnoni, Naval Ordnance Laboratory, Silver Spring, Maryland
SIMULATION OF HEAT SHIELD PYROTECHNIC SHOCK IMPEDANCE Norris J. Huffington, Jr., and Robert J. Goldman, The Martin Company, Baltimore, Maryland
PYROTECHNIC SHOCK TESTING OF A FULL-SCALE REENTRY VEHICLE W. R. Britton and G. K. Jones, The Martin Company, Baltimore, Maryland
SHOCK TESTING WITH SOLID-PROPELLANT-POWERED GUNS Larry O. Seamons, Sandia Corporation, Albuquerque, New Mexico
APPLICATION OF POLYURETHANE FOAM TO SHOCK ISOLATION OF LARGE SILO-BASED MISSILES
W. A. Volz, Westinghouse Electric Corporation, Sunnyvale, California
NEW APPROACH FOR EVALUATING TRANSIENT ENVIRONMENTAL TESTING OF SPACECRAFT James T. Howlett and John P. Raney, NASA Langley Research Center, Hampton, Virginia
SPECIFICATION OF SHOCK TESTS - PANEL SESSION
PAPERS APPEARING IN PART 3
Vibration Testing
USE OF FORCE AND ACCELERATION MEASUREMENTS IN SPECIFYING AND MONITORING LABORATORY VIBRATION TESTS
G. W. Painter, Lockheed-California Company, Burbank, California
FEASIBILITY OF FORCE-CONTROLLED SPACECRAFT VIBRATION TESTING USING NOTCHED RANDOM TEST SPECTRA
Joseph A. Heinrichs, The Martin Company, Baltimore, Maryland
IV
I COMPARISON OF MARINER ASSEMBLY-LEVEL AND SPACECRAFT-LEVEL VIBRATION.TESTS
Peter A. Franken and Terry O. Scharton, Bolt Beranek and Newman Inc., Van Nuya. California, and Thomas H. Mack, Jet Propulsion Laboratory, Pasadena, California
ACOUSTICALLY INDUCED VIBRATION TESTING OF SPACECRAFT COMPONENTS Richard W, Peverley, General Electric Company, Houston, Texas
REPRODUCTION OF COMPLEX AND RANDOM WAVEFORMS AT VARIOUS POINTS ON A TEST ITEM
John V. Otts and Norman F. Hunter, Jr., Sandia Corporation) Albuquerque, New Mexico
MULTIPLE SHAKER GROUND VIBRATION TEST SYSTEM DESIGNED FOR XB-70A R. G. North and J. R. Stevenson, North American Aviation, Inc.. Los Angeles, California
THE HOW OF HELICOPTER VIBRATION TESTING Ronald F. McCann, The pjoeing Company, Morton, Pennsylvania
RESONANCE TESTING OF A LIFTING BODY REENTRY VEHICLE G. Sardella and C. L. Riggen, The Martin Company, Baltimore, Maryland
SHOCK AND VIBRATION TESTING USING FOUR-SHAKER SYSTEM Dean F. Redford, Thiokol Chemical Corporation, Brigham City, Utah
DESIGN TECHNIQUES FOR HORIZONTAL DRIVERS Fred C, Tolleth, North American Aviation, Inc., Autonetics Division, Anaheim, California
FLIGHT LEVEL VIBRATION TESTING OF A LIFTING BODY REENTRY VEHICLE R. McCaa and M. Matrullo, The Martin Company. Baltimore, Maryland
HYDRAULIC EXCITER COMBINED ENVIRONMENT TESTS Edwin J. Skolka, NASA Goddard Space Flight Center, Greenbelt, Maryland
AVERAGING FUNDAMENTAL VIBRATION CONTROL SIGNALS: A THEORETICAL STUDY W. W. Shurtleff, Sandia Corporation, Albuquerque, New Mexico
CONTROL TECHNIQUES FOR MULTI-SHAKER VIBRATION SYSTEMS Richard A. Arone, Wyle Laboratories, Huntsville, Alabama, and Paul A. Brock, Sine Engineering Company, Granada Hills, California
PAPERS APPEARING IN PART 4
Damping
MECHANISMS ANu SCALING OF DAMPING IN A PRACTICAL STRUCTURAL JOINT Brantiay R. Hanks and David G. Stephens, NASA Langley Research Center, Hampton, Virginia
DAMPING OF STRUCTURES BY VISCOELASTIC LINKS David I.G. Jones, Air Force Materials Laboratory, Wright-Patter son Air Force Base, Ohio, and Ahid D. Nashif, University of Dayton, Dayton, Ohio
ELASTOMERS FOR DAMPING OVER WIDE TEMPERATURE RANGES F. S. Owens, Air Force Materials laboratory, Wright-Patterson Air Force Base, Ohio
NEW METHOD FOR DETERMINING DAMPING PROPERTIES OF VISCOELASTIC MATERIALS Ahid D. Nashif, Univers .ry of Dayton, Dayton, Ohio
EFFECT OF TUNED VISCOT£LASTIC DAMPERS ON RESPONSE OF MULTI-SPAN STRUCTURES David I.G. Jones and George H. Bruns, Air Force Materials Laboratory, Wright-Patterson Air Force Base, Ohio
METHOD FOR IDENTIFYING AND EVALUATING LINEAR DAMPING MODELS IN BEAM VIBRATIONS
M. W. Wrmbsganss, Jr., B. L. Boers, and G.S. Rosenberg, Argonne National Laboratory, Argonne, Illinois

EFFECT OF AIR DAMPING ON STRUCTURAL FATIGUE FAILURE John R. Fagan, Radio Corporation of America, Princeton, New Jersey
DEVELOPMENT OF DAMPED MACHINERY FOUNDATIONS W. BUtaingame and E. V. Thomas, Navy Marine Engineering Laboratory, Annapolis, Maryland, and R. A. DiTaranto, Pennsylvania Military Colleges, Chester, Pennsylvania
I DYNAMIC MECHANICAL STUDIES OF A COMPOSITE MATERIAL M. G. Sharma, M. Critcof<cld, and W. F. St. Lawrence, The Pennsylvania State University, University Park, Pennsylvania
i i
PAPERS APPEARING IN PART 6 i i
Data Analysis and Instrumentation ! i . EFFECT OF DIGITIZING DETAIL ON SHOCK AND FOURIER SPECTRUM COMPUTATION
OF FIELD DATA M. Gertel and R. Holland, Allied Research Associates, Inc., Concord, Massachusetts
t i
AUTOMATED DIGITAL SHOCK DATA REDUCTION SYSTEM Walter B. Murfin, Sandia Corporation, Albuquerque, New Mexico
AUTOMATED ANALOG METHOD OF SHOCK ANALYSIS F. X. Prendergast, Bell Telephone Laboracories, Whippany, New Jersey
VIBRATION DATA REDUCTION TECHNIQUES AS APPLIED TO SATURN S-H VEHICLE | Joseph D. Weather stone. North American Aviation, Downey, California
DIGITAL ANALYSIS OF SATURN ENVIRONMENTAL TEST RESPONSE DATA Daniel J. Bozich, Wyle Laboratories, Huntsville, Alabama
USE OF A LOW-FREQUENCY SPECTRUM ANALYZER S. E. Lee and R. G. Tuckerman, David Taylor Model Basin, Washington, D.C.
DETECTION OF LOOSE PARTS AND FREE OBJECTS IN SEALED CONTAINERS M. W. Schulz, General Electric Research and Development Center, Schenectady, New York
i COMBINED ENVIRONMENT TESTING OF SHIPBOARD ELECTRONIC EQUIPMENT AND UTILIZATION OF REGRESSION ANALYSIS
F. Robinson, Navy Electronics Laboratory, San Diego, California i
ANALYSIS OF RANDOM VIBRATION WITH AID OF OPTICAL SYSTEMS I Ching-u Ip, Aerospace Corporation, San Bernardino, California
i COMPUTER PROGRAM FOR DYNAMIC DESIGN ANALYSIS METHOD
John H. Avila, David Taylor Model Basin, Washington, D.C. |
COMPUTER PROGRAM FOR. GENERAL SHIP VIBRATION CALCULATIONS Francis M.Henderson, David Taylor Model Basin, Washington, D.C.
1 MATHEMATICAL MODEL AND COMPUTER PROGRAM FOR TRANSIENT SHOCK ANALYSE
Anthony C. Melodia, David Taylor Model Basin, Washington, D.C.
TRANSPORTATION ENVIRONMENTAL MEASUREMENT AND RECORDING SYSTEM Frank J. Holley, NASA Goddard Space Flight Center, Greenbelt, Maryland
DEVELOPMENT OF VELOCITY SHOCK RECORDER FOR MEASUREMENT OF SHIPPING ENVIRONMENTS
Matthew A. Venetos, U.S. Army Natick Laboratories, Natick, Massachusetts
ABSOLUTE CALIBRATION OF VIBRATION GENERATORS WITH TIME-SHARING COMPUTER AS INTEGRAL PART OF SYSTEM
B. F. Payne, National Bureau of Standards, Washington, D.C.
EXPERIMENTAL TECHNIQUES FOR OBSERVING MOTION OF EXTENDIBLE ANTENNA BOOMS Donald J. Hershfeld, NASA Goddard Space Flight Center, Greenbelt, Maryland
VI

--.• ^l.._-^^ ■■--■■
DEVELOPMENT OF LOW-COST FORCE TRANSDUCER Marlyn W. Sterk, S«ndia Corporation, Albuquerque, New Mexico, and James A. Ellison, California Institute of Technology, Pasadena, California
AUTOMATIC CALIBRATION AND ENVIRONMENTAL MEASUREMENT SYSTEM FOR LAUNCH PHASE SIMULATOR
Harry D. Cyphers and Frank J. Holley, NASA Goddard Space Flight Center, Greenbelt, Maryland
MICROMINIATURE INSTRUMENTATION AMPLIFIERS W. V. Bratkowski and P. F. Pittman, Westinghouse Research and Development Center, Pittsburgh, Pennsylvania
INVESTIGATION OF PULSE X-RAY TECHNIQUES FOR STUDY OF SHOCK-WAVE-INDUCED EFFECTS IN SOIL
Warren J. Baker and Frank J. Janza, Eric H. Wang, Civil Engineering Research Facility, University of New Mexico, Albuquerque, New Mexico
PAPERS APPEARING IN PART 7
Structural Reliability
ESTIMATE OF EFFECT OF SPACECRAFT VIBRATION QUALIFICATION TESTING ON RELIABILITY
Clyde V. Stahle, Jr., The Martin Company, Baltimore, Maryland
S-IC RELIABILITY PROGP AM FROM STRUCTURAL LIFE VIEWPOINT Roy L. Rich and James A. Roberts, The Boeing Company, New Orleans, Louisiana
STRUCTURAL RELIABILITY - PANEL SESSION
Design Data and Methods
DYNAMIC ANALYSIS OF ATS-B SPACECRAFT Saul M. Kaplan and Victor Terkun, Hughes Aircraft Company, El Segundo, California
SPACECRAFT DESIGN FOR ATLAS "fORSIONAL SHOCK TRANSIENT Sol Davis, Fairchild Hiller, Republic Aviation Division, Farmingdale, Long Island, New York
COMPARISON OF PREDICTED AND MEASURED LAUNCH LOADS FOR SNAP 10A Everett A. Robb and A.P. Gelman, Atomics International, Canoga Park, California
GROUND-WIND-INDUCED OSCILLATIONS OF GEMINI-TITAN AIR VEHICLE AND ITS ERECTOR John E. Tomassoni and William H. Lambert, The Martin Company, Baltimore, Maryland
NOISE LEVEL MEASUREMENTS FOR IMPROVED DELTA, ATLAS/AGENA-D, AND TAT/AGENA-D LAUNCH VEHICLES
Lloyd A. Williams and W-lliam B. Tereniak, NASA Goddard Space Flight Center, Greenbelt, Maryland
THE "VACUUM SPRING" K. D. Robertson, U.S. Army Materials Research Agency, Watertown, Massachusetts
SELF-ADAPTIVE VIBRATION BALANCING DEVICE FOR HELICOPTERS W. Euan Hooper, The Boeing Company, Morton, Pennsylvania
SHOCK RESPONSE OF ELECTRONIC EQUIPMENT CABINETS BY NORMAL MODE METHOD T. K. Hasselman and C. M. Hwang, TRW Systems, Redondo Beach, California
DAMPED VIBRATIONS OF ELASTICALLY SUPPORTED RIGID BODY WITH COUPLING BETWEEN TRANSLATION AND ROTATION
Francis H. Collopy, ITEK Corporation, Lexington, Massachusetts
MISSILE HANDLING ANALYSIS C. R. Brown and Alex J. Avis, Westinghouse Electric Corporation, Sunnyvale, California
Vll

ANALYSIS AND PREDICTION
METHOD FOR IMPROVING A DYNAMIC MODEL USING EXPERIMENTAL TRANSIENT RESPONSE DATA
Ching-u Ip, Eli P. Howard and Richard J. Sylvester Aerospace Corporation
San Bernardino, California
A rational method is developed for improving the mathematical dy- namic model of a linear system by utilizing experimental results. The di-:a. required as input to the method consist of measurements of the applied load and some limited response information. Two examples demonstrate the improvement in the mathematical model of a six- degree-of-freedom system when the loading and limited response in- formation is known without experimental error. Future efforts are outlined to study effects of error in experimental input data and fea- sibility of application to systems of many degrees of freedom.
E. P. Howard
INTRODUCTION
The dynamic analyses performed to deter- mine the responses of a structure subjected to dynamic loads involve the formulation of a mathematical model that represents the physi- cal structure. When the structure and loading are particularly complex, confirmatory experi- ments are devised to gain confidence in the re- sults of the mathematical model or to demon- strate structural Integrity, or both.
A certain degree of confidence in the math- ematical analysis can be achieved by a ground vibration test in which the ent're structure Is vibrated at a low level and the resonant fre- quencies are identified. However, limitations in this experimental technique usually preclude obtaining the mode shapes of the structure with
the same accuracy as the resonant frequencies. In addition to a ground vibration survey, dy- namic load teste are often conducted that sub- ject full-scale reentry vehicles to a blast wave in a large shock tube. A facility currently being utilized for this purpose is the Sandia Corporation 'Thunderpipe" facility at Albu- querque, New Mexico.
It is the purpose of this paper to present a method or technique for utilizing experimental results from such facilities^as the "Thunder- pipe" to improve the mathematical model rep- resenting the structure that was tested. The improvement is achieved by revising the the- oretically computed mode shapes to be in better agreement with experimental results.
LIST OF SYMBOLS
[c] Square matrix, damping matrix
{FU)} Column matrix giving forces act- ing on various stations (nodes) of system
i Subscript
[I] Identity matrix
j Subscript

(kl Square matrix, süffneu matrix
Im. Square matrix, maas matrix
n Nomber of modes
{qCt» Column matrix of generalized dis- placements
» Laplace transform variable
IT] Transformation matrix relating strains to displacements
T Superscript, transpose of a matrix
(x>. {x}. {x} Column matrices representing dis- placements and their time deriva- tive
a Scale factor
ß( t) Parameter associated with input forces and defined as quantity in- side large parentheses of Eq. (11)
yKy Shear strain
iy(t)} Parameter associated with input forces and defined by Eq. (15)
le) Column matrix of strains
ß Diagonal matrix of generalized modal damping
ii)] Modal matrix normalized so that
v'i Function to be minimized and de- fined by Eq. (2)
[<ü2] Diagonal matrix of squares of cir-
cular frequencies
DESCRIPTION OF METHOD
Thunderplpe Tests
The "Thunderpipe" test series subjects a full-size reentry vehicle structure to blasts of conventional explosive, confined in a closed-end tube. One objective of the tests is to compare the measured dynamic response with the the- oretical predictions to verify the analytical ap- proach. Specifically, the pressure-time his- tories at various stations on the reentry vehicle are measured and are used as the forcing
functions in the analytical model. Measure- ments by strain gages and accelerometers at selected locations on the vehicle constitute the measured responses, 'vhese are used to com- pare with the calculated response of the pre- selected mathematical model of the dynamic system subjected to the measured forcing function.
Comparison of Expei iment and Theory
An exact duplication of measured and com- puted response never occurs in practice. Henc a quantitative assessment of the degree of cor- relation is desired to assess the validity of the mathematical model used in the dynamic anal- ysis. This study was conducted to determine the feasibility of improving the dynamic model using measured data from 'Thunderpipe" ex- periments. This study assumes that the instru mentation and experimental technique are ade- quate, and that dlscrepaacles are due to errors in formulating the mathematical model or es- tablishing values of parameters for use in the model.
This feasibility study is idealized by con- sidering linear mass-sprlng-dashpot mechani- cal systems subjected to transient response experiments In general, rather than the specif! problem of the response of a reentry vehicle In a shock tube.
Summary of Method
In analyzing the continuous structure to which the shock Is applied, the structure Is approximated by a system of finite elements consisting of masses, springs, and dashpots. Since the structure Is assumed to experience small vibrations due to the shock loading, the finite elements are considered to behave lin- early. Hence, the linear response of the struc ture at the mass locations can be determined by the solution of the equations of motion of the system of finite elements if the system Indeed represents the structure correctly. The prob- lem Is formulated utilizing matrix notation to facilitate the treatment since the mathematical aspects of the problem usually Involve solving a large number of differential equations simul- taneously. The large number results from the large number of finite elements used to repre- sent the continuous system. The finite element are represented by (n x n) square matrices with n being the number of degrees of freedom. Tht shock or external disturbance Is represented by a column matrix of forces, with each force

element being a function at time acting on a finite element or mass.
Ja the discussion that follows, a formal so- lution of the equations of motion is derived in matrix forr*. The responses of the system, calculated and measured, should agree with one another. S these do not agree, one has to adjust the values of the 3n2 elements in the mass, spring, and dashpot matrices until agreement between calculated and measured response is reached. Since the system is assumed to be linear, the response can be assumed to be a linear superposition of its normal modes. Hence, by filtering the measured response by adjusting the filter to the measured resonant frequencies (obtained from a vibration survey), its modal comionents can be obtained. This can be compared with the normal mode solution obtained analytically and has the advantage that one has to adjust the vUues of only n elements at one time. This was done in this report with the aid of a method developed and computerized at Aerospace Corporation. In this method, the difference between the calculated and measured values of the response in a particular mode, i, constitutes an error. The 0 function derived in the body of this report represents the sum of the squares of all the errors in the ith mode. This function is to be minimized so that the ex- perimental data and the calculated 1 esults agree as closely as possible. By adjusting the values of the n modal elements in the neighborhood of the calculated values in a random manner and choosing the better set after each adjustment, one can find the values of the modal elements for closest agreement. Tue method described in this report accomplishes this result in a systematic way.
Derivation of Method for a Mass- Spring-Dashpot System
The equations of motion of a linear system with viscous damping can be written concisely in the form of a matrix equation:
[tnHJa + EcHi} + [kHx} = {F(t)} , (1)
where
[m] = square matrix called the mass matrix,
[c] = square matrix called the damping coefficient matrix,
[k] « square matrix called the stiffness matrix,
{xMiM*} * column matrices represent- ing displacements and their time derivatives, and
{F(t)} - column matrix giving the forces acting on various stations (called nodes) of the system.
The solution to this equation will be derived in terms of the normal modes of the system. Not only (xft)}, the displacement, but {x(t)}, the velocity, and {x(t)}, the acceleration, were derived in terms of the normal modes ami are given, respectively, in Eqs. (11), (12), and (13) which appear later.
It is convenient to treat the transient re- sponses of the dynamic system as the summa- tion of the responses of its normal modes. For a linear dynamic system with damping, the existence of normal modes is given by a the- orem of Caughey [1] which can be stated as fol- lows: "A necessary and sufficient condition that a linear clamped dynamical system possess classical normal modes is that the damping matrix be diagonalized by the same transfor- mation which uncouples the undamped system." However, if the transformation matrix l<t>], which diagonalizes the [m] and [k] matrices of the undamped system, is found, it will not nec- essarily diagonalize the [c] matrix of the damped system; but, for a realistic vibrating system, the off-diagonal terms of the trans- formed [c] matrix will be small compared with the diagonal terms. Hence, the calculated re- sponses by considering the system possesses classical normal modes would not differ much from the actual responses, and the generally accepted procedure is to ignore the off-diagonal terms of the modal damping matrix.
Consider the modal transformation as de- fined by
{x(t)} = Wiq(t)) . (2)
where [<£] is the modal matrix, normalized such that [^]T[m] [<t>] = fij , and {q(t)} is a column matrix representing the generalized displacements.
Substituting Eq. (2) into Eq. (1) and pre- multiplying by [<t>]T results in
(q) + Mlq) + M (U) = WT{F(t)}. (3)
where [n] and f^J are diagonal matrices representing the generalized modal damping

>
and the normalized stiffness (or the square of circular frequency), respectively. [*r is the transpose of the [<*>) matrix. Thus, we obtain
[*.1T[»H«) - [1],
l4>]rlV]l*] -- t^J. (4) and
where [i] is the identity matrix.
Talcing the Laplace transformalioa of Eq. (3), we obtain the transformed equation, after using the following notations:
f •'A
{q(s)} - {q(t)}e-stdt 'o
a CD
{F(s)} - j {F(t)}e-Stdt . Jo
(5)
{»(s)} = l^]{q(s)}
and
+ (sfl J + tMj^CO))) + {q(0)>.
Premultiplying Eq. (2) by [<;]T[m] and using the normalization property given in Eq. (4), we ob- tain the following equation:
{q(l)} - Wr[ml^x(t)> .
where the initial conditions are given by
and {q(0)} = [0lT[mHi(O)} .
From Eq. (5) we obtain
{x(s)} = [^]{q(s)}
(6)
(7)
!/>!
+ W
+ [0]
r ! S + Mj
2 2 S + ^i + "'i
E2 ^ SM; + .^i2
r*]TiFfS)}
UMT[mHx(0)}
[0]T[mlli(O)} ,
(8)
where i is the index for the i th row of the diagonal matrix. Now we observe that
u) [~2— j] U]T -- L -2 1 ; w.^yl
L J 0)
where <*}j is a column matrix formed from the ith column of the [(/>] matrix or the ith mode of the dynamic system. Hence, Eq. (8) becomes
Us^ - 2] WiWi ( \ S + s/x • + a.
(F(s)}
s + M:
2 2 S + S/l • + W-
[ni){x(0)}
+ —i r [m]{x(0)} 1 (10)
Taking the inverse Laplace transform of Eq. (10) and differentiating the resulting func- tion, we obtain the displacement, velocity, and acceleration matrices of the linear dynamic system as follows:
Wn) [Jo OJ./l - ^2
« sin fu-jd - 7) 71 - r.,A {F(T)} dr
+ [ni]{x(0)} e ' '
^^7
+ [tn]{i(0)}
n (^t /l - ^.2)
-C:«:t
^v^T? ^n ^.tyi-^n,
(ID
{id)} . 2] <^i<^iT I ■C.O,. (t-T)
{F(T)> Jcosv/l - ^i2 ^.(t-T)
«nx/l- <;i2 ^(t-r)' /rr?
(12) (Cent.)

.-je ' * / . \ - lm]<x(0)} '. = sin •u.jt /l - ;.2
♦ [ra]<ii(0)' e ' (v ^77)
>^rTT (12)
and
'i(t)
. tF{.)\
* 2 ^i'i cos (-(t-^yi- q5) dr
-C — t
- im]{x(0)>c ' ^cos^tyr^)
^in^yrriT) yr^
+ lrm]{i(0)}
-^'^-D
v/T •nfv/W?)
2^.^ cos (-ttv/TT^) (13)
where ' j ^. 2 ..'j.
Equations (11), (12), and (13) represent the displacement, velocity, and acceleration re- sponses of the total system of finite elements in terms of its normal modes. Considering, for example, Eq. (13), one may interpret that the elements in {x( t) > are obtainable from acceler- ometer readings, those in {F(O) are obtainable from pressure measurements, the values of ^ arc obtainable from a vibration survey, and <» i are the unknown quantities needed to satisfy the equation.
Also, it may be observed from Eq. (13) that the acceleration signal» consist only of compo- nents of the damped frequencies '^x - Zf* It
is then feasible that a narrow-band filter (whether it is an electronic circuit or a digital computer filter) may be used to separate the components. The filtered acceleration compo- nents are derived below and given in Eq. (19).
Filtered Signal - Consider the acceleration column matrix, Eq. (13), which can be written as
«"ml - Z] {*}i(*}iT{xt))i (14)
where {y(t))i is the column matrix represent- ing the quantity inside the braces in Eq. (13). For an undamped system where C j = 0,
{/(t)}; - {F(n} - j {F(T)} OJJ sin a).(t-T)dT ■'o
- (m]{x(0)} ^j2 cos ^t
- ImHx'O)} a), sin oi-t . (15)
Let the acceleration column matrix be de- composed into its modal components,
{x(t)) = £ {i(t))i . i
which gives, from Eq. (14),
Writing Eq. (17) in detail gives
(16)
(17)
'2i
> = <
?2i
v. "w
where
l^\ 1*2» yji ^mJ
<t . eni (18)
n is the number of degrees of freedom, j denotes the j th mass, and i denotes the ith mode.
From Eq. (18),

which is the filtered acceleration response at station i (filter set at the -th frequency).
Prior to the transient response experiment, a vibration survey (frequency response experi- ment) is made to determine accurately the natu- ral frequencies (actually the damped frequen- cies) of the system. The applied forces (F( t)) are measured during the transient response experiment. (It is assumed that the applied forces at each mass point representing the ex- ternal structure are measured or can be extrap- olated.) Then the quantities yki(t) can be de- termined from {F( t)} and the initial conditions of the system. Hence, on examining Eqs. (15) and (19), it would appear that a set of i<t>) j could be determined if the values of xji(t> and yki(t) are computed for a sufficient number of instants of observation.
In general, however, Eq. (19) will not be satisfied exactly for all instants of observation, due to inaccuracies in the formulation of the mathematical dynamic model. Consequently, a least squares criterion was generated for the determination of the best (;>}; that would satisfy Eq. (19).
For the ith mode, this least squares cri- terion may be written
response at various locations un the structure, we are able to construct ,-i. This function ex- presses in a general way the difference between the computed and measured responses. Hence, minimizing this function wilt result in a set of mode shapes that will fit the experimental data.
The minimization of Eq. (20) was accom- plished by means of a method developed by Brooks [2]. This method is described in the following paragraphs.
Brooks] Monte Carlo Method for Finding a Maximum - A customary method for determin- ing maxima is the gradient method, which re- quires determining the direction of maximum change of the function by evaluating its partial derivatives with respect to its independent variables. One then proceeds along the direc- tion of the gradient until a local maximum is determined. At this point, another gradient direction is established.
Because of the amount of computation in derivative determination, a more efficient method is to maximize along a line in a random direction. One can show that the expectation of the change is in the gradient direction, yet the partial derivatives associated with the gradient need not be determined.
^i(^,i,02i----^ni^
V t -1
(20)
or
where
k = 1,2,.. .,n; i = 1,2,..., m, number of responses meas-
ured; and t = 1,2,..., p, number of instants of ob-
servation.
It should be pointed out that the number of re- sponses measured, m, can be less than n, the number of degrees of freedom.
Recapitulating, we have shown that, on the basis of a dynamic analysis, an estimate of the natural mode shapes (/) could be made. To- gether with this information and the natural frequencies ^ obtained from a ground vibration survey of the structure and the measured
To simplify the discussion of the method, we consider 4>i to be a function of a two- dimensional space (*,|,02i) ^ig. 1). Starting with an initial guess of /^ .*2i. which corre- sponds to the point 0 in the space, one evaluates -0J. From 0, a random direction is chosen. A point 1 in the vicinity of 0 in the chosen direc- tion is then »elected and the corresponding value of -0j is evaluated. The second value of -$. is compared with the first. If the second value is higher, select point 2 in the direction of 0-1 at twice the step size. H point 2 is still higher, select point 6 at again twice the step size. If point 2 is 4till higher, select point 3 at again twice t^.e second step size. If point 3 gives a
l/i. = MAX
*ri
Fig. 1. Monte Carlo method

lower value ai -T,. than point 2, a parabolic curve is drawn through points 1, 2, and 3. Point 0' corresponds to the highes, point on the parabolic curve, which should be cJ^se to the position of a local maximum in that oie direc- tion. From 0', another random direction is chosen and the process is repeated The proc- ess terminates when an exhaustive seaich of a vicinity yields no better -; j.
It may be seen that this method has some of the characteristics of the method of steepest descent, but seems to be more efficient in that the gradients in n-dimensional space need not be evaluated for each step.
EXAMPLE PROBLEMS AND DISCUSSION
Two problems were solved to illustrate the method of this report. Both of these problems considered a lumped parameter model having only six degrees of freedom, but it is felt that the essence of the method was demonstrated nevertheless. In the absence of test data, the mass and stiffness parameters in the problems were arbitrarily changed in an attempt to intro- duce errors due to shortcomings of the dynamic analyst who formulated the problems. The mode shapes computed from this erroneous formula- tion were obviously different from the true mode shapes one would obtain from an experimental modal survey if this could be accomplished accurately.
In the first problem, it was assumed that there was measured disturbance or response information at all points corresponding to the degrees of freedom Ci the mathematical model. In the second problem, this was not true. In fact, no information was available at two of the stations used in the mathematical formulation.
the second example, improvement in the com- puted mode shapes was shown as a result of processing the "experimental data" according to the method of this report, although the im- provement was not as dramatic as in the first example. These results seem to imply that one can anticipate considerable improvement in a poorly formulated mathematical dynamic model when a large amount of experimental data are available.
Example Problem Number 1
Statement of Problem - To illustrate the application of the previously derived results, an example was constructed that contains the main featiires of a typical problem. The prob- lem might represent the case in which it is de- sired to determine the transient response of a reentry vehicle subjected to a blast loading. Based on the physical properties of the struc- ture, a spring-mass analog was constructed, consisting of 6 masses and 5 springs (Fig. 2). The applied force is represented by a triangu- lar pulse with a peak of 1000 lb and a duration of 0.001 sec that travels over the reentry vehi- cle at a speed of 12,000 ips.
Let the true (actual) masses and springs be of the following values:
mlR = 28.309 1b
m2g = 19.709 lb
mj-, - 16.110 lb
m4g = 14.919 lb
msg = 19.319 lb
m.g = 19.427 lb
The convergence to the true mode shapes was excellent in the first example despite the fact that the analytically derived mode shapes differed considerably from the true ones. In
k, = 1.251 x 10⁴ lb/in.
k2 = i.528x 104 lb/in.
1000 LB
m
-0.001 SEC
L_ 4" . . 6" J. 6,■ ' ■ 6" ■ ■ 6" —-J
Fig. 2. Spring-mass system subjected to traveling pulse

r
k, = 1.063 x 10⁴ lb/in.
k4 = 1.144 x 10⁴ lb/in.
k, = 1.012 x 10⁴ lb/in.
Let the dynamicist who formulates the dy- namic model calculate these values to be
«, = 25.000 lb
w2 = 19.709 lb
»3 = 16.110 1b
w4 = 17.000 lb
w( = 19.319 lb
w6 = 19.427 lb
k, = 1.25 x 10⁴ lb/in.
k2 = 1.300 x 10⁴ lb/in.
k3 = 0.900 x 10⁴ lb/in.
k4 = 1.144 x 10⁴ lb/in.
ks = 1.012 x 10⁴ lb/in.
which are different from the true values; i.e., some errors were made in formulating the values due to limitations of the theory employed.
An eigenvalue analysis would furnish the following frequencies and mode shapes.
a. "True Frequencies and Mode Shapes - The true frequencies and mode shapes are based on actual masses and springs of the system.
"'i (rigid body mode) IP) i ~ <
''2 2 - 5.6617794xl04
(1st flexible mode) ,(./>},
2.5711003x10s I-/.}.
1.0 1.0 1.0 1.0 1.0 1.0
'2.1832192 1.4587241 0.5896454 -0.7540531 -1.8584049 -2.5865483
r 1.7488900^ -0.8866337 -2.2827900 -2.6291799 -0.6677005 2.3984586
> ,
r >
.,2 =4.5687757x10" ■;>4 = ■<
■s2 = 7.5677902 x10 s {/K = V
1.4134544^ -2.3715559 -1.8505419 . 1.2^03420 f * 2.2175386 -1.7438144
^ 0.5546950^ -1.9057222 0.8981284
and
3.0055750 r -2.7191541 0.9841980
r 0.3159087^
2 = 1.2522949 x 10 6 W< = <
-2.0028400 4.4781486 -2.0715276 0.6050650
-0.1157667
>■
b. Calculated Frequencies and Mode Shapes - The calculated frequencies and mode shapes are based on masses and springs estimated by analysis.
r = 0 {0}, = <
1.0 1.0 1.0 1.0 1.0 1.0
>,
5.3594196 xlO4 </•) >,
2.4823731x10s Up}-
2.2822298^ 1.6491218 0.6928123
-0.8125969 -1.8292985 -2.4938566
r 1.7012653^ -0.4846835 -2.1157792 . -2.7167839 ?' -0.5938498
v 2.5348854 r 1.8014632^
2 _ 4.4476042xl05 {7)4
-2.3457125 -2.2398130 1.2419185 .8550571 .5313187 J
7.0651811x10s (0),
1* r 0.6474993^
1.7204015 0.7739617 2.M97223 2.9868394 1.1885990
>,
< >

and
1.06 75415 xlO6
0.4804274 -2.1742601 4.38567381
''» = Vl.7835363f 0.6914416
-0.1605030
It should be noted that the true and calcu- lated values of the frequencies and mode shapes are different and that, after a hypothetical fre- quency survey has been performed, the set of true j2 in case a is found. The sets of it)i in case a are not known, however, whereas those in case b have been calculated by the dynamicist. It is assumed that, during the frequency survey, either the mode shapes were not measured or they were not obtained with the same accuracy as the measured frequencies. A computer pro- gram has been written to compute tne quantities x'j^t) andern using Eqs. (14) and (15). The values of the quantities for 3 time instants and the 5 flexible modes are given in Table 1.
Example Problem Results - The numerical values from Table 1 were entered as inputs to the "Creeping Random Computer Program," previously discussed, which minimizes ^ in Eq. (20). This computer program requires as input an initial trial value for p-, -, • Instead of using the calculated values of <Pi ■l only (the re- sults of the dynamic analysis), two cases of ini- tial trial values of --i calculated values of
j • were attempted: (a) the
(from the dynamic analysis), and (b) all elements of 4>-. j equal to 1.0.
a. Calculated ; ^ as initial Values J i
[./.] : [^}2{;fe}3. ..{0>6]
2.1832193 1.7489067 1.4134545 1.4587253 -0.88650611 -2.3715565 0.58964542 -2.2828123 -1.8505421 -0.75405318 -2.6292058 1.2903421 -1.8584052 -0.6677963 2.2175393 -2.5865485 2.3984812 -1.7438146
No. of (71,001) (245,000) (81,002) Trials
No. of Trials
0.55469529 -1.9057233 0.89812871 3.0055761
-2.7191556 0.98419836
(139,002)
0.32092342 -2.0454205 4.5181893
-2.0922921 0.59756558
-0.11567424
(285,000 not yet converged)
b. All Elements of Initial Values
</>.. Equal to 1.0 as
[<p\ - [{*}j{*}jW4t</'>s]
-2.1832198 -1.4587201 -0.58964556 0.75405333 1.8584022 2.5865490
-1.7464479 0.90395607 2.2796787 2.6254416 0.65576761 -2.3956199
-1.4134545 2.3715562 1.8505420
-1.2903421 -2.2175390 1.7438145
No. of Trials
(108,002) (186,002) (152,001)
0.55469514 -1.9057231 0.89812867 3.0055761
-2.7191556 0.98419835
No. of Trials
(177,002)
Discussion of Example Problem Number 1 Results - Comparing the results obtained with the true mode shapes, it may be observed that the computer results are accurate and repeat- able as they converge to the values known to be correct a priori.
It is interesting to note that 4>-} ■1 converges to the same numerical value, but with a minus sign for i = 2, 3, and 4 in the case of the initial values of 1.0. For i = 5, the obtained result is the same for cases a and b. For our physical problem, the mode shape -{<*>> j Is the same as the mode shape {4>) ■l.
Not every set of *, j which minimizes Eq. (20) is necessarily a modal vector. If only a few response measurements are made and if there are many more unknowns than are repre- sented in Eq. (20), more than one set of 4>i i will render ^ equal or close to zero. An additional mathematical constraint is required to produce an acceptable solution. This restraint is sup- plied by confining in some manner the mode shape {</>}; to a neigfiborhood of the theoretically calculated mode shape.
If the Im] matrix is chosen somewhat arbi- trarily, as is often the case in the original model formulation, a test to evaluate whether the correct set of '</>) -, is obtained is that the vectors should be orthogonal with respect to the [ml matrix. After the correct [<£] matrix, [>/>] = [{*} j{0} 2... {0}6], is obtained from the Monte Carlo computation, the correct mass and stiffness matrices can then be evaluated from the following equations:

a o •**
Ä 0) Ü o
§
a S o U
<p «pr> M »H i« 00 00 «or- m S coco eo ■o a»o M oo «-la» a •i »w ir co a» eo ^i t- t- d «r 1
e «j« ^» e- in ii co oe e- «oo »- d « i v;
5 a» **« 5' «o «DC- a
t-i «D CO ^i C» t- »H IT ^H .-• o c- a d t- e- O «-«oo in « 00« »H co »i eo in «D d t- o
si Id dd d -< in o O A a» eo oo m O' oo d d ii d « | M «•-• t- O» 00« t-
N CO O» t- •H «00 «-' T-t «<co a co eo co es
« 1 iH Ci « m n ir d eo »H w • a«
i « w
^
1 1 1
i i 1 1 »H 1 i
«• « w rt •»» « •<» m ♦ ■» ♦ * m MM in •a « <e el •
o :K IK :x :x :x SX SX sx sx sx sx sx sx sx sx sx ;x sx IX sx
«P OJ O «O 00 <NI a t> •-■ « to c4
oo « ♦J 5 co co t> N in •-1 co TH er ci co a d co a» eo oo cr i ^H m c- c- a i
oo o CD m <-■ m a» m a»« rt er» «D 00 «c « C- r- in cod co m c eo a oo « in n
« ii O 00 CO CO « « * CO t- O»^' «D oo a» co m a»
co m r- d oo a co ao O CD v « o co « a a 1 CO
« in «o t- o to « d t- eo eo co »i «i ii in o co O Q a> t» ITS «-i a eo (D m « n
ci ~« *• ci in d ^ in <o •*• oo ^ oo d o a •* m eo a o t- d i 1 « in v ct oo R •H oo d eo a> cr t- d o d ir
1 i i i i i i Cl Cl M CI >H <-• i i i i i i
d d co co d d i i i i i i
»i eo « « eo i i i i i
« ^ n co m in i i i i
m in in m in in •* n m ♦ w o M M in v m <a ^ N ?s ^ ^ ?>, ^ ^ ^ ^. >. >. ^ ^ >. j». ^ ^ X ^ ^. ^. ^ ^ ^ ^ ^ ^ ?. ^
a m tn d o « 1
^« CO a» a» a oo oo en « a c in CD m t- ^H o m a a> d cr c c- a« if i ti »1 o o c ** e- c« « co to o c- in d a, « o «in ci in in eo «
•-• « ^ C* t* co ä co
^i oo ti « t- m« t- 00 CD « <li •1 t» CO cc rt CO CO 00 « t- «CO « »H 00 t- d eo in oo O t. 00 d M CO CD 00 Cl CO d ci d d a «a CD d d d oo "{ a» MA e« o» in in e> co o in t- TH ^< ^1 « o c- cc
04 «o t- c- ■* Cl c- ^i co in co « d «in o es i c« N CO CO CO i i i co «i
M • 1 1 i
8 W M « « m « m « ♦ ♦ ♦ •* in MM M ■o « « « - "1 •» 9 •• *o * <> - m « >> ** n ♦ "B — 10 « ' J d
ii
:x iX :x :x :X :x sx >K sx sx :x sx SX SX SX sx sx sx sx sx
O CO CO CO CD « •i CM rH t- CD m IT en a> o *** co oc in o O co t- in in in d •-< « if > o oo oo m oo «
^< ^< ao eo « c- CD N 0» CD o Cl
oo oo a> ci co t- d .-i « in eo a co « s- oo in o(i co m m « oo - !l d o t- « Cl <-< eo t- -H -H t- oe •H O t- o CO t- in « n d o if
"
«-I CD »-< o ^< eo CO Cl 00 CO CO CI « O a> o « m O « in eo «H t- in in d « oo n ^< o» o c- «o to o» co «-i t- co t- « « in d ao a» c^ ci d »i d d d d d d d eo t> co m eo C4 c « co o in o a -H co »H to t- ce co oo d a oo c ii t- oo « eo cc
1 09
1 1 1 1 1 o d d N »-l «H Cl ■ i ■ i i
eo eo eo d »H d d eo « eo d d i t i i i
d « m « i titi
<o «««««{ -^ w m * trt *o - t* n •* <n o « M *n ♦ m B •M M Kl « M D -^ M <*» ♦ M > 1 ^ ^ ;v ^ ;v ;*- ^ ?s ^ ^ ^ ^, ^ ^. ^ ^ ^ ?v ^ ^ ?. ^ X ^ ;*, ;«- ;v, ;v ^ x
t- CO O CO CO « oo a co v.' « O
co o o r- tO iH fH CC in co o O d O t- If i CO CD ^ »- ä ao t- a> c ^H o> in c « t- o u: m oo a cc> co in co if f co a> oo w t- co O er co to co in « to to en eo oo oo .- ■"
C1 00 t o ci « t- in d o> -H e- O co to t- in to c- a
s *H i> d d d d d <-* d t> as d d d d d d d d ii >4 co ^ e- oi ci a» m m t- oo -H eo a co co t- d co co a JS t- in a» e» oo at- c co ao co cc i ii in »-I d i«
00 esj
0)
u <
m »H ^ co i i
« «in in i i
i t i i i i eo »i i
n N " " jn m *> »o ♦ *• ♦ «r M Mm M e •o 3 « o _ "i ■» « - m * « — ^ « » -« (O ♦ «o ~ <*) <- o q d
II
:x SX :* IM SX SX SX !X SX SX SX SX SX sx :x sx sx :x sx sx
eg o CD ^H t- CO 'S .3 ^< ^< CO «H 00 iH
oo co ao a> a> in co m o> a» o ci eo to oo in t- 'H c- ii d a t« o TH t- m d « c co « to co o> CM t- ^ in o in o> ao co eo oo m Oi r- r- in in « •-
c O "* eo co c- co co m a> co ao a> in eo »H •* as to o « ii d a en ^ «o i t- co c u o t- t- »I oo co t- ci co co co in -H in « i-< d in in o co co co m in ii t- o oo co
in e<i d to '-< cd t- a» t- * m CM co d m c- o co « « « a ao d d a <i d d d co in co e>? «H C" « o co <-• c- t- co d t- a> « co CO d o O 00 CO »i « « co m
d « in « c- t i i i
CO
1 1 1 1 CSI t- d d »H -H ,-H C- t 1 I 1
eo eo d -H rH t- i t ■ i
eo « « eo t» i i i i
fl M M r» (N w n (^ in **) m «*) M M M M M M « « « « <o « 1 — M »n * U> « -- (N m -» in « M n m « in « — M 1^ ♦ M «C - ti n v MO
^ ;s ?s f», x ^ ^ ^ ^, ^ ^, ^, ,-, ^, ^ .x ,x ^, ^ ^ (v, ^ ^ ^ r ^ ,X X tx ^
1 - a» ^ N eo « in co I x o 4-> II T5 II 1 T3 II s: s" 1 iJ
S 5 ■-, ö - 1 U -H
1 * [ »H ^ d ^, cow « ct- **
10

-1
and (ml -- {WT) W-'
(21)
Example Problem Number 2
Statement of Problem - Referring to Ex- ample No. 1 and Eq. (20), we note thai if neither a forcing function measurement nor a transient response measurement is made on any node in the dynamic model, then the modal value at that node does not appear in thu equation. Hence, its value can then be arbitrary. In this example problem, we shall investigate methods for over- coming this deficiency.
When a dynamicist first formulates a math- ematical model, the choice of nodes is perfectly arbitrary and is subject solely to his judgment. To a lesser degree, the assignment of the masses at the nodes is also arbitrary. For most dynamic analyses, knowing the correct frequencies and mode shapes should be suffi- cient to describe the system analytically. In this example we shall assume that the correct mass matrix is formulated; hence, the mass matrix is not going to be changed in the im- provement of the model.
The same transient loading as that in the previous example is used except that the travel- ing pulse hits the first two particles only. The acceleration measurements are made on parti- cles 1, 3, and 6. No experimental data are available for particles 4 and 5. This may cor- respond to the case In which there are internal components 3, 4, 5 and 6, and 1 and 2 represent the external structure of a vehicle subjected to a blast loading. Compared with the 6 lorce measurements and 4 acceleration measure- ments of example 1, this example presents a more restrictive requirement.
It is noted here that the orthogonality prop- erties of the modal matrix normalized with re- spect to the mass matrix might be used as a supplemental restraint in addition to the com- parison of analytical results with experimental data. The following equation is chosen for mini- mization in the Monte Carlo method:
+ c, 2,, *(f 4'(2 - 386.08401
for i t 2, the first flexible mode.
p r- / < x2! t=l[j = «\ k-» / _Jt
♦Cl
rn 2 -i2
Z! *ff 4>ti - 386.08401 [f-i J
r- i2
+ CJ = minimum,
(23)
minimum, (")
where
k * 1,2,... q, number of forces measured;
*ll = diagonal element of weight matrix ("correct" set);
j s 1,2,..., m, number of accelera- tions measured;
CpCj ■ weighting constants; and
t = 1,2,..., p, number of instants of observation.
Table 2 constitutes the input data to the "Creeping Random Computer Program" for the improvement of the first three flexible modes. For initial trial values of the 4>'s, the calculated values mentioned previously are used. Values of 1.0 are taken for the constants c, and c2, giving equal weights to the experimental data and conditions of orthogonality.
Example Problem Results - Results from the computer program are9 given in Table 3. The true values of ^'s are repeated for com- parison in the same table.
Discussion of Example Problem No. 2 Results - The results show that improvement of the modal values, at nodes where there are no experimental data, can be obtained by the use of the orthogonality properties of modes.
The orthogonality property introduces one additional equation (in the case of {0)2) to equations containing experimental data when there are n unknown ^'s to be found. The value of n can be much larger than m. The question remains whether the orthogonality equation can improve all the 0's in a somewhat uniform manner.
To investigate this question, a value of ID6
is taken for c, in Eq. (22), thus magnifying the
11

}--*. -»
TABLE 2 Creeping Random Computer Program Input Data
Flex- ible
Mode
t, » 0.0028 t2 =0.0032 t3 = 0.004
»»ear Strain Acceleration Shear Strain Acceleration Shear Strain Acceleration
Ist {i«2) 722
-65.00842 -52.74640
X62
-477.84119 -129.05569 566.11783
>I2
722
-74.16420 -62.62416
*12
«32 X62
-552.93978 149.33837 655.09017
>12 y12
-90.38496 -80.59479
i12 -687.48634 X32 -185.67680 xt2 814.49294
2nd (i=3)
>13 -237.7336 -209.2545
«13
»33
»63
-402.66076 525.58478
-552.21607
>I3
^23
-249.6289 -233.2089
*I3
«33 X63
-401.89947 524.59108
-551.17202 y»
-242 6493 -251.8453
5,3 351.65368 .X33 459.00629 563 -482.26407
3rd (i=4)
>I4 -333.157?. -322.5316 *34
X64
415.55418 -544.05747 -512.67969
>I4
^24
-314.4325 -334.0710
«14
«34
«64
491.64481 -643.67788 -606.55462
>14
>24
-211.4668 -285.2581
x„ 533.72985 X34 -698.77702 x64 -658.47600
TABLE 3 Comparison of Computed and True ^'s for Example 2
*2a *.b ^C
Computed True Computed True Computed True
2.1823435 1.4613510 0.58940554
-0.76325231 -1.8548189 -2.5855092
2.1832192 1.4587241 0.58964540
-0.75405312 -1.8584049 -2.5865483
1.7488908 -0.88663371 -2.2827910 -2.6339910 -0.65287925 2.3984598
1.7488900 -0.88663372 -2.2827900 -2.6291799 -0.66770054 2.3984586
1.4134613 -2.3715563 -1.8505515
1.3490425 2.1903482
-1.7438244
1.4134544 -2.3715559 -1.8505419
1.2903420 2.2175386
-1.7438144
a294,002 trials. ^170,002 trials. C106,001 trials.
effects of orthogonality in comparison to those of the experimental data.
Table 4 shows the results of computed {$) 2 compared with the starting values and the true values. A general inprovement of W 2 is noted.
MIXED RESPONSE DATA FROM STRAIN GAGES AND ACCELEROMETERS-AN EXTENSION OF THE METHOD
In the preceding examples it was implied that only acceleration measurements were made. In practice, however, both acceleration
TABLE 4 Effects of Orthogonality Equation (C, = ID6)
Calculated (^} 2 a Computed {^}2
b True {i>}2
2.2822298 2.1391473 2.1832192 1.6491218 1.5925472 1.4587241 0.69281230 0.57770646 0.58984540
-0.81259693 -0.81575419 -0.75405312 -1.8292985 -1.8758526 -1.8584049 -2.4938566 -2.5343082 -2.5865483
aStarting values. From random program.
12

and strain measurements are used. In formu- lating the dynamic mi Jel, we postulate that the dynamicist uses a finite t- ement approach of some kind where masses are concentrated at a network of stations called nodes. The displace- ment and acceleration responses are also measured at the nodes. U the strains of the structure between the nodes are measured by strain gages, these measurements can be re- lated to the relative displacements of the two nodes. The exact nature of this relationship would have been determined by the dynamicist in his original stress analysis.
Before proceeding with the development of the method for handling strain data, we will di- gress briefly to derive some strain-displacement relationships that will be needed in the subse- quent derivation.
Let the transformation matrix [T] relate the strains ie) and the displacements M of the system. The matrix [T] is called the "strain transformation" matrix. This relationship may be expressed as follows:
Fig. 4. Example 2, triangular membrane element
e
> - Ö
xy
where
2A
(»,. y,)
vas 0 vai 0 yi2 0
0 x23 0 xil 0 x 12
x32 Vli X 3 Vai X21 Vli
>.
(26)
u) -- mix) (24)
As an illustration of the form of [T], two ex- amples are shown. Example 1 is the case of an axially loaded bar of varying cross section (Fig. 3). For this case, Fq. (24) takes the form:
r -\ VI, Vi,
■l/ly !/-£,
r ^
< X,
X
(25)
e%,ty,y%y - strains in x- and y-directions and shear strain, respectively, considered to be uniform in small triangular element;
A = area of triangle;
y23 = vj -yi, etc., where x and y are coordinates from reference point; and
u.v = displacements in the x- and y- directions, respectively.
U n L^«, - 0
cb Fig. 3. Example 1, longitudinal bar of varying cross section
Now, proceeding in a manner analogous to the treatment of acceleration data, we have from Eq. (11), the filtered signal for the dis- placement.
<x(t)}i = {0}i{0}iT^(t)}i (27)
where {^(t)); are the terms included in the braces in Eq. (11).
Substituting Eq. (24) into Eq. (27) gives
The second example (Fig. 4) is slightly more complex and considers the case of a tri- angular membrane element subjected to In- plane forces. The strain-displacement rela- tionship is expressed by Eq. (26):
{e>i -• [T]Wi{0}.T{y3}i . (28)
which, when written out in expanded form, be- comes
13

^
2i
<<ti> =
^ry
Tll TI2 ••• Tln
Tr.Tr2 .
0 ^
• T.
li
*2i
< ■ Y teH*2i ••• ^niJ <
4> ■ /3-i
(29)
where «, j is the strain measurement filtered to the ith mode between nodes I and -f + !, and there are r strain measurements.
It follows that t f is given by
^ ^E^p^j^E^^i)- ^30)
Hence, the ^ function to be minimized for mixed measurements of strain and acceleration responses will be given by
H (''ji - *ji L ^i TJi) + a E
..-g^^g^a (31)
where there are m acceleration and r strain measurements, m + r 1 n and a = scale factor, which is introduced because the strains, nu- merically, are so much smaller than the accelerations.
Similarly, one can gather together the ex- perimental data of more than one transient
response experiment to form the ^ function to be minimized. The subsequent dynamic model obtained from a single computing operation will best fit all the experimental data so treated.
CONCLUSIONS
This report demonstrates that it is feasi- ble to improve an analytically derived linear structural-dynamic model based on transient response experiments. Although th^ data used in this report were "manufactured" from anal- yses and were not actual measured data, the basic concept has been demonstrated.
In the example? presented, attempts were made to represent typical transient response experiments, albeit on a smaller scale; i.e., only a six-dfcgree-of-freedom model was used although it is recognized that most practical problems in the aerospace industry require many more degrees of freedom for adequate simulation. In addition, the essence of the transient response experiments was maintained, especially in the second example, where the forcing function was assumed to be applied at only the first two particles and acceleration measurements were made on particles 1, 3, and 6. This example typifies the expeviroent in which the external structure, represented by particles 1 and 2, is subjected to a load, and response measurements are made on the exter- nal structure and on some, but not all, of the internal components. (No measurements were made on particles 4 and 5.)
The basic logic of the method has been es- tablished, even tnough feasibility was demon- strated only on a six-degree-of-freedom system with input data (loading and response) known exactly. A study of the effect of errors in data should form a next step in the evolution of the method.
FUTURE EFFORT
Although this report, in its present form, can be utilized for assessing the validity of a structural dynamic analysis based on experi- mental results, certain questions have arisen during the course of this study that require ad- ditional effort to find the answers. In an effort to demonstrate the principles of the method in- volved, relatively simple examples were chosen in the report. To obtain a better simulation of the physical system, more complex analytical dynamic models involving more than six degrees of freedom are often generated. It is planned to demonstrate that the methods of this report are feasible and economical (in terms of
14

computer time) in handling systems represented by many degrees of freedom.
In the simple examples given, it was as- sumed that four, and then three, accelerometer measurements were made during the tests. An investigation is planned in which it is hoped that general criteria for the number and location of transducers required for successful application of this method can be achieved. These criteria will then serve as a guide for future planning of experiments.
Measurement inaccuracies due to trans- ducers and associated circuitry always arise due to factors such as manufacturing tolerances or noise in the system, ft is planned to employ statistical concepts in the representation of the loading am' response measurements obtained from experiments. This study should result in a "best fit" solution to the dynamic model based on test data. In addition, it is hoped to formu- late a criterion for measurement accuracy to yield adequate results for revision of the ana- lytical model.
REFERENCES
T. K. Caughey, "Classical Normal Modes in Damped Linear Systems," J. Appl. Mech., Vol. 27, Trans. ASME, pp. 269-271, '960
S. H. Brooks, "A Discussion of Random Methods for Seeking Maxima," Operations Res., Vol. 6, No. 2, March-April 1958
15

DIGITAL ANALYSIS OF FATIGUE DAMAGE TO A MULTI- MODAL SYSTEM SUBJECTED TO LOGARITHMICALLY
SWEPT SINUSOIDAL VIBRATION SPECTRA
Seymour Fogelson The Marquardt Corporation
Van Nuys, California
To qualify a component for use in missiles of space vehicles, it is nor- mally required that its fatigue strength be demonstrated by test. Such a test generally requires that the component be subjected to a random vibration input for a specified time awd to a sinusoidal vibration spec- trum that is swept linearly or logarithmically at a given rate. One of the functions of the stress analyst is thus to verify that the component has a fatigue life sufficient to pass these tests without failure. The purpose of this paper is to present the analyst with a digital computer program that will predict the fatigue damage done to a structure with up to six degrees of freedom that is subject to logarithmically swept sinusoidal vibration spectra.
A method for calculating the fatigue damage of structures subjected to sinusoidal vibration spectra that are swept logarithmically at a given rate was developed and programmed for analysis by digital computer. It is assumed that the structure is a damped spring-mass system with each mass having three translational and three rotational aegrees of freedom. Only lumped mass structures are considered. It is further assumed that the resonant amplification factors and the overall damp- ing ratio of the structure are known.
Based on this analysis, the resulting digital computer program yields the damage accumulated in each mode of response for each axis of ap- plied excitation, the total damage accruing for each input axis, and the total damage caused by sweeping the spectrum a given number of times.
Fogelson
INTRODUCTION
times these stresses are repeated are there- fore readily determined.
The "allowable" number of times this in- duced stress may be repeated is obtained from the S-N curve of the material and the resulting damage to the structure is directly obtained.
When a number of sinusoids differing in both amplitude and frequency are applied to the structure in sequence, the resulting damage is the sum of the damage caused by each resulting stress level, i.e..
When a damped resonator is subjected to a sinusoidal excitation of a given amplitude and frequency, its response peak acceleration and frequency is constant with time. The stresses induced in the structure, which are functions of the response accelerations, and the number of
L* N. (1)
according to the Palmgren-Miner hypothesis of cumulative damage.
17

It is often required to determine the dam- age done to a structi're when a frequency range is swept at a given rate. Within this range the magnitude of the applied excitation may remain constant for all frequencies or only over speci- fied frequency ranges, as shown .n Fig. 1. When this range of frequencies is swept, the response accelerations and, therefore, stresses are now time dependent and Eq. (1) is no longer applicable. In short-lived structures, such as missiles and space vehicles, the rate of sweep is adjusted to provide equal time increments for each frequency band [1, p. 24-22]. In this type of sweep the frequency varies logarithmi- cally with time as shown in Fig. 2.
MPUT
item
Fig. 1. Input spectrum
The response of a damped resonator sub- jected to a logarithmic swept sinusoidal spec- trum was investigated by Grumman Aircraft Engineering Corp. [2], This investigation re- sulted in an equation for predicting the number of times a specific amplification factor and, therefore, stress is exceeded when a spectrum
such as that shown in Fig. 1 is logarithirically swept at a given rate. This paper describes the utilization of that equation, and the resulting digital computer program, for predicting the fatigue damage in a lumped mass system having six degrees of freedom.
LIST OF SYMBOLS
b Slope of material S-N curve
D Damage
An Number of applied cycles occurring be- tween two specified stress levels
f Frequency of applied acceleration (cps)
fn Natural frequency, simple resonator (cps)
fr Natural frequency in mode r, multi- modal system (cps)
F.T Force, torque (lb, in,-lb)
> Damping ratio
H Linear or generalized magnification factor
I Weight moment of inertia (psi)
K Percentage of maximum magnification factor
m Mass
M Generalized weight (lb)
ü Response acceleration (in./sec2)
n Number of applied cycles
LOG t ICPS)
200
Fig. 2. Frequency-time relationship for logarithmic sweep
18

N Number of allowable cycles from material S-N curve
0 Generalized force (lb, in.-lb), "quality" factor = l 2/, single-degree-of-freedom system
R Applied load factor (g)
S Stress (psi)
SR Sweep rate (octaves/min)
T Sweep period (sec/octave)
w Weight (lb)
x Applied acceleration (in./sec2)
P Torsional mode magnification factor
Subscripts
i General index, response coordinate
j Input coordinate
k General index
L Subincremental index
r Mode
Matrix Notation
[A]T Transpose of matrix A
t J Diagonal matrix
FAILURE CRITERIA
A typical material S-N curve is shown in Fig. 3. If a stress of intensity S; is cyclically applied n. times, the resulting damage is
LOG
Fig. 3. Typical material S-N curve
D - T ni (4) i >
whore m is the total number of different stress intensities applied to the structure. In a piece- wise fashion the S-N curve shown in Fig. 3 may be expressed as
where
log (lyN,)
loR (S2/S,)
(5)
(6)
By substituting Eq. (S) into Eq. (4), the damage is expressed as
-tm*- (7)
(2)
Equation (7) demonstrates that, for a given ma- terial, the damage depends on the magnitude of the applied stress si and the number of times dj that it is applied. According tc test data [1, p. 24-12], failure of a multiple-loaded mate- rial occurs when
D > 1/2 . (8)
and the fatigue margin of safety may be ex- pressed as
M.S. . - 1 . (3)
If the peak stress intensities vary during the life of the structure, the damage, according to the Miner hypothesis, is cumulative and is ex- pressed as
»•-litt) r—y
fi. £ L-A
Fig. 4. Stress-time history
19

For clarity, the calculation processes for -le- termining S; and ni will be illustrated for a single-degree-of-freedom system.
SING LE-DEGREE-OF-FREEDOM SYSTEM
S»,, Ss<?N. (17)
the stress at any nonresonant condition can be expressed as
S. K. S i i max (18)
Determination of Stress
A resonator, such as shown in Fig. 4, re- sponds to an excitation with the acceleration of
"i ^ M, (9)
where H, the magnification factor, is given by
^ = {[1 (fi'f^V + ^iU fn)2}' 2 ■ (10)
x(t) - xo sin .A , (11)
and U| = response acceleration. When
fi fn- (12)
Eq. (10) reduces to
Determination of Applied Cycles
The number of times the stress S; (Eq. (18)) is equaled or exceeded was found by Grumman [1, p. 24-22] to be
n; - 2.041 Tfn /l-yTlw2) [l-dKiQ)2] .
(19)
in which T is the sweep period in seconds per octave.
Since ni counts all of the peak stresses greater than Sj, it also includes the number of times the stress Sk is exceeded (where sk Sj), as illustrated in Fig. 5.
W = 0.
When f; | fn, the magnification factor can be expressed as
Hj = KjO, (13)
where Ki is some fraction less than unity. The stress on section A-A (Fig. 4) of the mass is given by
S; "A-Aui
AA-A (14)
where
mA.A is the mass to the right of section A A, and
AA A is the cross-sectional area at A-A.
Substitution of Eqs. (9) and (13) into Eq. (14), setting mA.A wA.A K, yields
&PSI!
Fig. 5. Simple resonator
To preclude counting sk and all higher values of S more than once, the increment be- tween n. and nk is used and the number of times the peak stress level is between S; and Sk is counted. Thus, the quantity
An; (20)
is used in Eq. (7) in lieu of nj. The stress magnitude now used in Eq. (7) is the average of S; and sk, i.e..
or
S. _il* K. Q ^ AA.A 8
si SsKi^N
(15)
(16)
where Ss is the stress due to a 1-g loading and N is the applied load factor. If
-2-(Si + sk). (21)
If Kk - K; is small enough, the resulting error will also be small. Since the greatest damage is done at the higher stress levels, this differ- ence should be initially small, e.g., 2.5 percent, increased to 10 percent for K - 0.6.
20

INPUT DATA
H^.k
INPUT DATA
H S MAX, Q, N ♦.. T, MS-
DEFINE HVALUES OF
•NS = NO. OF SWEEPS
DETERMINE
». (EO.17)
DETERMINE
«>. PER SWEEP
(EQ. <)
DETERMINE O^XDj
PER SWEEP
DETERMINE TOTAL DAMAGE D * D* x NS
(I) IF S-N DIAGRAM IS NOT A STRAIGHT LINE WHEN PLOTTED ON LOG-LOG PAPER, THEN ASSUME STRAIGHT UNES BETWEEN AVAILABLE DATA POINTS AND USE SEVERAL VALVES OF «,,$,,*«.
Fig. 6. Flow diagram for single-degree-of-£reedom system
The procedure to be used to determine the damage factor D for a single-degree-of-freedom system is outlined in Fig. 6, and will now be adapted to a multi-modal system.
MULTI-MODAL SYSTEM
Discussion
This analysis is limited to a lumped mass system, supported on lightly damped springs, with each mass having three translational and three rotational modes of vibration. This sys- tem may be typified by equipment supported at various points on a space framework with struc- tural damping. A sinusoidal excitation, such as shown in Fig. 1, is logarithmically swept and applied to the system along each of the three orthogonal system axes in succession. This input excites all six modal responses as the frequency range of the spectrum is swept, as shown in Fig. 7.
As in the simple resonator, the procedure to be followed is (a) determine the applied stress intensity; (b) determine the number of times each stress intensity is applied; (c) de- termine, from the S-N curve, the number of times each stress intensity may be applied; and (d) compute the damage.
In a weakly coupled system, the damage from each mode must be computed separately and then summed. Each of the procedures out- lined above will now be discussed in detail.
Fig. 7. Response Inertia forces and moments
Determination of Stress Intensities
Each inertia load shown in Fig. 7 is de- rived from the mass properties at its centroid, the corresponding amplification factor, and the applied excitation. These loads are expressed as
rt) WH R n j r
-\
and > .
Trii = V;rijRr
Let each load be indexed as
(22)
21

r.. rxj
'Vl
«•»J
'»I
«•yj
r»J
>
Or»
«raj
«Mi Orij
where
r is the mode,
i is the response coordinate, and
i is the input coordinate (j = 1 on x-wds, j = 2 on y-axis, and j = 3 on z-axis).
Similarly, let
M4 N
H.^ Hlyj HIZ. elxi 0lyj 0lti
'Jxj
■3x
H4xj H4yj H4.j ß4xj 0iyj '94z)
"Sxj
'6x
'11
'21
Mj
H2yj H2zj o2xi e2yi elt.
H3yj H3zj eixi eiy\ 0iZi
H5yj HS«j 05xj öSyj 0Szj
"6yj H6lj 06xj ö6y. ö6lj
•l2j • H16j
■ • H26j
'66]
[Hrijl
R,
. IRJ
Let the full force matrix be
K?rijl '- [{Q.ii><Q2ij>--<Q6ii>]T.
which, from Eq. (22) and the matrices defined above is
N - NNIN • (23)
At any point In the structure, the stress induced by one of the Qrij forces is
Srij = OriiAj (24)
where A. is the coefficient relating Srij to Qrij as found by stress analysis. If Eq. (24) is written as a matrix, with the columns corre- sponding to the response axes and the rows corresponding to the modes,
NT = MM' (25,
and using Eq. (23), these stresses may be ex- pressed as
where
and
,1, = [(SuiHS,,,).-.^)]'
%i? 'r2j
<Srij> = <
^
and For the nonresonant frequencies, as in Eq. (18), Eq. (26) becomes
22

[h.r] «.[«.][«..,][",][',]. (")
Determination of Applied Cycles
It is shown by Eq. (19) »hat, for a simple resonator, the number of times a stress of in- tensity Sk is exceeded is a function of the cor- responding magnification factor KkQ. In a multi-degree-of-freedom system, however, the maximum magnification factor is H, which is different from o = 1/2 y. Equation (19) is, therefore, expressed as
(28) where
rr = rth modal frequency, and
SR = sweep rate (octaves/min) = 60/T.
Equation (28) indicates that for a given mode and sweep rate, the stress components Skrij will each be exceeded a different number of times, depending on the magnitudes of the cor- responding magnification factor (KkHrij).
Consider a two-degree-of-freedom system with response directions q, and q2 and the corresponding resonant amplification factors in mode 1, H,, and K12, for an input in direction 1, and assume that H,, > H12. Equation (28) indicates that as (KkHri) diminishes, the num- ber of times the stress corresponding to fKkHri^ is exceeded increases. Thus
"k I 1 * "k12 •
The number of times the peak stresses fall in the intervals
and
is given by
Skll < SI1 < S(k + Ak)ll
c < c < c k l 2 12 ( k + Ak ) 1 2
AnkU ' "kll _ n(k + Ak)M
and
Since
and
Ankl2 = nkl2 " n(k+ ( k + Ak ) 1 2 •
nkll < nkl2
"(ktfik)!! " n(k»ak)IJ
Ankll< ^k-
(29)
Since Eq. (29) must hold for all values of k, it is inferred that, on a time basis, the stress sk, 2 is applied to the structure before the stress sk,,. This means that the stress Sk,2 is applied to the structure a number of times equal to
AAn, kll AnkI2 ' Ankll (30)
more than skll. Also, since Skll and skl2 are applied symmetrically about a central frequency, Ankl2/2 and AnkI1/2 must occur simultaneously. The total stress
Sk " Sk 11 + Sk 12 •
is thus applied to the structure a number of times equal to
AAnkl2 = Ank,I (31)
This reasoning has been extended to cover the six-degree-of-freedom problem under consid- eration.
This concept is best illustrated in Fig. 8 where the dni and si values are chosen arbi- trarily. In this figure, Anj/2 is plotted against Sj to emphasize the temporal relationship be- tween the various response directions.
It is seen from Fig. 8 that the initial stress intensity applied to the structure is S,,. = s, = 5 ksi, which is appUed (2) (300 - 200) (lO*) » 200 x 10* times. Since the total stress applied to the structure is the sum of the component stresses, the stress S( 2) = S, + s4 = 5 + 10 = 15 ksi is applied to the structure (2)(200 - 150) (103) = lOOx 103 times before s, is applied. The summation of stress versus cycles contin- ues until the maximum stress is reached. This method is illustrated in Table 1 which lists the total number of applied cycles for each s(L) value.
The stresses, S(Lx, as found in Table 1, are then used in Eq. (5) to determine the corre- sponding allowable number of cycles, N..
Allowable Cycles and Total Damage In any interval of stress, where
SU<-S< Sk + Ak ■
it is assumed that sk may be used as the ref- erence stress to determine the allowable number
23

MOr-
290-
200 -
ü^v1*3 Mo-
se-
9 10 19 20 29 30 SilKSI) I 4 5 3 6 2 i
Fig. 8. Example relationship between An. and S.
TABI.E 1 Total Stress vs Number of Applied Cycles*
Increment, L No. of Applied Cycles, An(L) Total Stress, s(L) (ksi)
1
2
3
4
5
(2) (300-200) (103) = 200X103
(2) (200-150) (103) = lOOxlO3
(2) (150 - 100) (103) = 100x103
(2) (100-50) (lO3) = 100x103
(2)(50)(103) = 100x103
5
10 + 5 = 15
20+15 = 35
15 + 25 + 35 = 75
30 + 75 = 105
'Sec Fig. 7.
of cycles, as given in Eq. (5). By using the sub- scripts k, r, and i as before, and introducing the subscript L to denote the subincrements as illustrated in Table 1, Eq. (5) is written as
i w NkrLj MS,
(32)
The total damage per spectrum per sweep is then, from Eq. (7),
3 6 m+1 n / \
i*i t'i k'i t*\ ' \ > /
(33)
where
m is the number of nonresonant stress in- tensities.
n is the number of subincrements result- ing when the component stresses are summed, and
b is the slope of S-N curve (see Eq. (6)).
PROGRAMMING
The calculations indicated in this analysis were programmed, in Fortran IV, for the IBM 7040 digital computer. A flow chart of the pro- gram is shown in Fig. 9. A listing of the main program, with the subroutines SORT and SUM, is given in Appendix A. A sample problem based on the LEM Propulsion System/Thrust Chamber Assembly (PS/TCA) analysis [3] is given in Appendix B.
24

TO MIT Wf COW MC T I I I
I t_
(7) 1 ss1 liV^-L^Xi
NMT WiCTIIH <D
titii i n '•>.
ö ö
(a)
■ US
— emnit
FMk 1 — catrvt
camiTi Hl.,,! — coaniTt — coamirt
10»T Uta,!"»
MX TO MM ■
HM romt wnn l»SiL,l <D
O
COMFUTI cotmiTi 10,
f I
10, |.
1 s 0.. <?
WfITI OUTPUT
(b)
Fig. 9. (a) Fatigue program input-output flow chart, and (b) computation of damage
REFERENCES
1. Cyril M. Harris and C. E. Crede, Shock and Vibration Handbook, McGraw-Hill, New York, 1961
2. M. Pasyanos, Grumman Aircraft Engineer- ing Corp., Unpublished Memo., Dec. 1964
3. S. Fogelson, "Stress Analysis of the LEM PS/TCA RCS Cluster Mount," Marquardt Corp. Rept. L-1034, 14 March 1966
25

Appendix A
PROGRAM LISTING
5 i«C; i KbtLSi-fc ICC«-0v>-0116 FURTRAN SCUMCE LISI C9/26/66 Kh SüO«C£ SI»ltwtM
0 fIBfIC 1«» k PKCCKAK -MllCbt AIHAlVSIS.C.A.e.C. rElHCO C btfcO 19 *PftlLtlte6 C AMALVSIS AK3 PttCu<U»> «V S.FCCfcLSCN C
1 bIMENSIUM SSI».IO).VVkfi,iOI.SBSMi$.10I.NAHt2l«.tOI.N«niOI.Aei6. 210I.MKE3l«,lOI./ZRI10I.XXNSI10t.XXRI6.10l
2 OIKfNSICN *m.HI6.6.JI.FM6I.TIUEim.riUE2UI.IITL£3l«lt 2 XMI6I.S0Xi6.6I.S0VI«.6ltS0ZI6t6i.AKllTI.$F0XI6.|T,6ltSIUVI6.l7 3.6l,SF0/l6.1Tt«)tEK(itT«6.6l,EMVIl7,6.6I.EN<(l7.6.6l.0ELENXIIT,6.6 4).0tLENVII7.e«6l.l>ELEIlZU7.6.6i.««l6I.BI6I.CI6I.SUNMXi6.IT.6I.FS0X %U 7,6.61. SUM*l6. 1?.61,SUflk2l6.17*61.FSOTI 17,6.61 .FSUZI 17.6.61. 6fc0X(17,6.6l.ROVI17,6.6l.R0Zll7,6.6l.0EL00Xll7.C. .OELDOVI17.61. 70tLOOZI 17.61.SONOXI61.S0M>V(6I.S0N0ZI61.0011161.XXX161.XMI6I
3 oinEksiüN stsi.vNist.esimsi 4 UlPEKSICK XUI.TI*).Zi6l b REAL MCEZ.hRHES 6 SO REWCS.lOCITlTLEl.kPS.kCS.hMTS
12 IOC F0RN«fl4A6.2X.3l3i C C IIILEI* ASSEMBLY fcAOE. UPS« DO. OF PARTS TC BE CHECKED. NCS'NO. C OF LCAu CCMITIOMS. NPATS IS THE NUMBER OF DIFFERENT MATERIALS IN C THE ASSEPBLV C
13 lit REA0IS.12CIIIIHII.J,KI.J«1.6I.I-1.6I.K>1.3I 30 120 F0RMATI6F6.3I
C C HII.J.KI'PAGMFICATION FACTOR IN NCOE I.FOR A RESPONSE IN OIRfcCTI- C Oh J.TO AN INPUT LOAD FACTOR IN OIRECTIOK It C
31 REA0i;.13CMFNIII.1-1.61 36 130 FORMAT 16E12.61
C C fMI »«NATURAL FREwLENCV IK HCOE I C
37 i<fcAim,120IIXM|j)>j<1.6l C C XMIJI.J>I,3 ' ASSEMBLY DEICHT. XPIJt.J««.6 «IIXI,IIVI.IIZ I
26

3*c2 i tCCtLStN ISN
lCC*-CO-0Ufe SOURCe ST«fei>ENT
FCRIOAk SCUftCC Li SI 1402
112
S* Re*U().13»>m&(N.M.ft«l.SI.I»I.NH«TSI IS RE«UI%tl)iiHVVN|lt.f>.Mi#il.l»I.NDikTSI 46 RcAül%ii}5llla0SM^.I>ltl««l<i)tM«l,NMATSI 17 13» F0RIUTISE12.CI
C C SSN IS THE CKOIMTE OF Iht f«Tt:RI«L S-k CURVE C VVN IS THE ABSCISS* OF IHE PAfERUL S-N CUVE C ÜSSN IS THE SLCPE CF IHE MtTERIAL S-N CURVE C
ICO RE«OI5.l40MIMP£2fI.M>I.I«1.4i.MTINPI.NP'l,krSi 111 1*0 FORMAT(4A6t2X.m
kAPE2 IS THE MAMt OF THE PART BEING ANAUIEO. PAI IS THE NATERIAl CODE NUPBER
REAOI5.1)OII(ABIJ,kPi,J>l,6i,NP«l.kPSI ABIJ.KPI IS THE STRESS IkFlUENC*: COEFFICIENT FC« A RESPONSE IN DIRECTION J FOR PART MIMBER NP.
12) HfcAUlStlSOIIINAHEill,NCI.1*1.41.22RiNC>.XXNSIKC).NC*l.NCSi 134 ISO F0RMATI4A6.2X.F6.).2X.F«.9I
NAHtS IS THE NAME OF THE NCITHI CONDITION BEING CHECKED.
REA0IS.13CI(UXRII.NCI.I«1.6I«M>1.NCSI
XXKII.NCI IS THE 1KPUT CF NCOS I OURINC CONCITION NC.
146 CO 2000 NP«1.NPS 147 PsMATINP) 15C 00 155 I'1.4 151 155 TI?LE2II)«KAPE2II.^PI 153 CU 160 Ml,5 154 SIM'SSIK.Ht 155 VNINIoVVNIN.PI 116 Itf BSNINi*BBSNIN,M) 16C 00 165 J<1.6
133
34C^ I ffCttSCN UN
1C04-00-0136 SOURCE SIATEPENT
FORTRAN SCURCE LIST 3402 09/26/66
161 165 «IJI'ABIJ.KPI 163 üO 1UU0 NC'l.NCS U4 00 167 1 = 1.4 165 167 TITLE3II>«NAHE3II.KCi 167 2R*ZZRINCI 170 XNS'XXNSINCI 171 00 170 l«1.6 172 170 XRIII'XXRII.NCJ 174 00 180 I-1.6 175 OC 180 J-1.6 176 SDXII.JI«XR(IMH(I,Jtll*AIJI*XP(JI 177 S0YII.JMXRIII*HII.J.2I*AIJI«XMIJI 2CC IdC S02II.JI«XRn!*H(I.J.3l*A(Jt«XMIJI
C SCX.SOY.SUZ ARE PART STRESSES FOR LOACING IN X.Y.Z AXES ÜIRECTI0NS C C AK«PERCENT CF ("AXIPUP STRESS LEVEL C
2C3 AMIIM.C 2C4 00 192 N«2.5 205 192 AK|NI«AMN-1I-0.025 2C7 00 194 N«6.13 <10 IS4 AKINI«AKIN-1I-0.05C 212 OC 1V6 N>14,17 213 196 AKiN|«AKU-li-C.lC 215 00 200 J«l.t <U 00 200 IM.6 ill DO 200 N»1.17
C C SFOX.SFCV.fcTC.AHE MAX. STRESSES. FOR X.Y.ANC I LOADING.TIMES AX r
221 ill
SFOX(ItK,ji>AK(M*SCXII.JI SFOYII.N.JI-AKINMSOYII.J)
2CC SFU(I.fwJl«AMM«sa«I.JI
ENX.CNY.EN; AMt THE APPLIED CYCLES FUh X.Y.ANC 2-AXES LOADING.SUB- SCKIi'TS N'PERCENr LOADING I<MOUE J*fttSPONSt AXIS. I. t.. l^X-TRANSLA- T10N 2«V-T«ANSLAriCN 5»Y-AXIS ROTATIQS 6«Z-AXIS ROTATION
27

3*C< 2 FCttLSCK ISN
1CC*-00-OIJ6 SOUftLt SIATiHENT
rCHlKAK SCLRCE (.IST J402 09/26/66
?2e OC ICO I»lt6 ill «JixlU»Ui.«»FMI)»»KS//ft 2)0 SO 300 J«l,6 231 CQ 300 K>l.t? 23? i-HX '«KiKI*Hll,J,t) 233 FHV <*K(kl*hl I.J,2I 23« ^H2 «M(MI*Hll.J.3l 3ii H-«»<!Sl^nt).lt.UC»GO TC 225 240 tNTIN,l,J»-!i)iX(I l»SChHl.0-SCt«I(l.00***»(l.0-1.0/lfhr»»2»)n 241 CC IC 230 242 225 tMrlh.l.JIOXXIII 243 23C II-UBSIFH2I.IE.I.0ICO TC 250 246 EN2lk,I,JI'XXXIll*SU)tT(1.0-S:Kril.00444*II.C-1.0/lf-H2**2ll)l 247 CC TC 260 250 25C ENZIN.I.JI'XIXIII 251 260 IFUbSlfhXI.LE.l.CiGl) TC 270 <%4 EI«XIN,I,JI>XXXin*SgRTIl.O-S>.KTI1.0O444*ll.0-|.O/IFHX«*2nil 255 GO TO 300 kit 27C EKXlk.I.JI'XXXIII 257 3C0 CCMINUE
C C UtLEhXIN.I.JI'INCREfEKT OF ENX BETkEEM ft PERCEftT AftO 1N-1) PERCENT
263 CO 310 IM.6 264 00 310 J«l,6 265 OELEkXIl.l.JI'ENXll.l.Jl 266 Utltkril.l.JI'fcNYIl.l.JI 267 i)ELEK2il.I.JI*ENZIl.l.JI 270 00 310 K'2.17 /7I utLEKXCK.I.Jl'EftXIN.I.JI-trNXIft-I.I.JI 772 OELEhVlft.l.JI'ENVIN.I.Ji-EKYIft-l.l.JI 27J 310 OELEhZIK.l.JI*EN2IK.I,Jl-EN2IN-l.l,Jl
C C SUHNX'TCTAL hC. CF TIPES * PAHTtCULAR STRESS LEVEL IS APPLIED DUE C LOAÜIKG ON X-AXIS,AI K I CF MAX.,IN NCOi I. C FSCX«STRESS LtVtL APPLIEC SLiPftX TIMES CUE TC X-LCAulNt> C
3402 FCtELSC« 1004-00-0130 ISN SOURCc STAItHtNT
ill UO 322 IM.6 300 CC 322 KM.6 301 ÖÜ 322 KM.6 302 SLPNXlK.h.l)<U.0 30 3 SüPi*¥ix,N,n»o.o 3C4 SUPft2<K.ft.ll<0.0 305 FSÜXIN.K.II'C.O 306 FSUVIN.K.D'O.O 307 FSüZIN.K.II'O.O 210 322 CLNTIME 314 OC 400 ft<l.l7 J15 OC 400 Mi.6 316 DC 320 JM.6 3U AAIJ)«OkLENXlft.I,J) i20 320 BIJIMFOXI I.lk.JI 322 CALL SCRTIAA.B.fcl 3i3 CALL SUN|AA.e.C.6.JX X.Y.Z) 3i4 OC 340 K'l.JX 325 bUFNX(H,N,It'XIKI 326 FSOXIN.K.II'YIK) 327 34C CCNTINUE 331 00 350 J*l,6 332 AA(JI>OELENYlN.I,Ji 333 350 äUl'SFOYlI.K.J) 335 CALL SCHTIAA.t>.6l 336 CALL SUMIAA.H.C.ö.JY X.Y.2I 337 UU 37U KM.JY J4C SCHNYIK.N.D'XIK) 541 FSOYIN.K.II'YIKI 342 37C CCNTIMLE 344 OC 380 JM.6 345 AA(J)'UELbNm.l.J) 34b 360 BIJ» = SF02II.K..JI ibC CALL SCrtrUA.e.bl )bl LALL S0H(AA,ä.C.6.J2< X.Y.I) 352 OC m KM,J2 Ji3 Sl-fNifK.N.Il'KUl 354 FSWIN.K.II'VtKI
FL'KTRAN SOURCE LIST 3402 09/26/66
28

J<iW i l^fCtliCN ICC*-J(J-01i6 fChlKAN SCURCE 11ST 3*02 09/?6/*« ISN SUCACt SIAIi^tM
?ii 3SS CONIINtE JSr 4JC CLNTINUf
C t NUXIN.K.I I'MKlPftCCM. CF ALLCMAdlt CVCLtS ■»-EN X-MIS IS LUAOtO.At C N PEftCEM Lu«OING CCKRE SPCKUINb TO THE KCIHI STRESS LtVfl.IN «CUf C I. C
3t? DC 6CC 1-1,6 it} DC 6CC N'1,17 3*4 >iO S30 K'1,6 »45 IFIABSifSOMN.K.ni.Lf.SIIIICL TO «20 3TC ROXIK,R,n<l.0/VKIll 311 OC TC «30 37? <>;C IEMHSIFSLiXIK.ll,III.LI.SI3liCC TC «21 it'» KOXIN.K,! I<IIF>ÜXIN.K,||/SI2II**BSK(1II/Vftl2l 376 tC TC «30 377 «<l IFIAl»SiFSUXIN.K,Ilt.LT.SI«l)liC TC «22 «02 MUXlN.K.I I«IIFS0X|N,K.I|/SI3II**6SM3H/VNI3I «C3 CC »0 «30 «0« «22 IFIABSIFSOXIK.K.III.IT.SISIIGC TC «2% «0 7 KOXl N.K.I 1*1 fFSUXIN,K,ll/SI«ll**aSKI«n/VN(«l «10 CC TC «30 «II «25 tCDxIN.R.II'O.O «12 «30 CCMINUE «1« 00 «SO K'1,6 «IS IFIAaSIFSOVIN.K.III.LT.SIlllCC TC ««0 «2U «OtIN.K.I »«1.0/VNUI «21 GC TO «50 «22 ««0 l'l*dSIFS0VIN.K,lll.lT.SI3llSC TC ««I «25 RUrlN,K.II<l|FS0YlN.K.II/SI2l)*«aSMlil/VNI2l «26 CO TC «50 «27 ««1 IrlAlJSIFSbVIN.K,l)I.Ll.SI«IICC (C ««2 «32 «l)T(N,K,Il«UFSOY(N,K,l J/SI3n»»BiM3n/VNl:J. «33 CO TC «50 «J« ««2 IMAdSIFSuriN.K.lM.LT.SISilGC 'TC ««5 «37 RUH KtK.I ><((FSOr<K.K.II/SI«lt**SSNI«li/VNI«l ««C GC TC «50 ««1 ««5 ftuTIN.K.It'O.C
3«0< 2 FCCtLSCN 100«-00-Ol36 FCRTRAN SOURCE LIST 3«02 09/26/66 ISN SCURLt STATEMENT
««2 «50 CONTINUE ««« DC «70 K'1,6 ««5 IHABSIFSbiZIN.K.IIJ.LT.SmiGC TÜ «60 «50 R0ZiN.K,l)>1.0/VN<ll «51 GC TC «70 «52 «60 IFiABSIFS02<N.K.Itl.LT.SI3IIGO TO «61 «55 Rü2IN,K,I)'l<FS0Z(N.K.II/SI2ll**BSMIil/VNI2l «5b GO TC «70 «57 «61 IFIABSIFSU2lN.KtIII.LT.SI«IIGC TC «62 «62 R0Z(N.K.II*MFSOZIN,K.II/$l3ll**BSM3li/VNt3l «63 CC TO «7C «6« «62 IF(A9SIFS02IN,K,III.LT.SISHC0 TO «65 «67 RDZIN.K.n«! (FSUZU.K. ! I/S{«l }**BSN(«I }/VN(«l «7C GC TO «70 «71 «65 RDZIN,K,ll<0.0 «72 «7C CLNTINUE «7« 60C CONTINUE
C C 0ELO0XIK,)TCT«L PART CAPACE FCM X-AXIS LOADING.AT N PfcRCtNI OF C MCüE I. C
«77 CU 650 1*1,6 500 JO 650 N«1.I7 5C1 0ELO0XIN,U<C.O 5C2 0£LOOriN,II>0.0 5C3 LELJUZIN,II«0.0 5t« DO 650 K>1,6 5C5 OELDDX(N.II«CELOOXIN,II*ROX|N.K,ll*SUf<NXIK,K.II 5C6 OELODrlN.II>OELUOy(N.II«RurIN,K,ll*SUmviK.N.II SC7 0£LOCZ(N.I)>CELOOZIN.II«ROZtK.K,ll*SUnNZIK.N.I) 510 650 CLNTINUE
C C SUMUXIII'TOTAL PART DAMAGE IN MODE 1 FOR X-AXIS LOADING. C
51« CO 675 I>1,6 515 SuMUXdl'O.O *16 SUMDY(ll«0.0 517 SOMOZIII'O.O
29

3*^ 2 fXCtLSCft lC0*-0ü-ülJ6 FC*1l«Ah SOURCE LISI 1*02 09'.6/66 IS». SUUKCE SIATkKENI
5iC JC bTi Ml.IT £21 SOMOC. i I* &ON0KI II •GlL00lllt.il bdi SOMDViII'&OPCYill*OfLOOTIK.11 Si 3 SUNJZ III« St/HCZ I i I «Utl. '.-'m , II 52* tT5 COMIKtt
c C OtX« ICTAL PART C«X««.E VUt TC X-AXIS ICALINC. UHKINC THt HOUAl C UAHAbE. C
52? COx-U.O 530 UOY>0.0 531 CD2»0.0 532 00 700 l»l,4 533 CCX<C0X«SOMOXIII 53* CCV«dOV*SO*>OYIIi 575 002'OüZ*SOHUZil} 53t. 7J0 CLKflKUt
C C COt'lli« TOTAL PART CAHACE PER MODE, SUPHINb THE LCAO AXIS DAMAGE. C
:*C UC 710 i<1.6 5*1 OOHdl'C.O 5*2 710 CCMTINUE 5** DC 720 1-1.6 5*5 OCMII l«OOMI I t»SOPC«l I MSCMCTII l*S0M02111 5*6 720 CONTINUE
C C DO« TOTAL OF ALL PART CAPAGE OUE TC SPECTRUM. C
550 O0'OUX*0OV*I)CZ 551 ■RITEI6.800ITIUEI.TITLE2 552 dUC FGRMAIIlHl.*7X,*At/51X,16HFATIbUE ANALVSIS/*7X,*A6/52X.1*HFATIGUE
2 DAMAGE /t 553 ■RITEi6.l'C5WR.4NS 55* 805 FüRMATMX.ilHSMEEP RATE*.F5.2.iax. 3HNUHBER OF SWEEPS (UP AHO OOMN
2)«>F5.2 /I 555 ■•RITEI6.lilC>TITLE3.(PC0E.PC0E'1.6l 562 810 FUMMATI/*TXt*A6///57X,*hPC0t/3X,7HLCAOING/*X.*HAXlS.6I12.1lX.)HSUM
3*C2 2 »^CtLStK ICC*-CO-01S6 FCRTKAK SCliRCE LIST 3*02 09/26/66 ISK SOURCE STATEMENT
21 St3 MRITtl6.e2ül<ISOM0Xlll.l<l,6).0OXI 57* 820 FORMAT(6X.lHX,TX.7E12.3 ft 5 75 aKlTCI6.830MISOP0YII I . I < I .61 .OOYI tC6 tJO >:0MM*TI6X.1HY>7X.7E12.3 /I tC7 MR ITE16.8*0111SOPOlI It.'':.^■,0011 62C 8*0 FOHP*II6»,lM7,7X,7El2.i /) 621 «t«ITtl6,ä50M«UüK( 11, l»l ,o) ,ÜC) 632 b50 F0RM*TI/5X.3HSUP.6X,7Et2.i/lH-l 633 1000 CONTINUE 635 2CCC CONTINUE 637 GO TO 50 6*C ENO
i<.C2 2 FfttLScN ICC*-0C-0136 FCK ISN SOLRCE SIATfcPENT
0 »ISFTC SCHT SUSMCUTINE SCRUA.e.NI UIPENSICN Al 11.Bill OC 1000 1*2.N JL 1000 J«2.I JJ=I*2-J IFIAUJ-II.ÜE.AIJJII GC TC 1000 AOUMAUJI BCUP'BIJJi AIJJI'AIJJ-II BIJJt'BIJJ-ll »( JJ-1I«ADUM eiJJ-l»=30UM
ICüO CCNTINUE KETUMN ENO
FCKTHAN SCURCE LIST C9/26/66
30

I'.C^; 2 fLULSCr. ISN
lCC*-00-01i6 bCuMCE SiAftFfM
rCATHAN SCL^Ct lIST C4/?6/66
0 »!t:l-lt SLH 1 SLSButrUt SLH(»,rt,C.»,JC.<,r,2» ^ JIKEKSICN «iii.eiii.ciii.Jiin.nii./iii 3 MIMAIU <• T(ii»B(n 5 /lll'CIII 6 JC»I 7 DC 2000 X'l.h
IC IFI«ll-II.EC.«tIII CC IC 1000 U JC«JC«1 14 MJCi'AIII \b riJL)«tijc-ll*dlli U ZIJC)'/IJC-1I*CIII 17 GC IC 2000 ;c icco viJU'ViJCMBni i\ iiJC»«2tJCI*C(ll t7 2000 CCMIM/E 2« HEIUKN 25 tKD
IBM 7040 INPUT FORM - 80 COLUMN rO«M TMC tMt •€« >-•
psar ICKTCwilO« BIW: [»SOT
J_ 1 } .^ } Lota. -sn
12 3 « 5t » iVun 17U14B Kim ii0);i2?z»2»me»3i33»zs ^p^gjS^^^^^^^S^^^Mi^^^^OT nv^iOrMifk
1(111 TITLE I
i i i i i Hd.l.l) H(I.3,1) t 1 ' ' i I I 1 t i ■* 1 1 t -
MPS MCS ?s Md.«, I) i i i i i
i i i i i i i i i ^i_'
i i i i i i
i i i i i i
-L 1 I 1 I 1 I
I I » t t I I A I i i I i i t I 1 t
X 1 I I I t
■■'■■' I 1 1 I I I I I I * II CARDS.
i i i i « i i i i < i i , AMPLIFICATION FACTORS
i i i i i > i i i i i i i i i i i i i i i i
i i i i i i i i i i I i i i i i i I i i I i i i < i i i i i i H(«,1.3) H(4,2,3) H(«,3,3) M(6.4,3)
I I I H (6,5,3) I I I i I.
H (6,6,3) i i i t i i i i i | | ■'■■■■ '
i i I i i i i i i FK(I) FM(2)
« ' * ■ ■ i ■ ' ' ' '
mm i > i 11
FMM) fHd) FN(6)
WEICHT •'. •'. •'., WEICHT t WEIGHT MOMENTS OF INERTIAS I i I r I i i i 1 I I I 1 I I 1 I ■ ' ' ■ i ' ' '
SSd.I) iiii
ssa.i) ■ 11111 11
»(3.1) '■ii'
T i i ) i
SS(4,t) i i i i i i i i i i
SS(5,I) i i II i i i
NMATS CARDS i i I i i i I i i i 1 J-t-
i i ■ i i i i i i i i i, i ,i t i i i ■ i ' ' ' i ' OROtNATES OF S-N
■ i i I I i i i SSd.M) SSQ.M)
i i i SS(3,M)
i i i 1 i 1 i i i SS(4.M)
i ' i i i i i ' ' ' ' SS(5,Mi
I I i i i i i CURVES
i i i I i i ' i i ' i ' i i WH(I,))
i I I I i I i i I I i i I I i I i ■ ' i ' ' i ' i i i i r-Li i i i i WN(S,J)
'■■'■■ |
i i i i i i i i ■ ' ' i i ' i i ' I I I I i i i i i i t,
NM/TS CARDS i-i I I I
AISCISSAS 0 I I 1 I I
S-N CURVES ■ ■■■■'■ | ■
-J-I i i i i i i i i i i-t i i I I | ' | i | | ' ' WN (5,M)
I I I I 1 I I CURVES ■■■■■■ ■ '■'■■ii'
MSN (1,1)
-i-i-
■ i ■ ■ ■ i ■ ■ ■ ■ i I I I i i. i I I I 1 I (5.1)
I i i i i i I NMATS CARDS ■■■■■■
'''■■i'''' i i i I i i i i -t I I t 4 I i SLOPES OF Mil
a_i-i-l I i i I I m
11 11 i i C>SN(I,M)
■'■■'■■'■ I I 1 I I I > I I I I MSN(S.M)
I i i i I. I I CURVES
i I I i i i ■ ■■■■■'■■ NAME 2
IIII MAT NFS CARDS
I I I i I i I i i At d.D i i i I i i i I i I I i.i I I I I I I I I I 1 I I i i I I I i
■ ' ' ■*' ' '
Al'AD ■ i > i i i
I NFS CARDS Ii I i i i I
i i i i i i i i i i '''''■■I'' i I i i i i x STRESS
At(I.NF) -i i i i i i i i i i i I i i i I
AB{6, MF) COEFF. -LJ I I I I I I I
NAME 3(1) * ' ■ ' ■ ' i i ' ' ' ' i i t i i i i
IZR(l) i i i i i
XXNSd) i 1 1.1 I. i I I i i i I i I i i
■ i ■ ^ I ' ' ' | ■ | ■ ■ | | | ' NCS CARDS ■ * ■ ' I ■ ■ ■ ■ | | ' ■ | ■ ■■■■■■■ |
NAME3(NC) ■ ' ■ ■ ■ ■ | ■ ■ ■ ■ ■
7.ZR(NC) XXNS (NC) I I I I I 1"! I I I I I I I I I I I I ''''■'''■
■ i i i i '''''''''''■'■'''''■'■''''' i ' ■ '■■ i '''■ i '' ' i
i' ''■' i ''■■''■'■■'■'■■ ■''ll '''''■' i ''■ i i '' i '' I ' '
1 > I I I I I
I II.
I I I I I I I I I
I I I I IJ, XJ_ JmimLJJL.
31

IM 7040 INPUT FORM • 80 COLUMN
EU US. 'M ESa !«•« Jl.»l»i.6« jBi»T. ]».ui
i 2 o, 2
1 ? 3 4 5-t 7 U 9t! iroi41b»17MlWn2?2»B»77Jia(MI3n«»iniP«««0<«<MM7««^ ^7»)« |
1 "•«.!) | XX« (6.1) i i , i i i i i i i » X J i. i. J-JL t i j
NC CAIDS A i IMPUT LOADING
1 XKI(I.NC) XXR («.MC) . i I 1 i ■ ■ 1 1 1 1 > 4 & i t i
1 t 1 1 | 1 1
* 1 ............. 1 ........... 1 . . . . 1 ^ | . 1 ! . 1 1 1 I 1 1 1 . j | | ! | I ' > • 1 > • • ■ > ■ >
, ' 1 1 i • ■ • • • 1 ■ > . ■ 1 1 1 1 . . 1 1 1 . . . ■ 1 1 i 1 1 1 • 1 1 i 1 1 j 1 : ^ f l | | l l l l I i | | . 1 . > > ■ i • < > >
^ ''''*'''' 1 '* i ■ '■*''''' ' i-i-i-i-i i i 1 i i i i 1 i i i i i i t i i i i i i i i i i i i i i 1 i 1 J-i 1 I 1 I 1 I 1
Appendix B
EXAMPLE PROBLEM
This analysis was conducted on the LEM PS/TCA, Reaction Control System aft engine support structure. In this structure, static stress analysis indicated that the most highly stressed points were on adjacent pieces of structure loaded simultaneously by a single bolt. While the stress of one of the parts was only 94 percent of the stress in the other part, they were of different materials and, therefore, both were analyzed. A schematic of this as- sembly, with the critical loading, is shown in Fig. B-l.
MAGNIFICATION FACTORS
Since the inpvit is applied sequentially along each of the three reference axes, three matrices
of magnification factors result, one for each axis of loading:
X-Axis Loading
+2.£9 -0.52 +0.46 -0.33 -0.13 -0.09
1.10 -1.17 0.76 0.73 -1.12 -0.74
+1.65 +2.40 -2.77 -0.63 +0.36 +0.31
2.70 -0.81 1.71 0.25 0.99 0.63
+0.31 -0.15 -0.14 - +0.04 -0.03
0.21 0.12 0.07 - 0.03 -0.05
!Hrili
32

■J TUK (221* TtSlO)
Fig. B-l. Schematic of LEM PS/TCA cluster mount
Y-Axis Loading
f«ri2J =
-0.52 2.43 -1.86 1.42 0.07 0.08
-1.17 +1.02 -0.20 -0'.38 +0.12 +0.08
+2.40 +4.32 -4.84 -1.10 +0.20 +0.33
-0.80 +0.50 -1.79 -0.18 -0.30 -0.20
-0.13 6.37 6.03 -0.11 -0.66 0.68
0.10 2.87 1.88 -0.10 0.60 -0.99
Z-Axis Loading
[H ri3J
+0.46 -1.86 +2.24 -1.32 -0.06 -0.07
0.76 -0.20 1.18 0.37 -0.08 -0.05
-2.77 -4.85 5.84 1.29 -0.24 -0.38
1.72 -1.79 1.46 0.29 0.66 0.43
-0.13 6.03 5.70 -0.11 -0.63 0.65
0.06 1.88 1.60 -0.06 0.35 -0.58
NATURAL FREQUENCIES
The six calculated modal frequencies are listed below.
Mode Fn (cps) Mode Fn (cps)
1 57.1 4 113.3
2 69.6 5 173.6
3 96.7 6 200.8
MASS MATRIX
In this problem, the input spectra are in units of g. The mass matrix is, therefore, written in terms of the cluster weight and weight moments of inertia:
W = 25 lb,
lx = 318 psi,
ly = 592 psi, and
and
N
lz = 591 psi.
25
25
25
318
592
591
33

r-
STRESS COEFFICIENT MATRIX
A static stress analysis yielded the follow- ing stress coefficient matrices for the two parts (see Eq. (26)):
-15 Spacer
Ü.1339
•14.6
0.3842
18.86
1.653
2.423
-3 Tube
0.1258
-13.71
0.3608
17.71
1.55
2.275
INPUT SPECTRA
Three sinusoidal spectra, shown in Fig. B-2, are applied sequentially in x-, y-, and z-axis directions. These spectra are logarith- mically swept at the rates, and for the number of times, shown in Table B-l.
LOAD FACTOR 9-
(6-Sl
u MFOCMCf
—I 1 -T—■ 1 t I LSP llO-iaMNMOiKNT J. TMU VI
i i i i i l
1 i i t i
UtMCtt MO MMT .
/I i •'"
(/ tr* CIHJCMT
£fc0 / /
i s s ! / >
s / / r , > <r
n f s i /
IUUM EXCUUMW 1 1
7 ■ a 100 200 300
ricpsi 400 900
Fig. B-2. Sinusoidally applied load factors qualification test
TABLE B-l
Spec- trum Condition
Sweep Rate
(octaves/ min)
No. of Sweeps Up and Down
1
2
3
Launch and boost
Space flight
Lunar excursion
3
1.5
0.5
2
2
2
DATA SHEETS
Completed data input sheets are shown In Fig. B-3.
RESULTS
The damage resulting from the three load- ing conditions for the -15 spacer and the -3 tube are shown in the following printout. The total damage for the -3 tube is
D = 0.01925 + 0.00104 + 0.00002 = 0.02031,
and for the -15 spacer,
D = 0.04758 + 0.00197 + 0.00004 = 0.04959.
I
34

IBM 7040 INPUT FORM 80 COLUMN 'txm THC IM* •
ZiOZ Tsram— s.WiLse*
WmSBtm BfPT. —pm 1
iij?J|4S«|7l ,^^i^^#M^#
ten rs/ru A/r CL^T^ 2.3..^ i i I-J ■ i i J-l J j /
.2..^. rP.-Fl. P.-Xk rP..>y rP..*\ rfisfil i i.i. i X-i. 1
.i..fl.. r.i.'J.l. J0..U. . A.P.I -I...I1 rA'.l* •. • i. 111 J ■ .!
.l..jtS.. ZA . -2...77. rA.Al. A.M . /-A« 1_J i i 1 1 1 1 1 1 i i a i I i i_u <
Z..7 . rt..Mi.. J..M . A.M.. A-M . P,-t? 1 i i 1 1 J I 1 i 1 1 I1
P..XK rfi.JZ r*..M A-M rA'fi.1 ■ i ii 1 ..< A-zi.. A.'.*.. fi.-P.l *.-*?. r.*, *fi i i i i I . 1 .7 -P.-??.. 2...V. rJ.'A'.. J.'M . A-Al. P..P* i ■ i a f | 1 J -J.-JX . J.P.'. rP.-t.. rP.-M . A-M . P,.pe. ,,,,., 1
t..Al. .f •.« -f...«*. r./.-y... .^... PM .'." ^.Ä .. Ä./. .-/.-.^ r^..^ rA.f . .-?.-.* J-J-J • i i i i i 1 ,/,! ^•.'.3.. .f ..i7.. /...^. -<•./.'. .^../A . PsM i i i i ■ i ill 1 .'.2
PsJA. Ml. J.'M r*,.'... P.-A . rPstt < « U! 1 • ■ ( i 1 ./^ A-M. rL-BP.. l-X*. rJ..?* rA.PA rP.-fi.l I I i i i I I 1 i 1 1 1 I I 1 1 I'I4
Ä..7>. rP..M . J,M,. fi.-M rP.-P* rP.-P/. 1 ■M '.1:7.1 r.i.fr.. f.-A*.. J.-tf. rP.-tf. rP.-M .'.f J.-M ri...V.. J,.*.'.. P..M.. P.M . P,..V. ,/,> 'P.'J*. ß.-PA . ?.'?.». rP.-JJ. rP.-t?.. f.-tf...... Li,.,, iV ASA . .K'ßß., JAP. rP.-PA . P.-}?. .'.'.'&. i i i i i i i i i 1 .M ^•./. M-A ^.7. /./.J...5, ... JXK-k ^ cp.3y i . .V Z*..jl>..?JjB..p.fK.fi.™j.-A. , 1 i 1 1 L 1 i^1
t.'A.... W?.'*.\... fMt.'P +P*t..J.. fP<\ I'fi.. . . fPfl 1 .V 4.-P. .... .^, .5/*^ ,. **. t.'7 /*< Z-JA _i J_- .^, I-?.* . . .^. ?,**.... tph },A .... fp?. J,P. m. J,P.. HP. J.-P.. . . tPf. i I»]''
l.ff6l,,tp>l'A....m.X.P....W.t.A. ,^7, J.-P.. . , M LJ_ UJL
Fig. B-3(a). Completed data input sheet»
35

IBM 7040 INPUT FORM - 80 COLUMN ramm IMC iwt •»». >-M bU'UK mum fsiBi cmsiias SIWT: FIST'
j 2 or ^n 4 S|IM .*w#s# *m¥m¥m*m*wm^m*mm'*< ̂k^f^mp^VK,%p n n i
1 Ä-fAK .... ..Z-fAi....... «.-.tV... 1^. 7^2 i i i i j i i * > i i i i
^. o
?.ßU 7..Ä^ .. M.W. .. i^.^ir O.O
ris sfAte.*.. . l
'.sjyßß. 2 i i l | i i i i i i i ■ i i i j i i i i t i i i 1 1 1 1 1 1 1 1 1 1 1
'W. -U.-t .. .-Attf ... ... M-erx.., .,^,^^7.., , « . .2 ^/ . .U5Ä -U..7.J .. ..HPA .,. .., 17...7U .,, . .i^a... M.iZl VA . . . MuACH AW flA'tf. ., >-A. . ■ . .2...0
. .5^.^ KM*?...... i.'?.. ... ^' 1 1 1 i 1 1 1 1 1 1 i
i i i tm* mmw.... ^.-.f. ... .?•* ?t'A ' Z'X ..A'5: ...^..r, , . ,3,.,* l s , ,3,. X. k? 2...^ .. .2.^ ... .2.'^ ,,.<•/, . . . ^ /. fr? I'P. 2.0 ^'* 7.«' . . . Ä ,*.
i i i i i i i i i i i i i i i i i
,,.,,,,..,, i i i i i i i i i i i i i I I I i 1 1 I I I I I i i i i i i i i i t i i i t i i i
• i i i i • i i i i i i i i i i i i i
■ i ■ ■ i i • i • ■ i ■ i ■ i ■ i i i
i i i i i > i i i i i i i I I I i I i i I i 1 i i i i i i i i i i i i i i i i i i
i i i i i i i i i i i i i i i i i
> i i i i i i i i i i i i i i i i i l t ■ i i i i i i i i i i i i i i i
Fig. B-3(b). Completed data input sheets
36

Hi' fs/rc« AH ciusu« HU(JJI «iMLYSIS
-i TUHt f*riG'Jt UAMAuE
i«ctP K-Ii= '.cC NOXokR CF SäCEPS (tP »SU OCiiM= 2.10
LAUNCH »KJ BOCS»
ILACINL MCüt
axis a
1 c. c.
4 0.
5 0.
6 0.
SUH
If C.t'i'it-Ci C. C.148f-02 0. 0. 0. 0.S81E-02 i C.Jfet-ti 0. C.566t-02 0- 0. 0. 0.<)«2E-02
SU« V..UU-CI C.iilE-C« 0.7l*E-ü2 0. 0. 0. 0.193E-01
U» Pb/IC« AH CLuSrtR FAIIuUf i.ALYSIS
-? TUBE FATIGUF JAKACt
S«ttP »-Alt^ l.bC KUHUEH tF ihEtPi (LF «Ku DCIIM = ?.30
SPALE HIGt-r
tCAclNG HtUE
AXIS *
1 C.
2 C.221E-0*
3 c.
4 0.
5 0.
6 0.
SUM 0.221E-CH v C.^CC-CJ 0. C.5S1E-0* c. 0. 0. 0.5<;<;E-03
i C.UHt-Oi c. 0.2b4E-C3 u. 0. 0. 0.422E-03
SUK C.t7fl£-C3 C.2aE-C<. 0.3'.3E-C3 0. 0. 0. 0.1C<.fc-02
Ley PS/TCA AH CLUSIEK EAtlCUt A.JALrSIS
-3 TUBE l-AtlCUt ^AMACt
b«ttP «AIM C.f>C ^L^bH< Cf ShSEPS ILP AND UChM= 2.0^
LUNAR EXCUKSICN
CACISG MODE
AXIS »
1 c.
c. c.
2 .2ilE- -C* c,
c.
3 0.
0.
0.
0.
6 0.
0.
0,
0.
SUM .221E- -0*
/ c. 0. 0. 162E- ■O1) 0. 0. 0. 0. 162E- 05
SOK c. c. 221E- C* 0. 162E- -05 Ü. 0. 0. 0. 237E- ■0*
37

iolU" «Alt' 3.CO
It« PS/IC* AM ClUSIf" fATIUUt ANALrSIS
-1% SPACE« FAT^GUt SiAMAGc
K^StH CF S-ffPS UP AKu OtxM* 2.00
LAUSCH AKJ BCCSr
ICACINu
SU*
C.
HCC
2 3 C.27U-C4 C.
C.iCoE-Cl C.
C-S*J€-C? 0.
C.39U-02 0.
0.U5E-C1 0.
C.3CU-C1 C.27U-t* C.U<it-Cl 0.
0. 6
0. SUM
0.271E-0*
0. 0. 0.246E-01
0. 0. 0.230fc-0l
0. 0. 0.*76E-01
SactP RAU« 1.5C
IEP PS/tCA AH CLUSTER FATlCft 4NALfSIS
-15 SPACt« FATIGUE JAPAGfc
KbKfcfcK CF SaEEi'S (UP AND OChSi* 2.00
SPACt FLIGHT
HCDfc LLACIKG
AXIS X c.
2 C.271E-C*
3 C. 0.
5 0.
6 0.
SUM 0.77IE-0*
♦ Ü.ei2E-01 C. C.I66t-03 0. 0. 0. 0.<:78t-03
/ C.S^Tfc-OJ 0. 0.«nE-03 0. 0. 0. 0.96tF-a3
set- C.lit£-C2 C.27It-C* C.580E-03 0. 0. 0. 0.1S7E-02
i«£tP KATt» C.50
L,:H PS/TCA AFT CLUSTER FAIICUt ANALYSIS
-15 SPACER FATIGUE DAHAGt
KCPCtx Li- SufctPS IliP ANu L.ühM= 2.0U
LONAR tXCURSICN
PCDE LCALH.C i»IS
X c.
y c.
i c.
SO»
0.27lt-C4 C. 0.
0. C. 0.
C. 0.16SE-0* 0.
C.^7lt-C* C.lfeSE-0« C.
5 0.
6 0.
SUM 0.27!l:-0*
0. 0. 0.
0. 0. O.ltSE-0*
0. 0. 0.«*CE-0*
38

DISCUSSION
Mr. Holland (Allied Research Associate s): Fatigue damage is sensitive to the response amplitude, and you have determined damping analytically. Have you tried to find the effect different values derived from the damping ma- trix have on the cumulative fatigue damage?
Mr. Fogelson: The greater the damping, of course, the lower would be the applied stress and, therefore, the damage would be less.
Mr. Holland: How sensitive is it to this matrix? Since it is analytically determined, would small errors create a large difference in response?
Mr. Fogelson: We haven't found that. We aoplied various damping ratios differing by as much as 10 percent, and the difference was less than 10 percent, less thai, a 1:1 relationship.
Mr. Holland: What is your damping ratio?
Mr. Fogelson: We use 10 percent.
Mr. Holland: What is the critical damping; is it modal damping?
Mr. Fogelson: Yes.
Mr. Bratkowski (Westinghouse Research Laboratories): How were you measuring modal damping? This has been a problem for most dynamicists in the past, but it seems that you have solved it.
Mf. Fogelson: I haven't solved the prob- lem. The program has been used only in the design and analysis stage in which we have as- sumed a certain amount of modal damping. We have run a test on the system, but the data are not yet reduced.
Mr. Bratkowski: How have you correlated the results of your theory and experimental re- sults as far as damage is concerned ?
Mr. Fogelson: That, too, is waiting for completion of the test now under way.
Mr. DiTaranto (PMC Colleges): Why were you using each of the three stresses at a point individually, instead of the combined stresses?
Mr. Fogelson: I did not make myself clear. I do combine the stresses. There are six stress
components, one for each response direction. But I combine them based on the number of times each of these stress levels is applied. The stress level with the greatest number of cycles is used only for the number of cycles that it is applied minus the number of cycles that the next greatest stress is applied. Then the next two stresses are added together to get a new total stress which is applied only for the difference in the number of times these stresses are applied. All stresses are finally added to- gether, but only for the minimum number of cycles.
Mr. DiTaranto: These are not added linearly?
Mr. Fogelson: Yes, they are.
Mr. DiTaranto: Rather than using a more circular approach ?
Mr. Fogelson: No, because this stress was uniaxial and, therefore, the individual stress components, since they were all acting in the same direction, were added linearly.
Mr. Ip (Aerospace Corp.): Miner's hypoth- esis is based on a simple fatigue test. Is there any question of how well it applies to three- dimensional fatigue ?
Mr. Fogelson: I cannot answer that.
Mr. Stallard (AVCO Corp.): A test was run about ten years ago using random vibration as the load on pieces of metal. This again ap- proaches the idealized test. By performing that test using Miner's hypothesis of 1 (n/N) equal to 1, we found that 2 (n/N) varied between 3/10 and 5 and 6, which makes me wonder aI>out this test. Of course, you are using sinusoidal rather than random vibration. In the last two or three years, most of the papers in the Shock and Vi- bration Bulletins Indicated that Miner's I (n/N) ratio holds for a sinusoidal flexing load pro- duced by a small round beam with a wheel in the center and a weight hanging on the end of it. However, 2 (n/N) is not equal to 1 fof random loading; It varies over a wide range. I am sure that anyone else in this audience who has seen this type of test has found the same answer.
Mr. Rubin (Aerospace Corp.): This is very true. I think a paper was presented a few weeks ago at a Society of Automotive Engineers'
39

r
meeting which pointed out that the choice of the criterion of failure will affect the result. For example, if you define a 1 percent change in the natural frequency as failure for a small beam specimen, you will get one result. If you then
want to call failure a 2 percent change in the natural frequency, you will get an entirely dif- ferent result. So your failure criterion is also very important in establishing the exact fatigue hypothesis.
40

ANALYSIS OF VIBRATION DISTRIBUTIONS IN COMPLEX STRUCTURES
Eric E. Ungar Bolt Beranek and Newman Inc.
Cambridge, Massachusetts
and
Terry D. Scharton Bolt Beranek and Newman Inc.
Van Nuys, Califcrnia
This paper is intended to serve as an introduction to the "statistical energy analysis", approach, which provides one with a relatively simple means for understanding and estimating the most significant properties of multi-modal random vibrations of complex structures. The theoret- ical basis for this approach is summarized, some insights resulting from its use are presented, and some applications of it to spacecraft vibration analysis and testing are discussed.
E. E. Ungar
INTRODUCTION
Recent technological trends have brought with them more powerful sources of high- frequency random vibrations, and simultane- ously have led to lighter, smaller, and more delicate structures and equipments which are susceptible to damage from such vibrations. As these trends have developed, vibration ana- lysts have found that the various techniques that served them so well in the low-frequency domain (near the fundamental resonances) could not deal realistically with high-frequency problems.
To be sure, the time-honored classical analysis techniques are also theoretically valid for high frequencies; however, one encounters difficulties in their application to practical problems. The classical techniques generally involve determination of the lowest few mode
shapes, calculation of the response of each mode to a prescribed excitation, and superpo- sition of these responses to obtain the total re- sponse. Since only the lowest few modes re- spond significantly to low-frequency excitation, computations based only on these modes uffice for low-frequency analyses. This is not the case for broadband high-frequency excitations.
In analyzing the responses to high-frequency excitations, particularly where the excitations have broad frequency band spectra, one finds that one mufit take infoaccount a large number of modes. Determination of all of these mode shapes, of tho associated natural frequencies, and of the modal responses generally requires an excessive amount of computation.
Further, and perhaps more significantly, one finds that one cannot calculate the high- frequency mode shapes of practical structures meaningfully. To perform such calculations one would need to have available complete and precise mathematical descriptions of the ge- ometries, boundary conditions, and elastic properties of all structural components. Since such descriptions are usually not available, one is tempted to perform the required calculations for a fictitious structure which is similar to the actual one. Unfortunately, however, at a given location on the structure the responses associated with the higher modes tend to be much more affected by small changes in
41

geometry and boundary conditions than those associated with the lower modes Analysis of a fictitious structure thus gives results which are devoid of meaning for the higher modes, although a similar analysis may be useful where only the lower modes are involved.
If one could somehow perform adequately the multi-mode calculations required for high- frequency response predictions, one would still be faced with interpreting the large volume of data generated by such calculations. Generally, one would desire to perform further computa- tions, e.g., to determine various response av- erages, to reduce these data to more easily in- terpretable form.
An approach, which has come to be known as statistical energy analysis, has been devel- oped in the past few years to circumvent the aforementioned problems. This approach per- mits one to calculate average responses and their distribution over complex structures with relative ease, being concerned with the details of the various modes.
This paper is intended to serve as an in- troduction to "statistical energy analysis." The theoretical basis for this analysis approach is summarized in the first of the following sec- tions. Some applications of this approach to two coupled systems are indicated in the sec- ond section, whereas the third section discusses some practical applications to more complex systems.
THEORETICAL BACKGROUND [1,2]
Modes
Modes describe a special class of free vi- brations of undamped elastic systems where all points move in unison sinusoidally in time. Accordingly, one may describe a modal vibra- tion of an extended (one-dimensional'4') system by
W(x.t) = 0n(x) (D
Here w denotes a deformation of the system from equilibrium and is a function of the spa- tial coordinate x and of time t. The function •//„fx) is called the "mode shape" and is inde- pendent of time. The time dependence of w(x, t)
is embodied in the sin ^nt term, where .> de- notes the (radian) frequency associated with the mode.
Continuous systems have an infinite num- ber of modes, each with an associated modal (natural) frequency. The modes are usually numbered, beginning with the lowest (i.e., the fundamental) mode. The subscript 'V in Eq. (1) indicates the mode number. The mode shapes *„ and modal frequencies satisfy the system equations of motion (in the absence of damping and excitation) and the boundary conditions.
f The mode shapes also satisfy
0 for n i k 0n(x) ^(x) m(x) dx = • (2)
M for n ^ k
where m(x) denotes the distribution of mass per unit length, L the total length, and M the total mass of the system. (M is, of course, equal to the integral of IB(X) over the entire length.) The property that the product of two different mode shapes integrates to zero is called "orthogonality," and only holds for sys- tems whose boundaries are clamped, simply supported, and/or elastically restrained. Inte- gration of 0n
2(x)m(x) to M is a "normalization" condition (one of many possible ones) which is imposed on the mode shapes to define them uniquely (since the differential equations of motion define them only within an arbitrary multiplicative constant).
The mode shapes are useful functions for studying the responses of systems, since they permit one to expand any physically realizable system deflection w( x, t) or velocity v{x. t) and most excitation distributions p(x.t) in series:
w(x, t)
v(x,t)
00
00
(t) ,// (x) .
(t) ^„(x) n>l
(3)
and
P(x.t)
OD
n= 1
(t) 0n(x)
*The discussion is here presented only for a one-dimensional system, such as a beam or shaft. Results for two- or three-dimensional systems may readily be obtained by analogy.
Tor constant or small damping, each displace- ment coefficient Wn and velocity coefficient vn depends only on the corresponding force coeffi- cient F , according to
42
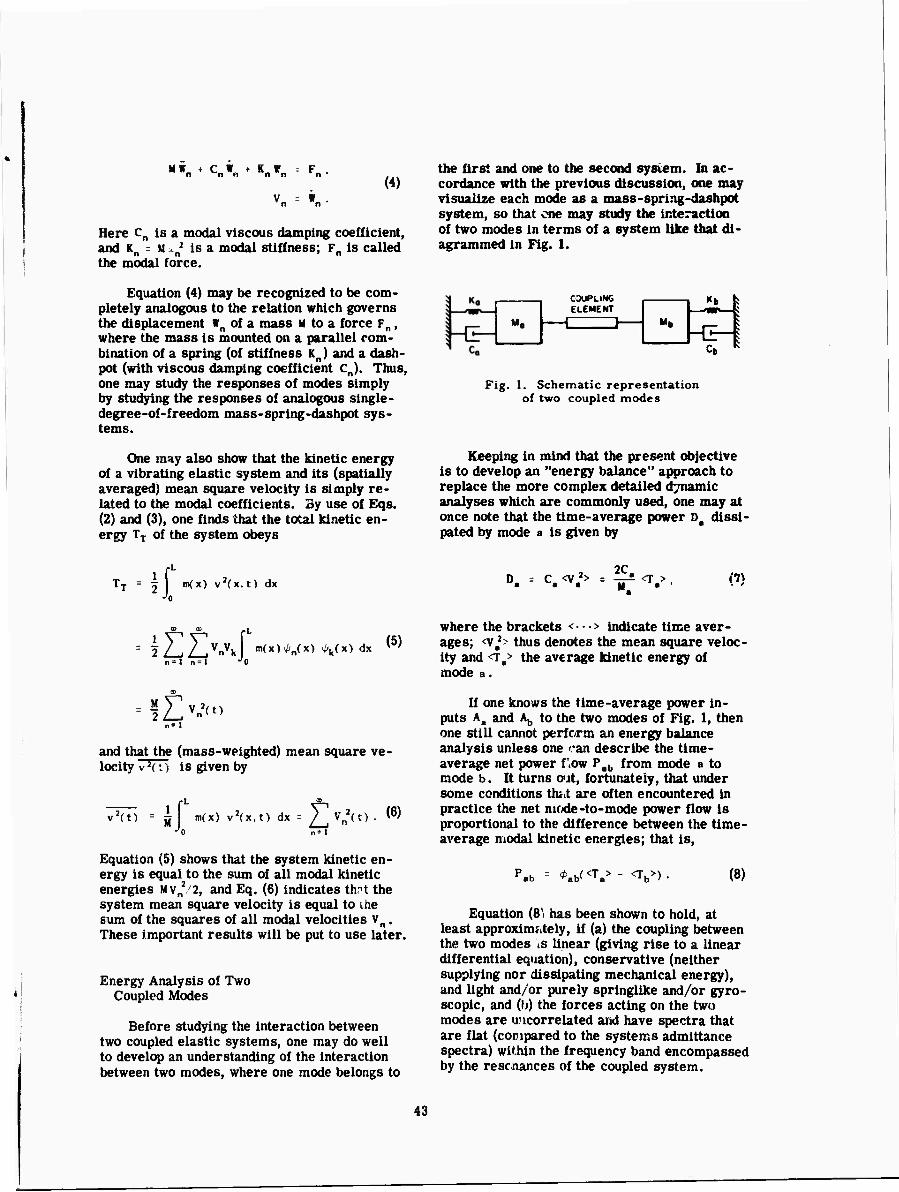
«"fn + CnWo . Kn*n = Fr
(4)
Here Cn is a modal viscous damping coefficient, and Kn r M . n
2 is a modal stiffness; Fn is called the modal force.
the first and one to the second system. In ac- cordance with the previous discussion, one may visualize each mode as a mass-spring-dashpot system, so that one may study the interaction of two modes in terms of a system like that di- agrammed in Fig. 1.
Equation (4) may be recognized to be com- pletely analogous to the relation which governs the displacement wn of a mass M to a force Fn , where the mass is mounted on a parallel com- bination of a spring (of stiffness Kn) and a dash- pot (with viscous damping coefficient cn). Thus, one may study the responses of modes simply by studying the responses of analogous single- degree-of-freedom mass-spring-dashpot sys- tems.
M,
COUPLING ELEMENT
1 1 M»
Kb t
-G- c.
Fig. 1. Schematic representation of two coupled modes
One may also show that the kinetic energy of a vibrating elastic system and its (spatially averaged) mean square velocity is simply re- lated to the modal coefficients. By use of Eqs. (2) and (3), one finds that the total kinetic en- ergy TT of the system obeys
Keeping in mind that the present objective is to develop an "energy balance" approach to replace the more complex detailed dynamic analyses which are commonly used, one may at once note that the time-average power Da dissi- pated by mode a is given by
JL
n
x) v2(x, t) dx c. <v. 2C. —5 <T > y 'a ■ (1)
dx (5)
'(t) n«l
and that the (mass-weighted) mean square ve- locity v 2( t) is given by
v2(t> MJ m(x) v2(x, t) dx = £>» (6)
Equation (5) shows that the system kinetic en- ergy is equal to the sum of all modal kinetic energies Mvn
2/2, and Eq. (6) indicates th-t the system mean square velocity is equal to ihe sum of the squares of all modal velocities vn. These important results will be put to use later.
Energy Analysis of Two Coupled Modes
Before studying the interaction between two coupled elastic systems, one may do well to develop an understanding of the interaction between two modes, where one mode belongs to
where the brackets <• • •> indicate time aver- ages; <va
2> thus denotes the mean square veloc- ity and <TB> the average kinetic energy of mode a.
If one knows the time-average power in- puts AB and Ab to the two modes of Fig. 1, then one still cannot perform an energy balance analysis unless one ran describe the time- average net power f'^ow Pab from mode a to mode b. It turns out, fortunately, that under some conditions ttui are often encountered in practice the net mode-to-mode power flow is proportional to the difference between the time- average modal kinetic energies; that is,
ab **<<*, <Tb>) (8)
Equation (8' has been shown to hold, at least approximately, if (a) the coupling between the two modes is linear (giving rise to a linear differential equation), conservative (neither supplying nor dissipating mechanical energy), and light and/or purely springlike and/or gyro- scopic, and {}}) the forces acting on the two modes are ui correlated and have spectra that are flat (compared to the systems admittance spectra) within the frequency band encompassed by the resonances of the coupled system.
43

The proportionality coefficient * b may be calculated if the coupling element is defined. For example, for coupling that may be repre- sented in Fig. 1 by a spring of stiffness Kc, one finds
^b
where
(9a)
<T.>
J- po»*^[<Ta>-<Tb>] » I < T0>
D. Ob
Fig. 2. Power flow diagram for two coupled modes
and
C.Kb I CbK.
K + K
2 hi Kc ^ = —s—
(9b)
mode. In the absence of coupling (or for loose coupling) one may express the power received by mode a as
A. % TTS.H. (11)
in terms of sa, the value of the mean square spectral density (also called power spectral density) of the force Fa at and near the reso- nance of mode a. (sa is again assumed to be a relatively flat function of frequency.)
One may show for any type of "loose" coupling (i.e., coupling that has relatively little effect on the average response of a mode to a force act- ing directly on it) which satisfies the aforemen- tioned conditions, that
2C r a"-b ab
J - T
Yab(^r d^ (10)
where Yab is the transfer admittance, that is, the ratio of the velocity (phasor) vj .) of mode a to the force (phasor) Fh( *) which acts on b to produce V (^.
By use of Eqs. (7} and (11) one may then directly arrive at the following expression for the steady state mean square velocity of an un- coupled mode:
<'v. S. MC (12)
As one may visualize with the aid of Fig. 2, if mode b has no force acting on it directly (Ab - o), then this mode receives power only through the coupling element. In the steady state this power must be equal to the power dissipated by mode b, so that if Eq. (8) holds, then
It is of interest to note that Eq. (8), Eq. (7), and an analogous relation pertaining to mode permit one to analyze the two coupled modes problem in terms of energies, and to visualize it in terms of a diagram like Fig. 2. One may also recognize that Fig. 2 is analogous to a di- agram one may draw to represent the heat transfer between two systems; then <Ta> and <Tb^ are analogous; to the system temperatures, Pab is analogous to the heat flow between the systems, Aa and Ab are analogous to heat sup- plied from sources, and oa and Db are analo- gous to heat rejected to sinks.
W <Te <V) *.b 2 a 2 "
r <v J" ^b Vb (13)
From the foregoing relation one may readily determine that the velocity ratio between the two modes may be written as
<v^
<Vb3> ;abMa
(14)
If one, for example, considers the mode a in absence of any coupling, then one may deter- mine that Aa r Da; that is, that the average power received by a mode is in the steady state equal to the average power dissipated by the
Energy Analysis of Two Mode Sets
The previously discussed expression per- taining to power flow between two individual
44

A,
□ p
a/r*«*(VT/9) »
\*ß I
0, Dß
Fig. 3. Power flow diagram for two coupled sets of modes
modes may be extended to apply to the power flow between two sets of modes (Fig. 3), where, for example, the two sets of modes may be groups of modes of two different structures. One finds that the time average power flow PaS from a mode set a to a mode set ß may be vritten as
= «WT.-V. (15)
analogously to Eq. (8). Here Ta represents the average kinetic energy per mode of the a set; thus, if TTa represents the total kinetic energy of all modes of the set, and if there are Na modes in the set, then
T . Iiü = -i y <T.> (16) ) = «
A corresponding expression applies also for T^, of course.
(b) the mode-to-mode coupling coefficients and modal kinetic energies are statistically inde- pendent, and (c) the modal kinetic energies in the ensemble average are uniformly distributed within a set. However, here Ta, T^, and *a. must be taken as the corresponding ensemble average parameters.
Under the aforementioned conditions the set-to-set coupling factor <paS turns out to be the sum of all possible mode-to-mode coupling factors between the sets, or
"aß LL <*>. «j.4k NBNfl*, aa.^b (17) ■l k'l
where A», ab denotes the average (over all mode pairs) of the mode-to-mode coupling fac- tors and <^, j *■, denote» the factor pertaining to power from the jth mode of the a set to the ktfc mode of the ^ set.
The total power TJa dissipated by mode set a is equal to the s«»» o:. all the dissipation con- tributions of the individuiü modes. Therefore,
£ Cj^i > = <v. (18)
where <va2> represents the total mean square
velocity of system a due to the N^ modes; ac- cording to Eq. (6), <va
2> id equal to the sum of all the individual modal velocities, since all of the a modes belong to the same elastic system. ca is an "effective" viscous damping coefficient for the whole set a and may be seen to obey
ZCj<V.2>
s<v,2> Sci<Ti>
Tta (19)
where all summations are implied to extend from j -1 to j = N^. The second form of Eq. (19) follows from Eq. (5) and from the equality of all modal masses in a set of modes of the same system, as evident from Eq. (2).
Equation (15) may be shown to hold if (a) the mode-to-mode power flow from all modes of the a set to all modes of the ß set satisfies Eq. (8), and (b) either the mode-to-mode cou- pling is the same for all mode pairs composed of one of the a and one of the ß modes, or all modes in a set have equal time-average kinetic energies. Equation (15) also applies for the en- semble average power flow from one mode set to another mode set of an ensemble, if (a) the first of the foregoing conditions is satisfied,
Loss Factors
It is useful to restate some of the previ- ously given results by introducing loss factors as measures of energy dissipation and conduc- tion. Loss factors may be defined in terms of energy quantities and thus have greater gener- ality than viscous damping coefficients. In addi- tion, use of loss factors for both dissipation and conduction of energy serves to draw attention
45

to the fact that both of these mechanisms may have the same effect on a system.
The loss factor is related to the viscous damping coefficient c and the critical damping coefficient cc as
7, = C/Mo,, = OS/IE = 2Ccc.
The less factor n of a mode a oscillating in steady state may be expressed as
7,. -- D/2a,,<T.> (20)
where Da denotes the time-average power dis- sipated by the system, <Ta> the time-average kinetic energy of the mode, and «, the modal frequency [3]. An expression like Eq. (20) may also be applied to a set of modes. The loss factor T)a of a set a may be written as
% * Da/2"0TTa ^.^.y/KX.y, (21)
where "o here represents the center frequency of a band which encompasses all modal fre- quencies of the set, and where the summations on j extend from 1 to Na. The right-hand ex- pression of Eq. (21), which is similar to Eq. (19) and shows that ^ is a weighted average of the modal loss factors, follows from Eqs. (16), (18), and (20).
"Coupling loss factors" 7jab and ■r)<iß) which are indicative of power flow in the same way that the loss factors of Eqs. (20) and (21) are indicative of power dissipation, may be defined by expressions which are the same as Eqs. (20) and (21), except that Da and Da are replaced by
•b <Tb>=0 taH^a and P afl T = <M
From the appropriately modified Eq. (21) and from an analogous expression pertaining to the mode set ß, one finds that the coupling loss factor ■naß (which refers to power flow from set a to set ß) and the loss factor T^ (which refers to power flow from the ß to the a set) obey
,N„ ^flaN/J = *a/2£do (22)
The usefulness of this notation will become ap- parent in the illustrations which follow.
determining the power flow from modes of one system which have their resonances in a given frequency band to a set of modes of another system which have their resonances in the same band. One may in general choose any convenient bandwidth, and «me may often wish to use different bandwidths for different calcu- lations. The number of modes which fall within the various sets depends on the bandwidths one chooses, so that it is useful to introduce the concept of modal density, in terms of which the dependence of some of the previous results on bandwidth can be stated more explicitly.
The modal density of an elastic system is defined as the average number of modes per unit frequency interval. If a system exhibits Na modes whose resonances fall within a fre- quency interval ACJ, then the modal density of the system at the center frequency terval is defined as
na(0 = Na/Aa,,
na(f) = Ha/2nhi (23)
The modal densities of systems may be determined from their "frequency equations," i.e., from the equations which give the system resonance frequencies as a function of the sys- tem parameters. For simple systems these calculations may be carried out without great difficulty [4].
Table 1 lists the modal densities of some uniform elastic systems, obtained largely from Smith and Lyon [4] and from related calcula- tions. The expressions listed in the table apply strictly only for frequencies considerably above the system fundamental (by perhaps at least two octaves), where boundary conditions have no important effects on the natural frequencies; however, these expressions generally also pro- vide reasonable estimates for the modal densi- ties at frequencies only slightly above the fundamental.
The modal density of a composite system is approximately equal to the sum of the modal densities of the component systems. Thus, for example, the modal density of a plate with at- tached beams is roughly equal to the modal density of the plate by itself, plus the modal densities of all of the beams by themselves.
Modal Densities
One usually studies the interactions of elastic systems on a band-by-band basis by
APPLICATIONS TO SIMPLE SYSTEMS Two Coupled Plates
Consider two coupled systems, as repre- sented by two irregularly shaped plates, joined
46
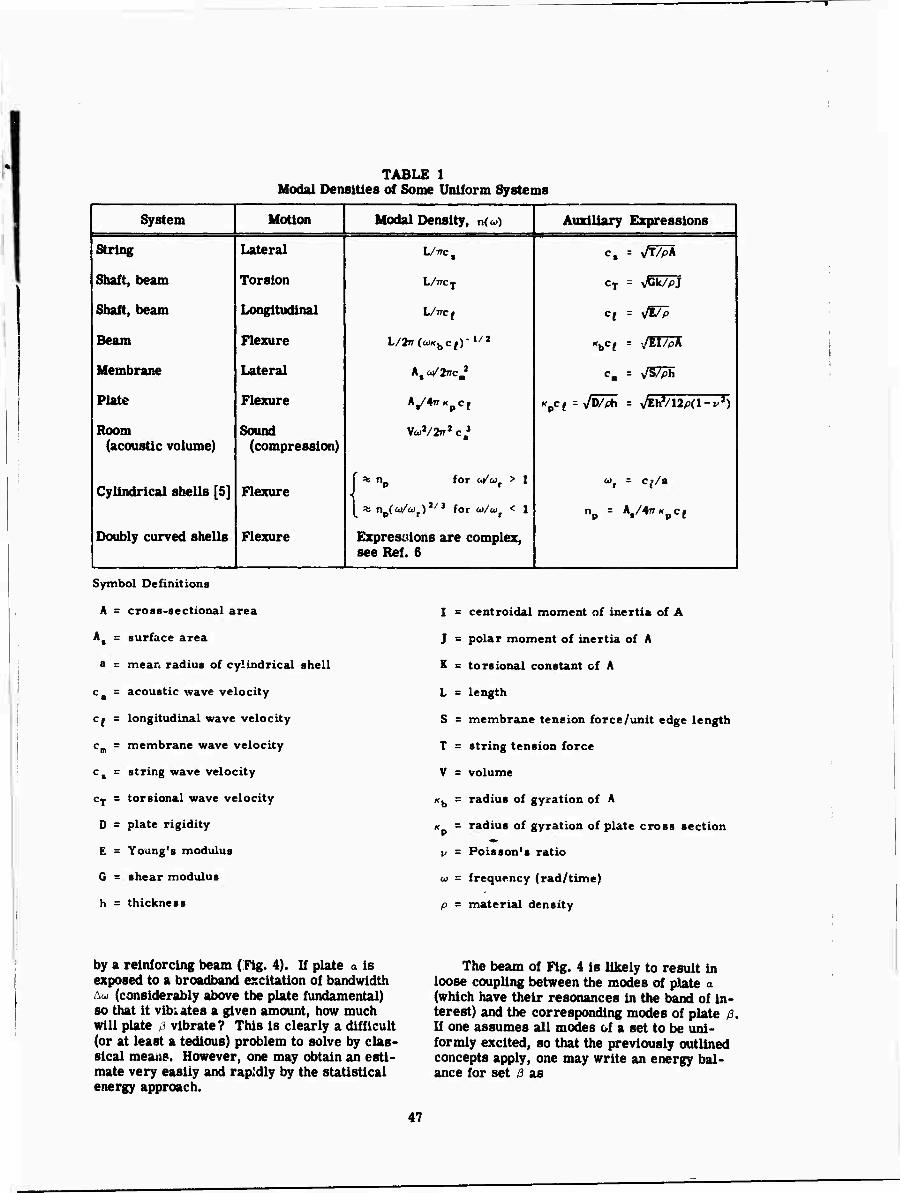
TABLE 1 Modal Densities of Some Uniform Systems
System Motion Modal Density, n(o>) Auxiliary Expressions
String Lateral L/Vc, c, = A/PA
Shaft, beam Torsion L/ncj CT = y/Gk/pJ
Shaft, beam Longitudinal L/ncf Cf - yjt/p
Beam Flexure l/2n(v*bCf)-1/2 *hct = -„/EI/pA
Membrane
Plate
Lateral
Flexure
A, oVTrrcJ c, = -/S/ph
Kft^JV/fk = yJt\t/\2p(\-V7)
Room (acoustic volume)
Sound (compression)
y^/Tn2 c,3
Cylindrical shells [5] Flexure * np for oi/wr > 1
[ * np(a/wr)2/3 for v/wT < 1 np = A,/4Tr«pc£
Doubly curved shells Flexure Expressions are complex, see Ref. 6
Symbol Definitions
A = cross-sectional area
At = surface area
a = mean radius of cylindrical shell
ca = acoustic wave velocity
c^ = longitudinal wave velocity
c,,, = membrane wave velocity
c1 = string wave velocity
cT = torsional wave velocity
D = plate rigidity
E = Young's modulus
G = shear modulus
h = thickness
I s centroidal moment of inertia of A
J = polar moment of inertia of A
K = torsional constant cf A
L s length
S s membrane tension force/unit edge length
T = string tension force
V B volume
*b = radius of gyration of A
*p » radius of gyration of plate cross section
v - Poisson's ratio
in - frequency (rad/time)
p = material density
by a reinforcing beam (Fig. 4). If plate a is exposed to a broadband excitation of bandwidth hu> (considerably above the plate fundamental) so that it vibiates a given amount, how much will plate ß vibrate? This is clearly a difficult (or at least a tedious) problem to solve by clas- sical means. However, one may obtain an esti- mate very easily and rapidly by the statistical energy approach.
The beam of Fig. 4 is likely to result in loose coupling between the modes of plate a (which have their resonances in the band of in- terest) and the corresponding modes of plate ß. If one assumes all modes of a set to be uni- formly excited, so that the previously outlined concepts apply, one may write an energy bal- ance for set /d as
47

BEAM
Fig. 4. Two coupled plates
*«^Ta-T3) - Dä z vB2u>0HeTe
and from it determine
"^ ^flo
*«fl + fooVßNg " ^Ba * T'S
(24)
(25)
From Eqs. (16), (23), and the expression of Table 1 for the modal density of plates one finds that if the plates are made of the same mate- rial, then
na M;3<V/>
n3Ma<Va'> (26)
where h and As denote the thickness and area, respectively, of the plate indicated by the sub- script.
By combining Eqs. (25) and (26), one may obtain an expression for the ratio of the mear square velocities in terms of only the gross geometric parameters of the two plates, the dissipation loss factor ^ , and the coupling loss factor laß' The loss factor nB generally can be estimated from available data, or it can be determined from some simple measure- ments, e.g., of the rate of deoy of free vibra- tions of plate ß by itself. As yet there is available no adequate means for estimating the coupling loss factor v3ll. However, ■rlBa + T)a may also be deduced from some simple meas- urements, e.g., of the rate of decay of free vi- brations of plate P when it is attached to piate c as in Fig. 4. (Note that the coupling loss fac- tor T;,a which appears in Eq. (25) refers to power flow from plate .: flows from a to 3 when
to plate a, but power is excited.)
The grouping of the loss factor terms ap- pearing in Eq. (25) permits one also to make some observations concerning the effectiveness of adding damping to the indirectly excited plate ß. If the damping of the ß plate is small initially, that is, if nß « vBai then added damp- ing will reduce the system vibrations only if this added damping is large enough so that the resulting v3 is no longer insignificant com-
On the other hand, if -n0 and any in-
pared to V J&en <v ,> varies inversely as ,,, crease In r^ will result in a corresponding de crease in <v^>.
From an energy balance on the directly excited plate a one may determine that
2«. = va (27)
The "apparent loss factor" Va introduced in the foregoing equation corresponds to the value of the dissipation loss factor which one would ascribe to set a (on the basis of measurements performed on set a) if one were not aware that this se* is coupled to set ß. It is evident from Eq. (27) that the apparent loss factor rlatp * never smaller than the actual dissipation loss factor rla. Thus, if one is unaware that a sys- tem whose loss factor one is measuring is cou- pled to another system, then one always obtains a loss factor value which is too large, an "obvi- ous" result. The error is insignificant, how- ever, if the coupling is poor {va3, vga % 0) and/or if the coupled set is relatively lossless (v3 « TJ.
From Eq. (27) one may also deduce that the response <\^> of plate a to a given excitation Aa is not controlled by the actual dissipation loss factor va of that plate, but rather by the apparent loss factor va
Interaction of Sound and Structures
The statistical energy approach may. also be applied to cases where one of the elastic systems considered is an acoustic volume. Thus, the approach may be used for estimating the sound field produced by structural vibra- tions or tor predicting the structural vibrations induced by sound.
It is of interest to note that the aforemen- tioned result reduces to a particularly simple one if the plate .: is lightly damped (r,3 « rj3a), so that the right-hand side of Eq. (5) reduces to unity.
Consider the case where a structure S is direci'y excited by random forces acting on it, and where these structural vibrations produce noise in a room R in which the structure is located. Here the structural modes in a
48
1

frequency band of interest correspond to a di- rectly excited mode set s, the modes of the acoustic space R correspond to the indirectly excited set .
The total energy ER in a diffuse acoustic field within a fluid volume v in a frequency band .■ is related to the mean square acoustic pressure -pi> measured in the same frequency band as
pJ- V (28)
where . a denotes the density and c., the sound velocity of the fluid. This total energy is, on the average, half potential and half kinetic, hence the average total kinetic energy TTR is one half of the total. The average modal kinetic energy TR may be obtained by dividing TTR by nK«.: ;, the number of modes in the interval. With the modal density expression given in Ta- ble 1 for acoustic volumes, one finds the aver- age kinetic energy of an acoustic mode of a room to be given by
(29) 2nRv.
If one applies Eq. (16) to the structure un- der consideration and replaces the number of modes Ns by ns >< l^, then one finds that the av- erage kinetic energy of a structural mode may be written
2n *_Vv M <a.2> (30)
- - ;2 n. S.
where ^t' represents the mean square veloc- ity and <a.'>
2<V 2> the mean square accel- eration of the structure, as measured in the frequency band Aw with center frequency ^. From an energy balance on the indirectly ex- cited system, i.e., the room, one may then obtain
<P2>
<a '>
M. ;RS ,..2, RS
(31)
In most practical cases the room-to-structure coupling loss factor will be much smaller than the dissipation loss factor of the room. Then, if one uses Eq. (22) to replace r,RS by ngRng nR and replaces the loss factor rSR by an equiva- lent viscous coefficient CRS, one obtains
M32> a CSR (32)
where the last form is obtained by substituting for nR the appropriate expression from Table 1. The structure-to-room coupling coefficient CSR may be shown to be the same as the rather well-known acoustic "radiation resistance" of the structure, which may be estimated reason- ably readily [4].
One may also readily develop an expres - sion which describes the response of a struc- ture to sound. For the cass where sound in an acoustic enclosure excites a structure, one may write an energy balance for the (here indirectly excited) structure, and from it determine that
<a 2> SR (33)
Cp^ ^SR +
'R
PRACTICAL APPLICATIONS
Rationale
In applying "statistical energy analysis" one takes advantage of properties which largely are peculiar to high-frequency random vibra- tions. Calculations involving structural and excitation details are avoided by averaging over possible excitation and measurement positions, since at high frequencies the vibration of uni- form structural regions is usually insensitive to details of the excitation or measurement positions. By considering a complex structure as composed of a number of simple, lightly coupled substructures, one may often study the vibrations of each substructure in terms of the vibration characteristics of that substructure considered as completely isolated from adjacent substructures; the power flow between the sub- structures then can be calculated from simple power balance relations similar to Eq. (24).
Coupled structures may be shown to exhibit a certain tendency toward assuming equal av- erage modal energies, and one often finds it ad- vantageous to use this "equipartition" tendency in estimating vibration distributions in com- posite structures. Since the coupling and dissi- pation loss factors are always positive, one may deduce from Eq. (25), for example, that the average modal energy T, of the indirectly ex- cited system is always less than that of the directly excited system Ta. The two modal energies are essentially equal in those cases where the loss factor TJ, of the indirectly ex- cited system is much smaller than the coupling loss factor r/3a. One may use the fact that T, < Ta to determine a simple upper bound to the vibration levels that result in various
49

components of a complex structure due to lo- calized random excitation.
Vibration Responses of Space Vehicles
The statistical energy approach has been applied to a number of problems involving vi- bration response and transmission in space ve- hicles. The approach has proven particularly useful for evaluating the relative importances of various excitation sources and transmission paths. For example, statistical energy calcu- lations have shown, in agreement with recent experimental work, that over a significant fre- quency range turbulent boundary layer excita- tion is more efficient in exciting mechanical vibrations than is acoustic excitation [7]. The use of the statistical energy approach to calcu- late the response of a launch vehicle to acoustic and aerodynamic excitation sources is discussed by Chandiramani and Lyon [8].
Figure 5 shows a schematic diagram of the OGO spacecraft and the energy paths that have been considered in calculating the vibration distributions that result from the action of the exterior acoustic field [9], The "acoustic path" involves the exterior acoustic space, shroud, interior acoustic space, and spacecraft panels; the "mechanical path" involves the exterior acoustic space, shroud, ring frame, mounting trusses, and spacecraft panels. Calculations [9] predict 10 to 20 db greater vibration levels due to transmission via the acoustic path than via the mechanical path. An experimental investi- gation of vibration transmission in the OGO spacecraft is in progress.
The relative importance of various vibra- tion transmission paths in the Surveyor space- craft are currently under study. As indicated in Fig. 6, this study considers a direct acoustic path from the interior acoustic space to com- partment A, in addition to a mechanical path which involves transmission from the adapter to the spacecraft trusses and then to compart- ment A. The adapter is excited by three sources: the interior acoustic space, the vented acoustic space, and the tank dome.
The statistical energy calculations indicate that high-frequency vibration transmission in a wide class of complex structures depends largely on a few characteristic properties of the structure, such as length of transmission path, mass of typical elements, average modal density, and internal damping. Some preliminary
COMPONENTS
1 tittrier Acoustic Sjjct
7 Shroud
3 Inttrior Acoustic Sp«ct
i Sptctcrift Pjntls
5 Ring Frame
6 Mounlin? Trusses
TRANSMISSION PATHS
CH-er
Acoustic
Mechanical
"*)
Fig. 5. Vibration transmission in the OGO spacecraft
COMPONENTS
1 Interior Acoustic Space
2 Compartment A
3 Adapter
4 Spacecraft Trusses
5 Vented Acoustic Space
6 Tank Dome
TRANSMISSION PATHS:
©-: -*> ©--52>—©''
Acoustic
Mechanical
Fig. 6. Vibration transmission in the Surveyor spacecraft
5C

work has been done, which indicates that vibra- tion transfer functions experimentally deter- mined on Ranger, Mariner and Surveyor space- craft can be reduced to a common form by scaling the frequency axis with respect to a transmission length [10].
Implications Relative to High- Frequency Vibration Testing
In present practice one generally attempts to obtain very st'ff test fixtures to set the first fixture resonance at a relatively high frequency. Howevtr, the first bending resonance of conven- tional fixtures often occurs within the fi equency range of interest in random vibration tests, fixture resonances result in amplification of the vibration level, for which one usually must compensate by using expensive equalization equipment) and in spatial variations in the fix- ture vibration, which complicate the problem of excitation control.
As a possible means of avoiding the prob- lems associated with stiff test fixtures, the statistical energy view suggests the use of light, flexible, multi-modal test fixtures. Such a fix- ture would have many resonances in any meas- urement bandwidth, and would result in a vi- bration field quite uniformly distributed over the fixture. (It has been demonstrated [11] that the spatial variation in mean square response of a structure excited wivh noise is inversely proportional to the number of structural modes which contribute to the response. Therefore, v/hereas the spatial variation in the response of a very rigid fixture vibrating in a low mode may be quite large, the vibration field of a thin panel-like fixture responding in many modes generally is quite uniform.)
Multi-modal test fixtures also have the added advantage that they usually can simulate the impedance of typical aerospace mounting configurations much better than conventional fixtures. Conventional rigid test fixtures pro- vide a coherent excitation source and, there- fore, severely overtest equipment which in practice is attached to lightweight structure and subjected to an incoherent excitation source. Some preliminary tests with multi-modal test fixtures have been rather encouraging.
By use of the multi-modal test fixture approach one also may avoid the conceptual,
instrumentation, and computation problems as- sociated with interface vibration measurements and specif, nations. One merely needs to use in-flight measurements of the reverberant vi- bration on mult i-modal structures to set the reverberant test levels on the multi-modal fix- tures. This method of specifying the vibration teat levels is analogous to specifying the sound pressure level for acoustic tests in a reverber- ant chamber.
CONCLUDING REMARKS
The ideas which underlie the statistical energy analysis approach have been summa- rized to give the reader some insight into the range of validity <uid applicability of this poten- tially very useful approach. Extended discus- sions of these ideas and a more complete list of references appears in Ref. 1.
A number of cases have been indicated where the statistical energy analysis approach lias led to a better qualitative understanding of this behavior of coupled systems. Practical applications of the approach to the prediction of vibration levels and to the comparison of the relative importances of parallel vibration transmission paths have also been discussed.
Statistical energy analysis provides one with a simple and powerful means for obtaining a qualitative understanding and quantitative es- timates of the most important aspects of multi- modal random vibrations of complex structural systems. At present the lack of information on power-flow coupling coefficients often limits the validity of the quantitative response esti- mates one desires to make for practical sys- tems, but related further work is in progress.
ACKNOWLEDGMENTS
The statistical energy analysis approach has been developed and is being extended under the sponsorship of various agencies of the U.S. Air Force and of NASA. This paper was pre- pared largely under sponsorship of the Air Force Flight Dynamics Laboratory, Research and Technology Division, Air Force Systems Command. The initial portions of this paper lean heavily on a report prepared for the Air Force Flight Dynamics Laboratory [1],
51

REFERENCES *
1. E. E. Ungar, "Fundamentals of Statistical Energy Analysis of Vibrating Systems," AFFDL TR 66-52, Apr. 1966
2. E. E. Ungar, "Statistical Energy Ana'ysis cf Vibrating Systems," submitted for pub- lication in Trans. Am. See. Mech. Eng.
3. E. E. Ungar and E. M. Kerwin, Jr., "Loss Factors of Viscoelastic Systems in Terms of Energy Concepts," J. Acoust. See. Am., Vol. 34, pp. 454-457, July 1962
4. P. W. Smith, Jr., and R. H. Lyon, "Sound and Structural Vibration," NASA CR-IBO, Mar. 1965
5. M. Heckl, "Vibrations of Point-Driven Cy- lindrical Shells," J. Acoust. See. Am., Vol. 34, pp. 1553-1557, Oct. 1962
6. V. V. Bolotin, "On the Density of Distribu- tions of Natural Frequencies of Thin Elas- tic Shells," J. Appl. Math, and Mech., Vol. 27, No, 2, pp. 538-543; transl. from Soviet PMM 27, No. 2, pp. 362-364, 1963
10.
11.
P. A. Franken and R. H. Lyon, "Energy- Method Estimates of Response to Inflight Dynamic Loads," 1966 Ann. Tech. Meeting, IES
K. L. Chandiramani and R. H. Lyon, "Re- sponse of Structural Components of a Launch Vehicle to Inflight Acoustic and Aerodynamic Environ ift-nts," Shock and Vibration Bull. No. 36, Part 5, 1967
J. E. Manning, R. H. Lyon, and T. D. Scharton, "An Analytical Procedure for Determining the Random Load Acting on a Spacecraft Due to a Primary Random Load Acting on an Exterior Structure," Bolt Beranek and Newman Rept. 1431, Contract No. NAS5-9601, July 1966
T. D. Scharton and P. A. Franken, "Cas- cade Models of Vibration Transmission in Flight Vehicles," to be presented at the November 1966 meeting of the Acoust. Soc. Am.
R. H. Lyon et al., "Studies of Random Vibration of Coupled Structures," Bolt Beranek and Newman Rept. 967, Appendix I, p. 28, Eq. 3.12, 1965
BIBLIOGRAPHY
Franken, P. A., T. H. Mack, and T. D. Scharton, "Comparison of Mariner Assembly-Level and Spacecraft-Level Vibration Tests," Shock and Vibration Bull. No. 36, Part 3, 1967
Karnopp, D. C, "Basic Theory of Random Vi- bration," Chap. 1 of Random Vibration,
Vol. 2, ed. by S. H. Crandall, MIT Press, Cambridge, 1963
Scharton, T. D., "Random Vibration of Coupled Oscillators and Coupled Structures," Doc- toral Thesis, MIT, Oct. 1965
DISCUSSION
Mr. Bookstein (Jet Propulsion Laboratory , Have you made any comparison between your method and the so-called stone-age method for computing responses ?
Mr. Ungar: No. The problems we have attempted by this method are completely im- possible by any other method. So ours is the best.
Mr. Kaplan (General Electric Co.): It ap- pears that you still have to go through the cum- bersome stone-age procedures, namely, getting the modes of vibration of the subsystems or the portions of the structure.
52
Mr. Ungar: I was not careful enough to point out the savings which we make. We do not have to determine the mode shapes. All we need to know is the average number of modes per frequency interval and this is a very dirty number which depends only on gross system properties.
Mr. Kaplan: But here again, for an exam- ple such as you postulated, a complicated spacecraft structure, there would be resonances within the various higher frequency bands that might be attributed to local breathing, second- ary resonances on the equipment support struc- ture, and the like. Therefore, wouldn't you

still have to know the content within each of the frequency bands to associate the various phe- nomena in terms of what is happening physically, and wouldn't you still nted the mode shapes?
Mr. Ungar: We do not need to know the mode shapes. We need to know only the type and number of modes.
Mr. Lyon (Bolt Beranek and Newman): A few of the more difficult modes to calculate, for example, in-plane motions or extensional modes of the structure, may be missed by tho simpler ways of counting the number of mot'.es in a band. Fortunately, there is a tendency for an equal amount of energy to exist in all modes. Therefore, if you miss 5 percent of tham, you have only missed 5 percent of the energy or 2 percent of the motion.
Mr. Smith (Bell Aerosystems Co.): Clas- sical or statiscical, you are still faced with the last step, aren't you? If you are handling % fatigue problem, you want stresses in the struc- ture, not modal displacement. Neither the clas- sical attack, with the shortcomings you outlined, nor the statistical will indicate whether you have a well or a badly designed structure.
Mr. Ungar: That is certainly true to some extent. We are, incidentally, working on an ap- plication or extension of this method in which we calculate, from the mean square response obtained, the maximum stresses near the edges. Incidentally, we are doing this by applying the dynamic edge condition principle discovered by Bolotin. I realize this is only a partial answer to your question, but it is the best I can give.
Mr. Crocker (LTV Research Center): Can you tell me how good your method is at low fre- quencies ? I suspect that the classical method might be more accurate for the lower modes.
Mr. Ungar: If you can use the lowest modes, you should. The method is well estab- lished. However, to do a reasonable analysis involving the lowest 20 modes, you need to deal with the lowest 14 modes and a 40x40 matrix,
and so on up. You very quickly run out of com- puter space. If you have a program and you want to worry only about the lowest three modes, by all means use classical methods.
Mr. Crocker: I did a problem by computer where we took into account 400 modes. It wo> Id have taken me 20 years by hand; the computer did it in about 20 minutes. The method seems fairly accurate at low and high frequencies, and is quite quick once the program is set up.
Mr. Ungar: I am glad you went through this stone-piling procedure. I recently saw some similar calculations where people calcu- late transmissibilities of structures when they were really only interested in the transmlssi- bility peaks at reasonably high frequencies. So they did something very similar, based on an assumed value of damping. I think if you had assumed the value of damping, using the simple method, you would have had the answer, without the use of a computer, in l/10th the time, per- haps at half the cost.
Mr. Himelblau (North American Aviation): I would like to come to your defense because I believe it is very difficult to get any kind of a computer solution for the higher modes that will adequately describe the modes and the modal responses. If you are averaging over several modes, the statistical energy method is very effective for problems not particularly suscep- tible to a narrow-band type of failure. For ex- ample, whether fatigue occurs in the 40th or the 43rd mode generally does not determine that a different lifetime exists. However, in certain problems involving subsequent narrow- band oscillators which provide an input to a particularly narrow-band resonant structure, you would not want to know what would happen in the 43rd mode. Taking the average response over a range involving, say, the 40th to the 50th mode, would not give assurance that your de- sign was adequate. Any comment on that?
Mr. Ui You covered a lot of ground, and I think I agree with you in just about every- thing, particularly in coming to our defense.
ngar: Tub
53

DYNAMIC ANALYSIS OF CONTINUUM BODIES BY DIRECT STIFFNESS METHOD
W. E. Baker Rocketdyne
Division of North American Aviation McGregor, Texas
and
J. M. Daly Arde Engineering Company Asheville, North Carolina
Problems frequently encountered in the field of structural dynamics require an analysis of structures having complex geometry and non- homogeneous materials. A method is presented for dynamic analysis of complex continuum bodies by extension of the finite element method, to circumvent the severe oversimplification often required in treating these problems by classical methods. Axisymmetric and plane stress- strain formulations, with th associated computer programs, have been developed. The analysis w < developed using viscous damping and the assumption that classical modes exist. The undamped frequencies and mode shapes are first calculated, then used to uncouple the damped equations of motion by diagonalization of the mass, damping and stiff- ness matrices. Thus, single-degree-of-freedom modal response equa- tions are formed and solved for the response contribution of each mode. Through superposition of each modal contribution coupled with a transformation back to the original coordinate system, the response to an arbitrary forcing function is determined. Theoretical develop- ment, correlation studies, applications and some of the limitations of the analysis are discussed.
>. E. Baker
INTRODUCTION AND SUMMARY
In the field of structural dynamics, prob- lems frequently encountered require an analysis of structures having complex geometry and non- homogeneous material properties. This is par- ticularly true in the solid rocket motor field, where the propellant grains often have irregular internal surfaces. Classical methods of analy- sis are somewhat limited, particularly where
irregular geometries and nonhomogeneous materials are involved; often severe over- simplifications are required to obtain classical solutions.
Recent achievements In finite element methods, accompanying the continuing advances In speed and capacity of digital computers, have enhanced the scope and detail practical In structural analysis. The finite element method, which has been found to be a powerful and ver- satile tool in the static analysis of complex structures, Is being extended into the field of dynamics to allow a whole new realm of dy- namic problems to be solved at minimal cost. Some of the problems that may be solved are:
1. Dynamic elastic analysis of thick-walled vessels, including spheres, cylinders and gen- eral axisymmetric shapes. Both longitudinal and radial modes may be analyzed.
2. Plane stress and plane strain analyses of arbitrary configuration and material property
55

distribution, subjected to transverse dynamic loading.
3. Analysis of elastic half spaces in which pressure waves emanate radially from a point source acting on the surface.
4. Longitudinal waves in rods of varying nonuniform cross section.
5. Analysis of circular plates of arying nonuniform general thickness subjected to axi- symmetric loading.
A major portion of the dynamic analysis, the stiffness matrix, had already been formu- lated in the development of the static analysis [1-4]. A recent study has extended the two- dimensional plane stress finite element method to include dynamic effects [5]; and at Rocket- dyne the method has been extended to axisym- metric bodies. The extension of the finite ele- ment method to dynamic analysis required the development of a mass matrix. Initially, a lumped mass method was used, but later a dis- placement consistent mass matrix suggested by Archer ■ 6] was developed to improve the accu- racy of the program. Comparisons of the two mass expressions showed that the consistent mass method generally provided greater accu- racy, especially in the higher raodes.
With the computer programs developed, a large number of sample problems have been solved, the majority of which involve bodies of regular shapes such as spheres, cylinders, and thick plates. The accuracy of the method is shown by comparison of the calculated natural frequencies and mode shapes with results avail- able from experiments and classical theoretical solutions. Agreement was very good, especially in the lower modes.
THEORETICAL PROCEDURE
Direct Stiffness Method
Details of the development of the stiffness matrbpfor a solid body are not presented here, except to the extent necessary for a general in- troduction to the concept; the missing details may be found in Refs. 1 through 4. Due to the similarity between the plane stress and axisym- metric formulation, only the axisymmetric case will be discussed.
The finite element concept is the idealiza- tion of an actual continuum body as an assem- blage of discrete elements (Fig. 1) connected at their nodal points. The basic element is
triangular in cross section, as shown in Fig. 2. For compatibility to be maintained at the edge of the elements, linear displacement functions were assumed:
t ♦
and
u(r. z)
v(r.z)
a - br
(1)
By assunr .g the displacement functions and knowing the strain-displacement and the stress- strain relations, the energy function may be calculated for the element. The element stiff- ness coefficients are then obtained by minimi- zation of the energy function. The coefficients relate nodal displacements to nodal forces; for a triangle having six degrees of freedom, a 6 x6 element stiffness matrix is formed.
0 2 4 6 8 r'in-
Fig. 1. Typical axisymmetric model
The complete assembly stiffness matrix is then formed by superposition of the appropriate stiffness coefficients of the elements connecting each nodal point, and the matrix will be equal in size to twice the number of nodal points. Bound- ary conditions that impose displacement con- straints are accounted for by removal of appro- priate rows and columns in the matrix. The assembly stiffness matrix relates the nodal forces to nodal displacements and the relation- ship expressed in matrix form is
{Fl -■: [KHul (2)
56

I J t'i
e
\
>^d<)
(a) ElMBMit for the plane etreg» or plane ■train case
(b) Element for the am- BVimetric case
Fig. 2. Finite elements used in dynannic stiffness method
Dynamic Analysis
The equations of motion ir. a damped finite element system may be expressed in matrix form as
[MHÜ) + [DHu) + [KHu) -~ (F(t)} (3)
where
K is the nodal stiffness matrix as de- scribed in the previous section,
[M] is the mass matrix,
[C] is the equivalent viscous damping matrix, and
{F(t)} is the dynamic force vector.
The mass matrix used in these programs is defined by one of the following methods: (a) one- third of the mass of each element is lumped at each of its nodal points, or (b) mass distribution is based on the assumed displacement shape of the element. The displacement-consistent mass matrix (method b) will be discussed later.
The general procedure followed in the method presented in this paper is (a) to solve the characteristic equation of an undamped sys- tem for the natural frequenciesand mode shapes, and (b) to evaluate the forced dynamic response by mode superposition. The eigenvectors of the characteristic equation are used to form a transformation matrix that will uncouple the equations of motion, forming single-degree-of- freedcm modal response equations. These equations are then solved for the response
contribution of each mode; and, through super- position of the mode contributions combined with a transformation back to the original co- ordinate system, the structural response is calculated.
The method used to decouple the equations of motion required the assumption of the exist- ence of classical modes. This assumption re- quires the damping matrix to be diagonalized by the same transformation that diagonalizes the mass and stiffness matrix. In general, this is not entirely true for many practical prob- lems, and the error introduced remains to be proven. Another approximation which may in- troduce error is the use of only the first 20 modes to evaluate the transient response plus the loss in accuracy in calculating some of the higher mode shapes.
The effective forcing function is determined using the assumption that all displacement con- strained nodal points are rigidly attached to the body supplying the external force to the system. Thus, the effective force becomes the difference of the applied external force and the resulting internal force. No provision has been made to provide for absolute fixity of a nodal point.
Displacement Consistent Mass Matrix
It has been shown by Archer [6] that im- proved accuracy in dynamic analysis may be attained by a mass distribution consistent with the assumed element displacement function. Because of computer storage limitation, it was of interest to develop a method whereby accu- racy could be improved in a manner other than
57

by increasing the number of elements used to define a structure. Therefore, a mass matrir consistent with the displacement field within the element was developed. The resulting element mass matrix is similar to the element stiffness matrix. Use of the consistent mass method re- quired some additional matrix manipulation and was somewhat of a disappointment in that it re- quired a prohibitive amount of computer stor- age space, thus limiting the grid size. Im- provements in frequency and mode shapes were not suificient to warrant use of the consistent mass method; no studies have been made to de- termine the effects on the forced response.
CORRELATION STUDIES
Discussion of Correlation Studies
During development of this new application of the finite element method, various structural dynamics problems were analyzed to serve as checkout runs to evaluate the numerical accu- racy and scope of the method.
For every example analyzed, excellent correlation was achieved with data available from other sources. Most of the examples studied were cnosen for availability of both the- oretical and experimental correlated data. These examples include structures of simple geometrical shapes, such as flat circular plates, spheres, rods, and rectangular beams.
The agreement has been excellent, as indi- cated in the examples presented in this section. The high degree of accuracy is especially im- pressive, since in most instances relatively coarse element models were used to expedite the gathering and reduction of data and to limit the total computer time required throughout development and checkout of the computer program.
In addition to simple examples used for evaluation of the accuracy of the method, rocket motors of complex shapes were analyzed. The utility and power of the dynamic stiffness method becomes apparent in the analysis of structures of complex shape. The same finite elements that form a thick-walled sphere, flat circular plate or uniform cantilever beam can readily be reassembled to represent a pressure vessel, 'Cket motor, or irregular piece of hardware. For such cases, there exists no other known practical approach to calculating the dynamic structural response, without the introduction of grossly simplifying assumptions.
Examples
In the examples presented, natural frequen- cies and mode shapes calculated by the dynamic finite element method-have been compared with results from other methods. In all instances, excellent agreement as to both frequencies and mode shapes has been achieved. Following de- termination of frequencies and mode shapes, overall structural response to a forcing function is calculated using the mode superposition method.
Examples presented to illustrate accuracy of the method are:
1. Flexural and extensional (radial) vibra- tions of thick circular plates;
2. Radial vibrations for spherical bodies; and
3. Longitudinal and radial vibrations of hollow tubes and rings.
To illustrate typical rocket motor grain struc- tural response calculations, examples of stresses, displacement, velocities and accel- erations throughout the body, varying with time, are presented in Example 4.
Even for the first three seemingly simple examples, solutions by classical theoretical methods are extremely difficult. For several of these three classes of problems, satisfactory theoretical solutions have been developed only in recent years.
The first three examples are problems in three-dimensional elasticity that may be for- mulated in two parameters. Further compli- cating the classical theoretical approaches is the fact that separate solutions may be involved for flexural vs extensional modes of vibration, for a given body. In contrast, the dynamic analysis of these and many other classes of structures may be performed by a single dy- namic finite element method program.
Example No. 1, Circular Disk —A particu- larly useful series of cases were analyzed for vibrations of thick circular disks. Vibrations of bodies of this class have been intensively studied, providing good data for comparison; both experimental and theoretical results are available.
Theoretical solutions for flexural modes of vibration have been published by Deresiewicz
58

and Mindlin [7], and corresponding experimental results have been published by Sharma [8].
Theoretical solutions for extensional (or radial) modes of vibration have been developed by Gazis and Mindlin [9], and experimental re- sults obtained by Shaw [10] have been compared with the theoretical.
Table 1 summarizes a comparison of fre- quencies of extensioiuJ (or ra'Ual) modes of vibration. Figure 3 shows the model used in this analysis. As noted, the finite element method agrees very well with the theoretical results. In the range of disk diameter-to- thickness ratio of 10:1 used in this example, the theoretical results of Gazis and Mindlin [9] and experimental results of Shaw [10] were in close agreement.. For smaller diameter-to- thickncss ratios, about 5:1, results from these two sources differed by about 12 percent for several modes. In this region, the finite ele- ment results were about 4 percent below exper- imental results, and about 8 percent above the- oretical results, which seems very good correlation, considering the discrepancies in the data available.
Good agreement is also shown in Table 2 for flexural vibrations of the same circular disk.
Deflected mode shapes as calculated by the finite element method show clearly extensional and flexural modes of vibration. Extensional mode shape data are presented in Fig. 4. Some flexural mode shapes are shown in Fig. 5. Little has been published as to predicted mode shapes
TABLE 1 Comparison of Natural Frequencies Obtained by Finite Element Program
and Theoretical Results
Funda- mental Mode
No.
Normalized Frequency, ß
Diff. (%) Finite Element Program
Theoretical Results [9]
1
2
3
4
5
6Ab
6Bb
7
8
0.221
0.568
0.872
1.115
1.271
1.369b
l,385c
1.472
1.58
0.220
0.570
0.880
1.143
1.290
1.47d
1.31e
1.5
1.61
0.4
-0.4
-1.0
-2.5
-1.6
-5.8
+5,7
-2.0
-1.9 aOf radial vibration for thick circular disk, diameter:thickness ratio of 10:1.
"Apparent shear-extensional mode. cEdge mode. "Experimental edge mode. eTheoretical edge mode.
— 100 in. —• Thr Circular Diak
Z
No. of Elenrnvs » 9«
No. of Nodal Point« - 65
Axisynnrtric Finite f.lement Aasembly
Fig. 3. Circular disk and axisymmetric finite element model
59

TABLE 2 Natural Frequencies in Flexural Modes of Vibration of Thick Circular Disk by Finite Element Program
Fundamental Mode Number*
Normalized Frequency Max. Diff.
(%) Finite Element Program
Theoretical [7] Experimental [8]
1
2
3
0.0533
0.205
0.400
0.0515b
0.197
0.371
0.0515b
0.194
0.371b
3.5
5.7
7.8
* Applicable results for first three modes only are given in the references. "Approximate —curve extended beyond range given in Refs. 7 and 8.
"^-^
-'J
lb
Q ^—^
-16 ^
40
o X JT ~w •
700
0
-700 h —
«0
0 1 A ^x
-80 / \y ^
1.8
0
-1.8
/N /-
/ \/V/
0.8
0 \ /^ - / -0.8
\y v^-\y
0 ^
10.0
yv - -
Ncmnlwcd Irrquenry./V
A,
n.
n-
si.
'.0
o
-40
~ lb
Ar. UL—^■^.■^•»■^ A 0
O X
.„ . ■ J-l«.
\
\
0.8
0
-O.H
0.8
0 -0.8
1.0
-1.0 0 10 20 10 >i0 r)0 0 10 JO V, w w
Hadiu s. in.
Fig. 4. Radial and axial defiectiona for extensional modes of vibration
60

FIfxural Hoar So.
c —
■5 S
2 .
\
n
in
0 10 Ä ■» 40 50
Radius, in.
Fig. 5. Deflected shapes for disk vibrating in flexure 1 modes
for circular plates, but efforts will continue to determine the accuracy of the calculated shapes. The accuracy of these shapes directly influences the accuracy of calculated stresses and strains in forced vibration, when using the mode super- position method. Based on the present study it seems reasonable to assume tentatively that accuracy of the mode shapes will be of the same order as that attained in calculating the natural frequencies.
A review of data in Tables 1 and 2 reveals the maximum error in natural frequency to be about 7.8 percent. Also, it can be seen that much higher accuracy is obtained in the exten- sional than in the flexural modes, as might be expected from consideration of the basic as- sumptions of the finite element method. The relevant assumption is that each element under- goes extension or compression and shear, but not pure flexural distortion [1, 2, 3].
A better grid system than the one chosen would perhaps give better flexural results, al- though this particular finite element method would not be recommended for dynamic analy- sis of, for example, thin shell structures where flexural modes predominate. However, the method is ideally suited for analysis of rela- tively thick bodies, such as solid rockei motor grains encased in relatively stiff cases where case bending is neglected.
Example No. 2, Spherical Bodies — Addi- tional correlation of the finite element program was made with the theory for vibration of spher- ical bodies. Three bodies were analyzed: a soliu sphere, a hollow body with a wall thickness
50 percent of its outer radius, and a hollow sphere with a wall thickness equal to 33.3 per- cent of the outer radius.
Theoretical solutions for the fundamental radial frequency are given by Love [11]. With this approach a computer program was written to find the theoretical natural frequency, using an iterative procedure on an IBM 1401 com- puter. Table 3 summarizes and compares the results obtained by the finite element method and by Love's theory [11]. The models are shown in Fig. 6.
TABLE 3 Natural Radial Frequency of Spheres
Natural Radial Frequencies
JSphere (rad/sec) Dlff, (%)
Finite Theoreti- Element cal [11]
Solid (90 element 729 726 0.41 model)
Hollow, wall thick- 605 605 0 ness 50% (51 ele- ment model)
Hollow, wall thick- 535 533 0.37 ness 33.3% (98 element model)
Hollow, wall thick- 539 533 1.13 ness 33.3% (48 element model)
Example No. 3, Tubes, Rings, and Cylin- ders — A variety of tubes, rings, and cylinders were also analyzed by the finite element method. Several hollow cylinder models were analyzed and checked against applicable theories. Sim- ple classical theories for vibrations of finite length, hollow cylinders do not include this im- portant physical parameter. Therefore, to pro- vide a basis for correlating the finite element analyses with theory, Poisson's ratio was per- mitted to approach zero in correlation data for this example. Results of including Poisson's ratio are also given to demonstrate the effect of varying the ratio in the analysis.
Table 4 presents the natural frequencies for a long hollow cylinder, with an element model a« shown in Fig. 7. Mode shapes are calculated by the dynamic finite element pro- gram and plotted as shown in Fig. 8.
61

Solid Sphere
90 Qeaeiita 58 Nodal Point«
Hollow Sphere
Wall Thickne«» 0u7«ide Radius 51 Elewnta 16 Nodal Point»
■50*
Hollow Sphere
Wall Thickne»» Outside Radiu» 98 Elenent» 65 Nodal Points
TV?«
!t b
Hollrw Sphere
Wall Hiicknys» Outside Radius 48 Elenent» ■56 Nodal Point»
T5.1«
Fig. 6. Axisymmetric finite element models for solid and hollow spheres
62

TABLE 4 Natural Frequencies of Longitudinal Vibration for a Koilow Cylinder
Mod-. No.
Natural Frequencies (rad/sec)
Theoretical Finite Element Program, Poisson's Ratio- 0.0
Diff.a (%) Finite Element Program, Poisson's Ratio = 0.45
1
2
3
4
48.25
144.75
241.25
337.50
48.23
144.30
239.16
331.64
-0.04
-031
-0.87
-1.74
48.15
142.19
228.97
302.72
'fercent difference = (program frequency - theoretical frequency)/theoretical frequency < 100 per- cent; theoretical frequency calculated by
where n = mode number, 1, 2, 3,4; f = unit weight, 0.065 pci; E - elastic modulus, 1000 psi; and L = length, 80 in.
'"-»■"£ l/f
The Hollow Tylindor
No. of KlementB = HO
No. of Nodal Points * (i"5
Boundary TonditiOR.« are bane
nodnl points restrained only
in nxinl direction, free in
rndial direction.
0 "5 t> ')
Finite Klement Asnembly
Typical Section of Repeating Pattern
Dimensions in inches
Fig. 7. 80-in. long hollow cylinder and finite element assembly
63

1.0 0.5
Noiaaliccd z Ks- placMMnt for Nsdc* 1 and 2
0-0.9-1.01.0 0.5 0-0.5-'
Neiaalixed z Dia- placcacnt for Mode* 5 and I
Fig. 3. Mode shapes of longitudinal vibrations for 80-in. cylinder
TABLE 5 Natural Frequencies of Longitudinal
and Ring Extenslonal Vibrations for Short Hollow Cylinder»
Mode Type
Natural Frequency (rad/e«c)
Diff. (%) Theo-
retical
Finite Element Program, Poisson's
Ratio = 0.0
Extenslonal
65.6 66.7 1.5
Longitudinal
1 2
182.7 548.0
180.5 573.9
1.2 4.7
»See Fig. 9.
Theoretical mode shapes are calculated by the equation
Sz - C, sin ivy) (4)
where
n = 1,3,5,7..., the number of quarter waves per length of cylinder;
s z = axial displacement;
Z = axial location;
i = length, 80 in.; and
Cj = amplitude of maximum displacement, a constant not defined for free vibra- tions.
Table 5 summarizes the results for a thick ring, illustrated in Fig. 9. The ring chosen has a very coarse model of eight elements, yet re- sults appear satisfactory for the ring exten- slonal (radial) modes and for the lower order longitudinal modes. Theoretical frequencies of longitudinal vibrations are calculated as for a long cylinder.
Ring extenslonal (or radial) frequency is calculated by
"R
where
^ - »= ^ 35.355 in.
E = elastic modulus, 910 psi;
g = acceleration of gravity, 32.2 x 12 in./ sec2;
e = unit weight, 0.065 pel;
I - moment of inertia of ring; and
a = cross-sectional area of ring.
Example No. 4 — Figure 10 summarizes the information available from the dynamic finite element analysis. The problem is defined as follows:
Grain outside diameter = 3.960 in.;
Case thickness = 0.064 in.;
Grain modulus = 1000 psi;
Poisson's ratio = +0.48;
Boundary condition: outer boundary rigidly fixed to forcing body;
Load resonant acceleration:
Px = 1 (g) sin (a;(1) t) .
where
l (g) = the assumed maximum amplitude of load,
"(i) = the first resonant frequency (rad/ sec), and
t = time (sec).
64

Short Hollow Cylindrr
TO
.20
.10
Q.
i I 20 10 0
Thr finite Klimmt Haiti
No. of eirarntR =■ 8 No. of Modul Ptoints
Diaonoieno in inch»«
8
Fig. 9. Short hollow cylinder and finite element model
The element model and curves shown are re- produced from cathode ray tube plots, automat- ically drawn by the computer to aid in rapid interpretation of the data from the computer run, as well as to provide documentation of the analysis as shown in Fig. 10:
Part (a) pictures the element model of a section of a typical grain, to be analyzed for transverse accelerations.
Part (b) is a trace of acceleration loads input to the grain through the case, mounted on a vibrating fixture.
Part (c) shows traces of acceleration and displacement of the tip of the grain during load- ing. Maximum displacements and accelerations asymptotically approach a maximum value dur- ing resonant load of constant maximum ampli- tude. Accelerations and displacements quickly die out due to energy absorption of the propel- lant following removal of the applied load.
Part (d) is a plot of stresses in a critical element of the grain, at the side of the filleted star point. Stresses also approach a maximum, to die out quickly after removal of load.
Comparison of Program Versions Using Lumped Mass and Consistent Mass Matrix Representations
A comparison is made of natural frequen- cies and mode shapes calculated by the lumped mass program (AXDY) and by the consistent mass program (AXMQ) for identical finite ele- ment models. All solid bodies analyzed to compare the two approaches were treated in the preceding paragraphs; only those additional data required for comparison are now introduced.
The results presented in Table 6 show that, in general, for a given element assembly the two programs agree about equally well with correlated data. An exception was sbc*n in the case of Example 1, a very coarse model of a short hollow cylinder.
In evaluating accuracy of the results, con- sideration of the effect of the stiffness matrix is also pertinent. From the fundamental as- sumption of constant strains through an element, a limitation is placed on the displaced shape the body can take. As a result, the finite element model is invariably stiff er than the real struc- ture, tending to produce calculated frequencies that are higher than the correct value. Fur- thermore, use of the displacement-consistent mass matrix approach yields frequencies that represent an upper bound to the true frequen- cies [6].
In general, lumped mass representation may yield frequencies either higher or lower than the correct value. However, in most of the cases analyzed by the lumped mass program, the calculated frequencies were below the cor- rect values. In these cases, errors introduced by the mass representation were apparently larger and of opposite sign from those intro- duced by the stiffness representation. Thus, the errors tended to be canceling, improving the agreement with theoretically correct re- sults for the lumped mass program.
Results of previous work have indicated the consistent mass matrix can be expected to yield results superior to those obtained using a lumped mass approach. However, results of this study show that, for those element models finely enough divided to represent the stiffness characteristics uf the structure, the lumped mass approach gives results with about equal accuracy.
65

m >-
13 a n c
• r4 ID u bo
K o
E o u
-3 n
66

TABLE 6 Natural Frequencies Calculated by Programs AXDY and
Compared with Theoretical Values AXMQ
Example Theoretical
Program AXDY Program AXMQ
Natural Frequency
(cps)
Diff. (%)
Natural Frequency
(cps)
Dili. (%)
1. Short hollow cylinder: j
Ring extensional mode, wr
Longitudinal mode -1
-2
66.3
182.7
548.0
62.5
160.0
701.0
-5.7
-12.6
+27.9
66.6
185.0
601.0
+0.3
+1.2
+8.8
2. 44-in. long cylinder:
Longitudinal mode -1
-2
-3
-4
-5
-6
83.03
249.1
415.15
581.2
747.3
914.0
83.0
248.2
411.1
570.0
723.0
867.6
-0.035
-0.36
-0.967
-1.93
-3.25
-5.07
83.01
249.9
419.6
593.4
764.7
961.4
-0.02
+0.32
+1.06
+2.1
+2.34
+5.19
3. Hollow spheres:
t/r0 = 0.50,
radial mode
t/r0 = 0.333,
radial mode
576.5
532.0
581.6
539.0
+0.71
+1.12
584.1
545.0
+1.32
+240
DISCLSSION AND CONCLUSIONS
Dynamic analyses using the finite element method have been applied to a variety of test cases on elastic bodies of regular shape. Cor- relation with available natural frequency and mode shape results of theoretical and experi- mental solutions has been excellent. It appears that with some refinement, this method of anal- ysis will provide an excellent tool for analyzing bodies of complex geometry and nonhomogene- ous materials.
The forced response portion of the analysis has several shortcomings, which may make the results questionable for many classes of prob- lems. Attempts to allow for arbitrary forcing
function and transient response calculations led to the use of the mode superposition method. For many problems, the assumption of the ex- istence of classical modes, used in the mode superposition method, does not hold and the deviation from the actual response, in many cases, is now known. Making the forcing func- tion less general (steady-state sinusoidal) would allow the use of better solution techniques and improve the results in steady-slate vibration probitras.
With modification the method could be ex- tended to include analysis of bodies with ortho- tropic material properties, analysis of bodies encased in thin shells, structural damping, and three-dimensional analyses. Structural damp- ing in steady-state sinusoidal vibration may be
67

liichided i>y multiplying the stiffness by a factor of (l * ig), where i is ^l and g is the damping proportionality factor. Isothermal viscoelastic analyses may be performed with a program of this type for calculation of the stiffness matrix using the storage modules and letting g become the loss tangent.
In many problems a three-dimensional analysis would be most appropriate. The for- mulation of such a program is fundamentally easy but because of computer storage limita- tions it does not appear feasible at this time. However, the two-dimensional program may be used to obtain good approximations.
REFERENCES
1. M. J. Turner, R. W. Clough, H. C. Martin, and L. J. Topp, "Stiffness and Deflection Analysis of Complex Structures," J. Aero- space Sei., Vol. 23, pp. 805-824, 1956
2. E. L. Wilson, "Finite Element Analysis of Two-Dimensional Structures," U. of Calif. Structures and Materials Res. Lab., Dept. of Civil Eng., Rept. 63-2, June 1963
3. R. W. Clough and Y. Rashid, "Finite Ele- ment Analysis of Axisymmetric Solids," J. Eng. Mech. Div., ASCE, Vol. 91, No. EMI, Proc. Paper 4229, Feb. 1965
4. R. J. Melosh, "Basis for Derivation of Mat- rices for the Direct Stiffness Method," AIAA J., Vol. 1, No. 7, July 1963
5. R. W. Clough and A. K. Chopra, "Earth- quake Stress Analysis in Dams," Proc. ASCE, Vol. 92, No. EM-2, April 1966
6. J. S. Archer, "Consistent Mass Matrix for Distributed Mass Systems," J. Structural Div., 3rd Conf. on Electronic Computation,
10.
11.
Vol. 89, No. ST4, Pt. 1, Proc. ASCE, p. 161, Aug. 1963
H. Deresiewicz and R. D. Mindlin, "Axially Symmetric Flexural Vibrations of a Circu- lar Disk," J. Appl. Mech., pp. 86-88, March 1955
R. L. Shartna, "Dependence of Frequency Spectrum of a Circular Disk on Poisson's Ratio." J. Appl. Mech., pp. 641-642, Dec. 1957
D. C. Gazis and R. D. Mindlin, "Extensional Vibrations and Waves in a Circular Disk and a Semi-Infinite Plate," J. Appl. Mech., pp. 541-547, Sept. 1960
E. A. G. Shaw, "On the Resonant Vibrations of Thick Barium Titanate Disks," J. Acoust. Soc. Am., Vol. 28, pp. 38-50, 1956
A. E. H. Love, The Mathematical Theory of Elasticity, 4th Ed. Dover Publications, New York, 1944
DISCUSSION
Mr. Howard (Aerospace Corp.): Do you use a solid or a two-dimensional element in your model?
Mr. Baker: This is a two-dimensional ele- ment and the plane-stress plane-strain formu- lation is a triangle of unit thickness. In the axisymmetric formulation it is a segment of a ring. Actually we eliminate the whole ring and use a one-radian segment, triangular in cross section. This can be done in three dimensions by using a tetrahedral solid element, although this may cause trouble with computer storage capacity.
Mr. Langland (Naval Ordnance Test Station, China Lake): You mentioned earlier that you assume a linear displacement function for these elements. Would you care to elaborate ?
Mr. Baker: It has generally been found that ihe linear displacement function is satisfactory for this type of analysis. It is the easiest one to use. The displacements are set along the two coordinate directions and are written in terms of either the rz or the xy coordinates, e.g., A + Br Cz. By using this displacement, the forces are determined in terms of nodal point displacement. We minimize energy by using these linear displacement functions, writing an energy function and then using a Rayleigh-Ritz procedure to minimize it for the lower values.
Mr. Langland: Is the tetrahedral element you mentioned the one Gallagher developed and described in some papers ?
Mr. Baker: There are several papers about it. I think some one at General Dynamics pub- lished a paper using the tetrahedron.
68

i
MIN-MAX RESPONSE PROBLEMS OF DYNAMIC SYSTEMS AND COMPUTATIONAL SOLUTION TECHNIQUES
Eugene Sevin and Walter Pilkey 1IT Research Institute
Chicago, Illinois
Analysis and design problems of dynamic systems are considered in which the system and/or disturbances are not completely prescribed and the extremal peak responses are of interest. Discussions are pre- sented of mathematical techniques of linear and nonlinear programming and dynamic programming which can be used to solve these so-called min-max problems. These techniques serve to determine not o.ily the extremal responses but also the unknown properties of the system (the optimum design problem) and/or the disturbance (the extremal re- sponse analysis problem) which generate these responses. Detailed consideration is limited to single-degree-of-freedom dynamic systems.
E. Sevin
INTRODUCTION
Various analysis and design-oriented prob- lems in dynamics are concerned with achieving some minimum-maximum deviation of the re- sponse, though they may not always be stated in this form. For example, it may be desired to design a shock isolator for which either the maximum transmitted acceleration or the max- imum relative displacement is to be minimized. Or perhaps the response of a system to the "worst" loading of a prescribed class is sought. This might correspond to finding the particular loading among the class for which the system's maximum displacement is itself a maximum. The problem may be of a compound type in which, ior example, an isolator is desired hav- ing a minimum-maximum response under the "worst" loading. Still another possibility is a design for minimum response sensitivity where the system is sought for which the spread be- tween the maximum responses, corresponding
to the "worst" and the "best" loadings, is minimized.
This paper deals with min-max problems for which the properties of the system and/or disturbances are not completely prescribed. Computational techniques are discussed which, under these circumstances, serve to determine both the maximum (or minimum) system re- sponse as well as the unknown system and/or disturbance characteristics. Consideration is limited to single-degree-of-freedom dynamic systems. While the methods are easily gener- alized to higher dimensions, in some instances the associated computational burden appears to be a formidable one.
CLASS OF PROBLEMS
By way of introduction, consider the single- degree-of-freedom shock absorber and sh^ck isolator shown in Figs. 1 and 2, respectively. For unit mass the equation of motion for a shock absorber is
x f ufx, x) - g(t)
and for a shock isolator is
x t u(x,x) g(t),
(la)
(lb)
where ufx, x) denotes the system function and g(t) the disturbance (input) function. The sys- tem function generally is expressed in terras of
69

Fixed Böse A Absorber / /^"N / f \ / —1 u )- / V / / \ s /
Moss
^{Zht f—
git) Input Force
Fig. 1. Single-degree-of- freedom shock absorber
We n»ay nc» consider three types of mln- max problems, the first two being a simple type and the third a compound type.
Problem 1
Given a system u( x) and a class of disturb- ances g(t), find
Moving Base
Isolator
Fig. 2. Single-degree-of- freedom shock isolator
3—^(0
the state variables, i.e., for a linear spring- dashpot system
u{x,x) kx +
and is only an implicit function of time. In some instances, however, it is more appropri- ate to treat u as an explicit function of time.
It is convenient to introduce a state vari- able notation where the symbol x denotes the vector {■•}, whose elements are displacement x and velocity x. Then the types of systems we will consider are those covered by a set of first-order ordinary differential equations of the vector form
f(x,u,g) (2)
x(0) = prescribed. Equations (1) are merely special forms of Eq. (2).
We will define the response function h as being that aspect of the system response whose maximum deviation is to be either minimized or maximized. Th"s, for the isolator whose relative displacement is to be minimizec', h - x,, however, for the absorber we may wish to min- imize the maximum transmitted force, so that h = u. In general, then
h h(x,u)
and we will seek to determine the maximum deviation of h from some preassigned quantity in a time interval of interest, o < t <_ T. This is designated
mix h(x,u) • t
or
min max h(x) R t
max max h(x) g t
(3a)
Ob)
and the associated g(t). This is the analysis problem of determining the upper and lower bounds to the system response for incompletely prescribed disturbances or, equivalently, the problem of finding the response to the "best" and "worst" disturbances among a specified class. A way of prescribing the class of g(t) might be to specify total impulse and duration and/or to specify a band within which g(t) must lie. This problem can be generalized immedi- ately to multidegree-of-freedom systems, for example, for the study of stress and displace- ment bounds on continuous structural members for incompletely prescribed loadings.
Problem 2
Given constraints L(x,u) < o response and a disturbance g( t),
min max h(x,u)
on the system find
(4)
and the associated u(t). (In this problem u can- not be found directly as u(x), unless a class of u(x) is first prescribed [1], The latter ap- proach would represent a less general minimi- zation of h. Therefore, in the present formu- lation the determination of u(x) is considered a separate problem which ultimately requires that some class of u(x) be specified.) This is the design problem of determining a system whose response is optimum in a prescribed sense. At the same time,
max h(ji,u) t
represents optimal performance specifications against which the "efficiency" of any suboptimal system can be measured and the raarpfin for im- provement determined. The ability to establish
70

the optimal u( t) also suggests improved tech- niques for determining the best u( %) from among a prescribed class, since what has here- tofore been treated as a constrained minimiza- tion problem now can be viewed as the much more simple problem of approximating u[x(t)] to u(t), e.g., by the method of least squares.
where H(t - tj) is the unit step function, uj is a constant In the interval t j < t < t. + At, t. = (i - i)At, and u = o. A continuous rep- resentation Of u( t) iS
u(t) £ (uj-uj.,) Hft-tiKt-t.), (7)
Problem 3
Given constraints Ltx.u) < o on the system response and a class of disturbances g( t), find
where
or
min min max h(x,u) g u t
max min max h(x.u) R u t
(5a)
(5b)
and the associated ur t) and g( t). This type of compound problem corresponds to designing a system which is optimum for either the "best" or "worst" possible disturbances among a pre- scribed class. A problem of this sort related to the design of space vehicles is discussed by Blair, Lovingood and Geissler [2]. Examples in terms of shock absorbers and isolators are obvious.
It might be noted that these problems have tl.tr ir counterparts in the theory of differential games. Roughly speaking, Eq. (5b) corresponds to a player g whose goal is to maximize max h while an opposing player u is seeking to mini- mize it.
DISCRETE FORMULATION
Since we Intend to seek computational pro- cedures utilizing high-speed digital computers, it is essential that a discrete formulation of the min-max problems be developed. Various ap- proaches are possible, depending on the dis- cretization of u(t) and g(t).
Let the total time interval T be divided into n subintervals At;, i = 1,2,..., n. Denote the value of x at the beginning of the ith interval by X;. If the subintervals are of equal length At, then
X; = %[(i- 1) At] .
A piecewise constant representation of the system function uf t) is
u(t) E (iij-uj.,) H(t- t.) (6)
u'(t) - 2] fui-ui-i> ^t-ti)
with u- constant in t; < t < tj + At,
Possible representations for the disturb- ance function include a series of a discrete im- pulse applied at the beginning of each interval, i.e.,
g(t) E «i ^t-tj) (8)
where S (t - t j) is the Dirac delta function, and the piecewise constant form
Km = Z] (Ki- gi.i) Hft-tj) (9)
The solution to Eq. (2) provides, in effect, a transformation of state variables fro^t the ith to the (i + 1) st state. That is, we rriy write
'iti = FUpUj.gj) (10)
where the function F may be either an exact expression if a closed form solution to Eq. (2) is available or an approximating difference equation.
Finally, we represent the response function h in discrete form, so that the maximization over time t is equivalent to maximization over all stages i, i.e..
max h(x,u) - max hfXj.uj), i = 1,2 n+ 1 . (il) t
COMPUTATIONAL TECHNIQUES
Linear and Nonlinear Programming
The general problem of linear and nonlinear programming is the selection of the set of pa- rameters y. which minimizes (or maximizes) some objective function (performance index) qfVi) subject to certain conditions of constraint on the parameters, p(yi) < 0. When both the objective function and each of the constraining
71

functions are linnr in the yj, the problem is one of linear programming; otherwise, it is one of nonlinear programming. The solution tech- niques and relative ease of computation are far more advanced for linear programming prob- lems. Thus, while we will consider the problem "solved" when reduced to either a linear or nonlinear programming formulation, a numeri- cal solution in the latter case may not be easily obtained.
For the min-max problems, the maximiza- tion over time of h(x.u) is placed in a form leading to mathematical programming formula- tions by setting
8j *0, j-1,2 n+l (non-negative loading),
Rj - 0, i>i\*2 {pulse of duration T - nAt) ,
and
J 6(t)dt S ^gi
- R (prescribed total iiupulse. R) .
From Eqs. (12) and (15/,
4> - max I x • (18)
max h( «j, u j) (12)
The problem is now to extremize i-, subject to the prescribed constraints, with the addition of the requirement
hCxj.iij) <4>, i ^ 1,2 n + 1 . (13)
As a first example, consider a problem 1 situation in which the bounds to the maximum displacement of a clamped linear absorber are sought for a class of disturbances character- - ized by total impulse and duration.
Here, the specific form of Eq. (2) is
1 (14)
L-kx - CX + R{t)J
where the disturbance will be represented by a series of impulses as given by Eq. (8). The response function is merely the displacement, so that
!•.(«;.": ) (15)
An exact solution of Eq. (14) is possible and the state transformation, Eq. (10), can be extended for zero initial conditions to the form
2> -/Mt. -t , )
where
ß
- 1
{l-/^!/2,
c/cc < i, and
2a. 2 Jk .
sin lÄ.,'i)(t: tj)] (16)
The class of disturbance functions is char- acterized by
Then the mathematical programming problem is one of finding the set of gj satisfying the conditions set by Eqs. (17) such that / is a minimum (or maximum), where the xi are given by Eq. (16). In the form stated, the prob- lem is one of linear programming since /. and the constraints of Eqs. (17) are all linear func- tions of the unknown g,. However, we have yet to state an explicit condition for insuring that the max i x j |, found in 0 i t i T, is not exceeded at some t > T. One approach is to recognize that there exists a functional relationship be- tween x and x (i.e., a region of the phase plane) which insures that max UJ is not exceeded at some later time. In general, this will be a non- linear relationship among the g,, destroying the linearity of the problem. In the present ex- ample, this relationship is easily shown to be quadratic for Eq. (16). To retain the linear ity it is necessary to either approximate the non- linear function by a polygonal path in the phase space or, more simply, to extend sufficiently the time interval of interest. Clearly, the lat- ter approach would be followed here.
A second example is the problem 2 type, in which we seek to design an isolator whose rel- ative displacement does not exceed a prescribed value and whose maximum transmitted acceler- ation is minimized. The disturbance function is specified.
The system function, u( t), will be taken to be piecewise constant as in Eq. (6), and the state transformation obtained from the solu- tion of
x + u(t)
x(0)
■R(t) (19)
is
1 ^ "i-iHtj- tj)2 " ftftj). (20)
72

The response function is hdj.uj) -ui and, hence, ; ma* ui . The linear programming problem is the determination of the set of i^ lor which
X; Xi (21)
(prescribed displacement bound) and .- is a minimum, the xi and u; being related through Eq. (20). The solution to this problem is re- ported by Liber and Sevin (Ij; typical results are shown in Fig. 3.
Problem 3 is considered as a final examole of the linear programming formulation. The example is interesting in its own right and also serves to indicate that not all such problems admit to a linear, or even nonlinear, approach. We want to design an isolator whose response, for the "best" of a given class of disturbances, is such that the maximum acceleration does not exceed a prescribed value and the maximum relative displacement is minimized. That is, we seek to determine
min min max h ", ft. '
(22)
where the response function is hiij.Uj) - xä. We specify the class of disturbance functions to be of prescribed duration, total impulse and bounded intensity. Both the system and disturb- ance functions will be represented as piecewise constant, as in Eqs. (6) and (9), respectively. The state transformation now is
(23)
Again, with
the linear programming pivulem is to find the set of u; and the set of ^ satisfying Eq. (23) for which
(prescribed acceleration bound),
(prescribed force bound),
I] (Rj-Ki-.Ht^.-tj) - R
(prescribed total impulse), and such that ^ is a minimum.
Examination of Eq. (23) will indicate that the problem yields to a linear programming formulation simply because we are minimizing $ with respect to both the u; and g;. Were we instead to attempt to construct
min max ; ,
Isolator
'- - Prescribed (Constraint)
w/mi^
u is Sought Such That
Ma« / Acceleration\ t VOf Moss }
is Minimized.
Optimum Ouontities bie Starred.
Fig. 3. Optimum shock isolator
73

where an order of minimization and maximiza- tion has to be preserved, an alternate approach would be necessary. In this instance, the -nat- ter of linearity is of no consequence, so non- linear programming offers nothing new. We are forced tu turn then to dynamic programming.
DYNAMIC PROGRAMMING
The computation. 1 technique of dynamic programming can be used to solve all three classes of min-max problems, and hence is a more general formulation than either linear or nonlinear programming. The method is com- putationally quite straightforward; there is more of a problem in getting lost in a sea of notation. We will first illustrate the technique with respect to a problem 2 example considered earlier and then generalize to cover all three classes.
We want to establish the system function u( t), characterized by the set of ui, for which Ixjl i Xj (x. specified) and ; = max u^ is a minimum. The state transformation is' given by Eqs. (10); note that the system starts from res«, i.e., s, = o Assume for the moment that at time t (< tntl), the system is in state %. and that the min-max solution for the subsequent motion is known. Moreover, assume that this solution is known for M different values of the state %.. That is, we know
t(xp nun max j » 1 in- 1 .
m= 1,2. (24)
In this notation m = 1, j = l corresponds to the value of the initial state originally prescribed. Thus, the desired min-max value is represented by ^(x,1) - .VO).
We seek now a means for computing ;(»"_,). Consider the system to be in the state Xj., at time t j., and investigate its response under the choice of some value of u j., consistent with the constraint of Eq. (21). At time t later, i.e., at t j, the system will be in state Xj, as determined from Eq. (10), corresponding to which can be found the value of ; (»j). The maximum of the two quantities u j., and :(x^ is recorded. This process is repeated for a range of admissible u- j, so that
min max u ; . i'■ '(* i M
of r.. The entire process must be repeated for a sufficient range of m so that subsequently, at any stage j-1, the resulting state *, will be close enough to some x" in the matrix of known ;(x") values to permit accurate interpolation. The process is easily started at j = n ♦ l since at »n.i. n.i 0 for all x",,. We recognize that with dynamic programming the n • 1 dimen- sional minimization required in the linear (or nonlinear) programming formulation has been replaced by a sequence of n • i unidimensional minimizations. Since dynamic programming does not consider linearity, it represents a most powerful approach.
The notation is improved somewhat if we distinguish better between the subscript denoting the stage of the computational process and the state of the system response. Thus, the com- putational algorithm becomes
'nO-jfV h- *nO-j^jtl>j
j = n, n - 1. (25)
with
^Un<1) = o
where subscript j represents the state of the system and the subscript on : denotes the stago of the computational process. The minimiza- tion, of course, is only with respect to admissi- ble values of u, as determined from the system constraints of Eq. (21). The optimal choice of the Uj is retained in the computer memory at each stage. Once the desired :„,,(()) is deter- mined, knowledge of u, permits the process to be repeated forward in time to select the appro- priate set of u j.
Equation (25) follows directly from Bell- man's principle of optimality, which in essence says that regardless of the decisions made in reaching a particular state, subsequent deci- sions must constitute an optimal policy with re- spect to this state. This permits us to general- ize the formulation immediately. Let
extrem
represent any of the minimizations, maximiza- tions or min-max combinations appropriate to the three types of problems considered earlier. That is.
can be determined. Clearly, this value then corresponds to ;(x".,) for the particu'ar choice
extrem - min or min or max or min max or min min 5i l,i 8, R, u, g. u. K,
74

Then, if at the f n ♦ i - j) th stage of the process, corresponding to the system being in its (j o ) st state, we denote the min-max value by
- (»j,,) extrem max hfXj.Uj) . ^gv
the next stage in the process is given by
;n.2./V extrem naxjWSj.Uj). ^n< , . ^(Xj , , )j
The process starts with
if«. max h(x,iii t
(27)
(28)
and is conducted for j = n. n-1 i. The ex- tremes are taken only with respect to admissi- ble values of sj as determined by the stagewis« constr?ints
< s,
In the dynamic programming formulation it is necessary to distinguish between stagewise and process (overall or terminal) constraints. In the linear programming formulation, these appeared either as inequalities (stagewise con- straint) or equalities (process constraint), and both could be handled automatically. It is usu- ally said that the greater the number of con- straints, the easier is the dynamic programming solution since the space to be searched is re- duced accordingly. This is true enough with respect to stagewise constraints, but the com- putational burden is increased in the presence of process constraints. Specifically, the proc- ess constraint enters the problem as an addi- tional state variable. Consider, for example, the case in which the disturbance function is to have a prescribed total impulse.
r(R.T) g(t)dt - R . (29)
We define a new state variable z. as
r«i
rrg.t,) r(R,t.)
(30)
where rf K. t,) is the value of the constraint at time t,. The additional state transformation needed to supplement Eq. (10) is
r(B. t^,) = rfg.t:) - Arj .
where -T l is the change caused in the constraint variable r by application of u.) •
Unfortunately, the addition cf another state variable increases the already bothersome bur- den of dimensionality. An alternate approach possessing the original dimensionality is avail- able for some system >. It has been shown [3] for a certain class of absorbers, including lin- ear systems, that the response function and process constraint can be interchanged without increasing the dimension of the dynamic pro- gramming formulation. In the case of min-max displacement for an absorber with prescribed total impulse and time duration, the equivalent problem becomes that of finding the g(t) of duration T, such that ; x< < x (x prescribed) and the total impulse rCg.T) i j maximized. Here
'n.l-j fVl) = maX £ 8i . (31) .*)♦!
and in accord with the principle of optimality
is computed for j ^ n, n - l l. Typical re- sults for this problem are shown in Fig. 4.
SUMMARY
A number of practical problems of a minimum-maximum deviation, or min-max, sort have been described and classified as three types. These have been represented by discrete lormulations amenable to solution by such gen- < ral mathematical programming techniques as linear and nonlinear programming and dynamic programming. Where applicable, linear pro- gramming constitutes the most efficient com- putational approach. Dynamic programming is the most general technique but presents the greatest computational burden for higher order systems. The method is eminently practical, however, for single-degree-of-freedom dynamic systems. Certain of the more interesting prob- lems formulated have not as yet been solved numerically. These will be the subject of future publications.
ACKNOWLEDGMENT
This work was supported by the U.S. Research Office, Durham, N.C.
Army
75

I
1.2
0.8 -
0.4 g is Sought Such That Max Ul is Minimized,
g Belongs To The Class Of Forces Characterized By I
g(.).fi0 0^T \'0 t >T
R'0/Tg(t)dt.RaT Given.
Optimupi Quantities Are Srorred«
Fig. 4. Min-max solution for systems with prescribed total impulse and time duration of forcing function
REFERENCES
1. T. Liber and E. Sevin, "Optimum Shock Isolation Synthesis," Shock and Vibration Bull., Vol. 35, Part 5, pp, 203-215, Feb. 1966
2. J. C. Blair, J. A. Lovingood, and E. D. Geissler, "Advanced Control Systems for Launch Vehicles," Astronautics and
Aeronautics, Vol. 4, No. 8, pp. 30-39, Aug. 1966
E. Sevin and W. Pilkey, "Computational Approaches to the Min-Max Response of Dynamic Systems with Incompletely Pre- scribed Input Functions," to be published in J. Appl. Mech.
76

STRAIN RESPONSE OF SIMPLY SUPPORTED BEAMS TO POINT AND ACOUSTIC LOADING
Tony L. Pariott and Joseph A. Drischlsr NASA Langley Research Center Langley Station, Hampton, Va.
Although dynamic strain response is the basic ingredient in fatigue life estimation schemes, there is a lack of documented comparisons of measured and predicted strains for responses of either complex or simple structures. Many investigators have been concerned with measurements of strain responses on structural components under op- erational conditions for which calculations are impractical to perform. On the other hand, theoretical investigations have been carried out for relatively simple structures for which few experimental strain re- sponse tests have been conducted, perhaps primarily because of the difficulty of obtaining a sufficiently close approximation to a set of classical boundary conditions.
It is the purpose of this paper to present a comparison of measured and predicted strain responses for carefully controlled experiments on beams whose boundary conditions approximate, to a high degree of ac- curacy, those of a simple support. The simply supported boundary condition was found to be readily amenable to mathematical analysis and characterized by low damping. Considerable development work was required in perfecting beam boundary attachments having satisfac- tory simple support behavior. Dimensions of the beams were chosen so that significant vibration amplitudes (in excess of the beam thick- ness) could be obtained in the fundamental mode. The beams were tx- cited by sinusoidal and random loadings applied both acoustically (uni- formly distributed along beam) and mechanically (at a point location). In addition to strain measuremeiits, both the total equivalent viscous damping and the magnitude of the exciting force were obtained.
In general, good agreement between measured and predicted dynamic bending strain was obtained; however, for sinusoidal point loading the theory ov?rpredicted, and for sinusoidal acoustic loading it underpre- dicted the dynamic strains. For random loading the theory and experi- ment were in close agreement. The total equivalent viscous damping, measured by the log decrement technique, was found to have amplitude and modal dependence.
J
T. L. Parrott
INTRODUCTION
Present-day strain response prediction schemes are intended tu provide engineering
estimates of the strain levels at critical loca- tions in complex structures loaded by spatially distributel forces characterized by continuous spectra with or without discrete frequencies superimposed. The prediction of strain re- sponse is useful for the purpose of estimating fatigue life and for determining noise trans- mission characteristics. The dynamic strain response of an aircraft or space vehicle struc- tural component to various types of complex dynamic loading depends, in addition to the detailed characteristics of the loading, on the geometry of ehe structure, the distribution of the structural mass and elasticity, the ability of the structure to dissipate vibrational energy,
77

and the boundary conditions imposed on the particular structural component of interest by the remaining struct ire.
Many investigators have been concerned with measurements of strain responses on structural components under operational condi- tions for which calculations are impractical to perform. On the other hand, theoretical inves- tigations have been carried out for relatively simple structures for which few experimental strain response tests have been conducted, perhaps primarily because of t'ie diÜAculty of obtaining a sufficiently close approximation to a set of classical boundary conditions.
It is the purpose of this paper to present a comparison of measured and predicted strain responses for carefully controlled experiments on beams whose boundary conditions approxi- mate those of a simple support. It was found that the simply supported boundary condition was readily amenable to mathematical analysis and was characterized by low damping. Consid- erable development work was required, how- ever, in perfecting beam boundary flexure at- tachments having satisfactory simple support behavior.
TEST MODEL
Illustrated in Fig. 1 are the boundary con- ditions associated with the various idealized models used in the classical description of beam behavior. The free-free beam was elim- inated from consideration in the present inves- tigation because of the practical difficulty of supporting it in such a manner as to permit the excitation of the higher modes, as well as the infrequent encounter with anything approaching this type of support in existing hardware. The clamped-clamped support was also eliminated frori consideration because of the unwieldy mathematics needed to describe the response to random loading and also because of the in- herently high joint damping. Finally, the sim- ple support (hinged-hinged) was chosen because of the ease with which the mathematics could be handled, the low damping that could be achieved, and because this type of boundary condition is not too far removed from some practical situations. The last entry Illustrates an idealized model of the beam boundary con - ditions which actually existed. The development work centered around attempting to make the spring stiffness, which governed the vertical displacement, very stiff without introducing an appreciable resistive bending moment [1]. This resistive bending moment is represented by the tcrsional springs. By using a combination of
CONDITIONS «T SUPPORT 1
fxxmowrr COWOITIONS
VERTICAL OISPUACEMENT.Y *0P£.S BEWWG ,
M0»CNT. LI OX»
*0 ■•0 '0 i FREE
■ -f i •0 = 0 1
*o \ 1 # -i- CLAMPEO
•0
] «0 | =0 i
HMGEO
; K, K,
1 SUPPORTED
»o ASIK-0 HO
-0 | ASK*0 i
|Kj-<0 1
Fig. 1. Boundary conditions of end supported beams
analytical and empirical methods, a very close approach to true simple support conditions was achieved.
A schematic diagram of the beam geometrv, including flexure support details and strain measuring locations, is shown in Fig. 2. The analytical work indicated that the resisting bending moment would be negligible if the beam thickness to flexure thickness ratio were on the order of 25. The flexures were spot welded to the beam as close as possible to the right-angle bend. Observations indicated that the best per- formance could be obtained if the flexures were clamped approximately 0.032 in. from the beam. Apparently, this clearance minimized the tor- sional spring compliance.
As criteria for evaluating the success to which simply supported conditions were
STRAIN GAGES- -DRIVING POINT
20" m m —^r-
J
r DRIVING
^ POINT _
Q ̂ ^ t w.-Z ,,^;.v ... _l
PLAN VIEW
SIDE VIEW
FLEXURE CLAMPS- MOUNTING FIXTURE-
200"
SUPPORT FLEXURE-
-,r;, BEAM END 0|0 SECTION
^-SPOT WELDS
004"
Fig. 2. Schematic diagrams of test beam and support system
78

approached, both natural frequencies and mode shapes were measured. Figure 3 shows a comparison of the measured and calculated frequencies for the firsi five symmetric modes for a typical beam installation. In this plot the ratio cf calculated to measured frequencies is plotted as a function of mode number. It will be seen that the measured frequencies are within 5 percent of the calculated frequencies for all measured modes. However, the agree- ment is not quite as good at the higher frequen- cies. This is probably due to the spring action of the flexures, which calculation indicates should become predominant at the higher frequencies.
ft), MEAS
MODE 1
MODE 3
MCDE5
DISTANCE ALONG BEAM, X/L
BEAM
^ =^
/-EXPERIMENT / -o o
-THEORY
12 3 4 5 6 7 8 MODE NUMBER
Fig. 3. Comparison of calculated and measured resonant frequencies of test beam
As a further test for the closeness of ap- proach to the simple support condition, the measured mode shapes for the first three sym- metrical modes are compared to the theoretical mode shapes in Fig. 4. In these plots the meas- ured strain at two off-center locations on the beam is ratioed to the strain measured at the mldspan location and plotted as a function of the beam length. The theoretical mode shape for the simply supported beam is a sinusoid of the appropriate wavelength as shown lor the first three symmetric modes. Note that the measured strain ratios are very close to their proper relative magnitudes. Thus, it appears that a close approximation to simple support conditions has been attained based on measured frequencies and mode shapes.
A number of beams, constructed to be as nearly identical as possible, were tested in this experiment to evaluate individual differ- ences of behavior. It was found that as far as frequencies were concerned, the deviation from
Fig. 4. Comparison of calculated and measured beam flexural mode shapes
calculations did not exceed 10 percent. Also, nodal patterns were in excellent agreement with calculations. By far the greater part of the differences in behavior between beams was in the dynamic strain response which, in turn, was due to relatively large differences in the damp- ing between the beams.
ANALYSIS
The test program and the data acquired were directed toward the comparison of the measured and the predicted strain response taking into account the detailed nature of the modal damping and the driving force. The equation of motion for a beam undergoing a general time varying distributed loading is given by:
EIWxxxx + P* + /3W - P(x,t) (1)
where
E = modulus of elasticity (lbf/in.2),
I = moment of inertia (in.4),
w s= deflection (in.),
P = mass per unit length (lbm/in.),
3 = damping coefficient. (lbf-sec/in.2),
P(x,t) = ioad distribution along beam (lbf/in.),
Wx = aw/Sx, and
W = 3W/9t.
79

This equation was solved for the four cases corresponding to the type of driving force used in the tests:
t. Sinusoidal point load,
2. Random point load,
3. Sinusoidal acoustic load with normal incidence, and
4. Randorr acoustic load with normal inci- dence.
The normal mode technique used to solve Eq. (1) made use of the characteristic functions for a simply supported beam to express the beam displacement response as a series [2]. The strain response was then obtained by taking the second space derivative of the displacement response. For the point load cases, use was made of the Dirac delta function to express the loading as an idealized point load.
The solutions of Eq, (1) for the rms strain at the midspan location for the above four cases are as follows:
P(fJ
1. Point sinusoidal load
2. Random point load
/ 6L \ \':^l Pri
''""* = \Ebh2v2j n2 i
(2)
ms
h (3)
3. Sinusoidal acoustic loading for normal incidence
P(fn)
\Ebh2rW \n3/ h
4. Random acoustic loading for normal incidence
(4)
-12/2Lw/fnNPrml (5)
where
(f.) = root mean square strain re- sponse for pure mode excitation Onn/in.),
L = length of beam (in.),
b = width of beam (in.),
h = thicknetf. of beam (in.),
n = mode number,
= ratio of damping to critical damping,
^ = angular frequency (rad/sec),
fn = normal mode frequency, and
P( f n) = sinusoidal loading at a normal mode frequency (lb).
MEASURED DAMPING
The ability to predict the absolute strain magnitude at a given location on a beam under- going dynamic excitation depends in part on an exact knowledge of the total equivalent viscous damping for each mode of interest as well as how it changes as a function of the response amplitude. Damping was measured by the free decay technique since this was believed to be the most expedient technique available. In Fig. 5, a sample of the measured damping is shown for the first three symmetric modes of a beam as a function of the rms value of the driving force. In this plot, the damping is given on the vertical scale in percentage of critical damping and the driving force is plotted on the abscissa in millipounds of force. Note that the damping in the first mode is essentially inde- pendent oi response amplitude, having a value of approximately 0.35 percent. However, the higher modes are seen to be dependent on re- sponse amplitude; the second mode damping varies from 0.10 percent to about 0.24 percent for the driving force range applied, and the third mode damping varies from about 0.09 to 0.20 percent.
COMPARISONS OF EXPERIMENTAL RESULTS AND THEORY
As indicated previously, a knowledge of the damping and driving force enables prediction of the strain response at any location on a given simply supported beam. Measured strain re- sponses have been obtained at the midspan lo- cation of the beam for the four types of dynamic loadings for which analytical expressions have been derived. Comparisons of these measured responses with the analytical estimates are given below.
80

005 r
M00C o I
D 3
A 5
z u S 002 F S !
" .001
10 02 05 I 2 5 10 20 RMS DRIVING FORCE, MILLIPOUNDS
_L J 50 100
Fig. 5. Measured damping for three modes of test beam as function of driving force
Sinusoidal Point Loading
In Fig. 6, the strain response in micro- inches per inch is plotted as a function of the driving force in millipounds. The measured and predicted strain by use of Eq. (2) is shown for the first three symmetric modes at the midspan of the beam. Predicted strain is shown by the dashed curves and the experimental strain values are indicated by the symbols. The driving force in this case was sinusoidal point loading with a frequency corresponding to that of the particular mode of the beam being driven. Note that the agreement between theory and experiment is quite good.
Random Point Loading
The frequency spectrum of the |x>int load- ing applied to the beam midspan is shown in Fig. 7. Note that the spectrum is flat from 20 Hz to approximately 800 Hz. Strain re- sponses of the beam have been measured for the first three symmetrical modes to such a spectrum of force for various levels of force input. These measured strain responses are shown in Fig. 8 along with the predicted strain response of Eq. (3) (modal theory) as a function of the mode number. Also included for compar- ison is the strain predicted for the first mode response by the well-known Miles theory [3].
12 5 K) ?0
DRIVING FORCt, RMS MIULITOUNOS
Fig. 6. Comparison of calculated and measured modal strain responses of test beam as function of sinusoidal point driving force
81

20r
%
2.0 50 100 iX-C
FREOUcNC, Hz 5-» 1000
Fig. 7. Frequency ipecirum of random point loading
CALC €MEAS IC
MILES THEORY
12 3 4
MODE NUMBER
MODE o I
D 3
O 5
-MODAL THEORY
Fig. 8. Comparison of calculated and measured strain responses for random point loading
20-
10-
W*,N/iK
2 5 10 20 50 ACOUSTIC UDAD, RMS MILL! POUNDS
Fig. 9. Comparison of calculated and measured modal strain responses for sinusoidal acoustic loading
Note that the Miles theory is overpredicting as expected, being approximately 25 percent high. The modal theory is also overpredicting and varies from 7 to 15 percent above the experi- mentally observed strain response.
involved because of the inherent lack of preci- sion associated with extrapolating an acoustic pressure measurement from a rigid surface to a nearby vibrating surface.
Uniform Sinusoidal Acoustic Loading
In Fig. 9 is shown the measured strain re- sponse and strain response predicted from Eq. (4) for acoustic loading of the sinusoidal type where the acoustic loading is expressed in milli- pounds of force. The acoustic loading was meas- ured by microphones flush mounted into a surface in which the beam was also mounted to provide baffling. In the first mode, theory and experi- ment are again in good agreement, with theory overpredicting. In the two higher modes, how- ever, this trend is reversed. Here the theory seems to be underpredicting, although the gen- eral trend of the strain response is still pre- dicted very well. Greater discrspancies will probably be encountered between theory and experiment when acoustic measurements are
Uniform Random Acoustic Loading
The frequency spectrum of the random acoustic loading is shown in Fig. 10. A flat spectrum cannot be obtained with the means available for producing acoustic loading. The beam resonance frequencies of 20, 200, and 500 Hz are indicated on the plot by the vertical lines. Note that the beam frequencies are lo- cated at points on the spectrum where there is a local minimum or where the spectrum is changing rapidly. Hence, it was surmised that this type of spectrum would provide a severe test for the theory since the assumption was made that the excitation for each mode consisted of white noise with a level corresponding to that of the actual spectrum .'evel at the resonant frequency of the particular mode of interest.
82

d6. R« 0002 OVNES/cm»
MOp
IOC 'x/X/v-'v 80
70- ÄPPHOX MOOAL FREQUENCIES OF TEST BEAM
60
20 50 100 FREQUENCY, Hi
200 500 1000
Fig. 10. Frequency spectrum of random acoustic iDading applied to test beam
'CAUC
'MEAS
"
0
o ^-MODAL IHEOftV
- MODE
z o | - □ 3
1 1
0 5
1 1 ! 1 1
1 2 3 4 5 6 MODE NUMBER
Fig. 11. Comparison of calculated and measured strain responses for ran- dom acoustic loading
The results in Fig. 11 indicate the devia- tion of experiment from theory for the input spectrum shown in Fig. 10. The data are plotted as the ratio of calculated to measured strain response as a function of the mode number. Note that the theory predicts the strain responst
to within about 40 percent. The greater devia- tion of experiment from theory for the third mode may somehow be related to the fact that the spectrum was changing rapidly with respect to frequency for this mode; however, for the most part the discrepancies are believed to be due to experimental error. These results indi- cate that the present assumptions and approxi- mations used in the modal analysis schemes for predicting strain levels are adequate for strain response estimates for the simple struc- tures used in this experiment.
CONCLUDING REMARKS
A technique has been employed for the de- sign of simple structures to approximate sim- ply supported boundary conditions characterized by low damping. The use of this technique on a simple beam has established confidence in modal analysis methods for providing good en- gineering estimates of strain levels for loadings ranging in complexity from simple sinusoidal point loading to random acoustic loading.
REFERENCES
1. Dennis U. Noiseux, Norman Doelling, Preston W. Smith, and James J. Coles, "The Response of Electronics to Intense Sound Fields," WADD TR 60-754, Jan. 1961
2. R. L. Barnoski, "Response of Elastic Struc- tures to Deterministic and Random Excita- tion," AFFDL-TR-64-199, May 1965
John W. Miles, "On Structural Fatigue Un- der Random Loading," J. Aero. Sei., Vol. 21, No. 11, pp. 573-762, Nov. 1954
83

DISCUSSION
Mr. Smith (Bell Aerosystems Co.): Did you investigate how the damping of the speci- men «as distributed between the joints at the two ends, the material itself, the internal mate- rial damping, and the basic acoustic damping? I assume the test was not conducted in a vac- uum. Second, when you compared the responses for the random point loading, the analysis of this spectrum appeared to be coarse. Tnis might account for the differences between the experimental and theoretical results. Third, how was the random acoustic loading correlated along the length of the beam? It obviously plays a vital part, again, in the comparison between theory and experiment.
Mr. Parrott: I did not try to distinguish between the various components of clamping; I only measured the total equivalent viscous damping, using the logarithmic decrement, ex- citing the specimen sinusoidally, letting it de- cay, and taking the first 3 db of the record.
Mr. Smith: In the spectral analysis of the point random loading, the points on your graph appear to be quite wide apart in frequency. You are playing with three lightly damped modes, and your spectrum might not be as flat as you think it is.
all modes of the strain resjxjnse except one and looked at it.
Mr. Smith: I assume that spectrum was your inp'it spectrum of the point loading.
Mr. Parrott: Yes, This is a 1/3-octave band analysis of the force leading.
Mr. Smith: Your modes are very much less damped than a 1/3-octave analysis of your input spectrum could handle. Your spectrum might not be flat, and this could account for the scatter between theoretical and measured re- sponses.
Mr. Parrott: Right, but in the experimen- tal analysis we centered the filter of the 1/3- octave band analyzer on the beam resonant frequency and looked with several other widths of filters. It seemed that we were getting all the strain response in that particular mode. Damping may have played a part in some of our analysis scatter here because we measured damping using a sinusoidal excitation and had to extrapolate back to the approximate ampli- tudes at which we felt the specimen was re- sponding under random loading. Perhaps the damping values are off in the region in which we are interested for random loading.
Mr. Parrott: We assumed in the calcula- tions that the spectrum was actually white noise at the point where the beam was resonating. We thought we could do this because with the low damping, less than 1 percent of critical for this beam, there was no intermodal coupling. We simply assumed all the strain response to be due to that particular mode; we filtered out
Mr. flr.Uth: The third question was the spatial correlation of the acoustical loading on the beam.
Mr. Parrott: The loading was normal im- pirgement, and we have no reason to believe that it was anything but unity throughout the total length of the beam.
84

PREDICTION OF FLIGHT VIBRATION LEVELS
FOR THE SCOUT LAUNCH VEHICLE
Robert B. Bost LTV Aerospace Corporation LTV Astronautics Division
Dallas, Texas
A widely used technique for establishing random vibration criteria is based on scaling of measured vibration data by such factors as acous- tic sound pressure level, mass loading, and surface weight density. This paper pri ents a prediction procedure developed in the process of establishing random vibration criteria for the Scout launch vehicle. The prediction procedure was designed to define the acoustically in- duced random vibration environment throughout the Scout vehicle by using the limited data sample from six vehicles. A transfer function relating the internal vibration level to the external noise level was established by use of the measured vibration data and the calculated external nois" levels at the point of measurement. This transfer function was then used to calculate the expected vibration levels in each area of the vehicle from the noise level at each location. Statistical methods were used to establish confidence levels for these calculations. The success jf the prediction procedure is demonstrated by comparison of the predicted vibration levels with measured data obtained on subse- quent Scout flights. In addition, the applicability of the procedure to üt.;-..?r vehicles is demonstrated by comparison of predicted and meas- ured vibration levels for the Atlas-launched fire velocity package.
R. B. Bost
INTRODUCTION
The prediction of environmental vibration levels for a new vehicle is a problem continu- ally lacing the vibration engineer. The diffi- culty of this problem is only slightly mitigated when the engineer is subsequently required to modify the predicted environment on the basis of limited measured data obtained in the vehicle flight test program.
Several methods of predicting environmen- tal vibration levels have been formulated by
various investigators in the dynamics field. These methods are, in general, based on em- pirical information. Some of the methods have been employed with considerable success, par- ticularly wl ?re the vibrations are induced solely by acoustic excitation. In this case, a strong correlation usually exists between the external noise level and the induced vibration level, so a transfer function may be defined which reflects the observed correlation.
It is the purpose of this paper to present a transfer function method for the prediction of acoustically induced random vibrations. This method was developed for the Scout launch ve- hicle to aid in revising the vibration test re- quirements to simulate better the actual flight environment. The method was developed from analysis of measured vibration data obtained during the boosted flight phase of six different Scout vehicles. These vehicles were equipped with 19 vibrometers located in three of the four vehicle interstage structures and with sensitive axes in both the longitudinal and transverse directions.
85

The success of the prediction procedure is demonstrated by comparison of the predicted vibration levels with measured data obtained at different locations on subsequent Scout flights. In addition, the applicability of the procedure to other launch vehicles is demonstrated by com- parison of measured and predicted vibration levels for the fire velocity package launched by the liquid-propellant Atlas booster.
REVIEW OF SCOUT FUGHT DATA
An examination of the flight vibration data from the six Scout vehicles indicated that the maximum random vibration levels occur at a flight time corresponding to maximum dynamic pressure and are induced by the turbulent boundary layer surrounding the vehicle at this time. These vibrations are broadband random in character and approximate a stationary Gaussian random process for several seconds of flight time. These characteristics were ver- ified by amplitude probability density analyses and by autocorrelation analyses.
Since the Scout vibration environment at maximum dynamic pressure arises solely from acoustic excitation, it was elected to devise an analysis procedure whereby all vibration data arising from this source could be considered as a single statistical sample. This was ac- complished by the transfer function approach [1] which consists of relating the external sound pressure level to the internal vibration level through a transfer function. Since the vibration data currently available for the Scout are quite limited for some portions of the vehicle, this was considered to afford the best estimate of the overall vehicle vibration environment con- sistent with the current data sample.
PREDICTION OF EXTERNAL NOISE LEVELS
The application of the transfer function method required a knowledge of the external noise levels existing at maximum dynamic pressure. Since measured data were not avail- able, a prediction procedure was used to esti- mate these levels.
External sound pressure fluctuations in- duced by turbulent boundary layers have been shown by several authors [2,3] to be strongly correlated with the free-stream dynamic pres- sure. The correlation is represented by a re- lation of the form
Kq (1)
pressure, and K is a factor which may vary over a wide range depending on the aerodynamic "cleanliness" of the vehicle. Measurements on the Scout vehicle [4] indicate a value of K on the order of 0.005. Equation (1), written in terms of the overall sound pressure level (OASPL), for a K value of 0.005 is
OASPL 20 IOR PR 20 lou q . 82 du . (2)
relative to 0.0002 dynes/sq cm. This equation is shown graphically in Fig. 1 by the curve labeled "conventional."
Experimental data indicate that the corre- lation represented by the above equation tends to overestimate the magnitude of the external pressure levels in the supersonic region of flight. The deviation from the conventional curve suggested by Van Houten [3] for higher dynamic pressures is shown in Fig. 1 super- imposed on the conventional curve. This curve was used to estimate the Scout boundary layer noise levels at maximum dynamic pressure.
The spectrum of sound pressures have been correlated with the Reynolds, Strouhal, and Mach numbers as a combined parameter [2] (Fig. 2). The parameters defining the co- ordinates of the graph in Fig. 2 are as follows; Co is the speed of sound at sea level; v is the free-stream velocity; . o and i , are the kine- matic viscosities at sea level and at the altitude of operation, respectively; and is the thick- ness of the boundary layer.
The boundary layer thickness was deter- mined by the flat-plate approximation [5],
0.37L(: VU1 (3)
where L is the distance from the leading edge of the structure initiating the disturbance, and the quantity within the parentheses is the in- verse of the Reynolds number. For these cal- culations, the nose of the vehicle was assumed to initiate the disturbance.
The one-third octave band soand pressure level (1/3 OBSPL) was calculated from the sound pressure spectrum level (SPL) by the relation
1 3 OBSPL SPL f 10 log Af (4)
where PK is root mean square (rms) boundary layer pressure, q, is the free-stream dynamic
where the SPL was established at the geometric mean frequency, fM (fL f^,)1 2,and Af " fH - 'L is the one-third octave bandwidth.
The application of this procedure to a typical Scout vehicle operating at a free-stream dynamic pressure of 2600 psf at an altitude of 35,000 ft is shown in Fig. 3.
86

z >- Q
a: 3
a z
>
20 SO 100 300 500
DYNAMIC PRESSURE (PSF)
1000 2000
Fig. 1. Boundary layer nc;gc external overall sound pressure level
3
~ -TO
> -30 -
o o
MODIFIED STROUHAL NUMBER (Weov<)0/v2„<>)
Fig. 2. Normalized boundary layer pressure spiectrum
87

r
ISO
I«
130
a.
o 5 i»
S „o
100
WTEKTAGC SECTION ^ ̂
:
0 -^'^
1 i ! 1 1 1 1 1 1 1 1 1 1 1 1 1 1 1 1 SO 100 200 S00 1000
1/3 OCTAVE BAND CENTER FREQUENCIES (CPS)
2000 5000
Fig. 3. One-third octave band sound pressure levels at maximum dynamic pressure for typical Scout vehicle
DEVELOPMENT OF TRANSFER FUNCTION
The transfer function approach to the pre- diction of random vibration environments in- duced by acoustic excitation is limited prima- rily to the prediction of the broadband characteristics of the vibration. Some authors [6] have used a transfer function to define the octave band vibration levels, while others [1] have attempted a finer definition by considering one-third octave band levels. Both approaches apply an arbitrary "correction factor" to ac- count for possible narrow-band peaks in the vibration spectrum.
The transfer function considered here is in terms of one-third octave band levels, but the appropriate correction factors are obtained by correlation with measured narrow-band data rather than by specifying some arbitrary factor.
Details of Transfer Function Definition
The one-third octave band external sound pressure levels in decibels relative to 0.0002 dynes/sq cm were calculated by the procedure outlined in the preceding paragraphs for each measurement location on each of the instru- mented Scout vehicles. The corresponding
measured one-third octave band rms vibration levels were extracted from the acceleration time histories and converted to decibels rela- tive to 1 g rms. The difference of these two quantities, 1/3 OBSPL - 1/3 OBGRMS, was defined as the transfer function relating external sound pressure level at maximum dynamic pressure to the internal vibration levels. These data are shown as a function oi the one-third octave band center frequencies by the scattered points in Fig. 4.
A regression analysis was performed on these data to provide a "best fit" in the least squares sense. This analysis was conducted to smooth the data and to provide a statistical basis for establishing confidence in predictions made from it. Quartic regression was found to provide the minimum standard deviation of er- ror about the regression line, and this fit is shown superimposed on the data points of Fig. 4 along with the corresponding 80 and 95 percent confidence limits.
The external sound pressure levels shown in Fig. 3 were used in conjunction with the transfer function shown in Fig. 4 to predict the one-third octave band g rms vibration levels for a typical Scout vehicle. The resulting levels were then converted to an acceleration power density spectrum by assuming the spectrum was flat within each one-third octave band.
88

■; -t»
z >- o
f 4 -i
>
o z
9
o
-13
u u
-180
'^^ o 8 § V
CONFIDENCE LIMITS
^"X6 8 8 .^*0y
a 0 o 9
^^ ^ ^-0 0 0 0 8.
<r'0^ O § Jt-lf o 0 o o
' 0J>ö"t5 8 o § o <r § o 8 0
§ o S-"^ ö o o
0\
REGRESSION LINE
J I L_J I I I r ill! L_I I L_J I I I I I L_X 20 50 100 200 300 1000
1/3 OCTAVE BAND CENTER FREQUENCIES (CPS)
2000 »00
Fig. 4. Structural response to acoustic loading in one-third octave band levels
The calculated acceleration power density spectra for the three Scout interstage sections designated "B", "C" and '15" are shown in Figs. 5 through 7. These spectra are based on the transfer function defined by the regression line and by the upper 80 and 95 percent confi- dence lines of Fig. 4. The spectra presented represent a smooth envelope of the spectra calculated by assuming a flat spectrum in each of the one-third octave bands.
the measured narrow-band data. On this basis, the upper 95 percent confidence line of Fig. 4 was chosen as the appropriate "transfer func- tion" relating the external noise levels and the .nduced vibration levels for each of the Scout interstage sections.
APPLICATION TO OTHER VEHICLES
CORRELATION WITH MEASURED DATA
The calculated acceleration power density spectra of Figs. 5 through 7 were compared with measured narrow-band data to establish the appropriate correction factors to be placed on the vibration levels predicted on the basis of the regression line of Fig. 4. This comparison is shown in Figs. 5 through 7 in terms of an en- velope of all of the measured data from each of the three interstage sections. As can be seen, the upper 95 percent confidence line provides a satisfactory envelope of all of the peaks in
While the data presented here were col- lected from the Scout launch vehicle, these em- pirical curves have been used to predict vibra- tion levels for other launch vehicles where vibration data are available. The predicted levels fit the measured data with about the same degree of accuracy as they do the Scout data. This is illustrated in Figs. 8 and 9 by comparison of measured and predicted vibration spectra at two locations on the fire velocity package launched by a liquid-propellant Atlas booster. As for the Scout data, the upper 95 percent confidence level provides a satisfactory envelope of all of the peaks in the measured spectra.
89

r
0.10
a.
o i
o lu
i 2
^
.01
.001
.0002
^r "X PREDICTED V LEVELS
Al \
/ Al . * 95%
\ CONFIDENCE
■ 1' / \\ / L/l / \\
/ ir / w / H ' \ CONFIDENCE
/ r ■ V \ / / 1 1 Xs
/ / 1 V > f / N / /Ns /
/ / ; C ' / , / / ^
1
/ ^ / / r . /
7 / \ MEASURED
/
/ J 20 50 100 200 500
FREQUENCY (CPS)
1000 2000 5000
Fig. 5. Measured and predicted acceleration power density spectra for Scout vehicle "B" section
90

200 500 1000
FREQUENCY (CPS)
Fig. 6, Measured and predicted acceleration power density spectra for Scout vehicle "C" section
91

a. JJ
a -i <
u u <
0.0002
0.001
50 100 200 500
FREQUENCY (CPS)
1000 2000 5000
Fig. 7. Measured and predicted acceleration power density spectra for Scout vehicle "D" section
92

0.0002
100 200 500 FREQUENCY (CPS)
1000 5000
Fig. 8. Measured and predicted acceleration power density spectra for fire veIoci*y package — equipment shelf
93

200 500 KA)
FREQUENCY (CPS)
Fig. 9. Measured and predicted acceleration power density spectra for fire velocity package -- aft separation ring
CONCLUDING REMARKS
By choosing the desired risk level (confi- dence line), the transfer functions presented in Fig. 4 may be used with reasonable success on
other launch vehicles. In particular, the 95 percent level should satisfactorily envelop most narrow-band peaks and, hence, provide a good first estimate of the vibration environment of a new vehicle.
REFER5JNCES
1. R. W. Mustain, "Prediction of Random En- vironments," SAE National Aeronautic and Space Engineering and Manufacturing Meet- ing, Los Angeles, Sept. 23-27, 1963
2. K. M. Eldred, W. J. Roberts, and R. White, "Structural Vibrations in Space Vehicles," WADD TR 61-62, Dec. 1961
3. J. J. Van Hauten, "Analysis Procedures for Predicting Boundary-Layer-Induced Noise," LTV Appl. Res. Div. Rept. 718-01, Jan. 1962
D. A. Hilton, "Scout-Vehicle Aerodynamic Noise Measurements," Noise Control, Vol. 2, pp. 28-31, Oct. 1963
H. Schlichting, "Boundary Layer Theory," p. 35. Pergamon Press, New York, 1935
P. T. Mahaffey and K. W. Smith, "Method for Predicting Environmental Vibration Levels in Jet Powered Vehicles," Noise Control, Vol. 6, pp. 20-26, July 1960
94

DISCUSSION
Mr. Whiteley (Ampex Corp.): Did you de- velop a transfer function from acoustical noise to mechanical vibration?
Mr. Bost: Yes, that is correct.
Mr. Whiteley: Is this felt applicable to various space vehicles?
Mr. Bost: I think it is definitely applicable to aerodynamically generated noise. We have tried it in a few cases for engine-generated noise, and it seems to give a fairly good corre- lation there also. We have tried it on other ve- hicles where measured data are available, and generally it gives a pretty good prediction of the maximum level.
Mr. Whiteley: This acoustic coupling, then, is felt to come through the skin. Is it structur- ally or acoustically coupled on the inside ?
Mr. Bost: It is structurally coupled. It is transmitted through the skin to the basic struc- ture. All these measurements were made on primary structure which was fairly heavy and stiff.
Mr. Franken (Bolt Beranek and Newman): What is the typical diameter of the Scout vehicle on which the empirical procedure was based ?
Mr. Bost: It varies from about 40 to 30 in.
Mr. Franken: With this diameter of about 2-1/2 to 3 ft, the ring resonance would be somewhere around 1500 cycles. Perhaps the peak in your transfer function is due to some cylindrical behavior which ought to be scaled by the diameter of the vehicle you are dealing with.
95

RESPONSE OF STRUCTURAL COMPONENTS OF A LAUNCH VEHICLE
TO IN-FLIGHT ACOUSTIC AND AERODYNAMIC ENVIRONMENTS Khushi L. Chandiramani and Richard H.
Bolt Beranek and Newman Inc. Cambridge, Massachusetts
Lyon
A unified system of procedures is developed for estimating some im- portant classes of iu-f)ight noise environments and the resulting sur- face vibration on a typical launch vehicle. Noise environments are classified according TO the nature of the spatial and temporal corre- lations of the associated fluctuating pressure fields. The structural elements considered are a cylinder and a flat plate. The presentation is general enough to apply to orthotropic and liquid-loaded structures. Some numerical examples are presented for estimates ol frequency spectra of acceleration on the vibrating structures.
R. H. Lyon
INTRODUCTION
This paper summarizes a recent study [l] undertaken to establish a system of procedures for estimating some importint classes of in- flight noise environments and resulting surface vibration levels experienced by skin segments of a typical launch vehicle. The in-flight noise environments are estimated empirically, based largely on available laboratory and field data and well-accepted similarity arguments. The procedures for response estimation draw heavily on the available pool of completed analyses, wliich have been modified to apply to vehicle skin segments that are orthotropic because of string- ers and stiffening rings or filled with liquids.
The study results in a basic system of simple procedures and solutions that are comprehensive enough to establish some preliminary design specifications and intelligible enough that an in- tuitive understanding of t le results can be gained.
The study was undertaken with the follow- ing objectives in mind:
1. The final estimates should be in more or less closed form, so that the effect of various input
parameters can be easily appraised, and so that detailed calculations (such as numerical inte- gration or numerical solution of a differential equation) are not necessary for final predictions.
2. The input parameters themselves should be as few as possible and should relate easily to trajectory and geometric parameters.
The above objectives dictated certain com- promises — for example, ignoring of variations in convectio." velocity and eddy decay in the mathematical muM for pressure fluctuations under a turbulent boundary layer, use of thin- shell theory, and ignoring of flutter-type inter- action between the vibrating structure and the exciting pressure field.
IN-FLIGHT ACOUSTIC AND AERODYNAMIC ENVIRONMENTS
Classification cf K>ise Sources
Figure 1 presents a summary of environ- mental noise sources in terms o^ vehicle con- figuration and Mach number. The letters in the figure refer to different types of noise sources.
The noise sources can be broadly classified into two categories: the acoustic noise associ- ated with rocket jet exhaust stream which domi- nates during or shortly after vehicle lift-off, and the aerodynamic noise which dominates during the rest of the trajectory. Table 1 shows the classification and coding of these noise sources. Table 1 and Fig. 1 broadly define the range of trajectory and geometric parameters over which a particular type of environment is
97

r
P,ms=o|q
TBL SUBSONiC SEPARATION C
P, rms" Olq
f TRANSONIC TRANSON.C SEPARATION SHOCK p OSCILLATION '-
D
TBL B
TBL
B
«awsSör MUD TRANSON.C SHgCK^^
Prms=OOSq
G SHOCK INDUCED SEPARATION Prms^008q
Pr^s^004"
^fcS^fc Pfmssoo5a
^^^TBL 5
Prrns^002"
PrrI,sS0 02q
UNPERTURBED TBL B
LiFT-OFF NOISE
A
MACH NUMBER
i' 190
180
170 1 MACH NUMBER
Fig. I. Summary of environmental noise sources as a function of vehicle configuration and Mach number
TABLE 1 Classification and Coding of In-Flight Acoustic
and Aerodynamic Environments
Flight Environment Mach
No. Code
Acoustic noise during lift-off — A i
Unperturbed and attached turbulent boundary layer — B
Reparation aft of flares at subsonic speeds C
Shock oscillation aft of flares at transonic speeds D
Separation aft of transonic shock oscillation (D) E
Shock oscillation forward of flares at supersonic speeds F
Separation aft of supersonic shock oscillation (E) G
Wake impingement — H
98

manifested, and the associated overall root mean square level pTmi of fluctuating pressure in terms of free-stream dynamic head q. Here the detailed procedures for estimating the en- vironmental parameters are omitted; they may be found in Ref. 1. Extensive use of available laboratory and flight data was made for this purpose.
Grouping of Noise Sources for Response Estimation
For vibration analysis, it is convenient to group the environments in accordance with the nature of the spatial and temporal correlations of the associated fluctuating crcssure fields. The environments are, therefore, grouped and modeled mathematically.
Environment A. Acoustic Noise During Lift-Off — The sound pressure field surrounding a segment of the vehicle is modeled approxi- mately by a diffuse sound field; that is, at any frequency, uncorrelated plane sound waves are assumed to impinge with equal intensity from all possible directions exterior to the structure surface. The pressure field acting on the struc- ture surface is statistically homogeneous and stationary in space and time, and its spatial correlation is Isotropie.
The sound pressure levels of the noise field exciting the structure are estimated by dimen- sional scaling of field data; the scaling parame- ters are the total lift-off thrust, jet exhaust ve- locity, effective nozzle diameter, and overall dimensions of the vehicle.
Environments B, C, E, G and H. Turbulent Boundary Layer and Similar Noise Sources — We can assume the fluctuating pressure fields asso- ciated with these environments to be statistically homogeneous and stationary in space and time. However, unlike a diffuse sound field, these pres- sure fields show dominant propagation only in the direction of the mainstream flow. An ade- quate representation of these environments is given by a simple mathematical model of a con- vecting and decaying fluctuating pressure field completely defined by the following: a constant convection velocity Uc; normalized wave number spectra *,(!«,) and *3rk3), in the directions pa- rallel and transverse to the main flow; and the normalized "temporal" or "moving-axis" spec- trum *„,(•). The combined wave number and frequency spectrum <Pp(k. ) is given by
where k is the wave number vector (kpkj), and P rm s is the overall mean square value of
the pressure fluctuations. The familiar fre- quency spectrum measured by means of a fixed microphone is then p^ ♦,-(.), given by
P^s v-) X (T u ♦„(k.Odk (2)
The flow parameters that must be estimated for calculation of structural response are the bou'idary-layer displacement thickness h*, the convection velocity uc, pt t and the spectra <t>f( o and ♦jfkj). The displacement thickness : * can be related to the distance from the lead- ing edge, uc can be related to the Iree stream velocity, and prnis ciax be related to the free stream dynamic head. The shapes of ♦f(w) and <i>3(k3) can be obtained in terms of .' and uc. A dominant component of the structural response of airborne vehicles, as a -»suit of the excitation by the environments under discussion, occurs at "coincidence" which is the match between the spatial patterns of vibration on the structure surface and those of fluctuations In the exciting pressure field. In such a case, details of eddy decay become unimportant and one can bypass the necessity for specifying the spectra ♦jfk,) and <t>J <>) separately [l].
Environments D and F. Shock Oscillation — The oscillation of shock fronts is a result of shock/boundary layer interaction. It is a relatively low-frequency phenomenon. At transonic speeds the shock oscillation occurs downstream of the flares; at supersonic speeds it occurs upstream of the flares. The empirical evidence for shock oscillation is obtained by noting that the static pressure measured near the mean shock-front location consists of a random rectangular wave with a dominant fre- quency [2,3].
For the purpose of estimation of structural response from environments D and F, we idealize the environment in the following way. The pres- sure in front of and behind the shock front has constant values. There is a discrete jump A in the pressure across the shock front. The shock front oscillates in the direction x, of the main flow and always remains straight in the trans- verse direction X3. The displacement y(t) of the shock front from its mean position is repre- sented by a narrow-band random Gaussian proc- ess with zero mean, centerband frequency w , and rms value a. The statistical properties"0! y( t) are identical to those of the displacement of an oscillator of resonance frequency w c, when excited by white Gaussian noise. Note that the random pressure field, assumed to be asso- ciated with an csclUating shock front, is statis- tically homogeneous in time but not In space.

For estimation of response, the parameters AP> 'W aiMl -' o* t*16 exciting environment are determined empirically by relating them to the flow and geometric parameters such as Mach number, dynamic head, ambient static pressure, and flare geometry.
STRUCTURAL COMPONENTS
We have studied various dynamic properties of two simple structural elements, a flat plate and a cylinder. To handle most situations of interest, these structures have been studied in both their finite and infinite form, and in their Isotropie as well as orthotropic form. We have considered also the case where a liquid (inside the cylinder or on one side of the plate) forms an integral part of the structure. Here we pre- sent some of the major results.
Infinitely Extended Structures
When the exciting pressure field is statisti- cally homogeneous over the surface of the re- sponding structure and when the structure bound- aries or the discontinuities on the structure surface do not play a significant role, it is worthwhile to exploit these simplifications by considering an infinitely extended model of the structure.
Infinitely Extended Isotropie Cylinder or Plate — Consider vibration (in the radial direc- tion) of an infinitely long, Isotropie, thin cylin- drical shell of radius a, thickness h, and sur- face mass density Let i3 be the axial and circumferential coordinates. The resonance frequency - for a vibration pattern with wave number k = (kj.kj) on the cylinder surface is found to be given by the resonance condition,
accounted for in the simplest possible way; the influence of shear deformation and of axial and tangential inertias is neglected. In spite erf these approximations, the final result has been found to be quite accurate, especially for thin cylinders with thickness-to-diameter ratio of 10 2 or less [4].
If we think of the resonance condition of Eq. (3) in terms of energy functions, the kinetic energy of the vibrating structure is propor- tional to v2, the contribution to the potential energy from the bending stresses is propor- tional tor4, and the contribution to the potential energy from the membrane stresses is propor- tional to cos4- . The resonance condition for an infinite flat plate can be obtained by simply omitting the term cos4e in Eq. (3), since the effect of curvature and resulting membrane stresses is absent in a flat plate.
The loci of constant resonance frequency v in the wave number plane (t.e) are shown in Fig. 2. In the membrane region of the (r.f) plane, cos 0 is larger than r; hence membrane stresses dominate and the resonance condition becomes approximately
.2.: (8)
The resonance loci in the membrane region are thus radial straight lines. In the bending region of the (r.r) plane, r is larger than cos t1; therefore, bending stresses dominate, the cylin- der responds like a flat plate, and the resonance condition becomes approximately
(9)
The resonance loci in the bending region are, therefore, circles. The boundary between the membrane and bending regions is given by
(3) cos 0 (10)
where ^ and (r.O) are the dimensionless fre- quency and wave number defined as
and
Here,
va c f ,
kC-a)1 2 ,
!kl . (k.^k/)'
tan (' kj/k,
(4)
(5)
(6)
(7)
h \l2 is the radius of gyration and Cf is the velocity of longitudinal waves in the cylinder material. In deriving Eq. (3), the in- fluence of bending and membrane stresses is
Infinitely Extended Orthotropic Cylinder or Plate — For analyzing an orthotropic structure, the inertial, extensional, and bending properties of the structure are averaged over the sources of its orthotropy, such as axial stringers and circumferential stiffeners in the structure. The average properties thus defined are valid for vibration with wavelengths larger than the spa- tial extent over which the structural properties are averaged.
The averaged surface mass density enters into the kinetic energy of vibration. The aver- aged extensional and bending rigidities of the structure (these can be different in the axial and circumferential directions) enter, respectively.
100

I I
BOUNDARY BETWEEN 'MEMBRANE' AND "BENDING" REGION
1
Fig. 2. Loci of constant resonance frequency in the dimensionless wave number plane (T.G), isotropic cylinder
into the components of potential energy con- trolled by the membrane and bending Presses. The description of the resonance loci in the wave number plane is qualitatively the same as that for the corresponding isotropic structure [1].
Infinitely Extended, Liquid-Loaded Cylinder or Plate — We consider only the liquids whose sound velocity exceeds the phase velocity of vi- bration on the structure surface. For such cases, no net energy is radiated from the vi- brating structure into the liquid, and the im- pedance offered by the liquid pressure to the structural vibration is inertlal. The mass loading m f per unit surface area owing to the liquid is approximately given by
p0/k (11)
where pn is the liquid density and k is the mag- nitude of the wave number of vibration on the structure surface.
This additional mass loading effect can easily be incorporated into the dynamic prop- erties described above for the "empty" struc- tures. This liquid mass loading, in general.
tends to reduce the resonance frequencies and suppress the membrane effects induced by the curvature. For example, if the isotropic cylin- der shown in Fig. 2 were filled with a heavy liquid, the resonance loci in the membrane region of the (T.O) plane would no longer be radial straight lines; the loci would tend, rather, to be extensions of the circular resonance loci in the bending region, thus reflecting the sup- pression Os. the curvature-induced membrane effects.
Structures of Finite Extent
When the excitation field is not statistically homogeneous ever the surface of the responding structure, or when the discontinuities such as the structure boundaries are expected to play a significant role, it becomes necessary to con- sider the modal representation of the finite structure. Often, the analyses performed on highly idealized structui es with simple bound- ary conditions yield concepts (and answers) powerful enough to find application in more general situations.
Modal Representation for Finite Cylinder or Plate — Consider a rectangular plate of
101

r
dimensions ( i» "-a» simply supported along its edges. The flexural vibration at the plate can be resolved into a double infinity of its orthog- onal modes. The spatial pattern 4m„(x) of the mode (m.n) of this series is given by
^(K) - sin (ovrjc,/^,) sin (nvx^lj) , (12)
ll» »3 are the coordinates parallel to /,, The
where and ti, and m.n are positive integers. modal wav"? number k associated with the mode (m.n) is gi ?nby
k - (k^kj) - (mWlt, nv/l3) (13)
This is the dominant wave number correspond- ing to the spatial pattern of Eq. (12). la other words, the spatial Fourier transform of Eq. (12) would peak at the wave number k given by Eq. (13). The larger the dimensions -t, and l3 of the plate, the sharper this peak in the Fourier transform will be, until in the limit the peak approaches a Dirac delta function for an infinite plate.
For a cylinder, odd numbers of half- wavelengths of vibration along the circumfer- ence are not possible. However, for every even number 2n of half-wavelengths along the cir- cumference, two independent modal shapes must be specified. Thus, for a cylinder of length ', and circumference t3t simply supported along its edges, the modal shapes 4'mn(%) are
;<mn(») sin (niTTx, ^j) sin (2nrT\}/ij).
and (14)
•l'~J*) sin (HITTX. M cos (2nTTi, ' )
The structures we have considered are simply supported along their boundaries. The resonance frequencies of their modes are, therefore, related to the associated modal wave numbers by the resonance conditions (such as Eqs. (3), (8), (9)) for the corresponding infinite structures.
Modal Densities for Finite Structures — Modal density n(w) is defined as the numbe of modes whose natural frequencies lie in a unit radian frequency bandwidth around frequency «. The simplest way of calculating modal densities is to represent the structural modes as a lattice of points in the wave number plane k, where the location of each mode is determined by its as- sociated modal wave number. By considering the geometry of the resonance loci in the k plane, we can easily calculate the modal densities [1,5].
Calculations show that for an Isotropie cyl-
modal density increases with frequency. It at- tains its peak value at the ring frequency and maintains a constant value, roughly two-thirds of the peak value, above the ring frequency. This constant value of modal density above the ring frequency applies also to a flat plate of the same area as the surface area of the cylinder. As noted before in connection with Eqs. (3), (8), (9) and Fig. 2, above the ring frequency »t (i.e., i > l), a cylinder is dynamically equivalent to a flat plate.
Detailed calculations of the modal density for orthotropic and liquid-loaded structures are reported in Ref. 1.
STRUCTURAL VIBRATION INDUCED BY ACOUSTIC AND AERODYNAMIC ENVIRONMENTS
Response of Cylinder or Flat Plate to Turbulent Boundary Layer Pressure Field (Environments B, C, E, G, or H)
Consider a turbulent boundary layer (TBL) pressure field over an Isotropie cylinder, the pressure field being convected along the gen- erators of the cylinder. Figure 3 shows the geometry of the situation in the wave number plane k for three different frequency ranges. At each frequency ^, most of the excitation from the TBL pressure field is shown to be concentrated in a narrow strip centered around k, = fVlJc, where k, is the wave number in the flow direction and Uc is the convection velocity. The width of this strip in the k, direction de- pends on the eddy decay time or the temporal spectrum *m(^) (see Eq. (1)). As shown in Fig. 3, this "excitation strip" divides the wave num- ber plane into regions of hydrodynamically slow (HS), hydrodynamically coincident (HC), and hydrodynamically fast (HF) modes. These modes are defined by the tra^e in the axial di- rection of the phase velocity of vibration at frequency w. The trace velocity for a HS mode is less than Uc. The HF and HC modes are defined similarly.
The three frequency ranges represented in Fig. 3 are defined by the two critical frequen- cies, the ring frequency , rJ and the hydrody- namic critical frequency MK , defined as "-h >
UJVKC (15)
inder, below the ring frequency Cf/a, the
Almost invariably, the hydrodynamic critical frequency is higher than the ring frequency for structures of current interest. For ■•> < oh, the strip of excitation in the wave number plane intersects the resonance locus (Figs. 3b and 3c);
102

VARIATION OF <I>pik.w)
IN THE k DIRECTION
BENDING CONTRIBUTION
(O 5
Fig. 3. Resonance loci and domain of excitation in the wave number plane, isotropic cylinder, TBL pressure field: (a) -o - .h, (b) .r < j < ,h, and (c) „• < -^
for "-h» it does not (Fig. 3a). For V only the bending stresses are dominant and the cylinder behaves like a fiat plate (Fig. 3b); for M < üT, both the bending stresses and the mem- brane stresses become important (Fig. 3c).
In the wave number plane, the domain of excitation at any frequency is quite narrow and sharply defined; therefore, the HC modes find the best spatial match or coincidence with the excitation field. The excitation of the HS and HF modes arises from relatively secondary ef- fects. The first of these effects is the result of the extension, or "tail," of the excitation field beyond the narrow strip defining the coincident region in the wave number plane. These tails of the excitation field (see the variation of <!y k. o in Fig. 3a) are governed by the tem- poral fluctuations, that is, the spectrum <t>m( J), of the pressure field in the TBL. The second
effect is due to the finite extent of any real structure. If the structure Has many edges and discontinuities (i.e., a small mean free path), the edge effects will contribute to some coupling with the excitation field.
For the situation considered in Fig. 3a, the frequency * is higher than the hydrodynamic critical frequency. Any resonant response of the structure at this frequency must arise from the secondary effects described above. In this frequency range, most of the resonant response is controlled by the temporal spectrum Qjv), the contribution from the edge effects being relatively negligible [6]. Below the hydrody- namic critical frequency vh, the dominant struc- tural response is not only resonant but also coincident, and is caused by the interaction be- tween the exciting pressure field and the struc- tural modes that lie in the wave number plane near the intersection of the resonance locus and the excitation strip (Figs. 3b and 3c).
For the noncoincident and resonant re- sponse above -h where response is controlled by 4>j ■), as well as for the coincident and resonant response below ^ , the interaction be- tween the pressure environment and the appro- priate structural modes is characterized by the matching of the wave numbers in the pressure field and the modal wave numbers. This inter- action takes place over the entire surface of the structure and is more or less independent of the edges. Therefore, we can simplify the calculations for power transfer and vibration response by considering a corresponding struc- ture that is infinitely extended or "edgeless."
The following general procedure is used to calculate the vibration response of structures excited by a TBL or by similar convecting-and- decaylng pressure fields. Consider the corre- sponding edgeless structure. In different fre- quency bands, find the mechanical power that the fluctuating pressure field transfers to the structure via the matching wave numbers of vibration at resonance. Equate this power input to the power dissipated as a result of the struc- tural vibration. (The power can be dissipated inside the vibrating structure as well as into the surroundings.) Solve for the velocity spec- trum of structural response. The resulting estimate pertains to resonant vibration aver- aged over the surface of the structure. Thij technique has been successfully applied to isotropic, orthotropic, and liquid-loaded cylin- ders and plates [1].
We omit the mathematical details and pre- sent only the results of a typical calculation. Figure 4 shows the spectrum for resonant ac- celeration of an isotropic cylinder excited by
103

£ in u jj -> 5
si 5g
«I -1 o
I- o
^ (E
HOO
-140
CYLINDER FILLED WITH A LIQUID OF SPECIFIC GRAVITY 1
40 63 KW 160 250 400 6S0 1000 1600 2S00 4000 6S00 OjOOO KpOO 32 SO M IZS ZOO 320 300 800 1230 2000 3200 5000 «000 12,5<M
ONE-THIRD OCTAVE BAND CENTER FREQUENCY IN Hz
Fig. 4. Response of cylinder to TBL pressure field
a TBL pressure field. The cylinder is 25 ft in diameter, 200 mils thick, and has a dissipation loss factor of 0.01. The boundary layer pres- sure fluctuations have a mean convection veloc- ity of 1250 fps with a free-stream velocity of 1800 fps. The boundary layer displacement thickness is 0.25 ft. The response spectrum is calculated up to the hydrodynamic critical fre- quency fh. For the empty cylinder, the re- sponse is seen to peak at fh and at the ring frequency f r. When the same cylinder is filled with a liquid of specific gravity (, the liquid mass loading brings down the response levels and suppresses the membrane effects as well as the peak at the ring frequency.
Response of Cylinder or Flat Plate to Diffuse Sound Field (Environment A)
Consider a diffuse sound field impinging on the exterior of an isotropic cylinder. Figure 5 shows the geometry of the situation in the wave number plane k fcr three different frequency ranges. At each frequency w, the excitation from the diffuse sound field is shown to be re- stricted to wave number magnitudes ranging from 0 to ka - Wc, where c is the sound speed. This region is shown as a shaded quarter-circle in the wave number plane. The structural modes situated in the wave number plane inside this shaded circular region are acoustically fast (AF) modes, those situated outside are acoustically slow (AS) modes. The magnitude of the phase velocity of vibration at frequency M of an AF (AS) mode is higher (lower) than the sound ve- locity c .
The three frequency ranges represented in Fig. 5 are defined by the two critical frequen- cies, the ring frequency ■JT , and the acoustic critical frequency ^ , defined as
-c c2.cf. (16)
For most structures of interest, , > ,J . At a frequency w > üC (Fig. 5a), all the resonant modes of the structure find a good spatial match or coincidence with some wave number compo- nents of the impinging sound field. The resonant vibration here is controlled by the bending stresses or the flat-plate behavior of the struc- ture. At a frequency .> < ,;r (Fig. 5c), only some of the resonant modes that are controlled essen- tially by membrane stresses are coincident. Thus, for the situations depicted in Figs. 5a and 5c (namely, u > a;c, and w < a>r}, the dominant structural response arises from the surface interactions between the environment and the resonant and coincident modes. The vibration analysis in these frequency regimes can, there- fore, be performed equally well on an infinitely extended or edgeless structure. In the inter- mediate frequency range, ^ < , < ^r (Fig. 5b), a fairly important frequency range, no coinci- dence or surface interaction is possible be- tween the resonant modes and the sound field. Any interaction causing resonant response in this frequency range must arise from the effects due to the boundaries and discontinuities on the structure surface. The analysis on the corre- sponding infinite or sd^elers structure would give zero resonant response in this frequency range.
f
104

— AF RESONANT MOOES
AS RESONANT MOOES
AS RESONANT MODES
Fig. 5. Resonance loci and domain of excitation in the wave number plane, isotropic cylinder, diffuse sound field: (a) ■• . , (b) ■ ■ . and (c) , ■ ,
Response calculations for excitation Irom a diffuse sound field are based on a modal ap- proach, so the size, boundaries, and discon- tinuities of the structure can be taken into con- sideration. The interaction between the sound field and different classes of modes over the surface, perimeter, edges, and corners of the structure can be expressed in terms of coupling parameters, which, in turn, can be related to the radiation efficiencies of modes. These cal- culations have been successfully completed for isotropic, orthotropic, and liquid-loaded cylin- ders and plates [1,7,8]. The vibratlonal energy of a structure is dissipated partly by radiation into the surrounding acoustic medium; there- fore, the radiation efficiency, in addition to de- termining the extent of coupling between thv. structural modes and the sound field, modifies the total dissipation loss factors of modes. Our approach is to calculate the response of a single mode to a diffuse sound field, and then extend the concepts to include groups of structural modes resonating in different frequency bands.
Again, we omit the mathematical details and present only the re&ults of a typical calcu- lation. Figure 6 shows the spectrum for reso- nant acceleration of an isoiropic cylinder ex- cited by a diffuse sound field. The cylinder is 30 ft long, 25 ft in diameter, 200 mils thick, and has a structural dissipation loss factor of 0.01. In the response calculations, this loss factor of 0.01 is increased slightly by the addition of the effective radiation loss factor. The accelera- tion spectrum for a cylinder with discontinuities, shown in Fig. 6, is calculated for the case where line sources of discontinuities are spaced 5 ft
40 63 100 160 250 400 630 1000 1600 ?SOO 4000 6300 IQjOOO 16000 32 50 80 125 200 320 500 800 1250 2ÜO0 S200 5000 800O 12,505
ONE-THIRD OCTAVE BAND CENTER FREOUENCy IN Hz
Fig. b. Response of cylinder to diffuse sound field
105

apart, along the axial and circumferential direc- tions of the cylinder. As we noted before, the response at frequencies above the acoustic criti- cal frequency fc and below the ring frequency f r is dominated by the surface interactions and is, therefore, hardly influenced by the presence or absence of structural discontinuities, edges, or boundaries. However, between the ring fre- quency and the acoustic critical frequency, the edge coupling is important and the response level depends on the mean free path of vibration or on the ratio of sti uctural surface area to total length of the edges. The discontinuities reduce the mean free path and increase the resonant response.
Response of Cylinder or Flat Plate to Oscillating Shock Front (Environment Dor F)
As explained before, the pressure field as- sociated with an oscillating shock front is not spatially homogeneous. When a shock front
over a structure surface undergoes a random oscillatory motion, the portion of the structure near the mean shock position experiences a fluctuating pressure field. Consequently, energy flows from the environment into the structure in this localized region, and the resulting vibra- tion is transmitted to the other parts of the structure. Since the structural vibration is derived from a localized source of excitation, t :bration level averaged over the structure SU* -e clearly depends on the extent of the structure. Also, shock oscillation frequency is generally found to be quite low (20 to 100 cps). As a result, only a few lowest order modes of the structure determine the vibration response. These facts dictate consideration of a finite structure with well-defined boundary conditions and estimation of Individual modal response for the first 5 or 10 modes. Thus, in this case, statistical concepts (like modal density) cease to apply to the very few modes involved. The statistical concepts can, however, be applied to the random oscillatory motion of the shock front. Details of the response estimation for oscillat- ing shock are given in Ref. 1.
REFERENCES
1. K. L. Chandiramani, S. E. Widnall, R. H. Lyon, and P. A. Franken, "Structural Re- sponse to Inflight Acoustic and Aerodynamic Environments," Bolt Beranek and Newman Inc., Contract NAS8-20026, BBN Rept. 1417, 31 July 1966
2. A. L. Kistler, "Surface Pressure Fluctua- tions Produced by Attached and Separated Supersonic Boundary Layers," NATO, AGARD Rept. 458, 1963
3. D. R. Wiley and M. G. Seidl, "Aerodynamic Noise Tests on X-20 Scale Models," Boeing Co., Tech. Rept. AFFDL-TR-65-192, Vols. I and n, 1965
4. M. Heckl, "Vibrations of Point-Driven Cylin- drical Shells," J. Acoust. Soc. Am., Vol. 32, pp. 1553-1557, 1962
5. P. W. Smith, Jr., and R. H. Lyon, "Sound and Structural Vibration," NASA CR-160, 1965
6. J. E. Ffowcs Williams and R. H. Lyon, "The Sound Radiated From Turbulent Flows Near Flexible Boundaries," Bolt Beranek and Newman Inc., Rept. 1054, Contract Nonr 2321(00), 15 Aug. 1963
7. G. Maidanik, "Response of Ribbed Panels to Reverberant Acoustic Fields," J. Acoust. Soc. Am., Vol. 34, pp. 809-862, 1962
8. P. W. Smith, Jr., "Response and Radiation of Structural Modes Excited by Sound," J. Acoust. Soc. Am., Vol. 34, pp. 640-647, 1962
BIBLIOGRAPHY
Bies,D A., and P. A. Franken, "Notes on Scaling Jet and Rocket Noise," J. Acoust. Soc. Am., Vol. 33, pp. 1171-1173, 1961
106

DYNAMIC VIBRATIONS OF THICK-WALLED
ELASTIC ANISOTROPIC CYLINDERS AND
SPHERES WITH INTERNAL DAMPING*
Gabriel Cinelli Argonne National Laboratory
Argonne, Illinois
A new finite Hankel transform is used to find the transient displacement and stresses in thick elastic cylinders and spheres composed of mate- rial with transverse curvilinear isotropy and internal viscous damping for the following problems: (a) plane strain motion of an infinitely long circular cylindrical shell, (b) torsional motion of a finite circular cy- lindrical shell, and (c) radially symmetric motion of a spherical shell. The dynamic loads on the surfaces arc taken as arbitrary functions of space (torsional case only) and time.
It is shown that the problems of the solid body, the thin shell, and cavity in an infii;'i_ medium can be obtained from the thick shell solution as limiting casos. Specializing the surface tractions to standard forms such as an impulse or a sinusoid, the free, harmonic, and static mo- tions are recovered. Physical quantities such as resonance and me- chanical impedance are derived and studied. Using the displacement equations, it is shown that the radially symmetric motion is analogous to the plane-strain motion of the cylinder. The results for isotropic bodies are found by specifying certain values for the elastic constants.
An extended Weber transform is also introduced, permitting solution of infinite media problems in a manner which is more direct than existing techniques.
G. Cinelli
INTRODUCTION
In recent years considerable effort has been expended on study of dynamic wave propa- gation and vibration in elastic isotropic bodies of finite and infinite dimensions. In contrast to
this has been the small amount of work done regarding elastic anisotropic bodies, although many materials of practical interest are of this nature. What work has been accomplished is mostly harmonic wave propagation and vibra- tions. Very few transient problems have been solved, especially for finite regions. A good review and evaluation of the field is given by Harmon [1] and Scott and Miklowitz [2].
For some classes of anisotropy and axes orientation, the equations of motion of an elas- tic solid admit plane strain and torsional solu- tions. These are the class of problems studied in this paper. The purpose of this study was to determine the transient displacement and stresses in elastic bodies of material with transverse curvilinear isotropy :nd viscous internal damping for the following problems: (a) plane strain motion of a thick infinitely long
Work performed under the auspices of the U.S. Atomic Energy Commission.
107

circular cylindricaJ shell, (b) torsional motion of a finite thick circular cylindrical shell, and (c) radially symmetric motion ot a thick spher- ical shell. The surface loads in these problems are taken as arbitrary functions of space (tor- sional case only) and time. The only previous work on such problems has been that by Eason on harmonic loads [3j.
The paper is divided into five parts. The first section I-its the pertinent finite and infi- nite transforms use', «j solving the various problems. The second portion treats in consid- erable detai1 the plane strain motion of the cy- lindrical shell. The general solution is obtained by means of a finite Ilankel transform [4]. By specifying certain values for the elastic con- stants, the solution for the Isotropie body is given. Next the cases of the solid body and the tiün shell are shown tc be limiting cases of the thick shell solution. An extended Weber trans- form is then introduced which solves the prob- lem of a cylindrical cavity in an iminite medium. The surface tractions are specialized to stand- ard forms, such as step function and sinusoid, which enable the free, harmonic, and static mo- tions to be recovered as special cases. Physi- cal quantities such as resonance and mechanical impedance are then derived. In the next section, it is shown that the radially symmetric motion of a sphere is analogous to the plane strain problem wtüch enables the solutions for the sphere to be obtained directly from those in the plane strain problem. The general solution for the torsional motion of the finite cylindrical shell is given in the fourth part. Finally, the results and conclusions of the study are pre- sented.
TABULATION OF TRANSFORMS
The various transforms and their proper- ties are listed in this section to make the paper self-contained. In these formulas, a bar over a lower case letter indicates the transform vari- able, whereas a prime on a letter indicates differentiation.
Extended Finite Hankel Transform [4J
{(r) 2
T L iJ.'f -':!>)
kj ( '.U).2 f( *".<-".)
(3^
F.fVi) k2* Z*[1' (^b)2])'^^*^^^
■t-y-n .T'( -:b) - k.T,( f.b) 2. (4)
where - ^ is a positive root of
* kYj-'il.)
Idr2 r dr r2 >
V-'i'^kJj-jb); -ity-'ib)
,]'( -ja) • hj ( .aK . (5)
Uyj:ih) tl!J:( ^i1'^
if To) • kf(b) f (a) <■ bUa) f(-;>. (6)
Extended Weber Transform
Hif(r), 7 7( i) | rf(r) C:(r, i) cir'
a _ r ■ ■. r • - 1 2
C (r, O JjiDl IY'J ia) • UY ( -.a)'
- Y.( -r) i ij'j ia) t hj^ ia)] .
if( i) C (r. ■■) (I > frr) f -—
lj,(<a)' •iYV.a)<hY,Oa)]
(7)
(8)
(9)
Icir2 r (Jr r2 ir if'dt) • liffa)l -- :2U i).
(10)
H(f(r)l ((--,) rf(r) C.Xr, -j) dr Finite Hankel Transform [5]
a 1 r <: h, i --12, (1) Hff(r)] f f( .* r rf(r) J,( .r) .Ir
1), 12. (11)
108

!-?/ ... /.. _^ Jj^b); (12) •u b, t > 0.
(18)
where . is a poEitive roo: of
jj.'f-.b) • kj., -jh. 0 (13)
/(l2f ' i]< 2 \ H(--i . ; iL - _ ,- bj (:ib)!f'(b) ♦ kf(b)i
f ( f;) ■ (14)
F'nite Cosine Transform
Cffx)! ! ffn) f^x) cos ^^-^ cix. n 0.1.2. a
(15)
f(x) 1 f(0) * -? y" V(n! cos ~ , (16) n^ 1
C l'^l\ (-W f'(a) - f(0) - üil! f(n) . (17) (S)
VI u c n ,<,. ' c i 2 7
'u u ^2-' C22-
(19)
(20)
where
Jt. '6 = radial and circumferential stress components, respectively;
u = radial displacement of cylinder;
t' = density of elastic medium;
ciici2c22 = elastic constants; and
D = viscous damping coefficient.
Putting Eqs. (19) and (20) into Eq. (21) gives
lu t 1 £U .Li üiii + _L ^ (21)
where
In these formulas thfe following notation holds:
J!. Y, = Bessel functions of ♦he first and second kind, respectively, and of order : ;
H.c = linear integral operators;
a,b = inner and outer radii of shell, respectively;
h.k = constant coefficients whose value can be positive, negative, or zero; and
f = arbitrary function.
: 2 ^ • (22)
Equations (2), (3), and (21) can be transformed into the following nondimensionalized coordinate system as
ÜH + 1 iü - ü! u z .aiy + c iü .1.2 /• *P >r2
p r _
1 < ^ <p, T >0.
(23)
(24)
PLANE STRAIN MOTION OF AN INFINITELY LONG CIRCULAR CYLINDRICAL SHELL
The basin equations of motion for the ra- dial vibrations of an infinitely long cylindrical shell witii transverse curvilinear isotropy and internal viscous damping are:
avD
B1)' V
I1'
(25)
109

a . . -u "- 12 u Ojf'.T) — * c,, * \l C .. f 11 11
(26) The solution to Eq. (33) via the Laplace trans- form and Eq. (28) is
,(/.T) du *- 22 u
'' * C12 '
(27) Ü(--;.r)
,(--»)
The appropriate initial conditions are
uO^.O) ^ f(.) . (28)
du ü(, .0) -- RO )
the boundary conditions are
Opip,') B(r)
„( 1. ? ) = A{ - ) .
(29)
The appropriate transform for the solution of this problem is, from Eq. (1),
üfc'i.T) - | .u(. .T) cy, .-"^dp. (30)
Define
ifiJ^Cj) * hJ^Cj)]
l-jJ^f.p) ♦ kjjcjp)! •Jp.v) ■Jl.v)l
sin -(T-V) dv + f(C-) e ' cos
e sin - t . (35)
• C(..f.)dp. (36)
.n/r^^ ^VT^T5
The solution for the displacement is, from Eq. (3),
u(..o ^ E V -J^-P)
(37)
(31)
c.jP P ■
Applying Eq. (30) to Eq. (23) and using Eqs. (6), (26), (29), and (31) gives
<l ii _ du . 7 _ k C -r- + - u A,2 ''•
2a ;c 11
^ij:^i) * hj.i^)]
ii^J't -P) * kJ^fiP)]
•fp, O - \n.)| • (32)
• ^^^'2^-i^c-r0-(38)
When the relationships given by Sneddon [5] are used,
<iz z - z (39)
z AI * BY. (40)
The stresses found from Eqs. (26), (27), and (38) are
By following standard techniques, Eq. (32) can be rewritten as
d\i du 2 2a f I^J^:,) 'KUf;)! [fiJ^fiP) »kJ^^p);
(P. o - ■ (1. )
c c CR
CCR 2
n i
; (33)
(34)
2a. Y VlV££iPJ ' kj/f.p)] 2 u( f j . r)
jC./'-'i)- c.^C^.C,,^)
(41)
rc>1 ' -r c.^'-i'-^j-c+l(, fj) (42)
no

EquationF (35), (38), (41), and (42) represent the general solutions to the basic equations.
The case of the Isotropie solid is obtained by defining the elastic constants as:
II L2J (43)
The transform for this case is from Eq. (11)
■ ü üfCj.T) = f pu(p,t.) Cjp.t^äp. (48)
o
Applying Eq. (48) to Eq. (46) and uuing Eqs. (14), (31), and (45) gives
d 2u ,, r du 2 - jg^ij r ♦ 2','> -T- + »i U Ar* n dr " c.
a/l.r), (49)
The general solutions then reduce to those in Ref. 6.
The thin shell solution is contained in Eqs. (35) and (38). Using Eq. (38) and taking the difference between the displacements at the surfaces gives
I.(P. )-u(l.) —Y. "'iJ'"',J'(->^ M^fiP)!2
where '..-•„ are as defined by Eq. (34). The solution to Eq. (49) is
u( j.') I e ~ (1 .v) sino,^T - v)dv cil' J
t f( -. ) e n cos urr + e " sin^'T. 1 JJ
(50)
iK-':.')
fMO ic^p.f^-c^i.fj);
(44)
As p approaches one, the difference in the bracket in Eq. (44) goes to zero. Hence, the usual assumptions of shell theory apply here, thereby showing that the general solutions hold over the range of shell thicknesses from very thin to very thick.
The solid cylinder is obtained by letting the inner radius approach zero. The initial conditions are those of Eq, (28), but the bound- ary conditions become
AP ,T) = — t (45)
For this case the nondimensicnalized form of Eq. (21) is
— 4 — u + C — , 0 ^ , • 1, .2 r .' ? .,2 ,W ^ ~
r b
t , b
bvD cii
0;
(46)
(47)
fff:) r1 UP) p) dp . (51)
where is as defined in Eq. (37). The solution for the displacement is obtained from Eq. (12) as
u^)-2£-lil^L i^_..(52)
The corresponding stress is found from Eq. (45).
The case of the cavity in an infinite me- dium is solved by using the extended Weber transform. The basic equations, Eqs. (23) through (28), remain the same. The boundary conditions now become
,(1,T) = A{r) ,
lini iT (* , T) -• 0
(53)
The transform for this case is
ü ü('.0 ^ j PU(P.T) cv(p.<i)dp. (54)
Applying Eq. (54) to Eq. (23) and using Eqs. (10), (26), (31), and (53) gives
d2u „ du dT
2a
'7C 11 Jl.T) (55)
111

The solution to Eq. (55) is
T
dv
»f?/ ^ . 2ga)tCf(a) . ] f(a) COS^T ♦ sin 'T L 2u> }
-C/2\- + e I ffa) cosier
((P) P C (p.a)dp
1/ 2
(56)
(57)
(58)
From Eq. (9) the displacement is
f° aü(a,T) 0^(^.0) da
(59)
The corresponding stresses are found from Eqs. (26) and (27). This problem has also been solved [7] using the Laplace transform. The advantage of the solution given here is that the complex integration used by Eason is avoided. However, it remains true that for most cases the integral in Eq. (59) must be evaluated numerically.
Returning to the thick shell, the surface tractions are now specialized so that particular cases of interest can be studied. Setting the surface tractions in Eq. (28) equal to zero, that is,
°p(p.-r) -- OpO.-O - o. (60)
gives the solution for free vibrations. Har- monic vibrations are studied by specifying the surface loads as follows:
ap(l,7) = -Ac
%(P.-0 HP) '- g(p) = 0
(61)
Putting Eq. (61) into Eq. (33) and solving for a gives
2aA i(<jT-<*n)
II "n
('■f^M; (62)
2^
tan (63)
Resonance is obtained by letting ü - u>n in Eq. (62), which gives
'RES 2aA „ «(« r-o/i)
J 'n"
2;
(64)
(65)
where On is the "magnification factor" for each mode. Static motion is then found by letting <. approach zero in Eq. (62) which gives
2aA JST
11 n
(66)
By using Eq. (66), Eq. (62) is rewritten as
i(«T . A ) U
2 ST
■v n ' » n'
(67)
Equations (61) through (67) show that under harmonic excitation each normal mode of the shell responds very much like a single degree of freedom with viscous damping Another form of the harmonic solution which has practical use is the transfer function or the ratio of the displacement to the surface load ap( l. r >. By using Eqs. (38), (62), and (67), it is easily shown that the transfer function is
-'*„
(-^■•K)' Tl/2 'ST
(68)
Equation (68) clearly shows the interrelation- ship of the static displacement, driving force, and shell response. Mechanical impedance is another concept which has widespread practical use. For a continuous elastic system of finite dimensions, this is defined as
112

Pfej.cj.e,) e1
i..e,.e,.e. (69) u(e,.e,.e 2ei- '
where
Z = mechanical impedance,
eie2es - orthogonal coordinates,
P = spatial distribution of applied force, and
ü = velocity of elastic .system.
To apply this concept to elastic systems of finite dimensions, two restrictions must be made: (a) all initial conditions must be zero, and (b) for loads on more than one surface, the mechanical impedance must be determined separately for each surface. For the loads specified in Eq. (61), the mechanical impedance found from Eqs. (61), (62), and (68) is
"T £ ti2 ^iJK^P) + kJ^'iP» Z(P.")
-i(*n '2) JST
(■-^M«€)' 1/2
(70)
The reciprocal of the impedance has been used in Eq. (70) because of the length and complexity of the expression and the fact that puch an ex- pression can be implemented in an analyzer. The use of the complete expression in Eq. (70) is, of course, cumbersome. Fortunately, for most structural materials the damping is so low (4 < 0.01) that contributions to the total motion from modes other than the first consti- tute only a few percent. Hence, a good approx- imation to Eq. (70) is
'l(p,co) S
2ösrF^i) ('-^ N)' -11/2
i(* -"/2)
(71)
The "point" impedance is found in Eqs. (70) and (71) by choosing p = i. The "transfer" imped- ance is found by taking p $ i. All of the results in Eqs. (61) through (71) were obtained for a load on the inner surface. The same procedure
can be repeated for a load on the outer surface with similar results.
The specification of the surface loads en- ables the transient solution to be put into a form that is more convenient for physical in- terpretation than Eqs. (35) and (38). To illus- trate the basic method, the following conditions are chosen:
VlT> l(r). (72)
Taking the Laplace transform of Eq. (33) and using Eq. (72) gives
Ü(^;.S) = 2a
,)2^2] • (73)
The final value theorem of Laplace transform theory is
lim F(x,y.z.t) - lire F(x,y,*,s). (74) t -»i » -» 0
When Eq. (74) is applied to Eq. (73), the static solution to Eq. (23) is
1 ST
2a ST (75)
Equation (73) can be rewritten as
"n "ST
s[(S f ^n)2 + CO2]
(76)
By inverting Eq. (76) and using Eq. (38), the solution for the displacement is
v(p-r)--^ZtiHtX(tipy+ujtirt2¥iTT
x uST 1 + ~ e''""7 siniwr- 0) , (77)
1/1 - tan -i _äL (78)
Equation (77) shows that the dynamic response can be related directly to the static deforma- tion. This is similar to the case of harmonic vibration in Eq. (67). As the damping 4 goes to zero, the standard result is that a dynamic dis- placement of twice the static deformation is recovered. The basic procedure shown here can be repeated for other types of loading with
113

similar results and for loads on the outer surlace.
All of the results in this section shown for specific loads can be easily extended to the limiting cases of the solid cylinder and cavity in an infinite medium. The standard case of no damping for all of the results in this section can be obtained by letting the damping ratio c go to zero. Although the approximation of the internal damping as a viscous effect is undoubt- edly oversimplified in many materials, the in- corporation of more complex viscoelastic be- havior can be solved by the same methods. Hence, extension to linear damping models of wider applicability can be accomplished by the interested reader.
When the same variables defined in Eqs. (24) and (25) are used, the dimensionless form of the basic equations for the sphere are:
!'2u 2 \i (u2- 1 4) ^u „ \i . —— » —. 4 c — . 1 V 2 -A. .7 ;<r J Ar
a ^ *c 12 — •,(;.') — ♦ u - n ' V C
II'
(84)
(85)
'\1 "- JJ T "-J3
12 ^(f.T) = — aJt.T) -. — + —-
C I 2 * dP C I
(86)
The appropriate initial and boundary conditions are, respectively.
RADIAL MOTION OF A SPHERICAL SHELL
The basic equations for the radially sym- metric motion of a spherical shell with internal viscous damping and transverse curvilinear isotropy are
ir+—r— = p^ + D37-,,-r<-b-t>0' (79)
(80)
(81)
cr -- C
II <M ir+ 2ci2 7-
ae '- ^ = ci2 <\l . N u
where
u = radial displacement of the sphere;
crras,a* = radial and circumferential stresses, respectively;
ciici2c22c23 = elastic constants; and
u(. .0) -- m(p) . (87)
Vl-T) -- A(T) , (88)
zjp.r) = B(r) .
T) - P1 2 f(P.r). (89)
u
then Eqs. (84) through (88) become
92f 1 3f u2 d2( „ of
\2 + ' :■. P o 2f^+C^- l<-^-P' ^0-
a, ■ vjp.r) - — +
y , 4c 12 - !
2c, .P f ,
a-' 2 , ^ ^1 2 . s
df 2fC22+c23> - ! — + ^ f SA' 2C12P
(90)
(91)
(92)
t *,D = material density and viscous clamping coefficient, respec- tively.
Substitution of Eqs. (80) and (81) into Eq. (79) gives
c^u 1 äu (M2- 1/4^ p' 32u D ?>u
(82)
2 I 8fc2j+cj3-cu) T 1/2
+ 1 (83)
Initial Conditions:
f(p,0) -- pl 2 m(p),
- HP.O) , ' 2 n(p). if
Boundary Conditions:
crp(l.r) -- A(T)
r->,T) - B(T) .
(93)
(94)
114

A comparison of Eqs. (90) through (94) with Eqs. (23) through (29) indicates that there is a direct analogy between the plane strain and radially symmetric problems if the following analogous quantities are defined:
Cylinder Sphere
c'z2 + a Ur2 ' r ?r " r2 7 " c44 t2 at
(95)
u(^,0), ü(, ,0) f(A.O). U- ,C)
1 2 -.(..o, .' 2.'.,<-.n
12
22
13
2c 12 1 2
c22 + C23 - 1 2
Thus, the solution for f(p,r) in the general case and all the various subcases can be written di- rectly from the solution for u(p,r) in the cylin- drical case merely by replacing the cylindrical quantities in the expression by their spherical counterpart. The radial displacement is then found from Eq. (89). The spherical stresses are obtained from the expressions in Eqs. (41) and (42) for the cylindrical stresses in exactly the same manner as ((p.r). Eason [7] has shown that the plane stress solution also has a plane stress analog. As a result of the present study, any plane strain, plane stress, or radial symmetric problem has a corresponding solu- tion in the other two analogs.
TORSIONAL MOTION OF A FINTTE CYLINDRICAL SHELL
W-.t) ^ c44a-(|-H).
and
where
,2(r.z.t) - c44 — au
z
(96)
(97)
u = torsional displacement of the cylinder,
c44 = elastic constant, and
a* = dimensionless constant whose value depends on the type of material crystal being used [2].
The new variables are defined as
P - a v/a7
z X = —
a
P*
(98)
Transient torsional wave propagation prob- lems in elastic media have been studied exten- sively in the recent past with most papers concentrating on Isotropie bodies [6,8-19]. Achenbach [11] and Berry [20] have extended the studies to viscoelastic materials. Aniso- tropie materials have been treated in only a few cases, as in Refs. 2, 18 and 19 which con- cern an infinite plate and semi-infinite media. ^'1 of the papers in which the radial direction is finite assume that the lateral surface is free from tractions. The problem treated here is the vibration of a finite hollo* cylinder with internal viscous damping and transverse curvi- linear isotropy with all of its surfaces subject to loads.
The basic equations of motion for this prob- lem are [2]:
vt a
» = l
q = —
C = avD
(99)
The basic equations in nondimensionalized co- ordinates are
SV /32u 1 3u 1 \ 92u .3H jl'^^X
(100)
115

-■-,..(■ .x. • ) - .'^(l-i). (loi) ^)Cäü ,'^.^u^ & ^.g
and
The appropriate initial conditions are
u(..x.O) = F(. .x) .
boundary conditions are
'^(l.x.-) = A(x. -) ,
c ,(P,x,r) - B(X.T) :
(102)
(103)
(104)
..-^ (no)
A<n, -) -' A(x. -)
B(n,M J B{x.')
n "x . cos dx
q
DC--..-)
E(V-)
F D(.. ) (..-:.)".
n ,2.. 2
(HI)
(112)
(113)
CtJ^.O.T) -- D(. .) ,
•..jL.q.r) z £(..--)
(105) then by using the same definitions of Eq. (34) in Eq. (110), the solution for u is
The appropriate transform for the axial variable (x) is. from Eq. (15),
üffj.n.T) v\ä» . J I 2
:(-l)nE(-'i.v)-D(s'i.v)]
u = u(/,.n.T) f u(..x.^ cos ^dx. (106)
By applying Eq. (106) to Eq. (100) and using Eqs. (17), (102), and (105),
X [(-l)n E^,-) - D(..-): + i'-ii|- . i-^- -L o
ij;('':)+hjt(fi) _ _ B(n.v) - A(P.V)
e n sin ••>,' T - v) dv + e
I- G( ^.n) + : SF(^.,n) i ;( " , n) cos VT + sm ^r
(114)
Xri (107)
The transform for the radial variable ( ) is, from Eq. (1),
FC^.n) 5. |3 F(t Ff-^.n) {i ^ F(,,x) C,(p,si) cos dp dx .
,x) ' ' 1
(115)
The solution for the displacement is obtained from the inversion series in Eqs. (3) and (16) as
ü = u( f,, n, T ) f pu(.,n.T) C,(\..-i)dp. (108) u(.,x,r) = — ^ f.2 k-jj'^.p)
If by definition
h -l
k
(109)
i - il p p
then using Eq. (108) along with Eqs. (6), (101), and (104) on Eq. (107) gives
^ kJ1(s-iP)]2u(ci.0.r)^^
T E L ^^ij;^"iP)
+ kl^s-jP^] 2ür:i,n, r) ' ' cos^-^
(116)
116

The solution is obtained by placing Eq. (114) into Eq. (116). It can easily be shown [11] that the lowest torsional mode (- j o) is nondis- persive, thereby making anisotropic finite hol- low cylinders useful as delay lines in ultrasonic studies.
The special cases of free, harmonic, and static motion plus the limiting cases of the solid cylinder and thin shell can be solved using the techniques and methods outlined for the circu- lar cylindrical shell. Using the extended Weber transform, the case of the infinite plate with a circular hole in it can be Solved. The solution for the semi-infinite medium with a circular hole is obtained by using the extended Weber transform and semi-infinite cosine transform. The infinite medium with a circular hole in it is solved by the combined use of the extended Weber transform and complex Fourier trans- form. Because of the ease with which these subproblems can be solved and to conserve paper length, they are left as an exercise for the reader.
This section treated the case where all four surface tractions were specified. Other cases which have displacements and tractions specified on the surfaces can be solved by choosing appropriate transforms that are avail- able in the literature. Mixed boundary condi- tions which lead to dual integral equations are treated by Shall [15] an^Sneddon et al. [16].
RESULTS AND CONCLUSIONS
The dynamic response of thick elastic ani- sotropic cylinders and spheres has been found in certain problems, where the boundary condi- tions are Cauchy in nature, by new integral transforms. The solutions were obtained in a manner which is more direct and concise than existing techniques. It was shown that there exists a direct analog between plane strain mo- tion of a cylinder and radially symmetric mo- tion of a sphere. These results have application to such diverse fields as pressure vessels, solid rocket propellants, geophysics, and ultrasonics.
REFERENCES
1. R. F. S. Harmon, Applied Anisotropic Elas- ticity. Oxford Univ. Press, London, Eng., 1961
2. R. A. Scott and J. Miklowitz, "Transient Elastic Wave?, in Anisotropic Plates," Div. oi Eng. and Appl. Sei., California Inst. of Technology, ONR Contract Nonr-220(57) NR-064-487 TR-1, AD 623917, Sept. 1965
3. G. Eason, "On the Vibration of Anisotropic Cylinders and Spheres," Appl. Sei. Res., Sect. A, Vol. 12, p. 81, June 1962
4. G. Cinelli, "An Extension of the Finite Hankel Transform and Application," Intern. J. Eng. Sei., Vol. 3, No. 5, p. 539, Oct. 1965
5. I. N, Sneddon, Four Transforms. McGraw- Hill, New York, 1951
6. G. Cinelli, "Dynamic Vibrations and Stresses in Elastic Cylinders and Spheres," 5th U. S. National Cong, of Appl. Mech,, Univ. of Minnesota, June 1966; to appear in J. Appl. Mech,
7. G. Eason, "Propagation of Waves from Spherical and Cylindrical Cavities," ZAMP, Vol. 14, p. 12, 1963
8. J. J. McCoy, "Propagation of Torsional Waves in a Circular Elastic Rod," ZAMP, Vol. 15, p. 456, 1964
9. W. L. Wainwright, "On Torsional Oscilla- tions in a Finite Circular Cylinder," JASA, Vol. 36, No. 3, p. 511, Mar. 1964
10. G. Cinelli, 'Torsional Wave Propagation and Its Application to Ultrasonic Delay Lines," 1965 IEEE Ultrasonics Symp., Boston, Mass., Dec. 1965
11. J8 D. Achenbach, "Torsional Oscillations of an Encased Hollow Cylinder of Finite Length," AIAA/ASME 7th Structures and Materials Conf. Proc, Coca Beach, Fla., Apr. 1966
12. S. K. Clark, "Torsional Wave Propagation in Hollow Cylindrical Bars," JASA, Vol. 28, No. 6, p. 1163, 1956
13. M. S. Macrakis, "Study of Torsional Waves in a Laminated Elastic Rod," MIT Lincoln Lab. Rept. 250-0015
14. A. E. Armenakas, "Torsional Waves in Composite Rods," JASA, Vol. 38, p. 439, Mar. 1965
117

15. R. Shall, "On the Forced Torsional Oscil- lations of an Elastic Cylinder," Proc. Cambridge Phil. Soc, Vol. 61, p. 955, 1965
16. I. N. Sneddon et al., "The Reissner-P-^goci Problem for a Long Cylinder of Finite Length," Quart. J. Mech. and Appl. Math., Vol. 19, No. 2, p. 123, May 1966
17. M. L. Ghosh, "Disturbance in an Elastic Half Space Due to an Impulsive Twisting Moment Applied to an Attached RigiC Disc," Appl. Sei. Res., Sec. A, Vol. 14, Nö. i-2, p. 31, 1964-65
18. M. Mitra, "Disturbance Produced in an Elastic Half Space by an Impulsive Twist- ing Moment Applied to an Attached Rigid Disc," ZAMM, Vol. 38, No. 1-2, p. 40, Jan.-Feb. 1958
19. G. Eason, "On the Torsional Impulsive Loading of an El?"tic Half Space," Quart. J. Math, and Appl. Mech., Vol. 17, No. 3, p. 279, 1964
20. D. S. Berry, J. Mech. Phys. Solids, Vol. 6, p. 177, 1958
118
!
EFFECT OF ASYMMETRICAL TRAPEZOIDAL PULSE
ON SINGLE-DEGREE-OF-FREEDOM SYSTEMS*
H. Saunders General Electric Company Philadelphia, Pennsylvania
The behavior of components when subjected to a shock may be approx- imated by a single-degree-of-freedom mass-spring system subjected to a prescribed pulse. A number of specifications require a rectangu- lar input pulse. Due to the limitations of the physical laboratory equip- ment, the theoretical rectanguiar pulse is unattainable and an asym- metrical trapezoidal pulse must be used. Equations are derived for predicting the maximum acceleration response of a physically obtain- able asymmetrical trapezoidal pulse. The equations employ the actual rise, decay and dwell portions of the pulse. Since most physical sys- tems contain httle or no damping, an undamped one degree of freedom is employed. The solution is obtained by utilizing the Laplace trans- form method in terms of the Dirac delta function. Comparisons are made between the theoretical rectangular pulse and a few trapezoidal pulses having different rise, decay and dwell times. The rectangular pulse is the most severe. The rise and decay times have a secondary effect on the response; the dwell time has the most important effect. By using the derived equations, the designer can evaluate the degree of departure between the idealized and actual test condition and can thus define an equivalent trapezoidal pulse capable of furnishing a similar response in the component.
INTRODUCTION
Great osts and prodigious engineering ef- forts are involved in attempting to achieve high reliability in the launch of space payloads. High reliability is based o.i a strong foundation of rigid quality control and preflight tests, par- ticularly shock and vibration tests. Space pay- loads are subjected to shock loads before and during flight and at touchdown. In the preflight phase, shock loads occur during transportation and handling of the payload. From launch to reentry, the primary sources of shock are en- gine ignition, shutdown and staging. From re- entry to the successful end of the mission, the main sources of shock excitation are parachute deployment, earth or water impact and, in the case of the LEM vehicle, touchdown on the moon. Since space payloads are exotic struc- tures consisting of fabricated mechanical and electronic parts, the response analysis of such a system may be of questionable value in as- sessing the system reliability. It thus becomes apparent that, wher -ostiüle, these payloads
must be subjected to the anticipated shock loads. Under simulated operating conditions, all components should be energized and prop- erly functioning to prove their ability in with- standing the induced shock. The components must either perform flawlessly or passively survive during the shock environment. The shock loadings may tend to compromise their ability to complete the intended flight mission.
DISCUSSION
At present, most aerospace manufac. ^rs subject components to shock load tests to . -n-ify their capability before going into system test. Each type of shock testing machine creates a particular pulse defined by an accelaration- time curve. The area under the acceleration curve is the velocity change and is considered to be a primary parameter in the damage effect. There are certain applicable principles concern- ing component damage which are directly re- lated to the results of a shock.
^This paper was not presented at the Symposium.
119

i -
MATxiEMATICAL ANALYSIS
A one-degreo-of-freedom vibrating system subjected to various shock impulses applied to the base has been analyzed by a number of au- thors in terms of acceleration response and its resulting amplification factor. A majority of the present specifications stipulate that the shock pulse inputs must be either peak terminal sawtooth, half-sinusoidal, simulated blast pulse (right triangulaf), or rectangular [1]. Consider a one-degree-of-freedom system with an elas- tic restraint, as shown in Fig. 1. The illustra- tion shows the absolute displacement x, of the mass m, the absolute displacement of the chas- sis xo, and the idealized spring stiffness k. The differential equation governing the behavior of the system during the shock phase of motion is
and
or
where
mx, ♦ k(x, - xc)
'l2(xl-xo) = 0
2 = JL
0 < t < T (la)
(lb)
and r is the pulse period.
C.G. OF MASS m
(2c)
Likewise, the original differential equation is transformed to the following form:
y + .2y o < < T (3)
This indicates that x0 represents the base ex- citation and y represents the relative displace- ment of the mass m with respect to the base. Equation (3) can be readily solved for y, to- gether with the conditions that the initial veloc- ity x(0) and displacement x(0) are zero. For most components, damping is considered to be small and is neglected.
In practical design, the maximum absolute acceleration response is of primary concern. The relationship between x, and y is deter- mined from Eqs. (1) and (2a):
(4)
A characteristic value of the displacement x, is the maximum static displacement under the maximum absolute value of the force, i.e.,
F(t) k
max F(t) _ ,. 2 (5)
Based on this equation, it is most natural to express the displacement spectrum in a dimen- sionless form in terms of the static deflection h. The ratio of the displacement spectrum to & is defined as the dynamic amplification factor or acceleration spectrum:
}. 777777777777 Fig. 1. Schematic representation of single-degree-of- freedom system
amplification spectrum - |x,| max (co1 t)
_ displacement spectrum
max. static displacement
(6)
For most practical problems, the amplifi- cation spectrum for acceleration is desired and is represented by
In present specifications, the shock pulse inputs are prescribed in terms of accelerations. For convenience, the following transformations are used:
x, - x0 = y , (2a)
*,-*() ^ v. (2b)
t max. absolute acceleration of mass a2 max. acceleration of pulse
If the shock pulse is defined, one approach to shock analysis is the use of Laplace transforms. This was first applied by Müller [2].
Many specifications prescribe the rectan- gular pulse as a shock input. A number of
120

2.0
1.6
"i z o h < O m 3 0,
5
1.2
0.8
IS
0.4
0.2
m*i
1.0 1.0
— - FREQUENCY RATIO "2
Fig. 2. Maximum acceleration response for rectangular pulse
10.0
authors have derived its shock spectrum by various methods. During the pulse, the maxi- mum acceleration ratio is
1 - cos a),! t < T, (7)
where ^2 is the forcing frequency and r - -n/wj, This reaches a maximum of 2 when ay&'j - 1. After the pulse, the maximum acceleration ra- tio is
/ wi \,/2
= 2 si t > T . (8)
When OJ, = u>J; the maximum acceleration ratio again attains the value of 2. This is illustrated in Fig. 2. In the laboratory, the specified rec- tangular pulse is difficult to obtain. Due to the inherent characteristics of present-day ma- chines, the rectangular pvlse acquires definite rise, dwell and decay times. The desired rec- tangular pulse thus becomes an asymmetrical
trapezoidal pulse (Fig. 3). Jacobsen and Ayre [3] derived a symmetrical trapezoidal pulse, i.e., equal rise and decay time.
The derivation of the asymmetrical pulse consists of describing the three phases, i.e., rise, dwell and decay positions, by an impulse function in Laplace transform notation. For the asymmetrical trapezoidal pulse, the base acceleration applied to the single-degree-ol- freedom system, as defined in Fig. 3, is
a2 (A+B + C) , (9)
where
rise period ^A- — irft) - n(t - a)?-] , (10) ar
dwei 1 period - B - [ß(t - a) - fj.(t - (a + 0)T)] ,
(11)
decay period = C = -^-^ [ß(t~ (a+ 0)T) - rft- r)].
(12)
and ß(t) is the Dirac impulse function where a - ar, h = ßr , c = yr, and a + ß+y - 1. The
121

Fo
^
* «4* b' ßr 1 C =VT
NOTES
The acceleration ratio during the pulse, i.e., t < T , then becomes
t 3 + j M sin a'jt N cos :i.t
(1.) where
COS I <.,T C os VJ,( a t ^) j 1 (18a)
and
F = APPLIED PULSE FORCE o
r - PULSE PERIOD
«♦fl + y = 1
Fig. 3. Asymmetrical trapezoidal pulse
expressions of Eqs. (10) through (12) are sub- stituted into Eq. (9) and the resulting equation is described in transform notation:
sin u,1(a + ß)-' sin aujT (18b)
To maximize the expression in Eq. (17), the first derivative is set equal to zero, solved for sin u^t and cos ^t, and substituted back into Eq. (17). This results in an expression for the maximum absolute acceleration response in terms of ^ and ^2.
After some mathematical manipulation, the maximum acceleration ratio reduces to:
ars L e e + — e
(13)
Equation (3) can be represented in transform notation by
s2 + OJ,2) y(S) = - s2XoCs) . (14)
i » M sin ii.t N cos ^.t 1 - _L + ! L (19)
where
sin J,t M Ny/y^M^N2) - 1
-/(M2 + N2) (20a)
Substituting Eq. (13) into Eq. (14) and simplify- ing yields
y(s) = - -jrr-
-CITS a -(ci*3)rs a - T s 1-e - — e + — e
,2 /<!2 ,,2. s ( S •• 0, i /
(15)
The inverse transformation results in the acceleration ratio equation after utilizing Eq. (4):
t sin a)jt / t sin ,(1 ■ IT)\
ar aw.T \.ar aai" / )j(t-ir)
t a + ß sin te,[t-(a+ 3)T]
y~ 7 yojjT ß[t-(a + f3)r]
/_t_ ± sin Mt(t-T)\ t-T). (16)
and
COS OJ.t M - NN//
2(K2 + N2) - 1
y(M2 + N2)
This can be further simplified to
(20b)
^-^^[y^.N2)-!] 1 2
(21)
After the shock phase, the forcing function is no longer operative. The resulting acceler- ation ratio becomes
G sin ■ jt H cos u^t (22)
where
122

■, r cos Vjf a + fj'jr .
and
{23a)
- [~h \
&) - cos \ ~~ i no
sin i.'j( i + .■")T sin i^ijt cos -,7
(23b) -4n (cos(-i) n [l - (i±i)a] sin(^) na si„ (^)^-j
To obtain the maximum acceleration ratio, the procedure as outlined above for Eq. (19) is fol- lowed. After much algebraic manipulation, the maximum acceleration ratio reduces to
^2
COS d V
1 "!2 + t
cos —( 1 - y)-n ">2
cos — w
sin a — TI M2
sin — ( 1 - a)77 ■}2
+ sin
i 2
(24)
When a = /, Eq. (24) becomes a symmetrical trapezoidal pulse, and the equation reduces to that given by Jacobson and Ayre [3] when ex- pressed in their terminology.
Equation (24) can be further simplified by expanding the quantities in the parenthesis and collecting terms. After much manipulation, Eq. (24) reduces to the following:
where n - a
(25)
Example
As an example of the use of the developed equation, consider a theoretical rectangular pulse having an 11-msec dwell. There are three other pulses, one symmetrical (LRP) and two asymmetrical trapezoidal pulses (ASTP No. 1 and No. 2) which may be obtained by use of the laboratory equipment. The question arises, "Which of the pulse shapes will simu- late the theoretical rectangular pulse?"
Table 1 gives the quantities necessary for the problem solution. After substituting the values for the rectangular pulse into Eq. (8) and LRP, ASTP No. 1, ASTP No. 2 into Eq. (25), one finds that the rectangular pulse is the most severe (as to be expected) and the ASTP pulses are approximately the same (Fig. 4).
TABLE 1
Pulse a b c a ß y n
Rectangular (theoretical)
- 0.0)1 - - - - -
LRP 0.002 0.011 0.002 0.1333 0.7334 0.1333 1.0
ASTP No. 1 0.002 0.011 0.004 0.118 0.647 0.235 0.5
ASTP No. 2 0.004 0.011 0,002 0.235 0.647 0.118 2.0
TABLE 2
Pulse a b c a .3 y n
ASTP No. 3
ASTP No. 4
ASTP No. 5
0.002
0.002
0.002
0.001
0.004
0.006
0.001
0.0025
0.00035
0.6452
0.320
0.2395
0.3226
0.640
0.7186
0.0322
0.040
0.0419
20.037
8.0
5.716
123
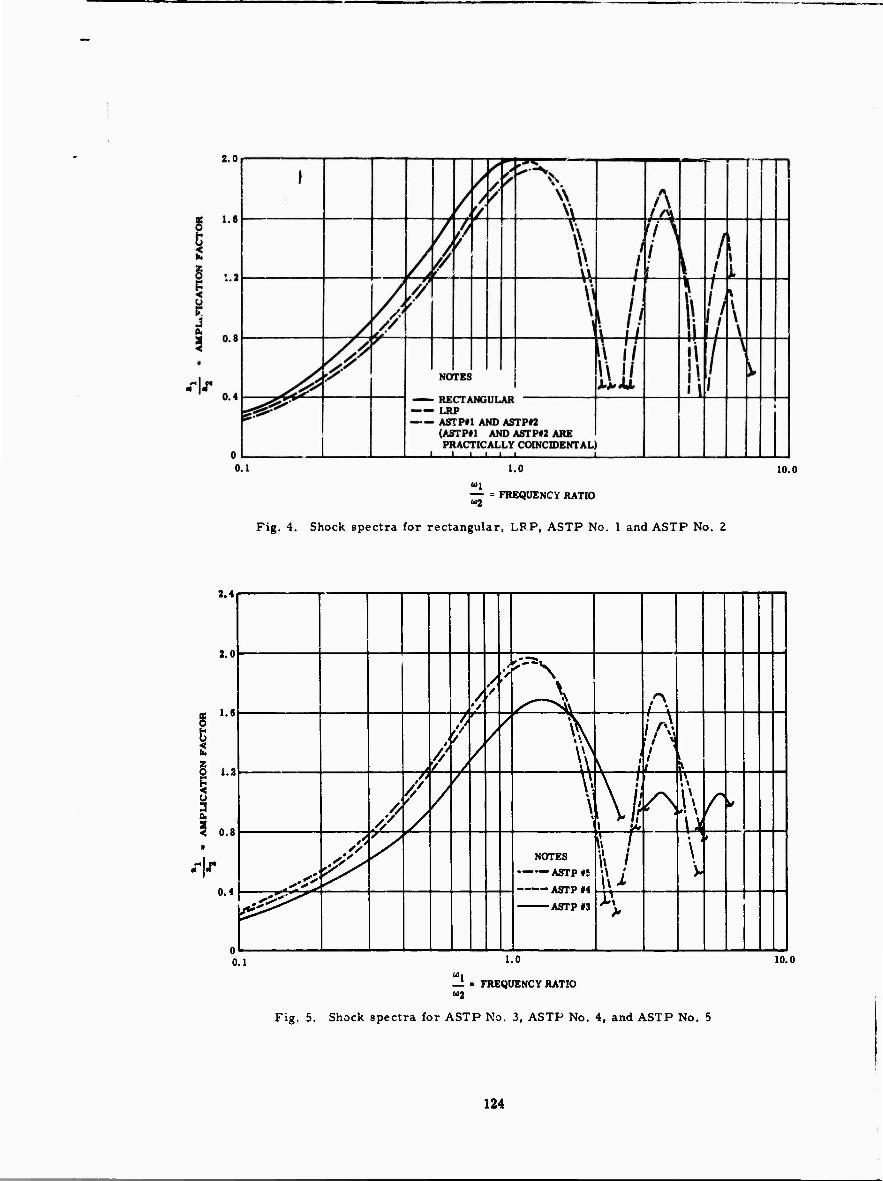
2.0
— = FREQUENCY RATIO
Fig. 4. Shock spectra for rectangular, LPP, ASTP No. 1 and ASTP No. 2
2.4
2.0
1.6
< Z 2 i-2
u 3 Ot
5 0.8
-i-r 0.4
0.1 1.0
— • FREQUENCY RATIO «2
Fig. 5. Shock spectra for ASTP No. 3, ASTP No. 4, and ASTP No. 5
10.0
1 l*
J /' o -£—. * ^
/
/
' \
1 * 1
A ^ Ik/
-"^ ̂
y NOTES
ASTP #5
-1— i —— ASTP #4
V •
^^ ASTP #3 >
10.0
124
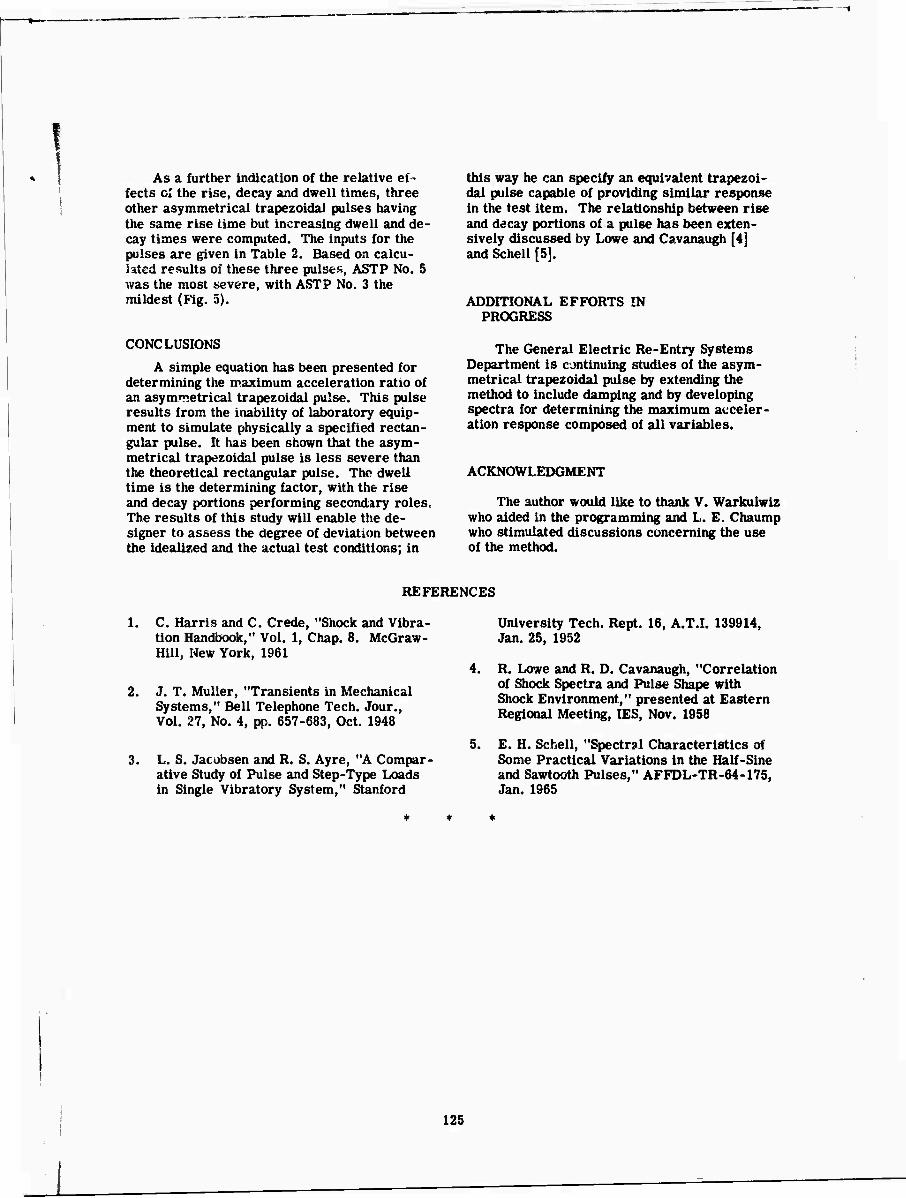
As a further indication of the relative ef- fects cl the rise, decay and dwell times, three other asymmetrical trapezoidal pulses having the same rise time but increasing dwell and de- cay times were computed. The inputs for the pulses are given in Table 2. Based on calcu- lated results of these three pulses, ASTP No. 5 was the most severe, with AST? No. 3 the mildest (Fig. 5).
CONCLUSIONS
A simple equation has been presented for determining the maximum acceleration ratio of an asymmetrical trapezoidal pulse. This pulse results from the inability of laboratory equip- ment to simulate physically a specified rectan- gular pulse. It has been shown that the asym- metrical trapezoidal pulse is less severe than the theoretical rectangular pulse. The dwell time is the determining factor, with the rise and decay portions performing secondary roles. The results of this study will enable the de- signer to assess the degree of deviation between the idealized and the actual test conditions; in
this way he can specify an equivalent trapezoi- dal pulse capable of providing similar response in the test item. The relationship between rise and decay portions of a pulse has been exten- sively discussed by Lowe and Cavanaugh [4] and Schell [5].
ADDITIONAL EFFORTS !N PROGRESS
The General Electric Re-Entry Systems Department is continuing studies of the asym- metrical trapezoidal pulse by extending the method to include damping and by developing spectra for determining the maximum acceler- ation response composed of all variables.
ACKNOWLEDGMENT
The author would like to thank V. Warkulwiz who aided in the programming and L. E. Chaump who stimulated discussions concerning the use of the method.
REFERENCES
1. C. Harris and C. Crede, "Shock and Vibra- tion Handbook," Vol. 1, Chap. 8. McGraw- Hill, New York, 1961
2. J. T. Müller, "Transients in Mechanical Systems," Bell Telephone Tech. Jour., Vol. 27, No. 4, pp. 657-683, Oct. 1948
3. L. S. Jacubsen and R. S, Ayre, "A Compar- ative Study of Pulse and Step-Type Loads in Single Vibratory System," Stanford
University Tech. Rept. 16, A.T.I. 139914, Jan. 25, 1952
R. Lowe and R. D. Cavanaugh, "Correlation of Shock Spectra and Pulse Shape with Shock Environment," presented at Eastern Regional Meeting, IES, Nov. 1958
E. H. Schell, "Spectral Characteristics of Some Practical Variations in the Half-Sine and Sawtooth Pulses," AFFDL-TR-64-175, Jan. 1965
125