Embed Size (px)
Citation preview
Distribution of reaction products in phospholipase A2 hydrolysis
Hanna P. Wacklin a,⁎,1, Fredrik Tiberg b, Giovanna Fragneto c, Robert K. Thomas a
a Oxford University, Physical and Theoretical Chemistry Laboratory, South Parks Road, Oxford OX1 3QZ, UKb Camurus AB, Ideon Science Park, Gamma 2, SE-223 70 Lund, Sweden
c Institut Laue-Langevin, 6 rue Jules Horowitz, BP 156, 38042 Grenoble, France
Received 30 May 2006; received in revised form 20 September 2006; accepted 30 October 2006Available online 10 November 2006
Abstract
We havemonitored the composition of supported phospholipid bilayers during phospholipase A2 hydrolysis using specular neutron reflection andellipsometry. Porcine pancreatic PLA2 shows a long lag phase of several hours during which the enzyme binds to the bilayer surface, but only 5±3%of the lipids react before the onset of rapid hydrolysis. The amount of PLA2, which resides in a 21±1 Å thick layer at the water-bilayer interface, aswell as its depth of penetration into the membrane, increase during the lag phase, the length of which is also proportional to the enzyme concentration.Hydrolysis of a single-chain deuterium labelled d31-POPC reveals for the first time that there is a significant asymmetry in the distribution of thereaction products between the membrane and the aqueous environment. The lyso-lipid leaves the membrane while the number of PLA2 moleculesbound to the interface increases with increasing fatty acid content. These results constitute the first direct measurement of the membrane structure andcomposition, including the location and amount of the enzyme during hydrolysis. These are discussed in terms of a model of fatty-acid mediatedactivation of PLA2.Crown Copyright © 2006 Published by Elsevier B.V. All rights reserved.
Keywords: Phospholipase A2; Lag phase; Lyso-lipid; Fatty acid; Supported bilayer; Neutron reflection
1. Introduction
Phospholipase A2 (PLA2) selectively cleaves the sn-2 esterbonds in 3-sn-phosphoglyceride lipids, the main lipid compo-nent of mammalian cell membranes. PLA2 is present in a widerange of biological environments from invertebrate and insectvenoms to the mammalian immune system [1], and performs alarge number of different physiological functions, although thechemistry at its catalytic site is preserved across species andclass. The atomic resolution structures of many PLA2s [2] haveestablished a catalytic mechanism [3,4], in which a His-Asp pairor a Serine residue participate in the transition state resultingfrom hydrolytic attack by water. In contrast to enzymes that
operate in solution, PLA2 only catalyses hydrolysis in thepresence of an aggregated lipid interface, and is therefore aninterfacially activated enzyme [5].
Pancreatic PLA2 exhibits a long lag period in zwitterionicphosphocholine membranes before the onset of hydrolysis [6],and its biological function is to digest lipids in bile salts(negatively charged), whereas most venom PLA2s are highlyactive towards neutral lecithin (mammalian cell) membranes.Non-pancreatic secreted PLA2s in the immune system are alsoactivated by negative charge [7,8]. Recently it has been foundthat the burst of hydrolysis coincides with the maximumavailable membrane edge in supported membranes [9] and alsowith the maximum in lateral membrane heterogeneity thataccompanies the lipid main phase transition [10]. Perhaps themost intriguing result is that there appears to be a critical fractionof the hydrolysis products (0.083) that is required for the onset ofrapid hydrolysis [11]. Apart from membrane heterogeneity, thesuggested mechanisms of PLA2 activation to explain the lagphase include slow penetration of the enzyme into the membrane[12], amembrane-induced conformational change of the enzymeinto a catalytically active form [13], dimerisation of the enzyme
Biochimica et Biophysica Acta 1768 (2007) 1036–1049www.elsevier.com/locate/bbamem
Abbreviations: d31-POPC, L-α-1-O-d31-palmitoyl,2-O-oleyl,3-O-sn-glycer-ophosphocholine; PLA2, phospholipase A2; DOPC, L-α-1,2-O-dioleyl-3-O-sn-glycerophosphocholine; DPPC, L-α-1,2-O- palmitoyl-3-O-sn-glycerophospho-choline; DDM, n-β-D-docecyl maltoside⁎ Corresponding author.E-mail address: [email protected] (H.P. Wacklin).
1 Present address: Australian Nuclear Science and Technology Organisation,Institute for Environmental Research, PMB1 Menai, NSW 2234, Australia.
0005-2736/$ - see front matter. Crown Copyright © 2006 Published by Elsevier B.V. All rights reserved.doi:10.1016/j.bbamem.2006.10.020
in the membrane as a pre-requisite to activation [14], andautocatalysis mediated by the reaction products [15], a fatty acidand a lyso-lipid, which are known to act as membrane perme-abilisation agents [16]. Regardless of the details of the activationprocess, there also seems to be an auto-inhibitory feature in themechanism of PLA2, since the hydrolysis does not necessarilyproceed to completion but can cease at a point characteristic for agiven enzyme and membrane composition, with the enzyme stillfound to be active if an avenue of substrate replenishment isintroduced [17].
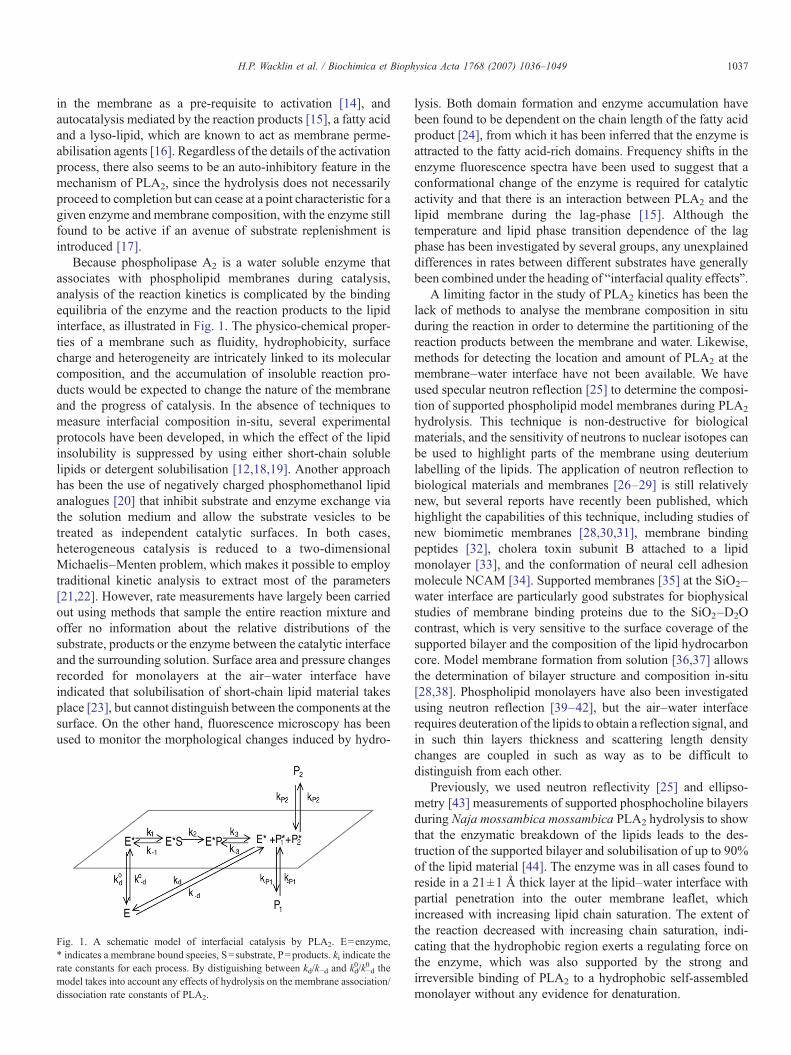
Because phospholipase A2 is a water soluble enzyme thatassociates with phospholipid membranes during catalysis,analysis of the reaction kinetics is complicated by the bindingequilibria of the enzyme and the reaction products to the lipidinterface, as illustrated in Fig. 1. The physico-chemical proper-ties of a membrane such as fluidity, hydrophobicity, surfacecharge and heterogeneity are intricately linked to its molecularcomposition, and the accumulation of insoluble reaction pro-ducts would be expected to change the nature of the membraneand the progress of catalysis. In the absence of techniques tomeasure interfacial composition in-situ, several experimentalprotocols have been developed, in which the effect of the lipidinsolubility is suppressed by using either short-chain solublelipids or detergent solubilisation [12,18,19]. Another approachhas been the use of negatively charged phosphomethanol lipidanalogues [20] that inhibit substrate and enzyme exchange viathe solution medium and allow the substrate vesicles to betreated as independent catalytic surfaces. In both cases,heterogeneous catalysis is reduced to a two-dimensionalMichaelis–Menten problem, which makes it possible to employtraditional kinetic analysis to extract most of the parameters[21,22]. However, rate measurements have largely been carriedout using methods that sample the entire reaction mixture andoffer no information about the relative distributions of thesubstrate, products or the enzyme between the catalytic interfaceand the surrounding solution. Surface area and pressure changesrecorded for monolayers at the air–water interface haveindicated that solubilisation of short-chain lipid material takesplace [23], but cannot distinguish between the components at thesurface. On the other hand, fluorescence microscopy has beenused to monitor the morphological changes induced by hydro-
lysis. Both domain formation and enzyme accumulation havebeen found to be dependent on the chain length of the fatty acidproduct [24], from which it has been inferred that the enzyme isattracted to the fatty acid-rich domains. Frequency shifts in theenzyme fluorescence spectra have been used to suggest that aconformational change of the enzyme is required for catalyticactivity and that there is an interaction between PLA2 and thelipid membrane during the lag-phase [15]. Although thetemperature and lipid phase transition dependence of the lagphase has been investigated by several groups, any unexplaineddifferences in rates between different substrates have generallybeen combined under the heading of “interfacial quality effects”.
A limiting factor in the study of PLA2 kinetics has been thelack of methods to analyse the membrane composition in situduring the reaction in order to determine the partitioning of thereaction products between the membrane and water. Likewise,methods for detecting the location and amount of PLA2 at themembrane–water interface have not been available. We haveused specular neutron reflection [25] to determine the composi-tion of supported phospholipid model membranes during PLA2
hydrolysis. This technique is non-destructive for biologicalmaterials, and the sensitivity of neutrons to nuclear isotopes canbe used to highlight parts of the membrane using deuteriumlabelling of the lipids. The application of neutron reflection tobiological materials and membranes [26–29] is still relativelynew, but several reports have recently been published, whichhighlight the capabilities of this technique, including studies ofnew biomimetic membranes [28,30,31], membrane bindingpeptides [32], cholera toxin subunit B attached to a lipidmonolayer [33], and the conformation of neural cell adhesionmolecule NCAM [34]. Supported membranes [35] at the SiO2–water interface are particularly good substrates for biophysicalstudies of membrane binding proteins due to the SiO2–D2Ocontrast, which is very sensitive to the surface coverage of thesupported bilayer and the composition of the lipid hydrocarboncore. Model membrane formation from solution [36,37] allowsthe determination of bilayer structure and composition in-situ[28,38]. Phospholipid monolayers have also been investigatedusing neutron reflection [39–42], but the air–water interfacerequires deuteration of the lipids to obtain a reflection signal, andin such thin layers thickness and scattering length densitychanges are coupled in such as way as to be difficult todistinguish from each other.
Previously, we used neutron reflectivity [25] and ellipso-metry [43] measurements of supported phosphocholine bilayersduring Naja mossambica mossambica PLA2 hydrolysis to showthat the enzymatic breakdown of the lipids leads to the des-truction of the supported bilayer and solubilisation of up to 90%of the lipid material [44]. The enzyme was in all cases found toreside in a 21±1 Å thick layer at the lipid–water interface withpartial penetration into the outer membrane leaflet, whichincreased with increasing lipid chain saturation. The extent ofthe reaction decreased with increasing chain saturation, indi-cating that the hydrophobic region exerts a regulating force onthe enzyme, which was also supported by the strong andirreversible binding of PLA2 to a hydrophobic self-assembledmonolayer without any evidence for denaturation.
Fig. 1. A schematic model of interfacial catalysis by PLA2. E=enzyme,* indicates a membrane bound species, S=substrate, P=products. ki indicate therate constants for each process. By distiguishing between kd/k−d and kd
0/k−d0 the
model takes into account any effects of hydrolysis on the membrane association/dissociation rate constants of PLA2.
1037H.P. Wacklin et al. / Biochimica et Biophysica Acta 1768 (2007) 1036–1049

In the current paper, we present new results on membranestructure and composition determined during and after the lagphase of porcine pancreatic PLA2. We have also for the firsttime used single-chain deuterium labelled d31-POPC to monitorthe distribution of the reaction products during both the lagphase and active hydrolysis. This lipid has a perdeuterated sn-1palmitoyl (C16:0) chain and an unmodified sn-2 oleyl (C18:1)chain. A reaction scheme with the scattering length densitiesthat formed the basis of our data analysis of the phosphocholinecomponents is presented in Fig. 2. As the half-deuteratedphospholipid molecules are hydrolysed by PLA2, a deuteratedlyso-lipid and a non-deuterated fatty acid are created, whichallows their partitioning between the surface and the bulksolution to be monitored as changes in the scattering lengthdensity of the bilayer.
2. Materials and methods
2.1. Neutron reflection
Neutron reflection [45] measures the composition of an adsorbed layerperpendicular to the interface, and its sensitivity to the layer structure dependson the scattering contrast between the film and the surrounding media. Thethickness of a thin film is related to the separation of neutron interference fringeswhile the amplitude of the fringes is directly proportional to the scattering lengthdensity profile (or neutron refractive index profile) of the system. The neutronscattering length density ρ(z) of the system is defined in Eq. (1),
qðzÞ ¼X
j
njðzÞbj ð1Þ
where bj is the neutron scattering length (or power) of nucleus j and nj(z) thenumber of atomic nuclei in the direction perpendicular to the surface. Thescattering length density is a function of the distribution of atoms per unitvolume, and thus describes the composition of an adsorbed film directly. Thespecular reflectivity R as a function of the momentum transfer vector Q can becalculated exactly using an optical matrix model [46], which divides the surfaceregion into homogeneous layers distinguished by their scattering length density.While model independent data fitting [47] is possible for simple interfaces, it isnot well suited for analysis of reflection from complex interfaces containing
multiple components, but it is often used in conjunction with more specific boxmodels. Computer programs such as Afit (v. 3.1) [48], allow the simulation ofreflectivity profiles by modelling the thickness, scattering length density, solventvolume fraction and roughness of each “box” or layer into which the interface isdivided, e.g. lipid head groups and tails. Although this kind of program allowsthe variation of all parameters for each layer independently (thereby generating alarge number of possible solutions), we used a global volume-constraint on thelipid molecules to find a unique, physically realistic solution. This procedurerelies on the fundamental assumptions that (i) each lipid head group must onlybe connected to two hydrocarbon chains and that (ii) the number of phospholipidmolecules on both sides of the bilayer must be identical within this restraint. Thisensures the correct distribution of the water molecules present at the interfacewhilst maintaining the proportions of the lipid molecules. In other words, thethickness and solvent content of lipid chain and headgroup boxes are coupled toeach other in our simulations.
In the case of a layer composed of a mixture of molecules, the scatteringlength density is the sum of the molecular scattering length densities ρi weightedby the volume fractions ϕi at which each component is present, for example in amixture of phospholipid (l), enzyme (E) and water (w), the scattering lengthdensity will be:
qlayer ¼ /lql þ /EqE þ /wqw: ð2Þ
Thus, the individual volume fractions can be computed from the fitted scatteringlength densities of the lipid hydrocarbon core and headgroup regions, and theenzyme layer. The enzyme molecules may be considered to displace some of thelipid and/or water molecules in any of the layers in the model, subject to theconstraint that the molecular proportions of the lipids and the enzyme must beconserved (e.g. the enzyme volume fractions in the layers it is present mustamount to the same number of molecules across all the layers). The data analysisprocedure is further explained in Materials and methods.
3. Ellipsometry
We used null ellipsometry [49] to follow the hydrolysis ofphospholipid bilayers in-situ. The ellipsometric angles ψ and Δwere determined from measurement of the incident and finalangles of polarisation and used to compute the complexreflection amplitude ratio ρ:
q ¼ jrprsjexp drp % drs
! "¼ tanwexp iDð Þ ð3Þ
where rs and rp are the reflection coefficients for s- and p-polarised light and δrs/rp represent their phase shifts uponreflection. The procedure applied to characterising the phospho-lipid bilayers was the same as that described by Tiberg andLandgren for surfactant films at the silica–water interface [50].Briefly, the ellipsometric angles ψ and Δ of the bare siliconsubstrate are recorded in air and water (the so-called multiple-medium method) before the formation of a supported bilayer.The ellipsometric angles are related to the bilayer refractive indexand to some extent, its thickness, via the Fresnel relations, whichare solved numerically by requiring the refractive indices of SiO2
and the phospholipid to be real. By using this procedure,refractive index values of n2=5.5±0.05–0.25±0.05 j andn1=1.48±0.005 were typically found for the bulk silicon andthe silicon dioxide layer respectively. The thickness of the oxidelayer was typically 270–300 Å. The bilayer surface coverage Γ(mg m−2) was computed using de Feijter's Eq. (4)
C ¼ ðn% n0Þdn=dc
d ð4Þ
Fig. 2. Reaction scheme for phospholipid hydrolysis by PLA2. The numbersindicated for the head groups and chains are the scattering length densities of thecomponents in units of 10−6 Å−2, as calculated from molecular componentvolumes [54].
1038 H.P. Wacklin et al. / Biochimica et Biophysica Acta 1768 (2007) 1036–1049
where n and n0 are the refractive indices of the adsorbate andbulk solvent respectively, d is the adsorbed film thickness and dn/dc is the refractive index increment (0.154 for DOPC [36]) of theadsorbate(measured by classical refractometry). The standarddeviation in determining the ellipsometric angles ψ and Δ wasestimated previously to be of the order of 0.001° and 0.002°respectively [49]. Although the errors in thickness andrefractive index can be quite large at low adsorbed amounts,they fall to less than 5% above 2 mg m−2, and are coupled ina way that they cancel when the surface excess is computed.Thus the surface excess is the most reliably computedproperty of very thin films (<30 Å) and was our primaryinterest in these experiments.
3.1. Experimental procedures
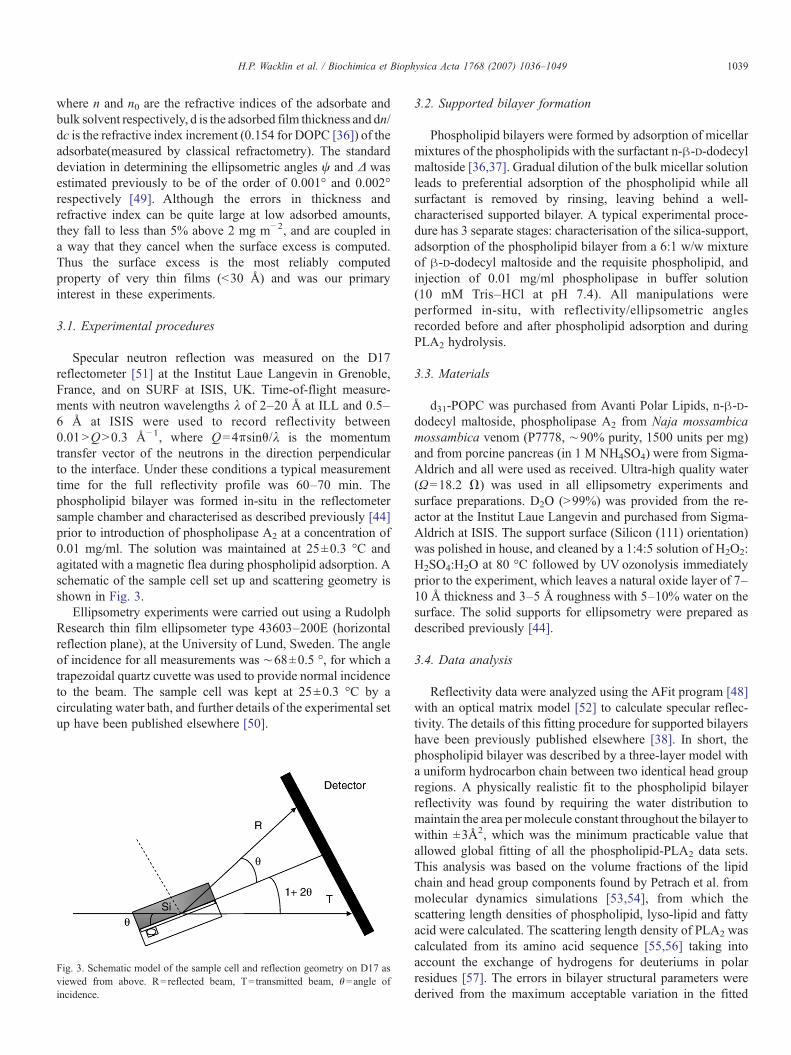
Specular neutron reflection was measured on the D17reflectometer [51] at the Institut Laue Langevin in Grenoble,France, and on SURF at ISIS, UK. Time-of-flight measure-ments with neutron wavelengths λ of 2–20 Å at ILL and 0.5–6 Å at ISIS were used to record reflectivity between0.01>Q>0.3 Å−1, where Q=4πsinθ/λ is the momentumtransfer vector of the neutrons in the direction perpendicularto the interface. Under these conditions a typical measurementtime for the full reflectivity profile was 60–70 min. Thephospholipid bilayer was formed in-situ in the reflectometersample chamber and characterised as described previously [44]prior to introduction of phospholipase A2 at a concentration of0.01 mg/ml. The solution was maintained at 25±0.3 °C andagitated with a magnetic flea during phospholipid adsorption. Aschematic of the sample cell set up and scattering geometry isshown in Fig. 3.
Ellipsometry experiments were carried out using a RudolphResearch thin film ellipsometer type 43603–200E (horizontalreflection plane), at the University of Lund, Sweden. The angleof incidence for all measurements was ∼68±0.5 °, for which atrapezoidal quartz cuvette was used to provide normal incidenceto the beam. The sample cell was kept at 25±0.3 °C by acirculating water bath, and further details of the experimental setup have been published elsewhere [50].
3.2. Supported bilayer formation
Phospholipid bilayers were formed by adsorption of micellarmixtures of the phospholipids with the surfactant n-β-D-dodecylmaltoside [36,37]. Gradual dilution of the bulk micellar solutionleads to preferential adsorption of the phospholipid while allsurfactant is removed by rinsing, leaving behind a well-characterised supported bilayer. A typical experimental proce-dure has 3 separate stages: characterisation of the silica-support,adsorption of the phospholipid bilayer from a 6:1 w/w mixtureof β-D-dodecyl maltoside and the requisite phospholipid, andinjection of 0.01 mg/ml phospholipase in buffer solution(10 mM Tris–HCl at pH 7.4). All manipulations wereperformed in-situ, with reflectivity/ellipsometric anglesrecorded before and after phospholipid adsorption and duringPLA2 hydrolysis.
3.3. Materials
d31-POPC was purchased from Avanti Polar Lipids, n-β-D-dodecyl maltoside, phospholipase A2 from Naja mossambicamossambica venom (P7778, ∼90% purity, 1500 units per mg)and from porcine pancreas (in 1 M NH4SO4) were from Sigma-Aldrich and all were used as received. Ultra-high quality water(Ω=18.2 Ω) was used in all ellipsometry experiments andsurface preparations. D2O (>99%) was provided from the re-actor at the Institut Laue Langevin and purchased from Sigma-Aldrich at ISIS. The support surface (Silicon (111) orientation)was polished in house, and cleaned by a 1:4:5 solution of H2O2:H2SO4:H2O at 80 °C followed by UV ozonolysis immediatelyprior to the experiment, which leaves a natural oxide layer of 7–10 Å thickness and 3–5 Å roughness with 5–10% water on thesurface. The solid supports for ellipsometry were prepared asdescribed previously [44].
3.4. Data analysis
Reflectivity data were analyzed using the AFit program [48]with an optical matrix model [52] to calculate specular reflec-tivity. The details of this fitting procedure for supported bilayershave been previously published elsewhere [38]. In short, thephospholipid bilayer was described by a three-layer model witha uniform hydrocarbon chain between two identical head groupregions. A physically realistic fit to the phospholipid bilayerreflectivity was found by requiring the water distribution tomaintain the area per molecule constant throughout the bilayer towithin ±3Å2, which was the minimum practicable value thatallowed global fitting of all the phospholipid-PLA2 data sets.This analysis was based on the volume fractions of the lipidchain and head group components found by Petrach et al. frommolecular dynamics simulations [53,54], from which thescattering length densities of phospholipid, lyso-lipid and fattyacid were calculated. The scattering length density of PLA2 wascalculated from its amino acid sequence [55,56] taking intoaccount the exchange of hydrogens for deuteriums in polarresidues [57]. The errors in bilayer structural parameters werederived from the maximum acceptable variation in the fitted
Fig. 3. Schematic model of the sample cell and reflection geometry on D17 asviewed from above. R=reflected beam, T=transmitted beam, θ=angle ofincidence.
1039H.P. Wacklin et al. / Biochimica et Biophysica Acta 1768 (2007) 1036–1049

parameters, in other words the thickness, volume fraction andscattering length density of each part of the lipid bilayer. Wehave previously demonstrated how the sensitivity of neutronreflection to structural details can be enhanced using the volumeconstraint, and shown that a supported DPPC bilayer has asomewhat lower density than a bulk lamellar phase at 25 °C, anda scattering length density of 6.9×10⁻⁶ Å−1 in the palmitoyl-chain region. The reflectivity profiles from partially deuteratedd31-POPC -PLA2 bilayers were fitted by allowing the lipidscattering length density to vary from that calculated for d31-POPC to determine the distribution of the reaction products. Theerror given for the lipid scattering length density ρ is that derivedfrom the maximum variation in this fitting parameter, while theerror in the total scattering length density ρa (the scatteringlength density of layer a in the model) is also related to the errorin fitting the water content of the layer and lipid volume fractionϕ. The errors in thickness and volume fraction in the modelsublayers are coupled in such away that the total errors in surfaceexcess and thickness are ±10% and ±2 Å respectively.
4. Results
4.1. The length of the lag phase and PLA2 concentration
Ellipsometry was used to record the surface coverage ofsupported phospholipid bilayers during the course of PLA2
hydrolysis. Fig. 4 shows the surface coverage Γ and thicknessof a DOPC bilayer recorded during attack by porcinepancreatic PLA2 at 0.01 mg/ml and 0.02 mg/ml concentrations.The point of enzyme injection is at t=0, and it is apparent thatin both cases there is a significant induction period before thesurface excess starts to decrease rapidly, which is interpreted asthe onset of sustained hydrolysis. The lag period is shortenedfrom 350 min. to 230 min. as the enzyme concentration isdoubled, and at 0.02 mg/ml of PLA2 the bilayer surface excess
tends to a limiting value of 0.26 mg m−2 (6% of the originalbilayer mass), which is nearly 3 times higher in the presence ofonly 0.01 mg/ml PLA2 (0.885 mg m−2, 21%).
Linear fits to the rapid phase hydrolysis after the end of thelag phase resulted in rates of 0.335 μg m−2 s−1 and 0.631 μgm−2 s−1 for 0.01 mg/ml and 0.02 mg/ml enzyme respectively,corresponding to 0.426 μmol m−2 s−1 and 0.802 μmol m−2 s−1.In other words, doubling the enzyme concentration leads to anearly 2-fold increase in the rate of removal of lipid from thesurface, but the length of the lag phase decreases by only 34%.This implies either that not all the enzyme is immediatelyassociated with the lipid bilayer, but accumulates during the lagperiod, or that, once at the interface, the enzyme moleculesrequire a period of time to overcome an activation barrier tocatalysis. It is not possible to distinguish these two mechanismswithout knowledge of the location and amount of PLA2.
The shortening of the lag phase is consistent with earliersuggestions in the literature [11] that gradual accumulation ofreaction products is required to provide the ideal conditions forPLA2 catalysis, in which case the time taken to generate asufficient fraction of products would be shorter in the presenceof a larger number of PLA2 molecules bound to the membrane.Lateral phase separation and the presence of domain edges inthe bilayer have been used to explain this autocatalytic effect ofthe products [10], but the negative charge of the fatty acids mayalso increase PLA2 partitioning in the membrane [24].
The changes in the extent of the reaction can be understoodin terms of the reduced number of enzyme molecules at themembrane interface, which, at low bilayer coverage slows downthe reaction turnover. PLA2 aggregation in fatty-acid richregions would also act to reduce the number of active enzymemolecules in the membrane faster at lower enzymeconcentration.
4.2. PLA2 binding during the lag phase
In order to understand what changes occur in the membraneduring the lag phase and how they eventually lead to a burst ofenzyme activity, we recorded the neutron reflectivity profiles ofphospholipid bilayers during and after the lag phase. While thesmall amounts of PLA2 bound to the membranes are notdetected by ellipsometry, we have previously shown that thescattering contrast in a neutron reflection measurement can bemanipulated so as to yield both the amount and location of theenzyme in the phospholipid bilayer.
Fig. 5 shows the reflectivity profiles of a DOPC bilayerrecorded before and after the injection of porcine pancreaticPLA2. The results obtained from data fitting are presented inTable 1. ρ corresponds to the scattering length density of eachmolecular fragment, and ρa is used to denote the scatteringlength density fitted for each layer and includes any solventpresent. The fitted thicknesses t of the lipid bilayer regions(heads and chains), and lipid volume fractions ϕ are given withthe areas per molecule and surface coverage values Γ that werecalculated from them. The surface coverage of PLA2 denotesthe total mount of PLA2 in all the layers it was found to bepresent in. For example, a layer “chains+PLA2” with a 7 Å
Fig. 4. Surface coverage and thickness of a DOPC bilayer recorded byellipsometry during porcine pancreatic PLA2 hydrolysis. 0.01 mg/ml PLA2:(grey solid line) surface coverage Γ/mg m−2 and (grey crosses) bilayer thicknesst/Å. 0.02 mg/ml PLA2: (black solid line) bilayer surface coverage Γ/mg m−2 and(open circles) bilayer thickness t/Å. PLA2 was injected at t=0 and the end of theinduction period is indicated in each case.
1040 H.P. Wacklin et al. / Biochimica et Biophysica Acta 1768 (2007) 1036–1049

thickness, and “head 2+PLA2”with a 6 Å thickness denote thatan increased scattering length density was found in the outer 7 Åof the chain region and the 6 Å thick outer head group region,and was assumed to be due to replacement of lipids by PLA2. Ifthe total thickness given for the PLA2 layer is, for example 21 Åthis indicates that the enzyme extends a further 8 Å into thesolution outside the bilayer. The enzyme volume fractiondenotes that the enzyme replaces this fraction of the lipids in thelayer. For example 0.4 vol.% of PLA2 in the lipid headgroupregion (6 Å thick) corresponds to a volume of 0.4×6.94×1015×325 Å3=9×10¹⁷ Å3, or 5.5×10¹⁷ Å2 of the membrane
surface area, where 6.94×10¹⁵ is the number of lipid moleculesin the bilayer. If the total thickness of the PLA2 layer is 21 Å,then the footprint of one PLA2 molecule is 733 Å2, which leadsto a PLA2 to lipid mole ratio of 0.03.
No significant changes (less than 5 v/v%) occur in thephospholipid surface coverage during the first 3 h of lipid–PLA2
interaction, confirming the existence of a lag phase of similarlength to that observed by ellipsometry. This is demonstrated bythe fact that although an increase is observed in reflectivity in the0.15>Q>0.21 Å−1 region, the data could be fitted by main-taining the lipid bilayer coverage within ±10% of the original Γ.The changes in reflectivity could be modeled by describing theenzyme as occupying a 21±3 Å layer at the lipid–water inter-face, i.e. penetrating through the outer headgroup region and 6±3 Å into the chain region of DOPC. After 6 h, a much morepronounced change in the reflectivity shows that hydrolyticbreakdown of DOPC into a lyso-lipid and fatty acid has started tocause removal of lipids from the support surface. At 9 h afterenzyme injection, the destruction of the DOPC bilayer continuesat a rate comparable to that previously observed for PLA2 fromNaja mossambica mossambica venom, with 40% of the originalbilayer mass having been removed at this stage. Coincident withthe start of rapid hydrolysis is also a 40% increase in membranebound PLA2 from 0.32 mg m−2 to 0.45 mg m−2.
4.3. Fate of the reaction products in d31-POPC hydrolysis
We also investigated the distribution of the lyso-lipid andfatty acid in Naja mossambica mossambica hydrolysis of d31-POPC. We previously observed this enzyme hydrolyzing asupported h-POPC bilayer immediately, although at a slightlylower overall efficiency compared to DOPC. The reflectivityprofiles of d31-POPC before, after 70 min and after 10 h 10 minof PLA2 hydrolysis are shown in Fig. 6. The fitting parametersand the bilayer properties calculated from the fits are summa-
Table 1Structural parameters of DOPC bilayer measured during PLA2 hydrolysis
Lipid Layer ρ/10−6 Å−2* ρa/10−6 Å−2† t/Å ϕ A/Å2″ Γ/mg m−2
DOPC pH 7.4 Heads 1.78±0.15 3.29±0.23 7±1 0.67±0.05 72±19 3.62±0.3610 mM TRIS Chains −0.21±0.15 0.38±0.13 30±2 0.91±0.02 72±7pig PLA2 Head 1 1.78±0.15 3.47±0.23 7±1 0.63±0.05 77±19 3.40±0.340.01 g/l 3 h Chains −2.1±0.15 0.12±0.13 27±2 0.95±0.02 77±8
Chains+PLA2# 0.2±0.15 0.5±0.12 6±2 0.95±0.02 77±8
Head 2+PLA2# 1.98±0.15 3.60±0.22 7±1 0.63±0.05 77±19
PLA2§ 3.84±0.15 6.10±0.10 21±2 0.10±0.05 7300±3000 0.32±0.03
pig PLA2 Head 1.78±0.15 4.02±0.23 7±1 0.51±0.05 94±26 2.76±0.280.01 g/l 6 h Chains −0.21±0.15 1.10±0.13 20±2 0.80±0.02 95±11
Chains+PLA2# 0.4±0.15 1.59±0.12 6±1 0.80±0.02 95±11
Head 2LA2# 2.09±0.15 4.18±0.21 7±1 0.51±0.05 94±26
PLA2§ 3.84±0.15 5.97±0.10 20±2 0.15±0.05 5100±1400 0.45±0.05
pig PLA2 Head 1 1.78±0.15 4.52±0.23 7±1 0.40±0.05 120±36 2.16±0.220.01 g/l 9 h Chains −0.21±0.15 2.81±0.13 24±2 0.54±0.02 122±14
Chains+PLA2# 0.4±0.15 3.14±0.12 6±2 0.54±0.02 122±14
Head 2+PLA2# 2.09±0.15 4.65±0.21 7±1 0.40±0.05 120±36
PLA2§ 3.84±0.15 5.97±0.10 20±2 0.15±0.05 5100±1400 0.45±0.05
*ρ=molecular scattering length density, †ρa= total scattering length density of layer a. Head 1 refers to the inner headgroup layer facing the silicon surface. ″A is thearea available per molecule and Γ the lipid surface excess. #PLA2 penetrates through the outer headgroup region and 6 Å into the outer hydrocarbon region. §Molecularparameters of PLA2 were calculated for the total thickness of this region.
Fig. 5. Specular reflectivity of a supported DOPC bilayer at the Silica–D2Ointerface recorded before and during porcine pancreatic PLA2 hydrolysis. (Opendiamonds) substrate reflectivity in D2O, (open circles) DOPC bilayer at in10 mM Tris–D2O pH 7.4, (open squares) DOPC bilayer 3 h after injection of0.01 mg/ml PLA2, (open triangles) DOPC bilayer 6 h after PLA2 injection and(crosses) DOPC bilayer 9 h after PLA2 injection. The reflectivity profiles (datapoints) and the data fits (solid lines) have been displaced by successive factors of10 for clarity. Statistical error bars are indicated for all data points. The data fitscorrespond to the bilayer parameters given in Table 1.
1041H.P. Wacklin et al. / Biochimica et Biophysica Acta 1768 (2007) 1036–1049
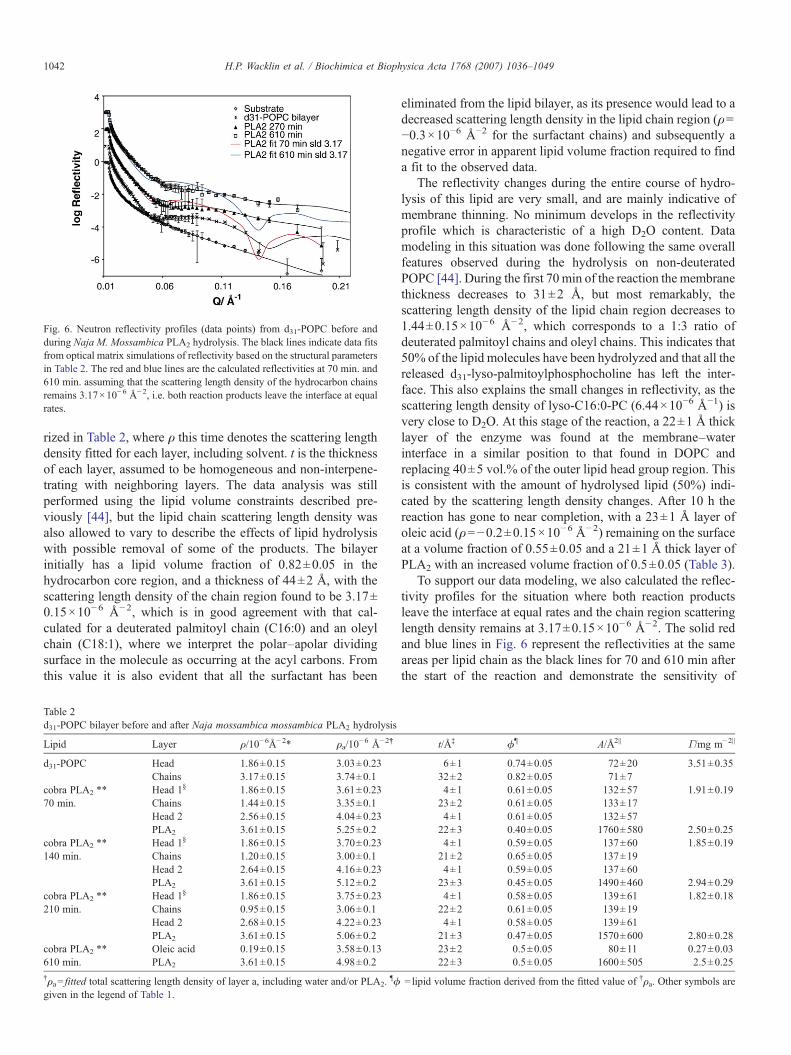
rized in Table 2, where ρ this time denotes the scattering lengthdensity fitted for each layer, including solvent. t is the thicknessof each layer, assumed to be homogeneous and non-interpene-trating with neighboring layers. The data analysis was stillperformed using the lipid volume constraints described pre-viously [44], but the lipid chain scattering length density wasalso allowed to vary to describe the effects of lipid hydrolysiswith possible removal of some of the products. The bilayerinitially has a lipid volume fraction of 0.82±0.05 in thehydrocarbon core region, and a thickness of 44±2 Å, with thescattering length density of the chain region found to be 3.17±0.15×10⁻⁶ Å−2, which is in good agreement with that cal-culated for a deuterated palmitoyl chain (C16:0) and an oleylchain (C18:1), where we interpret the polar–apolar dividingsurface in the molecule as occurring at the acyl carbons. Fromthis value it is also evident that all the surfactant has been
eliminated from the lipid bilayer, as its presence would lead to adecreased scattering length density in the lipid chain region (ρ=−0.3×10⁻⁶ Å−2 for the surfactant chains) and subsequently anegative error in apparent lipid volume fraction required to finda fit to the observed data.
The reflectivity changes during the entire course of hydro-lysis of this lipid are very small, and are mainly indicative ofmembrane thinning. No minimum develops in the reflectivityprofile which is characteristic of a high D2O content. Datamodeling in this situation was done following the same overallfeatures observed during the hydrolysis on non-deuteratedPOPC [44]. During the first 70 min of the reaction the membranethickness decreases to 31±2 Å, but most remarkably, thescattering length density of the lipid chain region decreases to1.44±0.15×10⁻⁶ Å−2, which corresponds to a 1:3 ratio ofdeuterated palmitoyl chains and oleyl chains. This indicates that50% of the lipid molecules have been hydrolyzed and that all thereleased d31-lyso-palmitoylphosphocholine has left the inter-face. This also explains the small changes in reflectivity, as thescattering length density of lyso-C16:0-PC (6.44×10⁻⁶ Å−1) isvery close to D2O. At this stage of the reaction, a 22±1 Å thicklayer of the enzyme was found at the membrane–waterinterface in a similar position to that found in DOPC andreplacing 40±5 vol.% of the outer lipid head group region. Thisis consistent with the amount of hydrolysed lipid (50%) indi-cated by the scattering length density changes. After 10 h thereaction has gone to near completion, with a 23±1 Å layer ofoleic acid (ρ=−0.2±0.15×10⁻⁶ Å−2) remaining on the surfaceat a volume fraction of 0.55±0.05 and a 21±1 Å thick layer ofPLA2 with an increased volume fraction of 0.5±0.05 (Table 3).
To support our data modeling, we also calculated the reflec-tivity profiles for the situation where both reaction productsleave the interface at equal rates and the chain region scatteringlength density remains at 3.17±0.15×10⁻⁶ Å−2. The solid redand blue lines in Fig. 6 represent the reflectivities at the sameareas per lipid chain as the black lines for 70 and 610 min afterthe start of the reaction and demonstrate the sensitivity of
Fig. 6. Neutron reflectivity profiles (data points) from d31-POPC before andduring Naja M. Mossambica PLA2 hydrolysis. The black lines indicate data fitsfrom optical matrix simulations of reflectivity based on the structural parametersin Table 2. The red and blue lines are the calculated reflectivities at 70 min. and610 min. assuming that the scattering length density of the hydrocarbon chainsremains 3.17×10⁻⁶ Å−2, i.e. both reaction products leave the interface at equalrates.
Table 2d31-POPC bilayer before and after Naja mossambica mossambica PLA2 hydrolysis
Lipid Layer ρ/10−6Å−2* ρa/10−6 Å−2† t/Ň ϕ¶ A/Å2|| Γ/mg m−2||
d31-POPC Head 1.86±0.15 3.03±0.23 6±1 0.74±0.05 72±20 3.51±0.35Chains 3.17±0.15 3.74±0.1 32±2 0.82±0.05 71±7
cobra PLA2 ** Head 1§ 1.86±0.15 3.61±0.23 4±1 0.61±0.05 132±57 1.91±0.1970 min. Chains 1.44±0.15 3.35±0.1 23±2 0.61±0.05 133±17
Head 2 2.56±0.15 4.04±0.23 4±1 0.61±0.05 132±57PLA2 3.61±0.15 5.25±0.2 22±3 0.40±0.05 1760±580 2.50±0.25
cobra PLA2 ** Head 1§ 1.86±0.15 3.70±0.23 4±1 0.59±0.05 137±60 1.85±0.19140 min. Chains 1.20±0.15 3.00±0.1 21±2 0.65±0.05 137±19
Head 2 2.64±0.15 4.16±0.23 4±1 0.59±0.05 137±60PLA2 3.61±0.15 5.12±0.2 23±3 0.45±0.05 1490±460 2.94±0.29
cobra PLA2 ** Head 1§ 1.86±0.15 3.75±0.23 4±1 0.58±0.05 139±61 1.82±0.18210 min. Chains 0.95±0.15 3.06±0.1 22±2 0.61±0.05 139±19
Head 2 2.68±0.15 4.22±0.23 4±1 0.58±0.05 139±61PLA2 3.61±0.15 5.06±0.2 21±3 0.47±0.05 1570±600 2.80±0.28
cobra PLA2 ** Oleic acid 0.19±0.15 3.58±0.13 23±2 0.5±0.05 80±11 0.27±0.03610 min. PLA2 3.61±0.15 4.98±0.2 22±3 0.5±0.05 1600±505 2.5±0.25†ρa= fitted total scattering length density of layer a, including water and/or PLA2.
¶ϕ =lipid volume fraction derived from the fitted value of †ρa. Other symbols aregiven in the legend of Table 1.
1042 H.P. Wacklin et al. / Biochimica et Biophysica Acta 1768 (2007) 1036–1049

neutron reflection to the layer composition. It was not possible tofit the data using a model assuming an even distribution of theproducts at any area per molecule, and hence we conclude thatthe lyso-lipid leaves the surface at the same rate as it is generatedby PLA2. A schematic model for a possible PLA2 interactionwith the POPC bilayer is shown in Fig. 7. Our data pointsstrongly to a mechanism in which the fatty acid accumulation atthe interface is accompanied by an increased adsorption of PLA2
while the lyso-lipid leaves the supported bilayer.
4.4. Distribution of products during the lag phase
We repeated the experiment using d31-POPC with porcinepancreatic PLA2. The reflectivity profiles in Fig. 8 show that inthis case too, only small changes in reflectivity occur during thereaction. Taking into account the possible changes in lipid
scattering length density, we interpreted these results using asimilar model as for the lag phase of pancreatic PLA2 withDOPC. The reflectivity profiles indicate that at least a 5-hinduction period exists before any significant amount (>10%)of the lipid material begins to leave the membrane. The inter-action with PLA2 leads mainly to thinning of the d31-POPChydrocarbon region by 4±1 Å. The contrast is less sensitive tothe exact location of PLA2 due to the partial deuteration of thelipid (the chain scattering length density is very close to that ofPLA2), but it was still possible to identify a 21±3 Å layer of theenzyme partially embedded in the bilayer. Even after 5 h thechanges in lipid volume fraction remain small, but begin to beaccompanied by a slow decrease in the chain scattering lengthdensity from 3.17×10⁻⁶ Å−2 to 2.75×10⁻⁶ Å−2, which impliesthat some of the deuterated lyso-palmitoyl lipid has left themembrane. Based on the phospholipid component volumes [53],
Table 3Structural parameters of d31-POPC during porcine pancreatic PLA2 hydrolysis
Lipid Layer ρ/10−6Å−2 ρa/10−6Å−2 t/Å ϕ Aa/Å2 Γ/mg m−2
d31-POPC Heads 1.86±0.15 3.52±0.22 6±1 0.63±0.10 85±31 2.95±0.30Chains 3.17±0.25 3.87±0.10 28±2 0.78±0.20 86±25
pig PLA2 1 h Head 1 1.86±0.15 3.84±0.22 6±1 0.56±0.10 96±37 2.49±0.25Chains 3.17±0.25 3.77±0.10 24±2 0.81±0.20 96±30Head 2+PLA2
# 2.16±0.15 4.34±0.21 6±1 0.56±0.10 96±30PLA2
§ 3.84±0.15 6.22±0.18 21±3 0.05±0.05 14,700±11000 0.30±0.03pig PLA2 5 h Head 1 1.86±0.15 3.66±0.24 5±1 0.60±0.10 107±46 2.34±0.23
Chains 3.17±0.25 3.97±0.10 23±2 0.75±0.20 108±35Chains+PLA2
# 3.26±0.25 4.03±0.10 5±1 0.75±0.20 108±35Head 2+PLA2
# 2.26±0.15 3.90±0.20 5±1 0.60±0.10 107±46PLA2 3.84±0.15 5.97±0.18 19±3 0.15±0.05 5400±2600 0.81±0.08
pig PLA2 10 h Head 1 1.86±0.15 3.33±0.23 4±1 0.67±0.10 120±61 2.09±0.21Chains 2.75±0.25 3.58±0.10 20±2 0.77±0.20 121±41Chains+PLA2
# 3.02±0.25 3.79±0.10 5±1 0.77±0.20 121±41Head 2+PLA2
# 2.24±0.15 3.60±0.21 4±1 0.67±0.10 120±61PLA2
§ 3.84±0.15 5.85±0.18 20±3 0.20±0.05 3800±1900 1.14±0.11#PLA2I initially penetrates into the outer headgroups and after 5 hours, 5Å into the hydrocarbon region. Other symbols are given in the legend of Table 1.
Fig. 7. Schematic model of a possible PLA2 interaction with a phospholipidbilayer based on the box models used to fit neutron reflectivity data as presentedin Table 2. The enzyme resides at the lipid–water interface and partially pene-trates into the bilayer. Fatty acid (small blue head group) accumulates in thebilayer as the lyso-phospholipid (large red head group) partitions into thesolution.
Fig. 8. Specular reflectivity of a supported d31-POPC bilayer at the Silica–D2Ointerface recorded before and during porcine pancreatic PLA2 hydrolysis. (Opendiamonds) substrate reflectivity in D2O, (open circles) d31-POPC bilayer at in10 mM Tris–D2O pH 7.4, (open squares) d31-POPC bilayer 1 h after injection of0.01 mg/ml PLA2, (crosses) d31-POPC bilayer 5 h after PLA2 injection and(open triangles) d31-POPC bilayer 10 h after PLA2 injection. The data fitscorrespond to the bilayer properties given in Table 3.
1043H.P. Wacklin et al. / Biochimica et Biophysica Acta 1768 (2007) 1036–1049

we estimate this fraction to be 5% of the deuterated sn-1 chains.Although the interfacial PLA2 volume fraction is initially lowerfor d31-POPC, it increases even more dramatically during the lagperiod than was the case for DOPC (Table 4).
4.5. Hydrolysis of DPPC by pancreatic PLA2
The interaction of pancreatic PLA2 with DPPC at the sametemperature (25 °C) is markedly different from DOPC andPOPC. Fig. 9 shows the reflectivity profiles from a chain-deu-terated d62-DPPC recorded before and after injection of PLA2.The bilayer reflectivity was measured in two contrasts, D2O andwater contrast matched to bulk silicon (CmSi, sld=2.07×10⁻⁶ Å−2), in order to determine the lipid volume fraction priorto PLA2 injection. In this case the lipid bilayer had a relativelylow volume fraction of only 45% indicating the presence of large(nm-size) lipid-free areas of the support surface, likely to be theresult of defects in the underlying surface. The injection of PLA2
was found to lead to a small increase in reflectivity, which iscontrary to what would be expected for a phospholipid bilayerreplaced by the solvent (D2O), and the data were found to fit bestto a model in which PLA2 penetrates uniformly throughout thebilayer but does not catalyze any significant amount of hydro-lysis. In a manner similar to DOPC and POPC, the DPPC bilayerbecomes 4±1 Å thinner upon interaction with PLA2 indicatingthat some enzyme–lipid binding and changes in the lipidpacking occur. PLA2 is likely to bind to the membrane edgesaround the defects as well as on the top of the membrane, whichwould make it appear as though it was penetrating deeper intothe lipid bilayer. When the DPPC experiment was repeated witha high quality d75-DPPC (chain and head deuterated) bilayer(data not shown), no changes in the bilayer composition wereobserved over extended periods of time (7 h) even using a 2-foldincrease in the enzyme concentration. We also repeated theexperiment using a single-chain deuterated d31-DPPC (at 67%volume fraction), but observed no reactivity up to 16 h afterPLA2 injection. These results indicate that this enzyme isinactive towards a DPPC at 25 °C, when it is in the gel state, butalso point to the importance of the lipid surface coverage ininterpreting results of experiments using supported modelmembranes. It has been argued by several researchers thatPLA2 can be activated by defects in model membranes [10,11],but our data points to the opposite conclusion; it appears that at25 °C in the absence of Ca2+ DPPC is not hydrolysed by
pancreatic PLA2 even when the bilayer has a large number ofdefects. This difference from previously published data could bean effect of the experimental conditions such as the nature of thesolid surface (e.g. charge), which may change properties of thelipid bilayer [58]. The silica substrates used here have a muchlower negative surface charge than mica surfaces which aretypically used in atomic force microscopy [59]. It is possibletherefore that the lipid molecules in our case have higher lateraland vertical mobility.
5. Discussion
5.1. Compositional changes and the role of reaction productsin PLA2 activation
Our results constitute the first direct measurement of theabsolute amount of PLA2 bound to a phospholipid bilayerduring the lag phase, and show unambiguously that it increases,although the changes observed in lipid composition are small.More remarkable is that in both cases, DOPC and d31-POPC,the lag phase is terminated when 5±3% of the lipid moleculeshave been hydrolysed although the time required for this isconsiderably longer for d31-POPC. The volume fraction of
Table 4Fitted parameters and bilayer properties of d62-DPPC before and during PLA2 hydrolysis
Lipid Layer ρ/10−6 Å−2 ϕ(PLA2) ρa/10 −6 Å−2 t/Å ϕ Aa/Å2 Γ/mg m−2
d62-DPPC Head 1.84±0.25 – 1.97±0.10 7±1 0.44±0.05 106±30 2.29±0.23CmSi Chains 6.89±0.15 – 4.24±0.10 37±2 0.45±0.02 107±11d62-DPPC Head 1.84±0.15 – 4.37±0.23 7±1 0.44±0.05 106±30 2.29±0.23D2O TRIS pH 7.4 Chains 6.89±0.25 – 6.59±0.11 37±2 0.45±0.2 107±41pig PLA2
# Head 2.14±0.15 0.15±0.08 4.03±0.21 7±1 0.55±0.05 85±22 2.88±0.290.01 g/l 1.5 h Chains 6.43±0.25 0.15±0.08 6.41±0.11 30±2 0.70±0.20 85±26pig PLA2
# Head 2.24±0.15 0.20±0.08 3.88±0.21 6±1 0.60±0.05 91±27 2.68±0.620.01 g/l 7.5 h Chains 6.28±0.25 0.20±0.08 6.30±0.11 26±2 0.75±0.20 91±28
Symbols are given in the legend of Table 1.
Fig. 9. Specular reflectivity of a supported d62-DPPC bilayer at the Silica–D2Ointerface recorded before and during porcine pancreatic PLA2 hydrolysis.(circles) d62-DPPC bilayer at in 10 mM Tris–D2O pH 7.4, (crosses) d62-DPPCbilayer at in 10 mM Tris–CmSi pH 7.4, (open squares) d62-DPPC bilayer 1.5 hafter injection of 0.01 mg/ml PLA2, (open diamonds) d62-DPPC bilayer 7.5 hafter PLA2 injection. The data fits correspond to the parameters given in Table 4.
1044 H.P. Wacklin et al. / Biochimica et Biophysica Acta 1768 (2007) 1036–1049

PLA2 bound to d31-POPC is initially higher but in both cases itincreases by ∼5 vol.% during the course of the lag phase,indicating that the departure of the lyso-PC and generation offatty acid enhance PLA2 binding to the membrane.
These results are in good agreement (to within our experi-mental error of ±3 vol.%) with the critical product mole fractionof 8.3% found in previous studies [11] to be sufficient toeliminate the lag phase of pancreatic PLA2. Our results alsoshow that despite the lyso-lipid being a leaving group in themembrane, its structure has an effect on the activation of PLA2
by way of regulating the length of the lag phase. Underconditions where the lag phase has been eliminated by additionof Ca2+, the effect of the lyso-lipid on the initial rate of PLA2
hydrolysis has been found to be much smaller than that of thefatty acid [60]. Considered together with the evidence from ourexperiment that the enzyme seems to be inactive towards, butstill interacts with DPPC in the gel-state, this suggests that thePLA2–membrane interaction has two steps, adsorption of theenzyme to the lipid–water interface and subsequent penetrationto the lipid hydrocarbon core, the latter being required forcatalytic activity. The amount of the enzyme bound to the lipidinterface initially was found to be very similar for DOPC andDPPC with both pancreatic and cobra venom PLA2 at 25 °C,which suggests that it is predominantly driven by electrostaticinteractions with the headgroup, but that the penetration step,which is required for catalytic activity, is more dependent on thenature of the phospholipid packing, and hence, the nature of thesn-1 chain. These effects may even be coupled to each other dueto the difference in lipid conformation in the fluid and gel phase.For example MAS-NMR studies [61] have shown that the31P–14N dipole in phosphocholine headgroups is almost parallelto the lipid–water interface in fluid membranes, whereas it ismore perpendicular to the interface in the gel state, in which casethe negative charge of the phosphate (and acyl bonds) may beeffectively shielded by the positively charged choline nitrogen.This means that ultimately PLA2 activity is sensitive to bothhydrophobic and electrostatic interactions between the lipidsand the enzyme and these all determine whether it can access theacyl bonds to be hydrolysed and release the products in order tocontinue the catalytic cycle.
Our results are also the first direct measurement of membranecompositional changes during active PLA2 hydrolysis. Thesolution partitioning of the d31-lyso-lipid and the accumulationof fatty acid in the membrane are consistent with the solubilitiesof the two reaction products, with the lyso-lipid having a largezwitterionic head group and the fatty acid a long saturatedhydrocarbon chain. Although lyso-lipids and fatty acids canform planar bilayer structures when present in a 1:1 ratio, whenthey are generated in the membrane there will be an equilibriumbetween the membrane and the aqueous phase leading to apartitioning of each according to their solubilities. The cmc of 1-palmitoyl-3-sn-phosphocholine is 70 μM [62] which isconsiderably higher than the entire stock of lysolipid that canbe released from the supported membrane into the solution andthis acts as a driving force for its solubilisation from the mem-brane. For example, in our bilayers, d31-POPC has an averageavailable molecular are of Amol=72 Å2, and the surface of our
silicon crystal is 5000 mm2, which accommodates 6.94×10¹⁵
molecules=11 nmol. This would give rise to a concentration of0.5 μM in a 22-ml neutron reflectivity cell, which is 140 timessmaller than the cmc of lyso-palmitoyl-PC. The C18:1 fatty acidis orders of magnitude less soluble. The possibility of reactionproduct retention in the hydrolysis of short chain lipid mono-layers has been suggested [63], but ours is the first confirmationof the changing lipid composition and the almost exclusivesolubilisation of the C16:0-lyso-PC.
An increased interaction of the enzyme with reaction pro-ducts in the membrane has been postulated before [11,15,64,65],and has, in the absence of methods to quantify the interfacialproduct concentrations, been a subject of much speculation. Insimple terms the product activation can be understood as anincreased electrostatic interaction arising from the presence of(at pH 7.4) negatively charged fatty acids with the enzyme,which is known to have several cationic residues that participatein the membrane interaction [66,67]. Thus, the enzymepartitioning is shifted towards the membrane bound state withincreasing fatty acid content of the membrane. That this effectvaries so much between three lipids as closely related as DOPC,POPC andDPPC, suggests that the reactivity of pancreatic PLA2
also dramatically depends on the lipid chain packing.A debate about the mechanism of PLA2 activation has been
going on for decades between the leading groups in the area.While the Jain group postulates that the activation is solelybased on electrostatic interactions, i.e. that only the number ofenzymes adsorbed at the membrane interface counts [63], theVerger laboratory originally suggested that a penetration step isalso required [68]. It is interesting to compare the implicationsof these concepts in light of the results from our experiments.Our results support the product activation hypothesis by con-firming that the amount of PLA2 at the interface increasesduring the lag phase (pancreatic PLA2), and also during theactive phase (cobra PLA2). However, if the activation of PLA2
were only dependent on the initial electrostatic interactions,then the length of the lag phase should be the same for allphosphatidylcholine bilayers, because the amount of enzymeinitially adsorbed is remarkably similar for all three lipids.However, we see a significant difference in the lag length evenbetween DOPC (3 h) and POPC (5 h) and no catalytic activitytowards DPPC, which clearly suggests that the activationinvolves another rate limiting step. Jain et al. suggest that thenegative fatty acid accumulation would only activate the initialenzyme adsorption step and increase kcat
* , the rate constant ofthe catalytic conversion step, but the parameters used by Jainet al. are derived from the kinetic analysis of homogenouscatalysis and cannot be used to describe the changes in themembrane structure that can also occur due to the reactionproduct accumulation, such as increased/decreased fluidity, in-terfacial roughness or lateral heterogeneity. The penetrationscheme of Verger has been impossible to validate in the absenceof methods to measure the penetration directly.
We believe that our neutron reflection and ellipsometryresults offer the first confirmation and a possible explanation ofseveral previously predicted effects. Our earlier results alreadyindicated that the location of PLA2 in supported bilayers
1045H.P. Wacklin et al. / Biochimica et Biophysica Acta 1768 (2007) 1036–1049

overlaps with the lipid headgroups, and part of the outer leafletchain region [44]. Accompanying the lag phase we have nowalso observed an increase in the penetration depth of PLA2.Both results strongly support the idea of a penetration step asrate limiting in catalytic activity. Thirdly, we see a similaramount of PLA2 adsorbed on the inactive DPPC bilayer duringthe lag phase as on the active DOPC bilayer during hydrolysis.Therefore the enzyme adsorption step cannot be the singleactivating process.
At least two different modes of membrane binding have beenidentified for PLA2 by fluorescence spectroscopy [6,7]. Whilethere is no direct structural evidence for a conformational changeof the enzyme, it is more certain that the different fluorescencestates represent two different types of PLA2–lipid interactions,i.e. two different locations of the enzyme at the lipid–waterinterface. Penetration into the lipid chain region implies that thelipids are also required to have the conformational freedom toallow PLA2 to reach its catalytic depth as a part of lipid insertioninto the active site. This catalytic depth could be described as thelocation in which all hydrophobic and electrostatic enzyme–lipid–water interactions are optimized, and may be very sensi-tive to the surface features of the enzyme and the lipid con-formation. Thus an inactive form of PLA2 could be bound at thelipid–water interface without being able to perform catalysis,which would explain the apparent inactivity of porcine pan-creatic PLA2 towards DPPC (in the absence of electrolytes) at25 °C. The inactivity would be expected to disappear when thelipids are heated to near or above the phase transition tem-perature, as has indeed been observed in DPPC vesicles [14],which are inactive towards pancreatic PLA2 in the absence ofCa2+ but exhibit a substrate concentration dependent lag-burstbehavior similar to unsaturated lipids above 38 °C. The im-portance of lipid conformation is further supported by resultsobtained from liquid chromatographic separations of lipid mix-tures such as DMPC/DSPC, in which the fluid lipid is prefer-entially hydrolysed [69].
It has also been suggested [11,24] that the presence ofreaction products causes phase separation in the membrane andcan activate PLA2 via defects. Given the complete solubilisationof the lyso-lipid evident in our neutron reflectivity data, thiseffect would then be solely due to the fatty acids, which can havevery different properties according to the nature of their hydro-carbon chain. In particular it has been found that the effect ofunsaturated fatty acids on a phospholipid bilayer structure isnegligible compared to saturated fatty acids [70]. A saturatedlong chain fatty such as palmitic acid tends to pack tightly into acrystalline lattice even at physiological temperatures, while thecorresponding unsaturated fatty acid is much more flexible andhas virtually no effect on the lipid bilayer melting temperature.The increased binding of PLA2 to the d31-POPC bilayer withincreasing oleic acid content confirms that the binding of thisenzyme is favored by the accumulating fatty acid, but thestrength of their interaction does not inhibit catalysis, whichproceeds to near completion. However, hydrolysis of DPPC byNaja m. mossambica PLA2 stops after only ∼15% of the phos-pholipid has been consumed, although PLA2 is still found to bepresent in the inactive membrane. This behavior can only be
explained by a binding interaction which has become so strongthat the catalytic cycle of PLA2 is disrupted and the enzyme isirreversibly bound to the lipid matrix. Such trapping could becaused by tightly packed domains of palmitic acid. Thereversibility of PLA2 binding to model lipid interfaces hasbeen a matter of interest for some decades, mainly due to theinfluence it has on the types of kinetic analyses that can beapplied, with the “scooting” and “hopping” modes beingreferred to as the irreversible and reversible cases respectively[71]. The apparent deactivation or trapping of PLA2 in DPPCmembranes suggests that the binding in this case at least isirreversible, as otherwise the enzyme could continue the reactionby “hopping” in and out of the membrane. It also suggests thatthe effect of the fatty acids is local substrate depletion becausethe reaction stops at such an early stage.
Our results are consistent with results on Agkistrodon pisci-vorus piscivorus (Type IIA [1]) PLA2 hydrolysis obtained byTatulian et al. [72] using attenuated total reflection infra-redspectroscopy (ATR-FTIR) [73], where the hydrolysis of sn-1deuterated DPPC was followed by monitoring the integratedCH2 and CD2 vibration intensities. A 20% difference in thefraction of unlabelled and labelled acyl chains retained in themembrane was observed by Tatulian et al., which is relativelysmall compared to the complete elimination of the lyso-lipid thatwe measured for d31-POPC and pancreatic PLA2, but doescorrelate well with our results on DPPC hydrolysis by Najamossambica mossambica PLA2 (which exhibits no lag phase). Itmay be that the variation is a result of different lipid–enzymeinteractions of the three different PLA2s. In Tatulian's case theAgistrodon piscivorus piscivorus PLA2 (which does exhibit a lagphase in the absence of Ca2+) was also activated by 2mMCaCl2,whereas we used no Ca2+ in our experiments. The similarity ofresults for the two active enzymes is interesting because theenzymes belong to two different classes but the total amount oflipid hydrolysed is in close agreement.
Overall, our results are contradictory to the assumptions usedin the scooting model of interfacial hydrolysis, in that themembrane composition changes on both sides of the supportedbilayer, implying that flip-flop of the fatty acid/phospholipid[74] is readily achieved without penetration of PLA2 to the otherside of the bilayer. Although supported bilayers and vesiclesdiffer in some of their properties as model membranes, theevidence presented for the integrity of vesicles during lipidhydrolysis by Jain et al. is inconclusive, especially whenconsidered in the light of the now measured solubilisation of thelyso-lipids. Virtually all the PLA2 hydrolysis data used toformulate the scooting model has been generated indirectly bysampling the entire reaction mixture or by measuring pH. In facta temperature dependent release of fluorescence markers duringPLA2 hydrolysis has been observed in phosphocholine vesicles[21,69], and it could be due to the slow removal of the lyso-lipids. The only other evidence for the scooting model is that thetotal amount of lipid material hydrolysed [75] correlates withthe amount of lipid assumed to reside in the outer leaflet of thevesicles based on the average size. The extent of hydrolysis insolution is most commonly measured by pH-Stat titrations [71],but it has previously been commented that rapid flip-flop of the
1046 H.P. Wacklin et al. / Biochimica et Biophysica Acta 1768 (2007) 1036–1049

fatty acids to the interior of the vesicles can give rise to mis-leading results [76,77]. We would therefore like to speculatethat the end-point of hydrolysis is not necessarily achievedwhen all the outer lipids have been digested, but when the outerlipid–product mixture has reached a limiting composition inwhich PLA2 can no longer effectively catalyse hydrolysis. Themain concern with using the scooting model to interpret the so-called “interfacial processivity” of enzymes is however that itonly applies to negatively charged micelle or (small unilamel-lar) vesicle interfaces, which often contain non-naturallyoccurring components, such as phosphomethanol lipids ordetergents. Such highly curved and highly charged interfacesare hardly similar to the natural operating environment of PLA2,which may exhibit comparatively different behavior towardscell membranes.
6. Conclusion
By using neutron reflection we have determined thecomposition of supported lipid bilayer during PLA2 hydrolysisand the lag phase of pancreatic PLA2 in situ together with theamount and location of membrane-bound PLA2. The increase inthe amount of PLA2 bound to both DOPC and d31-POPC duringthe lag phase strongly supports the idea that the lag phenomenonis a result of gradual changes in the lipid matrix that lead to anenhancement of PLA2 affinity for the membrane. An increase inthe penetration depth of PLA2 into the d31-POPC bilayer isobserved before the start of rapid hydrolysis, indicating that theaccumulation of reaction products also facilitates the hydro-phobic interaction between the lipid chains and the enzyme thatleads to its activation. The changes in the neutron reflectivityprofile of d31-POPC compared to POPC indicate unambiguouslythat the scattering length density of the partially deuteratedmembrane decreased during the reaction and all data profilescould be fitted using a model of gradual removal of thedeuterated lyso-C16-PC from the bilayers.
The exact mechanism of phospholipase A2 hydrolysisremains elusive, but our results demonstrate for the first timethe actual fate of the reaction products and show that PLA2 ishighly sensitive to the lipid chain composition, which calls forthe development of more accurate kinetic analyses to describethe effects of the reaction products. The biological functions andsubstrates of PLA2 are diverse, and it is likely that its regulationis related to the membrane lipid composition in eachenvironment. Since PLA2 plays a major role in inflammatoryresponse, it is a good candidate for drug development aimed atits selective inhibition [78], but advance is hampered by a lackof understanding about the subtleties of its regulation. We haveshown that neutron reflection gives unique information aboutthe composition and structure of phospholipid membranes, andis a valuable tool in studying the regulation of membranebinding enzymes such as PLA2.
Acknowledgements
This work was supported by the UK Biotechnology andBiological Sciences Research Council (BBSRC), the EU Marie
Curie training network, the Academy of Finland and the FinnishCultural Foundation. The authors would like to thank Dr. JohnWebster of the ISIS Neutron Facility, UK for his help in therealization of these experiments.
References
[1] D.A. Six, E.A. Dennis, The expanding superfamily of phospholipase A(2)enzymes: classification and characterization, Biochim. Biophys. Acta-Mol. Cell Biol. Lipids 1488 (2000) 1–19.
[2] R.K. Arni, R.J. Ward, Phospholipase A(2)—A structural review, Toxicon34 (1996) 827–841.
[3] B.W. Dijkstra, J. Drenth, K.H. Kalk, Active-site and catalytic mechanismof phospholipase-A2, Nature 289 (1981) 604–606.
[4] D.L. Scott, S.P. White, Z. Otwinowski, W. Yuan, M.H. Gelb, P.B. Sigler,Interfacial catalysis—The mechanism of phospholipase-A2, Science 250(1990) 1541–1546.
[5] M.H. Gelb, J.H. Min, M.K. Jain, Do membrane-bound enzymes accesstheir substrates from the membrane or aqueous phase: interfacial versusnon-interfacial enzymes, Biochim. Biophys. Acta-Mol. Cell Biol. Lipids1488 (2000) 20–27.
[6] W.R. Burack, M.E. Gadd, R.L. Biltonen, Modulation of phospholipase a(2)—Identification of an inactive membrane-bound state, Biochemistry 34(1995) 14819–14828.
[7] M.E. Gadd, R.L. Biltonen, Characterization of the interaction of phos-pholipase A(2) with phosphatidylcholine-phosphatidylglycerol mixedlipids, Biochemistry 39 (2000) 9623–9631.
[8] J.D. Bell, R.L. Biltonen, Molecular details of the activation of solublephospholipase- A(2) on lipid bilayers—Comparison of computer-simula-tions with experimental results, J. Biol. Chem. 267 (1992) 11046–11056.
[9] L.K. Nielsen, J. Risbo, T.H. Callisen, T. Bjornholm, Lag-burst kinetics inphospholipase A(2) hydrolysis of DPPC bilayers visualized by atomic forcemicroscopy, Biochim. Biophys. Acta-Biomembr. 1420 (1999) 266–271.
[10] T. Honger, K. Jorgensen, R.L. Biltonen, O.G. Mouritsen, Systematicrelationship between phospholipase A(2) activity and dynamic lipidbilayer microheterogeneity, Biochemistry 35 (1996) 9003–9006.
[11] W.R. Burack, Q. Yuan, R.L. Biltonen, Role of lateral phase-separation inthe modulation of phospholipase-A2 activity, Biochemistry 32 (1993)583–589.
[12] R. Verger, M.C.E. Mieras, G.H. de Haas, Action of phospholipase A atinterfaces, J. Biol. Chem. 218 (1973) 4023–4034.
[13] S.A. Tatulian, R.L. Biltonen, L.K. Tamm, Structural changes in a secretoryphospholipase A(2) induced by membrane binding: a clue to interfacialactivation? J. Mol. Biol. 268 (1997) 809–815.
[14] G. Romero, K. Thompson, R.L. Biltonen, The activation of porcinepancreatic phospholipase-A2 by dipalmitoylphosphatidylcholine largeunilamellar vesicles—Analysis of the state of aggregation of the activatedenzyme, J. Biol. Chem. 262 (1987) 13476–13482.
[15] R. Apitzcastro, M.K. Jain, G.H. Dehaas, Origin of the latency phase duringthe action of phospholipase- A2 on unmodified phosphatidylcholinevesicles, Biochim. Biophys. Acta 688 (1982) 349–356.
[16] J. Davidsen, O.G. Mouritsen, K. Jorgensen, Synergistic permeabilityenhancing effect of lysophospholipids and fatty acids on lipid membranes,Biochim. Biophys. Acta-Biomembr. 1564 (2002) 256–262.
[17] Y. Cajal, M.K. Jain, Synergism between mellitin and phospholipase A(2)from bee venom: apparent activation by intervesicle exchange of phos-pholipids, Biochemistry 36 (1997) 3882–3893.
[18] R. Verger, G.H.D. Haas, Enzyme reactions in a membrane model: 1. Newtechnique to study enzyme reactions in monolayers, Chem. Phys. Lipids 10(1973) 127–136.
[19] E.A. Dennis, Kinetic dependence of phospholipase A2 activity ondetergent triton X-100, J. Lipid Res. 14 (1973) 152–159.
[20] M.K. Jain, J. Rogers, D.V. Jahagirdar, J.F. Marecek, F. Ramirez, Kineticsof interfacial catalysis by phospholipase A2 in intravesicle scooting mode,and heterofusion of anionic and zwitterionic vesicles, Biochim. Biophys.Acta 860 (1986) 435–447.
[21] O.G. Berg, B.Z. Yu, J. Rogers, M.K. Jain, Interfacial catalysis by
1047H.P. Wacklin et al. / Biochimica et Biophysica Acta 1768 (2007) 1036–1049
phospholipase-A2—Determination of the interfacial kinetic rate constants,Biochemistry 30 (1991) 7283–7297.
[22] G.M. Carman, R.A. Deems, E.A. Dennis, Lipid signaling enzymes andsurface dilution kinetics, J. Biol. Chem. 270 (1995) 18711–18714.
[23] I. Panaiotov, R. Verger, in: A. Baszkin, W. Norde (Eds.), PhysicalChemistry of Biological Interfaces, Marcel Dekker Inc., New York, 2000,pp. 359–400.
[24] K.M.Maloney,M. Grandbois, D.W. Grainger, C. Salesse, K.A. Lewis,M.F.Roberts, Phospholipase A(2) domain formation in hydrolyzed asymmetricphospholipid monolayers at the air/water interface, Biochim. Biophys.Acta-Biomembr. 1235 (1995) 395–405.
[25] J.B. Hayter, R.R. Highfield, B.J. Pullman, R.K. Thomas, A.I. McMullen, J.Penfold, Critical reflection of neutrons—A new technique for investigat-ing interfacial phenomena, J. Chem. Soc.-Faraday Trans. I 77 (1981)1437–1448.
[26] G. Fragneto-Cusani, Neutron reflectivity at the solid/liquid interface: ex-amples of applications in biophysics, J. Phys.-Condens. Matter 13 (2001)4973–4989.
[27] T. Gutberlet, R. Steitz, G. Fragneto, B. Klosgen, Phospholipid bilayerformation at a bare Si surface: a time-resolved neutron reflectivity study,J. Phys.-Condens. Matter 16 (2004) S2469–S2476.
[28] S. Krueger, Neutron reflection from interfaces with biological andbiomimetic materials, Curr. Opin. Colloid Interface Sci. 6 (2001) 111–117.
[29] B. Stidder, G. Fragneto, R. Cubitt, A.V. Hughes, S.J. Roser, Cholesterolinduced suppression of large swelling of water layer in phosphocholinefloating bilayers, Langmuir 21 (2005) 8703–8710.
[30] U.A. Perez-Salas,K.M. Faucher, C.F.Majkrzak,N.F. Berk, S.Krueger, E.L.Chaikof, Characterization of a biomimetic polymeric lipid bilayer by phasesensitive neutron reflectometry, Langmuir 19 (2003) 7688–7694.
[31] C.A. Naumann, O. Prucker, T. Lehmann, J. Ruhe, W. Knoll, C.W. Frank,The polymer-supported phospholipid bilayer: tethering as a new approachto substrate–membrane stabilization, Biomacromolecules 3 (2002) 27–35.
[32] G. Fragneto, F. Graner, T. Charitat, P. Dubos, E. Bellet-Amalric, Interactionof the third helix of Antennapedia homeodomain with a deposited phos-pholipid bilayer: a neutron reflectivity structural study, Langmuir 16 (2000)4581–4588.
[33] C.E. Miller, J. Majewski, K. Kjaer, M. Weygand, R. Faller, S. Satija, T.L.Kuhl, Neutron and X-ray scattering studies of cholera toxin interactionswith lipid monolayers at the air–liquid interface, Colloids Surf., B 40(2005) 159–163.
[34] C.P. Johnson, G. Fragneto, O. Konovalov, V. Dubosclard, J.F. Legr, D.E.Leckband, Structural studies of the neural-cell-adhesion molecule by X-rayand neutron reflectivity, Biochemistry 44 (2005) 546–554.
[35] E. Sackmann, Supported membranes: scientific and practical applications,Science 271 (1996) 43–48.
[36] F. Tiberg, I. Harwigsson, M. Malmsten, Formation of model lipid bilayersat the silica–water interface by co-adsorption with non-ionic dodecylmaltoside surfactant, Eur. Biophys. J. Biophys. Lett. 29 (2000) 196–203.
[37] H. Vacklin, F. Tiberg, R.K. Thomas, Formation of supported phospholipidbilayers via co-adsorption with b-D-dodecyl maltoside, Biochim. Biophys.Acta—Biomembr. 1668 (2005) 17–24.
[38] H. Vacklin, F. Tiberg, G. Fragneto, R.K. Thomas, Composition of sup-ported model membranes determined by neutron reflection, Langmuir 21(2005) 2827–2837.
[39] T. Brumm, C. Naumann, E. Sackmann, A.R. Rennie, R.K. Thomas, D.Kanellas, J. Penfold, T.M. Bayerl, Conformational-changes of the lecithinheadgroup in monolayers at the air/water interface—A neutron reflectionstudy, Eur. Biophys. J. Biophys. Lett. 23 (1994) 289–295.
[40] C. Naumann, T. Brumm, A.R. Rennie, J. Penfold, T.M. Bayerl, Hydrationof DPPC monolayers at the air/water interface and its modulation by thenonionic surfactant C(12)E(4)—A neutron reflection study, Langmuir 11(1995) 3948–3952.
[41] C. Naumann, C. Dietrich, A. Behrisch, T. Bayerl, M. Schleicher, D.Bucknall, E. Sackmann, Hisactophilin-mediated binding of actin to lipidlamellae: a neutron reflectivity study of protein membrane coupling,Biophys. J. 71 (1996) 811–823.
[42] C. Naumann, C. Dietrich, J.R. Lu, R.K. Thomas, A.R. Rennie, J. Penfold,T.M. Bayerl, Structure of mixed monolayers of dipalmitoylglyceropho-
sphocholine and polyethylene-glycol monododecyl ether at the air–water-interface determined by neutron reflection and film balance techniques,Langmuir 10 (1994) 1919–1925.
[43] R.M.A. Azzam, N.M. Bashara, Ellipsometry and Polarised Light, North-Holland, Amsterdam, 1986.
[44] H. Vacklin, F. Tiberg, G. Fragneto, R.K. Thomas, Phospholipase A2 hy-drolysis of supported phospholipid bilayers: a neutron reflectivity andellipsometry study, Biochemistry 44 (2005) 2811–2821.
[45] J.E. Bradley, E.M. Lee, R.K. Thomas, A.J. Willatt, J. Penfold, R.C.Ward, D.P. Gregory, W. Waschkowski, Adsorption at the liquid surfacestudied by means of specular reflection of neutrons, Langmuir 4 (1988)821–826.
[46] G. Fragneto, Z.X. Li, R.K. Thomas, A.R. Rennie, J. Penfold, A neutronreflectivity study of the adsorption of aerosol-OT on self-assembledmonolayers on silicon, J. Colloid Interface Sci. 178 (1996) 531–537.
[47] J.S. Pedersen, I.W. Hamley, Analysis of neutron and X-ray reflectivity databy constrained least-squaresmethods, Phys., B Condens.Matter 198 (1994)16–23.
[48] P.N. Thirtle. AFit Simulation Program, v3.1., Oxford University (1997).[49] M. Landgren, B. Jonsson, Determination of the optical-properties of Si/
SiO2 surfaces by means of ellipsometry, using different ambient media,J. Phys. Chem. 97 (1993) 1656–1660.
[50] F. Tiberg, M. Landgren, Characterization of thin nonionic surfactant filmsat the silica water interface by means of ellipsometry, Langmuir 9 (1993)927–932.
[51] R. Cubitt, G. Fragneto, D17: the new reflectometer at the ILL, Appl. Phys.A: Mater. Sci. Proc. 74 (2002) S329–S331.
[52] O.S. Heavens, Optical Properties of Thin Films, Butterworths, London,1955.
[53] H.I. Petrache, S.E. Feller, J.F. Nagle, Determination of component volumesof lipid bilayers from simulations, Biophys. J. 72 (1997) 2237–2242.
[54] R.S. Armen, O.D. Uitto, S.E. Feller, Phospholipid component volumes:determination and application to bilayer structure calculations, Biophys. J.75 (1998) 734–744.
[55] F.J. Joubert, Naja Mossambica Mossambica venom: purifications, someproperties and the amino acid sequences of three phospholipases A (CM-I,CM-II and CM-II), Biochim. Biophys. Acta 493 (1977) 216–227.
[56] A.A. Zamyatin, Protein volume in solution, Prog. Biophys. Mol. Biol. 24(1972) 107–123.
[57] B. Jacrot, Rep. Prog. Phys. 39 (1976) 911.[58] R.P. Richter, N. Maury, A.R. Brisson, On the effect of the solid support on
the interleaflet distribution of lipids in supported lipid bilayers, Langmuir21 (2005) 299–304.
[59] L.K. Nielsen, K. Balashev, T.H. Callisen, T. Bjornholm, Influence ofproduct phase separation on phospholipase A2 hydrolysis of supportedphospholipid bilayers studied by force microscopy, Biophys. J. 83 (2002)2617–2624.
[60] M.K. Jain, D.V. Jahagirdar, Action of phospholipase-A2 on bilayers—Effect of fatty-acid and lysophospholipid additives on the kinetic-parameters, Biochim. Biophys. Acta 814 (1985) 313–318.
[61] F.W. Lindstroem, P.T.F.Williamson, G. Goebner,Molecular insight into theelectrostatic membrane surface potential by 14N/31P MAS NMR spectro-scopy: nociception–lipid association, J. Am. Chem. Soc. 127 (2004)6610–6616.
[62] R.E. Stafford, T. Fanni, E.A. Dennis, Interfacial properties and criticalmicelle concentration of lysophospholipids, Biochemistry 28 (1989)5113–5120.
[63] Y. Cajal, M.A. Alsina, O.G. Berg, M.K. Jain, Product accumulation duringthe lag phase as the basis for the activation of phospholipase A(2) onmonolayers, Langmuir 16 (2000) 252–257.
[64] Y. Cajal, O. Berg, M.K. Jain, Origin of delays in monolayer kinetics:phospholipase A2 paradigm, Biochemistry 43 (2004) 9256–9264.
[65] T. Wieloch, B. Borgstrom, G. Pieroni, F. Pattus, R. Verger, Product ac-tivation of pancreatic lipase, J. Biol. Chem. 257 (1982) 11523–11528.
[66] Y.H. Pan, T.M. Epstein, M.K. Jain, B.J. Bahnson, Five coplanar anionbinding sites on one face of phospholipase A(2). Relationship to interfacebinding, Biochemistry 40 (2001) 609–617.
[67] B.Z. Yu, M.J. Poi, U.A. Ramagopal, R. Jain, S. Ramakumar, O.G. Berg,
1048 H.P. Wacklin et al. / Biochimica et Biophysica Acta 1768 (2007) 1036–1049

M.D. Tsai, K. Sekar, M.K. Jain, Structural basis of the anionic interfacepreference and k*(cat) activation of pancreatic phospholipase A(2),Biochemistry 39 (2000) 12312–12323.
[68] R. Verger, M.C.E. Mieras, G.H. Dehaas, Action of phospholipase a atinterfaces, J. Biol. Chem. 248 (1973) 4023–4034.
[69] C. Leidy, O.G. Mouritsen, K. Jorgensen, N.H. Peters, Evolution of arippled membrane during phospholipase A(2) hydrolysis studied by time-resolved AFM, Biophys. J. 87 (2004) 408–418.
[70] T. Inoue, S. Yanagihara, Y. Misono, M. Suzuki, Effect of fatty acids onphase behavior of hydrated dipalmitoylphosphatidylcholine bilayer:saturated versus unsaturated fatty acids, Chem. Phys. Lipids 109 (2001)117–133.
[71] O.G. Berg, M.K. Jain, Interfacial Enzyme Kinetics, John Wiley & Sons,Ltd., Chichester, 2002.
[72] S.A. Tatulian, Toward understanding interfacial activation of secretoryphospholipase A(2) (PLA(2)): membrane surface properties and mem-brane-induced structural changes in the enzyme contribute synergisticallyto PLA(2) activation, Biophys. J. 80 (2001) 789–800.
[73] S.A. Tatulian, Attenuated total reflection Fourier transform infrared spec-
troscopy: a method of choice for studying membrane proteins and lipids,Biochemistry 42 (2003) 11898–11907.
[74] J.a.C. Liu, J.C. Conboy, 1,2-diacyl-phosphatidylcholine flip-flop mea-sured directly by sum-frequency vibrational spectroscopy, Biophys. J. 89(2005) 2522–2532.
[75] M.K. Jain, J. Rogers, D.V. Jahagirdar, J.F. Marecek, F. Ramirez, Kineticsof interfacial catalysis by phospholipase-A2 in intravesicle scooting mode,and heterofusion of anionic and zwitterionic vesicles, Biochim. Biophys.Acta 860 (1986) 435–447.
[76] F. Kamp, J.A. Hamilton, Ph gradients across phospholipid-membranescaused by fast flip- flop of unionized fatty-acids, Proc. Natl. Acad. Sci.U. S. A. 89 (1992) 11367–11370.
[77] F. Kamp, H.V. Westerhoff, J.A. Hamilton, Movement of fatty-acids, fatty-acid analogs, and bile-acids across phospholipid-bilayers—Kinetics offatty acid-mediated proton movement across small unilamellar vesicles,Biochemistry 32 (1993) 11074–11086.
[78] S. Yedgar, D. Lichtenberg, E. Schnitzer, Inhibition of phospholipase A(2)as a therapeutic target, Biochim. Biophys. Acta-Mol. Cell Biol. Lipids1488 (2000) 182–187.
1049H.P. Wacklin et al. / Biochimica et Biophysica Acta 1768 (2007) 1036–1049