Embed Size (px)
Citation preview

RESEARCH ARTICLE
Distribution of mammal functional diversity in
the Neotropical realm: Influence of land-use
and extinction risk
Jose F. Gonzalez-Maya1,2*, Enrique Martınez-Meyer3, Rodrigo Medellın1,
Gerardo Ceballos1
1 Instituto de Ecologıa, Universidad Nacional Autonoma de Mexico, Mexico DF, Mexico, 2 Proyecto de
Conservacion de Aguas y Tierras, ProCAT Colombia, Carrera 13 # 96–82, Of. 205, Bogota, Colombia,
3 Instituto de Biologıa, Universidad Nacional Autonoma de Mexico, Mexico DF, Mexico
Abstract
Functional diversity represents a measure of diversity that incorporates the role of species
in an ecosystem, and therefore its dynamics and resilience. Assessing its drivers and spatial
variation represents an important step forward in our understanding of functional ecosystem
dynamics and it is also necessary to achieve a comprehensive conservation planning. In
this paper, we assessed mammal functional diversity for the 218 ecoregions within the Neo-
tropical realm. We evaluated the overall influence and spatial variation of species richness,
ecoregion extent, intervention and species at risk on functional diversity. Using ordinary
least squares and geographically weighted regression modeling approaches, we found that
intervened areas and threatened and non-threatened species are the most influential overall
drivers of functional diversity. However, we also detected that these variables do not operate
equally across scales. Our local analyses indicated both that the variation explained and
local coefficients vary spatially depending on the ecoregion and major habitat type. As esti-
mates of functional diversity are based on current distribution of all mammals, negative influ-
ence of intervened areas and positive influence of non-threatened species may reflect a
potential degradation of functional processes for some ecosystems. Most generally, the
negative influence of intervention together with the influence of threatened species indicates
that some areas are currently more susceptible to functional diversity loss. Our results help
to pinpoint key areas requiring urgent conservation action to reduce natural land-cover loss
and areas where threatened species play influential roles on ecosystem functioning.
Introduction
Biological diversity has been historically measured via multiple approaches, ranging from
basic counts of species richness to more sophisticated measures of evolutionary and functional
diversity [1–4]. As more refined and complex measures arise, more aspects of community and
ecosystem dynamics are assessed, allowing more precise inferences about ecosystems function-
ing, resilience and services [2, 5], and in turn, better conservation planning [6]. The Neotropics
PLOS ONE | https://doi.org/10.1371/journal.pone.0175931 April 25, 2017 1 / 17
a1111111111
a1111111111
a1111111111
a1111111111
a1111111111
OPENACCESS
Citation: Gonzalez-Maya JF, Martınez-Meyer E,
Medellın R, Ceballos G (2017) Distribution of
mammal functional diversity in the Neotropical
realm: Influence of land-use and extinction risk.
PLoS ONE 12(4): e0175931. https://doi.org/
10.1371/journal.pone.0175931
Editor: Jesus E. Maldonado, Smithsonian
Conservation Biology Institute, UNITED STATES
Received: April 19, 2016
Accepted: April 3, 2017
Published: April 25, 2017
Copyright: © 2017 Gonzalez-Maya et al. This is an
open access article distributed under the terms of
the Creative Commons Attribution License, which
permits unrestricted use, distribution, and
reproduction in any medium, provided the original
author and source are credited.
Data Availability Statement: Data is freely
available from the IUCN Red List of Threatened
Species (http://www.iucnredlist.org/technical-
documents/spatial-data), World Wildlife Fund
(http://www.worldwildlife.org/publications/
terrestrial-ecoregions-of-the-world) and PanTheria
(Jones et al. 2002) and updates (Davidson et al.
2012), DOI: 10.1890/08-1494.1, including base
information for the figures. Specific original data
for our analyses are available in the Supporting
information file.
is one of the most diverse and complex regions in the world [7, 8], but also one of the most
threatened due to anthropogenic factors [4, 9]. As human intervention increases in Neotropi-
cal ecoregions, more precise, effective and efficient conservation measures are needed, and at
better resolution, in order to reduce biodiversity loss and thus preserve ecosystem services [10,
11]. Understanding underlying drivers of ecosystem function and diversity may allow design-
ing better conservation actions [12, 13].
Disturbance has been previously identified as a determinant and change driver on multiple
diversity measures, including functional diversity, and in general on ecosystem functioning for
multiple taxa and ecosystems across the globe [13–16]. In fact, functional diversity has been
proposed as a useful measure for comparing different ecological scenarios, such as land use
change [14], reflecting its effect on ecosystem functioning. The effect of this disturbance,
mostly in terms of habitat loss, varies spatially and taxonomically [13–16], and previous
studies have determined that species diversity is a good proxy of ecosystem stability but var-
ies according to the ecosystems´ disturbance history [13]. Since increasing disturbance can
have a significant effect on ecosystem stability, understanding which regions have suffered,
or are suffering, more significant functional loss is critical in order to prevent or stop such
degradation. Furthermore, species loss occurs not only due to habitat loss but also to multi-
ple factors operating over species and populations [17, 18]. Species at risk, namely those
with higher likelihood of disappearing on the short term, also play important ecological
roles and their disappearance would be reflected on the loss of functional complementarity
and therefore on ecosystem function [19]. The combination of the effect of human distur-
bance and species at risk would then cover all potential likelihood drivers of functional loss,
providing a better idea of which regions are likely on higher risk of suffering significant
functional degradation [6, 19, 20].
Considering that almost no baseline information exist for most taxonomic groups in the
Neotropics [21], and it was not until recently that complete groups were assessed in terms of
their conservation status and distribution information [11, 22–24], assessing changes and vari-
ation, or original conditions, in terms of ecological processes and extinction occurring at large
scales is a difficult task [21]. Some previous analyses assessed the magnitude of changes in
terms of land-cover for the Neotropics [25, 26], but to our knowledge few studies have related
these changes to ecosystem functionality or functional diversity as for other regions [3, 13–15].
Furthermore, so far, mammal diversity has been mostly studied from the macroecological per-
spective at global scales [7, 10, 17], with very few analyses assessing mammal diversity at
regional/national scales [3, 4, 27–29].
Here we provide a regional-scale analysis of mammal taxonomic and functional diversity
distribution as a basis for developing adequate conservation planning. Our specific goal was to
assess the relationship between mammal functional diversity and human intervention/effects
in the Neotropical ecoregions and its implications for conservation. We specifically address
the following questions: i) how is species richness and mammal functional diversity distributed
across the Neotropical realm and how is it distributed according to similar major habitat
types?, ii) what is the relationship between land-cover, ecoregion area and species extinction
risk on mammal functional diversity?, (iii) what is the spatial variation of these relationships?,
and (iv) what are the critical ecoregions for conservation action based on mammal functional
diversity?
Materials and methods
We assessed mammal species richness and functional diversity for all 218 Neotropical ecore-
gions and 11 biomes (S1 Table) according to WWF ecological regionalization of the world
Mammal functional diversity in the Neotropics
PLOS ONE | https://doi.org/10.1371/journal.pone.0175931 April 25, 2017 2 / 17
Funding: JFG-M acknowledges the scholarship
and financial support provided by the National
Council of Science and Technology (CONACyT),
and UNAM (scholarship 255983).
Competing interests: The authors have declared
that no competing interests exist.

[30], excepting St.Peter-St.Paul Rocks. We used the ecoregions approach based on numerous
reasons: (1) ecoregions represent similar specific ecological continuums [30] that (2) have
close relationship with taxonomic and functional compositions [3, 31, 32], thus having eco-
logical significance, and (3) should better reflect the effect of species composition and inter-
vention on functionality [13–15, 31, 33]; (4) patterns of disturbance and transformation occur
similarly along similar biomes and ecoregions, most of the times with similar underlying driv-
ers [27, 33]; (5) the median size (area) of all Neotropical ecoregions (S16,000 km2) does not
significantly differ from most continental-scale ecological analyses resolution (1˚x1˚, S12,200
km2 in the tropics) [34]; (6) this resolution has been previously used for similar analyses [27,
35]; and, in terms of conservation planning, (7) allows better prioritization given the ecological
significance of such regionalization, and not necessarily responding to political or arbitrary
boundaries but ecologically-significant spatially defined units [32]. In general, our approach is
based on the fact that Functional Diversity (FD) is a result of evolutionary, ecological and func-
tional processes occurring over long periods of time; this reflects community and functional
structure related with ecosystem type and with geographical/ecological significance [3]. We
overlapped the maps of all ecoregions and mammal distributions, derived from current distri-
bution polygons of all mammals obtained from the IUCN Red List [7], identifying all species
present in each ecoregion. These maps were selected as they represent a unique source com-
prising systematic information for most mammals and corrected by region and expertise [7].
We estimated species richness as the total number of mammal species present on each ecore-
gion. To evaluate functional diversity, we first compiled life-traits for all mammals present in
all ecoregions (i.e., 1593 spp.), including trophic guild (i.e., carnivore, omnivore, herbivore),
habit mode (i.e., volant, arboreal, terrestrial, fossorial, and aquatic) and body size (i.e., body
mass), derived from PanTHERIA [36] and other databases [3, 18]; these traits were selected
since they adequately resume various aspects of space and resource use, thus defining impor-
tant niche dimensions of each species [3, 37, 38]. Body size has been previously used in many
ecological studies because its close relationship with nearly all aspects of a species´ ecology and
even to diversity distribution patterns (e.g., environmental filtering) within ecosystems [39,
40]. This trait in relationship with trophic and habitat use characteristics defines resources use
in terms of quantity, type and how to acquire them [37]. This combination and their interac-
tions are a good proxy of species roles and complementarity [41] and are likely highly related
with the biodiversity and ecosystem function relationship [38]. Furthermore, these traits are
available for most species [18] and have been previously informative for exploring risk and
functional diversity in mammals [3, 4, 37, 38].
Mammal diversity measures
Once a species list for each ecoregion was obtained, we estimated species richness and a FD
index based on these traits. The FD index was calculated based on Petchey and Gaston (2002)
index, which is defined as the sum of the dendrogram branch distances necessary to connect
all species in the functional space [37, 42]. We used this metric because it has been previously
shown to perform well with multiple traits (i.e., nominal and quantitative [3, 43]), it interacts
with species richness but performs particularly well for species rich communities–such as
those in the Neotropics, and it does not depend on abundance data [3, 44]. We estimated a dis-
tance matrix and functional dendrogram based on the Gower distance (i.e., Unweighted pair
group with arithmetic averages) and summed the branches necessary to connect all the species
present in the ecoregion. The FD index considers that complementarity is high when the index
is comparatively high, thereby indicating species are distant in trait-space, and low comple-
mentarity occurs when the index is comparatively low, indicating species are more similar [37,
Mammal functional diversity in the Neotropics
PLOS ONE | https://doi.org/10.1371/journal.pone.0175931 April 25, 2017 3 / 17
45]. We assessed variation and similarities of species richness and FD across ecoregions and
according to corresponding biomes. To do so, we used ecoregion classification according to
major habitat types [30], classifying each in eleven biomes: Tropical and subtropical (T&S)
moist broadleaf forests (TSMBF), T&S dry broadleaf forests (TSDBF), T&S coniferous forests
(TSCF), T&S grasslands, savannas, and shrublands (TSGSS), Mangroves (M), Flooded grass-
lands and savannas (FGS), Temperate broadleaf and mixed forests (TBMF), Mediterranean
forests, woodlands, and scrub-sclerophyll forests (MFWSSF), Montane grasslands and shrub-
lands (MGS), Temperate grasslands, savannas, and shrublands (TGSS), and Deserts and xeric
shrublands (DXS; Fig 1A). Then, we assessed normality using a Shapiro-Wilk test, and subse-
quently performed a Kruskal-Wallis non-parametric test to determine differences on species
richness and functional diversity values, and post-hoc tests for identifying the biomes with
higher FD and richness values [46]. In order to evaluate similarities between biomes according
to species richness and FD, we performed a cluster analysis with square Euclidean distances
and different linking methods, selecting those with the highest cophenetic correlation [47].
Drivers of mammal functional diversity
In order to assess the influence of macroecological and anthropogenic variables and species
at risk on FD, we used Ordinary Least Squares modeling approach (OLS; [3]). OLS is a gener-
alized linear modelling technique homologous to linear regressions, accounting for minimiz-
ing the sum of the squares of the differences between the predicted linear values and those
observed on the dataset, thus indicating a causal relationship [48, 49]. We considered four
main variables accounting for gradients and ecological, intervention and risk dimensions iden-
tified by previous studies [1, 3, 13, 37, 50]. The variables included were: 1) mammal species
richness, defined as the total number of species present in each ecoregion since it is expected
this is the most important driver of FD [45]; 2) the area of the ecoregion, defined as its geo-
graphic extent [30], considering it has been previously identified as a driver of FD and trait
richness [51]; 3) intervention, defined as the area of natural and artificial land-covers derived
from the GlobCover database [52], based on previous analyses indicating the influence of dis-
turbance on FD [3, 13–15], and; 4) the number of species classified as threatened and non-
threatened present in the ecoregion, derived from the IUCN Red List of Threatened Species
[53], classifying those species assessed as Least Concern and Near Threatened as non-threat-
ened and those assessed as Data Deficient, Vulnerable, Endangered and Critically Endangered
as threatened, and based on the assumption that species at risk will likely disappear sooner,
therefore more rapidly affecting FD [50]. Even when other human intervention variables
potentially affect FD, generally assessing their influence on diversity measures at multiple
scales is challenging due to the generalized absence of spatial information at appropriate reso-
lutions [11, 54]. Land-use change, in the form of habitat loss and fragmentation, is considered
the most influencing driver of species extinction risk, particularly in mammals [7]; therefore,
even when we did not include other variables explicitly, most of them are implicitly considered
as the main factors driving a species towards extinction. Our selection of potential influencing
variables was based on allowing an accurate assessment of the effect of known and measurable
variables over FD, thus allowing better definition of priority areas and implementation of
actions.
We performed models with all possible variable combinations and no interaction terms
(i.e., 68 combinations), and selected those with the lower Akaike Information Criterion value
(AIC) corrected for small samples and AIC weights (AICw; [55]). We assessed model perfor-
mance based on both the AICc and the adjusted R2 (adjR2), and selected the best fitting model
with significant predictive variables. In order to assess correlation of influencing variables, we
Mammal functional diversity in the Neotropics
PLOS ONE | https://doi.org/10.1371/journal.pone.0175931 April 25, 2017 4 / 17
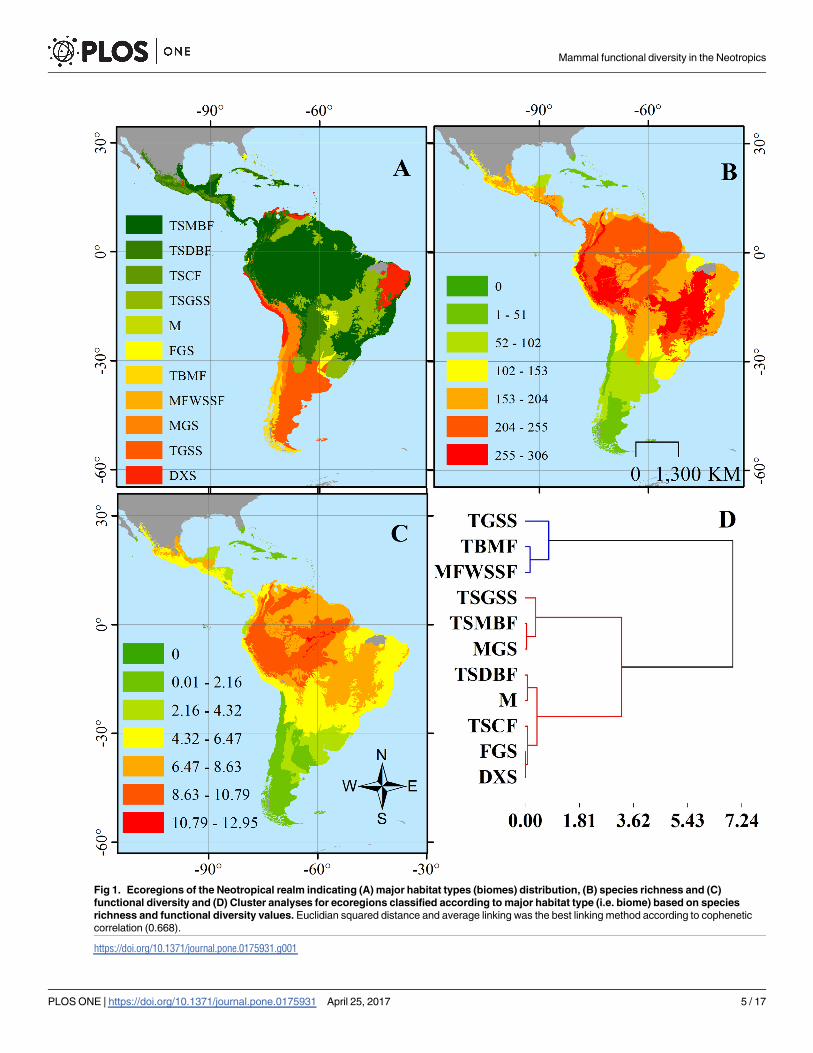
Fig 1. Ecoregions of the Neotropical realm indicating (A) major habitat types (biomes) distribution, (B) species richness and (C)
functional diversity and (D) Cluster analyses for ecoregions classified according to major habitat type (i.e. biome) based on species
richness and functional diversity values. Euclidian squared distance and average linking was the best linking method according to cophenetic
correlation (0.668).
https://doi.org/10.1371/journal.pone.0175931.g001
Mammal functional diversity in the Neotropics
PLOS ONE | https://doi.org/10.1371/journal.pone.0175931 April 25, 2017 5 / 17
estimated Variance Inflation Factors (VIF) for each variable and assessed large VIFs (>7)
according to the model as potentially correlated with other variables [56]. In cases where a vari-
able showed high VIF values in a large number of models, we estimated Spearman correlation
coefficients to determine which variables were highly correlated, thus similarly informing the
models. For assessing the significance of the variables, we estimated Koenke studentized Breusch-
Pagan statistic (K(BP)) and its probability, in order to assess the reliability of standard errors
when heteroskedaticity is present; in case the K(BP) was significant, we used the Robust Probabil-
ity instead of the raw probability estimation. Jarque-Bera statistic and Moran´s I were used for
testing for residuals normality and clustering, respectively; in case residuals were clustered, we
generated a spatial weights matrix and included the weights in the model. The K(BP) statistic also
assess the non-stationarity of the model, meaning that explanatory variables do not behave the
same everywhere (i.e., overall OLS model), therefore indicating that their influence does not oper-
ate homogeneously across geographic space [57].
Spatial variation of variables´ influence on functional diversity
After identifying non-stationarity, we performed a Geographic Weighted Regression (GWR)
with the selected variables, allowing us to assess if local models performed better than the over-
all OLS model by comparing Pseudo R2 values [58]. Also, we assessed the local explanatory
magnitudes (adjR2) and coefficients for each variable over each ecoregion, assessing where
stronger influence relationships occur for all variables (adjR2) and where certain variables are
more important or negatively/positively influence FD (local coefficients; [3, 59, 60]). GWR
evaluates the influence of variables for each ecoregion by generating individual models using a
defined number of adjacent ecoregions (i.e., neighbors); for selecting the number of neighbors
we used an adaptive corrected AIC method with cross-validation, considering that ecoregions
are distributed continuously across the Neotropical realm, and aiming to minimize AIC values
[59]. We used the condition number as a diagnostic of local multicollinearity, indicating a
locally unstable model; as a rule-of-thumb, condition numbers larger than 30 are likely unreli-
able. To test for the generalized FD explained by selected variables derived from local relation-
ships according to biomes, we included all biomes as prediction localities when defining the
model in order to compute coefficients and weighted R2 for each biome. Also, we used the gen-
erated condition numbers as an indication of unstable models and multicolinearity.
Ecoregions of high conservation priority
To select the ecoregions of high conservation priority we identified those ecoregions that are
more influenced by threatened species, according to estimated coefficients, and divided the
coefficient values in three classes (i.e. low, medium and high priority). We mapped these ecor-
egions and spatially identified those as priority for conservation action.
All geographic and statistical analyses were performed in ArcGIS 10.2 [61] and R environ-
ment [62].
Results
Mammal species richness and functional diversity distribution
Mammal FD and species richness across all Neotropical ecoregions showed a gradient distri-
bution from the lowest values in the Southern Cone towards higher values in the Central and
Northern regions of South America, Mesoamerica and decreasing towards Central Mexico
and the Caribbean (Fig 1B). Both measures showed a non-parametric distribution (Shapiro-
Wilks; W = 0.96, p<0.0001 and W = 0.95, p<0.0001, respectively) with a dominance of lower
Mammal functional diversity in the Neotropics
PLOS ONE | https://doi.org/10.1371/journal.pone.0175931 April 25, 2017 6 / 17
values in most ecoregions. There was significant variation in FD (Kruskal-Wallis; H = 44.71,
p<0.0001) and species richness (H = 48.80, p<0.0001) among major habitat types (i.e.,
biomes). Four biomes (T&S Dry Broadleaf Forests, Grasslands, Shrublands and Savannas and
Moist Broadleaf Forests, and Montane Grasslands and Shrublands) had the highest mean
(±SD) species richness (116±73, 148±89, 160±72 and 169±61, respectively) and mean (±SD)
FD values (4.14±2.44, 5.09±3.11, 5.77±2.855, 6.02±2.17, respectively). Both measures tended to
increase with decreasing latitude (Fig 1B), with greater FD values towards the Amazon basin
(Fig 1C). Two main clusters with one subdivision were identified among biomes according to
measures (Squared Euclidean Distance, average linkage; Cophenetic correlation = 0.668). One
group included Temperate Grasslands, Savannas, and Shrublands, Temperate Broadleaf and
Mixed Forests and Mediterranean Forests, Woodlands, and Scrub or Sclerophyll Forests, all
temperate biomes; the second cluster was divided in two groups, one consisting on T&S Grass-
lands, Savannas, and Shrublands, Moist Broadleaf Forests, and Montane Grasslands and
Shrublands; and a second group including T&S Dry Broadleaf Forests, Coniferous Forests,
Mangrove, Flooded Grasslands and Savannas, and Deserts and Xeric Shrublands (Fig 1D).
Variation in both measures responded significantly to the major habitat type (i.e., biomes).
Mammal functional diversity influencing factors
Mammal FD showed a significant relationship with three variables across the entire Neotropi-
cal realm, while ecoregion area did not have a significant effect on this measure. The best
selected model indicated a positive relationship between both threatened and non-threatened
species, more species increases FD, and a negative relationship with the intervened area of
the ecoregion, indicating that when the area of degraded land-covers increases, FD tends to
decrease (Table 1). The first variable excluded from the model, despite the fact that it was used
in all possible combinations, was species richness, as expected from previous studies and the
FD index used, since it showed a significant correlation with other determinant variables (i.e.
threatened and non-threatened species), potentially clouding the effect of the other determi-
nants (Spearman correlation = 0.92, p<0.001). Our model indicated a significant FD variation
explained by the predictor variables (R2 = 0.872), and residuals tested for normality (JB = 84.6,
p = 0.08) and non-clustering (Moran´s I = 0.03, Z-score = 0.36), thus not needing the use of
spatial weights for correcting the model. The model also showed non-stationarity, indicating
that the relationships found do not remain constant across space and scale (K(BP) = 19.69,
p<0.001), therefore, robust probabilities were used for all variables (Table 1).
Spatial variation of the relationship between variables and functional
diversity
The geographically weighted regression (GWR) indicated a differential relationship according
to the spatial location of each ecoregion. The weighted model (Pseudo R2 = 0.98) performed
better than the overall OLS model (Pseudo R2 = 0.89), and the variation explained by all influ-
encing variables also increased significantly (adjR2 = 0.9248). The variability explained for
each ecoregion “neighborhood” varied significantly across the Neotropical realm, with varying
R2 values between 0.53 and 0.99 (mean±SD = 0.84±0.09); Northern South America, and the
South Cone showed the strongest relationship between FD and species, threatened and non-
threatened, and intervention, while the lowest values were located in the southern Amazon
basin (Fig 2A).
Condition numbers indicated no multicollinearity among the local models for each ecore-
gion (Mean±SD = 12.28±4.56). In terms of the influence of each variable across each ecore-
gion, we found that intervention negatively influenced FD more notably in the Amazon Basin
Mammal functional diversity in the Neotropics
PLOS ONE | https://doi.org/10.1371/journal.pone.0175931 April 25, 2017 7 / 17

and Northern Mesoamerica (Fig 2B) with overall low intervention coefficients (mean coeffi-
cient±SD = -4.86E-07±9.64E-07). Threatened species most significantly influenced positively
in the Guyanas and influenced negatively in South America’s Atlantic coast (mean coefficient
±SD = 0.006±0.042; Fig 2C). Finally, non-threatened species had higher influence in the Caa-
tinga and Northern Brazil and lowest influence for the Southern Amazon basin (mean coeffi-
cient±SD = 0.03±0.007; Fig 2D). Overall explained variation weighted and projected by
biomes was high (R2 mean±SD = 0.93±0.03), where the highest influence was determined for
Temperate grasslands, savannas, and shrublands and the lowest for Flooded grasslands and
savannas; no multicollinearity was found for local biome models (Table 2). T & S Broadleaf
Moist Forests, Dry Broadleaf Forests, and Montane Grasslands and Mangroves were the
biomes more significantly affected both by human intervention and species risk, while the
ecoregions located in Northern South America, Mexico and Southern Argentina and Chile
were the ones suffering the strongest influence of only intervention on FD. Condition numbers
of weighted models for each biome showed stability and no effects of multicolinearity (Mean
±SD = 8.18±2.56).
Priority ecoregions for conservation action
We identified 49 high priority ecoregions where species at risk significantly influences FD (S1
Table); most of the ecoregions are located in the Caribbean, the continuum between southern
Nicaragua throughout Costa Rica and Panama into the Caribbean, Choco and Magdalena val-
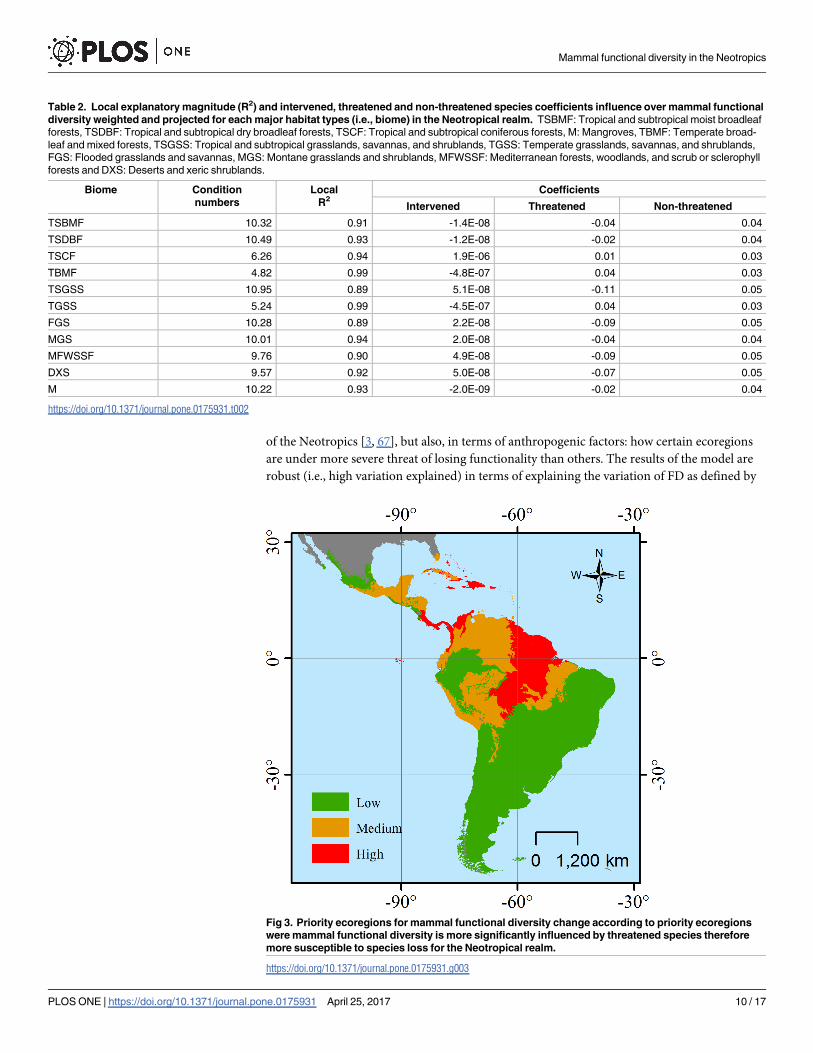
ley in Colombia, and the Guyana shield in South America (Fig 3). The biomes with higher esti-
mated influence of threatened species were the T&S Coniferous, Temperate Broadleaf Forests
and Tropical Grasslands (Table 2) while intervention is more significantly reducing functional
diversity for T&S Moist and Dry Forests, Temperate Forests, Tropical Grasslands and Man-
groves (Table 2).
Discussion
Mammal functional diversity (FD) across the Neotropical realm showed considerable variation
across most ecoregions, but was very similar across major habitat types (Fig 1D); also, it was
significantly influenced both by human impact and species at risk. Differences in FD among
major habitat types probably reflect natural differences due to habitat and environmental con-
straints, which affects both ecosystems and animal assemblages through environmental filter-
ing [63, 64]. Furthermore, similarities among habitats of the same type (e.g., T&S forests)
highlight how this filtering is potentially defining ecosystem structure in terms of functional
types or species roles [4].
Our results highlight the importance of anthropogenic intervention, both at the ecosystem
and species levels (i.e., disturbance and species at risk), regarding ecosystem resilience and
dynamics [65, 66]. Also, our results indicated geographic variation of the influence of the
explanatory variables, indicating the large variation along small space gradients characteristic
Table 1. Best performing selected model including the selected determinant variables influencing mammal functional diversity in the ecoregions
of the Neotropical realm. AIC: Akaike Information Criterion, adjR2: adjusted R2, AICw: AIC weights and VIF: Variance Inflation Factor.
Model Parameters Coef. VIF Robust p AIC adjR2
1 Intercept 0.244 - <0.001 606.15 0.872
Intervened -2.46E-07 1.17 <0.001
Threatened 0.022 3.80 0.026
Non-threatened 0.029 3.56 <0.001
https://doi.org/10.1371/journal.pone.0175931.t001
Mammal functional diversity in the Neotropics
PLOS ONE | https://doi.org/10.1371/journal.pone.0175931 April 25, 2017 8 / 17

Fig 2. Local values of (A) variation explained by selected variables–R2 and coefficients for (B) intervened land use, (C) threatened and (D)
non-threatened species influencing mammal functional diversity for each ecoregion of the Neotropical realm based on a geographically
weighted regression. Higher R2 values indicate higher functional diversity variation explained by the selected variables; higher coefficient value
indicates higher positive influence of each variable while negative values indicate negative influence on functional diversity values.
https://doi.org/10.1371/journal.pone.0175931.g002
Mammal functional diversity in the Neotropics
PLOS ONE | https://doi.org/10.1371/journal.pone.0175931 April 25, 2017 9 / 17
of the Neotropics [3, 67], but also, in terms of anthropogenic factors: how certain ecoregions
are under more severe threat of losing functionality than others. The results of the model are
robust (i.e., high variation explained) in terms of explaining the variation of FD as defined by
Table 2. Local explanatory magnitude (R2) and intervened, threatened and non-threatened species coefficients influence over mammal functional
diversity weighted and projected for each major habitat types (i.e., biome) in the Neotropical realm. TSBMF: Tropical and subtropical moist broadleaf
forests, TSDBF: Tropical and subtropical dry broadleaf forests, TSCF: Tropical and subtropical coniferous forests, M: Mangroves, TBMF: Temperate broad-
leaf and mixed forests, TSGSS: Tropical and subtropical grasslands, savannas, and shrublands, TGSS: Temperate grasslands, savannas, and shrublands,
FGS: Flooded grasslands and savannas, MGS: Montane grasslands and shrublands, MFWSSF: Mediterranean forests, woodlands, and scrub or sclerophyll
forests and DXS: Deserts and xeric shrublands.
Biome Condition
numbers
Local
R2Coefficients
Intervened Threatened Non-threatened
TSBMF 10.32 0.91 -1.4E-08 -0.04 0.04
TSDBF 10.49 0.93 -1.2E-08 -0.02 0.04
TSCF 6.26 0.94 1.9E-06 0.01 0.03
TBMF 4.82 0.99 -4.8E-07 0.04 0.03
TSGSS 10.95 0.89 5.1E-08 -0.11 0.05
TGSS 5.24 0.99 -4.5E-07 0.04 0.03
FGS 10.28 0.89 2.2E-08 -0.09 0.05
MGS 10.01 0.94 2.0E-08 -0.04 0.04
MFWSSF 9.76 0.90 4.9E-08 -0.09 0.05
DXS 9.57 0.92 5.0E-08 -0.07 0.05
M 10.22 0.93 -2.0E-09 -0.02 0.04
https://doi.org/10.1371/journal.pone.0175931.t002
Fig 3. Priority ecoregions for mammal functional diversity change according to priority ecoregions
were mammal functional diversity is more significantly influenced by threatened species therefore
more susceptible to species loss for the Neotropical realm.
https://doi.org/10.1371/journal.pone.0175931.g003
Mammal functional diversity in the Neotropics
PLOS ONE | https://doi.org/10.1371/journal.pone.0175931 April 25, 2017 10 / 17
species richness (i.e., species threatened and non-threatened) and current human intervention.
Overall model variation explained by selected variables, and geographically weighted maxi-
mum variation explained for certain ecoregions, indicates that some regions are heavily
affected by human intervention; however, for ecoregions with low levels of intervention only
~50% of this variation was explained.
Previous studies of global and regional variation on FD in mammals and other groups have
shown similar patterns than those obtained here [3, 4, 37, 68, 69], and most studies have identi-
fied anthropogenic intervention–in terms of land-cover transformation, as a major driver for
FD loss [14, 15, 38, 70]. However, very few studies have assessed the influence of species at risk
and the potential functional loss due to species extinctions [38, 50, 71]. Our results support the
premise that human intervention and species at risk can significantly alter ecosystem function
[38, 50], but also, highlight how threatened species, that according to IUCN standards are
mostly those restricted, vulnerable or rare, contribute significantly (i.e., complementarity) to
unique ecosystem functions [72, 73]. Furthermore, the impact of ecosystem functionality loss
has deeper implications in terms of ecosystem resilience and vulnerability [6, 12, 74]; species
loss not only means a reduction in the number of species in an ecosystem, but also serious
impacts at the community and ecosystem levels [17].
Species richness analyses have previously shown high correlation with FD [75], especially
when using our metric [3, 45], therefore it was expected these variables were highly related [3,
4]. Nevertheless, given the complete assessment of the group [7], species richness influence
could be divided between threatened and non-threatened species, allowing to isolate and
identify the potential negative impact of species loss. The strong influence of intervention and
species at risk on FD in certain ecoregions and biomes helps to identify specifically where pri-
orities should be focused in order to reduce species and ecosystem functionality loss [6, 15, 17,
38, 50]. Biomes and ecoregions at higher risk, as identified by our model, demand prior atten-
tion since impacts of functional loss affect beyond biological diversity, it reduces ecosystem
resilience and services provision [6, 12, 74]. Our identification of priority ecoregions by influ-
ence of species at risk, indicate how certain areas require more urgent conservation actions
at species, populations and ecosystem levels, so FD, and thus ecosystem functioning, can be
maintained. Most of the ecoregions encompassing most of the Neotropical human population
are those requiring reduction of deforestation and intervention in general. Ecoregions in the
likely most diverse areas of the Neotropics are those requiring species-level protection since
threatened species considerably influence FD and hence ecosystem function.
The coarse resolution distribution maps for certain species, and the intrinsic limitations
from the index, functional grouping and diversity estimations being relatively new for mam-
mals, and animals in general [76], may give rise to some constraints of our approach. However,
most of the future discussion relies on which life and ecological traits are more relevant or
informative for functional roles of species in ecosystems. In addition, our approach still high-
lights that even when few traits are used, human intervention is a severe threat to FD, and it is
likely that future analyses at finer resolutions will show the same trend, since it is expected that
lower redundancy will be observed among species [71, 77]. Because we analyzed current mam-
mal distribution ranges, positive influence of intervention can be related to already-degraded
assemblages or already-affected FD, suggesting that common species play more significant key
roles in ecosystems than rare species; this trend coincides in those ecoregions where non-
threatened species have the highest influence.
Conservation applicability of our results are both spatially-defined, by focusing on the pri-
ority ecoregions, and conservation action-defined, by focusing efforts on the highest threat to
functional stability. T&S Coniferous, Temperate Broadleaf Forests and Tropical Grasslands are
priority for improving species management and reducing the risk of those already considered
Mammal functional diversity in the Neotropics
PLOS ONE | https://doi.org/10.1371/journal.pone.0175931 April 25, 2017 11 / 17

under threat. T&S Moist and Dry Forests, Temperate Forests, Tropical Grasslands and Man-
groves ecoregions are those identified as priority for urgently reducing or mitigating habitat
loss derived from land-use change. Previous efforts have already prioritized areas based on the
number of species at risk or simply using measures of species richness [7, 34, 78, 79] while oth-
ers have identified those areas with the highest rates of habitat loss [80, 81], however, our
exploration of the link between human intervention and species at risk with ecosystem stability
and function provides more precise tools for supporting where and how to focus conservation
actions [14].
Conclusions
This is among the first studies assessing the influence of human impacts over mammal FD,
especially for one of the most diverse areas globally. Further explorations into mammal FD at
finer and more detailed resolutions and more precise definitions of human intervention would
likely provide confirmation of our results and will increase the precision of the trends found in
our results [3, 4]. Our definition of FD, as linked to the concept of functional richness, is the
functional trait space occupied by species within a community [75], influencing productivity
and in turn functionality and resilience at ecosystem and community scale. Therefore, despite
our coarse assessment of FD, influence of driving variables will definitely have significant con-
servation implications. Definition of conservation priorities at regional scales have proved an
efficient tool to effectively tackle biodiversity loss, and region-wide assessments and actions
may result in threat reduction and better conservation planning [27, 82, 83]. Our results help
refine conservation planning analyses by providing new insights and tools on different biodi-
versity measures, especially by linking both species risk and human intervention with ecosys-
tem vulnerability and resilience [6]. Previous priority-selection schemes have identified
priority areas based on species richness, threat or singularities [9]; our approach does not
undermine these initiatives by proposing new priorities, instead call for attention to those
regions suffering functionality loss due to intervention and species loss. This will likely
improve conservation actions not only for selecting conservation areas but as a tool for conser-
vation planning and decision making by selecting adequate cost-benefit policies [84]. Also,
this study can help enhance our understanding on how natural and induced spatial variability
can be incorporated in conservation planning to improve our conservation practices aiming to
reduce biodiversity loss, which is the current paramount environmental problem worldwide.
Supporting information
S1 Table. Neotropical ecoregions classified by biome (i.e. major habitat type), including
ecoregion size (area), species richness (SR) and functional diversity index values (FD), and
classified according to priority based on the influence of threatened species over mammal
functional diversity.
(DOCX)
Acknowledgments
This paper is a partial fulfillment of the Graduate Doctoral Degree Program in Biomedical Sci-
ences (Programa de Doctorado en Ciencias Biomedicas) of the National Autonomous Univer-
sity of Mexico (UNAM) of the first author. JFG-M acknowledges the scholarship and financial
support provided by the National Council of Science and Technology (CONACyT; scholarship
255983), and UNAM. Thanks to J. Belant for continued support throughout the research and
to the Jesus E. Maldonado and reviewers for insightful comments that significantly improved
Mammal functional diversity in the Neotropics
PLOS ONE | https://doi.org/10.1371/journal.pone.0175931 April 25, 2017 12 / 17

the manuscript. All data analyzed in this paper are available in the Supporting Information
file.
Author Contributions
Conceptualization: JFGM GC.
Data curation: JFGM GC.
Formal analysis: JFGM.
Funding acquisition: JFGM GC.
Investigation: JFGM.
Methodology: JFGM GC RM EMM.
Project administration: JFGM GC.
Resources: JFGM GC.
Software: JFGM GC.
Supervision: JFGM GC RM EMM.
Validation: JFGM GC RM EMM.
Visualization: JFGM GC RM EMM.
Writing – original draft: JFGM GC.
Writing – review & editing: JFGM GC RM EMM.
References1. Calba S, Maris V, Devictor V. Measuring and explaining large-scale distribution of functional and phylo-
genetic diversity in birds: separating ecological drivers from methodological choices. Global Ecology
and Biogeography. 2014; 23(6):669–78.
2. Monnet A-C, Jiguet F, Meynard CN, Mouillot D, Mouquet N, Thuiller W, et al. Asynchrony of taxonomic,
functional and phylogenetic diversity in birds. Global Ecology and Biogeography. 2014:780–8. https://
doi.org/10.1111/geb.12179 PMID: 25067904
3. Gonzalez-Maya JF, Vıquez-R LR, Arias-Alzate A, Belant JL, Ceballos G. Spatial patterns of species
richness and functional diversity in Costa Rican terrestrial mammals: implications for conservation.
Diversity and Distributions. 2016; 22(1):43–56.
4. Gonzalez-Maya JF, Arias-Alzate A, Granados-Peña R, Mancera-Rodrıguez NJ, Ceballos G. Environ-
mental determinants and spatial mismatch of mammal diversity measures in Colombia. Animal Biodi-
versity and Conservation. 2016; 39(1):77–87.
5. Spasojevic MJ, Copeland S, Suding KN. Using functional diversity patterns to explore metacommunity
dynamics: a framework for understanding local and regional influences on community structure. Eco-
graphy. 2014:no-no.
6. Dıaz S, Purvis A, Cornelissen JHC, Mace GM, Donoghue MJ, Ewers RM, et al. Functional traits, the
phylogeny of function, and ecosystem service vulnerability. Ecology and Evolution. 2013; 3(9):2958–
75. https://doi.org/10.1002/ece3.601 PMID: 24101986
7. Schipper J, Chanson JS, Chiozza F, Cox NA, Hoffmann M, Katariya V, et al. The status of the world’s
land and marine mammals: diversity, threat, and knowledge. Science. 2008; 322(5899):225–30. https://
doi.org/10.1126/science.1165115 PMID: 18845749
8. Brown JH, Svenning J-C. Why are there so many species in the tropics? Journal of Biogeography.
2014; 41(1):8–22. https://doi.org/10.1111/jbi.12228 PMID: 25684838
9. Le Saout S, Hoffmann M, Shi Y, Hughes A, Bernard C, Brooks T, et al. Protected Areas and Effective
Biodiversity Conservation. Science. 2013; 342(6160):803–5. https://doi.org/10.1126/science.1239268
PMID: 24233709
Mammal functional diversity in the Neotropics
PLOS ONE | https://doi.org/10.1371/journal.pone.0175931 April 25, 2017 13 / 17

10. Ceballos G, Ehrlich PR, Soberon J, Salazar I, Fay JP. Global mammal conservation: what must we
manage? Science. 2005; 309(5734):603–7. https://doi.org/10.1126/science.1114015 PMID: 16040704
11. Boitani L, Maiorano L, Baisero D, Falcucci A, Visconti P, Rondinini C. What spatial data do we need to
develop global mammal conservation strategies? Philosophical transactions of the Royal Society of
London Series B, Biological sciences. 2011; 366(1578):2623–32. PubMed Central PMCID:
PMC3140738. https://doi.org/10.1098/rstb.2011.0117 PMID: 21844041
12. Armsworth PR, Chan KMA, Daily GC, Ehrlich PR, Kremen C, Ricketts TH, et al. Ecosystem-service sci-
ence and the way forward for conservation. Conservation Biology. 2007; 21(6):1383–4. https://doi.org/
10.1111/j.1523-1739.2007.00821.x PMID: 18173455
13. Biswas SR, Mallik AU. Species diversity and functional diversity relationship varies with disturbance
intensity. Ecosphere. 2011; 2(4):art52-art.
14. Barragan F, Moreno CE, Escobar F, Halffter G, Navarrete D. Negative impacts of human land use on
dung beetle functional diversity. PloS one. 2011; 6(3):e17976–e. https://doi.org/10.1371/journal.pone.
0017976 PMID: 21448292
15. Biswas S, Mallik A. Disturbance effects on species diversity and functional diversity in riparian and
upland plant communities. Ecology. 2010; 91(1):28–35. PMID: 20380192
16. Buisson L, Grenouillet G, Villeger S, Canal J, Laffaille P. Toward a loss of functional diversity in stream
fish assemblages under climate change. Glob Chang Biol. 2013; 19(2):387–400. https://doi.org/10.
1111/gcb.12056 PMID: 23504778
17. Ceballos G, Ehrlich PR. Mammal population losses and the extinction crisis. Science. 2002; 296
(5569):904–7. https://doi.org/10.1126/science.1069349 PMID: 11988573
18. Davidson AD, Hamilton MJ, Boyer AG, Brown JH, Ceballos G. Multiple ecological pathways to extinc-
tion in mammals. Proceedings of the National Academy of Sciences of the United States of America.
2009; 106(26):10702–5. https://doi.org/10.1073/pnas.0901956106 PMID: 19528635
19. Cadotte MW, Carscadden K, Mirotchnick N. Beyond species: functional diversity and the maintenance
of ecological processes and services. Journal of Applied Ecology. 2011; 48(5):1079–87.
20. Dias ATC, Berg MP, de Bello F, Van Oosten AR, Bıla K, Moretti M, et al. An experimental framework to
identify community functional components driving ecosystem processes and services delivery. Journal
of Ecology. 2013; 101(1):29–37.
21. Lees A, de Moura N, Santana A, Aleixo A, Barlow J, Berenguer E, et al. Paragominas: a quantitative
baseline inventory of an eastern Amazonian avifauna. Revista Brasileira de Ornitologia. 2012; 20
(2):93–118.
22. Hoffmann M, Belant JL, Chanson JS, Cox NA, Lamoreux J, Rodrigues AS, et al. The changing fates of
the world’s mammals. Philos Trans R Soc Lond B Biol Sci. 2011; 366(1578):2598–610. PubMed Central
PMCID: PMC3140737. https://doi.org/10.1098/rstb.2011.0116 PMID: 21844039
23. Hoffmann M, Hilton-Taylor C, Angulo A, Bohm M, Brooks TM, Butchart SHM, et al. The impact of con-
servation on the status of the world’s vertebrates. Science (New York, NY). 2010; 330(6010):1503–9.
24. Rondinini C, Di Marco M, Chiozza F, Santulli G, Baisero D, Visconti P, et al. Global habitat suitability
models of terrestrial mammals. Philosophical transactions of the Royal Society of London Series B, Bio-
logical sciences. 2011; 366(1578):2633–41. https://doi.org/10.1098/rstb.2011.0113 PMID: 21844042
25. Sanchez-Cuervo AM, Aide TM, Clark ML, Etter A. Land cover change in Colombia: surprising forest
recovery trends between 2001 and 2010. PloS one. 2012; 7(8):e43943–e. https://doi.org/10.1371/
journal.pone.0043943 PMID: 22952816
26. Etter A, van Wyngaarden W. Patterns of Landscape Transformation in Colombia, with Emphasis in the
Andean Region. Ambio. 2000; 29(7):432–9.
27. Farias AA, Svensson GL. Ecoregional Vulnerability Assessment for the Functional Richness of South
American Carnivorans (Mammalia: Carnivora). Journal of Mammalian Evolution. 2014.
28. Ceballos G. Conservation priorities for mammals in megadiverse Mexico: the efficiency of reserve net-
works. Ecological Applications. 2007; 17(2):569–78. PMID: 17489260
29. Gonzalez-Maya JF, Vıquez-R LR, Belant JL, Ceballos G. Effectiveness of Protected Areas for Repre-
senting Species and Populations of Terrestrial Mammals in Costa Rica. Plos One. 2015; 10(5):
e0124480. https://doi.org/10.1371/journal.pone.0124480 PMID: 25970293
30. Olson DM, Dinerstein E, Wikramanayake ED, Burgess ND, Powell GVN, Underwood EC, et al. Terres-
trial ecoregions of the world: a new map of life on earth. BioScience. 2001; 51(11):933–.
31. Belmaker J, Jetz W. Spatial scaling of functional structure in bird and mammal assemblages. The Amer-
ican naturalist. 2013; 181(4):464–78. https://doi.org/10.1086/669906 PMID: 23535612
32. Gonzalez-Maya JF. Conservacion, diversidad funcional y riesgo de extincion en mamıferos Neotropi-
cales a multiples escalas. Mexico D. F., Mexico: Universidad Nacional Autonoma de Mexico; 2015.
Mammal functional diversity in the Neotropics
PLOS ONE | https://doi.org/10.1371/journal.pone.0175931 April 25, 2017 14 / 17

33. Bonnot TW, Thompson FR, Millspaugh JJ. Extension of landscape-based population viability models to
ecoregional scales for conservation planning. Biological Conservation. 2011; 144(7):2041–53.
34. Albuquerque F, Beier P, Ladle R. Global patterns and environmental correlates of high-priority conser-
vation areas for vertebrates. Journal of Biogeography. 2015:n/a-n/a.
35. Gonzalez-Maya JF, Vıquez-R LR, Pineda-Guerrero A, Vela-Vargas M, Cruz-Lizano I, Hoepker A, et al.
Connecting two continents: species richness, functional traits and extinction risk in the Panamanian
isthmus-Choco continuum. Revista de Biodiversidad Neotropical. 2012; 2(1):5–14.
36. Jones KE, Bielby J, Cardillo M, Fritz SA, O’Dell J, Orme CDL, et al. PanTHERIA: a species-level data-
base of life history, ecology, and geography of extant and recently extinct mammals. Ecology. 2009; 90
(9):2648–.
37. Safi K, Cianciaruso MV, Loyola RD, Brito D, Armour-Marshall K, Diniz-Filho JAF. Understanding global
patterns of mammalian functional and phylogenetic diversity. Philosophical Transactions of the Royal
Society of London Series B, Biological sciences. 2011; 366(1577):2536–44. https://doi.org/10.1098/
rstb.2011.0024 PMID: 21807734
38. Flynn DFB, Gogol-Prokurat M, Nogeire T, Molinari N, Richers BT, Lin BB, et al. Loss of functional diver-
sity under land use intensification across multiple taxa. Ecology Letters. 2009; 12(1):22–33. https://doi.
org/10.1111/j.1461-0248.2008.01255.x PMID: 19087109
39. Smith Fa, Brown JH, Haskell JP, Lyons SK, Alroy J, Charnov EL, et al. Similarity of mammalian body
size across the taxonomic hierarchy and across space and time. The American naturalist. 2004; 163
(5):672–91. https://doi.org/10.1086/382898 PMID: 15122486
40. Smith FA, Lyons SK. How big should a mammal be? A macroecological look at mammalian body size
over space and time. Philos Trans R Soc Lond B Biol Sci. 2011; 366(1576):2364–78. PubMed Central
PMCID: PMC3130437. https://doi.org/10.1098/rstb.2011.0067 PMID: 21768152
41. Petchey O. Integrating methods that investigate how complementarity influences ecosystem function-
ing. Oikos. 2003; 101(2):323–30.
42. Casanoves F, Pla L, Di Rienzo J. Valoracion y analisis de la diversidad funcional y su relacion con los
servicios ecosistemicos. Turrialba, Costa Rica: Centro Agronomico Tropical de Investigacion y
Enseñanza; 2011. 84- p.
43. Gower JC. A general coefficient of similarity and some of its properties. Biometrics. 1971; 27(4):857–
71.
44. Mason NWH, De Bello F, Mouillot D, Pavoine S, Dray S. A guide for using functional diversity indices to
reveal changes in assembly processes along ecological gradients. Journal of Vegetation Science.
2012; 24:794–806.
45. Petchey OL, Gaston KJ. Functional diversity (FD), species richness and community composition. Ecol-
ogy Letters. 2002; 5(3):402–11.
46. Conover WJ. Practical Nonparametric Statistics Third Edition ed. New York, US: John Wiley & Sons.;
1999.
47. Kaufman L, Rousseeuw PJ. Finding groups in data: an introduction to cluster analysis. New York, USA:
Wiley; 2005. 335 p.
48. Zar JH. Biostatistical analysis. New Jersey, US: Prentice Hall; 1974. 946 p.
49. Hutcheson GD. Ordinary Least-Squares Regression. In: Moutinho L, Hutcheson GD, editors. The
SAGE Dictionary of Quantitative Management Research. California, USA: SAGE Publications Ltd.;
2011. p. 224–8.
50. Petchey OL, Gaston KJ. Extinction and the loss of functional diversity. Proceedings Biological Sciences
/ The Royal Society. 2002; 269(1501):1721–7.
51. Franzen M, Schweiger O, Betzholtz P-e. Species-area relationships are controlled by species traits.
PloS one. 2012; 7(5):e37359–e. https://doi.org/10.1371/journal.pone.0037359 PMID: 22629384
52. ESA, UCLovain. GlobCover 2009. Paris, France: European Space Agency & Universite catholique de
Louvain; 2009.
53. IUCN. IUCN Red List of Threatened Species Gland, Switzerland: International Union for Conservation
of Nature; 2012 [cited 2014 February 2]. Available from: www.iucnredlist.org.
54. Rondinini C, Rodrigues ASL, Boitani L. The key elements of a comprehensive global mammal conser-
vation strategy. Philosophical transactions of the Royal Society of London Series B, Biological sciences.
2011; 366(1578):2591–7. https://doi.org/10.1098/rstb.2011.0111 PMID: 21844038
55. Wagenmakers EJ, Farrell S. AIC model selection using Akaike weights. Psychonomic Bulletin &
Review. 2004; 11(1):192–6.
56. O’Brien RM. A caution regarding rules of thumb for variance inflation factors. Quality & Quantity. 2007;
41(5):673–90.
Mammal functional diversity in the Neotropics
PLOS ONE | https://doi.org/10.1371/journal.pone.0175931 April 25, 2017 15 / 17
57. Brunsdon C, Fotheringham S, Charlton M. Geographically weighted regression-modelling spatial non-
stationarity. Journal of the Royal Statistical Society Series D. 1998; 47:431–43.
58. McFadden D. Conditional logit analysis of qualitative choice behavior. In: Zarembka P, editor. Frontiers
in Econometrics. New York, USA: Academic Press; 1973. p. 105–42.
59. Brunsdon C, Fotheringham AS, Charlton ME. Geographically weighted regression: a method for explor-
ing spatial nonstationarity. Geographical Analysis. 2010; 28(4):281–98.
60. Fotheringham AS, Brunsdon C, Charlton M. Geographically Weighted Regression: the analysis of spa-
tially varying relationships. West Sussex, United Kingdom: John Wiley & Sons; 2002.
61. Environmental Systems Research Institute. ArcGIS 10.2.1. Redlands, California, USA.: Environmental
Systems Research Institute; 2013.
62. R Team Development Core. R: A language and environment for statistical computing. Vienna, Austria:
R Foundation for Statistical Computing; 2008.
63. Messier J, McGill BJ, Lechowicz MJ. How do traits vary across ecological scales? A case for trait-based
ecology. Ecology letters. 2010; 13(7):838–48. https://doi.org/10.1111/j.1461-0248.2010.01476.x PMID:
20482582
64. Swenson NG, Enquist BJ, Pither J, Kerkhoff AJ, Boyle B, Weiser MD, et al. The biogeography and filter-
ing of woody plant functional diversity in North and South America. Global Ecology and Biogeography.
2012; 21(8):798–808.
65. Peterson G, Allen CR, Holling CS. Ecological resilience, biodiversity, and scale. Ecosystems. 1998;
1:6–18.
66. Sundstrom SM, Allen CR, Barichievy C. Species, functional groups, and thresholds in ecological resil-
ience. Conservation Biology. 2012; 26(2):305–14. https://doi.org/10.1111/j.1523-1739.2011.01822.x
PMID: 22443132
67. Stein A, Gerstner K, Kreft H. Environmental heterogeneity as a universal driver of species richness
across taxa, biomes and spatial scales. Ecol Lett. 2014.
68. Cardoso P, Pekar S, Jocque R, Coddington Ja. Global patterns of guild composition and functional
diversity of spiders. PloS one. 2011; 6(6):e21710. https://doi.org/10.1371/journal.pone.0021710 PMID:
21738772
69. Freudenberger L, Hobson PR, Schluck M, Ibisch PL. A global map of the functionality of terrestrial eco-
systems. Ecological Complexity. 2012; 12:13–22.
70. Newbold T, Scharlemann JPW, Butchart SHM, Şekercioğlu CH, Joppa L, Alkemade R, et al. Functional
traits, land-use change and the structure of present and future bird communities in tropical forests.
Global Ecology and Biogeography. 2014; 23(10):1073–84.
71. Fonseca CR, Ganade G. Species functional redundancy, random extinctions and the stability of ecosys-
tems. Journal of Ecology. 2001; 89(1):118–25.
72. Mouillot D, Bellwood DR, Baraloto C, Chave J, Galzin R, Harmelin-Vivien M, et al. Rare species support
vulnerable functions in high-diversity ecosystems. PLoS Biol. 2013; 11(5):e1001569 PubMed Central
PMCID: PMC3665844. https://doi.org/10.1371/journal.pbio.1001569 PMID: 23723735
73. Schmera D, Podani J, Erős T. Measuring the contribution of community members to functional diversity.
Oikos. 2009; 118(7):961–71.
74. Dıaz S, Cabido M. Vive la difference: plant functional diversity matters to ecosystem processes. Trends
in Ecology & Evolution. 2001; 16(11):646–55.
75. Mason NWH, Mouillot D, Lee WG, Wilson JB. Functional richness, functional evenness and functional
divergence: the primary components of functional diversity. Oikos. 2005; 111(1):112–8.
76. Blaum N, Mosner E, Schwager M, Jeltsch F. How functional is functional? Ecological groupings in ter-
restrial animal ecology: towards an animal functional type approach. Biodiversity and Conservation.
2011; 20(11):2333–45.
77. Mouchet MA, Villeger S, Mason NWH, Mouillot D. Functional diversity measures: an overview of their
redundancy and their ability to discriminate community assembly rules. Functional Ecology. 2010; 24
(4):867–76.
78. Ceballos G, Rodrıguez P, Medellın RA. Assesing conservation priorities in megadiverse Mexico: mam-
malian diversity, endemicity and endangerment. Ecological Applications. 1998; 8(1):8–17.
79. Grenyer R, Orme CD, Jackson SF, Thomas GH, Davies RG, Davies TJ, et al. Global distribution and
conservation of rare and threatened vertebrates. Nature. 2006; 444(7115):93–6. https://doi.org/10.
1038/nature05237 PMID: 17080090
80. Cattarino L, McAlpine CA, Rhodes JR. Land-use drivers of forest fragmentation vary with spatial scale.
Global Ecology and Biogeography. 2014:n/a-n/a.
Mammal functional diversity in the Neotropics
PLOS ONE | https://doi.org/10.1371/journal.pone.0175931 April 25, 2017 16 / 17

81. Menon S, Pontius RG, Rose J, Khan ML, Bawa KS. Identifying Conservation-Priority Areas in the Trop-
ics: a Land-Use Change Modeling Approach. Conservation Biology. 2001; 15(2):501–12.
82. Fitzpatrick U, Murray TE, Paxton RJ, Brown MJF. Building on IUCN regional red lists to produce lists of
species of conservation priority: a model with Irish bees. Conservation biology: the journal of the Society
for Conservation Biology. 2007; 21(5):1324–32.
83. Gauthier P, Debussche M, Thompson JD. Regional priority setting for rare species based on a method
combining three criteria. Biological Conservation. 2010; 143(6):1501–9.
84. Visconti P, Pressey RL, Giorgini D, Maiorano L, Bakkenes M, Boitani L, et al. Future hotspots of terres-
trial mammal loss. Philos Trans R Soc Lond B Biol Sci. 2011; 366(1578):2693–702. PubMed Central
PMCID: PMC3140729. https://doi.org/10.1098/rstb.2011.0105 PMID: 21844048
Mammal functional diversity in the Neotropics
PLOS ONE | https://doi.org/10.1371/journal.pone.0175931 April 25, 2017 17 / 17