Embed Size (px)
Citation preview

i
DISTRIBUTION OF HAEMOGLOBIN PHENOTYPES AND THE
RELATIONSHIP WITH CLINICAL CHARACTERISTICS AND
NUTRITIONAL STATUS IN THE NEWBORN AND OLDER CHILDREN
LESS THAN 60 MONTHS IN ETHIOPE WEST LOCAL
GOVERNMENT AREA OF DELTA STATE.
“THIS DISSERTATION IS SUBMITTED IN PART FULFILLMENT
OF THE REQUIREMENT FOR THE AWARD OF THE
FELLOWSHIP OF THE NATIONAL POSTGRADUATE MEDICAL
COLLEGE OF NIGERIA IN THE FACULTY OF PAEDIATRICS”.
GLORIA .A. NWAJEI
(M.B;B.S ;2002)
NOVEMBER, 2015

ii
DECLARATION
“It is hereby declared that this work is original unless otherwise acknowledged. This work has
not been presented to any other College for a Fellowship, nor has it been submitted elsewhere
for publication”.
…………………………………………..
GLORIA ATIM NWAJEI

iii
ATTESTATION
The study reported in this dissertation was done by the candidate under our supervision.
We also supervised the writing of this dissertation.
NAME OF FIRST SUPERVISOR Professor Angela. A. Okolo
SIGNATURE :
STATUS OF SUPERVISOR Consultant Paediatrician/Professor of Paediatrics
DATE
NAME OF SECOND SUPERVISOR Dr. Moses. Diakparomre
SIGNATURE
STATUS OF SUPERVISOR Consultant Paediatrician
DATE
NAME OF THIRD SUPERVISOR Professor. Mohamed Cherif Rahimy
SIGNATURE
STATUS OF SUPERVISOR Consultant Paediatrician/Professor of Paediatrics.
Coordinator of Newborn Screening for Sickle Cell
Disease, National University of Cotonou, Republic
of Benin.
DATE :
iv
TABLE OF CONTENTS
Title Page i
Declaration ii
Attestation iii
Table of Contents iv
Dedication v
Acknowledgement vi
List of Abbreviations used in this study vii
Definition of Terms viii
Summary x
Introduction 1
Literature Review 4
Aims and Objectives 29
Subjects and Methods 30
Results 41
Discussion 60
Conclusions 73
Recommendations 74
Limitations 75
Lines of Future Research 76
References 77
Appendixes 90

v
DEDICATION
This book is dedicated to children with sickle cell disease all over the world.

vi
ACKNOWLEDGEMENTS
My deep and sincere gratitude goes to my supervisors, Professor. Angela. A. Okolo, Dr. Moses
Diakparomre and Professor. Mohamed .C. Rahimy whose scholarly influence, discipline and
depth of knowledge contributed immensely to ensuring the successful execution of this project.
I acknowledge with thanks, all the children who participated in the study, as well as their
caregivers.
My sincere gratitude also goes to Marielle Guonongbe, Gloire Gbedji and Gladys Cadete, the
laboratory technologists in charge of the sickle cell research laboratory in Cotonou, the Republic
of Benin, for all the assistance they rendered in ensuring that the work was done.
I thank my husband, Dr. Charles Nwajei for being my pillar of support, providing the moral and
financial support throughout the residency training period and my little angels, Anita and
Alexandra Nwajei, for encouraging and supporting me in their own little way and for bearing
with me during the difficult times.
I thank all those who contributed in one way or another in ensuring that this work was done.
May God reward all your endeavours.
Finally and most of all, I thank God for everything.

vii
LIST OF ABBREVIATIONS
Hb Haemoglobin
SCD Sickle cell disease
SS Homozygous sickle cell disease
SC Heterozygous sickle cell haemoglobin C disease
Sβ° Heterozygous sickle cell - beta° thalassaemia
AC Haemoglobin C trait
AS Haemoglobin S trait
AD Haemoglobin D trait
AA Normal haemoglobin phenotype
LGA Local Government Area
CHEW Community Health Extension Worker
PHC Primary Health Center
DELSUTH Delta State University Teaching Hospital, Oghara
WHO World Health Organization
CAC Cellulose acetate electrophoresis
CAG Citrate agar electrophoresis
EDTA Ethylenediamine tetraacetic acid
MUAC Mid upper arm circumference

viii
DEFINITION OF TERMS
Genotype The genetic makeup of the haemoglobin type.
Phenotype Haematological (laboratory) diagnosis inferred by identification of
the haemoglobin produced by the normal or altered genes.
SCD Connotes all the phenotypes of sickle cell disease.
Homozygous Having identical alleles for a single trait.
Heterozygous Having two different alleles for a single trait.
Sickle cell anaemia Homozygous sickle cell disease.
Carrier Frequency The proportion of individuals in a population who inherited a
single copy of a specific recessive gene mutation.
Haplotype A set of DNA variations or polymorphisms that tend to be
inherited together.
Cohort A group of subjects who have shared a particular event
together during a particular time span.
Thalassaemia A group of inherited disorders of haemoglobin metabolism in
which there is impaired synthesis of one or more of the
polypeptide chains of globin.
Balanced Polymorphism A situation in which two different versions of a gene are
maintained in a population of organisms because individuals
carrying both versions are better able to survivethan those who
have two copies of either version alone.
Holoendemicity A state of high prevalence of a condition,where transmission,
and intensity throughout the year are high,without significant
seasonal or periodic variation.
Newborn A baby in the first 28 days of life.

ix
Infancy The period from birth to one year of age.
Older Child Any child one month to less than 60 months of age.
Electro-osmotic Flow When a voltage is applied across a tube filled with an electrolyte
solution (a solution that conducts electricity), the solution begins
tomove toward the cathode.

x
SUMMARY
In an effort to describe the haemoglobin phenotype distribution in the respective age cohorts of
newborn and older children less than sixty months of age, subjects were recruited into this study
starting from the 1st of April, 2013 to the 30th of September, 2013. Two hundred and eighty eight
newborn and 1,263 older children were recruited from randomly selected homes in three health
wards of the communities of Ethiope West. These were studied for their haemoglobin
phenotype distribution by respective age cohorts. Iso-electrofocusing and capillary
electrophoresis techniques were used forsample analysis for the newborn, while capillary
electrophoresis was used for the older age cohorts. Physical examination was carried out and
anthropometric measurements taken for each subject.
One hundred and eleven blood samples were lost to testing. Of these,42 belonged to the
newborn, while 69 to older children.
One thousand, four hundred and forty results were available following sample analyses. Two
hundred and forty six were for the newborn, while 1,194were for older children less than sixty
months.
Five haemoglobin phenotypes consisting of HbAA (73.6%), HbAC (0.4%), HbAD (0.1%),
HbAS (23.7%) and HbSS (2.2%) were identified.
Haemoglobin phenotype distribution in the respective age cohorts was varied, however, beyond
24 months of age, the prevalence of HbAA, HbAS and HbAC remained relatively constant.
The observed prevalence of HbSS ranged from 1.9% to 3.2% among the cohorts aged 1 month
to less than 60 months. In the newborn,the prevalence of HbSS was 1.2%, while the specific
distributions for the other haemoglobin phenotypes were HbAA (78.5%), HbAC (0.8%) and
HbAS (19.5%).
The presence of abnormal clinical signs was significantly higher among HbSS subjects than in
children of other haemoglobin phenotypes. (p< 0.001)

xi
Normal nutritional status was documented in 86.9% of the children aged one month to less than
60months. Of the subjects with HbSS aged one month to less than 60months, 20.7% were
underweight, while 13.8% were stunted..There was no significant difference in the nutritional
status among the various haemoglobin phenotypes. (p = 0.691)
These findings support the case for early diagnosis of sickle cell disease,comprehensive care
management and follow up of these cases as well as integration of growth monitoring in the
comprehensive care package so as to enhance nutritional support for the affected children.

1
INTRODUCTION
About 800 structural variants of haemoglobin have been described, the vast majority of which
are not associated with clinical manifestations.1The inherited disorders of haemoglobin are the
commonest single gene disorders known to man. The World Health Organisation estimates that
about 7% of the world population are carriers.1
If untreated, many of the clinically significant inherited haemoglobin disorders result in death
during the first few years of life. Their effect on the burden of disease has only recently become
more apparent following an epidemiologic transition owing to improvements in hygiene,
nutrition and control of infections that have seen a reduction in childhood mortality in countries
such as India and much of Asia.2 A similar transition is expected in sub-Sahara Africa and
hence, the need to understand the full extent of the problem and to develop programs to control
and manage these diseases.
The adult haemoglobin molecule is made up of two pairs of polypeptide (globin) chains, α and
β, with each chain having an iron-containing porphyrin ring (heme group)
attached.3Abnormalities in the globin chains give rise to haemoglobinopathies. Such abnormal
haemoglobins are produced by the activity of abnormal genes which may arise by spontaneous
mutation or may be inherited.3One of such mutations that occurred in the beta polypeptide chain
is the sickle gene, giving rise to haemoglobin S.
Sickle cell haemoglobin is the commonest single gene defect of the black race. Each year, there
are about 275,000 births of babies with a sickle cell disorder, and of these, 150,000 are born in
Nigeria alone.2 Thus, 55% of sickle cell disease (SCD) patients born each year are Nigerians.
Nigeria therefore has the biggest burden of SCD worldwide. Most of these children are
homozygous SS.2

2
It is noted, however, that the Asian haplotype of SCD is shared by people throughout central
India.4 SCD of the Asian haplotype is associated with high levels of fetal haemoglobin and
frequent deletional alpha thalassaemia, both factors likely to ameliorate the disease and change
the clinical features. Malaria is another factor that influences expression of the disease in this
region.4In predicting the prevalence of SCD in India,where the population currently stands at
1.22billion, many assumptions have been made.4 With a 20% trait frequency, 1% of births
would have homozygous SCD or 10,000 cases per million population. This would equate to
500,000 cases among a population of 50 million or 1million cases for an at risk population of
100 million. These figures suggest that the disease in India is at least, as prevalent as in
Equatorial Africa.4 However, most reports attest to the fact that three-quarters of sickle cell
cases occur in Africa where the carrier frequency ranges between 10% and 40%.5 Studies in
Nigeria show that 1- 3% of the population are homozygous SS and 25% are AS.6 This high
carrier frequency ensures propagation of the S gene among the Nigerian population.
Early studies suggested that mortality rate from SCD was highest in the first five years of life
with 50% of deaths occurring in the second half of the first year of life.7-12For most of them, the
diagnosis had not been made at the time of death. Approximately 80% of young children with
SCD in Africa die from this disorder by five years of age.13
The public health implications of sickle cell anaemia are thus,significant. Its impact on human
health may be assessed against the yardsticks of infant and under-five mortality. As not all
deaths occur in the first year of life, the most valid measure is underfive deaths. Sickle cell
anaemia contributes the equivalent of 5% of under-five deaths on the African continent, more
than 9% of such deaths in West Africa and up to 16% of under-five deaths in individual West
African countries.14

3
JUSTIFICATION FOR THE STUDY
In Nigeria, over 66% of babies are born outside the formal health care system.15 Majority of the
studies that have been done on haemoglobin phenotypes in children are hospital-based.
Community-based studies would give a more precise picture of the problem than hospital-based
studies, hence the need for a community based study.16
The age cohort, zero to less than sixty months, is the most vulnerable to SCD and it is a well
known fact that about 50% of affected children die in their first year of life7-12 without ever
being diagnosed. Infant mortality on its own, contributes significantly to under-five mortality,
while neonatal mortality contributes 40% of overall under-five mortality.17 With an annual
infant death rate of 100,000, SCD contributes 8% of infant mortality in Nigeria.18 Therefore, to
aim at reducing infant and under-five mortality, it would be beneficial to identify early the
affected child so as to apply, early in life, the principles of comprehensive care and parental
education.
Ideally, early identification of abnormal haemoglobins will aid in early and prompt institution of
measures to control severe manifestations of the condition through comprehensive target
healthcare. All parents, caregivers, as well as the children, would be made to become aware of
the child’s phenotype and the nature of the disorder. Such information would be very useful for
the planning of health care preventive services and life choices by the affected children and their
families. This will also enable the affected persons make informed decisions when they reach
adulthood.
Data generated from such a study could aid governmental and non-governmental institutions in
planning effective management strategies for SCD and other haemoglobinopathies, through the
provision of comprehensive healthcare such as parental education and counseling, provision of
health facilities, regular medical follow up and adequate immunizations. In communities where
this is practiced, the mortality rate has dropped from between 15% and 30% to less than 1%.19-21
4
LITERATURE REVIEW
Over one hundred abnormal haemoglobin variants have been described, however, only a few are
common and clinically significant.22 The common abnormal haemoglobin variants are HbS,
HbCand HbE, while less common ones include HbD, HbG, HbJ, HbM, Hb Constant Spring,
HbH and Hb Barts. Some are clinically silent causing no signs or symptoms, whereas others
such as HbS, HbC and HbE, affect the function and/or stability of the haemoglobin
molecule.22In different regions of the world, their spectrum and distribution vary. Therefore,
knowledge of the pattern and distribution of haemoglobin phenotypes is important, both for
public health purposes and for genetic counseling.
Globally, haemoglobin S is the most common abnormal structural haemoglobin variant.The
haemoglobin S gene is distributed throughout sub-Sahara Africa, the Indian Subcontinent, the
Middle East, and the Mediterranean region.2 The carrier frequency ranges between 10% and
40% across Equatorial Africa, decreasing to 1-2% on the North African coast and less than 1%
in South Africa.2 In Saudi Arabia, about 4.2% of the population carry the sickle cell trait,2the
highest frequency being found in the Eastern province where approximately 17% of the
population carry the gene. In India, the carrier frequency varies from 0 to 40% in different
population groups.23Several distinct β-globin gene haplotypes are associated with the sickle
mutation, and their distribution provides evidence for the origin of the mutation in several
locations within Africa (the Senegal, Benin and Bantu haplotypes) and Asia (the Arab-Indian
haplotype).2
Various HbAS trait frequencies have been reported; 1 in 100 among Cypriots, Pakistanis and
Indians; 1 in 10 among African-Carribeans; 1in 4 among West Africans.6
Hb E is found in the eastern half of the Indian Subcontinent and throughout Southeast Asia.2
Thalassaemia is frequent in a broad band stretching from the Mediterannean basin and parts of

5
Africa to the Pacific islands. The α+ thalassaemias occur right across the tropical zone reaching
extremely high frequencies in some populations, whereas the α° thalassaemias are restricted to
parts of Southeast Asia and the Mediterannean basin.2 Three to eight percent of Americans of
Italian or Greek ancestry and 0.5% of African Americans carry a gene for beta
thalassaemia.3The regions that are most affected by beta-thalassaemia in Africa include Western
and Northern Africa respectively with 63.88% and 22.17% of the total annual affected
conceptions. The major forms of alpha-thalassaemia are almost absent in Africa.2Weatherall et
al found a prevalence of 0.2% in Lagos, Nigeria; 1.3% in Southern Ghana; and 1.7% in Northern
Ghana.2
There are 270 million carriers and 300,000 to 500,000 annual births of infants with sickle cell
anaemia or serious forms of thalassaemia worldwide.2Among them, 60,000 are born annually
with beta-thalassaemia major, the remaining (83%) with SCD. Southeast Asia, where the
thalassaemias and Hb E predominate, appears to be the most severely affected. Sub-Sahara
Africa has the second highest burden reflecting the high incidence of HbS.
In Nigeria, as in most of sub-Sahara Africa, the phenomenon of balanced polymorphism (as
regards malaria), has made the prevalence of the HbS very high.6 Nigeria, with its high
population of 165 million, a geographical location in the tropical region and holoendemicity for
malaria, has a very high burden of S haemoglobinopathy. The relatively poor healthcare
structure results in a very high mortality among these children.6
Haemoglobin C trait (HbAC) has a frequency of 1 in 30 among African-Caribbeans and 1 in 6
among Ghanaians, while the D trait (HbAD) is 1 in 100 among Pakistanis and Indians, and 1 in
1,000 Caucasian British carriers.6 About 16 variants of HbD exist.The variant of HbD found
amongst Indians and Pakistanis is HbD Punjab. It differs in its clinical manifestation from other
less common variants of HbD such as HbD Korle Bu. In combination with HbS, HbD

6
Punjabresults in SCD with severe clinical manifestations, whereas others do not result in a
disease state and the affected individuals are clinically normal.3
The HbC is believed to have originated from Northern Ghana and Burkina Faso, then spread to
other parts of Africa by population migration.24 In Nigeria, the spread to the eastern part of the
country appeared to have been limited by the River Niger.25Cabannes24 in 1965, in support of
this observation noted that there were no cases of HbC in the eastern part of Nigeria in
comparison to the western part, where the HbC was quite prevalent. An explanation for this
finding was proffered by Nwokolo and Lehmann,25 who postulated that the ‘’C’’ gene originated
from Burkina Faso and Northern Ghana. They conjectured that migration of these peoples into
parts of Nigeria was inhibited by the difficulty to cross the River Niger;25 hence, the paucity of
the ‘’C’’ gene across the Niger. This prevalence decreases as one moves from the west towards
the east. In a population study of HbC in Akwa Ibom State in 1996, Usanga et al26found an
incidence of 0.4% for HbAC and 0.07% for HbSC.In Northern Nigeria, Fleming et al (1972)
noted some foci of the HbC gene.27 These studies from Nigeria were undertaken at different
locations and different times and none of them explored the respective age cohorts of under-
fives in a given population at the same time.
In the USA, the HbC and HbS genes have been shown to have spread there through the slave
trade24 and the reported frequency of C phenotypes is 1 in 50 for HbAC and 1 in 5,000 for
HbCC amongst African Americans.3
DISTRIBUTION OF HAEMOGLOBINPHENOTYPES IN THE NEWBORN
The ‘newborn’, reflects a population group that reflects the genetic distribution of the different
haemoglobin variants, considerably uninfluenced by the environment. Hence, they represent a
unique cohort to be studied. In Italy, Ballardini et al28 found that 1.2% of newborns were carriers
of abnormal haemoglobin variants. 0.8% had HbAS, 0.2% HbAC and 0.1% HbAE while 0.05%

7
were HbAD Punjab and HbAD Ouled Rabah, respectively. One other study in England by
Allison et al29 showed a prevalence of 0.05% for SCD (HbSS 0.04% and HbSC 0.01%). In that
study, 1.2% had HbAS, 0.2% were HbAC , 0.1% were HbAD and 0.2% were HbAE.
These European studies were carried out on populations thatcomprised people of diverse racial
and ethnic groups, hence the wide range of haemoglobin phenotypes described.
In Ghana, Ohene-Frempong et al30 screened a total of 202,244 newborn infants and found
HbAA in 76.3%, HbAC in 8.5%, HbAS in 13.3% and SCD in 1.9% (HbSS in 1.1% and HbSC in
0.8%).Tshilolo et al31 in the Democratic Republic of Congo, Central Africa screened 4116
neonates, and found HbAA in 77.3%, HbAS in 20.4% and HbSS in 2.3%.In the newborn
screening program in Angola, Southern Africa,of 36,453 infants screened, HbAA was seen in
77.3%, HbAS in 21.0%, HbSS in 1.5% and HbSC in 0.2%.32
These studies conducted in Africa utilized the same method for determination of haemoglobin
phenotype, thus documenting prevalence rates and pattern that are similar. However, the lower
prevalence of HbAS in Ghana, may be attributed to the higher prevalence of HbC there.24The
lower prevalence of SCD in Angola may on the other hand be due to the low carrier frequency
for HbS in the southern part of Africa.2
Few Nigerian studies have included the neonatal population. Odunvbun et al33 (2008) found a
prevalence of 75.3% for HbAA, 20.6% for HbAS, 2.8% for HbSS, 0.2% for HbSC and 1.1% for
HbAC in a hospital-based study on newborns in Benin city, Southern Nigeria.This study
involved 647 consecutively delivered newborns and being a hospital-based study, fails to reflect
the situation in the general population.Fleming et al27 (1979) found HbAA in 73.2%, HbAS in
24%, HbSS in 2.1% and HbAC in 0.7% in a community-based study in Kano State, Nigeria.
This study involved the 534 neonates born within the Garki community over the five year period
within which the study was conducted.

8
With regards to the spectrum of haemoglobin phenotypes identified and the prevalence rates of
the various haemoglobin phenotypes, Odunvbun et al33 and Fleming et al,27 documented a
similar pattern and similar rates for all the haemoglobin phenotypes identified. This may be
related to the fact that both studies utilised the same method, isoelectrofocusing electrophoresis
for haemoglobin phenotype determination. Also, the similar pattern described in both studies
may be due to the fact that they were both carried out in the same country with similar
geographic characteristics.
On the other hand, Abhulimhen-Iyoha et al34 in a community-based study involving the under-
fives in Ekosodin community, Benin city, Nigeria, found HbAA in 100% of the newborns
screened.34The absence of the ‘’S’’ gene in the neonatal population in that study is noteworthy.
However, only fourteen newborn babies were screened, hence the small sample size compared
with those of Odunvbun et al and Fleming et al, could have accounted for the observed
difference.
The prevalence of HbAA documented by other workers30-32 outside Nigeria was similar to that
in the Nigerian studies alluded to above.27,33,34. In Ghana,30the prevalence of HbAS was much
lower compared with the studies done in Nigeria27,33 and this may be attributable to the higher
prevalence of HbC in Ghana as proffered earlier.24 The prevalence of SCD was lower in the
Ghanaian30and Angolan32 studies than that found in Nigeria. These studies30-32 outside Nigeria
were all hospital-based and neonates delivered outside the formal healthcare system were not
included in the studies. Analysis of several Demographic and Health Surveys15reveals that two
thirds of women in sub-Sahara Africa give birth outside the formal healthcare system.

9
DISTRIBUTION OF HAEMOGLOBIN PHENOTYPES AMONG OLDER CHILDREN
UNDER 60 MONTHS OF AGE
Among older children under 60 months of age, Kaine and Udeozo35 in Enugu, Eastern Nigeria
found HbAA in 75.8%, HbAS in 22.6% and HbSS in l.6%, while Adewuyi and Akintunde36 in
Ilorin, North Central Nigeria, found HbAA in 69.3%, HbAS in 21.5%, HbSS in 3.1%, HbSC in
1.7%, HbAC in 4.1% and HbCC in 0.3%. Kaine and Udeozo35 studied under-five children
presenting at the Institute of Child Health, while Adewuyi and Akintunde36 studied children
aged between one month and fourteen years in both the rural and urban communities of Ilorin,
Nigeria.The much lower prevalence of HbAA (69.3%) in Adewuyi and Akintunde’s study36 was
perhaps due to the much higher prevalence of the ‘’C’’ gene in that locality. This study was
conducted in Ilorin, which shares its boundary to the south with Oyo state, where the prevalence
of HbC is known to be high. Also, the indigenes of Ilorin consist mainly of the Yorubas who are
known to have a high prevalence of the HbC gene.24
Ogunkunle et al37 in Ibadan, South Western Nigeria, found HbAA in 75.6%, HbAS in 16.7%,
HbSS in 1.8% and HbAC in 5.9% in a community-based study involving under-five children.
South Western Nigeria is known for its high prevalence of HbC because in the past, individuals
who had migrated from Ghana where the prevalence is high, settled there.25
Abhulimhen-Iyoha et al34 in Ekosodin, Benin city, Southern Nigeria, found HbAA in 72.0% and
HbAS in 28.0%.There was no case of SCD in that study. This was a community-based study.
However, the sample size was small, as only one hundred and sevensubjects were studied and
subject selection was neither systematic nor randomized.
In Ghana, West Africa, Amoako38 found HbAA in 75.9%, HbAS in 9.2%, HbAC in 14.9%,
HbSC in 0.3%, HbCC in 0.3% and HbSS in 0.9%. This was a hospital-based study involving

10
only children aged 6 to 59 months who presented with fever to the Kintampo North Municipal
Hospital. In addition, the sample size was small (341) and the study period short (3months).
The prevalence of HbAS in the Nigerian studies alluded to ranged from 16.7% to 28.0%, 34-
37while Amoako38 in Ghana, found a prevalence of 9.2% among under-fives. In the Northern
part of Ghana where Amoako’s study38 was conducted, the C trait is known to be more prevalent
(20-25%) and the S trait less prevalent (10%),24 hence the comparatively higher prevalence of
HbAC and the lower prevalence of HbAS in that region.
Among under-fives, the prevalence of SCD in the studies alluded to above,34-37 ranged from
0.0% to 4.8%. The higher prevalence of SCD documented in Ilorin by Adewuyi and Akintunde36
was characterized by HbSS 3.1% and HbSC 1.7% and could have beenattributable to the high
prevalence of HbC in that environment.36 In that study, the prevalence of HbC trait was 4.1%.36
Kaine and Udeozo35, Ogunkunle et al37 and Abhulimhen et al,34 documented prevalence rates for
HbSS of 1.6%, 1.8% and 0.0%, respectively.In the study by Kaine and Udeozo35, the ‘’C’’ gene
was not observed and SCD was due mainly to homozygous haemoglobin S.35 Also, unlike
Adewuyi and Akintunde’s study,36 this was a health facility-based study and hence, may not
have given the true prevalence of SCD in the under-five population. In the study by
Abhulimhen-Iyoha et al,34 it is possible that had the sampling procedure been systematic and
randomized, and the sample size larger, SCD may have been documented in that community. In
the study by Ogunkunle et al,37 in Ibadan, South Western Nigeria, the prevalence of SCD was
1.8%. Being that this was a community-based study, it has probably given a concise picture of
the prevalence of SCD in that community.
11
HISTORY OF SICKLE CELL DISEASE
Africanus Horton, in 1874, described the fever crises, the recurrent joint pains, and their
exacerbation during the rainy season and the constant abnormality of blood associated with this
condition.39 Several communities in West Africa have long recognized the disease and had given
it various names signifying a chronic recurrent condition.24,39 In Ghana, the Ga tribe call it
‘’Chwechweechwe’’, the Twi tribe, ‘’Ahotutuo’’, the Fante, ‘’Nwiiwii’’ and the Ewe,
‘’Nuidudui’’.24,39 Similarly, in Nigeria, various names were given to children who tended to die
in early infancy such as ‘’Abiku’’ in the Yoruba land and ‘’Ogbanje’’ in the Ibo.40The Urhobos
call it ‘’Eda’’.
However, the first generally accepted modern report of SCD was that of Dr. James Herrick in
North America. In a 1910 publication in the Archives of Internal Medicine, he described the
disease as a ‘’peculiar elongated and sickle shaped red blood corpuscle in a case of severe
anaemia’’ in a Jamaican student.41 Mason,42 in 1922, summarized all subsequent cases and
concluded that it was a new disease entity. He was the first to use the term ‘’sickle cell
anaemia’’.42 In 1925, Castana reported the first case of SCD in a European and four years later
(1929), Cooley and Lee described the disease in a Greek family.24 Edington and Lehmann at
Accra, first described HbC outside the United States of America in 1954,24 most HbC occurring
in West Africa, with the highest frequency in Northern Ghana at 20 to 21%.24,39
PREVALENCE OF SICKLE CELL DISEASE
The commonest abnormal haemoglobin phenotype affecting the black race is sickle cell disease.
Its prevalence varies within different geographic locations. In the United States of America, and
indeed worldwide, SCD is the most common genetic disease identified through the State’s
Mandatory Screening Program, occurring in 1/2,647 births.3 SCD in the U.S occurs among
African Americans at a rate of 1/396 births and among Hispanics at a rate of 1 in 36,000 births.
Among those of Middle Eastern descent, no cases were identified among 22,000 screened by Al
12
Hosani, but at a rate of 1/16,000 subjects screened among Asian Indians.3In Jamaica, an African-
Caribbean population, the incidence is 1 in 300 live births. 43,44
In West Africa, the incidence is estimated to be about 20 per 1,000 live births(2%).6 This is in
consonance with the reports of Odunvbun et al33 and Fleming et al27, who documented incidence
rates of 30 per 1,000 (3.0%) and 21 per 1,000 (2.1%), respectively, among newborns in the
Southern and Northern parts of Nigeria, respectively. Among under-fives, Kaine and Udeozo,35
in Enugu, Eastern Nigeria found a prevalence of 16 per 1,000(1.6%). In addition to studying the
newborn, Fleming et al27 also studied the haemoglobin phenotype pattern of the entire
population sample of Garki District in Kano State. Of note, is the fact that in that study, in the
age cohort of one to four years the prevalence of SCD was only 0.4% and 0.05% in the cohort
over the age of nine years. Results from target screening of newborn babies of mothers with
sickle cell trait in Cotonou, Republic of Benin, indicate a prevalence of 9.9%.45 It would appear
that there is an age related prevalence of SCD.
More recent studies, however,by Adewuyi and Akintunde36 in Ilorin, North Central Nigeria, and
Abhulimhen et al34 in Ekosodin, Southern Nigeria, indicated prevalence rates of SCD among
under-fives of 4.8% and 0.0%,respectively. Of note is the fact that in Adewuyi and Akintunde’s
study,36 the prevalence of SCD was also found to vary with age. In that study, the highest
prevalence of HbSS was at age four years (3.75%) and of HbSC at age five years (3.45%). From
the age of eight years to fourteen years, the prevalence of sickle cell anaemia remained low at
0.0% to 1.1%, while HbSC prevalence ranged from 0% to 2.5%.The fall in prevalence of HbSS
among children from age 8years in that study may suggest that mortality and/or morbidity is
significantly increased at this age. These findings may represent a new trend of improving
survival in the under-five age group, perhaps, a result of better medical care in early childhood
which has not been extended to middle childhood, occupied by the stressful years of primary
and junior secondary school.

13
Earlier studies showed that mortality from SCD was highest during infancy, especially in the
second six months of life.9,11-13 In the USA, Porter and Thurman46 in 1963, reported a mortality
of 16% in SCD patients in the first decade of life despite the better socioeconomic environment.
Lambotte-Legrand and Lambotte-Legrand,47 in a study in Republic of Zaire in 1955, followed
up 300 children diagnosed with SCD at an average age of one year five months. In that study,
120 (40%) had died by the age of two years. According to Sergeant,39 even as at 1975, Van Ros
still claimed that the majority of Zairian children with SCD died in infancy.39Vandepitte (1995)
estimated a 1% survival into adult life. 39 In Zambia, Barclay (1970) found that 80% of SCD
patients died, also in early infancy. 39 In about 30% of these patients, the parents were not even
aware of the presence of the disease.9
Such works as these contributed to highlight the most vulnerable age for mortality in these
children and buttressed the need for introduction of earlier diagnosis and further preventive care
measures.
Improvements in survival of children with SCD during the last thirty years in the industrialized
nations have been well established, as a result of improved access to medical care, socio-
economic development and better education. More recent studies indicate that though mortality
in SCD is reducing steadily, it is still high in Africa, with the most vulnerable period being
under-five years of age.6,50 Most affected children born in low-resource settings still die
undiagnosed.48 On the other hand, in the 40% of Africa that is now urbanized, improved access
to healthcare is leading to increased survival and rising demands for hospital services.48
In a hospital cohort study in Tanzania, Makani et al48 followed up 1,725 SCD patients from
2004 to 2009. A mortality rate of 1.9% was recorded.
In one study in Lagos, South Western Nigeria, Akinyanju et al49examined the outcome of a
comprehensive care program for SCD from 1988 to 1995. Over the study period, the number of

14
subjects rose from 290 in 1988 to 1,223 in 1995, while the mortality rate fell from 20.6% in
1988 to 0.6% in 1995. Also, the number of hospital admissions fell from 350 (119%) to 30 (4%)
and the number of blood transfusions fell from 260 (90%) to 25 (2%).49
Similarly, a study in the United States of America examined the trends in mortality rates from
SCD from 1979 to 2005.50The paediatric mortality rate dropped by 3% each year during the time
period studied.
Hence, unarguably, the provision of well-organized comprehensive care helps better knowledge
of the disease by the sufferers and significantly reduces illness and death and improves the
quality of lives of children living with SCD in the developing world as they receive better and
prompt attention.
PATHOPHYSIOLOGY OF SCD
Under low oxygen conditions, the absence of a polar amino acid at position six of the β globin
chain promotes the aggregation of haemoglobin, which distorts the red blood cells into a sickle
shape and decreases their elasticity. The loss of red blood cell elasticity is central to the
pathophysiology of SCD. Normal red blood cells are quite elastic, which allows the cells to pass
through capillaries. In SCD, low oxygen tension promotes red blood cell sickling and repeated
episodes of sickling damage the cell membrane and decrease the cell’s elasticity. These cells fail
to return to normal shape when normal oxygen tension is restored. As a consequence, these rigid
blood cells are unable to deform as they pass through narrow capillaries, leading to vessel
occlusion and ischaemia.
The actual anaemia of the illness is caused by haemolysis, the destruction of the red cells,
because of their misshape. Although the bone marrow attempts to compensate by creating new
red blood cells, it does not match the rate of destruction. Healthy red blood cells typically live 90
to 120 days, but sickle cells only survive for 10 to 20 days. The bone marrow thus, undergoes a

15
compensatory hyperplasia which in these patients causes depression of the nasal bridge,
midfacial overgrowth and malocclusion.
CLINICAL FEATURES IN CHILDREN WITH SCD
A body habitus characteristic of severely affected patients with SCD is well recognized.
Pallor, jaundice, skull bossing, flattened nasal bridge and gnathopathy were common
presentations in African children with SCD.51 This is because of marrow expansion in these
areas of the flat bone of affected children.The spleen is often palpable in early life due to
extramedullary haematopoiesis, congestion and sequestration. Subsequent episodes of recurrent
vaso-occlusion and infarction lead to gradual autosplenectomy, and in most patients, the spleen
is no longer palpable by the age of ten years.52
In a study by Ambeet al53 in Northern Nigeria, it was seen that hand and foot swelling was the
main symptom at diagnosis in the under-five age group (38.7%) and was more common in the
age group, 6 to 11 months, followed by jaundice (16.1%), then pallor (13.6%).
George et al54in Port Harcourt, South- South, Nigeria, studied 169 sickle cell anaemia patients
aged 6 months to 18 years over a one year period. The most common presenting symptoms were
pallor (90%) and jaundice (58%). 19% had splenomegaly and 13.6% had bossing of the skull
bones.
In another study in Kenya,East Africa involving 124 children with SCD aged 0 to 14 years, who
were followed up for 13.8months, Sadarangani et al55 found splenomegaly in 33% and
hepatomegaly in 20%, with both being common in all age groups. The peak prevalence for both
however, occurred in the 6 to 8 year age group.
Swankar et al56 in a hospital-based study in India, involving 131 children with SCD attending a
specialist outpatient clinic in a rural hospital, found that fever was the most common presenting

16
symptom (51.1%), while splenomegaly was the most common sign (87.9%) followed by
hepatomegaly (77.6%). Pallor was documented in 56.9% and jaundice in 51.7%.
All the studies cited above were hospital-based and hence, a depiction of only the SCD cases
utilizing health facilities; not inclusive of those yet to be diagnosed in the community or of those
with clinically mild disease, who have remained in the steady clinical state.
The clinical spectrum of SCD varies widely between patients. Factors contributing to this
variability include environmental and social circumstances, geographical variation, alpha-
thalassaemia, whose co-existence with SCD has been noted to reduce haemolytic rate, and
persistence of high haemoglobin F levels which also ameliorates the clinical severity of SCD.51
NUTRITIONAL STATUS IN CHILDREN WITH SCD
It is generally believed that SCD has an adverse effect upon the physical growth and
development of affected children.57 In Nigeria, affected children are believed to be of lower than
average body weight and height than their unaffected peers.58,59 Such growth deficits in sickle
cell patients have been reported by earlier studies59,60,62-68 to be more pronounced with
increasing age. This may be because of the chronic anaemia state. An earlier report has shown
that even African American children with SCD were shorter, with lower weights and thinner
body build than unaffected children.60 Several studies61,66,68 from the United States of America,
Jamaica and Italy have similarly shown that children and adolescents with SCD have impaired
growth as compared to normal controls. Such studies61,66,68 had even shown some nutrient
deficiencies in such children, further buttressing the need for extra care in these individuals.
In a study by Oredugba and Savage62in Lagos, South Western Nigeria in 2002, the height and
weight values in 177SCD subjects aged 1 to 18 years were not significantly different from those
of controls (unaffected children). This was a hospital-based cross sectional study and the cases

17
and controls were mostly from the lower socioeconomic class, which might explain the lack of
significant difference in anthropometric measurements between both groups.
In one study by Mukherjee and Gangakhedkar63 in India, involving 58 SCD (HbSS) children
aged 2 to 14 years compared with normal (HbAA) children, the SCD children, both male and
female, showed statistically significant lower values of all the measurements except the
upper/lower segment ratio as compared to normal children of the same age and sex groups. This
was also a hospital-based cross sectional study and majority of the SCD subjects in this study
were noted to have severe disease in terms of their clinical manifestations.
Ebomoyi et al64 in 1989, studied 719 SCD subjects aged 2 to 13 years, and found all (100%) to
be below the 50th percentile of the Harvard standards for height and weight. This study was
hospital- based. As such, it assessed only SCD cases presenting in hospital. The study
population included both acutely ill and stablechildren, hence, the effects of acute illness on the
nutritional state were not accounted for.
Oyedeji65 in 1991 also investigated 102 SCD subjects aged 9 months to 17 years. For weight, all
(100%) were below the 3rd percentile, while for height, they were around the 3rd percentile.
In 1992, Caruso-Nicolettiet al66reported moderate growth delay among 76 white Sicilian
children (1 to 17 years) with SCD. Weight and height were less than the 3rd centile of reference
values for white British children in 16% and 10.5%, respectively. The majority of these children
had Benin haplotypes and normal levels of somatomedin C.66 Compared with the studies in
Africa62,64,65 and India,63 growth indices appeared to be better in these European children with
SCD. This observation is likely due to the better socioeconomic circumstances and medical care
available in the more developed parts of the world.

18
Similarly,in a longitudinal study in 1981,Mann67 reported 61 HbSS patients (3 months to 19
years) in England, 16% of whose heights were greater than 2SD below the mean Caucasian
reference value. This finding further confirms the fact that European children with SCD showed
better growth than those in Africa and elsewhere, probably indicating better nutrition and quality
of care. The varied clinical manifestations compared with reports from Jamaica and North
America led the author to conclude that the variations depended on many factors including
geographic location, endemic infection and the general standard of nutrition and medical care.
In a longitudinal study of children with SS and SC disease, Stevens et al68 in 1986, followed 455
subjects from birth to 9 years of age. Compared with normal AA controls, they showed no birth
weight differences for either gender. The weight deficit for the HbSS children commenced
before the end of the first year of life. The deficit appeared to be relatively more marked in girls
and a similar trend was observed for height.68The children with HbSC disease showed no growth
deficit.68
Most of these studies were observational and hospital-based, with wide variations in sample size
and selection of reference growth data, which limited comparability. They however, all showed
a consistent pattern of growth failure among affected children from all geographic areas,
although the severity varied with location and was most marked in low-resource settings.
External and internal factors are likely to act together to a different degree against a variable
genetic, environmental and socio-economic background.
Improving the nutritional status and growth of these children could have a favourable impact on
their clinical course and prognosis. Hence, growth monitoring with appropriate nutritional
support as part of the comprehensive care of children with SCD , when promoted, might
influence better outcomes in the affected subjects.

19
SCREENING FOR SICKLE CELL DISEASE
Whitby69 suggested use of the following criteria for screening for a genetic disorder.:
Is the abnormality clearly defined? In the case of SCD as noted by Sergeant,39 it is the
first genetic disorder in which the molecular abnormality was precisely defined.
What population should be screened? In areas where SCD is prevalent, it has been
suggested that the whole neonatal population should be screened.70-73 Universal screening,
however, may be valuable epidemiologically in the description of prevalence rates.
What is the incidence of the condition? In Nigeria, from studies conducted in infancy and
the under-fives, the incidence ranges from 1.6 to 4.8% (16/1,000 – 48/1,000). 27,33-37,74 These
values are higher than those for congenital diseases like phenylketonuria, galactosaemia
and hypothyroidism for which screening programs exist.
How do screening methods compare in efficacy and cost? The two most commonly
used screening methods are haemoglobin electrophoresis and high performance liquid
chromatography. There are several established methods of electrophoresis: cellulose acetate,
citrate agar, thin layer iso-electrofocusing and capillary electrophoresis. Thin layer iso-
electrofocusing and capillary electrophoresis have beenadvocated to be the most sensitive
methods.75-78 They are able to separate distinctly the different types of haemoglobin.
Compared with the cost of doing both cellulose acetate and citrate agar electrophoresis,
thin layer iso-electrofocusing is thought to be cheaper. 75 Citrate agar usually has to be
done to confirm abnormal phenotypes when using cellulose acetate. Capillary
electrophoresis technique, in addition, detects minor variants of haemoglobin very well and also
quantifies the amounts of the various haemoglobins present in each individual sample.78
Are diagnostic facilities available for follow up of abnormalities shown by the screening
procedure, and are there acceptable treatments for the condition? Citrate

20
agarelectrophoresis can be used to confirm abnormal phenotypes. 75 Where this is not
available, cellulose acetate electrophoresis and solubility test can be done.There are also
acceptable treatments for the varied manifestations of the disease.
Is the natural history of the disease favourably influenced by the screening program? In
the case of SCD, in communities where newborn screening is practiced with
comprehensive health care program, the mortality rate has dropped from 15-30% to less
than 1%. 79,80-84
Is the screening cost effective? With the high mortality associated with this disease in
early infancy and childhood, there is eventual loss of potential manpower in the society.
In addition, early diagnosis, parental counseling, anticipatory guidance and regular follow
up will decrease the need for frequent hospitalizations. This in effect, would reduce the
burden on health facilities posed by this disease. It will also reduce the socioeconomic
burden of the illness on the family and society.
What should be done about findings that are neither clearly normal nor obviously
abnormal? These are the trait (carrier) cases. These persons are normal physiologically.
However, as carriers, they would be offered counseling, including genetic counseling, at
the point of diagnosis and on a continuous basis to ensure that at the time the need for
this information arises, they have fully grasped the notion of their status.85
EFFORTS TO REDUCE THE DISEASE BURDEN
Varied efforts have been made in different places to reduce the burden of sickle cell
disease. In an early study in Greece, people’s knowledge of their genetic makeup had no
effect on marriage decisions; 2 however, a recent study in the Islamic Republic of Iran
21
noted that about 50% of affected couples who decided to separate, resulted in reduction
in births with severe β thalassaemia to about 30% of the expected. 2
Newborn screening for SCD was first started at the Government Maternity Hospital,
Kingston, in Jamaica in July 1973.43,44 In 1975, New York and California States in the
USA added this to their pre-existing newborn screening programs.80In Europe, this
program was commenced in Birmingham in 1978.81 With the benefits of this exercise
widely documented, newborn screening for haemoglobinopathy is now widely practiced
in over 30 states in the USA and in other parts of Europe.86-89 The first newborn
screening centre in the Middle East, was established at the King Faisal University
Hospital in Damman, Eastern province of Saudi Arabia in 1982. 90
In Sub-Sahara Africa where this disease is prevalent, very few screening centres exist.
The first newborn screening program was established in Cotonou in the Republic of
Benin in May 1993. 45In February 1995, a second centre was established in Kumasi,
Ghana. 91
For newborn screening to be effective, it should be followed by comprehensive
healthcare.79,80,87The need for effective intervention in children with SCD should provide
a major impetus for screening the under-five population. One well established intervention
for children for children with SCD has been the use of prophylactic penicillin
therapy.Prophylactic penicillin therapy in a setting of comprehensive care has been found
to significantly reduce the morbidity and mortality of patients with SCD from
pneumococcal sepsis.48 Also, the recently introduced Pentavalent conjugate vaccine offers
hope for the future wellbeing in a setting where children are diagnosed at birth and
recruited into the comprehensive care and follow up program. Besides, reliable, simple and
cost effective techniques for mass screening are available and have demonstrated
validity.71,72

22
Given the fact that the benefits of screening and early institution of comprehensive care
are so compelling, universal newborn screening should be introduced into our welfare
program at the primary healthcare level.
CURRENT TREND OF NEONATAL SCREENING IN NIGERIA
Available literature indicates that Nigeria does not have a systematic program for mass and
newborn screening for SCD. Comprehensive health care service which is the foundation
for mitigating the burden of the disease is generally not widely available. 6
In addition, awareness of this condition, as well as what could be done for affected
children appear to be low in both our rural and urban centres. 6
METHODS OF DETECTING THE ABNORMAL HAEMOGLOBINS
The following methods are available for the detection of the presence of abnormal
haemoglobins:
1. Sickling test
2. Solubility test
3. Haemoglobin electrophoresis - Cellulose acetate
- Citrate agar
- Thin layer iso-electrofocusing
- Capillary electrophoresis
4. Micro-column chromatography
5. High performance liquid chromatography
1. SICKLING TEST
This test detects the presence of sickle haemoglobin. It is unable to detect the small
amounts of sickle cells that are present in the newborn.92

23
2. SOLUBILITY TEST
This test is based on the relative insolubility of deoxygenated sickle haemoglobin in
solutions of high molarity. This method is unable to differentiate the traits from those
with the disease.39
3. CELLULOSE ACETATE ELECTROPHORESIS
This method depends on the different mobilities of the different haemoglobins (because
of their different electrical charges) in an electric field. It is based on the charge change
in the haemoglobin molecule which occurs following certain amino acid changes.
In the case of sickle cell disease, the replacement of the negatively charged glutamic
acid by the neutral valine, results in two net positive charges per molecule relative to
the haemoglobin A1. Thus, HbS moves more slowly than HbA1 towards the anode. This
method requires a source of current, a buffer system which is borate at pH 8.4, and a
supporting medium which is the cellulose acetate membrane. It is not a highly sensitive
method of newborn screening. It is unable to separate the small amounts of HbA
distinctly from the large amounts of HbF present at birth and it also gives poor
resolution between HbF and HbS. 39,75 It is also unable to differentiate abnormal
haemoglobins with the same charge like HbD (Korle Bu and Punjab) from HbS and HbO
Arab from HbC. It is however, able to detect Bart’s haemoglobin (a gamma tetramer)
which when present, may suggest the presence of alpha-thalassaemia. 75
4. CITRATE AGAR ELECTROPHORESIS
This method is similar to the cellulose acetate electrophoresis (CAC). It enables one to
distinguish HbC, S, F, D and E. Its use in places where it is available is limited to
confirmation of abnormal patterns of haemoglobin detected by other methods used for
screening. 75

24
5. THIN LAYER ISO-ELECTROFOCUSING
This method has been reported to have the advantages of increased accuracy and
sensitivity compared to cellulose acetate (CAC) and citrate agar (CAG)
electrophoresis.75,76 It detects variants not apparent on CAC and CAG, 76and enables an
easier distinction of individual haemoglobin bands. It is also able to detect Bart’s
haemoglobin if the test is performed within two weeks of collection of the blood sample.
Compared to the cost of having to do both CAC and CAG, it is reported to be a
cheaper method of newborn screening.
It has a specificity of 99.5% to detect SCD and requires only five microliters of blood.
PRINCIPLE OF THE TEST
This method is based on the fact that each haemoglobin type has a zero net charge in solution at
a specific pH called the iso-electric point (pI). The charge on the support medium on which each
haemoglobin is being analysed (in this case agarose plate) is not uniform; i.e. there is a charge
gradient along the agarose plate unlike citrate agar and cellulose acetate that have a uniform
charge throughout their membranes. The haemoglobins being analysed migrate towards their
iso-electric points in this pH-gradient gel. A band called the ‘focusing band’ is formed by this
process. The iso-electric focusing technique has greater resolving power than either of the two
electrophoresis techniques currently used in most Nigerian laboratories (i.e. CAC and CAG).
The greatest advantage of iso-electric focusing technique seems to be in the detection and
separation of those mutant haemoglobins that migrate with HbA in cellulose acetate.75,76
THE PROCEDURE
A. PREPARATION OF THE AGAROSE PLATE
The agarose plate is prepared by mixing 400gm of agarose powder with 35mls of distilled water
in a beaker. This mixture is heated until it boils; then it is allowed to cool in room air to 70°Ϲ.

25
1.2mls each of Ampholine A solution at pH 6–8 and Ampholine B at pH 7–9 are then added to
this mixture. The mixture is immediately poured on a transparent cellophane plate that has been
mounted on another glass plate measuring about 12 by 25cm. This mixture forms a thin layer of
gel on cooling. This prepared agarose gel plate is stored in the refridgerator until when it is
needed.
It should be noted however, that there are ready-made plates of agarose gel which can be
purchased from the manufacturer.
B. PREPARATION OF THE HAEMOLYSATE
Using a paper clip, two slices of the blood stained Whatmanns paper are collected into a mini
test tube. 0.5mls of 0.05M solution of potassium cyanide is added to the paper in the test tube to
elute the haemoglobin from the Whatmann’s paper.
C. PREPARATION OF THE ELECTROPHORETIC STRIPS
Two strips of electrophoretic paper measuring 0.5 by 20cm are used. One is coated with 1 M
solution of sodium hydroxide (NaOH), while the other is coated with 0.05M solution of
sulphuric acid (H2SO4). The strip containing the NaOH is placed on the cathodal end of the
prepared agarose plate, while the H2SO4 strip is placed on the anodal end of the agarose plate.
D. RUNNING OF THE TEST (MIGRATION)
The agarose plate is placed on the electrophoretic machine. A rubber separator plate containing
52 small square spaces is then placed on the agarose plate close to the electrophoretic strip
containing the NaOH; i.e.the cathodal end. With separate pipettes, 0.05mls of each of the eluted
blood samples is dropped into the space contained in each of the small squares until all the
spaces are completed. The electrodes which are part of the electrophoretic machine are
connected with the negative electrode overlying the NaOH coated electrophoretic strip and the
positive electrode overlying the H2SO4 coated electrophoretic strip. The electrophoretic machine
itself is connected to two other machines. One is a pharmacia LKB multidrive XL machine. It is

26
a very high voltage machine supplying energy of 1500-3000 volts needed for the electrophoretic
movement. The second machine is a pharmacia LKB Multitemperature II which controls the
overall temperature of the electrophoretic machine preventing it from being destroyed by the
high voltage that is supplied by the multidrive machine. It maintains the temperature of the
electrophoretic machine at 13–13.5°Ϲ. Following the connection to these two machines, the
electrophoresis is allowed to run for 45-60 minutes until a clear separation of the various
haemoglobin types is achieved. The agarose plate is then removed from the electrophoresis
machine and is fixed in a 15% solution of trichloroacetic acid. The haemoglobin phenotypes are
read from the plate.
6. CAPILLARY ELECTROPHORESIS
This method is similar to chromatography in terms of separation science, but the main
principle is to separate compounds according to their charge, based mainly on electro-
osmotic flow. In capillary electrophoresis, every ion migrates at a different rate, hence it
has the efficiency to separate similarly structured compounds with a sensitivity comparable
to that of high performance liquid chromatography. 78
The main advantages of capillary electrophoresis over thin layer iso-electrofocusing
electrophoresis are that it detects minor variants very well and achieves good quantitation of
HbA2 and HbF. In addition, the system is easy to use and specimens may be run singly rather
than in batches like thin layer iso-electrofocusing.93
CAPILLARY ELECTROPHORESIS INSTRUMENT
The typical capillary electrophoresis instrument uses the following components to achieve both
electroosmotic flow and electrophoretic mobility and therefore, separations.93
1. Cathode (a negatively charged electrode)
2. Anode (a positively charged electrode)
27
3. Power supply to generate voltage/current
4. Catholyte (buffer solution at the cathode end)
5. Anolyte (buffer solution at the anodic end)
6. Capillary (25mm to 100mm internal diameter)
7. A detection method
8. A data acquisition method
Samples are introduced into the capillary for separation by electrokinetic injection.
Electrokinetic injection works when the capillary is placed into the catholyte on one end and into
the anolyte, containing the sample to be analyzed, on the other end. A voltage is applied and
electroosmotic flow moves from the tip of the capillary to the end of the capillary. A siphoning
effect occurrs, dragging a representative sample into the capillary. Also, ions begin moving into
the capillary from the buffer solution due to electrophoretic mobility as part of the sample
loading. These injections usually last for 1 to 5 seconds.93
After injection, the capillary injection end is moved into a sample vial containing capillary
electrophoresis grade water. A water plug is injected in the same manner that the sample is
injected. Then the capillary is moved into a different anolyte solution that did not contain the
sample. Voltage is applied across the capillary and the separation takes place as the separated
samples moved electrophoretically and with electroosmotic flow, past the detector. The detector
is linked to a data collection and storage system which displays the results graphically on the
monitor of a computer attached to the machine.93
7. MICRO-COLUMN CHROMATOGRAPHY
This method has been used successfully to screen large numbers of newborn. 94 It
requires a great deal of technical expertise. In addition, it requires the collection of a
large quantity of blood from the subjects.

28
8. HIGH PERFORMANCE LIQUID CHROMATOGRAPHY
This is the most sensitive method of detecting haemoglobin phenotypes. It also quantifies
the amounts of the various haemoglobins present in each individual sample. 39,95 The cost
of this machine is very high and its use requires more expertise.
FURTHER JUSTIFICATION FOR THIS STUDY
Given the various gaps in the literature reviewed, and the fact that these studies did not evaluate
the different frequencies of haemoglobin phenotypes for the various age groups of the under-
fives at the same time in a given community, it was worthwhile conducting a comprehensive
survey, taking into consideration as many of the various factors that describe and influence
disease outcomes in a holistic manner.

29
AIMS AND OBJECTIVES OF THE STUDY
BROAD OBJECTIVE
To study the distribution of haemoglobin phenotypes and the relationship with clinical
characteristics and nutritional status in newborns and older children aged <60 months.
SPECIFIC OBJECTIVES
1. To determine the overall and age-specific prevalence of the different haemoglobin
phenotypes among children less than 60 months of age in Ethiope West LGA.
2. To describe the specific haemoglobin phenotype distribution in the newborn.
3. To describe the clinical characteristics and anthropometric parameters of the study
population and relate these to the different haemoglobin phenotypes.
4. To determine the nutritional status of subjects aged 1 to less than 60 months and relate
this to the haemoglobin phenotypes.

30
SUBJECTS AND METHODS
STUDY DESIGN
This was a descriptive cross sectional study.
STUDY PERIOD
1st April, 2013 to 30th September, 2013.
STUDY LOCATION
The study was conducted in Ethiope West LGA of Delta State, situated in the rain
forest belt where malaria is holoendemic and the average annual rainfall is 266.5mm.
The LGA is bounded by Edo state to the North East, Warri North LGA to the West,
Sapele, Okpe and Ethiope East LGAs to the South.
Ethiope West has a population of 203,592 (2006 National Census) and occupies 536
square kilometers. It is inhabited mostly by the Urhobos, with pockets of other ethnic
groups like the Igbos and Hausas.
Their major occupations are farming, trading and civil service. The population is 75%
rural and about 25% urban/semi-urban. The literacy level is 47.7%
The main languages are Urhobo and pidgin English.
STUDY SITES
Ethiope West has eleven health wards and by a process of simple random sampling, three of
these health wards were selected for this study.
These wards are:
JESSE 1 (SELECTED)(Under- five population=9,793 of 48,964 total population)
JESSE 2

31
JESSE 3
JESSE 4
MOSOGAR 1
MOSOGAR 2
OGHAREFE 1
OGHAREFE 2 (SELECTED)(Under-five population=7,722 of 38,612 total population)
OGHAREFE 3
OGHAREKI 1 (SELECTED)(Under-five population=5,236 of 26,179 total population)
OGHAREKI 2
Each of these health wards has one health center. There is a General Hospital for the entire LGA
located in Oghareki 1.
The health centers are manned by a Senior Nursing Officer and at least two Community Health
Extension Workers (CHEWs). The CHEWs have been trained to provide home-based outreach
services and conduct health promotional activities for maternal, newborn and child health in the
communities.
ETHICAL CONSIDERATION
Prior approval of the Ethical Committee of DELSUTH was obtained.
Permission of the PHC coordinator of Ethiope West LGA was also obtained.
Parents of children diagnosed with SCD were counseled by the researcher, and such children
were enrolled in the DELSUTH comprehensive care programme.
Parents of children diagnosed with sickle cell trait, HbC and HbD traits were also counseled
appropriately by the researcher.
Children found with acute illness or any abnormalities were referred to the paediatric clinic of
DELSUTH.

32
Mobilisation Of The Population For The Study
Prior to accessing the population, pre-survey activities at the initial phase included visits to the
community leaders with the assistance of the LGA Chief Medical Officer and the PHC
coordinator to inform them of the purpose of the study and mobilize them for the study.
The CHEWs at the health centers were enlightened on the purpose of the study and the age
cohorts to be involved. They were also trained on carrying out physical examinations and
anthropometric measurements by the researcher.
Intensive mobilization activities were conducted to additionally sensitize the target communities.
SAMPLE SIZE DETERMINATION
The sample size was calculated using the formula:
Sample size, S = Z² x p(1-p)
d²
Z = confidence interval = 1.96
p = true proportion/prevalence in the population or the anticipated population prevalence
d = absolute precision = 0.03
For the neonates, the anticipated population prevalence was estimated to be 3-5%. For this work,
the 5% was used.
A prevalence of 50% was utilized for the cohort 1 month to <60months.
Accomodation for 13.5% attrition was made in both estimates.
Therefore, the sample size for neonates was:
S = 1.96² x 0.05(1 – 0.05) = 203 + 13.5% attrition (27) = 230
0.03²

33
The sample size for the 1 month to less than 60 months age cohort was :
S = 1.96² x 0.5(1 – 0.5) = 1,067 + 13.5% attrition (144) = 1,211
0.03²
Therefore, sample size for the entire study was 1,441.
SAMPLING PROCEDURE
A multistage random sampling procedure was used to select communities from the three
selected health wards. Selection of the households in these target communities was determined
by the ages of the children, as only children aged 0 to less than 60 months were targeted.
Enumeration of all the children aged 0 to less than 60 months in the selected communities was
conducted by the principal researcher with the assistance of the CHEWs.
Timing for the enumeration was 6p.m to 7p.m daily, and market days (every fourth day) were
excluded.
A complete listing of the households and enumeration of children per age cohort was done as
follows:
0 to < 1 month
≥ 1 month to <12 months
12 months to < 24 months
24 months to < 36 months
36 months to < 48 months
48 months to < 60 months
Jesse 1 is made up of nine villages. Three were selected by systematic random sampling. They
are Irhodo, Boboroku and Ejenesa.
Ogharefe 2 comprises six villages of which two, Otefe and Ijomi, were selected by systematic
random sampling.

34
Oghareki 1 comprises five villages. Two villages namely, Apapa and Uduaka, were similarly
selected.
In these selected villages of the health wards, enumeration of all children aged 0 to less than 60
months was done. The number of households from which these children were enumerated was
also noted.
Proportionate sampling based on the total number of children less than 60 months enumerated in
each selected health ward and the total number from the three health wards was used to
determine the number of subjects selected per health ward. This was derived as follows:
Number enumerated from health ward x Total sample size
Total number enumerated
660, 567 and 438 children less than 60 months were enumerated from the three selected health
wards, respectively. The study households were then selected by the use of a sampling interval
calculated as follows:
Sampling interval , N = Total population of children less than 60 months
Number of households
For households that had more than two children under 60 months of age, a simple random
sampling procedure was used to determine which two children to recruit for the study.
Hence, the calculated projected sample size from each health ward was 571, 491 and 379
subjects respectively, to achieve the calculated total sample size of 1,441.
A stratified randomization process was applied to accommodate for the respective age
cohorts.Based on the total number of children enumerated in each age cohort per health ward,
proportionate sampling was used to determine the proportions of each age cohort to select from
each of the three selected communities/health wards.
35
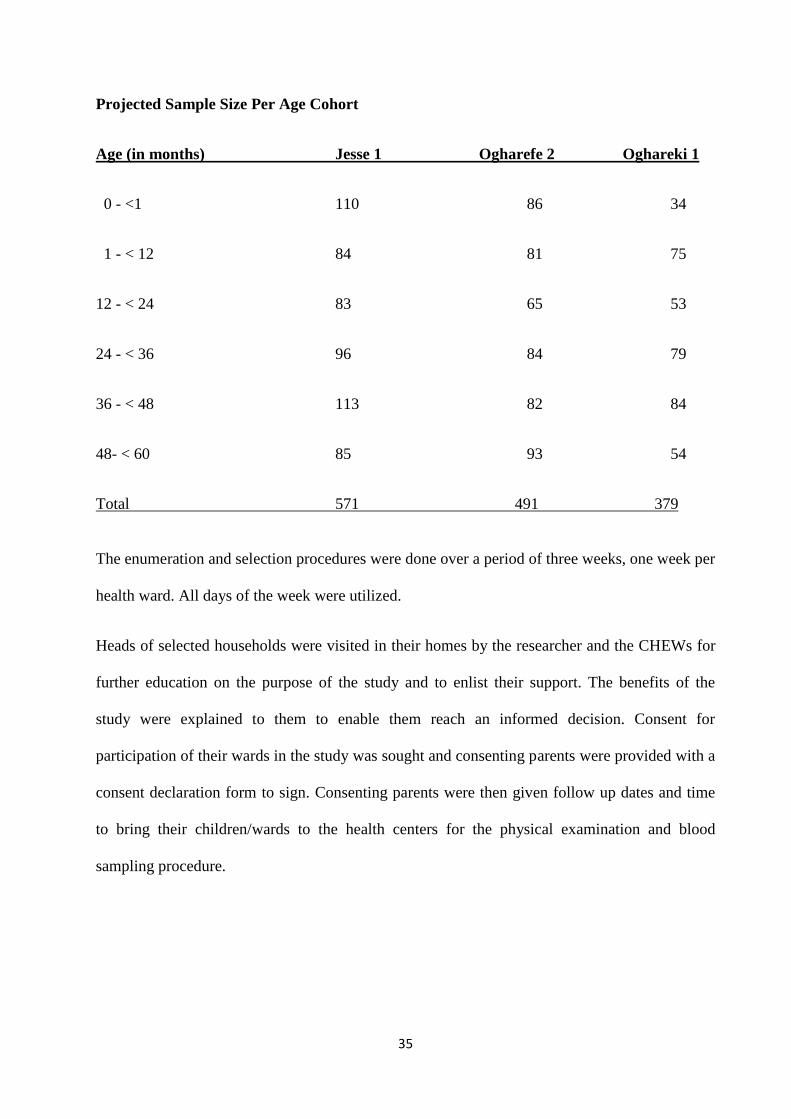
Projected Sample Size Per Age Cohort
Age (in months) Jesse 1 Ogharefe 2 Oghareki 1
0 - <1 110 86 34
1 - < 12 84 81 75
12 - < 24 83 65 53
24 - < 36 96 84 79
36 - < 48 113 82 84
48- < 60 85 93 54
Total 571 491 379
The enumeration and selection procedures were done over a period of three weeks, one week per
health ward. All days of the week were utilized.
Heads of selected households were visited in their homes by the researcher and the CHEWs for
further education on the purpose of the study and to enlist their support. The benefits of the
study were explained to them to enable them reach an informed decision. Consent for
participation of their wards in the study was sought and consenting parents were provided with a
consent declaration form to sign. Consenting parents were then given follow up dates and time
to bring their children/wards to the health centers for the physical examination and blood
sampling procedure.

36
INCLUSION CRITERION
All live borns aged 0 to less than 60 months in the selected households; a maximum of 2
children were sampled per household.
EXCLUSION CRITERIA
1. Blood transfusion within the preceding three months.
2. Permanent residence outside Ethiope West LGA. (Children on holidays or children of
mothers who had come from a different location to deliver their babies and receive
maternity care in the immediate postnatal period.Also, households that had domiciled
less than six months in the location).
DATA COLLECTION
Blood sampling and anthropometric measurements were commenced the week after completion
of the enumeration and subject selection. Study days for the older children were Mondays to
Fridays. For the newborn, who were recruited consecutively from the health centers and the
General Hospital following delivery and for those delivered at home, from their homes (with the
assistance of the CHEWs), recruitment and sampling were done everyday of the week for the
study period. The study time was from 8a.m to 4p.m daily. Babies recruited from the health
centers were tagged by the CHEWs for follow up in the community. This enhanced the
possibility of not recruiting them twice.
A questionnaire was administered to the parents of enrolled children following which a thorough
physical examination was conducted and anthropometric measurements (height, weight and mid
upper arm circumfence) using standardized procedures96 were taken. These procedures were
carried out by the researcher and trained assistants (four doctors and six CHEWs). The
examination findings for each subject were confirmed by at least two observers. Where there

37
was a significant difference in the observations, the subject was further examined by another two
observers.
Children 24 months and above, were weighed in their underwear, using a well calibrated
stadiometer weighing equipment that was also used in measuring the height, while the child was
standing erect, without shoes. The subject was made to stand up straight against the vertical
backboard of the stadiometer with their body weight evenly distributed and both feet on the
platform, with the heels together and the toes pointing slightly outwards at approximately 600
angle. The examiner then checked that the back of the head, shoulder blades, buttocks and heels
were in contact with the backboard before aligning the head in the Frankfort horizontal when the
horizontal line from the ear canal to the lower border of the orbit was parallel to the floor and
perpendicular to the vertical backboard. The subject was instructed to look straight ahead and
then the stadiometer head piece was lowered to rest firmly on top of the subject’s head, with
sufficient pressure to compress the hair. The examiner would then capture the result, verify the
correct value and then ask the subject to step away from the stadiometer, slide the head piece to
the top of the measurement column and secure it in place with the brake lever, in preparation for
the next participant. Infants were weighed in an infant weighing scale, while their lengths were
measured using an infantometer as follows. The subject was laid on the infantometer on top of
the horizontal backboard with the feet toward the foot piece and the head against the fixed head
piece. One examiner supported the child’s head and ensured that the head was aligned in the
Frankfort horizontal plane, while an assistant positioned the feet, aligning the child’s legs by
placing one hand gently, but with mild pressure over the knees and using his other hand to slide
the foot piece to rest firmly at the child’s heels. The measurement was then read off, verified,
and then the parent or guardian asked to remove the child from the infantometer and the foot
piece slid to the end of the measurement column in preparation for the next subject.The MUAC

38
was measured on the left arm, with the elbow extended, using a non-stretch measuring tape at
the mid-point between the acromion of the scapula and the olecranon process of the ulnar.
Findings on physical examination and anthropometric measurements were recorded on a
proforma that included the age, sex and address of the subject.
In children aged one month to less than 60 months, anthropometric measurements were later
assessed using z-scores calculated using WHO child growth standards. Levels of malnutrition
were defined as z-scores less than -2 and greater than +2 standard deviation for the age and sex
for undernutrition and overnutrition, respectively.
BLOOD SAMPLING
Blood sampling was done by the researcher and four doctors, spread across the three health
centers and the General Hospital.
For children less than 6 months, blood samples were collected by heel prick after cleaning with
70% alcohol, using a sterile medpoint lancet, onto a 3 by 7.5 centimetre Whatmann’s paper with
four one centimeter diameter circles. A drop of blood was placed at the center of each circle.
Prior to the sample collection, the paper was labeled with the child’s names, sex, age, date of
birth and date of sample collection. Each sample was allowed to dry in room air before sealing
in individual polythene self-sealing envelopes and then stored in the freezer at -4°Ϲ. Every two
weeks, samples were transported by the researcher in a cold chain box to the National Sickle
Cell Disease Center, Cotonou, where thin layer isoelectrofocusing and capillary electrophoresis
were done.
For children 6 months old and above, 2milliliters of blood was collected from any visible vein
on the dorsum of the hand using a gauge 22 Terumo needle, into an EDTA sample bottle after
swabbing the site with 70% methylated spirit. The blood was then stored in the refridgerator,

39
and then transported in a cold chain box to the National Sickle Cell Disease Center, Cotonou
within two weeks of collection by theresearcher . All samples were analysed by capillary
electrophoresis technique.
Parents were given follow up dates of four weeks following the sampling procedure to return to
the health centers for collection of their results.
DISCLOSURE OF RESULTS
Results were made available to parents four weeks after the sampling procedure.
Parents of those children with haemoglobinopathy were counseled on the nature of their childs’
condition, the clinical presentation, complications and management. Arrangements were then
made for their child to be immediately referred to the sickle cell clinic of the teaching hospital
by the researcher.
Parents of children with sickle cell trait, HbC and HbD traits, and normal haemoglobin
(HbAA)were also counseled and made aware of the implications of possessing these
haemoglobin phenotypes.
LABORATORY METHODS
A single method for haemoglobin analysismay not be sufficient for definitive identification of a
haemoglobin variant, particularly for the more uncommon haemoglobin
variants.97Complementary methods are useful because haemoglobin variants that do not separate
on one method, may show separation on another method. Combinations of methods are useful
also to confirm the common variants and help to narrow down the identification of unusual
variants, as these typically show varying mobilities by different methods. The choice of methods
depends on individual laboratories.97As a standard laboratory procedure, the research laboratory
at the National Sickle Cell Disease Center in Cotonou employs the use of both

40
isoelectrofocusing and capillary electrophoresis for newborn haemoglobin phenotype analysis.
This procedure was,as such, employed for the present study. Blood samples for the newborn
were first subjected to thin layer isoelectrofocusing electrophoresis and then, were confirmed
with capillary electrophoresis.
The researcher was present in the laboratory during the process of sample analysis and
participated in the preparation of the samples for the assay which was done fortnightly.
However, for acceptance of results with a specific measure of accuracy, the laboratory
technologists conducted the bulk of the tests.
STATISTICAL ANALYSIS
The statistical analysis were done using the IBM SPSS statistics version 20.0 to produce the
means, standard deviations and chi square. Categorical variables were compared using Fisher’s
exact tests. P values <0.05 were considered significant. Nutritional status was assessed using z-
scores calculated based on WHO child growth standards.

41
RESULTS
One thousand, five hundred and fifty one children were enrolled for this study. Two hundred and
eighty eight were neonates, while 1,263 were older children less than sixty months of age. One
hundred and eleven blood samples were lost to testing due to poor quality of blood samples as a
result of denaturation of the haemoglobin during storage of the samples and poor resolution of
results on capillary electrophoresis.. Following sample analysis, 1,440 results were valid. Two
hundred and forty six belonged to neonates, while 1,194 belonged to older children less than
sixty months.
SOCIO-DEMOGRAPHIC CHARACTERISTICS OF THE STUDY GROUP
Table I shows the socio-demographic characteristics of the study group. Of the 1440 children
studied, 744(51.7%) were male and 696(48.3%) were female, giving a male:female ratio of
1.07:1.
The age distribution of the study group is shown in Figure 1. Three hundred and eighty eight
(26.9%) of the children were in the age bracket 1-<12months; while 184(12.8%) were in the age
group 48-<60months. The mean age of the study group was 24.3± 17.0months.
EDUCATIONAL QUALIFICATION OF THE PARENTS/CAREGIVERS
The educational qualifications of the parents/caregivers of the children enrolled in the study are
as shown on Table I. Six hundred and forty eight (45.0%) of the parents/caregivers in this study
had primary education, while only about1.0% (14) had no formal education.

42
SOCIOECONOMIC STATUS OF THE PARENTS/CAREGIVERS
The socioeconomic status of the study group is shown in Table I.Majority of the study
subjects(65.5%) belonged to the lower socioeconomic class based on the social classification
system described by Oyedeji.98 For the purpose of this study, social class I and II were grouped
as the upper class, social class III as the middle class, while social class IV and V were
categorized as the lower class.
MARITAL STATUS OF PARENTS/CAREGIVERS
Almost all, 1360 (94.3%) of the parents/caregivers in this study were married. Twenty one
(1.5%) were single, 47(3.3%) cohabiting, 4(0.3%) separated or divorced and 8(0.6%) widowed.

43
Figure 1: Distribution of Study Subjects By Age
17.1%
26.9%
15.8%
14.4%
12.9%
12.8%
0 - <1mth
1 - <12mth
12 - <24mth
24 - <36mth
36 - <48mth
48 - <60mth

44
Table I : Socio-Demographic Characteristics of the Study Group
Variables Frequency Percentage (%)
Sex
Male 744 51.7
Female 696 48.3
Educational Qualification of Parents/Caregivers
No formal education 14 1.0
Primary 648 45.0
Secondary 635 44.1
Tertiary 143 9.9
Socioeconomic Status of Parents/Caregivers
Upper class 172 11.9
Middle class 325 22.6
Lower class 943 65.5
Total 1440 100.0

45

46
HAEMOGLOBIN PHENOTYPES BY AGE
The overall and age specific prevalence of the haemoglobin phenotypes identified in the study
population are shown in Table II.
The phenotypes identified were HbAA, HbAC, HbAD, HbAS and HbSS. The overall prevalence
of these phenotypes was 73.6%, 0.4%,0.1%, 23.7% and 2.2%, respectively.
HbAA, HbAS and HbSS were documented in all the age group cohorts, whereas, HbAC was
not identified in the 1-<12months age group and HbAD was identified in only one age cohort,
36-<48months.
HbAA phenotype was more prevalent in the neonatal age group (78.5%) and the 12-<24months
age group (79.5%) compared to the other age cohorts.
HbAC phenotype was also more prevalent in the neonatal age group (0.8%). The prevalence was
approximately the same (0.4%- 0.5%) in the other age cohorts where this phenotype was
documented.
HbAS phenotype was least prevalent (17.5%) in the 12-<24months age group and most
prevalent in the 1-<12months age group.
The prevalence of HbSS was highest (3.2%) in the 36-<48months age bracket and lowest (1.2%)
in the neonatal age group.
For all the haemoglobin phenotypes, the difference in prevalence among the various age cohorts
of children less than 60months was not statistically significant (p=0.213).

47
Table II: Haemoglobin Phenotypes By Age
Haemoglobin Phenotype - n (%)
Age (months) AA AS AD AC SS Total (%)
Neonates 193 (78.5) 48 (19.5) 0 (0.0) 2 (0.8) 3 (1.2) 246 (100.0)
≥1 - < 12 274 (70.6) 105 (27.1) 0 (0.0) 0 (0.0) 9 (2.3) 388 (100.0)
12 - < 24 181 (79.5) 40 (17.5) 0 (0.0) 1 (0.4) 6 (2.6) 228 (100.0)
24 - < 36 148 (71.2) 55 (26.4) 0 (0.0) 1 (0.5) 4 (1.9) 208 (100.0)
36 - < 48 133 (71.5) 45 (24.2) 1 (0.5) 1 (0.5) 6 (3.2) 186 (100.0)
48 - < 60 131 (71.2) 48 (26.1) 0 (0.0) 1 (0.5) 4 (2.2) 184 (100.0)
Total 1060 (73.6) 341(23.7) 1 (0.1) 6 (0.4) 32 (2.2) 1440(100.0)
Fisher’s exact test = 15.228; df = 12; p = 0.213

48
RELATIONSHIP BETWEEN HAEMOGLOBIN PHENOTYPE AND SPECIFIC
CLINICAL SIGNS
Table III shows the prevalence of specific clinical signs in the general study population and the
relationship of these signs with haemoglobin phenotype.
Two point two percent (23/1,060) of children with HbAA, 1.4% (5/348)of those with trait status
and 15.6%( 5/32) of those with HbSS were jaundiced. The prevalence of jaundice was
significantly higher in those with HbSS compared to the others (p<0.001).
Pallor was seen in 73(5.1%) of the general study population. 34.4% (11/32) of HbSS individuals
had pallor compared to 4.6% (49/1060) of HbAA and 3.7% (13/348) of individuals with trait
status . This difference was statistically significant (p<0.001).
Hepatomegaly and splenomegaly were observed in 15(1.1%) and 65(4.6%) of the total study
population, respectively. Among HbSS subjects, hepatomegaly was observed in 15.6% (5/32)
and splenomegaly was observed in 15.6% (5/32). Zero point eight percent (0.8%)( 8/1060) of
HbAA and 0.6% (2/348) of trait individuals had hepatomegaly and 4.4%( 47/1060) of HbAA
and 3.7% (13/348) of traits had splenomegaly. For both signs, the difference was statistically
significant (p<0.001,p<0.05, respectively).
Nine(0.6%) of the total study population had bossing of the skull bones while gnathopathy was
observed in 24(1.7%). Among HbSS individuals, bossing of the skull bones was observed in
6.3% (9/32) and gnathopathy in 9.4% (3/32). Zero point four percent, 0.4% (4/1060) of HbAA
and 0.9% (3/348) of trait individuals had bossing of the skull and 1.6% (17/1060) of HbAA
individuals and 1.2% (4/348) of trait individuals had gnathopathy.The difference in prevalence
of both signs between HbSS individuals, HbAA and traits was statistically significant (p<0.05
and p<0.05 respectively).
Eight (0.6%) of all the children had a flat nasal bridge. Among HbSS subjects, this sign was
observed in 12.5% (4/32), compared with 0.3% (17/1060) among HbAA subjects and 1.2%

49
(4/348) among trait individuals. The difference in prevalence between HbSS subjects compared
with HbAA and trait individuals was also statistically significant (p<0.001).
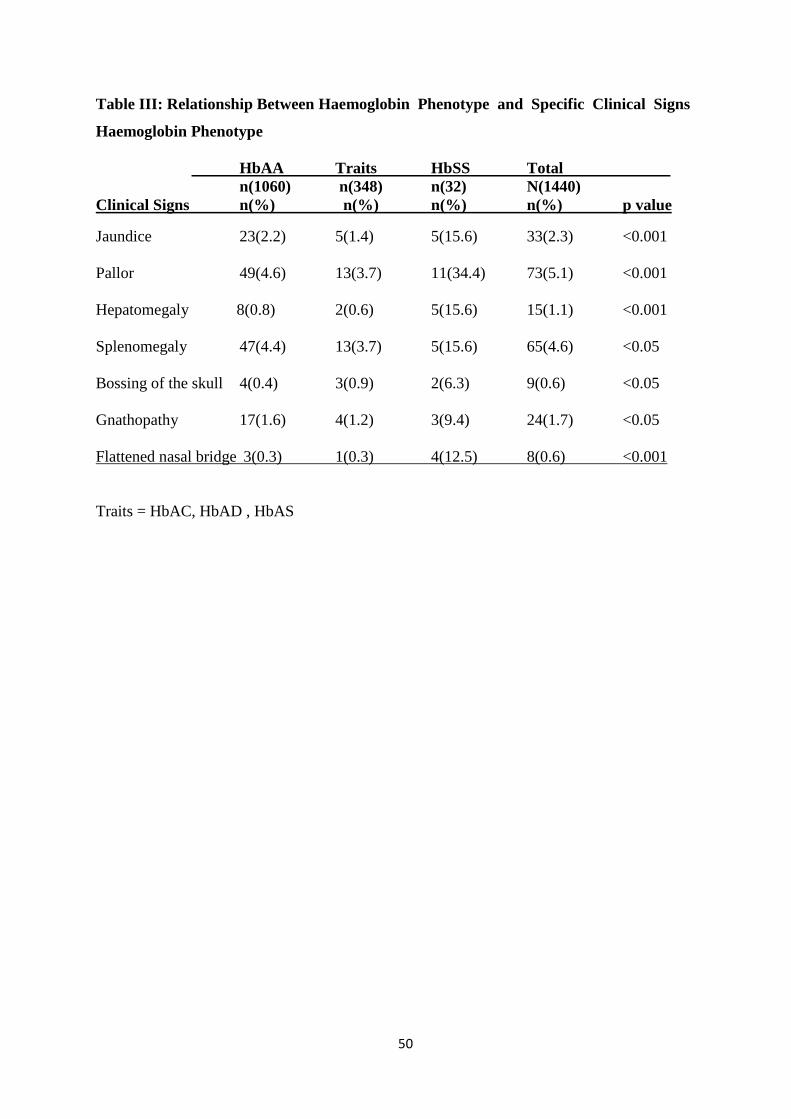
50
Table III: Relationship Between Haemoglobin Phenotype and Specific Clinical Signs
Haemoglobin Phenotype
HbAA Traits HbSS Total
n(1060) n(348) n(32) N(1440)
Clinical Signs n(%) n(%) n(%) n(%) p value
Jaundice 23(2.2) 5(1.4) 5(15.6) 33(2.3) <0.001
Pallor 49(4.6) 13(3.7) 11(34.4) 73(5.1) <0.001
Hepatomegaly 8(0.8) 2(0.6) 5(15.6) 15(1.1) <0.001
Splenomegaly 47(4.4) 13(3.7) 5(15.6) 65(4.6) <0.05
Bossing of the skull 4(0.4) 3(0.9) 2(6.3) 9(0.6) <0.05
Gnathopathy 17(1.6) 4(1.2) 3(9.4) 24(1.7) <0.05
Flattened nasal bridge 3(0.3) 1(0.3) 4(12.5) 8(0.6) <0.001
Traits = HbAC, HbAD , HbAS
51
PREVALENCE OFCLINICAL SIGNS ACCORDING TO AGE
The prevalence of clinical signs according to age is shown on Table IV.
Seventy three of 1440 subjects studied were clinically pale. Twenty one (28.6%) of them were in
the age bracket 1-<12months, while only 4 (5.5%) were of the neonatal age group.
Jaundice was observed in 33 study subjects. The prevalence was highest in the neonatal age
group; 25 (75.7%) and was lowest, 0(0.0%) in the 1-<12months age group.
Bossing of the skull bones was not observed until 12-<24months of age. Nine individuals had
this sign. Three (33.3%) were in the age bracket 12-<24months and another 3 (33.3%) amongst
24-<36months, while 1(11.1%) was in the 36-<48months age bracket.
The onset of gnathopathy was from 24months of age. Twenty four study subjects had this sign
of which 14(58.3%) were in the 48-<60months age group, while 2(8.4%) were in the
24-<36months age group.
Hepatomegaly was observed in 15 subjects. Four (26.7%) individuals each from age groups 24-
<36months and 36-<48months presented with this sign, while none, 0 (0.0%) from the neonatal
age group exhibited hepatomegaly
Sixty five study subjects had splenomegaly. Sixteen (24.6%) were in the 24-<36months age
group, while 4(6.2%) were of neonatal age

52
Table IV: Prevalence of Clinical Signs According to Age.
Age (months) n (%)
Clinical Signs 0-<1 1-<12 12-<24 24-<36 36-<48 48-<60 Total
Pallor 4 (5.5) 21(28.6) 15(20.5) 13(17.8) 11(15.1) 9(12.5) 73 (100.0)
Jaundice 25(75.7) 0(0.0) 3(9.1) 2(6.1) 1(3.0) 2(6.1) 33(100.0)
Bossing of skull 0(0.0) 0(0.0) 3(33.3) 3(33.3) 1(11.1) 2(22.2) 9(100.0)
Gnathopathy 0(0.0) 0(0.0) 0(0.0) 2(8.4) 8(33.3) 14(58.3) 24(100.0)
Flat Nasal Bridge 0(0.0) 1(12.5) 3(37.5) 1(12.5) 1(12.5) 2(25.0) 8(100.0)
Hepatomegaly 0(0.0) 2(13.3) 3(20.0) 4(26.7) 4(26.7) 2(13.3) 15(100.0)
Splenomegaly 4(6.2) 9(13.8) 15(23.1) 16(24.6) 10(15.4) 11(16.9) 65(100.0)

53
CLINICAL SIGNS (GNATHOPATHY) ACCORDING TO AGE AND HAEMOGLOBIN
PHENOTYPE
Table V shows the prevalence of gnathopathy according to age and haemoglobin phenotype.
Twenty four subjects had gnathopathy and this sign was documented in all the phenotype
groups. Fourteen (58.4%) were in the 48-<60months age group, while 2 (8.3%) were in the 24-
<36months age group. Below 24months of age, the prevalence was 0(0.0%). Thereafter, it
showed a progressive increase with age.

54
Table V: Gnathopathy According to Age and Haemoglobin Phenotype
Haemoglobin Phenotype Age (Months) P
<1 1-<12 12-<24 24-<36 36-<48 48-<60 Total
n=246 n=388 n=228 n= 208 n=186 n=184 N=1440
HbAA 0(0.0) 0(0.0) 0(0.0) 2(11.8) 6(35.3) 9(52.9) 17(100.0)
Traits 0(0.0) 0(0.0) 0(0.0) 0(0.0) 1(25.0) 3(75.0) 4(100.0)
HbSS 0(0.0) 0(0.0) 0(0.0) 0(0.0) 1(3.1) 2(6.3) 3(100.0)
Total 0(0.0) 0(0.0) 0(0.0) 2(8.3) 8(33.3 ) 14(58.4) 24(100.0)
Traits = HbAC,HbAD, HbAS

55
RELATIONSHIP BETWEEN HAEMOGLOBIN PHENOTYPE AND NUTRITIONAL
STATUS IN CHILDREN AGED 1 TO LESS THAN 60 MONTHS
Table VI shows the relationship between haemoglobin phenotype and nutritional status in
children aged 1 to less than 60months based on the weight for age.
One thousand and thirty-seven (86.9%) were well nourished, while 146 (12.2%) were
underweight and 11 (0.9%) were overweight.
Among the phenotype groups, normal nutritional status was found in 789(87.4%) of HbAA
individuals compared with 225(85.9%) of trait individuals and 23(71.9%) of HbSS subjects.
Six (18.8%) of HbSS individuals, 35 (13.4%) of trait individuals and 105 (11.6%) of HbAA
subjects were underweight.
Nine (1.0%) of HbAA subjects were overweight compared with 2 (0.7%) of trait subjects and 0
(0.0%) of HbSS subjects.
There was no statistically significant difference in the nutritional status among the various
haemoglobin phenotypes. (p=0.691)
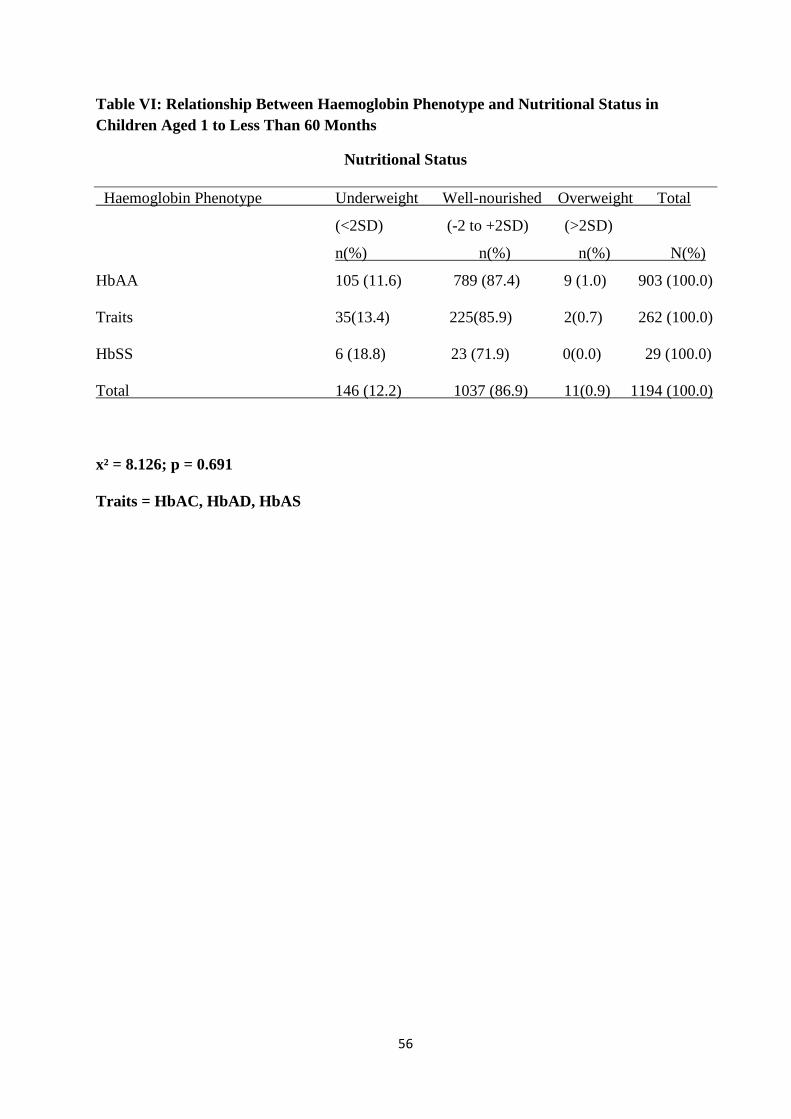
56
Table VI: Relationship Between Haemoglobin Phenotype and Nutritional Status in
Children Aged 1 to Less Than 60 Months
Nutritional Status
Haemoglobin Phenotype Underweight Well-nourished Overweight Total
(<2SD) (-2 to +2SD) (>2SD)
n(%) n(%) n(%) N(%)I
HbAA 105 (11.6) 789 (87.4) 9 (1.0) 903 (100.0)
Traits 35(13.4) 225(85.9) 2(0.7) 262 (100.0)
HbSS 6 (18.8) 23 (71.9) 0(0.0) 29 (100.0)
Total 146 (12.2) 1037 (86.9) 11(0.9) 1194 (100.0)
x² = 8.126; p = 0.691
Traits = HbAC, HbAD, HbAS

57
RELATIONSHIP BETWEEN HAEMOGLOBIN PHENOTYPE AND NUTRITIONAL
STATUS IN CHILDREN AGED 1 TO LESS THAN 60 MONTHS
Table VII shows the relationship between haemoglobin phenotype and nutritional status based
on height/length for age in children aged 1 to less than 60 months.
One thousand and sixty four (89.1%) of the study population were well nourished, while 125
(10.5%) were stunted and 5 (0.4%) had tall stature.
Among the haemoglobin phenotype groups, 803(88.9%) of HbAA children and 236(90.1%) of
trait individuals were well nourished (of normal height) compared with 25(86.2%) of HbSS
subjects.
Four (13.8%)of HbSS individuals were stunted compared with 24(9.2%) of trait individuals and
97(10.7%) of HbAA subjects.
Three (0.4%)of HbAA subjects had tall stature compared with 2(0.7%) of trait individuals and
0(0.0%) of HbSS subjects.
There was no statistically significant difference in the nutritional status among the various
haemoglobin phenotypes. (p=0.873)

58
Table VII: Relationship Between Haemoglobin Phenotype and Nutritional Status Based on
Height/Length for age in Children Aged 1 to Less Than 60 Months
Nutritional Status
Stunted Well nourished Tall Stature Total
Haemoglobin Phenotype (<2SD) (+2 to -2SD) (>2SD)
n(%) n(%) n(%) N(%)I
HbAA 97(10.7) 803(88.9) 3(0.4) 903(100.0)
Traits 24(9.2) 236(90.1) 2(0.7) 262(100.0)
HbSS 4(13.8) 25(86.2) 0(0.0) 32(100.0)
Total 125(10.5) 1064(89.1) 0(0.0) 1194(100.0)
x² = 6.143; p = 0.873
Traits = HbAC, HbAD, HbAS

59
Table VIII: Haemoglobin Phenotype and Nutritional Status Based on MUAC (children
aged 12 to less than 60 months)
Haemoglobin
Phenotype
Undernourished
(<12.5cm)
n(%)
Borderline
(12.5cm-
13.5cm)
n (%)
Well nourished
(13.5cm -
17.5cm)
n (%)
Obese
(>17.5cm
)
n (%)
Total
N (%)
HbAA 76(12.8) 61(10.3) 444(74.9) 12(2.0) 593(100.0)
HbAC, HbAD, HbAS 34(17.6) 22(11.4) 132(68.4) 5(2.6) 193(100.0)
HbSS 3(15.0) 3(15.0) 14(70.0) 0(0.0) 20(100.0)
Total 113(14.0) 86(10.7) 590(73.2) 17(2.1) 806(100.0)
𝑥2 = 7.784, 𝑝 = 0.703
There was no statistically significant difference in the nutritional status among the various
haemoglobin phenotypes

60
DISCUSSION
The haemoglobin phenotypes identified in this study were HbAA, HbAC, HbAD, HbAS and
HbSS. Overall, this pattern of haemoglobin phenotypes is similar to what has been previously
described for the under-five age group in Nigeria.34-37This study has additionally described
HbAD which hitherto has not been reported in Nigeria. This finding may be related to the
sensitivity of the newer capillary electrophoresis technique used in the haemoglobin phenotype
determination in this study. The capillary electrophoresis technique has a greater separation
power of globin chains than other commonly used methods of electrophoresis.93
Homozygous haemoglobin A was seen in 73.6% of the subjects, while the prevalence of the
sickle cell trait (HbAS) was 23.7%. These findings are consistent with those of Fleming et
al27who in 1979, documented a HbAA prevalence rate of 73.8%, and also with those of Kaine
and Udeozo35 in 1981 and Abhulimhen-Iyoha et al34 in 2006 in which the corresponding
prevalence rates were 75.8% and 72.0% respectively. Fleming and coworkers27 studied infants
from northern Nigeria, while Kaine and Udeozo35and Abhulimhen34 studied under-five children
in Eastern and Southern Nigeria respectively. Furthermore, Umoh et al in a 2007 survey of
8,097 Nigerians (adults and children) documented a prevalence of 78.7% for HbAA and 19.6%
for HbAS in the same study.100 In contrast, a lower prevalence rate was recorded by Omotade et
al74 in 1998 who reported a 67.2% prevalence for HbAA amongst infants presenting for measles
vaccination at the infant welfare clinic of the Institute of Child Health, University College
Hospital, Ibadan, Nigeria. Similarly, among 1,296 children aged between one month and
fourteen years at Ilorin (in North Central Nigeria), Adewuyi and Akintunde36had earlier, in
1990, recorded a prevalence of 68.9% for HbAA.
With regard to the prevalence rates of sickle cell trait (HbAS), the earlier Nigerian reports 27,34-37
alluded to above, documented values ranging from 19.6% to 28.9%. The observed HbAS
prevalence of 23.7% in this study corresponds to 20% to 30% documented for Nigeria and 20%

61
to 40% for Africa in general.101 Variations in the prevalence of sickle cell trait and disease in
children in different parts of the tropics may be determined partly by the intensity and mode of
falciparum malaria transmission in the region.27 Thus, the reported prevalence of sickle cell trait
in the Sudan Savanna Region of Nigeria, where falciparum malaria is hyperendemic was slightly
higher (28.9%), than in the rainforest belt of Nigeria (23.7%) where the parasite is
holoendemic.27This has been attributed to the more rapid acquisition of partial immunity in a
holoendemic situation, and the consequent quicker disappearance of the survival handicap
among children with normal haemoglobin.27
The prevalence of HbAC in this study was low with a trait frequency of only 0.4%. This is
consistent with the observations made by other workers from the Eastern and Southern parts of
Nigeria, where the HbC gene was infrequent or absent.35 In contrast, studies from Western
Nigeria describe a higher prevalence of the ‘’C’’ gene.36,37,74 Nwokolo and Lehman25 explained
that the ‘’C’’ gene might have originated from Burkina Fasso(formerly Upper Volta) and Ghana.
They argued that these people were hindered from migrating to the Eastern part of Nigeria
because of difficulty crossing the River Niger; hence the low frequency of the ‘’C’’ gene across
the Niger. On the other hand, the western region of Nigeria which was their first area of
settlement, had a higher prevalence of HbC. This prevalence decreases as one moves from the
west towards the east. Ethiope West,the study site, is on the western bank of the River Niger.
This may thus explain the low prevalence of HbAC and the absence of HbSC in this study.
In this study, the prevalence of HbAD was 0.1%. This finding is not consistent with those from
other studies done on underfives in Nigeria27,34-37 and in Africa30-32,38which confirms the rarity of
this haemoglobin phenotype in the African population. Among a population of 202,244 infants
screened by Ohene-Frempong et al32 in Ghana over a ten year period, no case of HbD was
documented. Similarly, among 10,115 infants screened by Omotade et al74 in Western Nigeria
over a twelve-year period, no cases of HbD were identified. In Gambia, Facer et al102screened

62
343 children aged two months to ten years and found no cases of HbD. Among 180 sickle cell
disease patients aged two to fifteen years in Western Nigeria, Adeyemoet al103 found a
prevalence of 0.6% for HbSD. The haemoglobin D trait is known to have its highest frequency
of 1 in 100 among Pakistanis and Indians.3This variant is known as HbD Punjab. Other less
common variants such as HbD Korle-Bu, are found much less frequently and more often in
individuals not of Pakistani or Indian descent.3 The variant of HbD reported in the present study
was HbD Korle-Bu.
The overall prevalence of SCD in this study was found to be 2.2%. This is higher than the 1.6%
reported by Kaine and Udeozo at Enugu, Eastern Nigeria. The higher prevalence of SCD in the
present study may possibly be due to the fact that it was a randomized community-based study,
incorporating infants of the neonatal age group as well as those below four months of age, unlike
Kaine and Udeozo’s study. In one other study of under-fives by Abhulimhen-Iyoha et al34 in
Ekosodin community, Benin city in Southern Nigeria, the prevalence of SCD was estimated to
be 0%. In that study, 107 children aged 0 to less than 60 months were studied. The relatively
smaller sample size and also, the non-systematic sampling technique utilized for the study may
have accounted for the absence of the homozygous state. Adewuyi and Akintunde36 in a 1990
study in Ilorin (North Central Nigeria) found a prevalence of 2.8% for SCD among 1,296
children between the ages of one month and fourteen years. This prevalence is higher than that
documented in the present study. This observation may be attributable to the fact that the authors
studied children one month to fourteen years of age, rather than children less than sixty months
of age as in the present study. The high prevalence of HbSC (1.3%) which was absent in the
present study may also have accounted for this observation. Omotade et al74 found a prevalence
of 4.4% for SCD in their 1998 study conducted at Ibadan, Western Nigeria. HbSS accounted for
3.3% of the SCD prevalence, while HbSC accounted for 1.1%. This prevalence is also higher
than that from the present study. This may be attributable to the much higher prevalence of HbC

63
gene in that locality. With respect to the African sub-region, Rahimy et al45in Cotonou, West
Africa documented a prevalence rate of 9.9% for SCD. The apparently higher prevalence may be
due to the fact that their study recruited newborns of mothers with sickle cell trait. In 2004,
Amoako38, in a study of 341 children aged 6 to 59 months in Kintampo North municipality,
Ghana, found a prevalence of 75.9% for HbAA, 14.9% for HbAC ,9.2% for HbAS, 0.3% for
HbSC, 0.3% for HbCC and 0.9% for HbSS. In the Northern part of Ghana where this study was
conducted, the C trait has been found to be more prevalent (20%-25%) and the S trait less
prevalent (10%),24 hence explaining the relatively higher prevalence of HbC trait and the lower
prevalence of sickle cell trait in that study.
No case of alpha or beta thalassaemia was seen in this study. In infancy, the presence of
Haemoglobin Barts in large amounts is taken to suggest the presence of alpha thalassaemia.
However, this haemoglobin undergoes denaturation when blood samples are stored for longer
than two weeks.72Most blood samples were stored longer than this period, hence a possible
explanation for its absence in the present study.
The capillary electrophoresis technique used in this study is able to differentiate heterozygous
sickle cell-beta thalassaemia from homozygous SS after infancy.97HbA2 is almost non-existent
in the newborn. Levels rise steadily until the age of one year when normal adult levels are
attained. 20,45 In beta thalassaemia, the levels of HbA2 are higher than the normal levels of
between 2.5 to 3.2% seen after the age of one year.3,104 In the present study, HbA2 levels ranged
between 2.1% and 3.2%.
The observed prevalence for HbAA by age cohorts in this study, as can be seen in Table II,
ranged from 70.6% to 79.5%. This finding is in keeping with other prevalence reports in
Nigeria, which show that normal haemoglobin (HbAA) ranges between 55% to 75%.100Beyond
24 months, the prevalence of HbAA remained relatively constant.

64
The prevalence of HbAS in this study ranged from 17.5% to 29.1%. These values also
correspond with those from other prevalence reports in Nigeria. 27,34-37
The HbAA to HbAS ratio in this study was 3.5-4.1:1 for all the age cohorts. This is in keeping
with previous reports which show that the frequency of the abnormal ‘’S’’ gene in our
population is about 25%.6This finding may merely imply that the gene frequency for HbS has
remained constant over time. The phenomenon of balanced polymorphism explains the high
prevalence of HbS in this study. Children who are HbAS are protected from severe attacks of
malaria than their HbAA counterparts.6 These HbAS individuals survive childhood better and
thus, propagate the ‘’S’’ gene.
The prevalence of HbD trait (HbAD) in this study ranged from 0% to 0.5% among the various
age cohorts. In a study by Adeyemo et al103in Lagos, Western Nigeria involving 180 SCD
patients aged 2 to 15years, a prevalence of 0.6% was documented for HbSD.103 This
haemoglobin variant and its co-inheritance with HbS are very rarely seen in the African
population.103
The prevalence of HbC trait (HbAC) among study subjects ranged from 0% to 0.8%. This
haemoglobin phenotype was documented in all the age group cohorts studied except the 1 to less
than 12month age cohort, with higher prevalence in the newborn. Odunvbun33 in Benin city,
Southern Nigeria, established a newborn prevalence of 1.1% for HbAC, while Fleming27 found
HbAC in 0.7% of infants in Garki, Northern Nigeria and Kaine and Udeozo35 in Eastern Nigeria
established a zero percent prevalence for HbC among underfives. The relatively constant
prevalence of HbC trait in all age groups is noteworthy and buttresses the fact this haemoglobin
phenotype has minimal clinical significance. In addition, like HbS, HbC has been shown to also
provide partial protection against falciparum malaria infection105.
65
HbSS was observed in 1.2% to 3.2% among the various age cohorts in this study. The frequency
was lowest in the newborn and highest at 36 to <48months. Mortality due to SCD is minimal
below the age of six months,27 and the frequencies of haemoglobin phenotypes below the age of
six months reflect the relative frequencies at birth. Thus, in the present study, it is apparent that
2.1% of babies born in the population have SCD. This value is in keeping with
Fleming’s27observation in Northern Nigeria where 2.1% of newborns were found to have SCD.
This observation may be related to the fact that a similar method of haemoglobin phenotype
determination was utilized in both studies, and that both studies were community-based, hence
reflecting the true prevalence of the condition in the population. This value is however, much
lower than was reported by Odunvbunet al33 in Southern Nigeria (3.0%) and Omotade et al74 in
Western Nigeria (4.4%). Odunvbun et al33 found a prevalence of 0.2% for HbSC,while in
Omotade’s study74, HbSC accounted for 1.1% of the SCD cases. HbSC was not documented in
the present study and its absence possibly accounts for the lower prevalence of SCD in the
present study. In addition, the studies by Odunvun et al33 and Omotade et al74 were hospital-
based unlike the present study which was community based, on a randomly selected study
population. Hence, it is likely that this study has given a precise description of the prevalence of
SCD in the various age cohorts of children less than 60months of age in this locality.
For the neonates, the haemoglobin phenotypes identified in this study were HbAA, HbAC,
HbAS and HbSS. This pattern was described by Fleminget al27 in their 1979 study in Kano
State, Northern Nigeria. In the Benin city hospital-based survey by Odunvbun et al33and the
large hospital-based study in Koumasi, Ghana by Ohene-Frempong et al30, a similar pattern of
haemoglobin phenotypes was observed.
Hitherto, there is paucity of data on community-based neonatal surveys. This work therefore,
fills a knowledge gap in providing such information on community-based patterns for the
newborn.These cited studies did not utilize the newer capillary electrophoresis technique for the

66
haemoglobin phenotype determination, though the technique has been available since the early
1990s.
In this study however, the prevalence of the different haemoglobin phenotypes in the newborn
varies from what was found by Odunvbun et al’s hospital-based survey33, in which a much
higher prevalence of SCD (3.0%) was described. This was because they found both HbSS
(2.8%) and HbSC (0.2%). Again, the cited study was hospital-based. In Fleming’s work27 in
1979 in Kano, Northern Nigeria, he found HbSS in 2.1% of newborns and HbAC in 0.7%. The
observed prevalence for HbAC, although similar to the finding of this study, may just be by
chance, as the observed prevalence of HbSS was much lower and the study communities were in
different geographic locations in Nigeria. The observed prevalence of HbSS in this cohort, may
just be due to the fact that this was a real population based survey where there has not been
published population surveys in the newborn.
In this study, 5.1% of the study population manifested with clinical pallor. This finding is in
agreement with those of Omokhodion106 in Ibadan, South Western Nigeria, who documented a
prevalence of 5.5% for pallor among 451 underfive children and Getaneh107 in Ethiopia,
Northern Africa, who found pallor in 5.7% of 628 children aged 6 to 59 months. On the other
hand, Akorede108in Akure, Ondo State and Fabunmi109in a rural community in Oyo State,
observed pallor in 9.3% and 20% of underfive children, respectively. In these studies, pallor was
shown to correlate positively with undernutrition, which was documented in 27.3% and 55% of
the underfive population respectively. In the present study, only 12.2% of the study population
were undernourished, hence, a better nutritional status in the study community may be the
reason for the lower prevalence of pallor observed. As expected, the presence of pallor was
significantly higher among HbSS subjects (p<0.001) than the other haemoglobin phenotypes.
This finding is consistent with those of Ambe et al53 in Maiduguri, North Eastern Nigeria and
Sadarangani et al55 in Kenya, Eastern Africa.

67
Jaundice was observed in 2.3% of the study subjects. It was most prevalent among the newborn
as shown in Table IV. It is expected that within the first week of life, as high as 60% of term
newborns and 80% of preterms will have jaundice.110 The observation of the present study is in
keeping with this expectation as majority of the newborns were recruited in the first week of life.
Of the older subjects with HbSS, 15.6% had jaundice, while only 2.2% of HbAA and 1.4% of
trait individuals presented with this feature. The observed prevalence of jaundice among HbSS
subjects in the present study is in agreement with the findings of Ambe et al53 in Northern
Nigeria, who documented a prevalence of 16.1% for jaundice among 333 sickle cell anaemia
patients at first diagnosis. Lysing of the sickled red blood cell as it passes through the
reticuloendothelial system and blood vessels may explain the chronic haemolytic anaemia and
jaundice seen in this condition.
Of the study population, 1.1% had hepatomegaly, while 4.6% had splenomegaly. This is in
agreement with Omokhodion’s106 finding in Ibadan, Western Nigeria, in which hepatomegaly
and splenomegaly were documented in 1.1% and 4.0% of under-fives respectively. In the
present study, splenomegaly was found in all the age cohorts, with peak prevalence among
children aged 24 to less than 36 months of age while hepatomegaly, which was not found
amongst the newborns, peaked at 36 to less than 48 months of age. The splenic rate in the
present study was lower than that documented by Adeyemo et al111among under-fives in
Erunmu village in Oyo state.This could be attributed to better knowledge of the preventive
measures against malaria and the increased use of antimalarial drugs which are readily available
in the health centres and the General hospital. Hepatomegaly and splenomegaly were
significantly more prevalent (p<0.001 and p<0.05, respectively) among subjects with SCD
compared with the other haemoglobin phenotypes. In a cohort of 125 SCD patients in Kuwait,
Adekile and Najwa112 found hepatomegaly in 15.2% and splenomegaly in 24%, while
Sadaranganiet al55 documented these features in 20% and 33%, respectively, of SCD subjects in

68
Kenya, Eastern Africa. The prevalence of splenomegaly among SCD subjects in the present
study was much lower than in the cited studies, unlike the prevalence of hepatomegaly which
compared favourably with those in the cited studies. A palpable spleen is expected to be an
uncommon finding in SCD because of autosplenectomy that occurs early in life. However, in
several cohorts conducted in sub-Sahara Africa, splenomegaly in SCD has been shown to persist
until late childhood and adolescence, and even into adulthood.113-115This finding has been
attributed to the effects of malaria.113-115The children in Adekile et al’s112 study were aged
between 3 and 16 years, while Sadarangani et al55 studied children 6months to 14 years of age.
In Ibadan, South Western Nigeria, Brown116 documented much higher prevalences of 88.4% and
31.8% respectively for hepatomegaly and splenomegaly among SCD patients. Brown’s study
involved 415 subjects aged 6 months to 17 years. Whether the same finding of splenomegaly
persisting until late childhood and adolescense will be true in this population is as yet,
unknown.In addition, the cited studies,55,112,116 were all hospital-based. Hence, they may have
studied mainly severely affected SCD subjects unlike the present study that was community-
based and identified children who had hitherto not been diagnosed with SCD. The much higher
prevalence of hepatomegaly documented by Brown116may signify a more intense chronic
haemolytic process in that population of SCD patients. Earlier workers had reported chronic
hepatomegaly in SCD patients and some, had singled out this feature as a severity index in
SCD.116-118 The variability in hepatomegaly and splenomegaly may be in consonance with the
diversity of various genetic and environmental factors governing the clinical course of SCD.
One of such factors is the coexistence of alpha thalassaemia which has been noted to reduce
haemolytic rate in SCD.119
Of the study population, 1.7% had gnathopathy, characterized mainly by a prognathic maxilla
and protruding anterior teeth. Of the subjects with SCD, 9.4% exhibited this feature and this was
significantly higher than the observations among other phenotypes (p<0.05). The prevalence of
69
gnathopathy among SCD subjects in the present study washowever, lower than documented by
Oredugba and Savage62 in Lagos, Western Nigeria. The gnathopathy in SCD has been found to
be progressive and more common in those patients with the most severe chronic haemolysis. In
a similar study by Fawehinmi120 in Port Harcourt, Southern Nigeria, features such as
gnathopathy, frontal bossing and depression of the bridge of the nose were observed to be more
prevalent among SCD subjects in the age group 11 to 14 years. Gupte and Suraj121 had earlier
documented that this characteristic facial profile is expected to be more prevalent in the age
group 11 to 14 years. In the present study, gnathopathy was observed in 3 HbSS subjects , one of
whom was in the 36 to less than 48months age group and two of whom were between 48 and
less than 60 months of age as shown in Table V. The lower prevalence of gnathopathy in the
present study compared with the cited studies62,120,121 may thus, be a reflection of the age
incidence of this feature in SCD. However, among the other phenotypes in which gnathopathy
was documented (HbAA,HbAS), it also showed a similar trend of increasing prevalence with
age. This observation is most likely due to the fact that dental development in children is
progressively achieved up until about 36months of age for the primary (deciduous) teeth.122
Bossing of the skull bones and depression of the nasal bridge were each observed in 0.6% of the
study population. 6.3% and 12.5% of HbSS subjects respectively, had these features and their
presence was also significantly higher among HbSS subjects compared with the other
haemoglobin phenotypes (p<0.05 and p<0.001, respectively). George54 in Port Harcourt,
Southern Nigeria, found a prevalence of 13.6% for bossing of the skull bones among SCD
affected subjects. This was a hospital based study involving 169 subjects aged between 6months
and 18 years of age. All the HbSS subjects in the present study who exhibited these features
were over 36 months of age. As earlier stated, the characteristic facial profile in SCD is thought
to be progressive with its highest prevalence in early to middle adolescence,121 hence the lower
prevalence in the present study.
70
Although abnormal clinical findings were more commonly found in HbSS subjects compared
with the other haemoglobin phenotypes, two hundred and thirty eight (238) of one thousand,four
hundred and eight (1,408) (16.9%) study cases who were not SCD affected also had similar
abnormal clinical findings. This emphasizes the value of laboratory evaluation in the diagnosis
of children, since physical findings alone have been found not to be sufficient in the
identification of cases of SCD in early life.
Nutritional status was assessed for study subjects based on their weight-for-age and
height/length-for-age. Z-scores were calculated based on WHO standard growth charts (Tables
VI and VII). Based on the weight-for-age, 86.9% were well nourished. The prevalence of
underweight was 12.2%, while overweight was observed in 0.9%.Based on the height/length-
for-age, 89.1% of the study population were well nourished, while the prevalence of stunting
and tall stature were 10.5% and 0.4%,respectively. The prevalence of normal nutritional status
in this study was much higher than has been documented in earlier reports.34,107-109 Among
underfive children in Akure, Southwestern Nigeria, Akorede and Abiola108 documented
undernutrition in 27.3% and normal nutritional status in 72.7%, while Abhulimhen-Iyoha34 in
Ekosodin community, Edo state, Southern Nigeria, found that 25.2% of the underfive population
were undernourished and 74.8% were well nourished.34,108 Getaneh et al107 in Ethiopia, observed
that 36.5% of the underfive children were undernourished, while 63.5% were well
nourished.107Fabunmi et al109documented undernutrition in as high as 55% of the underfive
children in rural Oyo state, Western Nigeria.These studies were all community-based. The
higher prevalence of normal nutritional state in the present study may be due to the impact of the
CHEWs who have been trained to deliver home-based health services in the communities.123
Their services include dissemination of information and demonstration of exclusive
breastfeeding and appropriate complementary feeding.123Also, perhaps, because the major

71
occupation in the LGA is farming, this may have a direct and positive impact on household food
security.
Based on the weight for age and the height/length for age, there was no significant difference in
the nutritional status among the various haemoglobin phenotypes (p>0.05). These finding
contrast with those of Oyedeji65, Ebomoyiet al64 and Kaine and Udeozo35, who demonstrated
significantly lower mean values for weight and height for SCD subjects when compared with
controls. These studies were all hospital-based, utilizing hospital cohorts of SCD subjects,
differing from the present study that assessed previously undiagnosed SCD subjects.The severity
of the disease in these subjects may have strongly impacted on their nutritional status unlike the
undiagnosed subjects whose manifestation of the disease still seemed as yet, mild. Oredugba and
Savage62 on the other hand, found no significant difference in the mean weights and heights of
SCD subjects aged under-five years compared with controls in a hospital-based study. In that
study, both SCD subjects and controls were from the lower socio-economic class which might
have attributed to the similarity in their anthropometric values.In the present study, the better
nutritional status of SCD subjects may be as a result of the generally better nutritional status of
the under-five population.
A 2009 study in England by Chawla et al124 examined the weight statusamong 675 children and
adolescents (2 to 19 years) with SCD, 60% of whom had HbSS disease and 26% HbSC disease.
Based on their body mass index percentiles, 22.4% were overweight or obese, while 6.7% of the
subjects were underweight of whom three quarters had HbSS or HbSβ°. Perhaps, because SCD
has historically been associated with growth delay or failure, therefore, children with SCD and
their families are counseled about the need for increased energy intake to prevent growth
problems, including underweight.124 As more children with SCD mimic the lifestyle of their
non-SCD peers, they may thus, experience similar trends of normal weight because of increased

72
caloric intake, and of increased weight because of the imbalance between energy intake and
expenditure.

73
CONCLUSIONS
1. Five haemoglobin phenotypes were identified in this study with HbAA being the most
common, followed by HbAS, HbSS, HbAC and HbAD.
2. In the newborn, four phenotypes were described and these included HbAA, HbAS,
HbSS, HbAC in decreasing order of frequency.
3. A fifth phenotype,HbAD, hithero unpublished,was documented in a 36month old child.
4. The clinical signs were more prevalent among HbSS subjects than among those who had
other haemoglobin phenotypes.
5. There was no difference in the nutritional status among study subjects regardless
of their haemoglobin phenotype.

74
RECOMMENDATIONS
Based on the findings of this study, it is recommended that:
1. Newborn screening for SCD and screening of all under-five children at any contact with
a healthcare facility be routinely conducted in all the nation’s health facilities.
2. Dedicated SCD centers should be established nationwide where access to follow up care
and target comprehensive care can be assessed following the newborn screening
program.
3. The Primary Health Centers and CHEWs should be empowered through appropriate
health education and training to administer prompt and appropriate primary care and
counselling to the SCD affected child, and refer to the appropriate specialist/center.
4. Growth monitoring and nutritional support be promoted within the comprehensive care
program for SCD.

75
LIMITATIONS
At the time of commencement of this study, there was no center in Nigeria equipped with
facilities for newborn/early infancy haemoglobin phenotype determination. Consequently, the
study was conducted with the support of a laboratory outside the country. This could probably
explain why Bart’s haemoglobin was not seen, being a gamma tetramer present in small
amounts in newborns. Its detection in large amounts would suggest the presence of alpha
thalassaemia. Bart’s haemoglobin denatures easily and thus cannot be detected by the methods
used for this study after the blood sample has been stored for more than two weeks.

76
LINES OF FUTURE RESEARCH
A Study:
1. Of the outcome of morbidity and mortality in early childhood following newborn
screening and early initiation of comprehensive health care in an African setting.
2. To determine the presence of other forms of haemoglobin in the newborn.
3. To compare the growth pattern of early diagnosed infants in a comprehensive health care
program to those diagnosed outside the newborn period and not enrolled in a
comprehensive health care program.
77
REFERENCES
1. Ashutosh L and Elliot V. Sickle cell disease. In: Hoffbrand AV Postgraduate
Haematology 5th Edition, 2005;85:104-106.
2. Weatherall DJ: Inherited Disorders of Haemoglobin. In Disease Control Priorities In
Developing Countries.2005.www.ncbi.nim.nih.gov/books/NBK11727. 2nd Edition
(Washington DC); chapter 38:663-680.
3. Ohls RK. Diseases of the Blood. In: Behrman.R.E, Kliegman.R.M, Jenson.H.B. editors
Nelson Textbook of Paediatrics, 18th Edition, W.B. Saunders International Edition;
2007:1396
4. Awasthy N, Aggarwal KC, Goyal PC, Parsad MS, Saluja S, Sharma M (2008). ‘’Sickle
cell disease: Experience of a tertiary care center in a nonendemic area’’. Annals of
Tropical Medicine and Public Health I(II):1-4doi:10.4103/1755-6783.43069
5. WHO ‘’Sickle-cell anaemia-Report by the Secretariat’’. 2010-11-27
6. Akinyanju O. The National Burden Of Sickle Cell Anaemia And The Way Forward:2-
18. Sicklecellfoundation.com/Nat%20Burden%20SCD.pdf. 2010
7. Gordon C. Manson’s Tropical Diseases W.B. Saunders 20th edition 118-134.
8. Nagel RL and Fleming AF.Genetic epidemiology of the beta S gene.Bailliere’s Clinical
Haematology 1992; 5:331-365.
9. Bainbridge R, Higgs DR, Maude GH, and Sergeant GR. Clinical presentation of
homozygous sickle cell disease. J Pediatr 1985;106:881-885.
10. Williams S, Maude GH, and Sergeant GR. Clinical presentation of sickle cell-
haemoglobin C disease. J Pediatr 1986;109:586-589.

78
11. 0’Brien RT, McIntosh S, Aspnes GT, Pearson HA.Prospective study of sickle cell
disease in infancy. J Pediatr 1976;89:205-210.
12. Leikin SJ, Gallagher D, Kinney TR, Klug P et al. Mortality in children and adolescents
with sickle cell disease. 1989;84:500-508.
13. Rogers DW, Clark JM, Cupidore L, Ramlal AM et al. Early deaths in Jamaican children
with sickle cell disease. BMJ 1978;1:1515-1516.
14. Makani J, Cox S, Soka D, et al. Mortality in sickle cell anaemia in Africa: a prospective
cohort study in Tanzania. PLoS ONE 2011;6:e14699.
15. Nigeria Demographic and Health Survey 2013. www.population.gov.ng/.../2013-nigeria-
demographic-and-health-survey
16. Meredith M, Victoria V, Charlotte C, Jenesse M. Promoting Healthy Public Policy
through Community Based Participatory Research: Ten Case Studies. 2006:7-68.
www.depts.washington.edu/CBPR_final.pdf
17. World Health Organisation Media Centre Fact Sheet no 178. Children: reducing
mortality. Sept,2012. www.who.int/mediacentre/fs178/
18. The Leadership Newspaper Editorial. Nigeria Ranks First In Sickle Cell Disease Burden
Worldwide With 40m Cases.November 28, 2014, page 14. Abuja, Nigeria.
19. Rahimy M, Gangbo A, Ahouignan G, Adjou R, Deguenon C, Goussanou S et al. Effect
of a comprehensive clinical care program on disease course in severely ill children with
sickle cell anaemia in a sub-Saharan African setting. Blood 2003;102:834-838

79
20. Sadarangani M, Makani J, Komba A, Ajala-Agbo T, Newton C, Marsh K, et al. An
observational study of children with sickle cell disease in Kilifi, Kenya. Br J Haematol,
2009;146:675-682.
21. Diagne I, Ndiaye O, Moreira C, Signate-Sy H, Camara B, Diouf S, et al. Sickle cell
disease in children in Dakar, Senegal. Archives de Pediatr,2000;7:16-24.
22. Eman A, Hiba A, Sana A. Haemoglobin patterns in patients with sickle cell
haemoglobinopathies. Int J Hematol Dis.2014;1:8-11.
23. Balgir RS, Sharma SK. Distribution of sickle cell haemoglobin in India. Ind J Hematol
1988;6:1-14.
24. Konote-Ahulu FID. The Sickle Cell Disease Patient. London and Basingstoke:
Macmillan Press; 1992;1-145.
25. Lehmann H, and Nwokolo C. The River Niger as a barrier to the spread eastwards of
haemoglobin C: A survey of haemoglobins in the Ibo. Nature (Lond) 1959; 4675:1587-
1588.
26. Usanga E, Andy J, Ekanem A, Udoh E, Udoh A. Haemoglobin C gene in south eastern
Nigeria. East Afr Med J. 1996;73:566-7.
27. Fleming AF, Storey J, Molineaux L, Iroko EA. Abnormal haemoglobins in the Sudan
Savannah of Nigeria. Brit J. Haematol.1979; 73: 161-172.
28. Ballardini E, Tarocco A, Marsella M. Universal neonatal screening for sickle cell disease
and other haemoglobinopathies in Ferrara, Italy. Blood Transfus 2013,11:245-249.
29. Allison S, Mary C, Melanie D. Implementation of the newborn screening programme for
sickle cell disease in England: results for 2003-2005. J Med Screen 2008;15:9-13.

80
30. Ohene-Frempong K, Oduro J, Tetteh H, Nkrumah F. Screening newborns for sickle cell
disease in Ghana. Pediatrics. 2008; 121:S120-S121.
31. Tshilolo L, Aissi L, Lukasa D. Neonatal screening for sickle cell anaemia in the
Democratic Republic of Congo: experience from a pioneer project on 31,204 newborns.
J Clin Pathol. 2009;62:35-38.
32. McGunn P, Ferris M, Macosso P,de Oliveira V, Ramamurthy U. A prospective pilot
newborn screening and treatment program for sickle cell anaemia in the Republic of
Angola.Blood. 2012;120:48-52.
33. Odunvbun M, Okolo A, Rahimy C. Newborn screening for sickle cell disease in a
Nigerian hospital. Public Health. 2008;122:1111-1116.
34. Abhulimhen-Iyoha B, Odunvbun M, Okolo A. Haemoglobin electrophoresis in under-
fives of Ekosodin Community, Edo State, Nigeria. S M J. 2011;14:179-185.
35. Kaine WN, and Udeozo IOK. Incidence of sickle cell trait and anaemia in Ibo Preschool
children. Niger. J Pediatr.1981;8:87-89.
36. Adewuyi J and Akintunde E. Survey of haemoglobin genotypes in children at Ilorin. Nig
J Pediatr.1990; 17:23-26.
37. Ogunkunle O, Odutola A, Orimadegun A. Pattern of blood pressure in apparently healthy
Nigerian children aged 1-5 years. Niger J Pediatr. 2007;34:14-23.
38. Amoako N. The Effects Of Haemoglobinopathies And G6PD Deficiency On Malaria
Among Children Of The Kintampo North Municipality Of Ghana. 2004:1-
13.www.indepth.network.org/AGM%/202010/Presentations/day2/parallel7/

81
39. Sergeant GR. Sickle Cell Disease. Oxford, England: Oxford university Press Oxford;
1985:1-289.
40. Soyinka W. ‘’Abiku’’ in : A Selection of African Poetry, Senanu KE, Vincent T. New
edition Longman 1990, pg 189,205.
41. Herrick JB: Peculiar elongated and sickle-shaped red blood corpuscles in a case of severe
anaemia. Arch Intern Med 1910;6:517-521.
42. Mason VR: Sickle cell anaemia. JAMA 1922; 79:1318-1320.
43. Sergeant GR, Sergeant BE, Forbes M, and Willliams LL. Haemoglobin gene frequencies
in the Jamaican population: a study in 100,000 newborns. Br J Haematol 1986; 64:253-
262.
44. Sergeant BE, Forbes M, Williams LL, and Sergeant GR. Screening cord bloods for
detection of sickle cell disease in Jamaica. Clin Chem 1974; 20:666-669.
45. Rahimy M, Ahouignan G, Gangbo A, Akpona S. Newborn screening for sickle cell
disease; Five years experience in Cotonou. Arch Fr Ped 1999;6:343-344.
46. Porter F and Thurman E. Studies of Sickle Cell Disease: Diagnosis in infancy. ADJC
1963; 106:35-42.
47. Lambotte-Legrand J, Lambotte-Legrand C. Le prognostic de l’anemie drepanocytaire an
Congo Belge (a propos de 300 cas et de 150 deces). Ann. Soc. Belge. Med. Trop;
1955:35:53-57. (in French)
48. Makani J, Cox S, Soka D, Komba A ,Oruo J, et al. Mortality in sickle cell anaemia in
Africa: A prospective cohort study in Tanzania. 2011. PLos ONE
6(2):e14699.doi:10.1371/journal.pone.0014699.
49. Akinyanju O, Otaigbe A, Ibidapo M. Outcome of holistic care in Nigerian patients with
sickle cell anaemia. Clinical and Laboratory Haematology. 2005;27:195-199.

82
50. Quinn C, Zora R, George B. Survival of children with sickle cell disease. Blood.
2004;103:4023-4027.
51. Konote-Ahulu FID. Effect of environment on sickle cell disease in West Africa:
epidemiological and clinical considerations. In: Abramson H, Bertles JF, Weather D,
eds. Symposium on Sickle Cell Diseases: Diagnosis, Management, Education and
Research. St. Louis: CV Mosby Co; 1973:20-38.
52. Olaniyi J and Abjah U. Frequency of hepatomegaly and splenomegaly in Nigerian
patients with sickle cell disease. WAJM 2007; 26(4):274-277.
53. Ambe J, Mava Y, Chama R, Farouq G, Machoko Y. Clinical features of sickle cell
anaemia in Northern Nigerian children. WAJM 2012;31:81-85.
54. George I and Opara P. Sickle cell anaemia: A survey of associated morbidities in
Nigerian children. Afr J Haematol Oncol 2011;2:187-190.
55. Sadarangani M, Makani J, Komba A, Ajala-Agbo T, Newton C, Marsh K, et al. An
observational study of children with sickle cell disease in Kilifi, Kenya. Br J
Haematol.2009.146:675-82.
56. Swankar K, Kale A, Lakhkar B. Clinico-Epidemiological and Hematological profile of
sickle cell anemia with special reference to penicillin prophylaxis in a rural hospital of
central India. Int J Epidemiol. 2010;9:25-29.
57. Nandanwar A and Kamdi Y. ‘’Sickle cell disease affects physical growth’’. Int J Pharm
Bio Sci 2013;4:784-789.
58. Lesi FEA. Anthropometric status of sickle cell anaemia patients in Lagos, Nigeria. Nig
Med J. 1979;9:337-342.
59. Oguntoye A. Anthropometric status of sickle cell disease.Community Health
Dissertation, MBBS Degree, University of Lagos. 1981.

83
60. McCormack M, Dicker L, Katz S. Growth pattern of children with sickle cell disease.
Hum Biol 1976;48:429-437.
61. Ohene-Frempong K, Steinberg M. Clinical aspects of sickle cell anaemia in adults and
children. In Steinberg M, Forget B, Higgs D, Nagel R, editors, Disorders of Hemoglobin,
1st Ed. USA: Cambridge University Press;2001.
62. Oredugba F and Savage K. Anthropometric findings in Nigerian children with sickle cell
disease. Pediatr Dent 2002;24:321-325.
63. Mukherjee M, Gangakhedkar R. Physical growth of children with sickle cell disease.
Indian J Hum Genet 2004; 10:70-72.
64. Ebomoyi E, Adedoyin M, Ogunlesi F. A comparative study of the growth status of
children with and without SS disease at Ilorin, Kwara State, Nigeria. Afr J Med Sci
1989;18:69-74.
65. Oyedeji G. The health, growth and educational performance of sickle cell disease
children. East Afr Med J 1991; 68:181-189.
66. Caruso-Nicoletti M, Mancuso M, Spadaro G, Samperi P, Consalvo C, Schiliro G.
Growth and development in white patients with sickle cell diseases. Am J Pediatr
Hematol Oncol 1992; 14:285-288.
67. Mann J. Sickle cell haemoglobinopathies in England. Arch Dis Child 1981; 56:676-683.
68. Stevens M, Hayes R, Sergeant G. Body shape in young children with homozygous sickle
cell disease. Pediatrics 1983; 71:610-614.
69. Whitby LJ: Screening for disease. Definitions and criteria. Lancet 1974;ii:819-821.

84
70. Griffiths PD, Mann JR, Darbyshire PJ, Green A. Evaluation of eight and half years of
neonatal screening for haemoglobinopathies in Birmingham. BMJ 1988; 296:1583-1585.
71. Consensus conference. Newborn screening for sickle cell disease and other
haemoglobinopathies. JAMA 1987;258:1205-1209.
72. Committee on Genetics, American Academy of Paediatrics: Issues in Newborn
screening. Pediatrics 1992; 89:345-351.
73. Ohene-Frempong K. Selected testing of newborns for sickle cell disease. Pediatrics
1989; 83:879-880.
74. Omotade O, Kayode C, Falade S, Ikpeme S et al. Routine screening for sickle cell
haemoglobinopathy by electrophoresis in an infant welfare clinic. WAJM 1998;17:92-
94.
75. Galacteros F, Kleman K, Caburi-Martin J, Beuzard Y. Core blood screening for
haemoglobin abnormalities by thin layer isoelectric focusing. Blood 1980; 56:1068-
1071.
76. Basset P, Beuzard Y, Garel MC and Rosa J: Iso-electrofocusing of human haemoglobin:
It’s application to screening, to the characterization of 70 variants, and to the study of
modified fractions of normal haemoglobins. Blood 1978; 51:971-977.
77. Arad Y, Mayer T, Arvan D. Isoelectric focusing of haemoglobins on thin layer agarose.
AM J Pathol 1981; 76:200-205.
78. NHS antenatal anf neonatal newborn screening programmes. http://www.kcl-
phs.org.uk/haemscreening/
79. Nussbaum RL, Powell C, Graham HL, Caskey CT. Newborn screening for sickling
haemoglobinopathies. Houston 1976 to 1980. AJDC 1984; 138:44-48.
80. Vichinsky E, Hurt D, Earles A, Kleman K. Newborn screening for sickle cell disease:
Effect on mortality. Pediatric 1988; 81:749-755.

85
81. Armbruster DA. Neonatal hemoglobinopathy screening. Lab Med 1990; 21:815-822.
82. Grover R, Wethers D, Shahidi S, Fisher B. Evaluation of the expanded newborn
screening program in New York City. Pediatrics 1978; 61:740-749.
83. Powers DP. Diagnosis at birth improves survival of children with sickle cell anaemia.
Pediatrics 1988; 81:749-755.
84. Grover R. Program effects on decreasing morbidity and mortality. Newborn screening in
New York City.Pediatrics 1989; 83:819-822.
85. Grover R, Newman S, Wethers D, Anyane-Yeboa K et al. Newborn screening for
haemoglobinopathies: The benefit beyond the target. AJPH 1986; 76: 1236-1237.
86. Githens JH, Lane PA, McCurdy RS, Houston ML et al. Newborn screening for
haemoglobinopathies in Colorado: the first ten years. AMJ Dis Child 1990: 144:466-470.
87. Vichinsky EP. Comprehensive health care in sickle cell disease: Its impact on morbidity
and mortality. Semin Haematol.1991; 28:220-226.
88. Pearson H. A neonatal program for sickle cell disease.Adv Pediatr 1986; 33:381-385.
89. Scott RB, Harrison DL. Screening of the umbilical cord blood for sickle cell disease:
Utilization and implementation. Am J Pediatr Haematol Oncol 1982; 4:202-205.
90. El Mouzan MI, AI Awamy BH, Al Torki MT, Niazi GA. Variability of sickle cell
disease in the Eastern province of Saudi Arabia. J Pediatr 1989; 114:973-976.
91. Baffoe-Bonnie B, Akoko O, Twumasi P, Ohene-Frempong K, Nkrumah F. Sickle Cell
Disease in the first century. Congress: Sept.15-20,1997, Grand Hyatt Washington
Abstract pg 175.
92. Daland GA and Castle WB: A simple and rapid method for demonstrating sickling of the
red blood cells: The use of reducing agents. J Lab Clin Med 1948; 33:1082-1088.

86
93. Mantikou E, Harteveld CL, Giordano PC. Newborn screening for haemoglobinopathies
using capillary electrophoresis technology: Testing the Capillarys Neonat Fast Hb
Device. Clin Biochem 2010; 43:1345-1350.
94. Powers DP, Schroeder WA, White L: Rapid diagnosis of sickle cell disease at birth by
micro-column chromatography. Pediatrics 1975; 55:630-635.
95. Adewuyi JO, Olatunji PO, Akintunde EA. An Abnormal Alpha-Globin Gene Hb G-
Philadelphia occurring with the Beta-Globin Gene HbC in two familes of Kwara State,
Nigeria. Niger Postgrad Med J 1997;4:10-13.
96. WHO 1995. Physical status: The Use and interpretation of anthropometry. Report of a
WHO expert committee, Technical report series, No 854. Geneva: WHO.
97. Henri W. Insights on the diagnosis of haemoglobin disorders. 2nd European
Haemoglobinopathy Forum. 2011.
98. Oyedeji GA. Socioeconomic and cultural background of hospitalized children in Ilesa.
Nig J Paediatr 1985; 12:111-117.
99. Laboratoire de Biochimie Genetique Hopital Robert Debre-Paris.Isoelectrofocalisation
sur gel d’agarose. 1992.
100. Umoh A, Abah G, Ekanem T, Essien E. Haemoglobin Genotypes: A prevalence study
and implications for reproductive health in Uyo, Nigeria. Nig J Med 2010 ;19:36-41.
101. National Screening Committee. Second Report of the UK National Screening
Committee. London: Department of Health, 2000.
102. Facer D, Harrison J, Osei C, Bajuga A. Screening an underfive population in The
Gambia for sickle cell disease. Mediterr J Hematol Infect Dis.2013; 5:24-26.
103. Adeyemo T, Oyesola O, Oyetunji A. Evaluation of high performance liquid
chromatography (HPLC) pattern and prevalence of beta-thalassaemia trait among sickle
cell disease patients in Lagos, Nigeria. Pan Afr Med J. 2014; 18:71-88.

87
104. Kim HC. Laboratory Identification of Inherited Haemoglobinopathies in Children. Clin
Pediatr.1981; 20:161-171.
105. Piel F, Patil A, Howes R. Global distribution of the sickle cell gene and geographical
confirmation of the malaria hypothesis. Nat Commun 2010;1:104.
106. Omokhodion F, Oyemade A, Sridhar M. Morbidity pattern among under-five children of
market women in Ibadan. Niger. J Pediatr.2003; 30:135-139.
107. Getanah T, Afework A, Zerihun T. Anemia in under-five children living in Jimma town.
Ethiop J Hlth Sci. 1998,8:23-28.
108. Akorede Q and Abiola O. Assessment of nutritional status of under five children in
Akure South Local Government, Ondo State, Nigeria. IJRRAS 2013; 14:671-681.
109. Fabunmi T, Onabanjo O, Oguntona E, Keshinro O, Onabanjo J, Obanla O, Oyawoye O.
Nutrient intakes and nutritional status of mothers and their under-five children in a rural
community of Oyo State, Nigeria. International Journal of Child Health and Nutrition,
2013;2:39-49.
110. Piazza A and Stoll B. Digestive system disorders. In: Behrman RE, Kliegman RM, Arvin
AM. Nelson Textbook of Pediatrics 18th Edition, W.B. Saunders International Edition,
2008; 753-766.
111. Adeyemo A, Olumese P, Amodu O, Gbadegesin R. Correlates of hepatomegaly and
splenomegaly among healthy school children in a malaria-endemic village. Nig J Pediatr.
1999; 26:1-3.
112. Adekile A, Najwa A. Ten-year review of hospital admissions among children with sickle
cell disease in Kuwait. Med Princ and Pract.2008; 17:404-8.
113. Esan G. The clinical spectrum of sickle cell disease in Nigerian adults. INSERM,44 43.

88
114. Adekile A, McKie K, Adeodu O, Sulzer A, Liu J, McKie V, et al. Spleen in sickle cell
anaemia: comparative studies of Nigerian and U.S. Patients. American Journal of
Haematology. 1993;42:316-321.
115. Thiulliez V and Vierin Y. The importance of sickle cell anaemia in a pediatric
environment in Gabon. Sante Publique. 1997; 9:45-60.
116. Brown B, Fatunde O, Sodeinde O. Correlates of steady-state haematocrit and
hepatosplenomegaly in children with sickle cell disease in Western Nigeria. West Afr J
Med 2012; 31:86-91.
117. Akinyanju O: Profile of sickle cell disease in Nigeria. Annals of New York Academy of
Sciences 1989; 565:126-136.
118. Kotila T and Shokunbi W. Survival advantage in females with sickle cell anaemia. East
Afr Med Journal. 2001;78:33-35.
119. De Ceulaer K, Higgs D, Weatherall D, Hayes R, Serjeant B, Serjeant G. Alpha
thalassaemia reduces the haemolytic rate in homozygous sickle cell disease. N Engl J
Med 1983; 309:189-190.
120. Fawehinmi H and Ligha A. Canthal and cephalic indexes of children with homozygous
sickle cell disease in Port Harcourt.Niger J Med 2011; 20:33-8.
121. Gupta S. Paediatric haematology. The short textbook of paediatrics, 9thed. New Delhi,
India: Jaypee Brothers Medical Publishers (P) Ltd; 2001.
122. Keane V. Assessment of growth. In: Behrman.R.E, Kliegman.R.M, Jenson.H.B. editors
Nelson Textbook of Paediatrics, 18th Edition, W.B. Saunders International Edition;2007:
73.
123. Okolo A, Diakparomre M, Oyibo I, Nwajei G. Impact of a community outreach
programme on attendance rate at a rural health centre in Nigeria, West Africa. Arch Dis
Child 2012;97:A69

89
124. Chawla A, Sprinz P, Welch J, Heeney M, Usmani G, et al. ‘’Weight status of children
with sickle cell disease’’. 2013. Pediatric Publications and Presentations. Paper
26.http://escholarship.umassmed.edu/peds-pp/26

90
APPENDIX I
Map of distribution of SCD

91
APPENDIX II
SURVEY INSTRUMENT: THE QUESTIONNAIRE
CHILD’S DATA:
1. NAME
2. AGE in months
3. SEX
4. PREVIOUS BLOOD TRANSFUSION YES/NO
5. IF YES, NUMBER OF TIMES AND DATE OF MOST RECENT
TRANSFUSION
6. YELLOW EYES IN THE PAST OR PRESENT YES/NO
7. PAINFUL HAND AND FOOT SWELLING IN THE PAST OR PRESENT
YES/NO
8. DATE OF BLOOD COLLECTION
PHYSICAL EXAMINATION:
SIGNIFICANT CLINICAL FINDING: INDICATE THE PRESENCE OR
ABSENCE OF THE FOLLOWING
SIGNS.
PALLOR
JAUNDICE
BOSSING OF SKULL BONES
GNATHOPATHY
FLATTENED NASAL BRIDGE
HEPATOMEGALY
SPLENOMEGALY
ANTHROPOMETRY:
HEIGHT/LENGTH in cm
WEIGHT in kg
MID UPPER ARM CIRCUMFERENCE in cm

92
PARENT’S DATA:
1. PARENT’S/GUARDIAN’S HOME ADDRESS
2. PARENT’S/GUARDIAN’S PHONE NUMBER:
3. NAME
4. AGE in years
5. SEX Male ( ) Female ( )
6. MARITAL STATUS
Single ( )
Married ( )
Cohabiting ( )
Divorced/Separated ( )
Widow/Widower ( )
7. EDUCATIONAL LEVEL
No formal education ( )
Primary ( )
Secondary ( )
Tertiary ( )
8. OCCUPATION
9. EDUCATIONAL LEVEL OF SPOUSE
No formal education ( )
Primary ( )
Secondary ( )
Tertiay ( )
10. OCCUPATION OF SPOUSE
11. AGE AND CAUSE OF DEATH OF ANY CHILD/CHILDREN
12. HAVE YOU HEARD OF GENOTYPE TEST IN THE PAST?
YES/NO
13. WHAT IS YOUR GENOTYPE?

93
APPENDIX III
STATEMENT OF INFORMED CONSENT
I am Dr.Gloria.Nwajei of the children’s department of DELSUTH, Oghara. I have come
to tell you about the work I want to start.
I plan to test your children so that I can find out whether they have got some special
things in their blood that can cause frequent sickness. What I am checking for in their
blood is called sickle cell disease. If I find that they have this thing in their blood, I will
begin to look after them in time so that they don’t develop any serious sickness .
To check the blood, I will have to take a small amount of blood from the foot or hand of
the child, and I will still check his body. The children may be afraid or cry from pain when I
am taking the blood, but outside this, it will not cause any problem.
I will give you the result of this test after 1 or 2 weeks, so I will need your address
and telephone number to call you when the result is ready. When I give you the result, I
will discuss the matter again with you.
If you know the type of blood your child has, then you will be able to look after the
child properly.
If you agree to have your child in this group that I will check, then you will sign this
paper for me so that I will include your child. Even where you don,t agree, I can still check
your child’s body, as the child will benefit from this check up , and you may like to know
the state of your child’s health.
I,…………………………………………………………………., give consent for my
child/ward,……………………………………,
to participate in this research work.
Signature:…………………………………………
Date:…………………………………………………

94
APPENDIX IV

95
APPENDIX V

96
APPENDIX VI
CAPILLARY ELECTROPHORESIS MACHINE SHOWING RESULTS

97
APPENDIX VII
RESULT OF THIN LAYER ISOELECTROFOCUSING

98
APPENDIX VIII
EXAMINING A CHILD AT THE HEALTH CENTRE IN JESSE 1

99
APPENDIX IX
CHILDREN AT THE HEALTH CENTRE FOR THE SCREENING PROCEDURE

100
APPENDIX X
STUDYING RESULTS OF ISOELECTROFOCUSING WITH THE LABORATORY
TECHNICIANS AT THE RESEARCH LAB IN COTONOU

101
APPENDIX XI
MOTHERS AND CHILDREN AT THE HEALTH CENTRE FOR THE
SCREENING PROCEDURE


![Raised Haemoglobin F (HbF) Level in Haemoglobinopathies ... · Haemoglobinopathies are the worldwide prevalent monogenic genetic disorders with variable geographic distribution [1]-[5].Although](https://img.dokumen.tips/doc/110x75/5f1b8427d7f40f077a680f2a/raised-haemoglobin-f-hbf-level-in-haemoglobinopathies-haemoglobinopathies.jpg)