Embed Size (px)
Citation preview

DOEtiC/14938-15Distribution Category UC-122
Advanced Reservoir Characterization in the Antelope Shale to Establish the Viability of COZEnhanced Oil Recovery in California’s Monterey Formation Siliceous Shales
.
ByPasquale R. Perri, John Cooney, Bill Fong, Dale Jukmder, Aleks Marasigan, Mike More%
Deborah Piceno andBill Stone, Chevron U.S.A. Production Co. ‘
Mark Emanuele and Jon Sheffield, Chevron Petroleum Technology Co.Jeff Wells and Bill Westbroo~ Chevron Research and Technology Co.
Karl Karnes, Core Labora~oriesMatt Pearson and Stuart Heisler, T.J. Cross Engineers, Inc.
April 2000 “
Work Perfor&ed Under Contract No DE-FC22-95BC14938
Prepared forU.S. Department of Energy
Assistant Secretary for Fossil Energy
Gary D. Walker, Project ManagerNational Petroleum Technology Office
P.O. BOX3628Tuls~ OK 74101
Prepared byChevron USA Production Company
5001 California Avenue. Bakersfield, CA 93309
I
I
:
1
I
I
I
I
,1
I, ., ,. . ...- Tm.y. ,, , , ., ,. . . . .m,-~r,.?-..rz-...z-s -- -. 7-- .-.-.---=7.s.— z --=--- . - .’==fl=
, .- ——.=

.,_.— ____ .,-: —. . . ..~—.- —. —“-.--L- ., ___—.
.
DISCLAIMER
This report was prepared as an account of work sponsoredby an agency of the United States Government. Neitherthe United States Government nor any agency thereof, norany of their employees, make any warranty, express orimplied, or assumes any legal liability or responsibility forthe accuracy, completeness, or usefulness of any
information, apparatus, product, or process disclosed, orrepresents that its use would not infringe privately ownedrights. Reference herein to any specific commercialproduct, process, or service by trade name, trademark,manufacturer, or otherwise does not necessarily constituteor imply its endorsement, recommendation, or favoring bythe United States Government or any agency thereof. Theviews and opinions of authors expressed herein do notnecessarily state or reflect those of the United StatesGovernment or any agency thereof.
..—

\
I
}
I
i
DISCLAIMER
Portions of this document may be illegiblein electronic image products. Images areproduced from the best available originaldocument.
,I
1

List of FiguresList of Tables
TABLE OF CONTENTS
...................................................................................................................... v....................................................................................................................... ix
Abstract ................................................................................................................................ xis Acknowledgments ................................................................................................................xvii
o EXECUTIVE SUMMARY...
............................................................................................... Xlll
SECTION 1. PRESENT SITUATION ............................................................................ 1
1.1 Geology ................................................................................................................... 3“1.2 Lost.Hills Current Development ............................................................................. 21
SECTION 2. PROPOSAL ................................................................................................ 272.12.22.32.42.52.62.72.82.9
C02 Pilot Location ................................................................................................ 29C02 Infectivity Test and Results ........................................................................... 30C02 Pilot Earth Model .......................................................................................... 37C02 Simulation Model ........................................................................................... 41Pilot Design ........................................................................................................... 47Drilling and Completion ....................................................................................... 50Pilot Facilities ....................................................................................................... 51Pilot Schedule ....................................................................................................... 52
Facility Alternatives ............................................................................................... 53
, 2.10 DOE Funding Plan and Expenditures ................................................................... 532.11 COZSources .......................................................................................................... 552.12 Field Operation Strategy ....................................................................................... 572.13 Pilot Monitoring and Surveillance ........................................................................ 59
SECTION 3. TECHNOLOGY TIWUWN?ER .................................................................. .613.1 Technology Transfer Completed to Date .............................................................. 63
Appendix A-Reservoir Fluid Study ......................................................................... 69
Appendix B-Average Reservoir Properties ............................................................. 89
Appendix C -.Revised DOE Funding Plan “................................................................ 93
. . .Ill

._ —.’.——— —. ... ______ .._ —- , - —. . . .. . . .

LIST OF FIG”iJRES,,,
Figure ES-1.
Figure 1.1-1.
Figure 1.1-2.
Figure 1.1-3.
Figure 1.1-4.
Fi~e 1.1-5.
Figure 1.1-6.
Figure 1.1-7.
Figure 1.1-8.
Figure 1.1-9.
Figure 1.1-10.
Figure 1.1-11.
Figure 1.1-12.
Figure 1.1-13.
Comparison of various IOR processes at Lost Hills ‘. .................................. xiv
Location map of major oil fields in the southern
San Joaquin Valley. Lost Hills Field is highlighted . ................................. 8 . “
Productive limits of Belridge Diatomite follows irend
of southeast plunge of the Lost Hills Anticline . ......................................... 8 1,Lost Hills stratigraphic column ................................................................... 9 5Lost Hills top Belridge Diatomite structure map.
Contour interval 200 feet 10 :. ...........................................................................
Generalized cross section along southeast plunge
on Lost Hills. The Belridge Diatomite is the objective).
of the COZpilot project . .............................................................................. 11SEM photomicrographs of opal-A fiustule starting to
convert to opal-CT (left), and frustule converted toi,I
opal-CT (right). 1,300X magnification 12. ......................................................
Opal-A fi-ustule i&iating conversion to opal-CT (left), .
and a fkustule afler its conversion to opal-CT.
SEM photomicrographs, 10,OOOXmagnification . ...................................... 12Lost Hills C02 pilot base map. Structure contours on FF Point. ............... 13
Cross Setions through pilot area COZinjection will
be in the FF through L interval 14. ..................................................................
Cross sectioh of porosity, air permeability, and oil
saturation of the C Point to Upper Brown Shale interval.I
The view is SW-NE and the length is extends across
4 patterns (including two in the pilot project). The proposed
injection interval, FF md L, is highlighted. This is the15 ,
same interval as the waterflood ...................................................................
Type log (12-8D) of Belridge Diatomite in the
Lost Hills pilot location. 12-SD was used for infectivity test. ...................16
S1abbed core of laminated diatomite (left), and
bioturbated sandy diatomite (right) ............................................................. 17Thin section photomicrographs of a “clean” diatomite
fi-omthe J Unit (left; 200X) and a “sandy diatomite from
the GG Unit (right; 40X, unpolarized and polarized light).
The J unit thin section shows diatoms and porosity in blue.
The GG Unit shows “blotchy” sand ~d porosity due to bioturbation. ......17
v
..? — . . ..—— —-. -- —.. —.. .,,. .———.. ———.—.. -—

— ~ ——— , - . ————AL . .—._.. . . ..-:— —.
Figure 1.1-14.
Figure 1.1-15.
Figure 1.1-16.
Figure 1.2-1.Figure 1.2-2.
Figure 1.2-3.
Figure 1.2-4.
Figure 1.2-5.
Figure 1.2-6.
Figure 1.2-7.
Figure 2.1-l.
Fig,ue 2.1-2.
Figure 2.2-1.
Figure 2.2-2.
Figure 2.2-3.
Figure 2.2-4.
Figy.re2.2-5.
Halliburton Formation Tester measurements
(upper curve) and fracture densities calculated born
EMI tool, Well 12-8D. Fracture data is from D. R. Julander . ........ .................
Azimuths of natural fractures as measured from the OB-7 EMI log.
The C02 pilot will target the F-L interval. Note the increase in fractures andchange in fracture azimuth in the Upper Brown Shale versus the F-J
and J-L intervals. The OB-7 is”600 feet to the southwest of the C(J2 pilot.Data is from D. Jukmder .. .................................................................................
C02 injection profiles for the 12-8D and 12-7W wells. The tracks
represent from left to righti gamma ray (25 – 75 API units), injectionprofiles, lithology, and resistivity (O–5 ohm m). The 12-8D shows the
C02 injection profile (0-50’XO).The 12:7W shows, from left to rightprofiles for water injection (after C02), two CO~profiles (higher and
lower rate), and three earlier water injection profiles (1999, 1998,
and 1996). The Iithology &ack shows percentages, from left to right,
of clay, sandkil~ and biogenic silica ...............................................................
Lost Hills Field Location Map . .........................................................................Lost Hills Field Regional Cross-Section ...........................................................
Lost Hills Historical Primary Production . ........................................................
Lost’Hills Waterflood Project Location Map ....................................................
Lost Hills Waterflood Performance . ..................................................................
Lost Hills Estimated Waterflood Reserves and Recovery Factors. ...................
Lost Hills Horizontal Well Performance . ..........................................................
Lost Hills COZPilot Location Map .....................................................................
Lost Hills C02 Pilot Pattern Map .......................................................................
Lost Hills C02 Pilot well location map.” Infectivity tests
were petiormed in 12-8D (non-hydraulically fictured well)
and 12-7W (hydraulicahy fractured water injector). The map
shows a preliminary 0.625 acre pilot design .....................................................
Injection versus time in the 12-8D and 12-7W wells “. ......................................
Gain in oil production due to C02 injection . ....................................................
Post C02 production data from 12-8D..............................................................
Map showing hydraulically propped fracture azimuths
from tihrneter analysis . .....................................................................................
18
19
202121
22
2323
24
2529
29
30
313232
34
vi

.
Fi~es 2.2-6.
& 2.2-7.
Figure 2.3-l.
Figure 2.3-2.Figure 2.3-3Figure 2.3-4Figure 2.3-5.Figure 2.3-6.Figure 2.3-7.Figure 2.4-1.Figure 2.4-2.Figure 2.4-3.Figure 2.4-4.Figure 2.4-5.Fig.ue 2.4-6.Figure 2.4-7.Figure 2.4-8.Figure 2.4-9.Figure 2.5-1.Figure 2.6-1.
Figure 2.6-2.
Figure 2.6-3.
Figure 2.10-1.Figure A-1.Figure A-2.
Figure A-3.Figure A-4.Figure A-5.
Figure B-1.
Injection profile from COZinjection (pink bars)
into 12-8D prior to prop fracture, shows fairly even distribution
with no preference for.COz to enter into higher perm zones.
C02 profiling from 12-7W shows C02 (pink bars) entering into
zones not well covered by water injection’(blue bars). 12-7W
injection profiles in chronological order from right to left. ........................ 36
16 pattern model outline. Pilot is in center 4 patterns 37 ~................................38
Wells and 17 marker surfaces used in model construction ......................... 39Variogram fit for SO. ...................................................................................Variogram fit for permeability
39. ,,. ...................................................................
Vtiogram fit for porosity40
. ..........................................................................Permeability cross-section
41. .........................................................................
PKS cross-section41
. ......................................................................................Compare scale-up porosity
42. ........................................................................
42,“
Production &injection data. .......................................................................Historical production and injection performance since 1990. .................... :4 ,
Pressure distribution in model - 8/92. .........................................................Gas saturation in model - 8/92 “ , 44. ...................................................................Cumulative oil production match 45................................................................Gas-Oil Ratio history match 45. ........... ..........................................................Cumulative water production match 46. ..........................................................Water-Oil Ratio history match 46....................................................................Four 2.5 Acre Patterns Pilot Configuration 47
,.. ...............................................
Bottom hole injection pressure indicates a COZinjection ~gradient of 0.80 psihl at the top pefioration 48. ..............................................Bottom hole injection pressure indicates a C02 injectionpressure gradient of 0.88 pstifl at the top perforation, above the DOGmaximum limit of 0.8 pstiil 48. .......................................................................Bottom hole injection pressure indicates a C02 injectiongradient of 0.64 psi/ft at the top perforation, well belowthe DOG m&rmun injection gradient of 0.8 psilft 49. ...................................Future DOE Expenditure Forecast for Lost Hills C02 Pilot .........~............. 55Reservoir Fluid Viscosity from Well 11-8D............................................... 81
Viscosity of Equilibrium Liquid Phase or COZSwollenReservoir Fluid ............................................................................................ 85
Summary of Packed Column Displacement Tests ...................................... 85
Asphaltene Experiment “................................................................................ 86
Viscosity Comparison of Original Reservoir Fluid and COZSwollen Fluid . ............................................................................................. 87Average RFT Pressure Data for Lost Hills COZPilot. ............................... 92

. . . . . . . . .. .— –..
4

LIST OF TABLES
Table 1.1-1.
Table 1.1-2.
Table 2.2-1.. . .
Table 2.2-2.
Table 2.3-1.
Table 2.3-2.
Table 2.3-3.
Table 2.10-1.
s Table 2.10-2.,. , Table 2.10-3.
Table 2.10-4.
Table 2.13-1.
Table A-1.
Table A-2.
Table A-3.
Table A-4.
Table A-5.
Table A-6.
Table A-7.
Table A-8. ‘
Table A-9.
Table A-10.
Table B-1.
Table C-1.
Average rock compositions from IfWell 166, Section 32, T26S/R21E 4..............................................................
Comp&ison of rock types at the newly proposed
pilot location (Lost Hills) and the original location
(lluena Vista Hills) “. .................................................................................... 6.
Tiltmeter fracture mapping results for COZinjections in
Wells 12-8D and 12-7W 35. ............................................................................
“Tiltmeterfracture mapping results for propped fracture
treatments in Well 12-8D ............................................................................ 35
Markers and average interval properties ..................................................... 38 ~1
Variogram Ranges ...................................................................................... 39 - ~I
Different geostatistical options 40. ..................................................................
Buena Vista Hills Field - Original DOE Funding by ‘,
Budget Period .............................................................................................. 53
Actual Pilot Expenditures Through December 31,1999 . ........................... 54
Lost Hills COZPilot - Remaining DOE Funding . ..................................... 54
Year 2000 DOE Expenditure Forecast . ...................................................... 54
Pilot Monitoring and Surveillance . ............................................................. 59
Composition of Primary Stage Separator Gas “. ........................................... 75
Composition .of Primary Stage Separator Liquid ........................................ 76
Wellstrearn Recombination Calculation . .................................................... 77
Calculated Composition of Wellstream . ..................................................... 78
Composition of pb Adjusted Reservoir Fluid............................................... 79
Pressure Volume Relations . ........................................................................ 80
Reservoir Fluid Shrinkage Analysis ........................................................... 81
Injection Gas /Reservoir Fluid Equilibrium ............................................... 82
Composition of Equilibrium Gas Phase ...................................................... 83
Composition of Equilibrium Liquid Phase . ................................................ 84
Average Reservoir Properties for Lost Hills COZPilot . ............................. 91
C02 Pilot Cost Summary Spreadsheet ........................................................ 95
. ix
{i— ,—.._,_. .,, . ,,.,,.., .... ..-7’-..- ,,. ., . . -’: .: .$-.-.5 ---., T-,-.-.>Y,>Y, .:. .. . ..-, —.’

. ————.—.—.-— . . ..—-. —.. —— —.—A.. L.—. . . . .
,

.
ABSTRACT
This report describes the evaluatio~ design, and implementation of a DOE funded C02 pilotproject in the Lost Hills Field, Kern County, California.
The pilot consists of four inverted (injector-centered) 5-spot patterns covering approximately10 acres, and is located in a portion of the field, which has been under waterfiood since early1992. The target reservoir for the COZpilot is the Belr.idge Diatomite. The pilot locationwas selected based on geology, reservoir quality and reservoir performance during thewaterflood. A C02 pilot was chosen, rather than fkdl-field irnplementatiou to investigateuncertainties associated with C02 utilization rate and premature COZ breakthrou~ andoverall uncertainty in the unproven C02 flood process in the San Joaquin Valley.
This report summarizes the methodology used in the project evaluation and design includingconstruction of the geologic model, reservoir simulation and COZflood predictions, facilitiesdesi~ and well design and completion considerations. An actual COZ infectivity test wasconducted in March 1999. The results of the infectivity test which helped in the design ofthe pilo~ are presented.
The reservoir management plan and future field potential are also discussed. COZ injection . . .in the pilot is planned to commence in June of 2000. The methodology and technicalanalysis used to evaluate and design the Lost Hills COZpilot are applicable to other potentialSan Joaquin Valley C02 floods.
II
“1
i

.- -.— —.C -L,-—. —-_——- .- _ .—— —.— ! 4 4—— ——-.L.- : . .—L .—. .—-. - ,., . . .

EXECUTIVE SUMMARY
Introduction:The primary objective of our project was to conduct advanced reservo~ characterization andmodeling studies in the Antelope Shale of the Buena Vista Hills Field. Work was subdividedinto two phases or budget periods. The first phase of the project would focus on a variety ofadvanced reservoir characterization techniques to determine the production characteristics ofthe Antelope Shale reservoir. Reservoir models based on the results of the characterization “work would then be used to evaluate how the reservoir would respond to enhanced oilrecove~ (EOR) processes such as of C02 flooding. The second phase of the project wouldbe to implement and evaluate a C02 in the Buena Vista Hills Field. A successful projectwould demonstrate the economic viability and widespread applicability of C02 flooding insiliceous shale reservoirs of the San Joaquin Valley.
However, it was decided not to proceed with a Phase II field trial in Buena Vista Hillsbecause of its very low oil saturatio~ lithologic heterogeneity and relatively few naturalfractures in the siliceous shale reservoirs. Although Buena Vista Hills turned out to be a poorC02 EOR candidate, oh reservoir characterization has demonstrated that under the rightconditions, C02 is a viable enhanced recovery process for other siliceous shales. Therefore,the Phase II C02 pilot was moved to Lost Hills Field, about 30 miles north of Buena VistaHilIs with the DOE’s concurrence.
Lost Hills Field:The target reservoir at Lost Hills is the Belridge Diatomite of the Monterey Formation. TheBehidge Diatomite is a diatomaceous mudstone and is not present at Buena Vista Hills. Thediatomite has high oil sa~tion (50Yo)and high porosity (45 - 70’%0),but its low permeability(<1 millid~cy) hm led to IOWprimary oil recovery (3 - 4% of 00IP). Due to the lowprimary recovery and large amount of remaining oil in place, Lost HiI1spresents an attractivetarget for EOR. In addition to the large resource base, there is technical and economicjustification for C02 flooding that was developed through our reservoir characterization andsimulation efforts. The oil response for four different recovery processes at Lost Hills atthree different well spacings (2-1/2, 1-1/4, 5/8 acres) were evaluated:
. Primary (Hydraulically Fractured Wells)● Waterflood. Steamflood● C02 Flood
..
Forecasts were then generated using Chevron proprietary reservoir simulation software.results of this simulation are shown in Figure ES-1. One process, in particular, really
Thedoes
stand out. C02 flooding shows tremendo~ oil response rejative to the-other three processes,mainly due to improved infectivity. C02 infectivity is at least two to three times greater thanthat of water or steam at 2-1/2 acre spacing. fie injection of C02 will also reduce reservoiroil viscosity and increase fluid expansion.
. . .Xlll
.,- —,... -e —r —------.. . -r..--.. -v.r --,-. m-- -77C.,.-r-,:=..>,.—-.>=----- 7.-.?.- —-------—T.- .- —--—..—.—---.-—-——-- -——

——. .— .. . . .-.—. ——-. .—— ——.-—--- .—— .. ....—
)
. . . . ... . -. . . .. . . ... . . ... . . . ...... . . ....- ..._ -.”. ..— . . . . . . ..- .:.
.-’~. iLOST HILLS. OiL RATE Comparison FOR 2.50 ACRES.—-. -—. ..
. ....... . ., . .- ,- . . . .. . . ... . . . .. ... .. .. .. .“,’, ... . ... . . . . ....
- +-~.
s9 *.~:.ti0. i != ._ ~ f *‘8 ?~.
E “g.15
i “i [ ~,. iQ-:-zF.. ,.. :-, .... .... . ..... ----~..-- -.. . -...,.:--- ...?= -,~ ~&@.
.-—... . . .... . .... .. . “,.“* , “ .. .
. .... . ...........’-..”.,. ;-,.._. .. . . . . . ... .... . ... . . . . ... .“~._,_. .
Figure ES-1. Comparison of various IOR processes at Lost Hills.
Prelimhry economics for fi,dl-scale implementation of a COZ Flood in Lost HIIIs hasidentified several key uncertainties which &ill be evaluated as part of the pilot planning. Themain economic uncertainties that can only be further evaluated by the pilot are oil response,and the corresponding C02 utilization required for such a response. The pilot has beendesigned and planned to significantly reduce the range of uncertainty for these two key items.Funding is also included in this project to fi.irther evaluate the feasibili~ and c~st of locallong-term COZ supplies. Since it is very unlikely that a C02 pipeline to California will bebuilt anytime soon, success of a full-scale C02 flood will depend on utilization of C02entrained in local produced gas and flue gas. Global warming and fiture world emissiontrading of COZ credits may drastically increase the availability and lower the cost of COZinCalifornia. As part of project scoping the COZTeam will continue to track developments forglobal warming.
Background & Present Situation:The Lost Hills Field, located 45 miles northwest of Bakersfield, Californk+ was discovered in1910. Reserves in the shallow sands, diatomite, and chert pools were developed using slottedliner completion techniques until the late 1970’s. From the late 1970’s to 1987, small volumehydrofracture completions were performed covering the entire Belridge Diatomite.
Advances in”hydraulic fracturing technology in the late 1980’s resulted in increased oilrecovery that led to a more aggressive development program by Chevron, From 1987 to thepresent, high volume hydrofiacture completions have been pefiormed across the entireBelridge Diatomite and the Upper Brown Shale resulting in significant production. increases.The Lost Hills Field is developed on a 5 acre (siliceous shale) to 1.25 acre (diatomite) wellspacing. There are over 2.2 billion barrels of oil in place in the Belridge Diatomite in Lost
xiv

Hills. To date only 112 million barrels have been produced, or approximately 5% of theoriginal oil in place (OOIP).
Chevron initiated a pilot diatomite waterflood project in December 1990 and began full-project development in April 1992. Since 1992, two hundred and eight 2-1/2 acre patternshave been put on water injection spanning parts of four sections (Sections 4,5,32 Fee, and33). Since the initiation of first project water injection in April 1992, production hasincreased approximately 4,000 BOPD from 6,400 BOPD to the current rate of 10,400 BOPD.
Proposal:Install a fotir-pattem, 2.5 acre pilot on Section 32 Fee to evaluate C02 flooding of the LostHills Diatomite. The scope of the pilot includes: remedial work to evaluate and upgrade thetubing and packers in the injectors, possible drilling of up to 4 replacement injectors, 3observation wells, liquid C02 injection facilities, injection lines, dedicated gauging facilities,and extensive monitoring. It is anticipated that C02 injection could commence as early asJune, 2000. The pilot will be evaluated for a period of 6 months to 2 years. Reservoirsimulation predicts that oil response would not occur for several years. However, based onthe results of the infectivity tesq a quicker response time is now expected.
Objectives:A COZ a pilot will be installed in Section 32 Fee of the Lost Hills field to test the technicaland economic viability of COZflooding the low permeability diatomite resource. A full-scaleCOZ project is economically justified by an incremental analysis and comparison to the ~current base case wateiflood. Incremental tertiary reserves are estimated to be 80 MMBOEGand are technically supported by reservoir simulation. However, the project is onlymarginally economic and considerable uncertainty exists in the magnitude of predicted COZrecoveries. Installing a pilot will provide us with an opportunity to gather and analyze thepertinent geologic, reservoir, and production data and gather facilities design Morrnationnecessary to commit to a fidl-field project. In addition, the pilot capital and operating costswill take advantage of available DOE tiding of nearly 2.7 million dollars.
Additional Objectives:There following are additional objectives of the proposed COZpilot:
. Gain information that could benefit other drive mechanisms in Diatomite such as:
Learn how injecting a gas (very low viscosity fluid) differs from injectingwater into the diatomite in terms of fracture azimuth, infectivity, and areal andvertical sweep.Mitigation measures for COZ breakthrough problems can be applied to otherIOR operations.Learn how much of the diatomite pay zone can effectively be processed. Thislmowledge can be applied to other IOR process designs.Learn how to mitigate and/or control hydrofiacture growth (vertically and , .areally).
xv
,-
,.
— -—. — —- ——.—..——
.“
● Potential Federal Regulations may make C02 a ‘%ee” commodity 5 to 10 years downthe road. Injecting C02 maybe used to offset emissions from other nearby Chevronfacilities.
Risks:The pilot has been design and planned to both minimize risk for the pilot and to better assess
risk for the fidl-scale project. Some of the significant risks for the pilot and project i~e:
● Premature breakthrough of COZ. Oil response is not measured well● Temporary loss of liquid C02 supply. Excessive corrosion from gas high in COZconcentration
Facility Alternatives:Since COZ equipment and purchases constitute the bulk of the expenditures for the pilokseveral alternatives were considered. The primary strategies ended up being “Lic@d COZY’versus “Amine COZ”. Liquid C02 is supplied born California refineries via truck while the“Amine CO~’ would involve the installation of an amine process COZremoval plant in LostHills (to remove C02 from produced gas that is 15% COZ by volume). Decision Analysiswas used to determine the NPV for each alternative and the factors that could influence thefinal value. The analysis showed that liquid C02 is more economical for a pilot lasting lessthen 2 or 3 years.
. . . . . .,
.!, .
xvi

,,I
‘1ACKNOWLEDGMENTS I
I would like to thank the following individuals for their help and participation on this project:John Cooney, Bill Fong, Dale Julander, Aleks Marasigan, Mike More% Deborah Piceno, andBill Stone of Chevron U.S.A. Production Company; Mark Emanuele and Jon Sheffield ofChevron Petroleum Technology Company; Jeff Wells and Bill Westbrook of Chevron “Research and Technology Company, Karl Karnes of Core Laboratories, Matt Pearson, andStuart Heisler of T.J. Cross Engineers, Inc. I would also like to thank the Lost Hills DecisionReview Board for their encouragement and insightful questions which led to the preparationof this document.
1,+
I
. ‘“,.
xviiI[
Ii. . .,, -., -r,--? w. —-_r,v >.—---.,.,, ..=,”, ,+,., ,.,.,.,.,-=<_ ~, .,,.+,>,. ..y.m —. .=—

SECTION 1.
PRESENT SITUATION
1’


‘1.1 GEOLOGY
Overview of Lost Hills Geology ~Lost Hills Field was discovered in 1910 and is located 40 miles northwest of Bakersfield, CA(Figure 1.1-1). Productive intervals include Middle to Upper Miocene diatomite, cher$porcelanite, and siliceous shale, and Plio-Pleistocene sands. The field is situated along anorthwest-southeast trending series of structural highs that begins with the Coalingahticline to the northwest and cuhninates with the Lost Hills Anticline to the southeast. Thisseries of highs roughly parallels folds of similar age on the westside of the San JoaquinValley. These folds are oriented nearly parallel to the trend of the San Andreas Fault to thewest and approximately perpendicular to the direction of regional compression.
Lost Hills oil is trapped at the crest and along the southeast plunge of the anticline (Figures1.1-2- 4). In this portion of the field where the pilot will be located, the structural plungevaries from 2 to 6 degrees toward the southeast. Dips along the northeast flank averagearound 30 degrees while those on the southwest flank average around 15 to 20 degrees. This“asymmetry in dips in the NE-SW direction is consistent with a fault-bend fold model. Thismodel predicts that structural growth of the Lost Hills Anticline was hiitiated during latestMiocene time and that the resulting anticline is perched above a ramp thrust that is locatedaround 13,000 feet below the surface. Numerous northeast-soutiwest trending normal faultswith throws rarely exceeding 40 feet cut the Lost Hills structure. These faults do not appearto effect production.
The stratigraphy at Lost Hills”is shown in Figures 1.1-3 and 1.1-5. The Monterey Formationis comprised of the Devilwater Shale, McLure Shale and Reef Ridge members. The
,Devilwater consists of shales and siliceous shales. It is slightly phosphatic. The McLure issubdivided into the McDonald Shale and the Antelope Shale. The McDonald consists ofinterbedded porcelanites and siliceous shales. It is also slightly phosphatic. The Antelope iscomprised of finely laminated cherts and porcelanites. The uppermost member of theMonterey Formation is the Reef Ridge and it is subdivided into the Brown Shale andBelridge Diatomite. The Brown Shale is made up of interbedded siliceous shale, shale, and
.silt. The Behidge Diatomite consists of interbedded diatomaceous mu~one, fine-grained,argillaceous samkdsilts, and porcelanite.
Based on regional studies of late Miocene paleogeography and paleobathymetry, the rocks ofthe Monterey Formation were deposited in a deep marine environment. In the San JoaqtiBasin, the late Miocene environment was such that water depths were bathyal (between 600and 3,000 feet), cool water temperatures and upwelling in the upper 200 feet supported largediatom populations, and the deeper basin waters were oxygen poor. Two primary
“ sedimentation processes were active in the basin at that time. Firs& hemipelagicsedimentation: the settling of diatom iiustules and clay-sized particles onto the basin floorfrom the overlying water column. And second, turbidite sedimentation: the deposition ofsand, silt, and clay-sized particles carried into the basin by density currents (usuallyoriginating along the basin margins).

————.—. - -—J. -—..-. . .— .. ——.—- —.— -_— .—
This combination of environmental conditions and sedimentation processes led to theaccunndation of thick deposits of organic-rich, Iarninated, diatomaceous sediments whichoccasionally are interrupted by thin-bedded, elastic-rich turbidite deposits. However,compared to the southwestern San Joaquin Basin, sandy turbidites at Lost Hills are notcommon. The Monterey Formation in the San Joaquin Basin differs from the coastal andoffshore Monterey in that it is much more elastic rich.
The composition of the Monterey can be described in terms of three primary components:biogenic silic% clay, and siltkzmd. As shown in Table 1.1-1, there is a ftir amount of verticalcompositional variation within the stratigraphic column at Lost Hills. The Devilwatercontains 27°/0blogenic silic~ 50°/0clay, and 23°/0siltlsand. The McDonald is slightly richerin biogenic silic~ roughly comparable in clay, and slightly lower in siltkmd. The Antelopeis very rich in biogenic siIic~ poor in clay, and poor in siltkand. The Brown Shale is clayrich. The Belridge Diatomite has roughly equal amounts of biogenic silic~ clay andsiltlsand. The overlying Etchegoin Formation is rich in silthnd and clay, and almost totallylacking in biogenic silica.
E%%
Table 1.1-1. Average rock compositions from Well 1’66, Section 32, T26S/R21E. .Rock Unit “Average. ‘h Average YO Average YO
a
Numbm ofBiogenic Silica Clay Silt/Sand Samples
Etchegoin 4 38 58 8,.,
‘“atomite 33 36 31 19e 26 .47 27 28
wmle 61 18 21 14d Shale 34 47 19 24
-, * . . .FA . e- n
l-i%%”’As hemipelagic and occasional turbidite deposits in the Lost Hills area were buried by theoverlying Etchegoin and Tulare sedlinents, the diatomaceous sediments of the MontereyFormation gradually Iithified into the highly porous (50-60V0or more) but impermeable (O.l-10.0 rnillidarcy) rock termed diatornite. As discussed above, anywhere horn 26’XOto 61% ofthis diatomite was composed of diatom fiustules. Diatom iiustules consist of a form of silicacalled opal-A, which is an unstructured mineral (essentially a solidified gel) usuallycontaining 3-10°/0water. As this dlatomite is buried deeper and reaches greater temperatures(40-50 degrees C), the opal-A material in the diatom fiustule becomes unstable andundergoes a phase transition to opal-CT (Figures 1.1-6 - 7). This form of silica is morestructured than opal-A and has released much of its water. Porosity is reduced to -40’%0.Atstill greater depths and higher temperatures (80-90 degrees C), the opal-CT undergoes a finalphase transition to a form of quartz with only a trace of water left. The Monterey Formationat Lost Hills is presently comprised of opal-A rocks at shallow depths @- 2,300 feet orshallower), opal-CT rocks at intermediate depths &2,300 to ~’4,300 feet), and quartz phaserocks below ~ 4300 feet.
The exact temperatures at which the opal-A to opal-CT and opal-CT to quartz phase changesoccur is governed by the amount of blogenic silica (diatoms) in the rock. Opal-A rocks richin biogenic silica convert to opal-CT at lower temperatures (and therefore shallower depths)
4

than those poor in biogenic silica. Conversely, opal-CT rocks rich in biogenic silica convert, to quartz phase at higher temperatures (and greater depths) than those poor in biogenic silica.
For this reaso~ an interval of rocks whose lan&ations vary in their biogenic silica contentcreate a transition zone of laminated phases near the phase transition temperature. Thelaminated phases in these transition zones (particularly where the laminae are thin) maybeespecially susceptible to natural fracturing, thereby enhancing system permeability. Volumereduction and water expulsion associated with the phase changes probably adds to thefracturing in these zones. In general, hydrocarbons are found in all three .(opal-A, opal-CT, !,and quartz) phases. Also production is enhanced in the opal-A to opal-CT an& in particular,the opal-CT to quartz phase transition zones. :
Geochemical analyses have demonstrated that Monterey Formation rocks in Lost Hills aretypically composed of 1% to 6% total organics, making them fair to good hydrocarbon I
source rocks. Studies of kerogen maturation have shown that the Monterey rocks are.. ;!immature (i.e., they have not been buried deep enough to generate oil) within the confines ofthe Lost Hills Field. However, studies of samples taken from down-flank wells indicate thatthese rocks are mostly ’mature in the syncline to the east of Lost Hills and possibly below theramp thrust immediately beneath the Lost Hills Anticline. Because the Monterey Formation .,
. kerogens and the produced oils at Lost Hills have sidar isotopic compositions, and becausethey contain similar concentrations of sulfiu, it is believed that Lost Hills oil was sourcedfrom the Monterey Formation itself.
Hydrocarbons migrated into the low permeability Monterey rocks at Lost Hills by way offaults, fractures and thin sands. Also the opal-A to opal-CT and opal-CT to quartz phasetransition zones with their higher ilacture density probably served as pathways forhydrocarbons to migrate from source beds down-structure to their ultimate resting place inthe crest of the anticline.
In the McDonald Shale and Lower Brown Shale/Antelope Shale pools, hydrocarbons areconfined fairly well within or immediately below the fractured opal-CT to quartz phasetransition rocks. In the Upper Brown Shale, fracturing also helps to make it productive.,Because the McDonald, htelope, and Brown shales have such low matrix permeability,most of the oil produced from these rocks comes out of the fi-actures. In the BelridgeDiatomite with its relatively higher matrix permeability, hydrocarbons have saturated theuppermost opal-CT, the opal-A to opal-CT transition, and most of the opal-A rocks. Most ofthe oil produced from the diatomite comes from the matrix. Lastly, some oil has evenmigrated into the overlying Etchegoin and Tukwe Formations.
Pilot Location and Belridge DiatomiteThe target reservoir for the COZ pilot in Lost Hills is the FF – L interval’ of the BelridgeDiatomite (Figures 1.1-8- 13). In the pilot are% the diatomite is in opal-A phase. The lowerhalf of the Belridge Diatomite is comprised of approximately equal parts of biogenic silica(diatoms), siltisand, and clay while the upper half is comprised mainly of siltkmd, clay, andminor biogenic silica. The diatotite is finely ltiated. ~ genera these l~ations .alternate between a more detritus rich lamina and a more diatomaceous rich Iamina. The -
5,
II
...7 _ , ,-.,,,-,,, ,..,,-_...—-:r_,_,:,r,,.._vv — ~?, , ,., /m- ,:,-. = “-T, --- - .. . . . . . . . . . ,--—-T.~ —-- —-.,— ------- -–— - “ I

,- —..—.—.——__. .———__—_ —. -. _—..—
laminations reflect cyclic variations in yearly runoff (detritus(diatomaceous rich).
rich) and upwelling
Superimposed on this depositional cycling are the changes in relative sea level that occurredin the Upper Miocene. As sea level rose, diatomaceous rich deposits were deposited fbrtherup on the slope. As sea level fell, sandy diatomite deposits prograded down the slope. Thesefluctuations in sea level caused the larger scale deposition of sedimentary units of “clean”diatomite, “clayey” diatomite, and “sandy” diatomite. The diatomites were deposited underoxygen poor to anoxic conditions that could sustain only a limited sediment-dwelling fauna.Thus laminations are presemed in the diatomites. Meanwhile sandy diatomites weredeposited under oxygen poor to oxygenated conditions. Sandy diatomites were originallydeposited as interlaminated sands and clays but shortly afler deposition were heavilybioturbated. Lastly, superimposed on the sea level changes was the overall progradation ofthe shelf, which resulted in the coarsening upward of the Belridge Diatomite, and theeventual filling in of the basin in the Pliocene.
As described above, the Belridge Diatomite is comprised “of varying anmounts ofdiatomaceous material, clay, and silthnd. In Lost Hills, the Belridge Diatomite ranges indepth flom 800 to 35000 feet. Oil gravity ranges from 28 to 18 degrees APL Although .porosity is very high (40 - 65%), permeability is very low (<1 – 10 millidarcies). Oilsaturation ranges from 40’%to 65’XOin opal-A imd from 10% to 30% in opal-CT (Table 1.1-2).
Table 1.1-2. Comparison of rock types at the newly proposed pilot location (Lost Hills)and the original location (Buena Vista Hills).
Parameter Lost Hills Pilot Buena Vista Hills PilotRock Unit Belridge Diatomite Upper htelop’e ShaleAge Uppermost Miocene Upper MioceneDepositional Hemipelagic; Progradational Hemipelagic-TurbidittyEnvironment - Slope BasinRock Type Diatomaceous Mudstone Siliceous ShaleSilica Phaie Opal-A Opal-CTPercent Sand Beds - 30’%0 5%Sand Description 5-60 feet thiclG fine-grained, <1 inch thick, fine-grained,
argillaceous, bioturbated non-bioturbatedDepth to Top of Unit 1,400 feet 4,200 feetThickness 700 feet 600 feetPorosity 50% 29%Permeability 0.1 – 10.0 millidarcies <0.1 millidarciesOil Saturation 50% 14%
J
Development of the Lost Hills Field has evolved over the years. From 1910 to the late1970’s, slotted liner completions were used in the upper Belridge Diatomite. From the late1970’s to .1987, small volume hydroilac completions were petiorrned covering the entireBelridge Diatomite. From 1987 to the present, high volume hydrofiac completions havebeen petionned across the entire Beliidge Diatomite and the Upper Brown Shale. Since
6

1992 a portion of the diatomite has been under waterflood, and in 1998 a pilot steam-drivewas st&ed. The Lost Hills Field is developed on a 5 acre (siliceous sh~e) to 1.25 acre(diatomite) well spacing. Evaluations on closer well spacings are also in progress. There areover 2 billion barrels of oil in place in the Belridge Diatomite in Lost Hills. Due to thereservoir’s low permeability less than 6’%of this oil has been produced. -
Natural Fractures and Thief Zones:In general, all wells are hydraulically propped fractured in Lost Hills. Occasionally thesehydraulic fractures intersect other existing producing wells causing them to sand-up, orincrease water production if an injection well communicates with it. These are inducedfractures. Hydraulic fractures intersecting existing wells can be the result of many factors.These include: 1) wells being in fracture alignment 2) existing faultdiiacture~ and 3)localized areas of depletion due to productio~ or localized areas of re-pressurization horninjection that cause the hydraulic fracture to propagate at an azimuth that is not in alignedwith the natural stress field. In the case of the communication between the 12-8D and 11-8Dduring the C02 infectivity test, this most probably was the result of these two wells being inhydraulic fracture alignment.
Recent fracture analysis by D. Julander using Electrical Micro Imaging (EMI) logs, and logdata from the OB-7 and 12-8D wells allows for observations to be made regarding theabundance of natural fractures and thief zones (Figures 1.1-14- 15). The EMI from the COZinfectivity test well 12-8D is ftily representative of this part of the Lost Hills Field. It showsa fracture iiequency between 1 and 3 fractures per 10 feet of vertical interval. This fracturefrequency includes all observable fractures: open, closed (clay-filled), and fractures ofundeterminable type (due to being poorly imaged).
With regards to thief zones, i.e., high permeability sands interbedded within the diatomite,there does not appear to be a large body of evidence to support this idea. Recent data fromthe nearby OB-7 well (1,160 feet SW of 12-8D) clearly exemplifies this. OB-7 was drilledand cored only 20 feet (perpendicukq to fracture azimuth) horn a water injection well (1O-9W) that was drilled in 1994. Core PKS data clearly shows that the sandy diatomites from.OB-7 do not have highly reduced oil saturations compared to the original injector. As statedabove and illustrated in Figures 2.1-12 and 13, the sandy diatomites are clay rich andbioturbated. These f=tures make it very difficult to behave as a thief zone. Also, the COZinjection profiles from 12-8D and 12-7W (Figure 1.1-16) ako indicate that that COZdid nothave a preference for the sandy diatomites.
In summary, while there are fractures and faults present in the diatomite, the reservoir shouldnot be considered a highly fractured reservoir. However it should also be said that based ontiltmeter analysis of C02, water, and steam infectivity tests in Lost Hills, it’ appears thatfractures and faults do play a role in the unpredictable distribution of low viscosily fluids atlow injection rates. This is another reason why a pilot is necessary.
.
7

FiWre 1.1-1. Location map of major oil fields in the southern San Joaquin Valley.Lost Hills Field is highlighted.
N
t
Productive limit ofBelridge Diatomite
\ T
- C02 PiIot LocationT26s/R21E
DiatomiteT27S/R21E
Waterflood
8
17 16 15
Figure 1.1-2. Productive limits of Belridge Diatomite follows trend of southeastplunge of the Lost Hills Anticline.
.
...~.— _ ..-— —. L-. —.—.———
d

. . .
‘leist.
PIio.
M.Mio.
E.Mio.
TULAREFM.
SANJOAQUINFM.
ETCHEGOINFM. ~1
::
.,
.-
,,
,7.,,-.;. ‘r 7,-7.?--,- V..- .-,---—. ~~.,--.->-,-.-r.m.r.~~=- .$. - ., . --- ,-.:-=-A----- .-n—T.-.. J.. -: . -.-— . -— .--2--,. -:-=— -—-——— . —-
ED
DD
E
EE
F
FF
G
EGG
H
J
K
BrownShale
Antelop6Shale
McDonaldShale
DevilwaterShale
TEMBLORFM. I
Figure 1.1-3. Lost Hills stratigraphic column.
9

.
i ..__,.. ___---- . .. .. . ..—.-- ....-..... . .. ..... -Y ..-
Figure 1.1-4. Lost Hills top Belridge Diatomite structure map. Contour interval 200feet.
10

.i
.:{
I,, ,J,
II
~igurc 1.
COMMINGLEDCOMMINGLED
DIATOMITE PRODUCERPRODUCER SE
NwPRODUCER
I I T1.K!AFE
t3EM!D,@E DL4 nzl’w .,
..—
—.—a~=%5
A ...................-4’ &..,= . . . -_, *
5(XIfih *
2Q(XI n
8
1-5, Gkneralked cross section along southeast plunge on Lost I-W. The Bclridge Diatomite is
I the objective of the COZ
“’l,, ,.
-..-”. .
,.. . .. . ,“,
,. --,-,.-
.----- ,.. .’”

Figure 1.1-6. SEM photomicrographs of opal-A frustule starting to convert to opal-CT (left), and frustule converted to opal-CT (right). 1,300X magnification.
.—— —— ——.—— ——-—.—. .—. .— —-l .. ———. .——.. — .- ——— — .——. —
4
Figure 1.1-7. Opal-A frustule initiating conversion to opai-CT (left), and a frustuleafter its conversion to opal-CT. - SEM photomicrographs, 10,OOOX magnification.

+z—
,:
,’
,-.-
,,
13~{,,
.rT —.- ---:..,......-=... ..TT.-.7..=,7,-,.r..q. +,.-x,,-z. ,,... . .,~.. .A,-U.,L.. 7,.=7 -.1-----.,~ _..—v---- y—-
w-l

.,
\J~’- 7C4 - -7%3 E
-3a13 --1000
-150 --1500
.~g~ L .!~~;
—
Figure 1.1-9. Cross Sections through pilot area. C02 injection will be in tlue FFthrough L interval. Changes in interval thicknesses due to small faults.Predominant Iithologies (end members) shown: “sandy” diatomite (half circles anddots), “clean” diatomite (ovals), and “clayey” diatomite (half circles).
14

,.
,
[
.15$$,
-.—.... .......-.—.- ----- ...... .- -.—.-. ..-,-..~Y..., ---- ~..----~.— --- -...—-.-—.——-—,——- ..----..-’
-—- .-.. . . ... . .. . . ....... - . .___. . .. ,._ —..-”- —- ---- . ,. . . . . . . . . . ---- — - . . . . . . . - --- . . .
,-- .. .. . .. .. . . .. ... .. .. . .-. .—..”- . . . . . . . . . . . . ..- .---,, .-. —---- .,
‘..—- ----- ..-
-_-, -—.-”
-,
.. —.--— . .. —- ..-– —-. — -. ....... :. -...-..—...,— —-— -- .—--:.....-—.
TzT-1 ..-.. . ... .,- .,,., .. . .. . ---- --- . .-. .—-. .. . . .. . .. ..-- ..-- ...””---- ,. -
—----- -..
“,.. ., \.1.,- . . . . . .. -. ..,. - ,- .-, ._. . . . . .. .. -x . . . . . ..,. .._ .—-. --”.
.,. .. .. .. . . . . . . . . . . ..... . .... .- A.. .--— —.. - . .
-—.
.— -----
. ... .-
. ..,,
=:.
-“. .’ ..:: .. .... ___1 +-” so
,,..==”.. ., .-
. . .. . . . ...-. .. . . . .. . ,.-.- ,,+”. . . .,. +
Figure 1.1-10. Cross-sections of porosity, air permeability, and oil saturation of theC Point to Upper Brown Shale interval from W. Fong’s 3D Earth Model. The viewis SW-NE and the length is extends across 4 patterns (one on either side of the pilot).The proposed C02 injection interval, FF - L, is highlighted. This is the sameinterval as the current waterflood.

————— —...——— .— ...-. .—-—.—. .-—-. ..——-. .-—..———.—. .... . .. .—_—.—e . .. . ———— .——. .
16
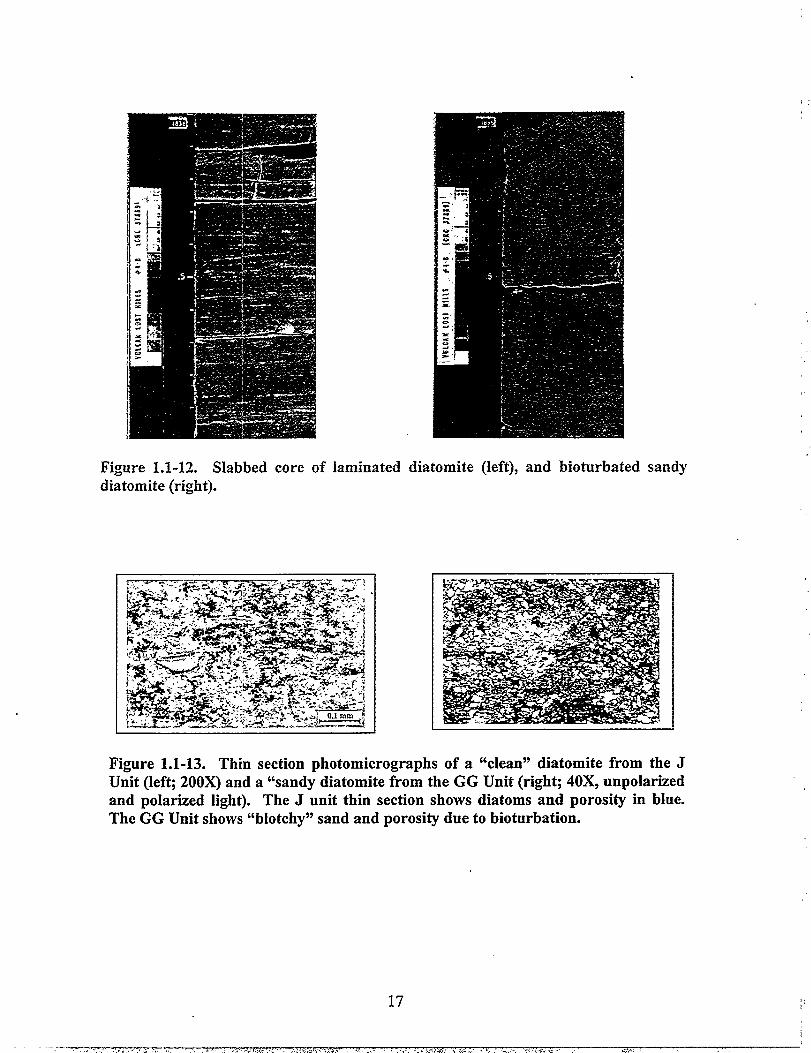
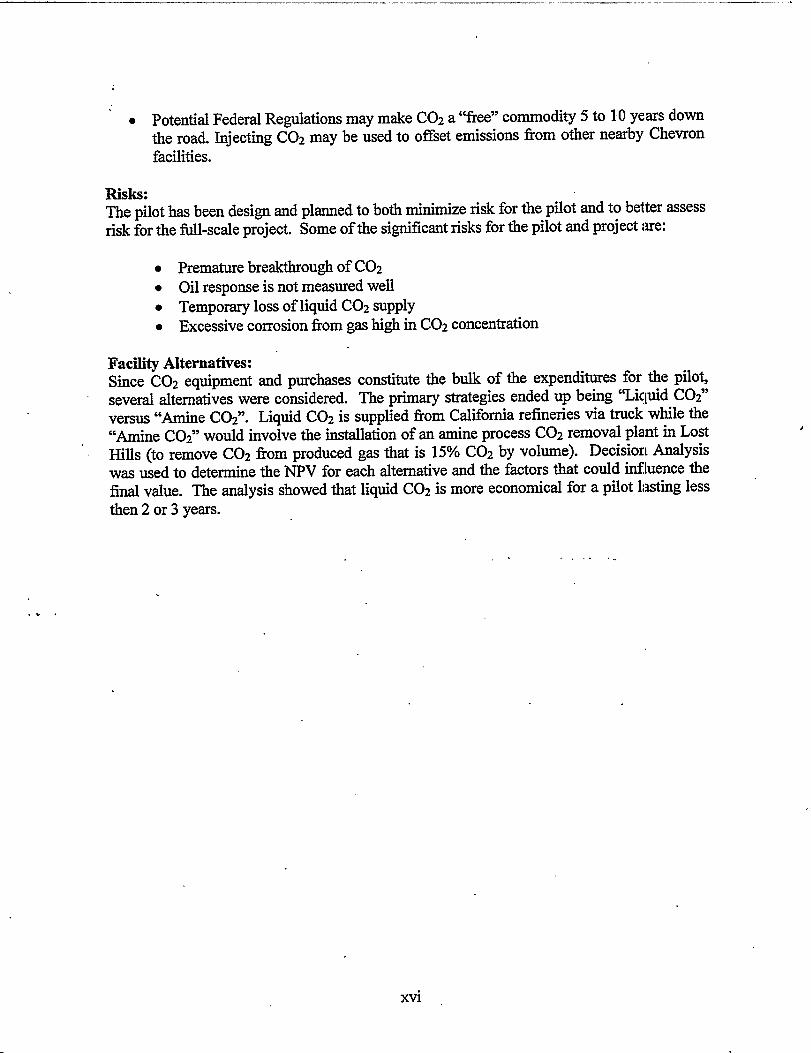
Figure 1.1-12. Slabbed core of laminated diatomite (left), and bioturbated sandydiatomite (right).
,:
,,
17 ,<
iI
..,-7 ,, . . . . ..<.. .<,,,,,,.,.$ ., ,.,,,, >+,.\,;r_e&- . . .. . ,. , . ... . .,, .,. —.,.<..... . .. . . . . ,_ ... .,<...... . ,,. ., ...$A-
JFigure 1.1-13. Thin section photomicrographs of a “clean” diatomite from theUnit (left; 200X) and a “sandy diatomite from the GG Unit (right; 40X, unpolarizedand polarized light). The J unit thin section shows diatoms and porosity in blue.The GG Unit shows “blotchy” sand and porosity due to bioturbation.

——- .- ..-. ..—..- .———- ...—.-. . ...—.. . .. . . ..——.--.. .——— —..—.—. —- ————— ..—-—.. ..—..—.— —.—-..—.——.-——
Frscture Density& RFT Pressure Measurements in Well 12-SD (Sec. 32EAll Fracture Types used to calculate Fracture Oens?ty
1Wo
9crl
Sao
700
300
2oa
100
01000 120a 1400 $600 1.$00 2000 22s0 2400 2500 2600
Depth{R)
?—denl-cu,+ RFi O-b...—. —
Figure 1.1-14. Halliburton Formation Tester measurements (upper curve) andfracture densities calculated from well 12-SD EMI log. Fracture data is from D.Julander.
18

ALL FYL4CTU2ES
Planes Y
= 221
J-L [:wrva! FR4CWREV
Planes N(Stike
I
Axial $f=7
,’
,’.
.,
,,
1
..,. - -P-T.———— .r - . . .Y.-—---v.m ----- . .. -- ..7 ---z= --.—7. - --, -rt-c-,- ----- ---- --- -——--
F-J Inttn’nf ER.4CTLXES
Planes N{Strikq
Ada! N=16
Figure 1.1-15. Azimuths of natural fractures
ii Brown SIm[e Intuvu! FIMGW?E.Y
Planes N(Strike)
%
. -. . .
Axial N=67
N measured from the OB-7 EMI log.The C02change inintervals.Julander.
pilot will target the F-L interval. Note the increase in fractures andfracture azimuth in the Upper Brown Shale versus the F-J and J-LThe OB-7 is 600 feet to the southwest of the C02 pilot. Data is from D.
19

—.—. .— ...... ___ —.——.<. . - _—.— . . . .
12-W) perf’d ,,L. - 12-7W fim’d .,,,. ~,t
!44
I
.
EM
I
2—
,.. .- .-.. .- .. ..,,..—i
~’/3>>
)?
Figure 1.1-16. COZ injection profiles for the 12-8D and 12-7W wells. The tracks—represent from left to right: gamma ray (25 – 75 API units), injection profiles, Iithology,and resistivity (O–5 ohm m). The 12-8D shows the C02 injection profile (0-500/0). The12-7W shows, from left to right, profiles for water injection (after C02), two COZprofiles (higher and lower rate), and three earlier water injection profiles (1999, 1998,and 1996). The lithology track shows percentages, from left to right, of clay, sandkilt,and biogenic silica.
20

1.2 LOST HILLS CURRENT DEVELOPMENT
Lost HIIIs Primaxy DevelopmentThe Lost Hills Field, located 45 miles northwest of Bakersfiel& Califo@& (see Figure 1.2-1)was discovered in 1910. Reserves in the shallow sands, diatomite, and chert pools (Figure1.2-2) were developed using slotted liner completion techniques until the late 1970’s. From
“ the late 1970’s to 1987, small volume hydrofi-acture completions were peflormed coveringthe entire Belridge Diatomite.
mb\
/
Figure 1.2-1. Lost Hills Field Location Map.
OIATOMITE ‘ COMb!lNGLED COM?41NGLE0
NWPRODUCER PROOUCER PRODUCER SE
I1
Figure 1.2-2. Lost Hills Field Regional Cross-Section.
21
OPAL A-OPAL CTPIIASE80USDA81
OPA’Lcr-QUARTZPH71SEBOUXDAI?>
“.- -T!w’r-.--.-”- -=’:: ‘— -—- ‘----’ ““”““ -

—, __— — .————-_.. _— —.L .—.. —. . .
Advances in hydraulic fracturing technology in the late 1980’s resulted in increased oilrecovery that led to a more aggressive development program by Chevron. From 1987 to thepresen~ high volume hydrofiacture completions have been pefiormed across the entireBelridge Diatomite and the Upper Brown Shale resulting in significant production increasesas shown in Figure 1.2-3. The Lost HIIIs Field is developed on a 5 acre (siliceous shale) to1.25 acre (diatomite) well spacing. There are over 2.2 billion barrels of oil in ,place in theBekidge Diatomite in Lost Hills. To date only 112 million barrels have been produced, orapproximately 5’%of the original oil in place (OOIP).
. .f .,. . . ., ;!
‘“ lLostHMs Hiioricai Primary Production ~ I.1}“, ,””,,,
/ !.,-----.__ ......—_—_ ——._ . ..— II
4 .3 i F-www $
Diatomite Waterflood Development:Chevron initiated a pilot diatomite waterflood’ project in December 1990 and began full-project development in April 1992. Since 1992, two hundred and eight 2-1/2 acre patternshave been put on water injection spanning parts of four sections (Sections 4, 5, 32 Fee, and33) as shown in Figure 1.2-4. The historical performance ‘of the Lost Hills waterfloodperformance can be seen in Figure 1.2-5. Since the initiation of first project water injectionin April 1992, production has increased approximately 4,000 BOPD from 6,400 B.OPDto thecurrent rate of 10,400 BOPD.
22

❑$’s Chevron Fee.. . .
u Chevron US
,C)OD AREA
314
,-,, -,.,,.—,.., .,,. —m. ,, ..,. —7 . . . . . . . ... . . . . . -. ?-.T- ----- .._>__ ,. ..,+ ,,
Figure 1.2-4. Lost Hills Waterfiood Project Location Map.
11-ostHiI!s Waterflood Performance/I., .— . . . . .. . . . .. . . . .. . ..-— .
@Mo)-
30.COQi
:-’
>>_______. ...,_.
F@re 1.2-5. Lost EIii Wateri300d Performance.
23

—--- .- L -—.—c — . ,_ —.— —-.. _— . . . . —
In terms of recovery efficiency, Figure 1.2-6 compares the estimated primary and secondary(waterflood) recoveries for each of the 4 sectio& under waterflood to the original Lost HillsWaterflood GO-36 on a per pattern basis. The height of the bars in Figure 1.2-6 represent theaverage pattern 00IP. Estimated ultimate waterflood recovery from the Lost HI1lsdiatomiteis 8.1°/0of 00IP, which is considerably less than the original GO-36 estimate of 19.6°/0of00IP.
—
,— - ,- —. .— . .—.. r——--.---,
i .,” ,:.,t’- —.--: -. . -- .—- —,. -L.- —.. —. —— --
..–‘ \Lost Hills Waterfiood Performance - Average Pattern Analysis
;
———. . ... .LYOOIP(c-u
. ❑ 001? (DO-L>
“ Else.cmxllyR3SenesI—— .. . . ... . ..-
3,301
❑ Prwmay Resaws1
“R
“@~:. _.. .,
Fe--=&S3 RES98 C-LGO.3E
AVEPTR?4
3i+
L
. .
. . .
--—;,ti
. .
. . .. .
.,n.—.—. —
‘ ‘“>2.525 RES98 DLM
1:”
---
4 (91 j .- \. -ro~i (208).. ‘= “;’ ..’s{45).. ‘“ “, ~Fee.&) 33f39).. . ,..~:,. .. . ,,..’ .. . .
., .-”, ~.’ ‘, f+ction (*of Pa@&) ~ ‘ ,. ~. ;!,’-/.!““..“...-_L._-=-L.....&.- — -.. -..,. _—.&..L____ “- . ,, ~ :- L’--- ..:. -—=:: -— —---- -. .. —...—.”.—.—... . ..—.—-- -
Figure 1.2-6. Lost Hills Estimated Waterflood Reserves and Recovery Factors.
Infti Primary PilofiAn infill primary pilot was initiated by Chevron k Section 32 US. in 1998 to test theeconomic viability of improving primary recovery (3 – 4 0/0 of OOIP to date) by infill drillingfrom the current 2-1/2 acre development down to 1-1/4 acre spacing. A total of 11 infillproducers have been or will be drilled and completed by the conclusion of the pilclt test.
Infdl Waterfiood Pilot: “Installation of an infill waterflood pilot began in late 1998 by Chevron in Section 32 Fee totest the potential of waterflooding with 1-1/4 acre “direct line-drive” patterns compared tothe current 2-1/2 acre “staggered”’ patterns. Plans call for 17 wells (6 injectors and 11producers) to be drilled to determine if the current waterflood recovery can be accelerated, orbetter ye~ if incremental waterflood reserves can be obtained by infill drilling.
24
.
J

Diatomite Steamflood PilotiChevron initiated a diatomite stearnflood/cyclic steam pilot in the southern portion of Section29 in October 1998. The stearnflood pilot consists of 7 injectors targeting the J – L “clean”diatomite intervals. A single pattern cyclic steam pilot consisting of 4 producers targetingthe more permeable EE – F “sandy” diatomite was initiated concurrently. Both pilots are stillunder evaluation.
Horizontal Wells:In 1997 Chevron began experimenting with horizontal wells to try to exploit the flanks of thefield where vertical wells could not be economically justified due to the reduced oil cohunn.Through September 1999, four horizontal wells have been drilled with mixed results. Figure1.2-7 is a summary of the Lost Hills horizontal well performance to date.
. .
LostHills i+orizontallAfeiiPerformance IIs)o~
,-.4 * *
[5 1-+--4 i
Deu% w-n Jun.%’ ‘S@lY >‘ ~ *-98 .I!.4%% Novas i%?kks9?.4aya3At&t -93
%me (MorkiI-Year).- . . . . . . .- .-.. ... . . .. . . -. .- -..—-———.
Figure 1.2-7. Lost Hills Horizontal Well Performance.

/

SECTION 2.
PROPOSAL
27

— .———-e —..— .———...... . .’_. .——.
.

2.1 COZPILOT LOCATION
The proposed COZPilot will be located in the southeast quarter-section of Section 32, T.26S.,R.21E. of the Lost Hills Field as shown in Figure 2.1-1. Plans are to install a four-patternpilot. The pilot area is enlarged in Figure 2.1-2 showing the four existing waterflood patterns(10-8WA, 1l-8W& 12-7W, and 12-8W) which will be converted to C02 injection.
t
Productive limit ofBelridge Diatomite
Y.
31 J\@&
33 COZPilot LocationT26SIR21E /??1
DiatomiteWaterflood
8
47 16 15
Figure 2.1-1. Lost Hills C02 Pilot Location Map.
127S/R21E
ff.avi?IO-7A* d.._ - --
I f-w A “ 74
0’ +
/
“uA,_FfO-&+’A ,. -4
/
: I-*A v IJB-W+M09-S
If-g .E:76 0●. v +0 P.
.YJ-50
Hell Symbols1
Scok
Figure 2.1-2. Lost Hills C02 Pilot Pattern Map.
29
w’
.. :.-. . ....... ...+-m --- :.,?- . ..:. .—.>. ...,_ ..,. . . ., .,*,.. .... . .

—-— .. ... . —..
2.2 COZ INFECTIVITY TEST AND RESULTS
C02 infectivity tests were conducted in the Belridge Diatomite of the Monterey Formation inthe Lost Hills Field horn March 11, 1999 through April 16, 1999. The injection tests tookplace in two wells (Figure 2.2-l). The fist well, 12-SD Section 32, is a new well that wasdrilled during late December 1998. This well had not been completed prior to the C02injection test. The second well, 12-7W Section 32, is a waterflood injection well that was J
hydraulically propped Iiactured during mid-1996 and has been on continuous water injectionsince November 1996. A total of approximately 10 MMSCF of C02 was injected during thetest. Figure 2.2-2 shows the injection rate and duration of the test.
A s“ N
A
11-7B
# WaterInjector
VP ProposedC02Injecto]@ ProposedOil
0.... 0 Observation~* Surface Location
/;,/
/“” o 100Y.... L I
11-sD ,.,-””’” FEET●“
Figure 2.2-1. Lost Hills C02 Pilot well location map. Infectivity tests were performedin 12-SD (non-hydraulically fractured well) and 12-7W (hydraulically fractured waterinjector). The map shows a preliminary 0.625 acre pilot design.
30

. . ... .
! 1.6 MMscf 5.5 !4 M$cfor or
400.00 L-—— --- .- 93 Tons 376 tons I 1 1
I ~
f
i.’
300.00>
~<—
12+3 C02 12-7W C02Injeeions
1~ ~je=uon
200.00
I I I \ I 1.
/
ioo.oo $
j
L4PL JAG Pt.Iojcciion
6.00 i
3/1!1999 3@w99 3m1999 3f2@999 - ‘-3129!li99 *11599 &iz2tlss9.+@i1999 42611999
: . . . ..—. .___.. _. .._- _”, ”____________:
—-.— .— . . . ..
Figure 2.2-2. Injection versus time in the 12-SD and 12-7W wells.
Production Response:Production from the 4 pattern producers(11-7B, 11-8D, 12-7, 12-8B) prior to the initiation ofC02 injection was approximately 230 BOPD and 380 BWPD. Post C02 pattern productionincreased to a peak of 260 BOPD and 500 BWPD. Gas production rates were essentiallyunchanged as a result of the injection test. Figure 2.2-3 shows the gain in oil production thatoccurred as a result of COZ injection. .
Oil production from 12-8D, was not included as part of the totalinjecting COZ in 12-8D, the well was hydraulically proppedproduction. Figure 2.2-4 contains the production history of 12-8D.
—
pattern production. Afterfractured and placed on
Surface Titlmeter Mapping Results:Surface tiltmeter mapping has been utilized in the Lost Hills field for over 10 years. Therehave been approximately 300 hydraulic fractures mapped during this time indicating anaverage tlacture azimuth of N47”E *1 OO. A surface tiltmeter array was employed during allCOZ injections as well as during the hydraulic propped fracture treatment of well 12-8D.The tiltmeters saw strong signals. However, the tilt vector patterns induced by tie COZinjections were quite complex, indicating a more complicated fracture geometry then just asingle vertical fracture. For all of the COZ injections, the s~ace deformation tended to havea bowl shaped pattern, indicating multiple near-vertical fractures at azimuths very differentfrom the field average. This bowl shaped surface deformation is’quite different than that of ahorizontal fracture.
31
, ---- - - .,—--——..- T-7 T-–,---Z, 2-,:-. . z-w--m-= . .>T-—-—- V.,-.—-7T77T7--..-T

—— —— -.— —. >.,_ —...’: —.”—. — —“.
-}>-
—@&@@@ “’
$it&@ ‘~ ,: ..77 -.. . ...’. ----- . . . . . .. .
.,—.. . . .‘1
$
--
*
$
~
-.,
-. :.-4 ‘&. .- @q@fJic&O,an* . . ..’- . . . . . . . . . . . ,
---
2gg--- ..:: .:>== . L. -..
----
. .. .
Zq
. . . .
. -.–%.----- –0..
f 500.~PD.as a .. i : + ;+. . . -’
%&c:.’ ‘“’” ‘-’T !--i r
-“-”+--+7
tZj3 —---
—* ;.:——-”- - +-= ? ---
~ A___ ---------- - ~ ~:“ “- I
—.—.—. -i;: { --i
2. *L . .. . .. . _’~:’ i., --- .-” -., . . . . .,-- ..—. . . . . . . . . . . .
me:.- -. : --
?fi~ l+j ?Iy -&.@ .3y@- “.w :* Szl& -&<&,!@&9 ,-ais$ $i%9a, : “,- ~fi~ .-.. .... . ,,.—-. —-. —,-—-. ”-. . . ..L.”—
>~=._ ___ —--...JGG...’,....— . . . .__. _..... -_ - ___ -_”_.-.,,_..__,
Figure 2.2-3. Gain in oil production due to C02 injection.
. ...-. .s. ‘. :---- .,}
:,---I
Izg: ~
------- —._.. — .+-. ._-.. ___ ..;
;
2,~.,.
f= ?W ;
\cJ
——. .-. -—
:=
—.- _________
;=:s
.-—— ..-. -—.—
. . . . .. . . . . . . . .. .
t
A CM l%cU
x Ga$. Prod
x wrr Pma
* Total FM
————
. . . .. t~. ;.. .
glnsg - -“-’-
Qafi999 s@99$”. . %%%% “?*’ “=*
61499
“1...__ . ..__,.
. . .- - -- .-.. -..”- - . . . .__ -.. .-_. — . ..- . . ..&. -r-... _.—. - “..__: . . .________ . __ .- ,.. ___ - ._ ,,-. ,r,_. .+,,-
Figure 2.2-4. Post CO? production data from 12-8D.
32

‘In well 12-8D the average propped hydraulic fracture azimuth was N69”E *6”. This possiblyindicates a local reorientation of the stress field. For the two C02 injection tests in 12-8D,and the first half of the C02 injection test in 12-7W, most of the injection resulted in twofractures. Of these two main fractures, the bulk of the fluid created fractures with an averageazimuth of N30°E k 7°. That is an average rotation of about&an 40° to the North from the‘hydraulically propped fractures mapped in 12-8D. The majority of the remaining injectedvolume created either vertical or steeply dipping fractures that were oriented N67°W + 10°and orthogonal to the main fracture system.
From Figure 2.2-5, it is clear that there was a strong possibility for the C02 from the 12-7Wto communicate with adjacent wells 11-8D and 12-7. Gas analysis data confirmed that COZwas detected in both of these wells.
The second half of the 12-7W COZinjection was significantly dii%erentfrom the first half.After about 8 !4 days (half-way into the injection), all of the tiltmeters dramatically changedslope, with the biggest change seen on the East side of the well. It appears that after 8 % -9days, two events happened that might possibly be related. FirsL the main fracture from thefirst half of the injection communicated with well 12-7, as both the gas production and COZconcentration increased from a baseline of 20 MSCF/D at 20’XOC02 to nearly 50 MSCF/D at45% C02 concentration. Once this primary fhcture was in a “steady-state”, the tiltmeters nolonger detected significant growth in this fracture plane. Second, an orthogonal ilacturebegan growing that is best fit with a single vertical fracture oriented at N40°W + 10°.
Tables 2.2-1 and 2.2-2 show the final results of the tiltmeter fracture mapping. Although thefracture system is d!fiicult to completely resolve, the C02 injections certainly created morethan a single vertical fracture. While most of the fluid was injected into vertical fracturesoriented at or near N30°E, there were also significant secondary fractures (also near-verticalfractures) at very different azimuth orientations, horizontal fracture components, and verylikely significant shear slippage in the formation as well.
C02 injection is not likely to be maintained with simple reservoir matrix flow, as the rateswill have to be extremely low. Nor is it likely to induce simple vertical fracture growth alongthe Lost Hills average maximum horizontal stress direction (N50°E). Instea& injection willinduce a more complicated, but not random, fracture system.
C02 Injection Profiling ~Injection profiling was done on each C02 infectivity test for well 12-SD prior to the wellbeing hydraulically fractured. Additionally, C02 injection profiling was done. at IWO2 “different injection rates during the injection test into well 12-7W which “was previouslyhydraulically propped fractured and on water injection since 1996. Figure 2.2-6 shows aftily even distribution of C02 for both injection intervals in well 12-8D. It appears that COZdid not flow preferentially into zones of higher permeability.
33

—. ———-—— —. —.. -.. —
/
Inasmuch as well 12-7W had been on water injection prior to COZinjection, a good.comparison of water vs. C02 injection can be seen in Figure 2.2-7. Injection profiles indicateC02-entered zones where water injection was minimal.
-n7Cm
776s00
776s00
7767(N
776WI
7764a)
7763X)
. ----- . . ....
ProppedFractureAzimuths 1
i’
. .. .-. .-—— .-.FmdureIellgthsaregeauy
,./ O- injecth,,
exmJwaM fordarily. !1 kc Idf\\
/
t’\ 1’
CO- irjeaim.
2ndMf ~,, /’ ,
/,,-,./’
O* /’1l-m
]Z-7W C@ /’ # 12-8B
,’,’
-..-.. \
-. \\ %R’oPPed fiMIIrem”muth1’ \\
.. \11
T
\\..f\
11 0 12-SD ‘-.../’ .
/’ ,’
,1-8;” \ \
I’ ‘/’1’
/’/’ ,’
,’ .1.’ k 0. injtztim
,- . ,,”
,’ , secoduy piece
lsI C&- injeclim m-n piece
and 2nd C(2 inja”m have
nearlythesameorimtatbn
14%X0 MsmO 14871(KJ 1487203 MS733 1487403 14s7500 14s7603
Figure 2.2-5. Map showing hydraulically propped fracture azimuths from tiltmeteranalysis.
34

Table 2.2-1. Tiltmeter fracture mapping results for C02 injections in Wells 12-SD and12-IW.
TDlp - Wolume?40’
Component. .,. .,,.
Tzir Inj. Date Volum[UlquidEquiv.Coz
(BBL)
AverageInjection
RateLiquid
Equiv.COj(hpd)
Perf ~ Azimuthnterval”(ft)
3/lo/99-3/17/99
82°~ 6° down ‘“to the NW 55’%0 ‘12-8D Inj. 1 867 123.85 1970-2120 N 32”E + 8°
F
+
84°&7° downto the SW 45%
84°k 5° downto the NW 75%
Steeplydipping 25%
3i22199-3/26/99
511 127.7512-8D Inj. 2
F,.
Inj. 1FirstHalf
~;econdHalf
3/3l/99-4/8/99
89°* 6° downto the SE 75%1027 120.8 1670-2140 N23” E*7°12-7W
+
Steeplydipping 25%
80° A 10°down to the N/A*
Sw418f99-4/16/9912-7W 1027 120.8 1670-2140I N 40°W * 10°
* This IYacturehas a significantsheardisplacementcomponent
Table 2.2-2. Tiltmeter frac$ure mapping results for propped fracture treatments in Well12-8D.
Well Stage Date Volume Perf Azimuth Dip Volume ‘h(BBL) Interval (ft) Horizontal
Component
12-8D 1 4128199 660 2160-2320 N62° EA50 74° + 4° clownto the NW 39’%0**
12-8D 2 4130/99 152 1970-2120 N66° E*60 70° + 5° clownto the NW 36Yo**
12-8D 3 4130199 812 1760-1930 N72° E&40 87° + 3° down to the NW 56%**
12-8D 4 4130/99 778 1500-1710 N75” E+4° 75o + 5° down to the SE 24%**
35
.—.7 .,...J,..,.- , .,..,,,,. . . . . . . . . ,-,... ‘ k.. .zz7m..7xir,7=rT-.--.7 7--TZ?7 m?.--T7$w$T--T.. . .... ,, ..%=?*. . . . .. . . ... ... . . .

_. .s
12-SDPeforated 12-7W Fractured
FBA
I
1j.
IfL,..-.. ......
Figures: 2.2-6 and 2.2-7. Injection profile from COZ injection (pink bars) into 12-SDprior to prop fracture, shows fairly- even distribution with no preference for COZ toenter into higher perm zones.. COZ profiling from 12-7W shows COZ (pink bars)entering into zones not well covered by water injection (blue bars). 12-7W injectionprofiles in chronological order from right to left.
36

2.3 COZ PILOT EARTH MODEL
This section discusses the construction of a detailed earth model around the C02 pilot area atLost Hills. The objective is to use the earth model to construct a reservoir flow simulationmodel in order to predict and analyze the future C02 pilot pefiormance.
A detailed, Ml-field, reservoir characterization effort was completed last year by Chetion.Using this new data allows us to build better geologic models. Past simulation models werebased on small, single pattern models with rather idealized fracture geometry. Although theyhave been adjusted to match averaged historical productio~ these models have significantconfinement problems. A model covering a larger area has less confinement problems, andcan better capture heterogeneity and fracture interi?erence. In addition, an area-specificmodel is needed to carefi.dly match the historical production (primary depletion andwaterflood to date) in the pilot area.
Model FrameworkChevron’s G2/Go,cad++ software was used in most of the earth modeling steps. The modelcovers 16 injector-centered patterns, as shown in Figure 2.3-1. The C02 pilot consists of thecenter four patterns. A 149-well group around the pilot area was extracted from the fidl fielddata. A total of 17 stiaces from the C-Pt. to 300 feet below the L-Pt. were used to confinethe model, as listed in Figure 2.3-2. The total reservoir thickness is 1176’. The earth modelhas 25’ x 5’ areal grids, and 500 layers each about 2’ thick. This results in a 10.3 MM gridmodel.
..- , /Figure 2.3-1. 16 pattern model outline. Pilot is in center 4 patterns.

.—— —.... ——.
Figure 2.3-2. Wells and 17 marker surfaces used in model construction.
Table 2.3-1 lists the marker surfaces incorporated in the model, and averaged properties foreach layer. The total 00IP of this model is 73 MMSTB, including the 300’ interval belowthe L-Pt.
Table 2.3-1. Markers and average interval properties.I Avg. thickness I Avg. Porosity I Avg. Air Perm I Ave’x[
I % I (red) I I“ 1c-l%. I 127 I 44.4 I 8.5 I 30.7 I
D-Pt. 58 45.2 9.8DD-Pt. 59 ~~.~ 3.1 :HE-Pt. 36 50.7 3.1
.4
ZJ().1E~ Smd Top 32 49.6 5.6 44.1
EE Top 55 46.3 7.4 ~H.8
F-Pt. 38 ~~.~ 3.6 47.1I FF-Pt. I I 50.5 I I 45.4 I
GG-Pt. 57 58.4 3.6
+
36.3H-Pt. 56. ‘ 51.3 3.6 50.8H Sand To~ 71 j~.() ~.o 47.8
I J-Pt. 81 54.0 ! 1.6 ! 49.4 I47.7I K-Pt. I 69 I I 1.5 I 41.5 I
L-Pt. – 300’ 300 43.2 0.53
4
:!4-9
Belowl~e 1176 49.6 4.4 i}~-8I Total or Averz
38

Geostatistics:To populate the 3D volume, geostatistics was applied. A set of three logs, (PERM98, S098and PH198) from the 149 wells, which correspond to calculated air permeability, oilsaturation and porosity, respectively, were analyzed. Nested variograms can fit the data quitewell. As shown in Table 2.3-2, each property can be modeled as a two level nestedvariogram. Model 1 is the short range, and Model 2 is the long range fit in feet. The Z, orvertical, range is normalized to the entire interval.
Table 2.3-2. Variogram RangesX Range(ft) Y Range (ft) Z Range (ft) Azimuth (degrees)
Oil SaturationModel 1- Exponential 139 112 0.029 132Model 2-Gaussian 10000 6500 0.24 149
PorosityModel 1– Exponential 374 284 0.019 149Model2 – Exponential 15000 7500 0.187 121
Ln of PermeabilityModel 1- Exponential 327 249 0.025 19Model2-Gaussian 20000 10000 0.63 149
Figures 2.3-3 to 2.3-5 show results of varhfour quadrants was plotted as four smallshown as a single plot on the right. Model
~gram fits. In each plo~ the areal variogram fi~windows on the left. The vertical variogramazimuth is plotted in the lower half.
inis
;.:,
.,
. .-. -,- ?. , ,, . . . . -m . . . r?x-.-.—.---. -.-.r- .-T---rl.-
Figure 2.3-3 Variogram fit for SO.
39
Figure 2.3-4 Variogram fit for permeability.

——— ,—-—. . . ..... . -:4...—— ..—. —.-— .— — -..—,—. . . . .—. —.2
.
Figure 2.3-5. Variogram fit for porosity.
Geostatistical Simulations:A few dif3erent geostatistical options were tested. Earlier models were built by separate,independent Sequential Gaussian Simulations (SGS) of porosity, permeability andsaturations. However, the resulting cross plot (e.g., SOvs. porosity) and correlation value didnot honor the input data. The R2 can be either too high or too low, as shown in Table 2.4-3.A better way is to fit perform a SGS on SO,then perform a Collocate Cokriging SGS(ColCok_SGS), using the already simulated So as soft data In petiorming the ColCok_SGS,we adjusted the correlation coefficient input (for porosity or ln(pexm) vs. SO)downwards to0.2 – 0.3. After the Co2CoK_SGS is done, we then compare the cross plot and R2, which isclose to the original inpu~ as summarized in the right column in Table 2.4-3. -
Table 2S-3. Diflerent geostatistical options.Actual Well data Wells Independent SGS
! a
ColCok SGSPorosity vs. SO 0.55 -. 0.66 (seed W 0.’56
0.44 (seed #2Ln(perm) vs. S0 0.49 0.41 (seed #l) 0.51
0.40 (seed #2
Figure 2.3-6 shows simulated permeability (cross section) compared to well log values(cylinders). The values match quite well. Figure 2.3-7 shows “the simulated porosity,permeability and oil saturation through the middle of the model. The location of the FF-Pt.and the L-Pt. stiaces are also shown.
40
A

,- .. ..-.—”-. . . . . . . . “ ..---.—. --
‘,
,.
i
-,
,“,’
.,,,
,,
.,
:
‘,
41
.-2,-,-- -.>.,,, . ....... . , k-..”.,.+.... -.~..,,,,.,J,,,... , /-,, ......... ,,..,<~.... . ..... ., -, ,.,., —-—w- .
. ..‘.. - . ..-— —— — .4.
.. —- .--.- .——. —- —-—— .-. —
.-,-.. ., . . -,...- ..—.-.—.—..-. —..——— — .. ....,_. .—...-
: 2“’ :., . . . .:.
...-
. .. . ----- ,. .-,. ---- _. _....+
Porosity
..
Perm_tir,
so
Figure 2.3-6. Permeability cross-section. Figure 2.3-7. PKS cross-section.
<
2.4 COZ PILOT FLOW SIMULATION
The earth model was. scaled up for reservoir
MODEL
flow simulation, this was also done inG2/Gocadi+. Figure 2.4-1 comp&es porosity cross-sections of the original earth model, ada scaled up, 36 layer reservoir flow simulation model. The degree of scale-up is mostlydetermined by the size of the compositional model that can be run in a reasonable amount oftime.
To model hydraulic fractures, thin planes of cells were added after scale-up (see Figure 2.4-1). The flow model allows for orthogonal sets of fractures originating from the injectors.This finally results in a 60,516 grid model for Chevron’s CHEARS simulator. The modeldimension is 41 x 41 x 36. An 112,700 grid model with more vertical definition (67 layers)was also created.

. . . . . . —— ..—. __—— ——. .—. . .—,.——— . .
Fiiure 2.4-1. Compare scak-up porosity. Figure 2.4-2. Production & injection data.
Well completion and production data were impoped into G2/Gocad++, as shown in Fi=~e2.4-2. The spheres indicate cumulative oil production to date. The diamonds indicatecumulative water injection to date. These were then output to CHEARS format for historymatching. PVT data from well 11-8D was also incorporated into the model. IFor historymatching purposes, the simulation model was run in black oil mode fi-om 1949-1999. Thepressure and saturation itiormation will then be output to a compositional version of thesame model for subsequent C02 injection predictions.
Fi=~e 2.4-3 is a plot of production and injection rates for the wells in the sixteen patternmodel. Wells that started producing in the 1950’s were non-fractured wells. These wellsproduced until the late 1980’s. From 1989 to current time, new hydraulically-fractured wellswere gradually put on production. The Lost Hills waterflood commenced in the early 1990’s.The history match was therefore made in two stages:
(1) primary production period from 1949-1991 with no hydraulic fractures in the model.(2) primary + waterflood period from 1991-1999; with all new wells hydraulically.
fractured..
42

I!Lost .Hills 16- Pattern C02 Simulation Model - Hstorical Production
i6,030 lmoo :
t
. . . ..- .+--—oil----+Gas 1-“ ‘- -- ‘ ‘----------
----.-.. ——— ..... --—i
I——-—-..- L
50””” G2?i&d------‘---- -----------
I :$..-...........
3z 4,cal —. -.. .. . .. -.. .. —-. . . . :::T---&o”m”m ~g
= ---- .-.. ---...-—- -5
g 3,000 -—.—- .. -—.. .-9z0
. . . ---- . . . . . .. . . .
~
% 200 ------- . . . . . . .. 1 . . . .. “L.%2“n
1.000
,,-;,
.:
,,
.
‘,
,:
43
-. ,.-..---r----—-.,.- -..- -,---- ,-7.-, . .......,->-.7-=------ —--s=,.7.:,..-7-:,,----!.. -.-77- .--,--- -T--f---, , !.-, ..... —---,
2.om
1/1/90 1/1/91 1/1/92 12/31192 12t311s3 12131194 12/31/s5 lz131?&6 W3W97 tx3cw6 W3W99
Year-— --- ----- ,- . .......--— ——-.. . . . . ...-. ..--— —..—-— .. ..--. ..-—--———. --
Figure 2.4-3. Historical production and injection performance since 1990.
Primary (or Pre-Frac) History MatchingThe result of the first stage history match is satisfactory. “Figures 2.4-4 and 2.4-5 show thepressure and gas saturation in model by August 1992, respectively. Localized pressuredepletion can been seen, and the pressure difference from top to the bottom of model isapproximately 800 psia. Free gas saturation (2-3°/0) existed at this time, arid the observedGOR (gas-oil ratio) reached 5000 scflstb. The history match involve the following changesin original simulation properties:
(a) increase original oil bubble point by 100 psia to 1315 psi% to better match initialGOR.
(b) reduce critical gas saturation (S~,) from 0.02 to 0.0 to improve GOR trend match.(c) reduce SWir= 0.97* SWito allow for initial water production.
“ Total liquid production (oil + water) vs. time for each well was used as input for the historymatching runs.

.~ -—.. . .. ...—.—. .——..—...— —..——
Figure 2.4-4. Pressure distribution in model - 8/92.
44

,,,::,.
I
A
CDUIo
Gas 011Ratio, scf/stb .
4 Mu UIU)-4000 %0 o0 000
00go
Zooooo
Cumulative 011Produced, stb
,..,, -,. ,,- ,....,,. ..”. ‘,.,. ,“ ,,

i’
I
1
IIII
Water Oil Ratio, stbktb40 A IQ o
Cumulative Water Produced, stboy*mcO~+A AAh)Ooooooluh b)tno
ggggggggggg.AOcnululaa)aol Cncno’1
.

‘2.5 COZpmOT DESIGN .
Objectives:The proposed Lost Hills C02 Pilot was designed with the following goals and objectives inmind:
●
●
●
●
●
●
Test the technical and economic viability of C02 flooding the low permeabilityDiatomite resource, which is one member of California’s siliceous shalereservoirs of the Monterey Formation.Test the technical and economic viability of C02 flooding the Diatomite resourcein a timely manner (3 years or less).Install a configuration that enhances the chance of process success (oil response).Install a configuration that minimizes the likelihood of premature C02breakthrough.Provide an opportunity to gather and analyze reservoir, geologic, and productionckta and gather facilities design information necessary to commit to a fidl-fieldproject.Install a C02 Pilot in Lost Hills sa$ely, without incident and in accordance withall county, state, and federal environmental rules and regulations.
With the foregoing objectives in mind, a four pattern (2.5 acre each) C02 pilot configurationwas chosen-as shown in Figure 2.5-1. This configuration confines one producer(11-8D) andreduces the risk of premature breakthrough that a 5/8 acre pilot contlguration would likelyincur.
?12-7
‘Y711-SE ‘
11-9Jy
.
11-8WAd
Y
LEGEND12-SC
/: i ● oil
/’/~ ‘-#CQ (JkMiug %0 Injector)O Proposed Obsexvtion
/ 0 SurfaceLOcatrnn
\/ o 200 400~ J I I 1 t
Figure 2.5-1. Four 2.5 Acre Patterns Pilot Configuration.
47
-—-----T .. ,-. ,,,,..-----,,.,..... . .----..--—7-7--.-.-,= --.-7-,--. -.—.==- ——-..—-...=-%-m...- ....-. —.—,——

—— _—— _—— —..— _——.
L-__L__ . . ,J-,. g
—..—.— , -.-A—--4’
Figure 2.6-1. Bottom hole injection pressure indicates a C02 injection gradi[ent of 0.80psihl at the top perforation.
,, 1’@@z gijec@n ‘fe$g @8d Zggie*Z, “. : -’ .J ;
:.’ . ...>:- .,’ 4s $t@760’+4’93$$)’‘ : ~ j ,
}. .
~=. --- . ... . _ , ~[ i. . . . ...’..-. . . . .. .. . ... .. . . .
1“:<j \; t.——..——..—..— .....“.-— _ —J
;=, --
.-. — .- —-.-— ._ .._>
-- ““”-—— ;
> “.2:.. %
~ - +-. —+ . . ....- —----- ____;.X.
.;
-------- . . . .-. .— .- —”___ . . . . . . . . . .
.-
.:
<
..-— . . _. -...-..—— .-—, . . . . . . ...+- .. ______
.—
?... :
. . . . . . . . . —. ..- ..-. ,,-.
1.!
. .*. ” ‘: ’’’”-. T?nl -- -....’ ,- ,’..3%,. ,: : 2@t
.:,:;.. . . .. . !,
‘firne(~min. i&r&h*j. - ~~,.. .
.,; . . .>
- -L. ” .-___. L _-; 2..___, ------ —— ——__ _,.. __., _.:_____ A __.. .__._ ._, ‘l----i
Figure 2.6-2. Bottom hole injection pressure indicates a C02 injection pressuregradient of 0.88 psi/ft at the top perforation, above the DOG maximum limit of 0.8psilft. .
48

%(x)
12C0
100O
em
i-l.$nms9 .u5ms9 41w%i9- ux3n!3s9 -ln7fiss9
Figure 2.6-3. Bottom hole injection pressure indicates a COZ injection gradient of 0.64psi/ft at the top perforation, well below the DOG maximum injection ~adient of 0.8psilft.

. .— ——— -———————.. -.. —
2.6 DRILLING AND COMPLETION
Existing and New Producers:AU current C02 pilot pattern production wells are currently producing. At this time noadditional pattern producers will need to be drilled. All future new, or replacement producerswill need to be hydraulic fkcture stimulated in 4-5 stages, from the Upper Brown Shale tothe D pt. Marker. Based on the corrosion monitoring program, existing tubing and suckerrods may have to be replaced with corrosion resistant materials (internally coated tubingand/or externally coated continuous sucker rods).
Existing Injectors:The existing four water flood injectors (12-7W, 12-8W, 11-8W, 11-8WA) will need to bepulled to install internally coated injection packers and tub&irs. During this remedial workthe wells will be reconfigured from dual injection to single string injection. The probabilityof success during these injector conversions is extremely low, due to subsidence relatedcasing restrictions. As of this writing, all four injectors have known casing restrictionsador casing damage.
New Injectors:Four new C02 injection wells may have to be drilled, based on the success of the injectorconversions horn will be drilled. These new injection wells will receive 7“ casing, twopropped fracture stages (Gpt–Jpt and Jpt-Lpt). and will be completed with a singll~, internallycoate~ injection string.
New Injector Completions:Injection wells will have to be propped fractured to allow injection below the specifiedDivision of Oil and Gas @.O.G.) petit limit of 0.8 psi/ft as measured horn the toppetioration of the injection interval. Bottom hole pressure data from the C02 injection testconducted on non-fractured producer 12-8D Sec 32 Fee, indicated injection pressuregradients of 0.80 psi/ft (Figure 2.6-1) for the Jpt-Lpt interval, and 0.88 psi/fl (Figure 2.6-2)for the Gpt-Lpt interval. The C02 injection pressure gradient for well 12-7W,, Sec 32Fee(propped fiuctured water injector) was 0.64 psi./fl (Figure 2.6-3), well below the D.O.Gmaximum injection pressure limit of 0.8 psihl.
Data from the infectivity test indicates that single string injectors are adequate to achieveeven (202 distribution across all injection intervals (Fpt-Lpt). Additionally, single stringinjectors are preferred over dual injectors from a stiace rate and pressure control. standpoint.Dual C02 injection wells will require twice the surface control and monitoring equipment assingle string injectors. Lastly, injection tubukrs and packers will have to internally coatedfor corrosion protection as a result of WAG (Water Alternating Gas) injection. The currentinjectors do not meet these requirements as none of the injection packers are internally coatedand not all injectors have internally coated tubukirs. Therefore the existing injectors willhave to be mechanically reconfigured to accommodate C02 injection.
50

.:
‘2.7 PILOT FACILITIES
Design Basis:The facilities are being designed to support four 2.5 acre patterns with the following as thedesign basis:
. Four injection wells (existing water injectors) requiring a maximum pressure of 1200psig. The equipment will be able to deliver a C02 rate as low as 100 mscfd per well,and as high as 500 MSCF/D per well. This range is based on the results of the recentinfectivity test.
. Ten producing wells
A phased approach is being taken to establish early baseline data from the existing producingwells in the C02 pilot.
Phase 1- New Gauging Facilities:It should be noted that the existing gauge setting can handle and monitor the productionassociated with the pilot. However, if the pilot is sustained it would be advantageous toinstall the new gauge setting to improve metering accuracy and to minimize corrosiondarnage to existing facilities. .,*
The new gauging facilities will start operating in late April or early May in order to establishgood baseline production data prior to starting injection. They will be designed to handle andmonitor the increased C02 production associated with the C02 pilot. The key objective ofthese facilities will be to isolate and handle the wet gases high in C02 to prevent excessivecorrosion of the existing gathering system. The time lag be~een phase 1 and 2 facilities willbe minimal (2 to 4 ‘months). Since these gauging facilities will have salvage value toChevron, regardless of the outcome of the pilo~ it will be proposed that the DOE only pay25V0for this portion. ‘
Some of the existing flow lines will be utilized for the producers, while others will bereplaced with cement lined piping. Funding is included in this AFE to tie additional wellsinto the pilot dedicated gauge setting should they also experience C02 breakthrough outsidethe immediate pilot patterns. The facilities will include monitoring equipmen~ such asdensity meters and online corrosion monitors, to help detect C02 breakthrough.
Phase 2- Injection Facilities:The injection equipment will be leased and consist ofi storage tanks, injection pumps,heaters, monitoring equipmen~ and injection lines. It will be very similar to the equipmentutilized for the infectivity test but with a greater capacity. SCADA equipment will beinstalled to enable the existing in&structure to gather and compile the data from the pilot.
51
. --- ?7— —— -- -.. .—-~ -. .,— —---m- v.-—--- ---- . . . ...---— - ..-.——— — - --, --- -- -.. . . ..—

2.8 PILOT AND PROJECT SCHEDULE
Pilot ScheduleThe pilot will be constructed and operated in phases, to establish reliable baseline productiondata. Phase 1, which includes the new metering facility will start-up in late April or earlyMay. Phase 2, which includes the COZand water injection systems will start-up in. late Juneor early July. Construction and well drilling schedules are being closely monitored to lookfor ways to expedite installation of the pilot.
Critical path for the start-up of the pilot is the mechanical evaluation of the injectors andsubsequent redrills if necessary. To achieve injection by the second quarter it will benecessary to schedule a drilling rig for late in the first quarter of 2000. Drlling rig scheduleswill be juggled to accommodate the C02 pilot schedule.
Iiquid C02 supply is also a major consideration in the pilot schedule. If the pilot starts priorto June of 2000 it maybe subjected to periods of low C02 supply/curtailment. After June of2000, 130C will have additional, more dependable, supplies from Chevron’s El SegundoRefiery.
A plan has been developed to institute water alternating with gas (WAG) cycles as soon asthere are indications of COZ breakthrough, for any individual pattern. Control techniqueslearned in the early stages of the pilot will be utilized and refined throughout the pilotduration.
The pilot duration could be as short-as a few months (if breakthrough cannot be controlled),or as long as 2 to 3 years if sustained success is achieved.
As soon as the major economic uncertainties of oil production and associated COZutilizationare understood, the pilot will be terminated. At that time we will finalize the feasibilityevaluation of expanding to a commercial COZinjection operation.
Commercial C02 Project Schedule:Based on a strategy to utilize only the C02 that is locally obtainable, additional patterns canbe installed and started roughly one year afler approval to proceed is obtained. This is manyyears sooner thw if we had to wait on an interstate COZpipeline. The fist 5 m~cfd of C02is entrained in the Lost Hills produced gas and will be the easiest to deliver to the project.Additional C02 could be delivered 6 to 12 months thereafter.
If the C02 flood goes commercial, after a successful pilot using just the local COZ supplies,it could be on line, with 10 to 30 patterns (depends on final desi~ injection rate):, as early as2003. Additional expansion could take place every year, for several years thereafter, untilthe local supply is used up, or additional supplies come to the market.
52

)
\
2.9 FACILITY ALTERNATIVES \1
Pilok1.!
Since the C02 supply is the most significant cost for the pilot, Decision Analysis was used to Idetermine the best method of supplying C02. The C02 Team held a Iiaming session to list allpossible methods of C02 delivery. Since COZis entrained in the produced gas at Lost Hills
1I
the most likely choices came down to:!,
1. Use liquid C02 from trucks (“Liquid Strategy”) or2. Remove C02 from the Lost Hills gas (“Amine Strategy”) !
The base case Net Present Value (NW) for the liquid strategy is higher than ,the am@eI
strategy. The only exception to that is if the amine plant would have significant value after)
termination of the pilot. Utiortunately, this is not the case since the removal of COZfrom ourproduced gas at Lost Hills does not result in gas sales price uplift and has no measurablemerit above and beyond the pilot.
I
The duration of the pilot must approach 3 years for an amine C02 removal plant to beeconomic. The preliminary design for the C02 removal plant will proceed, should it beneeded to supply a long-term, commercially viable source of C02.
Commercial COZProject Alternatives:The primary economic uncertainties are; a). The amount of oil production as a result of COZ
injection and b). C02 utilization per BBL of incremental oil. Therefore, the akernatives forthe project will focus on the most economical supply of C02 and the best way to utilize theIimhed supply.
2.10 DOE FUNDING PLAN AND EXPENDITURES
we U.S. Department of Energy (DOE) has made fhnds available to explore for ways toproduce mature oil fields. This program is called the Class Program. In 1996 the DOEapproved a Chevron proposal for a jointly fuuded study of C02 enhanced oil recovery in theBuena Vista Hills siliceous shale. After two years of study, it was determined that a COZflood was not practical at Buena Vista Hills due to low oil saturation. However, core floodsand reservoir simulation showed that a C02 flood of diatomite had technical merit. ‘Arevision of the original proposal was presented and approved by the DOE to move the piIotdemonstration to the Belridge Diatomite at Lost Hills. Table 2.10-1 is a summary of theoriginal DOE fimding by budget period.
Table 2.10-1. Buena Vista Hills Field - Original DOE Funding by Budget Period.Period No. 1 Period No. 2 Total
DOE $2,334,048 $2,515,406 $4,849,454Chevron $2,334,049 $2,515,406 $4,849,455Total $4,668,097 $5,030,812 $9,698,909
i,
I

. .
Table 2.10-2 is a summary of actual pilot expenditures through December 31, 1999 andTable 2.10-3 is a summa.IYof the total remaining DOE funds. As shown in the Table 2.10-3,a little over $2.7 MM of DOE finding is available for the Lost Hills pilot in the Mum.
Table 2.10-2. Actual Pilot Expenditures Through December 31,1999. -Period No. 1 Period No. 2 Total
DOE $2,105,297 $0 $2,105,297
Chevron $2,105,297 $0 $2,105,297
Total $43210,594 $0 $4,210,594 3
Table 2.10-3. Lost Hills C02 Pilot - Remaining DOE Funding.Period No. 1 Period No. 2 Total
DOE $228,751 $2,515,406 $2,744,157
Chevron $228,752 $2,515,406 $2,744,158
Total $457,503 $5,030,812 $5,488,315 3
As a condition of this funding, Chevron has agreed to make all findings of tie pilotdemonstration public. Thus Chevron is required to write topical reports, quarterly and anmudreports, and a final project report. Also Chevron is required to publish papers and give oral
presentations regarding the pilot. The fimding plan was revised and submitted to the DOE inagreement with the Chevron approved funding plan. The original funding spreadsheet along
with the proposed revisions are included in Appendix D. Generally, we now intencl to use asignificant amount of the DOE fi.mding to offset the operating expense of purchasing COZ.Table 2.10-4 is the forecasted DOE expenditure forecast for the Lost Hills COZ pilot andFigure 2.10-1 is a graphical representation of the same ifiormation.
Table 2.10-4. Year 2000 DOE Expenditure Forecast.Through This Period
z
Total Cumulative
1999 $172,936 $2,105,297
1= Quarter- 2000 $283,750 $2,389,047
2ndQuarter- 2000 $853,063 $3,242,110
3rdQuarter -2000 $565,250 $3,807,360
4m Quarter -2000 $237,500 $4,044,860
54

w ,oo6.@o
350@oo
s2co.#3
SIoo,im
50
. .,~Lost H’ifrsc~2 fJitot - Timing of Budget Periodt . . ... —____...——-.———----..—--—-—--—- . ----.-
. . . . . . . -.. . . . . . .,-
‘%—............l--.--..+
I—— .. .IEE!aQrtt 1
jJ-CWI.DOE I_
/“ +“w-{ .-----y -
S3so@o ~~
DOEPhasel +1 MMS=3.334M?4S. . . . .. ... ~.gqtl g
.,
-- --- [email protected] a
DOEPhas%l=Z334tdMS z>. . . .. . . . .
$xqWGO z..—
E.. .. . . .—.-.— s15fJ0.&?O ~
1------ ~.. —-.q.OIn@
t. . .S5qo.fijtl
so
Figure 2.10-1. Future DOE Expenditure Forecast for Lost HiUs COZ Pdot.
2.11 COZSOURCES FOR LOST HILLS
COZ Source for Piloti
I
i’
. As was discussed in “Facility Alternatives” it is more economic to supply a short lived pilot(less than 2 years in duration) with liquid COZthan by extracting it from the Lost Hills gaswhich contains 15’%C02. As a result we have focused on getting the lowesg dependablesource of liquid C02 possible. BOC Gases will be supply the C02 and the associatedstorage/injection equipment for the pilot. ‘
It is noted in the Risk Mitigation table that one of the pilot risks is that COZ will not beavailable for periods of up to several days. Tlis is because the California COZ supply isIimited, and will continue to be until BOC builds their COZ plant at Chevron’s El Se=-dorefinery in the Spring/Summer of 2000. We plan to work closely with the vendor to monitor
,.
the C02 supply and to anticipate/mitigate problems. -
C02 Source for ProjectiThe COZ Demand Study Group, made up of Oxy, Aer~ and Chevron, was set up todetermine the long-term demand for C02 in the San .loaquin Valley. The team has workedclosely with companies such as Shell COl and Ridgeway Oil to examine the feasibility of aCOZ pipeline from Mlzona or Colorado. Unfortunately, the cost for such a project would bebetween $500 million and $800 million, and require a sustained demand over 400 MMSCFDfor at least 10 years. It is very unlikely that the combined demand of Ae~ Oxy, and
’55

.—. —
Chevron would be that high in the foreseeable fi.ture. As a resul~ this project would dependon local C02 supplies and has been evaluated on that basis. The project would have limitedinitial growth due to the limited available supply. Some of tie possible 10C~ Q~ supplies ,are discussed below
●
●
●
●
COZ from Lost HilIs Produced Gas (4.5 to 6 MMSCFD): Gas produced by Aeraand Chevron in Lost Hills contains approximately 15’XOC02 and is processsd locallyat Aera’s Four Star plant.C02 from Cymric Casing Gas (1.5 to 2 MMSCFD): Currently well-vent gases,containing approximately 50% C02, are incinerated in steam generators in Cymric. Ifthis C02 were removed from this casing gas it could be transported to Lost Hills viapipeline.C02 from Produced Gas of Other Oil Companies (10 to 30 MMscfd in future):Gas produced by other oil companies in the vicinity of Lost Hills is also relativelyhigh in C02. Facilities could be installed to remove and transport this CCJ2to LostHills.C02 from IC Engines (250 mscfd to 1 MMSCFD per engine): Several IC enginesare locate within one-half mile of the C02 flood location. Other operators haveutilized C02 from the exhaust of IC engines as an injectant supply. The bugs have notbeen worked out of this technology yet but maybe by the time the COZflood wouldgo commercial.
,.
56

2.12 FIELD OPERATING STRATEGY
WAG Optimization:Based on the infectivity test performed in April, 1999 we anticipate having to deal with quick breakthrough of C02. Therefore theoperating strategy for the pilot centers around the need to control breakthrough individually for each pattern, on a moments notice.
The following table depicts the planned strategy for dealing with breakthrough:
tnjectants C02 I Water Injection C02 Injection Duration WaterInjectionDuration WAGCycle Times Synchronize Patterns ?Rate (i.e. same injectant at
all times?)C02 Alt. With Start with low of 100 Inject until breakthrough is Eithe~ Continue with Control patternsWater mscfd per well and work detected(breakthroughdefined ● Inject until desired cycles until desired individually - some
up to 500 mscfd max. by detection of tracer gases in HCPVSI is achieved cumulative HCPVSI may be in COZinjectiononeproducer) or... isachieved. while others in water
● If there is a production injectionkick we will “ride itout”
As a result of trying the above strat~gies, we hope to arrive at the optimal process for controlling breakthrough while monitoring foran oil kick. As noted before, the above strategies will be tested before facilities to. handle high C02 are installed. We are riskingshutting down injection for a while but it reduces the capital investment risked up-front. If the cumulative COZpercentage for the areaof the pilot stays low enough to avoid corrosion, injection will not be stopped to wait on facilities.
MonitoringSince the pilot is located near a gauge setting most, if not all, of the process data will be transmitted to the existing data acquisitionsystem at the main processing plant where it will be compiled for analysis at desktop workstations.
Safety:The pilot will bean expanded version of the infectivity test.’We intend to utilize the safety plan and the subsequent lessons learned forthe pilot. The key issues were safe delivery of the C02 and keeping Chevron personnel away from high-pressure injection lines. The
. . . . . . .!, . ..- . . . ----- _. .._-

revised plan calls for the access road to be ie-paved for the increased traffic. ln addition, more visible signs will direct C02 delivery’ ..drivers to their destination IManpower for Pilot:The equipment requiring most of the attention will be the C02 storagevesselsand the injection skid. A Contractor was on-site duringall ,injection operations for the infectivity test. This would be cost prohibitive for the pilot, therefore automatic controls will be addedto monitor critical process parameters and Chevron Operations personnel will be trained on how to check and operate/adjust theequipment (particularly the pumps). Generally, priming the C02 pumps after loss of flow is the most difficult operation. Injection willbe continuous unless C02 monitoring indicates it should be stopped at which time operator intervention will be required to switch towater injection
In addition, significant manpower will be required to stay up to date,on all the data necessary to properly evaluate success of the pilot.Contract labor will be used to gather and tinalyze oil and gas samples. Analysis of the data, with the intent of making WAG decisions,will be performed by the Production Engineer, in the field. Initially, these decisions will be made by consulting with the C02 Teammembers but should become more routine after awhile.
I
.
t
.

2.13 PILOT MONITORING AND SURVEILLANCE
C02 Injection Monitoring PlanIn order to monitor the COZ pilot’s performance, a comprehensive monitofig adsurveillance program has been developed. Table 2.13-1 lists the types of data to be collectedand its relev%ce.
Table 2.13-1. Pilot Monitoring and Surveillance.
Source Data Collection Data Evaluation & Evaluation—. —---Type – Frequency Presentation Derived Information
njection Wells Tramsurvey; Threemonths Logs;bubbleplots& InjectionprofilqInstallflowmeterswl Daily maps, C(h rate,pressure&temperaturecm.rollers @ each . .
injector-headeqTikrneters once Map Hydraulicffactureazimuth
FiberglassCased Casedholeresistivi~, Six months Logs,charts& cross Oil saturadonchangesObservationWells E-M survey sections Cozsweep.
Crosswellseismic- C02sweep(mssibleDOEfinds)
steelcd Pressure Six months Pressureplots Formationpressw,ObservationWell Neededto determinehydrocarbon
porevohrmesof CQ injectedProducingWells C02 concentrationin Weekly Rate,bubble& contour Ptiorntance updatirrs material
producedg=, maps&plots balan=, COZresponsq reservoirCorrosionCOUPON, modeling
CasingCollection Gas composition Daily Pressurevs. oil rate plots Energybakmcq effecton casingSystem pressure& oil productionProducingWells: lrrstdl newAWT EverytWO Bubble& contourmaps& Baseline production VS.actualIncrementalOil, dedicatedto pilotwells days plots production;Gss& Water Rat6vs,Timeplots Incrementalgas productionProduction HCPVSIvs. Cum.Oil Oil productionvs. HCporevolumes
injectedCOZUtilization CQ injectionratevs. Monthly Injectionratevs. oil plots MeterCChinjectionrateandtrendvs.
incremental C02 Utilhtion vs. Time oil produced- longtermproductionCOZquaJity% - blendin natura!gas
COZBr@ctlrrough Detectwhentracer Daily Gascompositionplots OnlineGC or frequentsamplingwithgases tive at labproducers
Percent Recycle Gasproduction Monthly Productionplot Sample&trend %.COZat criticalcomposition YO COZvs. Time Plot junctions of gas system-Section 3
COZInjection&C02 compressor,Calm3 compressors,&Productionvs. Time FourStar gas plantSi3kSpoint
Timingof oil Rerdtime comparison Monthly Production&. injectionvs. Pilot performanceResponse of oilproductionvs. timeplots
injectionrates
We plan to drill 3 observation wells in April 2000. Two of these wells will be fiberglass-cased. We will run resistivity logs in these wells every six months to look for changes in oilsaturation and vertical sweep. The third observation well will be steel cased and used forpressure observation.
An electro-magnetic (EM) survey is also planned for the fiberglass-cased wells. Theadvantage of EM is that while the resistivity logs only have a small radius of investigationaround the wellbore, EM lets us see what is taking place between the wells. The two
59
I,
,,, ,..,,.. , ., 7-2 ,.,.--:m,~:~,~.-~ .,.,; , .q.<:~,~;:.-- —- -P,-, ~,> , ,&i , ; — . . . . , .--c-..... , > ., > — ..——.

—
‘fiberglass-cased observation wells will be located on either side of a C02 injector. Thus weshould be able to image C02 areal sweep in the reservoir and monitor changes overtime.
If any of the existing injectors needs repalcemenL then resistivity, gamma ray, neutron-density, and Electrical Micro Imaging (EMI) logs will be run. The EMI will be used to lookfor natural fractures.
60

SECTION 3.
TECHNOLOGY TRANSFER
. . . .
..
,,
,1
.
. .
,,
I
..:,
,,
,,
‘,,.
.- . .. . 2 -~—.—.= .- ---7 ..’7--’=--7 -.-, ----- ~--- .-, -...7 ..- ., . -

. . .. —.
d

3.1. TECfiOLOGY TRANSFER
Aydm, A., 1997, Fault Control on Hydrocarbon Migration and Fluid Flow in Neogene Basinsand Related Reservoirs of Central and Coastal Califomi~ USA An OveWiew, ~ Pollard, D.D. and Aydw A. eds., Proceedings of the Rock Fracture Project Workshop, StanfordUniversity, Stiord, CA.
Aydin, A., DholakiZ S. K., Antonellini, M., and Lore, J., 1996, Fault Control onHydrocarbon Migration in Neogene Basins in Central and Coastal Californi~ USA, Faulting,Fault Sealing and Fluid Flow in Hydrocarbon Reservoirs, Conference, University of Leeds.
Bilodea~ B. J., and Smi~ S. C., 1997, Session Chairmen for Reservoir Characterization andImproving Recovery in Monterey-type Siliceous Shales, Pacific Section AAPG/SEPMAnnual Convention, Bakersfield, CA.
Bilodea% B. J., Smith, S. C., and Juhmder, D. R., 1997, Comprehensive ReservoirCharacterization Using Open-Hole Wireline Logs, Core, and Downhole Video, Buena VistaHills Field, Califomi~ Pacific Section AAPG/SEPM Annual Convention, Bakersfield, CA.
Britton, A.W., Smi~ J. L., and Chapman, D., 1997, Continuous Permeability and PorosityDeterminations in the Chevron 653Z-26B Well, Buena Vista Field, Kern County, CA, PacificSection AAPG/SEPM Annual Conventio~ BakersfieI& CA.
Brittou A. W., and More% M. F~,1998, Acoustic Anisotropy Measurements in the SiliceousShale, 653Z-26B Well, Buena Vista Hills Field, Californi& AAPG Annual Convention, SaltLake City, UT.
Carnpagn~ D. J., Amos, J. F., and Mamulq N., 1998, Influence of Structure, ReservoirCompartments, and Natural Fractures on Oil and Gas Production in the Southern San JoaquinBasin, Califomi~ AAPG Annual Conventio~ Salt Lake City, UT.
Carpenter, A. B., and Moore, T. S., 1997, Origin of Boron-Rich Pore Water in the MontereyFormation, San Joaquin Valley, CA, Pacific Section AAPG/SEPM Annual Convention,Bakersfield, CA.
Decker, D. and Bilodeau, B. J., 1997, Antrim Shale Resource and Reservoir Characterizationas an Analog for Diflhsion Controlled Gas Production from the Monterey Formation PacificSection A4PG/SEPM Annual Convention, Bakersfield, CA.
Dholaki~ S. K., 1995, An Integrative Study of Fractures and IrJ Situ Stress in the AntelopeShale, Monterey Formation, Stiord Rock Fracture Projec~ Stanford University, Stanford,CA.
63 I
-—7.- .,-,.... ~>., r. ,. . .. . . . . . . . . . . . . . . . . . . . ... . . -7.=. ?3.7-—7-7 T “:-.-n-m.m .-7= -,.. ,. ..-. ...

-——..—— —,—. .—-. —--- ---- -
Dholaki~ “S. K., 1996, Outcrop to Reservok. Importance of Faulting to HydrocarbonMigration in the Monterey Formation, CA, Stanford Rock Fracture Project StanfordUniversity, Stanford, CA.
Dholaki~ S. K., Aydin, A. Pollard, D. D., and Zoback, M. D., 1995, Relationship betweenHydrocarbon Transport and Shearing Deformation in the Antelope Shale, Monterey .Formation, San Joaquin Valley, Californi~ GSA Annual Convention.
Dholaki~ S. K., Aydw A., Pollard, D. D., Wd Zoback, M. D., 1996, Hydrocarbon Transportand Shearing Processes in the Antelope Shale, Monterey Formatio~ San Joaqu:n Valley,Califomi~ AAPG Annual Convention San Diego, CA.
Dholaki~ S. K., Aydin, A., Pollard, D. D., and Zoback, M. D., 1998, Development of Fauk-controlled Hydrocarbon Pathways in the Monterey Formation, Californi~ AAPG 13ulletin,v.82, no. 8, p. 1551-1574.
Dholaki~ S. K., Aydin, A., Pollard, D. D., Zoback, M. D., and Barton, C., 1996, Integrationof Geological and Borehole Image Data for the Interpretation of Conductive StructuralInhomogeneities in the Monterey Formation, Californi4 Geological Application of BoreholeImaging Conference, Houston, TX.
Dholaki% S. K., Aydin, A, Pollard, D. D., Zoback, M. D., Barton, C., and Bilodeau B. J.,1997, Integration of Stiace Geology and Borehole Geophysics for ReservoirCharacterization in the Monterey Siliceous Shales for the Purpose of Facilitating ImprovedRecovery Designs, Pacific Section AAPG/SEPM Annual Convention, Bakersfiel~ CA.
Dholaki~ S. K., Ayd~ A., Zoback, M. D., and Pollard, D. D., 1995, Plan for an IntegrativeStudy of Fractures and In Situ Stress in the Antelope Shale, Monterey Formation, StiordRock & Borehole Geophysics Project Annual Report, Stanford University, Stardlord, CA.
Dholaki~ S. K:, Lore, J., Brankman, C. M., and Roznovsky, T., 1996, Fault Control onHydrocarbon Migration in the Monterey Formation, CA, Proceedings of the Stanford RockFracture Project Field Workshop, Stiord University, Stanfor~ CA.
Dholaki~ S. K., Zobac~ M. D., and Aydin, A., 1996, Stress State, Shearing Deformation andImplications for Hydrocarbon Transport in the Monterey Formatio~ Californk~ StantlordRock & Borehole Geophysics Project Annual Report, Stanford University, Stiord, CA.
Dholaki~ S. K., Zoback, M. D., Barton, C., Aydin, A. and Pollard, D. D., Active Faults andHydrocarbon Migration and Production in the Monterey Formation, Californi~ Geophysics(in prep).
Fargo, D., 1997, Advanced Coring and Wellsite Handling Add Piza.zz to .Buena Vista HillsCore, Pacific Section AAPG/SEPM hnual Convention Bakersfield, CA.
64

.
Fargo, D:, 1997, Advanced Coring and Wellsite Case Study of Chevron/DOE Well 653Z-26B, Core Technology Meeting, Anchorage, AK.
Fargo, D., 1997, Case Study: Chevron/DOE Buena Vista Field Core Project, TechnologyMeeting, AEIU Energy, Bakersfield, CA.,
Jacobs, J. L., 1997, Characterization and Formation of En Echelon Fracture Arrays in theMonterey Formation, California. In, Pollard, D. D. and Aydin, A., eds., Proceedings of theRock Fracture Project Workshop, Stiord University, Stanilord, CA.
j,,
Kuuskr~ V., 1997, Incorporating Reservoir Characterization into Optimized Production ofSiliceous Shales and Other Gas Bearing Shales, Pacific Section AAPG/SEPM Annual
‘,
Convention, Bakersfield, CA.
Lang~ R. T., 1997, Crosswell Reflection Imaging in the San Joaquin Valley: Buena Vista ,’
Hills, Society of Exploration Geophysicists, Development and Production Forum, Vail, CO. 1
Lang~ R. T., 1997, Crosswell Seismology, Where We’ve Been and Where We’re Going,Producers Executive Committee, Gas Research Institute, Chicago, IL. ,
‘1Langtq R. T., 1997, Crosswell Imaging in West Texas and the San Joaquin Valley,Geosciences Department, Princeton University, Princetou NJ.
!’
Langan, R. T., Jukmder, D. R., More% M, F., Addington, C. M., and Lazaratos, S. K., 1998,Crosswell Seismic Imaging in the Buena Vista Hills, San Joaquin Valley: A Case Study,Annual International Meeting, Society of Exploration Geophysicists, New Orleans, LA. ,,
Mamul~ N., and Campagn~ D. J., 1997, Determination of Reservoir Compartmentalization IUsing Mesoscopic Scale Fracture Analysis in the Buena Vista Hills Area of the Southern SanJoaquin Valley, CA, Pacific Section AAPG/SEPM Annual Convention, Bakersfield, CA.
,.
I
More% M. F., 1997, Advanced Reservoir Characterization in the Antelope Shale to Establishthe Viability of C02 Enhanced Oil Recovery in California’s Monterey Formation SiliceousShales, Oil Technology and Gas Environmental Program Review Meeting, Houston, TX.
More% M. F., 1998, Advanced Reservoir Characterization in the Antelope Shale to Establishthe Viability of C02 Enhanced Oil Recovery in California’s Monterey Formation SiliceousShales, DOE/BC/14938-8, (DE98000484), 1997 Annual Repo~ National PetroleumTechnology Office, US Department of Energy, Tuls~ OK.
More% M. F., 1999, Advanced Reservoir Characterization in the Antelope Shale to Establishthe Viability of C02 Enhanced Oil Recovery in California’s Monterey Formation SiliceousShales, DOE/BC/14938-12, (OSTI ID: 5127), 1998 Annual Repo% National PetroleumTechnology Office, US Department of Energy, Tuls~ OK.
65
.,---., ,,.,--z-T,,, ,, . . . . . . . .., ->!.. . . . . . . . . -79, . ..... .. ... ., L -- ,=T-T?T,-:..:--.--T%- -= ?—-r —.

.—— ——— ....——— .—....=. . . ...
More% M. F., Juknder, D. R., Zalan, T. A,, and Beeson, D. C., 1998, Advanced ReservoirCharacterization of the Siliceous Shale, Buena Vista Hills, Californkq Pacific Section AAPGConvention, Ven~ CA.
More% M. F., Zalan, T. A., and Jacobs, J. L., 1997, Buena Vista Hills ReservoirCharacterization Study, Chevron/DOE Class 111 Reservoir Project. ~ Adv~ces inReservoir Description Techniques as Applied to California Oil and Gas Fields Workshop,Pacific Section A4PG/SEPM Annual Convention, Bakersfiel~ CA.
Mor~ M. F., Zalan, T. A., Jukmder, D. R., Beeson, D. ‘C., and Brittou A. W., 1998,Advanced Reservoir Characterization of the Siliceous Shale, Buena Vista Hills, CaliforniaIntegration of Geological, Geochemical, and Petrophysical Da@ AAPG Annual ConventionSalt Lake City, UT.
More% M. F., and Zalan, T. A., in press, Chapter 3, Buena Vista Hills Field, CaliforniaBorehole Imaging, DOE/AAPG Advanced Logging Volume, Tuls~ OK.
Mor% M. F., and Zalan, T. A., in press, Chapter 4, Buena Vista Hills Field, Californi%Advanced Logging Tools, DOE/AAPG Advanced Logging Volume, Tuls~ OK.
Tang, R. W., Zhou, D., Beeson, D. C., Ulrich, R. L., and More% M. F., 1998, lknmiscibleCOZ Floods in Low Permeability Reservoirs, International Energy Agency, CollaborativeProject on Enhanced Oil Recovery, 19tbWorkshop and Symposium, Cannel, CA.
Toronyi, R. M., 1997, Advanced Reservoir Characterization in the Antelope Shale toEstablish the Viability of C02 Enhanced Oil Recovery in California’s Monterey FormationSiliceous Shales, DOE/BC/14938-7, (DE98000460), .1997 Annual Repo~, NationalPetroleum Technology Office, US Department of Energy, Tuls4 OK.
Wang, G. Y., 1997, 3-D Attenuation Imaging, Annual International Meeting,’ Society ofExploration Geophysicists, Dallas, TX.
Wang, G. Y., Harris, J. M., Magalhaes, C. G., Jukmder, D. R., ahd More% M. F., 1998,Buena Vista Hills 3-D Attenuation and Velocity Tomography, Annual International Meeting,Society of Exploration Geophysicists, New Orleans, LA.
zal~ T. A., More% M. F., Jukmder, D. R., and Denoo, S. A., 1998, Applying IntegratedFormation Evaluation to Advanced Reservoir Characterization in California’s MontereyFormation Siliceous Shales, DOE/BDM OK/ PTTC Class Project Logging Workshop,Advanced Applications of Wireline Logging for Improved Oil Recovery, Denver, CO.
ZalaIL T. A., More% M. F., Julander, D. R., and Denoo, S. A., 1998, Integrated. FormationEvaluation in California’s Monterey Formation Siliceous Shales, Buena Vista Hills Field,Californi~ 1998, SPE Western Regional Meeting, Gems Session, Bakersfield, CA.
66
‘Zalan, T. A., More% M. F., Jukmder, D. R., and Denoo, S. A., 1998, Applying IntegratedFormation Evaluation to Advanced Reservoir Characterization in California’s MontereyFormation Siliceous Shales, Society of Professional, Well Log Analysts, 39th AnnualLogging Symposium, Keystone, CO.
Zobach M. D., Barton, C., Finkbeiner, T., and Dholaki~ S. K., 1996, Evidence for FluidFlow along Critically-Stressed Faults in Crystalline and Sedimentary ROCIGFaulting, FaultSealing and Fluid Flow in Hydrocarbon Reservoirs, Abstracts, Cotierence, University ofLeeds.
Data from this project has been given to Southwest Research Institute, San Antonio, TX andincluded in their projectiParr% J. O., Characterization of Fracture Reservoirs using Static and Dynamic Da@ FromSonic and 3D Seismic to Permeability Distributio~ BDM Subcontract No. G4S51-731, andPrime Contract No. DE-AC22-94PC91OO8.
,,fI
‘,
,’
!’
,,
. .
,,
67
-,--, --.,,, ,,.. &—..V..- -,—---—.e-r...Tm. r.--.s.T-cw...,-7m————----–y.?--—--—- —-—-—--------- --

——.

,
,, IAPPEND~ A
RESERVOIR FLUID STUDY
.
69


RESERVOIR FLUID STUDY
Introduction:On March 8, 1999 a liquid and gas separator sample was taken from Well 11-8D in the COZpilot area of the Lost Hills Field. The producing interval extended from 1202’ to 2560’ MDand covered the entire Behidge Diatomite. ‘The reservoir pressure ranged between313 – 640 ‘psig, and averaged 475 psig. Bottomhole temperature reached 120!F with an average ofapproximately 108°F.
The separator liquid and separator gas sample from the subject well was sent to CoreLaboratories in Carrollto~ Texas for use in a reservoir fluid study to ex~e the effects ofC02 injection into the reservoir. The following test and/or analyses were conducted:
Sample Composition:The composition of the separator gas was determined using gas chromatography. Thecomposition, along with the calculated properties of the separator gas, is presented on TableA-1. The composition of separator liquid was measured through a heptanes plus residualfraction using fractional distillation. The heptanes plus fraction was fbrther analyzed by gaschromatography through triacontanes plus. The composition and density of the separatorliquid can be found on Table A-2.
Reservoir Fluid Composition:The separator gas and separator liquid were physically recombined to a gadoil ratio (GOR)of515 scf of primary separator gas per barrel of stock tank oil. The recombination valuesand calculated wellstream composition based upon GOR and separator product compositionscan be found on Tables A-3 and A-4. The recombined separator products equilibrated at atarget bubblepoint of 950 psig at 108OFin a PVT cell. The equilibrium gas phase wasIphysically removed and the remaining equilibrium liquid was used as the “original reservoirfluid”. The measured composition of the reservoir fluid is presented on Table A-5.
‘Pressure-Volume Relationship:A portion of the reservoir fluid was charged to a high pressure, windowed cell heated to thereported reservoir temperature of 108!F. During the constant composition expansion at thistemperature, a bubblepoint was observed at 930 psig. The results of the pressure-volume .relations are presented on Table A-6.
Multi-Pressure Viscosity:The viscosity of the reservoir fluid was measured over a wide range of pressures at 108OFina rolling ball viscometer. The results of the viscosity measurements are presented in FigureA-1.
71. 1
, , ),. , ,.. . .. . , .,. . . . . . . . . . . ,, .- . . . .,, . . . . . .. . . . . . . .---Tr,T ------ ----. -—:..---——-->

Separator (Shrinkage) Test:A small portion of the reservoir fluid was subjected to a single-stage separator test to
determine gas/oil ratio, stock tank oil”gravity and formation volume factor. These data canbe found on Table A-7.
Vapor/Liquid Equilibrium Experiment:A mixture of 60 mole ~0 C02 and 40 mole % reservoir fluid was prepared in a PVT cell for
use in an equilibrium (K-value) experiment at 950 psig and 1080F. The equilibrium gasphase and equilibrium liquid phase were separately analyzed for volume, density andcomposition. A summary of the equilibrium products can be found on Table .A-8. Thecompositions of the two phases are presented on Tables A-9 and A-10. An additionalvolume of the liquid phase was prepared and subsequently charged to a rolling ballviscometer for the purpose of measuring fluid viscosity veiws pressure depletion at 108OF.This C02 swollen reservoir fluid viscosity can be found in Figure A-2.
Packed Column Displacements (Minimum Miscibility Pressure):A series of packed column displacements were performed at 2000, 3000, and 5CJO0psig at108OFin a forty-foot, Ottawa sand packed column using the reservoir fluid and pure COZ. Asummary of the displacements’ recoveries at 1.2 pore volumes of gas injected is presented inFigure A-3. Minimum Miscibility Pressure, or MMP, is typically defied as the pressure atwhich 90°A oil recovery occurs after 1.2 pore volumes of C02 gas injected. Analysis ofFigure A-3 shows that this occurs at 5000 psig for the Lost Hills reservoir fluid.
Asphaltene Flocculation Experiments:A 25 cc sample of reservoir fluid was placed in a high pressure PVT cell at an overb~den
pressure of 950 psig and reservoir temperature of 108!F. After reaching equilibrium, thesample was sctied using near-irdhred (NIR) spectrophotometer to establish a.n absolutetransmittance level for reference. Once &e reference was established, ~e fluid was slowlymixed and maintained at 950 psig as pure C02 was added to the system. During COZadditions, scans in a near-inbred range of wavelengths horn 1500 to 1700 run were repeatedat every cc increment of gas addition from Oto 60CC(Omole VO to 207 mole ‘A Coz added toreservoir flui~ respectively). Results of these NIR scans at reservoir temperature arepresented in graphical form on Figure A-4. Following the gas addition, the system wasequilibrated at 950 psig and 1080F and an additional reference scan petiornmd. Whilemixing the cell contents, the system was slowly pressurized from 950 psig to 5100 psig.During this pressurization process, scans were peflormed at every 50-psig pressureincrement. These data are also presented graphically in Figure A-4. Neither during theprocess of titrating the reservoir fluid with COZnor subsequent pressurization of the systemwas an asphaltene onset observed.
Summary:The results of the reservoir fluid study are encouraging for the proposed Lost HilksCOz pilot.AIthough the packed column displacement tests resulted in a Minimum Miscibility Pressure(MMP) of 5000 psig, there is still a significant benefit from COZinjection. Figure A-5 showsa comparison of the original reservoir fluid viscosity to the C02 swollen fluid viscosity as afimction of pressure. Although the Lost Hills COZflood will be operating well below MMP
72

and in the 500 – 1100 psig range, a fluid viscosity reduction in excess of 50’% can still beachieved.
In addition, many C02 projects in West Texas and Colorado have been hampered with asevere aspha.ltene precipitation problem subsequent to commencing C02 injection. Analyses‘of the asphaltene flocculation experiments indicate that this will not be a problem with LostHills oil.


Chevron U.S.A. Production ‘Company. .Well II$D 32 Fee
RFL 990038
COMPOSITION OF PRIMARY STAGE SEPARATOR GAS(byPrcgmrmd-Temperature, CapOlaryChromatography)
Plant Liquid-d Mel% Producia Density M/v
[@M) (Lrtnkc)
Hydrogen .Sulfde 0.00
Carbon Dioxide 26.70 0.8f72 44.010Nitrogen 0.02 0.6G86 28.013Methane 6426 02697 16.043Elhana 5.48 1.464 0.3s62 30.070propane 0.71 0.19s 0.s370 44.097iso-Butane 0.92 o.3of 0.s629 58.123n-Mane 0.45 0.142 0.S640 , 58.123iso-Pentane 0.46 0.166 0.6244 72.1S0n-pentane 02f 0.076 0.8311 72.15UHexenes 027 0.10S 0.66S0 84.0Hepbrles 0,35 0.147 0.7220 96.0Ochlaa 0.12 0.05s 0.7450 107Nonanaa 0.04 0.020 0.7840 121Deoanes 0.01 0.006 0.7780 134
T6TSI* I 4nnml --le-rn I...— — 1 ,-- , . ..-..” I
[1,
1
;,
,,
.
,,;
‘.
,.,,
. .—...-.., _—,.,=,,. ~ . ,., ~“rn-z--7v~- =--.vm, -=-=.-..-. -.-—y ~... —,...-.. ~-, —--- . . . . .. . . . .
Properties of Plus Fractions
_ ~d
Cornponenl Mol % DenSty APl Mvv
(gmkc] Gravity
Heptenes pkls 0.s2 0.732s al .6 lof2
SAMPLINGCONDITIONS
4S psig
72 ‘F
Gas CyGnder
Average sample Propertka
CriicalPressure, @a .......................... 771.4CrithalTemperrdure, ~ ........................ 424.6
Average MolecularVVeight ............. ....... 26.06Calculated Gaa Graviy[eir=l.OtO ).. 0.800
at 14.73 ptia and 60 T
Heating Value, 6tWcf dry ge&Groaa ................................................. 877
Note Componentpropertiea assigned fromliterature.1ret Gas Producers&SuppWs Association(GPSA) En@earing Defa Book
Table A-1. Composition of Primary Stage Separator Gas.
75

——. . ..—. .——. .————..-. -.. — -. —.——.— -— ——.-. .—...- ..—
“.
Chevron U.S.A. Production CompanyWell 11-8D32 Fee
RFL993039
COMPOSITION OF PRIMARY STAGE SEPARATOR LIQUID(byLow Ternpwa!ure DWkrtion lPrograrmned-Temperrdure, Capillary Chromatography)
I~d
component Mel% w% Density WV
Hydrogen SulfdeCarbon DioxideNitrogen
EthanePlopeneisO&bne
b+enbne11-Psntane
Hexanes
I-le@anesOctanasms
DecenesUndscanssDodecanes
Trk&anesTebdecanesPe4—tadecanesHexadecanesI-@ladecanesOdadecanss
NormdeoanesEcosanes
Wnebsanes
Trbxanss
PeriwOsanes
He@cOsamS
OctecosanesNonacOswS
Tri&xdanes pb
0.000.490.00
0280240.11025
0.180.530.42
2.42750
9Sl7.98
7.005.444.814.48
3.S3.162.752.592.74
2.192.58
1.861.831.831.891.16
1.091.30
0.93
12915.56
0.000.08 0.M72 44.MO0.00
0.02 02997 16.0430.03 0.3s62 30.0700.02 0.s070 44.0970.0S 0.5829 58.1230.04 0.5840 58.1230.14. 0.8244 72.1500.11 0S311 72.150
0.75 0.88s0 84.02.87 0.7220 96.0
3.33 0.7450 1073.s8 0.7840 1213.48 0.7760 134
2.97 0.7890 1472.87 0.8000 161
2.91 O.8I1O 1752.s3 0.8220 1902.41 0.8320 206226 0.8390 222
228 0.8470 2372.ss 0.8s20 2512.14 0.8S70 2832.83 0.8820 275
2.m 0s670 291
2.07 0.8720 3051.92 0.6770 3162.07 0.8M0 3311.48 0.8850 345
1.45 0.8690 3531>a 0.893U 3741.34 0.8980 388
1 .e2 0.8390 402“43.49‘ ‘1.fl 27 753
TotaIs — I 100.00 I 100.00 I
SAMPLINGCONDITIONS
43 psig72%
LiquidCyhdef228367D
Average SarnpIe Propeties
Average MolecularVVe@ti+ . . . . ... . . .. . .. . .. . . .
Celudated Density at Opsigand60T.
289.890S245
Propem-es of PIUSFra~-ons
Liquid Li@dPlusFraction MOl%
E
w% Density AH w
(m ) GmVq
Heptanes plus S08 98.76 0.9298 20.6 260Undeoenes pb 82’s9 85.10 0.9659 14.9 386Perdadecanes plu 44.37 73.82 0.9363 10.4 449
mxsanes plus 3094 82.16 1.0308 5.8 542Penlacosanes plu 2135 .51.48 1.0717 0.4 850Triaccdene$ PIUS 1SS8 43.49 i .4127 -4.5 753
Table A-2. Composition of Primary Stage Separator Liquid.
76

Chevron U.S.A. Production CompanyWell 11-8D32 Fee
RFL690039
WELLSTREAM RECOMBINATION CALCULATION(basedonfieldwodltti dda) .
Conditions for Recombination Calculations
PrimarYSta9eti48 psi9andi’2’F
Hdd Gw f?8t@Ciwrectio/f /%ctom - Re/d Ik%iwuredJ?atwand R8t.%s -
Gas Gmvity (air=l .000) ........................................ = PrimaryStage Gas Flow Raie, MSMI ............... 34.I3O
Gas Gravity Factor, Fg ......................................... = Primary Stage LiquidFbw Rate, bblKI ................ 66.00
prinmryStage Gas Ioii RaIio, scfS%kd ............. 515.15
Ges Deviation FadOr, Z .........................................
Super CarrWessibilityFactor,Fpv ........................ mPressure Base, psie ............................................ 14.730 Recowrbiaatfoi? Rates and Ratfos -
PrimatYSta9e Gas FbwRate, rdsm ............... 34.00+h?boratom Gas Rate Correction Factors - MnterY Stage LiquidFbwRate, bbli) ................ 66.oo
Ges Gravity (air=l .000) ........................................ 0.900
Primary Stage Gas 10il Ratio, wfhbl ................. 515.15
Gas GravityFactor, Fg (notapplied) . .. .. . .. . . . .. . . .. . .. . 1.0S42
Gas DeviationFactor*, Z ....................................... 0.990Supescotnpressibiii Factor, Fpv (not applied)..:.. 1.00S2
Pressure Bass, mie ............................................ 14.730
tiborato?v .Liauid Rste Correctio~ Factors -
LiquidVoluneFactor, S%bbbbl@ 60 ‘F .............. na6iiurnen, Wintent & Water (BS&W) Fader ......... 1.OCII
WWstrearnr Rowarrbimatioa f?%tiO
Jrromrot — 1.1377
“From StandiIW,MB. Wolumeuiaand Phase Be haviorof Oil FieldHg&ocafbonSgsten&, SPE(Oaltac).197?.6th Edith AppmdiaL
- Data notsupplied to GJI? Lat@fatories
Table A-3. Wellstream Recombination Calculation.
77

. .
Chevron U.S.A. Production CompanyWell lI$D 32 Fee
RFL89003s
CALCULATED COMPOSITION OF WELLSTREAM(fromcalculatedrecurrhetion of separator products)
~d
Mel% w% Densily Mvv(grrtcc)
HydmrJen3ulf&CarbullxlxideNlrogenMhene
meiso-atderle’11-erlsneiso-P@snen-PerlleneHsxenesHepbnesOctenesNonsnesDecanes
UndecsnesDodecsnes
Trk&snesTetredemnes
Pe@edeanesf-kxsdecanesHs@d&xnes
CzMemmsNonsdecsnes
DocossnesTricmamsTebxsmesPeriecoserreS
HqfecosmesOc!emssnesNomwsanesTriscordsrresPhs .
0.0014.44
0.0134.33
3.030.430.810.320.490.311283.884.703.75328
2.54225
2.101.68
1.4812812f
1281.021.210.67
0.660.76
Q790540.51
0.810.440.80729
0.004.54 0.8172 44.010O.OU 0.8088 28.0133.93 0.29S7 18.0430.6s 0.3582 30.0700.14 0.s070 44.097025 0.6628 58.1230.13 0.5640 58.123025 0.6244” 72.1=0.16 0.8311 72.1500.77’ 0.8850 84.02.53 0.7220 98.03.58 0.7450 107324 0.7840 1213.14 0.7780 134
2.67 0.7880 1472.59 O.aooo 161
2.62 O.allo 175228 0.6220 190
2.18 0.8320 2062.04 0.82S0 2222.06 0.6470 237229 0.6520 2611.82 0.6670 263
2.36 0.6620 2751.61 0.6870 2811.87 0.8720 31151.73 0.8770 3181.87 0.6610 331
1.33 0.8850 3451.31 0.886U 2S91.83 0.6930 374
122 0.6980 3881.72 0.8S90 402
39.17 1.1127 7S3
kCOMBINATION cortrmorw
43 psig72 T
Recomb-h*-on Parameters
PrimeryShge G&s/Oil Ratio, scfhblsi remn-b!kmiionconditii ................ 515.15
We9stresrnRecomb- Rs!iomolesgas f rndeIk@d........................ 1.1377
Average Vfelktream Propetiee
AvereLX MolecularWe@kit.................... 140J1Celcu!atedoensilys!op sigsndaov. 0.8383
Properties of Plus Fractions
He@snes pb 44.75 89.18 0.9291 20.7 279Undecanes plus 28’33 76.68 0.9659 14.9 366
Perdadecenes @u 20.76 66.52 0.9883 10.4 449Ebsenes plus 14.48 S6.04 1.0308 5.6 542Pentacasenes * 9.S9 46.38 1.0717 0.4 850Triecontenes PIUS 729 38.17 1.lf127 -4.5 753
Totals _ I 100.00 I 100.00 I
Table A-4. Calculated Composition of Wellstream.
78
.— . . .. .

Chevron U.S.A. Production CompanyWell IIJ3D32 Fee
RFL990039
COMPOSITION OF Pb ADJUSTED RESERVOIR FLUIW(byFlash,Exterrded-CapillaryChromatography)
LiquidComponent Name Mot % m% Dens”@ w
(grn&)
HydrogenSulfideCarbonDioxideNitroganMe!haneElhanePropane
iso-Bub3ne
n-Bukne
iso-Pentene
n-l%mtane
Hexanes
Haptanes
octanesNonanes
DecanesUndecacesDodacenesTridecanesTetradecanesPentadecanesHexadecanesHeptadecarresOctadacenesNonedecaneaEicosanesHeneIcosanesDocosanesTricosanesTetracosanesPen!amsanasHexacoseneaHeptacosanesOctacosanasNonacosanasTriacotianas Plus
0.0011.07
0.0016.173210,710.960560.760.481.595.606.605.074.533.463.353.’I92.562281so1.631.681.481.471221210.970.960.650.900.620.790.89
10.64
0.00 0.60062.54 0.61720.00 0.60661.33 028970.50 0.3s620.16 0.5070028 0.56290.47 0.5640029 0.62440.18 0.63110.70 o.6aso2.eo 0.72203.68 0.74s03.19 0.76403.16 0.77602.6S 0.78902.61 0.60002.81 O.BIIO2.s6 0.62202.45 0.6320.220 0.63SU226 0.8470220 0.65202.03 0.65702.10 0.66201.64 0.6s701.92 0.87201.60 0.87701.6s 0.66101.52 O.Bow1.66 0.66901.60 0.69301.59 0.69601.66 0.6960
41.47 f .1074
34.0844.01
26.01316.04330.07
44.09758.12356.12372.1572.1S
8496
10712113414716117s190’206222237251263275291305318331345359374388402748
Totals 100.00 100.00
● Bubblepo-ti Adjusted to
930 psig st I08T
Total SsrnpIe Properties
Molecular Weight ....................................... 192.04
Equivalent Liquid Densityt @sCC ............. 0.6649
.Plus Fractions I Mel%m%Heptanss PIUS 64.47 93.62Undecanesplus 42.47 60.69Perdadecanesplus 29.69 69S17Eicosanesplus 20.72 58.63Pentacosanasplus ‘14.68 49.72Triawntanes plus 10.64 41 .4?
Densily
0.92610.96410.99481.0293
1.0646
1.1074
Table A-5. Composition of pb Adjusted Reservoir Fluid.
w
2793ss450545641746

Chevron U.S.A. Production CompanyWell l141D 32 Fee “
RFL990039
VOLUMETRICDATA(at108 “F) .
SaturationPressure (Psat) ................................. ‘ 930 psigDens.Ryat Psat ....................................................... 0.8811 grnfccThermal ExpI@5000 psig ................................... 1.01954 V at 108 ‘F IV at 60 “F
AVERAGESINGLE-PNASECOMPRESSIBILITIES
EiEEiia5000 to 4500 4.64 E-64500 to 4000 4.73 E-64000 to 3500 4.84 E-63500 to 3000 4.96 E-63000 to 2500 5.11 E-62500 to 2000 5.30 E-62000 to 1500 5.56 E-61500. to 1000 5.92 E-61000 to 930 6.20 E-6
PRESSURE-VOLUME RELATIONS(at108’F)
EPLzlPressure Relative Y-Function Density
5000450040003500300025002000150014001300120011001000
bw930929928927
0.97930.98160.98390.98630.98870.99120.99390.99660.99720.99780.99840,99900.99961.00001.00091.00191.0031
0.89970.89770.89550.8934 “0.89120.88890.88650.88410.88360.88310.88250.88200.88150.8811
1.1871.1051.023
(A) Rehtiie Volume VAkat or volume at indicekd pressure pervolumeetsaturationpressure.(El)wwe Y. (mat - P)
&ebs)*(wvset-1]
Table A-6. Pressure Volume Relations.
80
.— ..—— .—-—.._ .-
.

——-— .———-- .... .-—— ..—-.. —. . . .— -.—-—. —
i40.0
S5.o
3Q.O
10.0
5.0
0.0
—-—— —.iReservoir Fluid Viscosity: Well 1I-8D 32 Fee
(CP d 10809 .
. .—.- ..- .-------- -—. .——.—. - -. .----L---- .. . . .. . .. .—-. --------- .-. ----—-—. . ..— -1—...—......... .... ........-........... ..——-.—.-—.....---+!l... --.-.-—.—----.-..———-—.. -—.— —..--1
,. - ..——- ..—-—. ..1
--- - — -. ... ... . . . . .- ...-. .—— - ..— . ...--—----7i
]-. . —.. ------ - . - - . . . .- —.-. -+— —
o 10QO 2000 300Q
Pressure, psig. . .—. — . .— ----- . . .— . . . . . - -.—-. ——— --- .
Figure A-1. Reservoir Fluid Viscosity from
4000 5WJ.
.. . . .- —-. . .. .
Well 11-SD.
,.
,,
~,
.’
:,
,
;.t’
,,
-.
81 .(——,—,= ~—. —.-.—----m------
Chevron U.S.A. Production CompanyWell IISD 32 Fee
RFL 990039
RESERVOIR FLUID SHRINKAGE ANALYSIS
Flash Gas/Oil Gas/Oil Stock Tank ~ Liquid Specific Oil PhaseConditions Ratio Ratio Oil Gravity Shrinkage Gravity of Density
( scfhbl ) I ( scfsTbbl ) [ at 60 ‘F Factor Flashed Gas ( grnfcc ]psig ‘F (A) I (m ( “AH) m ( .%=1 .000)
930 108 0.88110 “68 214 214 21.7 .9064 1.056 0.9197
Rsfb = 214
(A) Cubic Feet of gas at 14.73 psia and SO .F per barrel of oil et indicated pressure and temperature,
(B) Cubic Feet of ges at 14.73 psia and 60 “F per barrel of stock tank oil at 60 ‘F.
(C) Barrels of stock tank oil at 60 .F per barrel of oil at indicated pressure and temperature.
Table A-7. Reservoir Fluid Shrinkage Analysis.

.
Chevron U.S.A. ProductionWell 11-8D32 Fee
RFL990039
Company
INJECTION GAS 1RESERVOIR FLUID EQUILIBRIUM{Carbon Dioxide Added to Reservoir Fluid)
‘ (at108”F)
60 mole% CarbonDioxide/40 mole % Reservoir Fluid SystemEquilibrated at 950 psig at 108’F
Equilibrium Gas Phastx
57.26volume % at 950 psig and”l 08°F47.50 mole % at 950 psig and 108°F0.1531 gm~cc at 950 psig and 108=F0.680 Z-factor at 950 psig and 108’F
EquilibriumLiquidPhas=
42.74 volume % at 950 psig and 108°F52.50 mole % at 950 psig and 108°F0.8971 gmlcc at 950 psig and 108=F
Table A-8. Injection Gas /Reservoir Fluid Equilibrium.
.82

Chevron U.SA. Production CompanyWell 11-OD 32 Fee
RFL990039
Composition of Equilibrium Gas Phase[ From Chrornatographic Tti”que ]
LiqMol X GPM MW Dens
(d cc]
Hydrogen WideCarbon DtieNitJogenMdhaneEfhanaPropaneko-Butanerlwtaneis&Pantanan%ntaneHaxanesHap!anesoctanesNonanesOecanesUndecanesDodaoanes @lJS
am87.040.02
10.451.7s0.170.16ao70.060.030.060.100.05ao2arn
TraceTrace
.470
.047
.052
.022
.022
.ml
.023
.042
.023
.mo
.035
44.mo28.m316.04330.07044.03758.1235a1237215)7215084.0008S.000
107.00121.oo134.00
.Oln
.8086
.2s97
.3562
.5070
.5623
.5840
.6244
.s311
.Sa50
.7220
.74!33
.7640
.7780
Totats . . .. . . . . . . . I 100.00 I 0.727 I I
Properties of Plus FraA-ons
::
.’
,,
~,
>
,,
,-
-.
83
—-...._ _. ,,, ,,. -,- ... - ,., -.. -. . . -——
hcomponent Mol Z “Mw Dens AM
[d cc] Gravity,.
Hep!anes pfus 0.18 1039 a737Dccanes pfus o.m 134.0 0.7ss z
Sampling Conditions
950 psig108 ●F
Sarrrple CharacteristicsCoreLabsamPkrumbar207
CriticalPrmure@ia]................................Crii T~edure (%] .............................
Awage MolacufaIWeight ........................
Cafarfatad Gas GraviIY[air = 1.000] ...........
Gas GravityFactoi, Fg ..................... ....................... ..
Super Comprdbiity Factu. FINat sarrpbg Condbns ..............................
GasZ%ctorat sanding Codions “ .......... .............”..
at 14.73 @a and 60 “F
HealingVafue,Btu/scf dry gasGross ......................................................
“ Fronx Standing, M.B.,’Vofurnabic and PhaseBehavior of Oil F*Hydrocarb Systarns”’,SPE IDalas),1977, WI Edith- Il.
Table A-9. Composition of Equilibrium Gas Phase.
1o18.2528.4
41.03
1.417
J3i32
1.2035
asw
165

Chevron U.SA. Production CompanyWell ll$D 32 Fee
RFL8s0m9
Composition of Equilibrium Liquid Phase(byFlasluExtended Chromatography)
Component Nenre Mol % w% Derrsay MvV(grr’llCc)
Hydrogen Sulfide
Carbon Dmxide
Nitrogen
Evlerre
propane
iso-Bttarren-6@neiao-pertanen-PertaneHexanesHe@anesOckrnesNonanssDemnesUndeoaneaDodwelle
Tridemnea
TeirademnesPentedmarrmHexademnes
HeptademrresOctademnesNonadewrB
HeneaWnes
OocosanasT-es
Te!recosenmPentamsanes
HexaWWnesHeptamsanesOctacosenes
NonacasanesTriacorrtanes plus
0.00 0.0044.s3 12.s4
O.(CI O.M2.40 0.2si.38 0260.31 0.090.s2 0.190.?3 0.120.47 0.220.32 0.151.04 0.s63.88 234.45 3.053.48 2.883.13 2.682.s0 2.35229 2.36229 2.571.89 2.301.71 2261.40 1.98123 1.871.16 1.661.09 1.641.04 1.830.87 1.800.76 1.480.79 .1.610.s9 1260.73 1.600.s2 1.190.S6 1.340.82 1.s50.ss 1.42
11.10 40.3s
0.80060.8172
0.8C880.2s970.3s820.50700.s8290.68400.62440.6310.68500.72200.74500.76400.77600.78900.80000.61100.62200.83200.83900.64700.85200.8s700.68200.68700.67200.8770o.68io0.68s00.6690
0.88800.8s901.0782
34.0844.01
28.013.I6.043
3Q.0744.09758.12356.123
72.1572.~5
6496
107121134147161175190208222
, 2372612632752913&5318331
-3453s9374368402588
Totals 100.00 100.00
Sampling Conditions
950 psig108T
Total Sample Propeti-es
Molecular WsigM ..................................... 1S827
Theoreibal IJ@d Demsiy, grrrlsm .......... 0.6888
Plus Fradons jrdoi?+qwrsiwlhw
I I I I
iexanes plus 49.76 86.18 0.9236 271ieptanes plus 48.72 85.62 0.92S9 275)ecenes plus 36.82 779 0.9502 328Wtademnes phrs 24.82 8524 0S!$51 4113msanes plus 1823 55.43 lm150 475kn!amsenes pb 14.oa 47.45 1.0440 527rriemntenesplus 11.10 40.3s 1.0762 588
TableA-10. Compositionof EquilibriumLiquid Phase.
84

. . ./. . .
hscosity of C02 Swollen Oil: Well q14D 32 Feei! (CPat70809- - .. .... -,------—-.... . . ,-. . .. . ...... ._r-..-_-—__.,-----
Figure A-2. Viscosity of Equilibrium Liquid Phase or COZSwollen Reservoir Fluid.
105.00
100.00
95.00
90.00
85.00
80,00
75.00
7000
6s,00
60.00
II
I
Displacement
with Carbon
----- .. ..
RecoveryDioxide
t=
1500 2000 2500 3000 3500 4000 4500 5000 5500
Injection Pressure, psig
Figure A-3. Summary of Packed Column Displacement Tests.

——. . .—
Chevron U.SA. Production CompanyWell 11-8D 32 Fee
RFL 990039
Asphaltene Flocculation Experiment-N IR Scans( FromNear lnfrared~~r~py Technique ]
No Onsez ~etecred
AsphaRene Onset Experimentby Titration
Carbon Dioxide added to Reservoir Fluid
S.oo
av= 4.00_Ez 3J30gag *mzs=~ 1.00
2@~ 0.00c+z4 -1.00
-2000 20 40 60 En 100 120 140 lEO 100 2on 220
Carbon Dioxide A&led. mol?i
Asphaltene-Onset Experimentby Pressurizing
Reservoir Fluid / C02 System50).,,,.......,:. , ., . ., ., . . . . . . . . . . . . . . . . . .
. . . . :.. . :.1:. ..:. ,: . . . ,::: . . . . . . . . ;., . . ,.. ,.. : . .
al. . . .
... , . . . . . ..: .. :.., . . . . . .::, . . . .~ 4.m ::’::::’..”! ::::::;:.;”:” ::.:”:
:,g .-. . .!., ,, ‘:-—. .“: .’ ,,... ., .,. . .,, .
z . . . . . . . . . . .~ 3.m ;“:~
. .. . . . . .;. , ... , ,:-. ...1...:—-—. :.. .,,.,” . . . .~ : +--—-- ., ,,
g 2.CO --—;-- ----- ‘ --- --+ -’-–-~:-~-::%=-~=------ ~-- -:-L------—-- —._- ———. _.. — —al
—-—-. ,., .
> L—--— .——. : :——: :,—- —-.—_— -
~ 1.03 — ‘-.-.., -——— -,. ..:
. - ... .... 4. .--. -.-4-—— .. . . . .. . . . . . ..=.. .——. —_ ... .- .. . . .--. -.--. —_. L_-- L_——- .> ...<..- . . . .. .. . . . ... .. ... ,-. . -.---—— _._L---- . .: .. . .- .-. — .-- :-.-L -----
2 :. :.. . . . . !,. . .. . -~ . . . . . . . . . . . ,
as O.o1 .-_— A --’ :.: .,c _---- .____._&_—_&___ L- . . .,
—--- - --_._——+_5
--. —_- -.- —---- , .. . —-. . .:. ... .,... . ,. :,—— : ,:.
s -1 .al -: : .-. —+ —--..-. _L :,. ,.,--- :.--...-=+ —-—-. -. =---- -—__. _—-- .—-. >----- .,. ;,,:.. .0 ,- ——- +-... -_. __- L-. .._. L.-+ —_.._. -:: :“-._—-—-. —.. ---- ——4--—=—— ~..—-.-.-—= —-
-— ——--!-. . --._- A_--2.al
—-. . . . , .- —-—-—: --——----r-
500 1000 150) 2000 2500 3000 350) 4033 45no 5om 5S10Pressure. psig
Figure A-4. Asphaltene Experiment
86

/
-+ .
. ... .
. ...-
.. . .
,..
.— .
.—
..-.+.
..—.
—
. —-,
.—
7’.....
..—
.-—
w—
—..
\
-. .
.-
.
. .. .
——
— .-
.
. .. ..
,- ---
.——.
.... ,
8b
T-“””-”~-’”-
- -.
. . ..
.“ -.. .
-., . . . .
--e
-. .-
—
wo-
.....
.,.
-—
-.—
..-,
-.. -..
---
.:
ii
i... . .. . .. . . . . . . . . ...-. ..,. ., :..’ ..-,- ,,’

—.— —. .— -.
.
APPENDIX B
AVERAGE RESERVOIR PROPERTIES
t
\
.,,
,,
IL
,,
89‘.
:v,-,.-.,.,,..:.!,...A.,,,.,.,.. ,,.!,,.-.... .. ...... _,?.. .. ,,>,x,..,.!., . , ,,..,.,,..-,,..,.,.,.X,AT.,%+.......?’.<../,.I...=.~..i .... .. .. . . . .. ..

_————.—————.—_—_ ..—..—-._.. .——— — .-
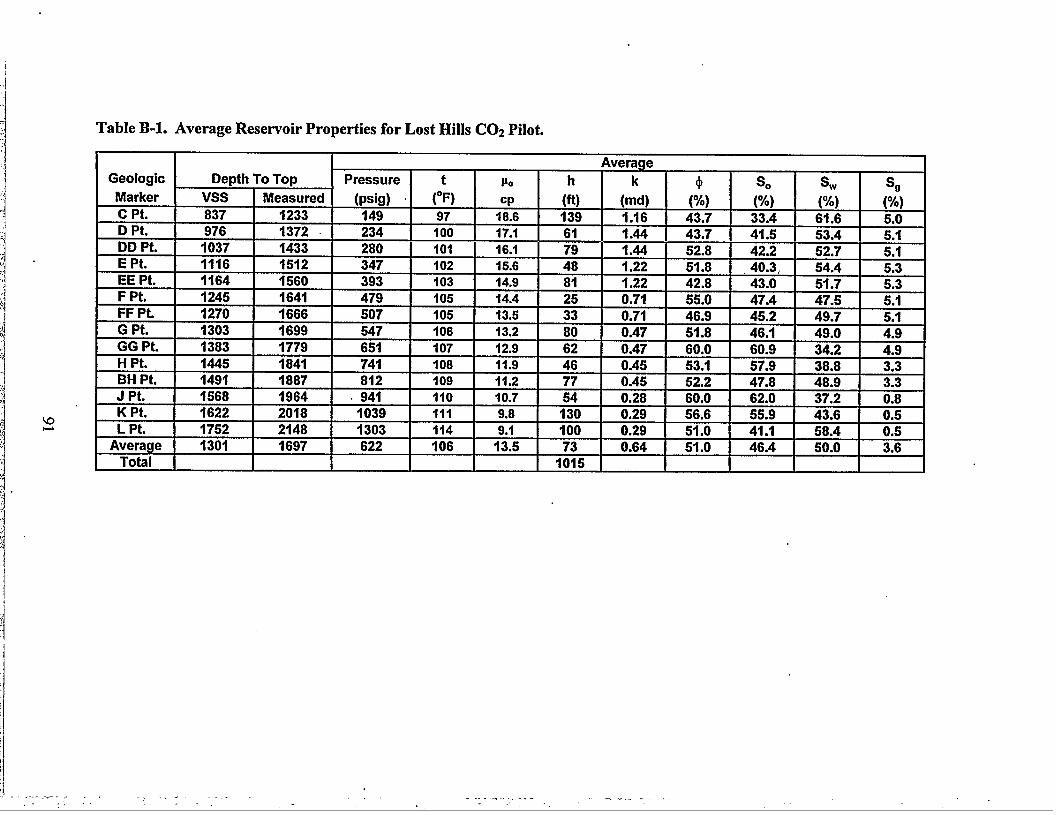
Table B-1. Average Reservoir Properties for Lost Hills C02 Pilot.
I Geologic ~ ‘ pressure I t I PO I h--rrre , + , % , Sw , s. ,
I—... #DD Pt. 1; ‘.I 1 t~ I ..- 1 .
,.— —
Marker VSs Measured (psig) ~ (°F) Cp (f,) (red) (%) (%) (%) (%)c Pt. 837 1233 149 97 18.6 139 1.16 43.7 33.4 61.6 5.0D Pt. 976 1372 234 100 17.1 61 1.44 43.7 41.5 53.4 5.1
D37 1433 280 101 16,A 7fi 4 AA 52.8 42.2 52.7 5.1E Pt. 1116 1512 347 102 15.6 48 1.22 51.8 40.3, 54.4 5.3EE Pt. 1164 1560 393 103 14.9 81 1.22 42.8 43.0 51.7 5.3F Pt. 1245 1641 479 105
-—.35.0 47.4 47.5 5.1
270 1666 507 105 I 13.5 I 33 I ().71 I 46.9 45.2 49.7 5.1117 51.8 46.1 49.0 4.9
,2 4.9
I 14.4 I 25 I 0.71 I :ii Pt. 1;G Pt. 1303 1699 ‘--547 106‘-- ‘---13.2 ii O.d.. _..- ----GG Pt. 1383 1779 651 107 12.9 62 0.47 60.0 60.9 34.H Pt. 1445 1841 741 108 11.9 46 0.45 53.1 57.9 38,BH Pt. 1491 1887 812 109 11.2 77 0.45 52.2 47.8 4“J Pt. 1568 1964 . 941 110 10.7 54 0.28 60.0 62.0 3K Pt. 1622 2018 1039 111 9.8 130 0.29 56.6 55.9 4
L Pt. 1752 2148 1303 114 9.1 100 0.29 51.0 41.1 5
Average 1301 1697 622 106 13.5 73 0.(
Total 1015
&H--l17.2 I 0.8 I
V=I==&%
. . ...------- ,.,. . .. . ... .. . . . . .. . .:,,’ ,- >. . .. .
,..,’.

I
i
.....-...-”..-.+...................._.-+..
i;’ ,,,; ,,
.... ..,..-”..... . . . . . . . . . . —“.-. -.. .- ——.—.. -—m-—.—.——— .— -.. .— .—s .---”—. ”...”-.. Z — .-....-.+ .--_ ---__ --,_.,
,,
~ —.-. — +. —-.-.. -..--- ”----- -.—.——— —t ‘, I,lLOsT HILLS WELL 12n8DRFT DATAII ‘ ,,,
,,,,,4,,,,,
,’——,, —-. —. A”.”,”J
1
t,.. ....“ .. ”.,.”. . . . . .-”
D Pt,
-—-. . ..—
E Pt.
I
I FF pt,
,’ I.“.-~..-’:,.....
{ [[
.,, .
.,,.. . ..&
.,.
-.-, -T–”:’-?-’–”-” --”--1’ I
1200! -’-1--’--[’’”---’”--1-”””-‘--II
I
t]
11
t
3
~. . . . ,.. . . ..”-. — . ..’ ‘-””-~““”‘[--’”.“-p”””!’ $
,---
11--------...................-..-.......
!
I
,
. . -..., , ..+”.,.. ... . ...,~..
,,,
1:300’.“,
I-.. .,,”,
I
1.-—-...,.+.......---.———
(3G I
J........
i.“---- ;- ,. . . .
1t
.. . “ ,,,.. . . . . . .-
1 ~/
!----- _“. -+ -.—- . ___ . . . ,. . . . ..- . .
ii DD Pt,~,.— .—. ..-.= .—- .. .--...”.,——--
1
—----_ . .
---.,..
Ii
f... .. . . !
I
5J
!fq~ol
I
..—, ..—
.. .
--- .
Pt*
....,,..
...—
.----......__..]. .,..”i,...,.._t ..--”j=....._\...”...... . ..I ‘ “i
1!1 i
. .~-. “
I
.,- .-. ,. .....-.
/
------------- –.-i -------- ~---------””’-
“~..:l-~__J . . . ..!.. ________,.
G Pt;
7
‘HP.e— —
IL,
. . ... .,.,,., .,,; ,f:g~j{
I,,
. . . .. . ... . .
--”.”. . . . . . . —...—. . .— —~’
~p~ &@
——-.L.——
: ; ,,
: i jtt’()(j] ._J._.l.__L_!, .,’,<....x.--.” .- ..JOL. L.. ./100). .. fill ........= ..fiool----- ...WOOL.,... .i50i. _:,.._x’--’1-:---------------...... ...>.. . -...-..,..”,., —\.--..-””--.-==--:...u<..- 600~..... . .. ..,17001_‘:. 1806!... .,. jg~o!..:.:,..:,,~,,~. . .. . ..<+,., ..-----~x,.,.,.-”.-.-.—...-.,,+.,,.—..-..-—-.,.....<.--—,7..-.w...... .. .... ... ... ..-...”..,,
I..
Ngu]4c B-L Awwgc RFT Prcssut”c Data for Lost Hills COZ Pilot,

APPENDIX C
REVISED DOE SPENDING PLAN
.
93
,,
.,
‘,
r
,.
.’
.
,,
:“
:
!
.’ -~T-m’T7r- $,’..<.,., . . . . . . . ..- . . . . . . . . . .. ...>.,. ,,, . . ..’,. .<6 . ., ,. >..2 ., ,,%<.. . . . . . . . . . . . ,: . . . . . -,.-<,-- .
.7 ...,

-..— .——...
.
,


Table C-1. C02 Pilot Cost Summary Spreadsheet (continued)Lost Hills DOE ProjectProjectTasksandBudget
OrIglnal Pilot RavltrodPilot WE SHARE CHEVRONTank Numberand Name Resourma Budget(12/98) Budget(10/99)
L Pilot Start-upActlvlllaa(Noto1) SHARE
CUSA1.1.startupproductlonfadlities 5,rXm s - $ - $1.2,Stort-upC02 InjadlonFedlilisi 5,Ci30$ - $ - $, A ,.,, !--- ,.-.. ,., --.!-- ..,, &“-—
I moo $ - $ - $
I------- .. . .. 1 , . 40,000 s - $ - s
1
$
Is s 2!
I.a mmim uu IrIFJCItonwwrvrunnonant Supply $.,
m,htdnl far 1. *
wmrsesillen analvsls $ la
mlerwell tracers (inject in in Iactora, oamrh producers) s ,4.
Tilhnaler survevs $ 1(EM SUWOV +-,.,””,
Cross-wallseismicsurvav(LBLtoFund)-., .
I $25,0Slellcpressuresurvavs $12,0Gas comrsasitlonanalvsls $12,0PVT RaaarvekFluidSempleandAnalvsls 1$
,:----!
J. PilotMonltorfng CUSAIniactorM Ies s- 72,000 $30,0M s 15,0LXI s 15,0f.ml
Casad-hdareolslivitvIenolrsnandanalvsls $ &l,ooo $20,00C,$ Io,CCa s IO,CWJ
Ges 3,000 S120JXXIs EO,ooos Srr,coo,.. —— .&330 $40,0cd s m,ooo $ m,m.
I02,0CC $%!ood s 2S,000 s 2s,ooQmm wlrvj(j$ 25,001 $ 25,000
Dds 12,500 s 12,500Kids a,cm s wooKids S,ooo $ e,ooo
120#cxxll $15,00d$ 7,500 $ 7,5009A fld t+9 rvd % 6,000 $ S,m.
S,ooo $ IS,CCJ3
‘4,000 $ 214,000
Staticcressuraaufvava I $ L .,--”, .- ,”.- -corrosioncarwl oandLxobas s I $36,00d $ 1
Subtotal for * I s 492,0001$ 426,0001s 211
Pilot CAPEXTotek s 9,643@oo s 4,120,750 $ 1,700,663 s 2,4m,188
AddltIonelFundingfor OaslgnfScoplngof LongTerm C02 Supply: s 250,000 $ 260,000
I I I 1 1
CAPEXTotal Includlng C02 PmJoc4 Scoping LlPlannlng 1$ 4,370,7601$ 1,700,6s31$ 2,670,1S6
fK. C02 lnJactlonEqulpmantL%Purchaaaa (MEJ: Expense Items)K.1 RentalofC02 lnJectionEqulpmenl.%Start-up asalatanaa SOC orldr Llqulde $ 277,0C0 s 136,500 s 136,500
I(.2 LlquldC02 Purchases(C41 MMscfdlnJadlonrale) - Nota3 s 2,a5s,occ s sm,ca $ 1,935,000.
Exmmm Tot.Yl: s 2.a32.000s 766.600 s 2.073.600
WE ExpandltumSummaryEspandlturaaforlnjectivlty Tact and Pilot Oaalgn (as of 10
CareyIn from “WEOrfalnal Phase II DOE FUnd
t-..P.........——— . .
IIu.!tshtm nh,. c. M ml= c,m.-!lrm t. Dhn.m 1 s?mrru In & Ph”am II F,, mil”ml
I 1 r
ProJectTofel Capital+ Espanse for2 Yeara ($) 1$ 9,6.42*OO4I$ 6,9S2,7601$ 2459,0s31 $ 4,743,000
I:.-
D/1/s9h $ S46,000 $ 160,000$ 496,000
[Phaaa l“: ~ 97,896—
‘Inw ; 2,616,400
1
)“-.”,, ””,” , ,,”-” ,, ““- . -,, ”...W,—. ..”. ” . -“.. , .,. . .,--- .. . . ... .... ! s 2,S13,302
PmJactadPhasoII 00E Expanditfuras $ 2,609,003
LChavron EspanditumSummary:
Chavmn Capital Fundl..e ..-7 --------------Total chevron Expanse Funding Raquaatad
3
io73;600
Total Naw ChavronFunding(Capital+ Expanaa) “--””--’”’ 6,743,s66
Totsl PhasoII Expsndltums(IncludinghsJactlvltyTest) .s 6,424,SS8
I I I 1 I 4I 1 I I I
hm RmunWMS for Pilot IsI
2.670,16SI i I I Is 2
I
I
I
Noto1: Task Costs to bs split 60/50 unleaa noted otherwfseNote 2 Charge cedes for each tankwfll bs pmvldsd at a tatsr dateNote X CAPEXfor wells msy bs lass -In Wslchcase 00E fundingwould be ussd to purchase C02 (psndlngDOE approval)
.