Embed Size (px)
Citation preview

Distribution Automation / Smart Grid
Kevin Whitten

Main Overview Distribution Reliability
Distribution Automation
Smart Grid

Distribution Reliability

• Introduction to Distribution systems• Distribution Reliability• Standard Reliability Metrics• Information Required for Reliability
Evaluation• Predictive Reliability Evaluation
• Analytical Methods• Simulation Based Methods
• Methods to improve reliability
Distribution Reliability -Overview

• 5kV- 69kV system class• Layout
• Substations• Primary distribution system• Secondary distribution
system• Largely a radial system
with single, two and threephase lines.
• Responsible for themajority (about 80%) ofcustomer interruptions thatare either momentary orsustained.
Woods CreekSubstation Feeder 1810
Feeder 1810Feeder 1811
Feeder 1808
Feeder 1809
(to ThreeLakes)
(to Sultan)
(to Sultan)
Distribution Line
N.O. Switch
N.C. Switch
Feeder Boundary
Fuse
Recloser
Sectionalizer
SectionWCA45
Introduction to Distribution Systems

Distribution Reliability Motivation/Objective◦ Determine the system reliability and customer satisfaction: Number of momentary and sustained interruptions Duration of interruptions Number of customers interrupted
◦ Improve system performance◦ Basis for new or expanded system planning◦ Determine performance◦ Maintenance scheduling and Resource allocation

Requirements for Distribution Reliability Utilities generally require an overall
average of one interruption of no more than two hours’ duration per customer year
Corresponds to an Average Service Availability Index (ASAI) greater than or equal to 8758 service hours / 8760 hours◦ 99.9772% Reliability

Standard Reliability Metrics
Load point indices◦ Determine for each customer The Number of outages (per year) The Duration of outages (per year) Unavailability / Availability of service
System wide indices◦ SAIFI (System Average Interruption Frequency
Index)
◦ SAIDI (System Average Interruption Duration Index)
T
i
NN∑=
T
ii
NNr∑=

Standard Reliability Metrics Contd.
◦ CAIDI (Customer Average Interruption Duration Index)
◦ CTAIDI (Customer Total Average Interruption Duration Index)
◦ CAIFI (Customer Average Interruption Frequency Index)
◦ MAIFI (Momentary Average Interruption Frequency Index)
CNNr ii∑=
SAIFISAIDI
NNr
i
ii ==∑∑
CNNi∑=
ServedCustomersofNumberTotalonsInterruptiCustomerMomentaryofNumberTotalMAIFI =
T
ii
NNID∑=
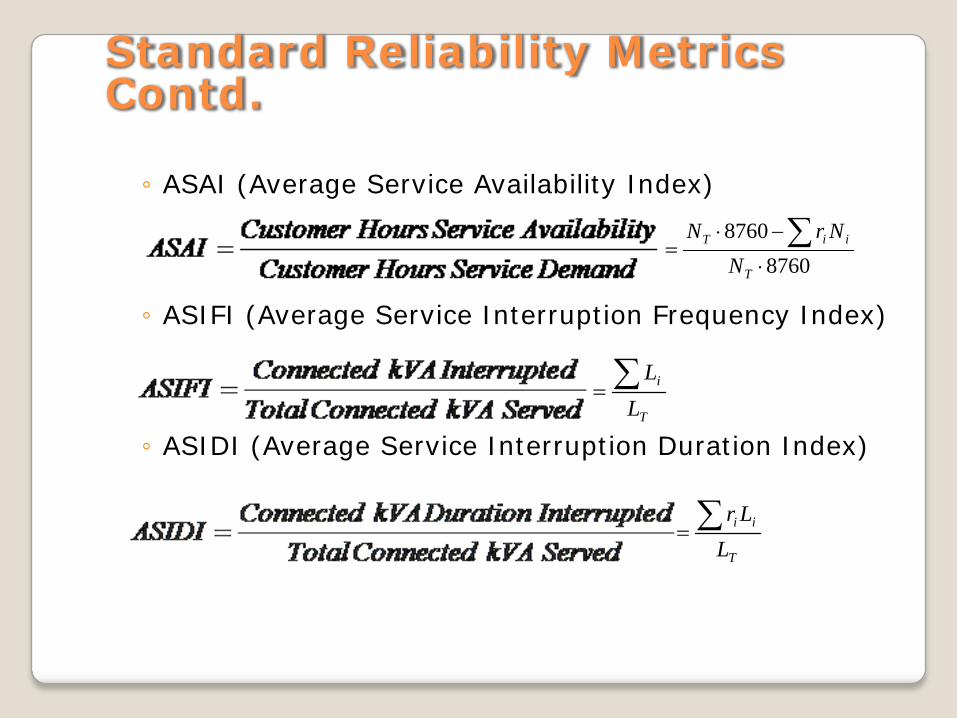
Standard Reliability Metrics Contd.
◦ ASAI (Average Service Availability Index)
◦ ASIFI (Average Service Interruption Frequency Index)
◦ ASIDI (Average Service Interruption Duration Index)
87608760
⋅
−⋅= ∑
T
iiT
NNrN
T
i
LL∑=
T
ii
LLr∑=

SAIDI SAIFI CAIDI ASAI
90 min/yr 1.1 Interruptions/yr
76 min/year 99.82%
Typical Values for Basic Reliability Indices

Historical Vs Predictive Analysis Historical Analysis◦ Use system outage histories to computeindices that reflect past performance of thesystem◦ Basis for most short term decision making◦ Used in the computation of failure rates andrepair times required as input to predictiveanalysis
Predictive Analysis◦ Combine system topology with a set oftechniques to estimate load-point andsystem indices◦ Basis for most long term as well as shortterm decision making

Information Required for Predictive Reliability Evaluation
System topology
Reliability parameters◦ Over-head and underground line segments Permanent Failure Rate (λp) Temporary Failure Rate (λt) Mean Time to Repair (MTTR)
◦ Protective and Switching Devices (Reclosers, Switches, Fuses, Breakers, etc.) Probability of Failure (POF) Protection Reliability (PR) Reclose Reliability (RR) Mean Time to Repair (MTTR) Switching Reliability (SR) Mean Time to Switch (MTTS)
Customer and Load Information

How to Compute Reliability? Analytical Methods◦ Use system topology along with mathematical
expressions to determine reliability indices
Simulation Based Methods◦ Compute indices by simulating the conditions on the
system by generating system states of failure and repair randomly
Assumptions made in Analytical Methods
◦ Temporary and Permanent fault processes areindependent and mutually exclusive◦ Occurrence of a fault excludes the occurrence of
another until the system is restored to normalcy. Canbe a reasonable assumption if the system spends amajority of the time in its normal working state

Accounting for Protection and Switching Failures When a protective device fails to operate after a fault occurs
downstream of it, the backup protective device operates andclears it causing more number of customers to be interruptedfor a longer period of time.
When a switch fails to operate, customers are not restoredand experience a duration equal to the MTTR of the fault.
Fault (λ)
Device Operates (PR)
Device fails (1-PR)
PR*λ*Response 1
(1-PR)*λ*Response 2

Zone-Branch Reduction
Substation
M1
S1(NC) F1
L1
BRK
C1
M2L3
F2
L2C2
S2(NC)
M3
C3L4
S3(NO)
F3
L5C4
900 Customers, 1800 kVA
550 Customers, 1100 kVA
450 Customers, 825 kVA125 Customers,
300 kVA
AlternativeSupply
ZoneNumber
Device Name
Branches in the zone
Branch 1 Branch 2
1 BRK M1
2 F1 L1
2 S1 M2 L3
3 F2 L2
3 S2 M3 L4
4 F3 L5

Methods to Improve Reliability
Maintenance◦ Corrective Maintenance◦ Preventive Maintenance Time based or periodic maintenance Condition based preventive maintenance Reliability centered maintenance
Reduces both the momentary and sustained outage frequency
Installing reclosers and breakersReduces both the outage frequency and duration
Fuse saving and Fuse clearing methods◦ Self resetting fuses
Reduces both the outage frequency and duration
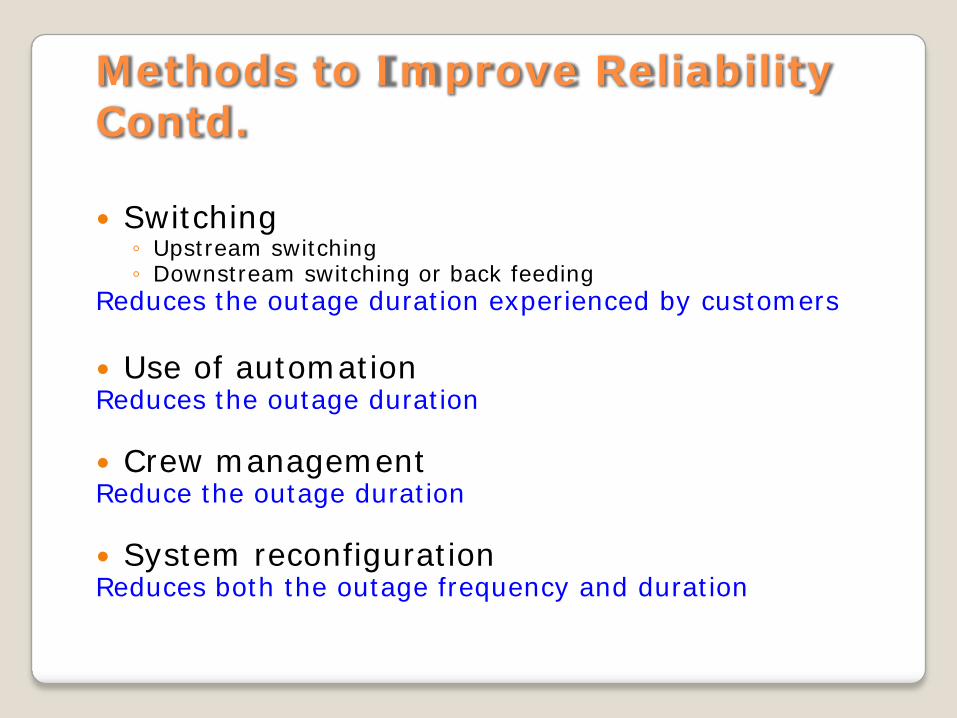
Methods to Improve Reliability Contd.
Switching◦ Upstream switching◦ Downstream switching or back feeding
Reduces the outage duration experienced by customers
Use of automationReduces the outage duration
Crew managementReduce the outage duration
System reconfigurationReduces both the outage frequency and duration

Distribution Automation
• Introduction• Distribution Automation
• Necessity• Technology• Challenges
• Better Power Quality• Drivers• Power quality products
• Efficient Power Utilization• Different efficient power utilization• Efficient utilization solution
Distribution Automation -Overview

• Reliability• Continuity of power supply • Fault detection, isolation, service restoration after fault
• Quality• Voltage, power factor, Harmonics, Frequency variations
• Efficiency• Technical losses, commercial loss
• Unplanned Growth of Electric Power Network• In Distribution; cause of difficulty in Management of the
network• Complexity
• Of network, Of technology• Cost
• Implementation cost, maintenance cost• Time
• To meet the requirement of customer within shortest time
Issues in Distribution System

• To measure, protection control and monitor the components which are remotelylocated outside the substation
• To integrate all substations within a circle and all such components which areremotely located outside the substation for performance analysis
• To make fault detection and automatic isolation
• To integrate automatic meter reading to avoid manipulation and loss of revenueby integrating DA with Automatic Billing and Collection Center
• To maintain load shedding schedule automatically
• To monitor network topology and network components (assets)
• To increase overall efficiency, reliability.
• To make operation and maintenance easy
• To save the time gap between a trouble call by a customer and actual service byintegrating DA and Trouble Call Management
Distribution Automation – A Necessity

• Components of Distribution Network:• Transformers• Ring Main Units• Substations
• Basic Components of Automation:• Master Distribution Automation Software• Engineering analysis software• Data Acquisition and Control Hardware like Relays,
Digital Multifunction Meters, Remote Tap Changer• Communication Hardware
• Basic Features:• Monitoring• Control• Protection
Distribution Automation –Technology

• Necessary Functions:• System Level
• Monitoring• Control• Substation Automation• Feeder Automation
• Customer Level• Remote Meter Reading and Billing• Load management• Customer Automation
Distribution Automation –Technology

• Monitoring and Control Functions:-• Data Monitoring• Data logging• Remote Meter Reading and Billing• Automatic Bus/ Feeder Sectionalizing
• Fault location, Isolation and Service Restoration• Feeder Reconfiguration and Substation Transformer
Load Balancing• Substation Transformer overload
• Integrated Volt/ VAR Control• Capacitor Control• Voltage Control
• Emergency Load Shedding• Load Control
Distribution Automation –Technology

Global Architecture of Distribution Automation and Management System
Distribution Automation –Technology

• Covering Large Area
• Geographical and atmospheric Problems
• Interoperability Issues
• Huge Data Handling
• Data storage and related care
• Care of future expansion
Challenges in Distribution

• Increase in nonlinear loads has ignited a demand for increased power quality on the grid• Harmonics need to be accounted for
• Examples of nonlinear, harmonic causing loads:• Electronic equipment such as PC• Battery chargers• Lighting dimmer controls• Fluorescent lights• Welders• Electronic ballasts• Printers• Photocopiers• Fax machines
Driving Force for Distribution Automation –Power Quality

• Mechanical Switched Capacitor• Current based• p.f. based
• Thyristor Switched Capacitor (TSC)
• Static Synchronous Compensator (STATCOM)• LV (415V, extendable up to 690V), ratings 110kVAR,
200kVAR, 500kVAR• LV (415V) 1-ph STATCOM, 100kVAR & module
paralleling for high power rating
• MV (11kV and above) STATCOM
• Voltage dip compensator
• Thyristor “Q” Compensator
Power Quality Products

IEC 61850• Standard for the design of electrical substation
automation.
• Features:• Data Modeling — Primary process objects as well as protection and
control functionality in the substation is modeled into different standard logical nodes which can be grouped under different logical devices. There are logical nodes for data/functions related to the logical device (LLN0) and physical device (LPHD).
• Reporting Schemes — There are various reporting schemes (BRCB & URCB) for reporting data from server through a server-client relationship which can be triggered based on pre-defined trigger conditions.
• Fast Transfer of events — Generic Substation Events (GSE) are defined for fast transfer of event data for a peer-to-peer communication mode.

IEC 61850• Features (cont):
• Setting Groups — The setting group control Blocks (SGCB) are defined to handle the setting groups so that user can switch to any active group according to the requirement.
• Sampled Data Transfer — Schemes are also defined to handle transfer of sampled values using Sampled Value Control blocks (SVCB)
• Commands — Various command types are also supported by IEC 61850 which include direct & select before operate (SBO) commands with normal and enhanced securities.
• Data Storage — Substation Configuration Language (SCL) is defined for complete storage of configured data of the substation in a specific format.

How The Grid Is Getting Smarter
Distribution Automation and the Smart Grid

Smart Grid

• Motivation
• Sensing and Measurement
• Communications and Security
• Components and Subsystems
• Interfaces and Decision Support
• Control Methods and Topologies
Smart Grid - Overview

US Electricity Grid
Aged
Centralized
Manual operations
Fragile

Affected 55 million people
$6 billion lost
Per year $135 billions lost for power interruption
Northeast Blackout – August 14, 2003

Smart Grid
Uses information technologies to improve how electricity travels from power plants to consumers
Allows consumers to interact with the grid Integrates new and improved technologies into the
operation of the grid

Smart Grid Attributes
Information-based Communicating Secure Self-healing Reliable Flexible Cost-effective Dynamically controllable

Advanced Sensing and Measurement
Enhance power system measurements and enable the transformation of data into information.
Evaluate the health of equipment, the integrity of the grid, and support advanced protective relaying.
Enable consumer choice and demand response, and help relieve congestion

Advanced Sensing and Measurement
Advanced Metering Infrastructure (AMI)◦ Provide interface between the utility and its customers: bi-direction control◦ Advanced functionality Real-time electricity pricing Accurate load characterization Outage detection/restoration ◦ California asked all the utilities to deploy the new smart meter

Advanced Sensing and Measurement
Health Monitor: Phasor Measurement Unit (PMU)◦ Measure the electrical
waves and determine the health of the system.◦ Increase the reliability
by detecting faults early, allowing for isolation of operative system, and the prevention of power outages.
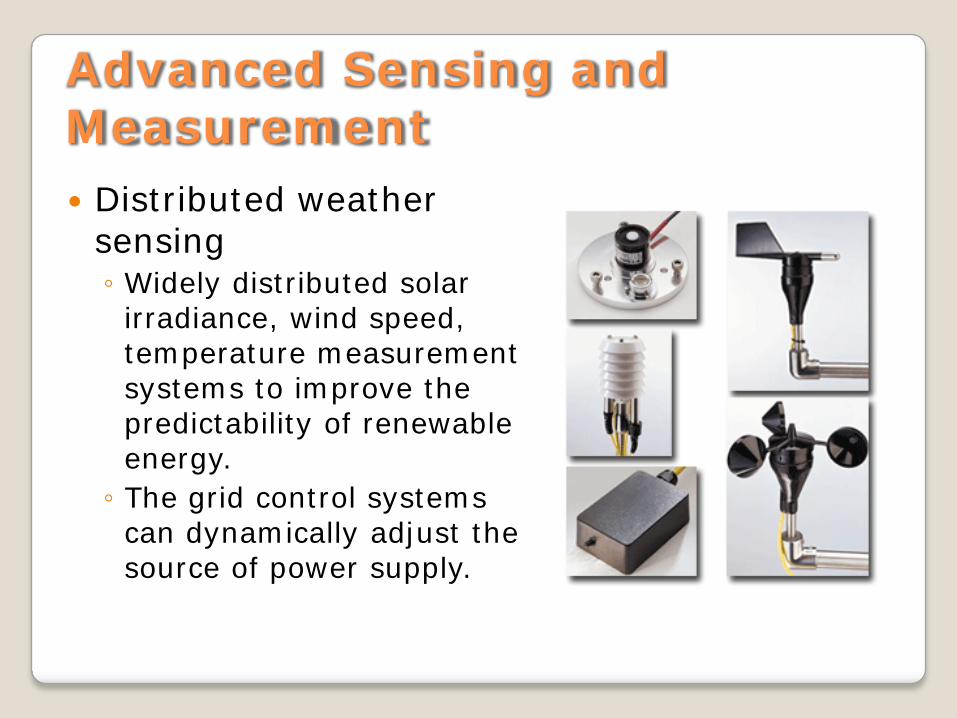
Advanced Sensing and Measurement Distributed weather
sensing◦ Widely distributed solar
irradiance, wind speed, temperature measurement systems to improve the predictability of renewable energy.◦ The grid control systems
can dynamically adjust the source of power supply.

Integrated Communications and Security
High-speed, fully integrated, two-way communication technologies that make the smart grid a dynamic, interactive “mega-infrastructure” for real-time information and power exchange.
Cyber Security: the new communication mechanism should consider security, reliability, QoS.

Wireless Sensor Network
The challenges of wireless sensor network in smart grid◦ Harsh environmental conditions.◦ Reliability and latency requirements◦ Packet errors and variable link capacity◦ Resource constraints.
The interference will severely affect the quality of wireless sensor network.

45
Advanced Components and Subsystems
Advanced Energy Storage◦ New Battery Technologies Sodium Sulfur (NaS)
◦ Plug-in Hybrid Electric Vehicle (PHEV) Grid-to-Vehicle(G2V) and Vehicle-to-Grid(V2G) Peak load leveling

Advanced Components and Subsystems

Improved Interfaces and Decision Support
The smart grid will require wide, seamless, often real-time use of applications and tools that enable grid operators and managers to make decisions quickly.
Decision support and improved interfaces will enable more accurate and timely human decision making at all levels of the grid, including the consumer level, while also enabling more advanced operator training.
Smart Grid Application

48
Improved Interfaces and Decision Support
Advanced Pattern Recognition
Visualization Human Interface◦ Region of Stability
Existence (ROSE) Real-time calculate
the stable region based on the voltage constraints, thermal limits, etc.

Control Methods and Topologies
Traditional power system problems:◦ Centralized◦ No local supervisory control unit◦ No fault isolation◦ Relied entirely on electricity from the grid
IDAPS: Intelligent Distributed Autonomous Power Systems
Distributed Loosely connected APSs Autonomous ◦ Can perform automatic control without human intervention, such as fault isolation
Intelligent◦ Demand-side management◦ Securing critical loads
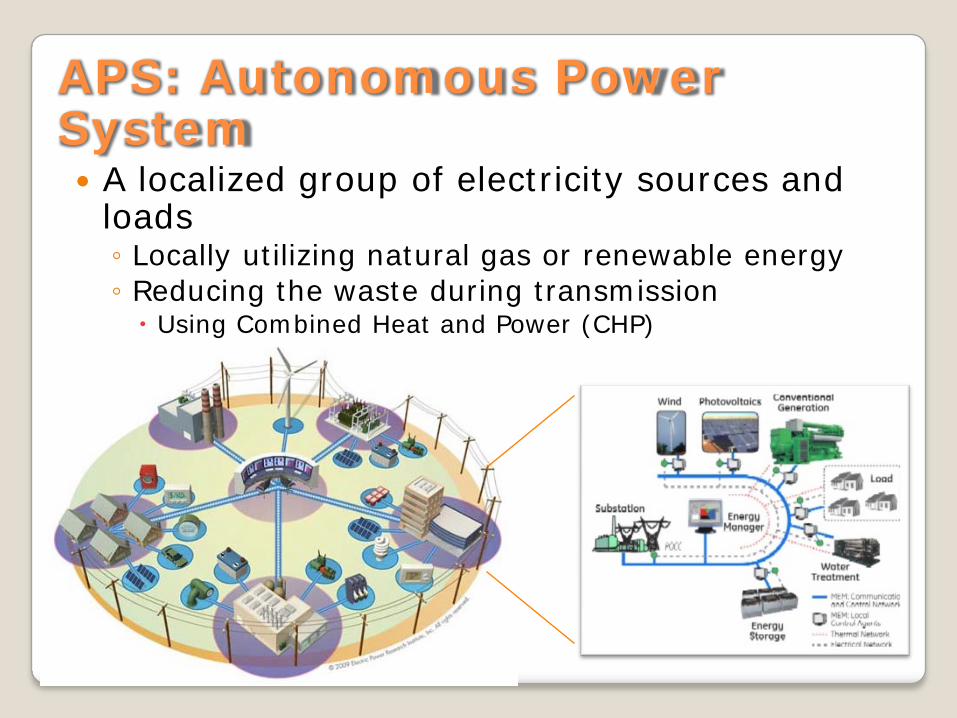
A localized group of electricity sources and loads◦ Locally utilizing natural gas or renewable energy◦ Reducing the waste during transmission Using Combined Heat and Power (CHP)
APS: Autonomous Power System

Multi-Agent Control System
IDAPS management agent◦ Monitor the health of the system and perform fault isolation◦ Intelligent control
DG agent◦ Monitor and control the DG power◦ Provide information, such as availability and prices
User agent◦ Provide the interface for the end users

IDAPS Agent Technology

Questions?