Embed Size (px)
Citation preview

Distributed, Collaborative Processing System
(COBRA Virtual Office)


Distributed, Collaborative
Processing Systems –Some Prospects
E-Commerce
B2B and B2C
-Collaborative Product design
-Collaborative Product decision
Software Engineering Environments
-Distributed Collaborative system design space
Group communication
-Net meeting
-PDA, PCS etc
-Virtual class rooms
Personal entertainment
-On-line video games

Multiple users at different locations can work on one design collaborativelyand simultaneously. No travel and no delay.
Higher Productivity,Lower cost,Better Traceablity.

COBRA= Collaborative behavioral Requirement and Architecture
FOR
• Modeling requirements• Designing architecture • Evaluating existing architectures/components if they can meet new requirements•Monitoring projects

The System Provides
• Communication of Knowledge
• Simulation
• Project Management
• Traceability

History of COBRA
• Started in 1994 as a research prototype
• Initial implementation in c/c++ and tc/tlk
• Current implementation in Java

Main Challenges seen previously
• Poor documentation of the system
• Insufficient communication when projects passed from semester to semester.
• Poor communication among members resulting in integration problem
•Reinventing the wheel due to poor code comments.

The system is implemented using Java/JavaBeans so as to enhance platform-independence, interoperability, composability (plug-and-play), and distributability.
Platform Independency

The system will be used to model the behavior of a variety of system types, including a mobile communication system.
Hence, we will be using a particular scenario for the particular system chosen to be modeled.
System Applications

Usecase for COBRA system
<<Uses>>
<<Uses>> <<Uses>
> <<Uses>>
<<Uses>>
<<Uses>>
<<Extends>>
<<Extends>>
<<Uses>>
<<Extends>>
<<uses>>
TCP/IP connection
<<uses>>
<<Extends>>
<<Uses>>
<<Uses>>
<<Uses>>
<<Uses>>
<<Uses>.
<<Uses>> <<Uses>
> <<Uses>>
<<uses>>
TCP/IP Connection
TCP/IP connection
<<Extends>>
User 2 Site, participant & Collaboration coordinator
Site 1 Particiapant & Collaboration Intiator Site 3
Particpant COBRA GUI Application
COBRA GUI application
COBRA System
Public Window in use
Virtual Office_1
Check Prelimnary Collaboration Plan
Display work bordcasted to/from other users
Petri Net Application
CPM/PERT Chart Application Draw and simulate CPM/PERT Chart
Begin Collaboration
Private Window in use
Friend window in use
Display individual user's work separately
Track work Progress acitivty
Draw and Simulate Petri Net
Virtual Office_3
Start Collaboration
Negotatiate and resovle conflicts
Virtual Office_2
Terminate Collaboration
Register Participants
Detect and record conflicts
Monitor Collaboration acitivity
Participant 1 is a collaobrator who initates the collaboration seesion
The content of the COBRA system package for User 2 is the same as user 1. Omitted for diagram clarity purpose
Collaboration Coordinating System
Get consensus on work completion
Send Messages between participant and coordinator
Brodcast work to other users
Brodcast work to other users
The content of the COBRA GUI application package for User 2 is the same as user 1. Omit ted for diagram clarity purpose
COBRA System
Collaboration Coordinating System
The content of the collaboration coardination sysytem package for User 1 is the same as user 2. Omitted for diagram clarity purpose
COBRA System

Cobra Virtual Office Functionalities
• Constructing Augmented Petri-Net (FSM) for System Behavior Modeling
•Constructing PERT Chart for Project Scheduling and management

As a test-bed, we are working on the modeling and analysis of system behavior using Augmented Petri Net (APN), a formalism which is expressively more powerful than Finite State Machines.
Constructing Augmented Petri-Net

More about Augmented Petri-Net
A form of FSMs, first proposed by C. A. Petri in 1962 A notation for defining abstract concurrent processesPrimitives:
Place
Transition
Token
TWhen all input places of a transition are enabled (i.e., with a token) and the external stimulus associated with the transition occurs, the tokens move from the input places to output places

Fundamental notions: Sequencing
T2
T1
T2T1
Concurrency
T2
T3Synchronization
T1T3

ONTARIO
Site
TEXAS Site
NORTH CAROLINA
Site

Collaborative Processing (view from Texas)
Public Window
S 1
S 1 2
T 1 1
T 1
T 1 3
S22
S 1 3 T 1 2
S 1 4
S 2 1 T 1 4 T 2 0
S 2 0
S 2
TX Window
S 1
T 1
T 1 3
S22
T 1 4
S 2

Collaborative Processing (view from Ontario)
Public Window
S 1
S 1 2
T 1 1
T 1
T 1 3
S22
S 1 3 T 1 2
S 1 4
S 2 1 T 1 4 T 2 0
S 2 0
S 2
ON Window
S 1 2
T 1 1 S 1 3
T 1 2 S 1 4

Collaborative Processing (view from North Carolina)
Public Window
S 1
S 1 2
T 1 1
T 1
T 1 3
S22
S 1 3 T 1 2
S 1 4
S 2 1 T 1 4 T 2 0
S 2 0
S 2
NC Window
S 2 1 T 2 0 S 2 2

Simulation
The system’s simulation functionality represent the behavior of Petri-net

Simulation (Cont’)

Another Aspect of the Virtual Office
Monitoring and Scheduling Projects Using PERT Chart


Why Do We Need PERT Chart
• Allows users to express time dependencies for project tasks
• Analyze the project critical path
• Tracks project progress to ensure that delay is recognized
• Provides a road map for a project manager
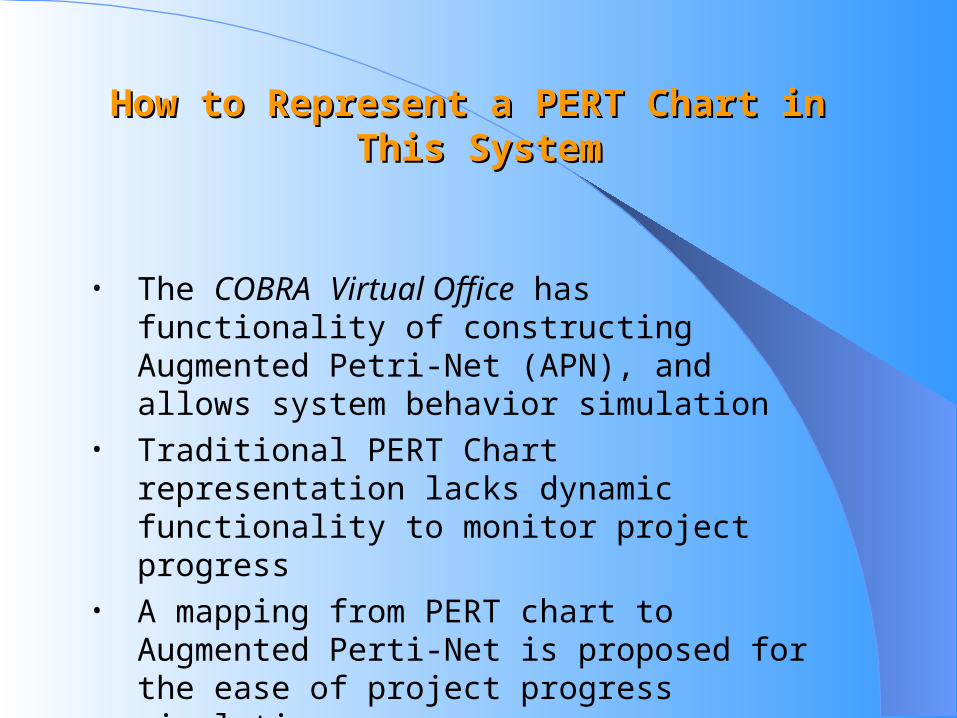
How to Represent a PERT Chart in How to Represent a PERT Chart in This SystemThis System
• The COBRA Virtual Office has functionality of constructing Augmented Petri-Net (APN), and allows system behavior simulation
• Traditional PERT Chart representation lacks dynamic functionality to monitor project progress
• A mapping from PERT chart to Augmented Perti-Net is proposed for the ease of project progress simulation

Figure 1: PERT Chart
Representation
•Numbered rectangles are nodes that represent events or milestones
•Directional arrows represent tasks that must be completed sequentially
•Diverging arrow directions indicate possibly concurrent tasks
•Dotted lines indicate dependent tasks that do not require resources
1
2
3
4
5
6
7
8
9
10
11
Create Schedule
Buy Hardware
Programming
Installation
Test Code
Write Man
Conversion
Test System
Training User Test
10
20 20 10
5
15 15
5
5 10
An Example

•Numbered rectangles are nodes that represent states of a project
•Directional arrows represent moving from one state to another
•Vertical bars represent transitions from one state to another
1
1’
2
3
4
5
5’ 6
7
8
9
10
11
Schedule done
@now>=t0+9 ۸ ~done /reminder
Hardware bought
@now>=t0+4 ۸ ~done /reminder
Programming done
@now>=t0+18 ۸ ~done /reminder
@now>=t0+13 ۸ ~done /reminder
Installation done
@now>=t0+13 ۸ ~done /reminder
man done
@now>=t0+4 ۸ ~done /reminder
conversion done
@now>=t0+4۸ ~done /reminder
Training
done@now>=t0+9 ۸ ~done /reminder
User test done
@now>=t0+18 ۸ ~done /reminder
Code test done
@now>=t0+9 ۸ ~done /reminder
system test done
Figure 2: APN
Representation
An Example (Cont’)


COBRA architecture
APN/Pert Chart Applications
GU Interface
Repository
Collaborator
Tutor
COBRA System Client-Server
Model constructor
Scenarios Models File Manager Simulator
Negotiator Utilities GUI Basic GUI
Animator
Client –Server Communicator
Configuration Manager
Animator
Simulator Integrator
Figure 4.1 Client-Server architecture for COBRA System
Explanation for symbols: 3D gray circle represents the COBRA system either a client or server Cleared Circles represent main components Rectangles represents sub-components Note : Detail description for each sub-components are illustrated on the following pages.