Embed Size (px)
Citation preview
Science of Computer Programming 75 (2010) 276–287
Contents lists available at ScienceDirect
Science of Computer Programming
journal homepage: www.elsevier.com/locate/scico
Distributed and Collaborative Software Evolution Analysis withChurrascoMarco D’Ambros ∗, Michele LanzaREVEAL, Faculty of Informatics, University of Lugano, Switzerland
a r t i c l e i n f o
Article history:Received 27 November 2008Received in revised form 20 May 2009Accepted 22 July 2009Available online 18 August 2009
Keywords:Software evolution analysisCollaborationVisualization
a b s t r a c t
Analyzing the evolution of large and long-lived software systems is a complex problem thatrequires extensive tool support due to the amount and complexity of the data that needs tobe processed. In this paper, we present Churrasco, a tool to support collaborative softwareevolution analysis through a web interface. After describing the tool and its architecture,we provide a usage scenario of Churrasco on a large open source software system, and wepresent two collaboration experiments performedwith, respectively, 8 and 4 participants.
© 2009 Elsevier B.V. All rights reserved.
1. Introduction
Software evolution analysis is concerned with the causes and the effects of software change. There is a large numberof approaches, which all use different types of information about the history and the (evolving) structure of a system. Theoverall goal is, on the one hand, to perform retrospective analysis, useful for a number of maintenance activities, and, onthe other hand, to predict the future evolution of a system. Such analyses are intrinsically complex, because modeling theevolution of complex systems implies:1. The retrieval of data from software repositories, managed by software configuration management systems such as CVSor SVN,
2. The parsing of the obtained raw data to extract relevant facts and to minimize the noise that such large data sets exhibit,and
3. The population of models that are then the basis for any analysis. Tools supporting software evolution analysis shouldhide these tasks from the users, to let them focus on the actual analysis.
Moreover, such tools should provide means to break down information complexity, typical for large and long-livedsoftware systems. We argue that any software evolution analysis tool should possess the following characteristics:
FlexibleMeta-model. Several, and largely similar, approaches have been proposed to create and populate amodelof an evolving software system, considering a variety of information sources, such as the histories of softwareartifacts (as recorded by a versioning system), the problem reports stored by systems such as Bugzilla [1], e-mailarchives, user documentation [2], etc. Even if such models are appropriate for modeling the evolution, they are‘‘hard-coded’’ in the sense that their creators took deliberate design choices in accordance with their researchgoals. We postulate that software evolution tools should be flexible with respect to the underlying meta-model: Ifthe meta-model is changed or extended because some new type of information is at hand, or because some newanalysis is required, the tool should adapt itself to the new meta-model.
∗ Corresponding author. Tel.: +41 58 666 4758; fax: +41 58 666 4536.E-mail addresses:[email protected] (M. D’Ambros), [email protected] (M. Lanza).
0167-6423/$ – see front matter© 2009 Elsevier B.V. All rights reserved.doi:10.1016/j.scico.2009.07.005

M. D’Ambros, M. Lanza / Science of Computer Programming 75 (2010) 276–287 277
Fig. 1. The architecture of Churrasco.
Accessibility. Researchers have developed a plethora of evolution analysis tools and environments. Onecommonality among many prototypes is their limited usability, i.e., often only the developers themselves knowhow to use them, thus hindering the development and/or cross-fertilization of novel analysis techniques. Thereare some notable exceptions, such as Moose [3], which have been used by a large number of researchers overthe years. Researchers also investigated ways to exchange information about software systems [4,5], approacheswhich, however, are seldom followed up because of lack of time or manpower. We argue that software evolutiontools should be easily accessible: They should be usable from any machine running any operating system, withoutany strings attached.Incremental Storage of Results. Results of analyses and findings on software systems produced by tools are oftenwritten into files and/or manually crafted reports, and are therefore of limited use. We claim that analysis resultsshould be incrementally and consistently stored back into the analyzed models: This allows researchers to developnovel analyses that exploit the results of a previous analysis (cross-fertilization of ideas/results). It can also serveas a basis for a benchmark for analyses targeting the sameproblem, andultimatelywould also allowone to combinetechniques targeting different problems.Support for Collaboration. The need of collaboration in software development is gettingmore andmore attention.Tools which support collaboration, such as Jazz for Eclipse [6], were only recently introduced, but hint at a largercurrent trend. Just as the software development teams are geographically distributed, consultants and analystsare too. Specialists in different domains of expertise should be allowed to collaborate without the need of beingphysically present together. Because of these reasons, we argue that software evolution analysis should be acollaborative activity. As a consequence, software evolution analysis tools should support collaboration, by allowingdifferent users, with different expertise, from different locations, to collaboratively analyze a system.
We present Churrasco [7], a tool for collaborative software analysis, which is available at http://churrasco.inf.unisi.ch.Churrasco has the following characteristics:
• It hides all data retrieval and processing tasks from the users, to let them focus on the actual analysis, and provides aneasily accessible interface over a web browser to model the data sources to be analyzed.
• It copes with modeling and populating problems by providing a flexible and extensible object-relational persistencemechanism. Any data meta-model can be dynamically changed and extended, and all the data is stored in a centraldatabase.
• It provides a set of collaborative visual analyses and supports collaborative analysis by allowing users to annotate theanalyzed data.
• It stores the findings into a central database to create an incrementally enriched body of knowledge about a system,which can be exploited by subsequent users.
Structure of the paper. In Section 2 we describe the Churrasco framework, its architecture, and its main components. Wethen provide an example of a collaborative session and describe two collaboration experiments performed with Churrasco(Section 3). We discuss our approach in Section 4 and examine tool building issues in Section 5. We survey related work inSection 6, and conclude in Section 7 with a summary of our contributions and directions of future work.
2. Churrasco
Fig. 1 depicts Churrasco’s architecture, consisting of:
1. The Extensible Evolutionary meta-model describes the internal representation of software systems’ evolution, which canbe extended using the facilities provided by the Meta-base module.

278 M. D’Ambros, M. Lanza / Science of Computer Programming 75 (2010) 276–287
2. The Meta-base supports flexible and dynamic object-relational persistence. It uses the external component GLORP [8](Generic Lightweight Object-Relational Persistence), providing object-relational persistence, to read from/write to thedatabase. The meta-base also uses the Moose reengineering environment [3] to create a representation of the sourcecode (C++, Java or Smalltalk) based on the FAMIX language independent meta-model [9].
3. The Bugzilla and SVN modules retrieve and process the data from SVN and Bugzilla repositories.4. The Web portal represents the front-end of the framework accessible through a web browser.5. The Visualization module supports software evolution analysis by creating and exporting interactive Scalable VectorGraphics (SVG) visualizations.
6. The Annotation module supports collaborative analysis by enriching any entity in the system with annotations. Itcommunicates with the web visualizations to depict the annotations within the visualizations.
2.1. The Meta-base
Churrasco’s Meta-base [10] provides flexibility and persistence to any meta-model, in particular to our evolution meta-model. It takes as input a meta-model described in EMOF and outputs a descriptor, which defines the mapping betweenthe object instances of the meta-model, i.e., the model, and tables in the database. EMOF (Essential Meta Object Facilities)is a subset of MOF,1 a meta-meta-model used to describe meta-models. The Meta-base ensures persistence with theobject-relational module GLORP. By generating descriptors of the mapping between the database and the meta-model, theMeta-base can be adapted dynamically and automatically to any meta-model. This allows Churrasco users to modify anddynamically extend any meta-model. For more details, we refer the interested reader to [10].
2.2. The SVN and Bugzilla modules
These modules retrieve and process data from, respectively, Subversion and Bugzilla repositories. They take, as input,the URL of the repositories, and then populate the models using the Meta-base. They are initially launched from the webimporter (discussed later) to create the models, and then they automatically update all the models in the database everynight, with the new information (new commits or bug reports).The SVN module populates the versioning system model, by checking out (or updating) the project with the given
repository, creating and parsing SVN log files. The checked out system is then used to create the FAMIXmodel of the systemwith the external component Moose.The Bugzilla module retrieves and parses all the bug reports (in XML format) from the given repository. Subsequently,
it populates the corresponding part of the defect model. It then retrieves all bug activities from the given repository. SinceBugzilla does not provide this information in XML format, Churrasco parses HTML pages and populates the correspondingpart of the model. Finally, it links software artifacts with bug reports. To do this, it combines the technique proposed byFischer et al. [1] (matching bug report IDs and keywords in the commit comments) with a timestamp-based approach.
2.3. The web portal
The web portal is the front-end of Churrasco, developed using the Seaside framework [11]. It allows users both to createthe models, and to analyze them, by means of different web-based visualizations. To create new models and access thevisualizations, the user has to log in to the web portal.Fig. 2(a) shows the importer web page of Churrasco, ready to import the ArgoUML software project. All that is needed to
create the model is the URL of the SVN repository and the URLs of the Bugzilla repository (one for bug reports, one for bugactivities). Since, depending on the size of the software system to be imported, this can take a long time, the user can alsoindicate an e-mail address to be notified when the importing is finished.Fig. 2(b) shows the projects web page of Churrasco, which contains a list of projects available in the database and, for
a selected project, information such as the number of files and commits, the time period (time between the first and lastcommit), the number of bugs, a collection of FAMIX models corresponding to different versions of the system etc. Finally,the page also provides a set of actions to the user, i.e., links to the web visualizations provided by Churrasco.
2.4. The visualization module
This module offers the following set of interactive visualizations that support software evolution analysis:
1. The Evolution Radar [12,13] supports software evolution analysis by depicting change coupling information. Changecoupling is the implicit dependency between twoormore software artifacts that have beenobserved to frequently change
1 MOF and EMOF are standards defined by the OMG (Object Management Group) for Model Driven Engineering. For more details, consult thespecifications at: http://www.omg.org/docs/html/06-01-01/Output/06-01-01.htm.

M. D’Ambros, M. Lanza / Science of Computer Programming 75 (2010) 276–287 279
(a) The importer page. (b) The projects page.
Fig. 2. The Churrasco web portal.
(a) Evolution Radar. (b) System Complexity. (c) Correlation view.
Fig. 3. Evolution Radar, System Complexity and correlation view principles.
together during the evolution of a system. There are several ways of computing the change coupling measure, where thesimplest one consists in counting the number of transactions in which the considered software artifacts were changedtogether. Discussing other techniques to compute change coupling goes beyond the scope of this paper, and we refer theinterested reader to [13].Fig. 3(a) illustrates the principle of the Evolution Radar. It shows the dependencies between a module, represented
as a circle and placed in the center of a pie chart, and all the other modules in the system represented as sectors. In eachsector, all files belonging to the correspondingmodule are represented as colored circles and positioned according to thechange coupling they have with the module in the center (the higher the coupling the closer to the center). With respectto the angle, we sort the files alphabetically (considering the entire directory path) and uniformly distribute them in theircontaining module.
2. The System Complexity [14] view supports the understanding of object-oriented systems, by enriching a simple two-dimensional depiction of classes and inheritance relationships with software metrics (see Fig. 3(b)). By default, the sizeof the nodes is proportional to the number of attributes (width) and methods (height), while the color represents thenumber of lines of code. This mapping can be changed from the web interface, by assigning any software metric from arich catalog to the width, height and color of the nodes. The goal of the view is to provide clues on the complexity andstructure of a software system.
3. The correlation view shows all the classes of a software system in a two-dimensional space, using a scatterplot layout,and mapping up to five software metrics on them: On the vertical and horizontal position, on the size and on the color(see Fig. 3(c)). The default mapping is the following: The nodes’ coordinates represent the number of attributes (x) andmethods (y), the color represents the number of lines of code, while the size of the nodes is fixed. As for the SystemComplexity view, the mapping can be changed at any time using the web interface. The Correlation view is useful tounderstand the correlation between different metrics in a software system and to detect outliers, i.e., entities havingmetric values completely different with respect to the majority of entities in the system.

280 M. D’Ambros, M. Lanza / Science of Computer Programming 75 (2010) 276–287
# bugs
LOC
B
A
Fig. 4. A correlation view applied to the ArgoUML software system. Nodes represent classes, nodes’ position represents the number of lines of code (x) andthe number of post release bugs (y), and nodes’ color maps the number of methods.
In the experiments discussed later in the paper, we provide examples of Evolution Radar and System Complexityvisualizations, but not of correlation view. We give an example of this view here, depicted in Fig. 4. Nodes representclasses of the ArgoUML software system,2 where the x position is proportional to the number of lines of code, the yposition is proportional to the number of post release bugs, and the color maps the number of methods. Such a choiceof metrics mapping can be useful to understand whether larger classes (higher number of lines of code) generate morebugs. This correlation does not hold in the case of ArgoUML (see Fig. 4). Moreover, we spot some outliers in the view: Theone marked as ‘‘A’’, which has an outstanding number of bugs, and the ones marked as ‘‘B’’, with an outstanding numberof lines of code.
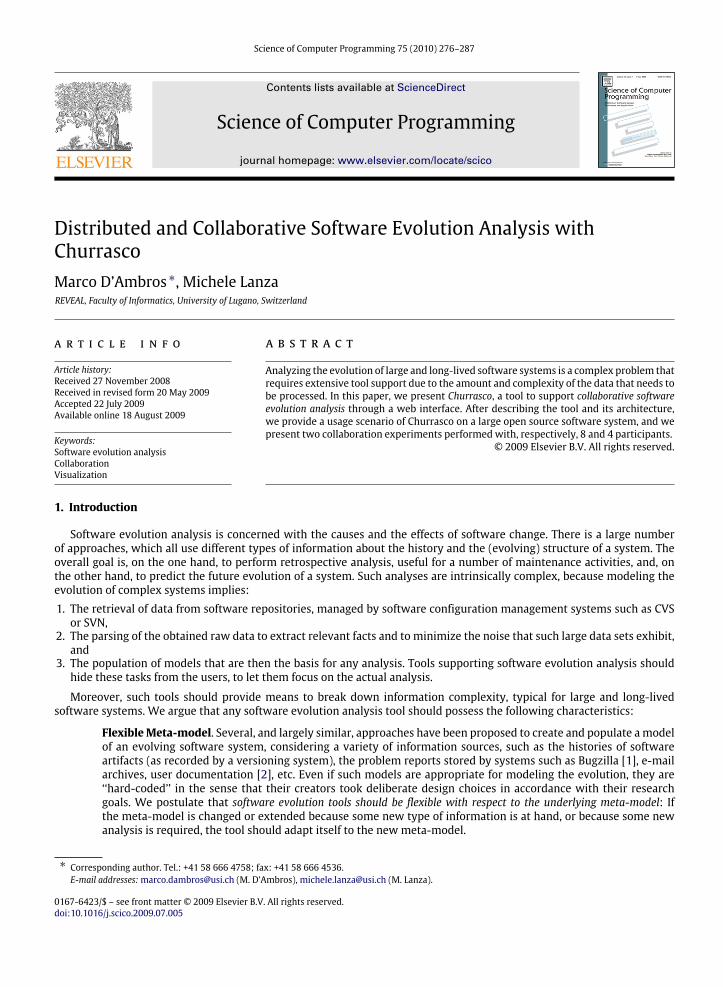
The visualizations are created using the Mondrian framework [15] (residing in Moose) and the Episode framework [16](residing in Churrasco’s visualizationmodule). Tomake the visualizations interactivewithin thewebportal, Episode attachesAjax callbacks to the figures.Fig. 5 shows an example of a SystemComplexity visualization rendered in the Churrascoweb portal. Themain panel is the
view where all the figures are rendered as SVG graphics. The figures are interactive: Clicking on one of them will highlightthe figure (red boundary), generate a context menu and show the figure details (the name, type and metrics values) in thefigure information panel on the left. Under the information panel, Churrasco provides three other panels which are usefulto configure and interact with the visualization:1. The metrics mapping configurator which allows the user to customize the view by changing the metrics mapping.2. The package selector which allows the user to select, and then visualize, multiple packages or the entire system.3. The regular expression matcher with which the user can select entities in the visualization according to a regularexpression.
2.5. The annotation module
The idea behind Churrasco’s annotation module is that each model entity can be enriched with annotations to (1) storefindings and results incrementally into the model and to (2) let different users collaborate in the analysis of a system inparallel. Annotations can be attached to any visualized model entity, and each entity can have several annotations. Anannotation is composed of the author who wrote it, the creation timestamp and the text. When the user clicks on the menuaction ‘‘Showannotations’’ an additional panel is rendered at the top left corner of theweb page (above the recent annotationpanel). The panel shows all the annotations for the selected entity and allows the user to delete (only) his/her annotations.Clicking on the ‘‘Add annotation’’ menu itemwill result in displaying another panel (again in the top left corner) that allowsthe user to write and add new annotations to the selected entity. Since the annotations are stored in a central database, anynew annotation is immediately visible to all the people using Churrasco, thus allowing different users to collaborate in theanalysis. Churrasco features three other panels aimed at supporting collaboration:1. The ‘‘Recent annotations’’ panel displays the most recent annotations added, together with the name of the annotatedentity and, by clicking on it, the user can highlight the corresponding figure in the visualization.
2. The ‘‘Participants’’ panel lists all the people who annotated the visualizations, i.e., people collaborating in the analysis.When one of these names is clicked, all the figures annotated by the corresponding person are highlighted in the view,to see which part of the system that person is working on.
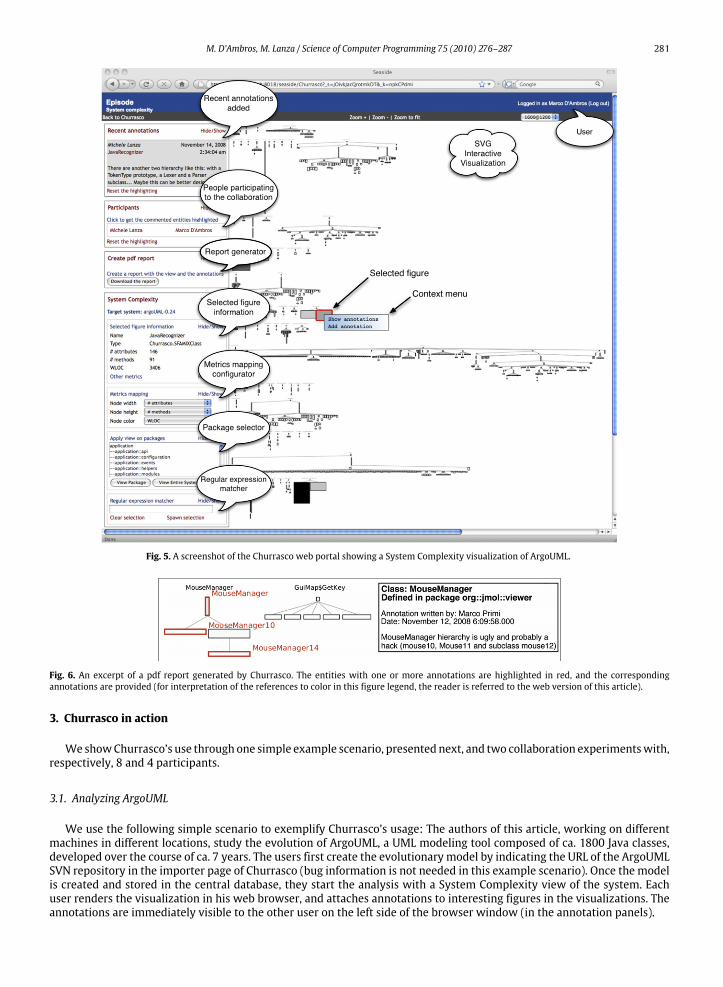
3. The ‘‘Create pdf report’’ panel generates a pdf document containing the visualization and all the annotations referring tothe visualized entities. Fig. 6 shows a modified excerpt3 of such a report: In the visualization part, the entities with atleast one annotation are highlighted in red, and the corresponding annotations are listed together with the author anddate information.
2 http://argouml.tigris.org.3 We modified the excerpt of the report to make it fit in the page.
M. D’Ambros, M. Lanza / Science of Computer Programming 75 (2010) 276–287 281
Fig. 5. A screenshot of the Churrasco web portal showing a System Complexity visualization of ArgoUML.
Fig. 6. An excerpt of a pdf report generated by Churrasco. The entities with one or more annotations are highlighted in red, and the correspondingannotations are provided (for interpretation of the references to color in this figure legend, the reader is referred to the web version of this article).
3. Churrasco in action
WeshowChurrasco’s use through one simple example scenario, presented next, and two collaboration experimentswith,respectively, 8 and 4 participants.
3.1. Analyzing ArgoUML
We use the following simple scenario to exemplify Churrasco’s usage: The authors of this article, working on differentmachines in different locations, study the evolution of ArgoUML, a UML modeling tool composed of ca. 1800 Java classes,developed over the course of ca. 7 years. The users first create the evolutionary model by indicating the URL of the ArgoUMLSVN repository in the importer page of Churrasco (bug information is not needed in this example scenario). Once the modelis created and stored in the central database, they start the analysis with a System Complexity view of the system. Eachuser renders the visualization in his web browser, and attaches annotations to interesting figures in the visualizations. Theannotations are immediately visible to the other user on the left side of the browser window (in the annotation panels).

282 M. D’Ambros, M. Lanza / Science of Computer Programming 75 (2010) 276–287
Fig. 7. The web portal of Churrasco visualizing the System Complexity of theModel package of ArgoUML on the left and the entire ArgoUML system on theright (for interpretation of the references to color in this figure legend, the reader is referred to the web version of this article).
While Michele is analyzing the entire system, Marco focuses on the Model package, which contains several classescharacterized by a large number of methods and many lines of code. The entities annotated by Marco in the fine-grainedview are then visible to Michele in the coarse-grained System Complexity. Marco has the advantage of a more focused view,while Michele sees the entire context. Fig. 7 shows Marco’s view on the left, while Michele’s one is depicted on the right.Marco selected the FacadeMDRImpl class (highlighted in red inMarco’s view), and is readingMichele’s comments about thatclass (highlighted in blue in Michele’s view). These are two examples of collaboration:
1. Marco, focusing on the Model package, annotates that the class FacadeMDRImpl shows symptoms of bad design: It has350 methods, 3400 lines of code, only 3 attributes, and it is the only implementor of the Facade interface. Michele adds asecond annotation that Marco’s observation holds also with respect to the entire system, and that FacadeMDRImpl is theclass with the highest number of methods in the entire system.
2. Marco sees that several classes in the Factory hierarchy implement the Factory interface and also inherit fromclasses belonging to the AbstractModelFactory hierarchy. This is not visible in Michele’s view (where Factory andAbstractModelFactory are highlighted in blue), who discovers that fact by highlighting the entities annotated by Marcoand then reading the annotations.
Both now want to find out whether these design problems have always been present in the system. They analyzethe system history in terms of its change coupling using the Evolution Radar. This visualization is time-dependent, i.e.,different radar views are used to represent different time intervals. Fig. 8 shows, on the left, an Evolution Radar visualizationcorresponding to the time interval Oct 2004–Oct 2005 and, on the right, the radar corresponding to Oct 2005–Oct 2006.They both represent the dependencies of the Diagram module (displayed as a cyan circle in the center) with all the othermodules of ArgoUML, by rendering individual classes. Marco is looking at the time interval 2004/05 (left part of Fig. 8). Heselects the class UMLFactoryMDRImpl (marked in red), belonging to theModelmodule, because it is the closest to the center(highest coupling with the Diagram module in the center) and because it is large (the size maps the number of changesin the corresponding time interval). Marco attaches to the class the annotation that it is potentially harmful, given thehigh coupling with a different module (Diagram), with respect to the one the class belongs to (Model). In the meantime,Michele is looking at the time interval 2005/06 (right part of Fig. 8). He highlights the classes annotated by Marco and seesthe UMLFactoryMDRImpl class. In Michele’s radar, the class is not coupled at all with the Diagram module, i.e., it is at theboundary of the view (marked in red). Therefore, Michele adds an annotation to the class, saying that it is probably notharmful, since the coupling decreased over time. After reading this comment, Marco goes back to the System Complexityview, to see the structural properties of the class in the system. The UMLFactoryMDRImpl class (marked in the left part ofFig. 7) has 22 methods, 9 attributes and 600 lines of code. It implements the interfaces AbstractUmlModelFactoryMDR andUMLFactory. After seeing the class in the System Complexity, Marco adds another annotation saying that the class is notharmful after all.This information can then be used by other users in the future. Suppose that Romainwants to join the analysiswithMarco
andMichele, or to start from their results. He can first see onwhich entities the previous usersworked, by highlighting them,and then reading the corresponding annotations to get the previously acquired knowledge about the system.

M. D’Ambros, M. Lanza / Science of Computer Programming 75 (2010) 276–287 283
Fig. 8. Evolution Radars of ArgoUML (for interpretation of the references to color in this figure legend, the reader is referred to the web version of thisarticle).
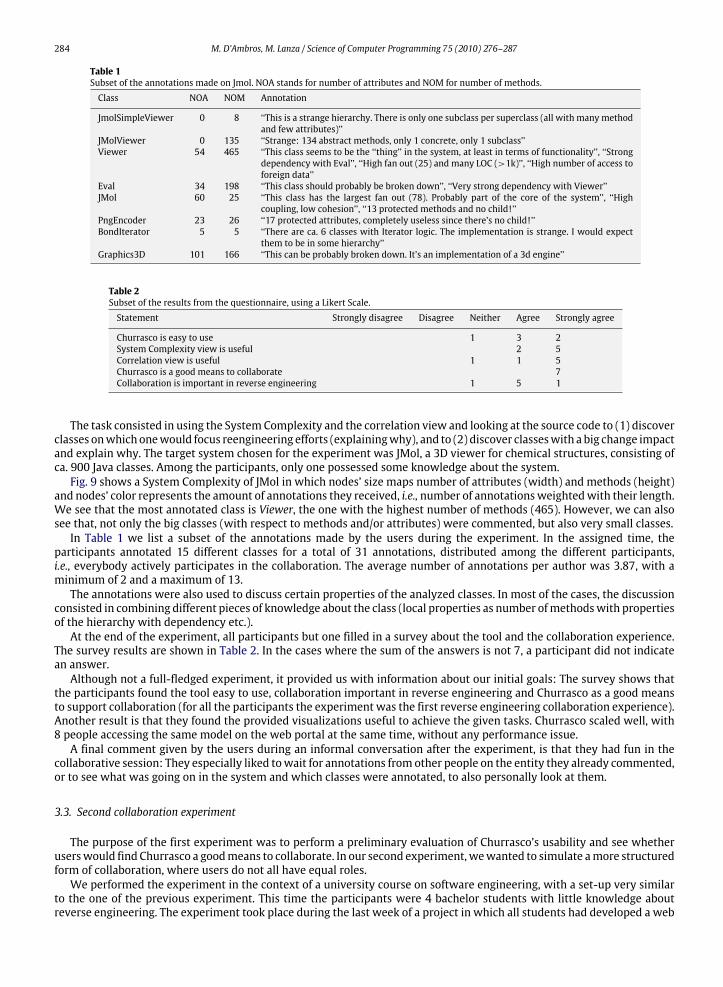
Fig. 9. A System Complexity of JMol. The color denotes the amount of annotations made by the users. The highlighted classes (green boundaries) areannotated classes (for interpretation of the references to color in this figure legend, the reader is referred to the web version of this article).
This simple scenario shows how (1) the knowledge about a system, gained in software evolution analysis activities, canbe incrementally built, (2) different users from different locations can collaborate, and (3) different visualization techniquescan be combined to improve the analysis.
3.2. First collaboration experiment
The previous example showed that Churrasco supports collaborative analysis. However, the example is hardly acollaborative experiment, because (1) there were only two participants (2) who were the developers of the tool,(3) possessing prior knowledge about the analyzed software system. Therefore, we performed a collaboration experiment, ina more realistic setting, with the following goals: (1) evaluate whether Churrasco is a good means to support collaborationin software evolution analysis, (2) test the usability of the tool, and (3) test the scalability of the tool with respect to thenumber of participants.We performed the experiment in the context of a university course on software design and evolution. The experiment
lasted 3 hours: During the first 30minutes, we explained the concept of the tool and how to use it, in the following two hours(with a 15minutes break in the middle) the students performed the actual experiment and in the last 15minutes they filledin a questionnaire about the experiment and the tool. The participants were: 5master students, 2 doctoral students workingin the software evolution domain and 1 professor. The Master students were lectured on reverse engineering topics beforethe experiment.
284 M. D’Ambros, M. Lanza / Science of Computer Programming 75 (2010) 276–287
Table 1Subset of the annotations made on Jmol. NOA stands for number of attributes and NOM for number of methods.Class NOA NOM Annotation
JmolSimpleViewer 0 8 ‘‘This is a strange hierarchy. There is only one subclass per superclass (all with many methodand few attributes)’’
JMolViewer 0 135 ‘‘Strange: 134 abstract methods, only 1 concrete, only 1 subclass’’Viewer 54 465 ‘‘This class seems to be the ‘‘thing’’ in the system, at least in terms of functionality’’, ‘‘Strong
dependency with Eval’’, ‘‘High fan out (25) and many LOC (>1k)’’, ‘‘High number of access toforeign data’’
Eval 34 198 ‘‘This class should probably be broken down’’, ‘‘Very strong dependency with Viewer’’JMol 60 25 ‘‘This class has the largest fan out (78). Probably part of the core of the system’’, ‘‘High
coupling, low cohesion’’, ‘‘13 protected methods and no child!’’PngEncoder 23 26 ‘‘17 protected attributes, completely useless since there’s no child!’’BondIterator 5 5 ‘‘There are ca. 6 classes with Iterator logic. The implementation is strange. I would expect
them to be in some hierarchy’’Graphics3D 101 166 ‘‘This can be probably broken down. It’s an implementation of a 3d engine’’
Table 2Subset of the results from the questionnaire, using a Likert Scale.Statement Strongly disagree Disagree Neither Agree Strongly agree
Churrasco is easy to use 1 3 2System Complexity view is useful 2 5Correlation view is useful 1 1 5Churrasco is a good means to collaborate 7Collaboration is important in reverse engineering 1 5 1
The task consisted in using the System Complexity and the correlation view and looking at the source code to (1) discoverclasses onwhich onewould focus reengineering efforts (explainingwhy), and to (2) discover classeswith a big change impactand explain why. The target system chosen for the experiment was JMol, a 3D viewer for chemical structures, consisting ofca. 900 Java classes. Among the participants, only one possessed some knowledge about the system.Fig. 9 shows a System Complexity of JMol in which nodes’ size maps number of attributes (width) and methods (height)
and nodes’ color represents the amount of annotations they received, i.e., number of annotationsweightedwith their length.We see that the most annotated class is Viewer, the one with the highest number of methods (465). However, we can alsosee that, not only the big classes (with respect to methods and/or attributes) were commented, but also very small classes.In Table 1 we list a subset of the annotations made by the users during the experiment. In the assigned time, the
participants annotated 15 different classes for a total of 31 annotations, distributed among the different participants,i.e., everybody actively participates in the collaboration. The average number of annotations per author was 3.87, with aminimum of 2 and a maximum of 13.The annotations were also used to discuss certain properties of the analyzed classes. In most of the cases, the discussion
consisted in combining different pieces of knowledge about the class (local properties as number ofmethodswith propertiesof the hierarchy with dependency etc.).At the end of the experiment, all participants but one filled in a survey about the tool and the collaboration experience.
The survey results are shown in Table 2. In the cases where the sum of the answers is not 7, a participant did not indicatean answer.Although not a full-fledged experiment, it provided us with information about our initial goals: The survey shows that
the participants found the tool easy to use, collaboration important in reverse engineering and Churrasco as a good meansto support collaboration (for all the participants the experiment was the first reverse engineering collaboration experience).Another result is that they found the provided visualizations useful to achieve the given tasks. Churrasco scaled well, with8 people accessing the same model on the web portal at the same time, without any performance issue.A final comment given by the users during an informal conversation after the experiment, is that they had fun in the
collaborative session: They especially liked towait for annotations from other people on the entity they already commented,or to see what was going on in the system and which classes were annotated, to also personally look at them.
3.3. Second collaboration experiment
The purpose of the first experiment was to perform a preliminary evaluation of Churrasco’s usability and see whetheruserswould find Churrasco a goodmeans to collaborate. In our second experiment,wewanted to simulate amore structuredform of collaboration, where users do not all have equal roles.We performed the experiment in the context of a university course on software engineering, with a set-up very similar
to the one of the previous experiment. This time the participants were 4 bachelor students with little knowledge aboutreverse engineering. The experiment took place during the last week of a project in which all students had developed a web

M. D’Ambros, M. Lanza / Science of Computer Programming 75 (2010) 276–287 285
Table 3Subset of the annotations made on the Smalltalk web application.Class ElementModel
What is the difference between Element Model and Element? Are both hierarchies replicated?One is themodel thatmanages the functionalities of the element, the other onemanages the displaying of the element (it is a proxy pattern).One is for the layout behavior while the other is for the widget behavior.
Class WBLBorderLayoutModel
This layout seems to have more behavior than the others, even though it has the same number of attributes. Maybe it is doing too muchand it should be a composite layout?It has a lot of complex operations which being detached can raise the complexity much more. As you say it has functionalities that can beput in more than 1 class.The layout is complex. Dividing it into several classes will require too much time and effort.
Table 4Subset of the results from the questionnaire, using a Likert Scale.Statement Strongly disagree Disagree Neither Agree Strongly agree
Churrasco is a good means to collaborate 1 3Collaboration helped me in understanding thesystem
3 1
The proposed methodology (leader) helps instructuring the collaborative effort
3 1
Reading other users’ annotations eases thegiven tasks
2 2
1–2 3–4 5–6 7–8 9–10Quantify (1–10) the added value of the collab-orative support provided by the tool
2 2
application in Smalltalk during 6 weeks. During the last week of the project, the students could not add new features to thesystem, but they could only restructure/refactor it to improve its design and code quality.The task that the students had in the experiment was to identify which parts of the system should be refactored, using
the System Complexity and correlation views in Churrasco. The students had different roles in the collaboration: One actedas a leader, responsible for analyzing the system, by selecting classes which he thought were candidates for refactoring,while the other students would check in detail whether the classes in question needed to be refactored or not.With the annotations, the leader could also ask questions that the followers then answered. Typical questions were:
‘‘What is the responsibility of this class?’’, ‘‘Can we remove this class?’’, ‘‘These hierarchies seem to be duplicated, can wemerge them?’’,‘‘Why this class is in this hierarchy? Shouldn’t it be a subclass of that class?’’ etc.The target software system was composed of 166 classes, 983 methods for a total of ca. 5000 lines of Smalltalk code.Table 3 shows a subset of the annotations made by the users during the experiment, the ones written for a couple of
classes. These two groups of annotations exemplify how the collaborative session was performed: The leader was askingquestions about the design of classes and hierarchies, and the other students were answering these questions.During the experiment, the participants annotated 11 different classes for a total of 27 annotations, 9 written by the
leader and 18 by the other students. Since the participants knew the system, they were faster in writing annotations withrespect to the participants of the first collaboration experiment.As in the previous experiment, at the end of the collaborative session, the participants filled in a survey about the tool
and the collaboration experience. A subset of the results are shown in Table 4. The survey shows that the participants foundthat collaboration helped them in understanding the software system and the methodology used with the leader usefulto structure the collaborative effort. Moreover, the use of annotations eased the task of selecting potential candidates forrefactoring. Another result is that the students found that the collaborative support provided by Churrasco has an addedvalue.
4. Discussion
Themain benefits of Churrasco consist in its accessibility and flexibility. All the features of the framework can be accessedthrough a web browser: (1) The importers to create and populate evolutionary models of software systems, (2) the SystemComplexity and correlation views, to support the understanding of the structure of the system and (3) the Evolution Radarview to study the evolution of the systemmodules in terms of change coupling. The visualizations are interactive, and theyallow the user to inspect the entities represented by the figures, to apply new visualizations on-the-fly from the contextmenus and to navigate back and forth among different views. The framework can be extended with respect to the meta-model and with respect to the visualizations. Using the facilities provided by the meta-base, the underlying evolutionarymeta-model of Churrasco can be enriched with new types of information.

286 M. D’Ambros, M. Lanza / Science of Computer Programming 75 (2010) 276–287
5. Tool building issues
Developing a web-based tool that supports scalable and interactive visualizations raises issues related to interacting,updating, and debugging.
Interacting. Supporting interaction through awebbrowser is still a non-trivial task, and even supposedly simple features,such as context menus, must be implemented from scratch. In our Churrasco tool, we have implemented the context menusas SVG composite figures, with callbacks attached, which are rendered on top of the SVG visualization.Moreover, it is hard toguarantee a responsive user interface, since every web application introduces a latency due to the transport of information.
Updating. The standardway of rendering aweb visualization is that, every time something changes in the page, thewholepage is refreshed to show the updated version. In the context menu example, whenever the user clicks on a figure, the pagechanges because a new figure appears, and therefore the page needs to be refreshed to show the menu. This introduceslatencies which make the web application unusable when it comes to rendering very large SVG visualizations. For thisreason, we implemented many actions that do not require a complete re-rendering of a page using Ajax requests. Examplesof such actions are: Rendering of context menus, highlighting figures, displaying figure information, displaying and addingannotations.
Debugging. A barrier to develop web applications is the lack of support for debugging. Even if there are someapplications like Firebug, providing HTML inspection, Javascript debugging and DOM exploration, the debugging supportis not comparable with the one given in mainstream integrated development environments such as Eclipse.All in all, while building Churrasco, we learned that creating a web application that supports interactive visualizations
implies a number of technological challenges. With the current status quo of web development frameworks, it should makeany intention of porting existing applications to the web forego a careful evaluation of whether the result is worth theeffort. On the other hand, web applications introduce a number of novel ways to interact with systems that will open upnew research directions.
6. Related work
A number of approaches support web-based software evolution analysis and visualizations.Beyer and Hassan proposed Evolution Storyboards [17], a visualization technique that offers dynamic views. The
storyboards, rendered as SVG files (visible in a web browser), depict the history of a project using a sequence of panels,each representing a particular time period in the life of a software project. These visualizations are not, or only partially,interactive, i.e., they only show the names of the entities represented by the SVG or VRML figures. In contrast, the viewsoffered in the Churrascoweb portal are fully interactive, providing contextmenus for the figures and navigation capabilities.Lungu et al. presented a web-based approach to visualize entire software repositories [18]. Their technique, validated
on Smalltalk repositories, focuses on understanding the structure of the organization behind the repositories, by studyingthe interaction among the developers. They also provide views to see the evolution of the repositories over time. Both theapproaches are fully interactive and web-based, but while Lungu’s approach focuses on the entire repository evolution withcoarse-grained views, Churrasco targets single projects with fine-grained visualizations.In [19] Mancoridis et al. presented REportal, a web-based portal site for the reverse engineering of software systems.
REportal allows users to upload their code (Java or C++) and then to browse, analyze and query it. These services areimplemented by reverse engineering tools developed by the authors over the years. REportal supports software analysisthrough browsing and querying, whereas Churrasco supports the analysis by means of interactive visualizations.In [20] Nentwich et al. introduced BOX, a portable, distributed and interoperable approach to browse UML models. BOX
translates a UML model that is represented in XMI into VML (Vector Markup Language), which can be directly displayed ina web browser. BOX enables software engineers to access and review UMLmodels without the need to purchase licenses oftools that produced the models. While BOX is focused on design documents, such as UML diagrams, in Churrasco we focuson the history and structure of software systems.A major difference between all the mentioned approaches and Churrasco, is that these techniques support single user
software evolution analysis, while Churrasco supports collaborative analysis.
7. Conclusions
We have presented Churrasco, a tool which supports collaborative software evolution analysis and visualization. Themain features of Churrasco are:
• Flexible meta-model support. The meta-model used in Churrasco to describe the evolution of a software system can bedynamically changed and/or extended, by means of the meta-base component.
• Accessibility. The tool is fully web-based, i.e., the entire analysis of a software system, from the initial model creation tothe final study, can be performed from a web browser, without having to install or configure any tool.
• Modeling of results. Churrasco relies on a central database and supports annotations. Thus, the knowledge of the system,gained during the analysis, can be incrementally stored on the model of the system itself.
• Collaboration.Wehave shown, through a couple of collaboration experimentswith respectively 8 and 4 participants, howChurrasco supports collaborative software evolution analysis.

M. D’Ambros, M. Lanza / Science of Computer Programming 75 (2010) 276–287 287
7.1. Future work
Our future work targets twomain directions: Extending the tool and performingmore experiments. Concerning the tool,we plan to extend the Churrasco meta-model by including information extracted frommail archives, and we plan to createthe corresponding importer which retrieves such data in batch mode. Moreover, we want to enrich the set of views offeredby Churrasco with visualizations of bug information. For examples of such bug visualizations, we refer the reader to [21].With respect to the experiments, we plan to perform both a quantitative experiment on Churrasco’s usefulness and a
qualitative one (by means of interviews) on its usability and usefulness.
Acknowledgment
We gratefully acknowledge the financial support of the Swiss National Science foundation for the project ‘‘DiCoSA’’ (SNFProject No. 118063).
Appendix. Supplementary data
Supplementary data associated with this article can be found, in the online version, at doi:10.1016/j.scico.2009.07.005.
References
[1] M. Fischer, M. Pinzger, H. Gall, Populating a release history database from version control and bug tracking systems, in: Proceedings of the 19thInternational Conference on Software Maintenance, ICSM 2003, IEEE CS Press, 2003, pp. 23–32.
[2] D. Cubranic, G. Murphy, Hipikat: Recommending pertinent software development artifacts, in: Proceedings of the 25th International Conference onSoftware Engineering, ICSE 2003, ACM Press, 2003, pp. 408–418.
[3] S. Ducasse, T. Gîrba, O. Nierstrasz, Moose: An agile reengineering environment, in: Proceedings of the 10th European Software Engineering ConferenceHeld Jointly with 13th ACM SIGSOFT International Symposium on Foundations of Software Engineering, ESEC/FSE 2005, 2005, pp. 99–102.
[4] S. Kim, T. Zimmermann, M. Kim, A. Hassan, A. Mockus, T. Gîrba, M. Pinzger, J. Whitehead, A. Zeller, TA-RE: An exchange language for mining softwarerepositories, in: Proceedings of the 3rd International Workshop on Mining Software Repositories, MSR 2006, ACM, 2006, pp. 22–25.
[5] S. Tichelaar, S. Ducasse, S. Demeyer, FAMIX: Exchange experiences with CDIF and XMI, in: Proceedings of the ICSE 2000 Workshop on StandardExchange Format, WoSEF 2000, 2000.
[6] R. Frost, Jazz and the eclipse way of collaboration, IEEE Software 24 (6) (2007) 114–117.[7] M. D’Ambros, M. Lanza, A flexible framework to support collaborative software evolution analysis, in: Proceedings of the 12th IEEE EuropeanConference on Software Maintenance and Reengineering, CSMR 2008, IEEE CS Press, 2008, pp. 3–12.
[8] A. Knight, Glorp: Generic lightweight object-relational persistence, in: Proceeding of OOPSLA 2000 (Addendum), ACM Press, 2000, pp. 173–174.[9] S. Demeyer, S. Tichelaar, S. Ducasse, FAMIX 2.1 — The FAMOOS information exchange model, Tech. Rep., University of Bern, 2001.[10] M. D’Ambros, M. Lanza, M. Pinzger, The metabase: Generating object persistency using meta descriptions, in: Proceedings of the 1st Workshop on
FAMIX and Moose in Reengineering, FAMOOSR 2007, 2007.[11] S. Ducasse, A. Lienhard, L. Renggli, Seaside: A flexible environment for building dynamic web applications, IEEE Software 24 (5) (2007) 56–63.[12] M. D’Ambros, M. Lanza, M. Lungu, The evolution radar: Visualizing integrated logical coupling information, in: Proceedings of the 3rd International
Workshop on Mining Software Repositories, MSR 2006, ACM, 2006, pp. 26–32.[13] M. D’Ambros, M. Lanza, Reverse engineering with logical coupling, in: Proceedings of the 13th Working Conference on Reverse Engineering, WCRE
2006, IEEE CS Press, 2006, pp. 189–198.[14] M. Lanza, S. Ducasse, Polymetric views — a lightweight visual approach to reverse engineering, Transactions on Software Engineering (TSE) 29 (9)
(2003) 782–795.[15] M. Meyer, T. Gîrba, M. Lungu, Mondrian: An agile visualization framework, in: ACM Symposium on Software Visualization, SoftVis 2006, ACM Press,
2006, pp. 135–144.[16] M. Primi, The episode framework — exporting visualization tools to the web, Bachelor’s Thesis, University of Lugano, Jun. 2007.[17] D. Beyer, A.E. Hassan, Animated visualization of software history using evolution storyboards, in: Proceedings of the 13th Working Conference on
Reverse Engineering, WCRE 2006, IEEE CS Press, 2006, pp. 199–210.[18] M. Lungu, M. Lanza, T. Gîrba, R. Heeck, Reverse engineering super-repositories, in: Proceedings of the 14th IEEE Working Conference on Reverse
Engineering, WCRE 2007, IEEE CS Press, 2007, pp. 120–129.[19] S. Mancoridis, T.S. Souder, Y.-F. Chen, E.R. Gansner, J.L. Korn, Reportal: A web-based portal site for reverse engineering, in: Proceedings of the 8th
Working Conference on Reverse Engineering, WCRE 2001, IEEE Computer Society, 2001, p. 221.[20] C. Nentwich, W. Emmerich, A. Finkelstein, A. Zisman, BOX: Browsing objects in XML, Software Practice and Experience 30 (15) (2000) 1661–1676.[21] M. D’Ambros, M. Lanza, M. Pinzger, a bug’s life — visualizing a bug database, in: Proceedings of the 4th IEEE International Workshop on Visualizing
Software For Understanding and Analysis, VISSOFT 2007, IEEE CS Press, 2007, pp. 113–120.