Embed Size (px)
Citation preview

1
Distortions to Agricultural Incentives
in Central and Eastern Europe
Pavel Ciaian and Johan F.M. Swinnen
LICOS Centre for Institutions and Economic Performance
University of Leuven (KUL), Belgium and Department of Agricultural Economics
University of Nitra, Slovakia [email protected]
LICOS Centre for Institutions and Economic Performance
and Department of Economics University of Leuven (KUL), Belgium
Agricultural Distortions Working Paper 07, August 2007 This is a product of a research project on Distortions to Agricultural Incentives, under the leadership of Kym Anderson of the World Bank’s Development Research Group (www.worldbank.org/agdistortions). The authors thank Kym Anderson, Olga Melyukhina, Stefan Bojnec, Jason Hartell, Holger Kray, Benoit Blarel and participants at the World Bank workshops in Bonn and Washington DC for many discussions on these issues, comments on the report, and assistance in the preparation and organization of the study. We are especially grateful to OECD for access to the PSE data and indicators. The authors are grateful also for funding from the World Bank’s Europe and Central Asia Department and Trust Funds provided by the governments of Ireland, Japan, the Netherlands (BNPP) and the United Kingdom (DfID). This Working Paper series is designed to promptly disseminate the findings of work in progress for comment before they are finalized. The views expressed are the authors’ alone and not necessarily those of the World Bank and its Executive Directors, nor the countries they represent, nor of the institutions providing funds for this research project.

2
Distortions to Agricultural Incentives
In Central and Eastern Europe
Pavel Ciaian and Johan Swinnen
Introduction and summary
The objective of this chapter is to document and explain the extent of policy distortions to
agricultural market incentives in Central and Eastern Europe (CEE) over the past decades.1 In
doing so we provide an historical review of the policy changes in the CEE and we calculate
indicators of direct and indirect assistance to agriculture and of taxation of consumers. The
country coverage includes the eight Central and Eastern European countries (CEECs) that
joined the European Union in 2004 (CEU-8: Czech Republic, Estonia, Hungary, Latvia,
Lithuania, Poland, Slovakia and Slovenia), plus the two countries that joined the EU in 2007
(Romania and Bulgaria). The other big economies of Eastern Europe – Russia, Turkey and
Ukraine – are not discussed here but are the subject of parallel studies by Liefert and Liefert
(2007), Burrell (2007) and von Cramon-Taubadel et al. (2007).
Agricultural production and food consumption in these countries were heavily
subsidized under the communist system, distorting incentives for both consumers and
producers. With consumer retail prices set low and producer prices high, the gap was covered
by direct subsidies to processing and trading companies or by soft budget constraints.
However, at the same time exchange rates were overvalued and assistance to non-agricultural
industries negatively affected agriculture. The net effect of all these distortions is difficult to
estimate accurately, but there is general agreement among experts that agriculture was
assisted relative to non-agriculture in the latter 1980s. One indicator of that is the fact that, at
the end of the 1980s, direct budgetary subsidies to agriculture and food were between 5 and
10 percent of GDP in most CEECs.
1 The policy focus is on price, trade and subsidy policies. Policy distortions and reforms in other areas, such as property rights, land reform, etc. -- which played a very important role in the 1990s in these countries -- are not discussed in this chapter.

3
In the late 1980s and early 1990s subsidies were cut, prices, trade, and exchange rates
liberalized, and many distortions removed. The net result was a major reduction in direct
assistance to farmers. On average the nominal rate of assistance to agriculture (NRA) was
close to zero in the early 1990s. Consumers experienced offsetting effects. While they got
access to a much wider set of options in terms of quantity and quality of food products, retail
food prices increased substantially in real terms.
After the initial liberalizations, assistance to agriculture increased again,
gradually but substantially, from an average NRA of around 0 percent in 1992 to around 40
percent in 1998, after which it stabilized as the CEECs began preparing for accession to the
EU. In 2004 there was an increase in assistance to farmers as the agricultural policy regimes
in CEE became integrated into the EU’s Common Agricultural Policy (CAP). That included a
gradual change in policy instruments also: there was a reduction in the use of market support
and output subsidies in the 1990s compared to the 1980s, with direct payments and other
support to agriculture making up a very substantive part of total assistance to agriculture by
2000. Not surprisingly, farm incomes increased strongly with accession. This was true even
for non-landowners whose rent payments went up.
During the past decade indirect disincentives to agriculture in the CEECs was limited.
Exchange rate distortions were largely removed by the second half of the 1990s, and indirect
taxation through tariffs on the rest of the economy was equivalent to less than 10 percent on
average, and decreasing over time.
In recent years, the most highly supported agricultural sectors were in Slovenia and
Latvia, countries where agriculture represents a small share of the economy, while protection
was lowest in Bulgaria, Poland, and Estonia. There was considerable variation among
countries and commodities though. In our political economy analysis below, we show that
structural differences in the CEE economies are associated with different support levels, that
international agreements have played some (albeit limited) role in affecting policy distortions,
and that budgetary and human capital constraints played a role. More specifically:
• Agricultural support is higher, ceteris paribus, in richer countries, in import-
competing industries which lack a comparative advantage, or in industries that are
negatively affected by economic changes such as real exchange rate appreciations.
• Regional trade agreements and EU accession agreement have had a limited effect on
policy distortions.

4
• WTO trade agreements were much more constraining for the countries that joined in
the second half of the 1990s or later than for those that joined before.
• Budgetary constraints have limited CEE government expenditure on agricultural
support, in particular in the 1990s, while inexperience in policy-setting in a market
environment had some serious effects on policy design and reversals in the 1990s.
While much has been accomplished in removing distortions to agricultural incentives
in CEE in the 1990s, there is much room for further reductions of distortions to agricultural
incentives. Improving policies and reducing distortions can be done through overall
reductions in support policies, shifting support to less-distortive policy instruments, focusing
budgetary expenditures on public good investments rather than farm subsidies, shifting from
a quantity-based to a quality-based policy paradigm, etc. Such reforms would not be
inconsistent with EU accession, as the EU has moved to more decoupled farm support in
recent years. Moreover, further reforms are underway in the EU with important implications
for distortions in the CEE, such as reforms of some of the commodity regimes and the shift
from per hectare payments to single farm payments. These too will be implemented in the
CEE in the coming years.
Also important have been other reforms, such as regulatory reforms to stimulate food
industry investment and labor market reforms to enhance off-farm employment opportunities.
A crucial component of this is a shift in the policy paradigm from policies focused on
quantity and basic standards to one focused on quality and high standards. Food safety and
quality standards are increasingly crucial components of modern food chains, both
domestically and internationally. Competition and anti-trust policy is another important area
for policy attention. In supply chains where farms have to sell their products to trading,
processing, and retailing companies, the ability to choose freely between companies is of
crucial importance in getting better conditions for farms.
From the perspective of further reforms and consolidating reforms in the future, the
ongoing WTO negotiations may impose further discipline on agricultural policy distortions.
Indirectly, the WTO agreements have already had major impacts on CEE distortions, as they
have imposed constraints on the policies and the distortions that an enlarged EU-27 could
implement. That contributed to the EU policy reforms this decade, which is resulting in lower
distortions in the CEE than would otherwise have been the case.
The chapter is organized as follows. In the first section we give a historical overview
of the changes in government policies affecting agriculture and food consumers that have

5
taken place over the past decades. We then present our estimates of the extent of producer
and consumer assistance and the policy distortions. As discussed there, the methodology is a
slight modification of that detailed in Anderson et al. (2006), and we make extensive use of
data collected by international organizations such as FAO, GTAP, Eurostat, the World Bank,
the UN and especially the OECD’s producer support estimates (PSEs). In the following
section we review a series of political economy factors that have affected policy choices and
see to what extent they can help in explaining the changes and differences in policy
distortions in CEE agriculture. The final section identifies some lessons and prospects for
reducing distortions in the future.
Historical perspective on agriculture and policy distortions
Until the Second World War, agriculture in the Central and East European countries was
organized much like that in the neighboring West European countries. By the 1940s
agriculture made up a considerable share of total output and a large share of total
employment, although there was substantial variation between countries.
The communist period
After World War II the CEE economies were subject to Communist rule. Land and farms
were put under central planning and in most countries (with the exception of Poland and the
former Yugoslavia) farming was forcefully organized into collective and state farms.
The central planning of the agricultural economy resulted in distorted allocations of
production factors and distorted incentives for consumers and producers. Consumer prices
were set low and producer prices high, with the gap covered by direct subsidies to processing
and trading companies or by soft budget constraints.
More specifically, in the late 1960s the leadership of the USSR decided to increase
agricultural production, with a strong emphasis on livestock, a policy the Eastern European
countries of the Soviet Bloc generally followed (Liefert and Swinnen 2002). As a
consequence, livestock herds and output in these countries grew by 40 to 60 percent between
1970 and 1990. The rise in feed requirements caused by the growing herds stimulated the

6
crop sector. In the late 1980s, the average annual output of feed grain in Poland and Hungary
was up by half and one-quarter, respectively, compared with output in the late 1960s. In the
USSR the feed requirements were so great that the country also became a substantial importer
of feed commodities.
By 1990, per capita consumption of livestock products and foodstuffs in general
compared favorably with many OECD countries, even though income in the Central and East
European countries was much lower than the OECD average. This “achievement” came at a
cost though, as large state subsidies, to both producers and consumers, were necessary to
maintain the high levels of production and consumption. For example, at the end of the 1980s
direct budgetary subsidies to the agriculture and food economy were between 5 and 10
percent of GDP in most CEECs, with the bulk of these subsidies going to the livestock sector.
Because of these measures, agriculture made up a sizeable share of the CEE
economies in the 1980s: 15 percent of output and 25 percent of employment on average.
While there was large variation (for example the agricultural employment share at the end of
the 1980s varied from 27 percent in Poland to 8 percent in Slovenia), the distortions ensured
a relatively large share of resources stayed in agriculture rather than being more efficiently
used in other sectors of the economy.
However, while both consumers and producers were strongly subsidized in nominal
terms by high output and low input price settings under the Communist regime, interventions
and regulations in the rest of the economy had counteracting effects on agriculture: several
industrial sectors were also subsidized, and administratively set exchange rates discouraged
all tradable sectors. The net effect of these various distortions is very different to measure,
but experts generally agree that agriculture in CEE was heavily subsidized in the 1970s and
1980s (Brooks and Nash 2002, Cook et al. 1991, Liefert and Swinnen 2002, OECD 1996, and
Valdes 2000).
The transition period, 1989 to 2000
After the fall of the Berlin Wall in 1989, rapid changes took place in the Central and Eastern
European countries. We identify the 1990s as the period of transition, with three phases of
change in agricultural price and trade policies during that decade. The distinction of these
phases is useful to understand the changes of the agricultural policies and the distortions
during the period “between Communism and the European Union”, even though in reality

7
these periods are not as clearly separated as presented here, and not all the countries moved
from one phase to the next at the same time.
Phase One: Liberalization
In the first phase (sometime between 1988 and 1992, depending on the country) a large set of
price and trade regimes were liberalized and subsidies to producers and consumers reduced,
accompanied by macro-economic reforms. As a result, consumer prices soared and real
incomes often declined, so domestic demand fell. Reduced domestic demands, together with
falling incomes and subsidy cuts, were reinforced by falling foreign demand for CEEC
products and increased import competition from Western countries.
The impact on consumers was mixed: real food prices increased, but access to higher-
quality food products also improved – directly through imports, and indirectly through
enhanced competition which forced domestic food companies to improve their standards.
The impact on producers was more dramatic. Farm input prices increased strongly
relative to producers’ output prices, causing a strong decline in agricultural terms of trade and
hence in agricultural output in the early 1990s (Figure 1). Macours and Swinnen (2000)
estimate that the terms of trade effect alone caused 40-50 per cent of the decline in CEE crop
output over the 1989-1995 period.
The liberalizations caused a contraction not only in agricultural production but also a
decline in the industrial sector. In the case of services, by contrast, output expanded rapidly as
that sector had been constrained by Communist regulations (Figure 2).
Phase Two: Fire-brigade policymaking
The decline in farm incomes and soaring food prices caused a lot of social conflict, leading to
political demands for government intervention, support and state regulation. As a result, in
the second phase, still in the first half of the 1990s, CEE governments responded to this
pressure by (re-)introducing price and trade interventions to protect consumers and producers
against negative real income effects of the liberalization and other reforms.2 However many
of these inventions occurred in an ad hoc fashion, since CEE governments and their
administrations were inexperienced in implementing policies in the emerging market
economy. Governments reacted to unanticipated policy effects by introducing more ad hoc
2 See also Valdes (2000), who analyzes agricultural support in the period 1994-1997 in, among other countries, Poland, Romania and Bulgaria.

8
regulations, adding to the uncertainty induced by general economic reforms. The nature of
the response has been described as “fire-brigade” policy-making.
Phase Three: Policy consolidation
In the third phase, from the mid-1990s, CEE governments moved to formulate more
comprehensive agricultural policies for long-term intervention in agriculture. Some
governments introduced policy instruments that already resembled, at least in design, the
EU’s Common Agricultural Policy (CAP) prior to the MacSharry reforms. Such ‘CAP-style’
agricultural policy packages included guaranteed prices, production quotas, export subsidies,
and (variable) import levies. Most of the policy regimes passed through various degrees of re-
instrumentation, either to address domestic policy objectives, to comply with international
agreements, or, later, to bring agricultural policies more in line with those of the EU. For
example, some of the countries in the ‘first wave’ of applicants for accession to the EU soon
modified their policy regimes to include more direct payments and other subsidies and
somewhat less reliance on market price support (Hartell and Swinnen 1998).
The pre-EU accession period: 2000 to 2004
One could consider the dramatic end of the political and economic restructuring of the
CEECs the integration of eight of these countries in the EU in 2004. However, in many
aspects, EU enlargement effectively started several years before 2004 (Swinnen 2002). Trade
integration and foreign investment grew rapidly, in the late 1990s the gap in product quality
and prices in East and West Europe gradually reduced, and policy convergence started with
many CEECs implementing CAP instruments or at least preparing to put them in place.
Preparing policies for accession was often referred to as trying to hit a “moving
target”, as there was considerable discussion of CAP reform in anticipation of enlargement
and important EU decisions were made in 1999 and in 2002. In 1999 the first financial
framework for the 2000-2006 period was agreed, which included assumptions about the
agricultural policy framework for enlargement. In 2002 important changes were introduced,
partly as a result of pressure from the CEECs, and in December 2002 the final accession
framework was agreed.3 This gave CEEC governments a much clearer policy adjustment
3 The debate on how to extend the EU’s Common Agricultural Policy to the accession countries and, more specifically, on the budgetary and trade implications of extending the CAP to the new accession countries, played a prominent role in the entire enlargement debate. In 1999 the so-called Agenda 2000 reforms of the
9
path and they could start preparing for the implementation of the so-called acquis
communautaire –the set of laws, regulations and instruments required for entrance to the EU.
This implementation procedure required the adjustment of their agricultural policy systems to
make them consistent with the Common Agricultural Policy of the EU.
Accession to the European Union in 2004
In May 2004, eight Central and Eastern European countries joined the EU (plus Cyprus and
Malta, not discussed here). The accession process was characterized by last-minute
negotiations on farm subsidies and production quotas, but their agricultural sectors are now
integrated into the CAP even though, in the first years of accession, farmers in the eight “new
member states” (NMS) will receive less subsidies than farmers of the EU-15.
The extension of substantial subsidies to CEEC farmers, especially compared to local
income standards, had an important impact on farm incomes and rural market distortions. On
average agricultural incomes in the eight new member states in 2004 were 61 percent higher
than in 2003 (Table 1). Only part of that increase was due to poor weather in 2003.
The equity and efficiency effects of these higher payments depend on existing factor
market imperfections, in particular the functioning of the land market (Ciaian and Swinnen
2006). In all NMS, the subsidies led to rapid land price increases, benefiting land owners.
Land prices approximately doubled in, for example, Poland, the Czech Republic and Slovakia
between 2002 and 2006 (Swinnen and Vranken 2007). However, because farm and
landownership structures differ strongly between countries, the effects of the subsidies on
CAP were decided by the EU-15, at least partly in anticipation of enlargement. These reforms transferred support from market interventions to direct (per hectare or per animal) payments, and provided a policy framework for the next six years, including enlargement. The Financial Framework for enlargement, also agreed in 1999, made several assumptions regarding Eastern enlargement, including that six new member states would join by 2002 and that farms in the new member countries would not qualify for direct income support. Despite much opposition from EU-15 member countries against extending the direct payments to CEEC farmers, all the candidate countries were united in their insistence on “equal” treatment of their farmers from the moment of accession, that is, they demanded the same subsidies as EU-15 farmers, including direct payments. As it became clear that enlargement would start later, but with more countries, the Commission made new proposals. The Council decisions made in the Brussels and Copenhagen Summits in the fall of 2002 provided a revised financial framework for both the enlargement process and future CAP reforms. First, the EU Council of Ministers followed the Commission proposal to phase in the direct payments. The CEECs would receive the equivalent of 25 percent of EU-15 direct payments in 2004, 30 percent in 2005, 35 percent in 2006, and rising to 100 percent by 2013. Later, following strong pressure from the CEECs, the European Council agreed to increase direct payments to CEECs to 55 percent of the EU level in 2004, increasing to 100 percent by 2010. However, the funding for these increases, the so-called “national top-up”, is to come from the CEECs themselves either directly or indirectly (Swinnen 2004).

10
farm incomes differ between NMS. In countries such as Slovakia and the Czech Republic,
farming is concentrated on large-scale corporate farms, who rent most of their land from the
many fragmented land owners, many of whom live in urban areas. In contrast, in countries
such as Poland and Slovenia, farming is dominated by small family farmers who own most of
their land. The other countries, such as Hungary and Bulgaria, have a mixed structure.
The presence of high transaction costs in the land market is constraining the necessary
restructuring required to increase the competitiveness of the farm sector in NMS, and their
increased subsidies over the 2007–2013 period are exacerbating that, possibly outweighing
the gains in transaction cost reductions (Ciaian and Swinnen 2006).
Transition changes in trade policy and trade agreements
International trade was strongly regulated under the centrally planned system. The
Communist countries were integrated in the Council of Mutual Economic Assistance
(CMEA) system, the planned inter-country trading regime, trading mainly with other
communist countries. One could think of the CMEA as the international version of the
domestic central planner. The CEE countries were less integrated than the countries Former
Soviet Union (FSU), but still a large part of their trade volume went through the CMEA. The
CMEA system collapsed in the early 1990s with the liberalization of the macro-economy and
of trade policies, and caused important changes in trade and financial flows.
Effects of trade liberalization
Trade liberalization reinforced the reallocation of production activities caused by the
abolishment of central planning. Traditional international production allocations were no
longer possible when trade had to be financed by hard currencies and when inputs were
accounted for at real costs. It also allowed the import of high-quality Western produce, which
had been restricted earlier. The result was major international reorganization of production
activities. Initially this had a very negative impact on CEEC producers, because the
traditional export markets in the former Soviet Union dwindled due to a lack of hard currency
and because Western countries remained closed to CEEC agricultural exports. At the same
time the reduction of CEE import constraints opened CEEC markets to Western imports. In
combination, this caused a worsening of the agricultural trade balance in CEECs in the first
half of the 1990s (Figure 3).

11
Later on, however, trade between the CEECs and the EU-15 intensified, and growing
exports to Western markets contributed to recovery in the CEECs. Trade flows in agricultural
and food products in particular between the EU-15 and the CEECs have increased strongly
since 1990, and in both directions.4 Early predictions that the EU markets would be flooded
by cheap eastern imports turned out wrong. True, the EU’s agri-food imports from CEECs
doubled over the 1990s, but exports from the EU to CEE increased ten-fold.
Another important development was the shift from centrally imposed extreme
specialisation (e.g., dairy production in the Baltics and cotton production in Central Asia) to
more diversified production systems, thereby increasing domestic production of staple foods
and reducing dependence on single commodities in those countries.
Possibly even more important than the trade effects was the massive inflow of
Western foreign direct investment in the food industry in CEECs. That contributed to a major
restructuring of the CEE food industry and to improvements in food quality and productivity
(Dries and Swinnen 2004). Most recently, the wave of foreign investments in the retail sector
has caused further restructurings of the agri-food system, with important implications for
both producers and consumers (Dries, Reardon and Swinnen 2004).
New trade agreements
After the collapse of the CMEA regime around 1990, the CEECs have been part of several
other trade agreements – some old, some new – but these generally had limited direct effects
on their agricultural policy interventions. First, the Czech Republic, Slovakia, Hungary,
Poland, Romania and Slovenia have been members of the World Trade Organization (WTO)
since its creation in 1995. Bulgaria joined soon afterwards, and Estonia, Lithuania and Latvia
joined in 1999 and 2001. The tariff structure in CEECs shows that both applied and bound
4 Trade integration is clear from Figure 3. The removal of non-tariff barriers as part of the EU accession was an important factor in stimulating CEEC-EU trade. Chevassus-Lozza et al. (2005) analyze the effect of non-tariff barriers on the CEECs’ agro-food exports to EU in the period just before enlargement. Despite preferential trade agreements, CEECs were essentially subject to the same access regulations in the EU market as any third country. Non-tariff barriers include sanitary and phytosanitary standards, quality, and import licensing. In principle, import licences became obsolete only when the CEECs join EU. The other two groups of measures, however, cease to represent trade barriers from the moment they are met by producers. Still, Chevassus-Lozza et al. (2005) show (for the CEECs that joined the EU in 2004, using a gravity model) that sanitary and phytosanitary standards indeed acted as a significant entry barrier to CEE exports to EU in 1999. In 2003 they still constrained trade, but the effect was smaller than in 1999, indicating that the number of firms fulfilling the standards has increased. Regarding quality regulations, they also restricted CEEC exports in 1999 but to a lesser extent than the sanitary and phytosanitary standards. In 2003 quality restriction did not constrain CEEC exports to EU anymore, as CEECs succeeded in adopting EU standards. Finally, import licensing increases the transaction costs of trade and significantly restricted CEEC exports in 1999 and 2003; these barriers were removed only after EU accession by the CEECs.

12
tariffs in the agri-food sector were considerably higher than in the EU-15: in 2001 the
weighted average of bound tariff levels was 21.4 percent and of applied tariffs 13.1 percent,
compared to 6.5 percent and 5.4 percent in the EU-15 (Tables A1, A2 and A3 in the
Appendix). The large difference between bound and applied suggests the CEECs have not
been constrained by WTO agreements (Bacchetta and Drabek 2002). This is especially so for
the CEECs that joined early, as their commitments were based on the high support levels of
the 1980s and therefore caused little constraint on their policies in the 1990s; for the others,
the restrictions were more severe.5 The latter countries liberalized their trade regimes
unilaterally and have been able to negotiate the terms of their WTO accession within the
scope of measures already taken. As a result, their WTO commitments are less "liberal" than
the measures actually applied.
Second, there were also new trade agreements, most importantly the Central European
Free Trade Area (CEFTA) and the Baltic Free Trade Area (BFTA). However, the impact of
these agreements on reducing agricultural policy distortions was generally limited, since the
agreements included many exceptions for agricultural and food products and especially for
so-called “sensitive products” which made up a substantial share of production.
However, the most important trade agreements were the (pre-)accession treaties with
the EU, and later the effective integration of the CEECs into the EU, which we discuss
elsewhere in this chapter.
Measuring assistance to agriculture
Methodology and approach
5 However some of these restrictions became important later with the EU accession process. In GATT terms, accession of the CEECs to the EU involved enlargement of a customs union. There are GATT rules for such cases, laid down in GATT Article XXIV. Essentially these rules apply to tariffs. However, as these rules date back to the times before the Uruguay Round’s Agreement on Agriculture (URAA), they do not relate to the new types of commitments established under the URAA (Tangermann 2000). Regarding tariffs, the EU and the CEECs had to satisfy other members of the WTO that EU enlargement does not result in a situation in which the overall level of agricultural protection and support in the enlarged EU violates the aggregate commitments that both had before enlargement. Tariff bindings in the CEECs in many cases were significantly below those bound and applied in the EU, so negotiations will have to be held in the WTO on how to compensate other countries for the increase in tariffs on their agricultural and food exports to the CEECs. How to treat commitments on agricultural export subsidies and domestic support is not regulated in these GATT provisions. However, there was the precedent of the EU Northern enlargement in 1995 (Burrell 2000). As for domestic support commitments, those of the EU-12 and those of the new member states were simply added.

13
The methodology used in this chapter for calculating assistance to agriculture follows the
methodology as explained and documented in Anderson et al. (2006); and we refer readers to
this document for explanations. We calculated nominal rate of assistance (NRA) for both
agricultural and non-agricultural production, as well as the consumer tax equivalent (CTE) on
food consumption.
The calculation of the NRA to agriculture is much more accurate than that for non-
agriculture, for several reasons mostly related to data. The two most important sources of
indirect distortions to agriculture are exchange rate distortions and subsidies/taxes on other
sectors of the economy. Regarding the former, we do not have (even reasonably) accurate
measures of exchange rate distortions.6 We only have indicators of black market exchange
rates for some countries for some years. We will use these to illustrate the possible extent of
the distortions caused by exchange rates (which is large). However, since black market
exchange rates are not ideal measures of distortion, and since they are not consistently
available, we have not included them in the NRAs. What is included in the non-agricultural
NRAs is the trade weighted average of tariffs in the rest of the economy (including food
processing), as a rough indicator of subsidization of the import-competing part of the rest of
the economy. Clearly this is an imperfect measure, but it was all that was possible to calculate
consistently across countries, for (at least) the most recent time period.
The NRA for agriculture includes direct payments such as subsidies per animal or
subsidies per hectare, as well as variable input subsidies. The per unit value of both product-
specific direct payments and input subsidies are divided by the undistorted price and added to
the market price support component of the NRA.
There are also “non-product specific subsidies”. These include government payments
for research and development, agricultural schools, inspection services, infrastructure,
marketing and promotion, public stockholdings and “miscellaneous”. Since some of these can
be argued to be public goods, and their impact on agricultural incomes depends on the
elasticity of demand (see, Alston, Edwards and Freebairn 1988, and Swinnen and de Gorter
1998, 2001), so they are included separately from the direct assistance to individual products.
More generally, some policy instruments are more distorting than others. Using
OECD data, Dewbre, Anton, and Thompson (2001), and with market price support (MPS) as
a benchmark of 100 percent, they conclude that variable input subsidies are the most 6 For attempts to capture the exchange rate induced distortions and protection, see Bojnec and Swinnen (1997), Bojnec, Münch and Swinnen (1996), and OECD (1994, 1995).

14
distortive instrument (around 130 percent), followed by output subsidies and market price
support (100 percent), area payments which require the planting of crops (around 35 percent),
and area payments which do not require planting of crops (around 10 percent). Therefore it is
necessary to look at both the total calculated assistance as well as its composition, before
drawing conclusions as to the distortions caused by policies.
The rest of this section is organized as follows. To highlight the main effects and their
changes over the years we present average indicators for the ten CEECs. However, there is
considerable variation in the extent of policy distortions, the level of support, and the type of
policy instruments used across countries and commodities. To demonstrate the differences
between countries and commodities, and to understand the factors causing these differences,
we focus especially on indicators for the year 2000: by 2000, almost a decade of reforms,
institutional changes, and knowledge-accumulation of policy-making in a market
environment had passed, and EU accession was a distant prospect in many countries.
Indicators of assistance and taxation
We first consider distortions to producer incentives, and then turn to those faced by food
consumers.
Assistance to agricultural production
Liberalization resulted initially in major reductions of direct assistance to agriculture. The
decline in assistance was especially dramatic in the countries where the support had been
highest, in particular the FSU countries of Latvia, Lithuania and Estonia and in Bulgaria. By
1992 the CEECs’ average agricultural NRA was close to zero including non-product specific
subsidies. But soon after the initial liberalizations new interventions emerged, and these were
consolidated into government intervention systems by the mid-1990s. The result of these new
series of interventions was an increase in farm support, to around 40 percent by 1998,
followed by some decline in the next two years to 25 percent and then a rise to 33 percent by
2003, excluding non-product-specific supports (Figure 4). That is just below the comparable
estimate for the EU-15 in 2003 of 37 percent (Josling 2007).
By 2000, the NRA level was 25 percent excluding non-product-specific supports, but
29 percent when those non-product-specific supports are included. That year the highest level
of producer assistance was in Slovenia at 76 percent, and the lowest was in Bulgaria at just 4

15
percent, while Latvia (38 percent), Romania (36 percent) and Slovakia (35 percent) all had
NRA levels somewhat above the 29 percent CEE average (Figure 5).
Figure 6 illustrates the differences in NRAs across commodities in 2000 for the
region. Most commodity NRAs averaged between 10 percent and 50 percent. Sugar stands
out as the most protected commodity, with a NRA around 80 percent. At the other extreme,
sheep meat and soybean received slightly negative NRAs that year. The full time series of
NRAs by product from 1992 to 2003 is summarized for the ten CEECs in Table 2.
To get a more-complete assessment of the policy distortions, it is necessary also to
look at the other distortions which affect agriculture. Input price regulations were to a large
extent abandoned in the early 1990s. That contributed to the initial reduction in farm
assistance, but they have played almost no role since 1992. Exchange rate regulations too
were either removed or substantially reduced in the early 1990s (see Tables A4 and A5 in the
Appendix). One symbol of that is the disappearance by the mid-1990s in Poland and
Hungary, and a few years later in Romania, of the large black market exchange rate premia of
the mid- and late 1980s (Figure A1 in the Appendix). The effect of these changes was a
strong reduction in the indirect taxation of agriculture and other tradable sectors through the
exchange rate. We do not include this effect in the calculations below, however.
Another important source of indirect distortions to agriculture is assistance to other
sectors of the economy. For present purposes it is assumed the service sector receives no net
assistance, and that the tariff protection provided to processed food and non-agricultural
import-competing goods is an indicator of the level of assistance to all other tradable sectors.
There is significant variation in tariff levels among commodity groups. According to the
UNCTAD TRAINS tariff database, in 2001-03 CEE tariffs averaged 21 percent for processed
foods, 6 percent for other manufacturing products, and 2 percent for non-agricultural primary
products. (These rates compare with 11 percent for primary agricultural products.) We use
these trade-weighted average tariffs as a proxy for the nominal rate of assistance to the
tradable non-agricultural part of the economy (including the processed food industry),7 call it
NRAnonagt. Together with the NRAagt we are then able to calculate a Relative Rate of
Assistance, RRA, defined as:
RRA = 100[(1+NRAagt/100)/(1+NRAnonagt/100) – 1]
7 This would be an overstatement if exporting and non-trading parts of the non-agricultural sectors receive less support than the import-competing parts; but it is assumed that non-tariff import barriers are still in place and exactly offset this bias.

16
where NRAagt and NRAnonagt are the average percentage NRAs for the tradables parts of
the agricultural and non-agricultural sectors, respectively. Since the NRA cannot be less than
-100 percent if producers are to earn anything, so too must the RRA. This measure is useful.
If it is below zero, it provides an internationally comparable indication of the extent to which
the policy regime has an anti-agricultural bias, and conversely when the RRA is positive.
The estimated RRAs for the CEECs as a group are shown in Figure 7 and Table 3.
According to those data, the NRA for agriculture is offset only slightly by the NRA in other
sectors in recent years, in the early years of transition it almost completely offset assistance
via farm programs. So the conclusion that assistance to farmers became positive by 1993 and
steadily rose still holds: the RRA increased in CEECs from -10 percent in 1992 to 30 percent
by 2003. And that upward trend is generally true for each of the ten countries in the region, as
shown in Tables A6 to A25 in the Appendix, even though there is a wide range in mean
values (ranging in 2003 from close to zero in Bulgaria to nearly 90 percent in Slovenia).
Taxation of consumers
The consumer tax equivalent (CTE), using the Anderson et al. (2006) methodology, increased
from around -8 percent in 1992 to around 17 percent in 2000, suggesting a relative increase in
taxation of food consumers. As with the NRAs, the 2000 CTEs vary importantly between
countries, in roughly the same way as NRAs (Table 4).
However, the net effect on consumers of the transition policy changes is very different
from that indicated by this CTE change. First, the reduction of exchange rate distortions and
removal of price fixing and subsidies at the wholesale level reduced consumer assistance (and
thus increased relative taxation). Offsetting that, there are important benefits for consumers
from the reforms associated with opportunity costs in acquiring food. Under the communist
regime, consumers, unable to buy all they wanted at low prices, had to incur high search and
queuing costs. These costs were removed with the reforms in the 1990s. Further, consumers
benefited from greater access to a much wider variety and higher quality of food products. By
restricting foreign imports and regulating trade, the Communist regime prevented its
consumers from accessing quality food products. This factor of consumer taxation is typically
not captured by distortion indicators but may be very important. Kostova Huffman and
Johnson (2004) estimate that these welfare losses are equivalent to between 50 and 75 percent
of the direct subsidy benefits of consumers under the communist regime – and, hence, there
were equivalent gains with the trade liberalization in the 1990s. In combination, while the
transition reforms have generally increased food prices (and thus hurt consumers in this way),

17
they have importantly benefited consumers by reducing the labor opportunity costs of
acquiring food and by making available a much wider choice of options, both in terms of
quantity and quality of food.
Agricultural policy instruments and the composition of assistance
The policy instruments used under the Communist regime, discussed in Liefert and Swinnen
(2002, 2006), were changed dramatically after 1990. In a survey of CEEC agricultural policy
instruments during transition, Hartell and Swinnen (1998, 2001) identify several phases in the
choice and changes of agricultural policy instruments (for more details see tables A26 and
A27 in Appendix).
By 1990-1991, most countries removed or substantially reduced nontariff import and
export barriers on a wide range of commodities, and reduced or eliminated production
subsidies, leaving import tariffs as the primary instrument of market intervention. However,
following the decline in the agricultural terms of trade, a series of non-tariff import
interventions were introduced on a wide range of crops. Some CEECs also introduced non-
tariff food export barriers following occasional internal shortages. In the most advanced
CEECs these non-tariff interventions evolved into a market organization system implemented
to provide long-run support to, and interventions in, agriculture. This included variable
import levies in combination with minimum guaranteed producer prices, and some countries
installed production controls in combination with price support -- although implementation of
the GATT’s Uruguay Round Agreement on Agriculture resulted later in the tariffication of
variable import levies and some other nontariff barriers.
In the second half of the 1990s, market price support in many CEECs became
somewhat less important as direct support increased. These direct payments, usually in the
form of area or headage payments, were quite often targeted to less-favored areas. Most
countries also introduced credit subsidies for agriculture because rural credit supply was
heavily constrained during transition. Other input subsidies included fuel tax reimbursements,
wage subsidies, capital investment subsidies, and production input subsidies.
By 2001 many highly interventionist policies such as fixed or minimum guaranteed
prices, intervention purchases, threshold triggering, and deficiency payments could be found
throughout the CEECs. Export subsidies played a prominent role in some countries. Several
countries announced their intention to reform their agricultural and farm policies to align

18
them more closely with the CAP. This includes the adoption of tariffs, intervention, export
subsidies, guarantees, and a variety of direct payments.
These policy changes are reflected in the composition of the assistance that farms
received. While there was a significant decline in all forms of producer support in the early
1990s, there have been important changes in the form of support over the period considered
here. Under the Communist system, price support and output subsidies were the main
component in CEECs. After the reforms in the early 1990s, the share of market support and
output subsidies declined substantially, falling below 50 percent. Since then it has grown
again to around 60 percent of NRA.
The other important components of the CEECs’ NRA were input subsidies, direct
payments and non-product specific subsidies. The share of input subsidies in total NRA
varied between 10 and 30 percent during transition. Input subsidies included interest rate
subsidies, credit guarantee schemes, fuel subsidies, support to purchase breeding materials,
etc.
There was a significant shift in the latter 1990s to less-distortionary assistance such as
direct payments based on area planted/animal numbers. Their share on total NRA increased
during transition, from almost zero to 16 percent in 2000; but still far from the share in the
EU (at 35 percent). Decoupled payments (payments based on historical entitlements) were
almost zero in both CEECs and the EU before 2004, but this will change importantly in the
coming years as the CAP shifts to single farm payments in CEECs.
Finally, “non-product specific subsidies” represent a relatively large share in the
NRAs: in 1995 they accounted for around 20 percent and in 2003 around 10 percent. These
can be seen in row 4 of Table 3 for CEECs as a group, and in the comparable national tables
in the Appendix.
As with total assistance, there are substantial variations in the composition of NRAs
within the CEECs. The share of price support and output subsidies is very high in Lithuania,
Poland, and Romania and low in Bulgaria and Estonia. Input subsidies were more important
in Bulgaria and Estonia partly because rural credit problems continued to be a major problem
there until recently and partly because price support is so low in Bulgaria and Estonia. There
is strong variation among countries in the use of subsidies based on area planted/animal
numbers, but in most CEECs the granting of these subsidies to farmers was not limited to
area planted or animal numbers, so they were highly distortive. An exception is the Czech
Republic: there they were limited to a certain area planted/animal numbers, similar to in the
EU under its 1992 reform and Agenda 2000 where the CAP began moving away from price

19
support and output subsidies to area and animal payments that were limited to reference
period levels. Decoupled payments based on historical entitlements were almost zero in both
the CEECs and the EU when the Czech Republic introduced them. Its decoupled payments
accounted for 20 percent of total Czech NRA in 2000.
Political economy
Causes of the changes in CEEC policy instruments and support levels mentioned in studies
and discussions of this issue include irrationality and imperfect information in decision
making by CEE governments, constraints imposed by World Trade Organization (WTO)
membership, efforts to align some policies in preparation for EU membership, and domestic
political and economic conditions. In our view, these various causal factors should be
considered complementary rather than competing theories in explaining the development and
changes in CEEC policies. Further, the factors may have different impacts on the protection
level as distinct from the instrument choice. In this section, we analyze to what extent
political economy factors can explain the changes and variation between countries in the
level and nature of support.
Structural causes of agricultural policy distortions
As explained above, after an initial period of market liberalization, many CEE governments
have moved to intervene to varying degrees in the market, primarily and increasingly for the
benefit of producers at the expense of food buyers and taxpayers. Swinnen (1996) argues that
the explanation for the overall pattern of CEEC agricultural protection is largely consistent
with political economy theory and predictions.8
Political economy explanations of agricultural protection patterns stresses the impact
of the structure of the economy on the distribution of costs and benefits of agricultural
protection and of changes in the relative income situation of farmers as the primary causes of 8 For discussions of the importance of political economy factors for explaining general trade policies in CEECs, see Hillman (1994), Lemoine (1995), and Hillman and Ursprung (1996). See de Gorter and Swinnen (2002) and Swinnen and Van der Zee (1993) for surveys of the political economy literature related more specifically to agricultural policy.

20
variations in agricultural protection during different stages of economic development
(Anderson 1995, Swinnen 1994), as well as changes in political organizational costs (Olson
1985). Changes in the structure of the economy affect the distribution and the size of political
costs and benefits of agricultural protection and thus the governments’ political incentives in
decision making.
The pattern of agricultural protection/taxation worldwide that emerges from numerous
studies is summarized by the now well-known ‘development pattern’ and ‘anti-trade
pattern’.9 In addition, studies find that agricultural protection increases when farm incomes
fall relative to the rest of the economy. There is evidence that, despite the influence of a
variety of other factors, the policy developments in the CEECs described here are also
consistent with these patterns.
Table 5 reports the results from a simple regression model correlating the NRA levels
with indicators of structural factors reflecting these patterns (GDP per capita, agricultural
trade balance, real exchange rate, agricultural land per capita).10 Agricultural land per capita
is an often used indicator of a country’s comparative advantage in agricultural production.
The real exchange rate is included as an indicator of the relative income effect, as changes in
exchange rates, whether policy induced or the result of structural changes, have an important
impact on the relative profitability of farms.
Absolute income (“the development pattern”)
The ‘development pattern’ refers to the often observed pattern of a gradual switch a country
makes from taxation to protection of agricultural producers as it develops economically.
There is also evidence that such a development relationship exists in CEECs. On average,
protection is positively correlated with higher incomes, both across countries and over time.
This is consistent with the earlier observation that protection was much higher in Slovenia
(the richest CEEC) than in any other country, and lowest in Bulgaria, one of the poorest
CEECs, and also consistent with the statistical correlation results in Table 5.
Relative income and comparative advantage
9 See Anderson and Hayami (1986) and Lindert (1991) for countries of North America, Europe, and East Asia; Krueger et al. (1991) for a survey of developing countries; and Tracy (1989) and Swinnen et al. (2001) for the specific evolution of protection in Western European countries. 10 Several factors are not included here, such as the share of food in consumer expenditures, the farm structure (e.g., large versus small farms) and its implication for effectively influencing the government, etc. See, e.g., Swinnen (1996) for a discussion of these factors.

21
Related to the development pattern, political economy models, both theoretically (de Gorter
and Tsur 1991, Swinnen 1994) and empirically (e.g., Swinnen et al. 2001), show that
agricultural support will increase when farm incomes (excluding the support) fall. The reason
is that farmers will pressure politicians for support and politicians can gain total political
support by reacting to this pressure by increasing subsidies. Hartell and Swinnen (2001) find
strong support for the impact of this factor in agricultural protection in CEECs. They
conclude that the most important factor explaining changes in support for CEEC farmers over
the 1992-1996 period is change in the relative income position of farmers.
Our own calculations in Table 5 also confirm that in the 1990-2003 increases in
nominal assistance to agriculture are inversely related with changes in the exchange rate.
When the strong revaluation in the mid-1990s had negative incentive effects on CEE
agriculture, governments reacted by increasing assistance to farmers. Reductions in
agricultural incentives caused by the exchange rate in the 1993-1998 period was associated
with increasing NRAs; and the NRAs did not increase further when the exchange rate effect
on incentives was relative stable in the 1998-2003 period (see Table A28 in the Appendix for
details).
Another aspect of this political economy mechanism is that sectors with lower (or
declining) comparative advantage will pressure politicians to protect their sector and the
political calculus leads to higher equilibrium subsidies for sectors with lower comparative
advantage. Hartell and Swinnen (2001) provide evidence that, within countries, sectors with a
low comparative advantage receive more assistance, based on data from Hungary and the
Czech Republic.
The anti-trade pattern
The ‘anti-trade pattern’ suggests that import-competing products tend to be more assisted (or
taxed less) than exportable products.11 The distortions (deadweight costs) and transfer costs
of policy intervention typically increase with the commodity’s trade balance, i.e., when its net
exports increase. Therefore protection of the sector is found to decrease with increases in the
trade surplus in many countries. Our data also indicate that, on average, such an anti-trade
11 The long-term observed trend, however, masks strong occasional fluctuations in protection levels, generally coinciding with periods of general macroeconomic depression and severe food shortages. These fluctuations demonstrate how sensitive and responsive agricultural protection (income transfers) can be to the welfare position of taxed groups. These fluctuations in support to agriculture are clearly visible in studies utilizing long time-series data such as Gardner (1987), Lindert (1991), Crommelynck et al. (1998), and Swinnen et al. (1999).

22
pattern is also present in CEECs: on average, higher protection is for import-competing
commodities and lower protection for exported commodities (Table 5).
The role of international agreements
International agreements had an impact on the level and choice of agricultural policies in the
CEECs. The CMEA regime affected policies until the start of transition. Since then the
CEECs have been part of several multilateral, regional and bilateral trade agreements, such as
membership in the WTO and regional free trade agreements and the Association Agreements
with the EU.12
WTO
In general, in the CEECs as elsewhere, WTO negotiations have worked to reduce the level of
tariffs, increase market access, and prohibit certain instruments such as variable levies and
quantitative restrictions. However, the impact has been quite different among CEECs. In
terms of WTO commitments CEECs can be divided in two groups. The first group includes
the Czech Republic, Hungary, Poland, Romania, and Slovakia, which made commitments as
part of the Uruguay negotiations (pre-UR members) and those that joined WTO after the
Uruguay negotiations (post-UR members). The second group includes Bulgaria, Slovenia,
Estonia, Latvia and Lithuania.
The implications of joining before or after the UR agreement are substantive
(Kazlauskiene and Meyers 2001). The CEECs that were members of the GATT prior to the
Uruguay Round were conducting more distorting, more protectionist, and less transparent
policies. The base period for reduction commitments of this group was prior to 1990, when
production was still high, support for agriculture was quite strong, and the use of non-tariff
measures (NTMs) was extensive. Countries that joined the WTO after the Uruguay Round
already had as a starting position more liberal, less distorting, and more transparent policies.
These policies resulted from post-1990 policy reforms, as well as the conclusion and
implementation of a number of multilateral and bilateral trade agreements and economic
memoranda with international financial institutions (such as the International Monetary Fund
and the World Bank). The base period for commitments of this group was the mid- to late- 12 In general, such types of agreements can work to improve political credibility and acceptability of trade policies which diverge from the short run political optimum (Giavazzi and Pagano 1988). By tying the government’s hands, such institutional arrangements reduce their choice set and alter the incentives in decision making.

23
1990s, when production was already considerably lower than in the pre-1990 period, and
structural, institutional, and policy reforms were already well underway. Since tariff bindings
are generally lower for the post-UR accession group, there are also relatively few products in
these countries for which TRQs are included in the commitments.
Pre-UR WTO members were also able to negotiate non-zero commitments on export
subsidies for major commodities. Among the post-UR group, Bulgaria was the only country that,
for political reasons (a United Nations embargo on trade with the former Yugoslavia), succeeded
in joining the WTO with non-zero export-subsidy commitments for its main exports, including
cereals, oilseeds, cheese, beef, pork, and poultry (Kazlauskiene and Meyers 2003).
Regional agreements: CEFTA and BAFTA
The Central European Free Trade Area (CEFTA) and the Baltic Free Trade Area (BaFTA)
were negotiated in the 1990s. These regional trade associations and agreements imposed rules
and restrictions on the use of trade barriers and encouraged greater regional policy
coordination. However, the impact of these agreements on reducing agricultural policy
distortions was generally limited since the agreements included many exceptions for
agricultural and food products, and especially for the so-called “sensitive products” which
made up a substantial share of production, and which were often exempted from substantive
liberalization.
Still, agricultural trade liberalization within the regional trade agreements was
stronger than CEECs agricultural trade liberalization outside. CEFTA (Central European Free
Trade Agreement) countries had lower tariffs among themselves than they had with EU.
However, this was not the case between CEFTA countries and Baltic countries. CEFTA
countries had almost the same tariff rates with EU as with Baltic countries (Table A29 in the
Appendix).
In some cases, these free trade area agreements create pressure for participating
countries to harmonize agricultural policies in order to avoid arbitrage in trade. In the case of
BAFTA, Kazlauskiene and Meyers (1999) argue that this was the reason why Lithuania in
1997 began to abandon the system of minimum purchase prices introduced in 1995 for most
farm products. Lithuania, unlike Estonia and Latvia, gave significant emphasis to price
policies. In a free trade area this government policy reduces firm competitiveness if such a
program leads to higher domestic producer prices than the prices in other countries that are
part of the free trade area, and it reduces the effectiveness of the intervention purchases

24
because the support also goes to other member countries due to free flow of products across
the borders within the free trade area.
In addition to being weakened because CEFTA mainly covered the least-sensitive
products, CEEC governments regularly violated the spirit of the agreement by evoking
national safeguard clauses in the face of strong domestic pressure. Despite these agreements,
domestic political economy considerations played an important role in overall CEEC policy
development including instrument choice and their reactions to economic shocks and cycles.
This is illustrated by CEEC governments’ reactions to spillover effects from the 1998
Russian crisis. Difficulties in 1998 and 1999 in CEEC agriculture, following the Russian
crises and low world market prices, induced CEEC governments to give priority to domestic
producer pressure for protection over CEFTA. Low world prices, import pressure, and the
loss of important CEEC export markets in Russia and the Commonwealth of Independent
States, especially for the major temperate commodities and several livestock products,
induced major income losses for CEEC producers. Extreme reactions from producers
prompted several CEEC governments, over the objections of Hungary and the Czech
Republic, to indefinitely suspend further CEFTA agricultural product trade liberalization. In
addition, some previously negotiated bilateral arrangements were scrapped, preferential tariff
rates revoked, and tariffs raised. The response was often retaliatory tariff measures and the
increased use of export subsidies by some countries. Normally forbidden under CEFTA rules,
CEEC governments invoked a safeguard clause in the treaty, giving them wide latitude to
respond to agricultural and food sector emergencies. Romania even considered withdrawing
from CEFTA. The incidents soured trading relations between the CEECs, eroded the
credibility of CEFTA, spurred some governments to legislate more contingency base
insulating and distortionary instruments, and damaged efforts to liberalize trade in
agricultural products.
EU enlargement and policy alignment
The EU accession agreements had obviously a profound impact on agricultural policy
settings and distortions, but its impact became most noticeable primarily after 2000, and
increasingly so the closer was EU accession in 2004. A pre-integration strategy of imitating
EU policy instruments reduced adjustment costs at the time of EU accession. Preparation for
EU accession was an increasingly important consideration in CEEC domestic trade and price
setting, but primarily for instrument choice. This is formalized in the Association Agreements
whereby the CEECs agreed to align policy and fulfill the requirements of the aquis
25
communitaire as a condition for membership. During the preparation phase, the EU provided
assistance for legal and institution development, which further contributed to policy
alignment.13
While several experts argued in the mid-1990s that further CAP reforms would be
required to make the CAP consistent with enlargement and WTO constraints, it was uncertain
until just before enlargement whether CAP reform would actually occur. Before this
information was available, CEEC policy makers, even if they wanted to base their policy
strategy on minimizing adjustment costs of integration with the future CAP, could only try to
hit an (albeit slowly) moving target. In fact, the final accession agreement was characterized
by last-minute negotiations on farm subsidies and production quotas. The negotiations
reflected demands for equal treatment and equal support for CEEC farmers within an
enlarged EU facing budgetary constraints and WTO constraints.
It seems that alignment was more important in policy instrument choice than in the
level of protection which seems to be primarily determined by political economy factors,
where domestic pressures, political incentives, and budgetary constraints played a very
important role. This can also be seen from the evolution of the gap in NRAs between the
CEECs and the EU, and from the NRA differences among CEECs. The differences between
CEECs did not diminish significantly over the 1998-2003 period. Moreover, while there was
a reduction of the EU-CEE average NRA gap between 1992 and 1998, there was no
significant change in this gap over the years leading up to enlargement: it was just under 4
percentage points both in 1998 and in 2003 (c.f. Josling 2007). This is consistent with the
conclusion that the level of assistance to farmers was determined primarily by domestic
considerations, such as captured by our structural variables analysis (see above) and the
budget constraints (see below), even in the years leading up to enlargement.
The budget and human capital constraints 14
13 However, as explained in greater detail in Hartell and Swinnen (1999), the big picture may obfuscate some important and complex differences of similar-looking policies, so care should be taken in interpreting the observations. 14 Part of the political economy literature focuses explicitly on explaining the choice of government policy instruments. Changes in the structural conditions of political institutions and economies not only affect the preferred level of interventions but also the political costs and benefits of the use of various policy instruments (Campos 1989, Rodrik 1994). For example, implementation costs of farm programmes have an important influence on governments’ choice of policy instruments (Munk 1995, de Gorter 1994), and can vary considerably with farm size and structure (Sarris 1994). Exogenous factors often place limits on the scope, form, and operation of many support programmes. A structural change which reduces implementation costs enlarges or alters the instrument choice set. This helps to explain a certain degree of path dependency often observed in

26
Budgetary constraints played an important role in CEEC policy setting during transition, both
in the choice of the instruments and in the level of intervention. In general, budgetary
constraints have been the source of many reform proposals, such as in the recent experience
of many OECD countries, and often limit the level of intervention. This has also been the
situation in many CEECs in early transition where, due to a lack of budgetary resources,
minimum guaranteed prices were often set at or below the cost of production as well as below
market price. The low threshold prices, in combination with the selective use of border
controls, ensured that intervention was needed infrequently, and when needed was always
subject to specific quota limitations (Hartell and Swinnen 1998).
The major institutional changes that took place in the early 1990s also had major
implications for how government intervention could and could not work. Inexperience of
CEEC policy makers in this area had an important effect on policy choices in the early 1990s.
Policy initiatives undertaken by various CEEC governments shortly after liberalization were
often rapidly overturned and seemed ill timed, contradictory, and unnecessarily painful. This
period of stopgap policy making may be explained as the result of temporary human capital
constraints. Previous administrative skills and understanding of policy effects in a command
economy were inadequate in the new market environment. During this period of ‘learning-
by-doing’ in a new and difficult economic environment, policies were implemented and then
reversed when they produced unanticipated and unwanted effects (Swinnen 1996).
Also later during transition, even though CEEC policy choice frequently appeared
similar to the pre-reform CAP, it in fact often operated very differently. For example, despite
the widespread use of minimum prices, variable import levies played a minimal role in
maintaining internal producer prices. Unlike the administration of variable import levies in
Western Europe, the ‘variability’ was not high with adjustment usually being made on a
monthly or less frequent basis. In this sense they acted like an additional fixed import tariff.
With experience, increasing sophistication, and increasing economic rewards to skill and
education, this constraint became less binding in policy instrument choice and
implementation (Swinnen 1996, Orazem and Vodopivec 1997).
Lessons and prospects for reforms and reducing distortions agricultural policy. For example, Ray (1981) finds that among many OECD countries, the introduction of tariffs and nontariff barriers is nearly always sequential—which is what we also observe in the CEECs.

27
There have been major reductions in distortions to agricultural incentives in CEE over the
past two decades. Much has been accomplished in removing distortions to agricultural
incentives in CEE as dramatic changes have removed the most distortionary policy regimes.
The liberalization of prices and trade lead to relatively low rates of assistance in the early and
mid-1990s.
However, there is still substantial room for further reduction of distortions to
agricultural incentives. In fact, the CEE countries have re-introduced new distortions. Some
have done this as part of the EU accession process; others started earlier.
Improving policies and reducing distortions can be done through various means:
overall reductions in support policies, shifting support to less-distortive policy instruments,
focusing budgetary means to public good type of investments rather than farm subsidies,
shifting from a quantity-based to a quality-based policy paradigm, etc.
Such reforms are not inconsistent with EU accession. The EU has moved in recent
years to more-decoupled farm support, and has given more policy attention to improving the
efficiency of farms and food companies.
From this perspective, it is important to point to other avenues, such as
macroeconomic and regulatory reforms to stimulate food industry investment, labor market
reforms to enhance off-farm employment opportunities, and credit reforms to stimulate
improved access to rural credit.
A crucial component of this should be a shift in the policy paradigm from policies
focused on quantity and basic standards to a policy framework focused on quality and high
standards. Safety and quality standards are increasingly crucial components of modern food
chains, both domestically and internationally. With emerging technologies and the growing
influence of large retail and processing chains, demand for traceability and high quality
standards will further increase. These developments will also pose new policy challenges in
terms of equity (exclusion and rent extraction) and efficiency (contracting problems, safety
and standard disputes, etc). Traditional agricultural policies are not fit to deal with the
challenges posed by these modern chains.
Competition and anti-trust policy is an important area for policy attention. In supply
chains where farms have to sell their products to trading, processing, and retailing companies,
the ability to choose freely between companies is of crucial importance in getting better
conditions for farms. Concentration in agribusiness and the food industry, such as the

28
increasing dominance of large retail chains in Central Europe, puts pressure on contract
conditions and terms for farms.
An important policy finding is that exchange rate developments have had and will
continue to have an important impact on farmers’ incentives. Part of these exchange rate
effects were caused or influenced by policy (e.g., government used to set exchange rates
under the Communist regime, and pegged exchange rates still apply in some countries now),
or they were a consequence of macroeconomic developments. In either case, over the past
two decades exchange rate distortions and adjustments have had very substantial impacts on
incentives, both before and during transition. The impact of this factor will be different after
EU accession. While it is unclear how many of the CEECs will join the eurozone, their own
exchange rate policy vis-à-vis the Euro and the appreciation of the Euro against the dollar
affects the international competitiveness of the CEE farms.
It is important to realize though that the political economy forces identified above
may constrain the prospects for further reducing distortions to agricultural incentives in the
foreseeable future, because of changes in the pressure and the constraints for policy reform.
Overall income growth induces political economy pressures to increase assistance to
agriculture. This is suggested by the positive relationship between agricultural protection and
economic development, which this study also finds in CEE. Growth and improved budgetary
situations also put the CEE governments in a stronger position to bargain with international
institutions such as the IMF and the World Bank in the late 1990s, because countries’ growth
and improved fiscal positions made them less likely to be beholden to conditionlity by
international institutions.
The role of international institutions, such as the World Bank, the IMF and the EBRD,
was very important at the start of transition, as it provided policy reform guidance in all these
countries. However, in later years this advice has been less effective. For the CEE countries
wanting to join the EU, EU accession (or wider European integration) had taken priority.
Moreover, they benefited strongly from private inflows of capital, know-how and technology,
for example through large foreign direct investment in their food industries in the late 1990s
and 2000s.
Later on, accession of the CEE countries to the EU has increased their levels of farm
assistance, although they now face more competition within the enlarged EU. Reducing CEE
farm assistance in the future cannot without reducing EU protection levels. However,
important improvements can take place by shifting to less distortive policy instruments. Some
important reforms have been implemented or are underway in the EU with important

29
implications for distortions in the CEE, such as reforms of some of the commodity regimes
and the shift from per hectare payments to single farm payments. The letter will be
implemented in the CEE in the coming years.
From the perspective of further reforms and consolidating reforms in the future, the
ongoing WTO negotiations are important to impose discipline on agricultural policy
distortions. Indirectly, the WTO agreements have already had major impacts on CEE
distortions, as they have imposed constraints on the policies and the distortions that an
enlarged EU-27 could implement, and have thus importantly contributed to the EU policy
reforms in 2000, which is now resulting in lower distortions in the CEE than would otherwise
have been the case.
References
Alston, J.M., G.W. Edwards, and J.W. Freebairn (1988), “Market Distortions and the Benefits
from Research”, American Journal of Agricultural Economics 70(2): 281–88.
Anderson, K. (1995), “Lobbying Incentives and the Pattern of Protection in Rich and Poor
Countries”, Economic Development and Cultural Change 43: 401-24.
Anderson, K. and Y. Hayami (1986), The Political Economy of Agricultural Protection, Boston,
London and Sydney: Allen and Unwin.
Anderson, K. and W. Martin (2005), “Agricultural Trade Reform and the Doha Development
Agenda”, The World Economy 28(9): 1301-27, September.
Anderson, K., W. Martin, D. Sandri, and E. Valenzuela (2006), “Methodology for Measuring
Distortions to Agricultural Incentives”, Agricultural Distortions Working Paper 02,
Washington DC, December. Posted at www.worldbank.org/agdistortions
Babetski, J., L. Boone, and M. Maurel (2003), “Exchange Rate Regimes and Supply Shocks
Asymmetry: the Case of the Accession Countries”, Charles University, CERGE-EI
Working Paper No. 206.

30
Bacchetta, M. and Z. Drabek (2002), “Effects of WTO Accession on Policy-Making in Sovereign
States: Preliminary Lessons from the Recent Experience of Transition Countries”, WTO
Staff Working Paper DERD-2002-02, Geneva.
Bojnec, S. and J. Swinnen (1997), “Patterns of Agricultural Price Distortions in Central Europe”,
Food Policy 22(4): 289-306.
Bojnec, S., W. Münch, and J. Swinnen (1998), “Exchange Rates and the Measurement of
Agricultural Price Distortions in CEECs and the Costs of CEEC-EU Accession”, pp. 285-
304 in Brockmeier, M., Francois, J., Hertel, T., and P.M. Schmitz (eds.), Economic
Transition and the Greening of Policies. Modeling New Challenges for Agriculture and
Agribusiness in Europe, Kiel: Wissenschaftsverlag Vauk.
Brooks, K. and J. Nash (2002), “The Rural Sector in Transition Economies“, pp. 1547-1592 in
Gardner B. and G. C. Rausser (eds.), Handbook of Agricultural Economics. Volume 2A.
Agriculture and its External Linkages, Amsterdam: North Holland, Elsevier.
Burrell, A. (2000), “The World Trade Organization and EU agricultural policy” in A. Burrell and
A. Oskam (eds.), Agricultural Policy and Enlargement of the European Union,
Wageningen: Wageningen University Press.
Burrell, A. (2007), “Distortions to Agricultural Incentives in Turkey”, Agricultural Distortions
Working Paper xx, Washington DC, September. Posted at
www.worldbank.org/agdistortions
Campos J.E.L. (1989), “Legislative Institutions, Lobbying, and The Endogenous Choice of
Regulatory Instruments - A Political-Economy Approach To Instrument Choice”, Journal
of Law Economics and Organization 5(2): 333-53.
Ciaian, P. and J.F.M. Swinnen (2006), “Land Market Imperfections and Agricultural Policy
Impacts in the New EU Member States: A Partial Equilibrium Analysis”, American
Journal of Agricultural Economics 88(4): 799-815.
Chevassus-Lozza, E., D. Majkovic, V. Persillet, M. Unguru (2005), “Technical Barriers to Trade
in the European Union: Importance for the New EU Members. An Assessment for
Agricultural and Food Products”, Paper presented at XIth EAAE Congress, August 24-27,
Copenhagen.

31
Cook, E.C., W.M. Liefert, and R.B. Koopman (1991), “Government Intervention in Soviet
Agriculture: Estimates of Consumer and Producer Subsidy Equivalents”, Staff Report No.
AGES 9146, Economic Research Service, U.S. Dept. of Agriculture, August.
von Cramon-Taubadel, S., O. Nivyevski, E.E. von der Malsburg and V. Movchan (2007),
“Distortions to Agricultural Incentives in Ukraine”, Agricultural Distortions Working
Paper 06, World Bank, Washington DC, August. Posted at
www.worldbank.org/agdistortions
de Gorter, H. and J. Swinnen (2002), “Political Economy of Agricultural Policies”, Ch. 36 in B.
Gardner and G. Rausser (eds.), Handbook of Agricultural Economics, Volume 2,
Amsterdam: Elsevier.
de Gorter, H. and Y. Tsur (1991), “Explaining Price Policy Bias in Agriculture: The Calculus of
Support-Maximizing Politicians”, American Journal of Agricultural Economics 73: 1244-
54.
Dewbre, J., Antón, J. and Thompson, W. (2001), “The Transfer Efficiency and Trade Effects of
Direct Payments”, American Journal of Agricultural Economics 83(5): 1204–14.
Dries, L. and J. Swinnen (2004), “Foreign Direct Investment, Vertical Integration and Local
Suppliers: Evidence from the Polish Dairy Sector”, World Development 32(9): 125-154.
Dries, L., T. Reardon and J. Swinnen (2004), “The Rapid Rise of Supermarkets in Central and
East Europe: Implications for the Agrifood and Rural Development”, Development Policy
Review 22(5): 525-56.
European Commission (2005), Agriculture in the European Union: Statistical and Economic
Information 2005, Brussels: European Commission.
Giavazzi, F. and M. Pagano (1988), “The Advantage of Tying One’s Hands”, European
Economic Review 32(5): 1055-75.
Halpern, L. and D. Wyplosz (1995), “Equilibrium Real Exchange Rates in Transition”, CEPR
Discussion Paper Series No. 1145, London: Center for Economic Policy Research.
Hartell, J. and J. Swinnen (1998), “Trends in Price and Trade Policy Instruments in Central
European Agricultural and Food Markets”, The World Economy 21(2): 261-79.

32
Hartell, J. and J. Swinnen (1999), "Political Economy Aspects of Free Trade Agreements and
Agricultural Policy in Central and Eastern Europe", Paper presented at the 61st EAAE
Seminar, pp. 75-99 in Foreign Trade and Foreign Investment in Agri-Food Sectors:
Competitiveness and Policy Implications, Warsaw: Warsaw Agricultural University
Press.
Hartell, J. and J. Swinnen (2000), “European Integration and the Political Economy of Central
and East European Agricultural Price and Trade Policy”, in S. Tangermann and M. Banse
(eds.), Central and Eastern European Agriculture in an Expanding European Union,
London: CAB International.
Hillman, A.L. (1994), “The Transition from Socialism: An Overview from a Political Economy
Perspective”, European Journal of Political Economy 10(1): 191-225.
Hillman, A.L. and H.W. Ursprung (1996), “The Political Economy of Trade Liberalization in the
Transition”, European Economic Review 40(3-5): 783-94.
Honma, M. and Y. Hayami (1986), “Structure of Agricultural Protection in Industrial Countries”,
Journal of International Economics 20: 115-29.
Josling, T. (2007), “Distortions to Agricultural Incentives in Western Europe”, Agricultural
Distortions Working Paper xx, Washington DC, September. Posted at
www.worldbank.org/agdistortions
Kazlauskiene, N. and W.H. Meyers (2003), “Implications of EU Accession for Trade Regimes
and Trade Flows of CEECs”, Paper presented at the IATRC Conference on Agricultural
Policy Reform and the WTO: Where are we Heading? Capri, 23-26 June.
Kazlauskiene, N. and W.H. Meyers (2001), “CEEC Interests and Options in the WTO 2000
Negotiations”, Ch. 6 in M.D. Ingco and L.A. Winters (eds.), Agricultural Trade
Liberalization in a New Trade Round: Perspectives of Developing Countries and
Transition Economies, World Bank Discussion Paper No. 418, Washington DC: World
Bank.
Kazlauskiene, N. and W.H. Meyers (1999), “The Baltic Free Trade Agreement in Agriculture:
Early Results of the Experiment”, MOCT-MOST: Economic Policy in Transition
Economics 9(3): 291-305.

33
Kostova Huffman, S. and S.R. Johnson (2004), “Impacts of Economic Reform in Poland:
Incidence and Welfare Changes Within a Consistent Framework”, Review of Economics
and Statistics 86(2): 626-636.
Kowalski, P., Paczynski, W. and Rawdanowicz, L. (2003), “Exchange Rate Regimes and the
Real Sector: a Sectoral Analysis of CEE Countries”, Post-Communist Economies 15(4):
533-55.
Krueger, A.O., M. Schiff, and A. Valdes (1991), The Political Economy of Agricultural Pricing
Policy, London: Johns Hopkins University Press.
Liefert, W. and J. Swinnen (2002), “Changes in Agricultural Markets in Transition Economies”,
Agricultural Economic Report No. AER806, Washington DC: Economic Research
Service, U.S. Dept. of Agriculture.
Liefert, W. and O. Liefert (2007), “Distortions to Agricultural Incentives in Russia”, Agricultural
Distortions Working Paper 08, Washington DC, August. Posted at
www.worldbank.org/agdistortions
Lindert, P.H. (1991), “Historical Patterns of Agricultural Policy”, in Timmer, C.P. (ed.),
Agriculture and the State, Ithaca: Cornell University Press.
Macours, K. and J. Swinnen (2000), “Causes of Output Decline in Economic Transition: The
Case of Central and Eastern European Agriculture”, Journal of Comparative Economics
28(1): 172-206.
Munk, K.J. (1995), “Government Support to Sectors with Structural Adjustment Problems: A
Public Finance Approach”, Center for Economic Studies, K.U. Leuven, Leuven.
Olson, M. (1985), “Space, Agriculture and Organization”, American Journal of Agricultural
Economics 67: 928-37.
OECD (1994), Review of Agricultural Policies: Hungary, Paris: OECD.
OECD (1994), Review of Agricultural Policies: Poland, Paris: OECD.
OECD (1995a), Review of Agricultural Policies: the Czech Republic, Paris: OECD.

34
OECD (1995b), Purchasing Power Parities for Countries in Transition -- Methodological Papers,
OECD Centre for Cooperation with the Economies in Transition. Paris: OECD.
OECD (1996a), Review of Agricultural Policies: Latvia, Paris: OECD.
OECD (1996b), Review of Agricultural Policies: Lithuania, Paris: OECD.
OECD (1996c), Review of Agricultural Policies: Estonia, Paris: OECD.
OECD (1996d), Agricultural Policies, Markets and Trade in the Central and Eastern European
Countries, Selected New Independent States, Mongolia and China: Monitoring and
Outlook 1995. Paris: OECD.
OECD (1997), Review of Agricultural Policies: Slovak Republic, Paris: OECD.
OECD (2000a), Review of Agricultural Policies: Bulgaria, Paris: OECD.
OECD (2000b), Review of Agricultural Policies: Romania, Paris: OECD.
OECD (2001), Review of Agricultural Policies: Slovenia, Paris: OECD.
OECD (various years), Agricultural Policies in Transition Economies, Paris: OECD.
OECD (various years), Agricultural Policies in OECD Countries, Paris: OECD.
Orazem, P.F. and M. Vodopivec (1997), "Value of Human Capital in Transition to Market:
Evidence from Slovenia", European Economic Review 41(3-5): 893-903.
Ray, E.J. (1981), “The Determinants of Tariff and Non-Tariff Trade Restrictions in the United
States”, Journal of Political Economy 89: 105-21.
Rodrik, D. (1994), “What Does the Political Economy Literature on Trade Policy (Not) Tell Us
That We Ought to Know?” Discussion Paper 1039, London: CEPR.
Sandri, D., Valenzuela, E., and Anderson, K. (2006), “Compendium of Global Economic and
Trade Indicators by Region, 1960 to 2004”, Agricultural Distortions Working Paper 01,
May, Washington DC. Posted at www.worldbank.org/agdistortions
Sarris, A. (1994), “Implications of EC Economic Integration for Agriculture, Agricultural Trade,
and Trade Policy”, in Hartmann, M., Schmitz, P.M. and von Witzke, H. (eds.),

35
Agricultural Trade and Economic Integration in Europe and North America, Kiel:
Wissenschaftsverlag Vauk.
Swinnen, J. (1994), "A Positive Theory of Agricultural Protection", American Journal of
Agricultural Economics 76(1): 1-14, February.
Swinnen, J. (1996), "Endogenous Price and Trade Policy Developments in Central European
Agriculture", European Review of Agricultural Economics 23(2): 133-60.
Swinnen, J. (2002), “Transition and Integration in Europe: Implications for agricultural and food
markets, policy and trade agreements”, The World Economy 25(4): 481-501.
Swinnen, J. (2004), “Eastern Enlargement of the EU and Its Implications for Agriculture and
Agricultural Policies”, Food Economics 1(1): 5-11.
Swinnen, J., A. Banerjee, and H. de Gorter (2001), “Economic Development, Institutional
Change and The Political Economy of Agricultural Protection: An econometric Study on
Belgium Since the 19th Century”, Agricultural Economics 26(1): 25-44S.
Swinnen, J. and H. de Gorter (1998), “Endogenous Market Distortions and the Benefits from
Research”, American Journal of Agricultural Economics 80(1): 107-15.
Swinnen, J. and H. de Gorter (2001), “On Government Credibility, Compensation and
Underinvestment in Public Research”, European Review of Agricultural Economics
29(4): 501-22.
Swinnen J. and H. Gow (1999), “Agricultural Credit Problems and Policies during the Transition
to a Market Economy in Central and Eastern Europe”, Food Policy 21(1): 21-47.
Swinnen, J. and L. Vranken (2006), “Patterns of Land Market Developments in Transition”,
LICOS Discussion Paper 179/2007, Leuven.
Swinnen, J. and L. Vranken (2007), “Review of Transitional Restrictions on Agricultural Real
Estate for Foreigners in the New EU Member States”, Report to the European
Commission, Brussels.
Swinnen, J. and F. van der Zee (1993), “The New Political Economy of Agricultural Policies: A
Survey“, European Review of Agricultural Economics 20(3): 261-90.

36
Tangermann, S. (2000), “Widening the EU to Central and Eastern European Countries: WTO and
Perspectives of the New Member Countries”, in A. Burrell and A. Oskam (eds.),
Agricultural Policy and Enlargement of the European Union, Wageningen: Wageningen
University Press.
Tracy M. (1989), Government and Agriculture in Western Europe 1880-1988, 3rd edition, New
York: New York University Press.
Valdes, A. (ed.) (2000), “Agricultural Support Policies in Transition Economies”, World Bank
Technical Paper No. 470, Washington DC.

37
Table 1: Real agricultural income per annual work unit in CEECs after EU accession (change in 2004 relative to 2003, percent)
2004/2003 (percent)
Czech R. 60 Estonia 55 Latvia 74 Lithuania 69 Hungary 55 Poland 95 Slovenia 51 Slovakia 28 CEEC-8* 61 EU-15 3
Source: European Commission (2005). Notes: AWU: annual work unit, equivalent to the labor of one person working full time in agriculture.
* Authors’ calculation - simple average over 8 CEECs that are included in the table.

38
Table 2: Nominal rates of assistance* to agricultural industries, CEEC-10, 1992 to 2003 (percent)
Crop 1992 1993 1994 1995 1996 1997 1998 1999 2000 2001 2002 2003
Wheat 3.3 16.7 9.3 -8.4 1.6 5.1 21.0 24.6 20.6 15.4 13.7 20.3
Rye 5.5 -15.3 -0.5 22.6 11.5 23.6 63.8 71.4 46.8 23.5 -8.6 7.8
Maize 21.1 36.2 9.5 0.4 -0.4 1.0 1.6 -1.5 9.1 12.3 -2.9 28.0
Milk 3.7 25.0 25.4 27.2 21.6 35.3 79.4 45.2 32.8 29.6 48.8 61.0
Other grains 2.7 26.5 9.2 5.5 25.9 24.7 22.7 24.5 28.9 6.3 4.7 14.5
Barley -5.8 36.6 17.5 -11.1 -1.4 6.0 34.9 15.9 6.8 12.7 21.3 17.3
Potatoes 23.0 15.5 -6.7 -2.0 16.9 51.9 3.4 9.3 34.8 20.5 82.6 86.2
Oats -37.3 -18.5 -15.6 -5.3 12.8 46.1 29.3 47.5 47.8 35.3 -7.4 26.0
Sunflower -16.7 -19.5 -22.9 -16.8 -12.2 -14.8 -15.4 -13.3 1.6 -11.3 -9.3 -7.7
Rape 17.8 -3.7 -17.8 -10.9 -9.8 -10.7 13.9 4.5 13.2 14.7 6.6 7.4
Soybean 24.4 89.0 45.0 20.3 21.6 0.4 -14.9 -8.8 -4.0 27.5 19.3 -6.6
Sugar 71.4 65.5 49.1 42.7 51.4 59.6 81.0 102.6 82.3 66.1 95.7 136.0
Beef 5.9 -9.3 -3.0 0.5 -0.9 -1.9 19.6 9.5 6.5 39.0 38.5 23.1
Pigmeat -20.1 11.8 29.3 15.2 2.3 -0.9 39.0 54.4 28.5 29.7 27.7 20.1
Poultry 17.2 33.6 52.9 53.1 43.7 43.7 62.3 52.9 50.3 55.2 80.9 66.9
Eggs 11.4 15.1 26.8 45.7 26.2 39.7 58.6 62.5 34.7 31.1 18.4 2.7
Sheep 82.7 34.0 35.9 86.5 52.0 40.3 59.0 6.8 -6.8 6.2 4.0 10.4
Importables 4.6 24.5 23.8 20.8 15.2 19.1 49.8 42.0 29.8 33.3 34.4 43.0
Exportables -5.6 4.4 10.0 4.6 3.1 9.3 29.3 25.9 22.6 15.0 27.7 19.7 Total agriculture -2.6 12.1 13.5 10.4 8.0 13.1 40.3 33.0 25.0 25.7 29.7 33.3
Standard Deviation 33.2 29.2 23.0 29.5 22.6 22.4 27.6 30.6 23.1 17.9 30.7 34.8
Share of above products in total gross value of agricultural production**
64.7 64.8 63.0 61.9 63.5 64.9 64.3 62.4 64.6 66.0 63.0 61.6
Source: Authors’ calculations using data from OECD, FAOSTAT, UN, Eurostat, and UNCTAD TRAINS Notes: * Nominal rates of assistance are simple averages over 10 CEECs;
** Share is calculated in terms of undistorted prices and is simple average over 10 CEECs.

39
Table 3: Nominal rates of assistance to agricultural and non-agricultural tradable sectors, and relative rate of assistance, CEEC-10, 1992 to 2003*
(percent)
1992 1993 1994 1995 1996 1997 1998 1999 2000 2001 2002 2003
Covered productsa -2.6 12.1 13.5 10.4 8.0 13.1 40.3 33.0 25.0 25.7 29.7 33.3
Non-covered products -2.6 12.1 13.5 10.4 8.0 13.1 40.3 33.0 25.0 25.7 29.7 33.3
All agric. productsa -2.6 12.1 13.5 10.4 8.0 13.1 40.3 33.0 25.0 25.7 29.7 33.3
Non-product specific assistance (NPS) 1.8 2.0 2.4 2.3 2.0 2.5 3.7 4.5 3.8 3.4 4.0 4.7
Total agriculture incl. NPSa,b -0.8 14.2 15.9 12.6 10.0 15.6 43.9 37.5 28.9 29.1 33.6 38.0
Tradables
All Agriculturea,b -0.8 14.2 15.9 12.6 10.0 15.6 43.9 37.5 28.9 29.1 33.6 38.0
All Non-Agriculture 10.4 10.0 10.0 5.9 5.6 4.8 4.6 4.4 4.4 4.3 5.5 5.8
RRAc -10.1 3.8 5.3 6.4 4.2 10.3 37.6 31.8 23.5 23.8 26.7 30.4
Source: Own calculations using data from OECD, FAOSTAT, UN, Eurostat, and UNCTAD TRAINS Notes:* Nominal rates of assistance are simple averages over 10 CEECs;
a NRA including product-specific subsidies; b NRA including other (incl. decoupled & non-product-specific) subsidies; c The RRA is defined as 100*[(100+NRAagt)/(100+NRAnonagt) - 1], where NRAagt
and NRAnonagt are the average percentage NRAs for the tradables parts of the agricultural and non-agricultural sectors, respectively.

40
Table 4: Consumer tax equivalent, CEEC-10, 1992 to 2003 (percent)
1992 1993 1994 1995 1996 1997 1998 1999 2000 2001 2002 2003 Bulgaria -34.1 -9.3 -26.1 -21.4 -35.0 -11.2 7.1 -1.9 5.2 -5.3 -9.3 13.0 Czech R. 15.0 26.3 16.6 0.2 1.4 0.7 27.3 16.9 6.8 16.9 22.1 21.5 Estonia -36.9 -21.9 -8.2 1.6 5.5 3.9 24.7 5.2 5.1 5.6 10.5 13.4 Hungary 8.5 21.7 17.9 2.9 2.5 2.2 11.6 17.1 14.9 17.3 19.6 18.7 Latvia -41.0 -15.7 9.3 0.2 3.0 10.5 37.3 37.9 27.7 31.7 31.8 16.0 Lithuania -38.8 -15.7 -15.8 2.3 4.9 13.4 41.6 43.4 24.0 21.1 29.6 24.4 Poland -6.5 9.2 13.1 5.7 14.6 11.9 26.2 19.9 6.2 4.3 0.0 -5.5 Romania 2.2 28.4 15.8 4.8 4.9 1.6 47.1 30.4 25.7 65.0 45.6 61.5 Slovakia 2.1 15.8 13.8 1.3 -6.1 2.3 21.2 15.8 7.0 3.6 10.8 13.1 Slovenia 47.8 49.5 48.1 48.5 36.6 45.3 72.1 75.4 45.6 38.5 43.0 46.6
CEEC-10 -8.2 8.9 8.4 4.6 3.2 8.1 31.6 26.0 16.8 19.9 20.4 22.3
Source: Own calculations using data from OECD, FAOSTAT, UN, Eurostat, and UNCTAD TRAINS Note: Consumer tax equivalent for CEEC-10 is the simple average over 10 CEECs.

41
Table 5: Political economy regression results
(dependent variable is NRA; data are 1990-2003)
Model 1 Model 2 Constant -30.9
(0.161) -213***
(0.004)
GDP per capita ($) 0.007*** (0.000)
0.02*** (0.002)
Agricultural trade balance -0.26*** (0.005)
–
Real exchange rate 23.9** (0.011)
85.8** (0.010)
Arable land per person 18.6 (0.466)
267*** (0.001)
R-squared 0.29 0.09
Source: Authors’ calculations using data from OECD, FAOSTAT, UN and Eurostat. Notes: p-values in parenthesis
* significant at 10 percent ** significant at 5 percent *** significant at 1 percent. Data: unbalanced panel data for period 1990-2003.
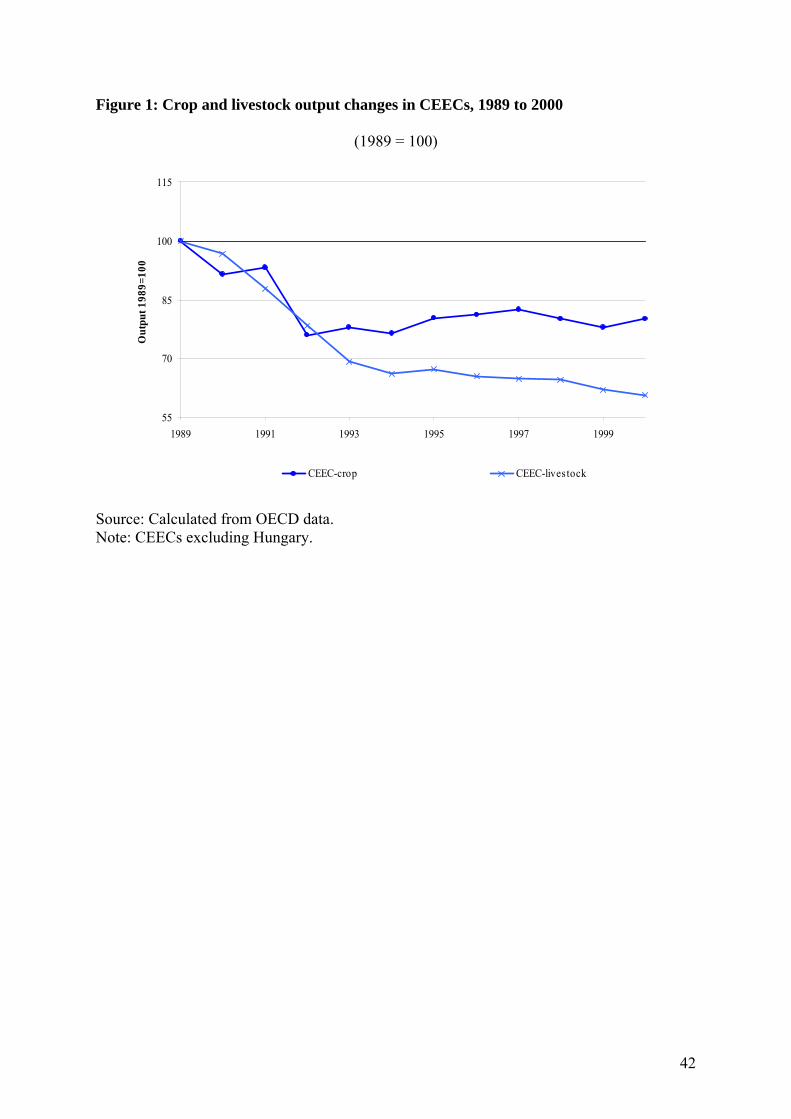
42
Figure 1: Crop and livestock output changes in CEECs, 1989 to 2000
(1989 = 100)
55
70
85
100
115
1989 1991 1993 1995 1997 1999
Out
put 1
989=
100
CEEC-crop CEEC-livestock
Source: Calculated from OECD data. Note: CEECs excluding Hungary.

43
Figure 2: Sectoral output changes in CEECs, 1990 to 2001
(1990 = 100)
30
65
100
135
170
1990 1991 1992 1993 1994 1995 1996 1997 1998 1999 2000 2001
Out
put 1
990=
100
GDP Agriculture Industry Services
Source: Calculated using data from OECD and Sandri et al. (2006).

44
Figure 3: Agricultural trade of CEECs, 1989 to 2004
(US$billions)
-3
0
3
6
9
12
15
18
21
1989 1991 1993 1995 1997 1999 2001 2003
Bill
ion
$
CEEC imports CEEC exports CEEC trade balance
Source: FAOSTAT Note: For Estonia, Latvia, Lithuania and Slovenia, data available only from 1992.

45
Figure 4: Nominal rates of assistance* to exportable, import-competing and all agricultural industries, CEEC-10, 1992 to 2003
(percent)
-10
0
10
20
30
40
50
60
1992 1993 1994 1995 1996 1997 1998 1999 2000 2001 2002 2003
Importables Exportables Total Ag
Source: Own calculations using data from OECD, FAOSTAT, UN and Eurostat. Note: NRA for CEEC is the simple average for Bulgaria, the Czech Republic, Estonia, Hungary, Latvia, Lithuania, Poland, Romania, Slovakia, Slovenia, and Slovenia. NRA includes product-specific subsidies but does not include non-product specific subsidies.

46
Figure 5: Nominal rates of assistance to agriculture in each of the ten CEECs, 2000 (percent)
0
10
20
30
40
50
60
70
80
Slovenia Latvia Romania Slovakia Lithuania Hungary Czech R. Estonia Poland Bulgaria CEEC-10
Source: Authors’ calculations using data from OECD, FAOSTAT, UN and Eurostat. Note: NRA for CEEC is the simple average for Bulgaria, the Czech Republic, Estonia, Hungary, Latvia, Lithuania, Poland, Romania, Slovakia, and Slovenia. NRA includes both product-specific subsidies and non-product specific subsidies.

47
Figure 6: Nominal rates of assistance to various agricultural industries, CEEC-10, 2000 (percent)
-10
0
10
20
30
40
50
60
70
80
90Su
gar
Poul
try
Oat
s
Rye
Pota
toes
Eggs
Milk
Pigm
eat
Whe
at
Rap
e
Mai
ze
Bar
ley
Bee
f
Sunf
low
er
Soyb
ean
Shee
p
Source: Authors’ calculations using data from OECD, FAOSTAT, UN and Eurostat. Note: NRA includes product-specific subsidies.

48
Figure 7: Nominal rates of assistance to agricultural and non-agricultural tradable sectors, and relative rate of assistance, CEEC-10, 1992 to 2003
(percent)
-20
-10
0
10
20
30
40
50
1992 1993 1994 1995 1996 1997 1998 1999 2000 2001 2002 2003
All Agriculture All Non-Agriculture RRAc
Source: Authors’ calculations using data from OECD, FAOSTAT, UN and Eurostat. Note: NRA for CEEC is the simple average for Bulgaria, the Czech Republic, Estonia, Hungary, Latvia, Lithuania, Poland, Romania, Slovakia, Slovenia, and Slovenia. The RRA is defined as 100*[(100+NRAagt)/(100+NRAnonagt) - 1], where NRAagt and NRAnonagt are the average percentage NRAs for the tradables part of the agricultural and non-agricultural sectors, respectively. NRA for agriculture includes both product-specific subsidies and non-product specific subsidies.

49
Table A1: Simple average applied and bound tariffs for three sectors in CEECs and EU-15, 1999-2001 (percent)
Applied tariffs Bound tariffs Applied tariffs/Bound tariffs
Agric and Proc food
Other Manufacturing
Other Primary Year
Agric and Proc food
Other Manufacturing
Other Primary
Agric and Proc food
Other Manufacturing
Other Primary
Bulgaria 23.3 7.8 6.4 2001 36.7 22.9 22.9 2001 0.6 0.3 0.3 Czech R. 8.9 3.4 3.1 1999 9.8 4.5 3.2 2001 0.9 0.8 1.0 Estonia 11.7 0.0 0.0 2001 18.3 7.1 7.3 2001 0.6 0.0 0.0 Hungary 27.5 7.9 5.3 2002 28.4 7.3 4.5 2001 1.0 1.1 1.2 Latvia 10.8 2.5 4.3 2001 36.4 8.9 10.1 2000 0.3 0.3 0.4 Lithuania 4.8 1.2 0.4 2002 15.7 8.5 7.2 2001 0.3 0.1 0.1 Poland 20.7 2.4 1.5 2001 36.0 10.1 8.3 2001 0.6 0.2 0.2 Romania 23.1 8.7 6.0 1999 94.1 32.0 32.8 1999 0.2 0.3 0.2 Slovenia 13.1 11.3 7.3 2001 23.5 23.6 24.6 2001 0.6 0.5 0.3 CEEC 15.1 4.6 3.5 25.6 11.6 11.0 0.6 0.4 0.3 EU-15 5.7 3.2 2 2001 7 4.1 2.1 2001 0.8 0.8 0.9
Source: www.gtap.org Note: CEECs tariffs are simple averages, excluding Romania and Slovakia.

50
Table A2: Weighted average applied and bound tariffs for three sectors in CEECs and EU-15, 1999-2001
(percent) Applied tariffs Bound tariffs Applied tariffs/Bound tariffs
Agric and Proc food
Other Manufacturing
Other Primary Year
Agric and Proc food
Other Manufacturing
Other Primary Year
Agric and Proc food
Other Manufacturing
Other Primary
Bulgaria 22.2 4.7 2.5 2001 34.0 19.4 18.8 2001 0.7 0.2 0.1 Czech R. 10.3 4.2 2.7 2002 10.0 4.2 2.5 2001 1.0 1.0 1.1 Estonia 8.6 0.0 0.0 2001 15.2 4.8 6.4 2001 0.6 0.0 0.0 Hungary 23.9 8.1 2.2 2002 26.1 8.3 2.4 2001 0.9 1.0 0.9 Lithuania 4.1 0.3 0.1 2002 12.1 7.6 12.5 2001 0.3 0.0 0.0 Latvia 10.6 1.2 2.5 2001 24.0 6.4 8.3 2000 0.4 0.2 0.3 Poland 12.4 1.3 0.5 2001 27.6 8.1 4.5 2001 0.4 0.2 0.1 Romania 30.2 7.0 3.7 2001 2001 Slovenia 13.0 10.5 6.2 2001 21.9 21.6 21.5 2001 0.6 0.5 0.3 CEEC 13.1 3.8 2.1 21.4 10.1 9.6 0.6 0.4 0.2 EU-15 5.4 2.9 0.8 2001 6.5 3.3 0.8 2001 0.8 0.9 1
Source: www.gtap.org Note: for CEECs tariffs are simple averages, Romania and Slovakia are not included

51
Table A3: Applied tariffs in CEECs, 1991 to 2003 Simple average Weighted average
Average
1991-1995 Average
1996-2000 Average
2001-2003 Average
1991-1995 Average
1996-2000 Average
2001-2003 Czech R. AgFood – 8.48 8.19 – 9.33 10.44 PrmAGR – 3.90 3.53 – 5.40 4.96 ProFoo – 11.87 11.41 – 12.20 13.38 OthPrm – 4.21 4.05 – 1.79 1.88 Manufa – 4.93 4.91 – 4.29 4.33 Estonia AgFood 0.05 11.56 11.60 0.03 8.52 7.73 PrmAGR 0.15 6.19 7.09 0.13 3.24 3.29 ProFoo 0.0 14.64 13.90 0.0 11.47 9.77 OthPrm 0.0 0.0 0.0 0.0 0.0 0.0 Manufa 0.05 0.0 0.0 0.49 0.0 0.0 Hungary AgFood 20.17 30.90 27.46 15.34 23.50 23.89 PrmAGR 10.94 20.25 19.95 8.35 18.60 19.90 ProFoo 26.74 37.87 31.98 20.91 26.56 25.38 OthPrm 7.15 4.75 5.99 2.07 1.01 1.89 Manufa 10.86 6.61 7.68 10.74 6.40 7.94 Lithuania AgFood 8.63 8.18 4.75 9.53 8.78 4.04 PrmAGR 3.50 3.06 2.41 2.02 2.44 2.85 ProFoo 11.13 10.55 6.01 13.27 11.15 4.56 OthPrm 0.90 1.16 0.57 0.17 0.28 0.12 Manufa 2.56 3.00 1.08 1.70 1.75 0.38 Latvia AgFood – 9.66 10.78 – 6 10.64 PrmAGR – 5.75 5.66 – 5.05 6.82 ProFoo – 11.81 13.46 – 6.48 11.89 OthPrm – 6.53 6.16 – 3.04 3.79 Manufa – 3.94 2.72 – 2.34 1.43 Poland AgFood 10.93 26.31 21.59 6.92 16.93 12.95 PrmAGR 8.09 16.45 12.57 5.04 22.89 20.50 ProFoo 12.79 34.04 28.33 8.50 31.44 27.61 OthPrm 11.04 3.39 1.82 3.26 1.12 0.53 Manufa 10.58 5.21 2.79 8.87 3.88 1.49 Romania AgFood 24.17 23.12 24.86 24.27 22.47 30.24 PrmAGR 21.51 13.86 15.95 19.66 15.31 18.43 ProFoo 25.25 27.29 29.32 29.34 27.83 37.61 OthPrm 10.49 5.15 7.24 3.01 1.9 2.03 Manufa 18.9 8.5 10.55 16.74 7.08 7.13 Slovenia AgFood – 12.80 10.86 – 13.34 10.21 PrmAGR – 7.71 7.08 – 7.32 6.20 ProFoo – 16.25 13.24 – 17.14 12.31 OthPrm – 7.01 3.74 – 5.48 2.49 Manufa – 11.65 6.33 – 11.80 4.12 Slovakia AgFood – – 24.5 – – 30.53 PrmAGR – – 14.94 – – 15.29 ProFoo – – 31.44 – – 36.53 OthPrm – – 17.44 – – 8.2 Manufa – – 22.4 – – 23.44 Bulgaria AgFood – – 22.59 – – 22.38 PrmAGR – – 16.21 – – 14.06 ProFoo – – 25.73 – – 26.80 OthPrm – – 8.04 – – 2.54 Manufa – – 8.74 – – 7.09

52
Source: UNCTAD TRAINS Notes: Unbalanced panel data were available. The averages reported for the considered periods were made out of those years that were available.

53
Table A4: Exchange rate regimes in the CEECs, 1990 to 2002 1990 1991 1992 1993 1994 1995 1996 1997 1998 1999 2000 2001 2002 Bulgaria 3 8 8 8 8 8 8 2 2 2 2 2 2 Czech R. 3 3 3 3 3 3 6 7 7 7 7 7 7 Estonia - - 2 2 2 2 2 2 2 2 2 2 2 Hungary 3 3 3 3 3 6 6 6 6 6 6 6 4 Latvia - - 8 8 3 3 3 3 3 3 3 3 3 Lithuania - - 8 8 2 2 2 2 2 2 2 2 2 Poland 3 5 5 5 5 6 6 6 6 6 8 8 8 Romania 3 7 7 7 7 7 7 7 7 7 7 7 7 Slovakia 3 3 3 3 3 3 6 6 7 7 7 7 7 Slovenia - - 7 7 7 7 7 7 7 7 7 7 7 Source: Babetski, Boone, and Maurel (2003). Notes: Exchange rate regime description: 1: Dollarization, no separate legal tender 2: Currency Board, currency fully backed by foreign exchange reserves 3: Conventional Fixed Pegs, peg to another currency or currency basket within a band of at most ±1 percent 4: Horizontal Bands, pegs with bands larger than ±1 percent 5: Crawling Pegs, pegs with central parity periodically adjusted in fixed amounts at a fixed, pre-announced rate or in response to changes in selected quantitative indicators 6: Crawling Bands, crawling pegs combined with bands of more than ±1 percent 7: Managed Float with No Preannounced Exchange Rate Path, active intervention without precommitment to a preannounced target or path for the exchange rate 8: Independent Float, market-determined exchange rate and monetary policy independent of exchange rate policy.

54
Table A5: Classification of exchange rate systems in CEECs, 1994 to 2002 Czech R. Estonia Hungary Lithuania Poland Slovakia Slovenia Q1_1994 0 0 - - - 0 - Q2_1994 0 0 - - - 0 - Q3_1994 0 0 - - - 0 - Q4_1994 0 0 - - - 0 - Q1_1995 0 0 0.5 0 0.5 0 0.5 Q2_1995 0 0 0.5 0 0.5 0 0.5 Q3_1995 0 0 0.5 0 0.5 0 0.5 Q4_1995 0 0 0.5 0 0.5 0 0.5 Q1_1996 0 0 0.5 0 0.5 0 0.5 Q2_1996 0.5 0 0.5 0 0.5 0 0.5 Q3_1996 0.5 0 0.5 0 0.5 0 0.5 Q4_1996 0.5 0 0.5 0 0.5 0 0.5 Q1_1997 0.5 0 0.5 0 0.5 0 0.5 Q2_1997 0.5 0 0.5 0 0.5 0 0.5 Q3_1997 1 0 0.5 0 0.5 0 0.5 Q4_1997 1 0 0.5 0 0.5 0 0.5 Q1_1998 1 0 0.5 0 0.5 0 0.5 Q2_1998 1 0 0.5 0 1 0 0.5 Q3_1998 1 0 0.5 0 1 0 0.5 Q4_1998 1 0 0.5 0 1 1 0.5 Q1_1999 1 0 0.5 0 1 1 0.5 Q2_1999 1 0 0.5 0 1 1 0.5 Q3_1999 1 0 0.5 0 1 1 0.5 Q4_1999 1 0 0.5 0 1 1 0.5 Q1_2000 1 0 0.5 0 1 1 0.5 Q2_2000 1 0 0.5 0 1 1 0.5 Q3_2000 1 0 0.5 0 1 1 0.5 Q4_2000 1 0 0.5 0 1 1 0.5 Q1_2001 1 0 0.5 0 1 1 0.5 Q2_2001 1 0 1 0 1 1 0.5 Q3_2001 1 0 1 0 1 1 0.5 Q4_2001 1 0 1 0 1 1 0.5 Q1_2002 1 0 1 0 1 1 0.5 Q2_2002 1 0 1 0 1 1 0.5 Q3_2002 1 0 1 0 1 1 0.5 Q4_2002 1 0 1 0 1 1 0.5
Source: Kowalski, Paczynski and Rawdanowicz (2003). Notes: "0" denotes fixed exchange rate regime, "0.5" intermediate regime, "1" floating regime.

55
Table A6: Nominal rates of assistance to agricultural industries, Bulgaria, 1992-2005
Crop 1992 1993 1994 1995 1996 1997 1998 1999 2000 2001 2002 2003 2004 2005
Importables
Sugar -34.2 -42.9 -29.5 -26.2 -26.0 -0.4 17.9 41.3 14.5 16.4 8.1 72.5 90.6 56.6
Exportables
Eggs 1.4 2.1 -5.5 11.9 -12.9 1.6 17.6 34.7 12.8 4.9 37.8 23.3 9.8 9.9
Sunflower -39.2 -29.6 -41.1 -39.9 -36.1 -29.2 -19.7 -24.0 -10.5 -15.3 -15.9 -6.9 -27.1 -14.8
Mixed Trade Status
Wheat -37.8 -1.0 -31.6 -44.7 -18.1 0.2 -13.6 -11.3 -2.4 -3.6 -18.5 8.6 12.9 -29.5
Maize -21.1 18.5 -19.9 -21.2 -20.7 -4.0 -5.8 -16.6 0.6 7.9 -13.7 6.0 32.4 -7.5
Milk -31.8 10.0 -11.5 25.2 -41.0 -15.4 63.5 -6.7 15.4 -18.7 -23.8 20.4 62.3 72.0
Barley -31.4 14.4 -18.6 -42.8 -14.9 3.4 9.5 -15.0 -10.4 -14.5 -19.6 2.2 1.8 -17.6
Beef -40.1 -35.8 -36.8 -22.7 -55.2 -32.9 -2.3 -26.4 2.4 29.6 46.8 39.7 5.7 -2.1
Pigmeat -36.7 -7.2 -18.0 -15.4 -48.3 -15.1 7.1 16.3 4.8 -13.9 -0.8 2.4 23.7 33.6
Poultry -27.5 -3.5 -12.7 -6.6 -32.1 2.9 25.8 32.5 25.4 14.5 41.2 90.0 134.7 94.1
Importables 0.0 -12.2 -25.3 -6.0 -28.9 -5.0 23.3 11.4 10.6 6.2 19.0 24.9 52.6 57.2
Exportables -25.7 0.7 -12.7 -14.3 -38.5 -13.2 -2.8 -7.6 -1.3 -9.1 -9.3 3.0 0.1 -5.8
Weighted average of above -25.7 -4.6 -16.3 -10.8 -35.2 -9.7 10.5 -1.8 4.9 -5.8 -6.3 10.7 13.3 15.7
Standard Deviation 13.1 21.7 13.4 24.4 15.3 13.6 23.8 26.5 11.7 17.8 29.9 36.0 53.1 42.5
Share of above products in total gross value of agricultural production*
56.7 66.1 65.6 62.5 59.7 55.3 53.9 53.3 66.4 55.6 48.4 49.5 55.7 51.7
Source: Own calculations using data from OECD, FAOSTAT, UN, Eurostat, and Unctad Trains * Share is calculated in terms of undistorted prices and is simple average

56
Table A7: Nominal rates of assistance to agricultural relative to non-agricultural industries, Bulgaria, 1992-2005
1992 1993 1994 1995 1996 1997 1998 1999 2000 2001 2002 2003 2004 2005
Covered productsa -25.7 -4.6 -16.3 -10.8 -35.2 -9.7 10.5 -1.8 4.9 -5.8 -6.3 10.7 13.3 15.7
Non-covered products -25.6 -4.6 -16.3 -10.8 -35.2 -9.7 10.5 -1.8 4.9 -5.8 -6.3 10.7 13.3 15.7
All agric. productsa -25.6 -4.6 -16.3 -10.8 -35.2 -9.7 10.5 -1.8 4.9 -5.8 -6.3 10.7 13.3 15.7
Non-product specific assistance (NPS) 0.8 2.8 1.0 0.7 0.4 0.3 0.1 0.2 0.2 0.2 0.6 0.5 0.5 0.9
Total agriculture incl. NPSa,b -24.8 -1.8 -15.3 -10.1 -34.7 -9.4 10.6 -1.6 5.2 -5.6 -5.7 11.2 13.8 16.6
Tradables
All Agriculturea,b -24.8 -1.8 -15.3 -10.1 -34.7 -9.4 10.6 -1.6 5.2 -5.6 -5.7 11.2 13.8 16.6
All Non-Agriculture n.a. n.a. n.a. n.a. n.a. n.a. n.a. n.a. n.a. 5.4 5.4 9.4 9.3 9.3
RRAc n.a. n.a. n.a. n.a. n.a. n.a. n.a. n.a. n.a. -10.4 -10.5 1.6 4.1 6.7
Source: Own calculations using data from OECD, FAOSTAT, UN, Eurostat, and Unctad Trains a NRA including product-specific subsidies; b NRA including other (incl. decoupled & non-product-specific) subsidies; c The RRA is defined as 100*[(100+NRAagt)/(100+NRAnonagt) - 1], where NRAagt and NRAnonagt are the average percentage NRAs for the tradables part of the agricultural and non-agricultural sectors, respectively.

57
Table A8: Nominal rates of assistance to agricultural industries, Czech Republic, 1992-2003
Crop 1992 1993 1994 1995 1996 1997 1998 1999 2000 2001 2002 2003
Exportables
Rape 18.2 -4.4 -26.4 -22.6 -20.0 -20.0 -22.1 -15.6 -6.1 9.5 -3.5 7.9
Eggs 15.1 1.9 16.4 29.0 14.5 34.6 51.1 50.7 35.7 25.8 13.5 3.2 Mixed Trade Status
Milk 46.7 61.3 48.4 39.9 43.8 51.6 98.1 51.6 27.5 30.6 71.4 78.4
Wheat -1.7 15.2 -1.2 -33.9 -25.4 -8.9 4.5 -5.7 -11.2 4.1 -0.9 0.6
Barley 4.1 40.3 15.3 -28.9 -27.8 -10.7 18.1 -17.4 -25.3 -4.8 0.7 -6.7
Sugar 50.5 31.6 1.6 12.8 20.5 5.3 17.4 13.5 17.5 20.9 30.4 57.8
Beef 76.8 32.4 25.9 22.0 23.9 5.9 16.1 26.3 30.9 18.9 26.1 41.4
Pigmeat -12.0 18.2 11.3 3.8 6.4 -12.0 32.3 38.2 16.4 37.3 19.3 17.7
Poultry 49.1 51.3 48.5 35.4 32.7 32.7 53.4 31.0 28.3 35.7 59.1 55.0 Importables 3.1 40.3 16.0 13.1 13.9 5.7 47.6 47.9 26.8 38.5 54.2 55.2
Exportables 32.0 32.0 22.6 1.0 2.9 6.0 29.2 2.7 0.9 8.0 7.4 10.9 Weighted average of above 20.1 32.6 20.2 4.8 6.0 6.0 34.7 23.2 13.5 24.1 29.8 32.7
Standard Deviation 30.6 22.5 24.3 28.5 26.3 25.3 34.8 27.3 21.6 15.2 27.1 30.8
Share of above products in total gross value of agricultural production*
64.8 65.4 66.1 67.5 69.6 72.3 72.3 69.6 72.7 76.8 73.1 74.0
Source: Own calculations using data from OECD, FAOSTAT, UN, Eurostat, and Unctad Trains * Share is calculated in terms of undistorted prices and is simple average

58
Table A9: Nominal rates of assistance to agricultural relative to non-agricultural industries, Czech Republic, 1992-2003
1992 1993 1994 1995 1996 1997 1998 1999 2000 2001 2002 2003
Covered productsa 20.1 32.6 20.2 4.8 6.0 6.0 34.7 23.2 13.5 24.1 29.8 32.7
Non-covered products 20.1 32.6 20.2 4.8 6.0 6.0 34.7 23.2 13.5 24.1 29.8 32.7
All agric. productsa 20.1 32.6 20.2 4.8 6.0 6.0 34.7 23.2 13.5 24.1 29.8 32.7
Non-product specific assistance (NPS) 1.0 1.1 3.4 2.8 2.7 2.8 3.5 3.8 4.0 3.3 3.9 4.9
Total agriculture incl. NPSa,b 21.1 33.8 23.6 7.6 8.7 8.8 38.2 27.0 17.4 27.4 33.7 37.6
Tradables
All Agriculturea,b 21.1 33.8 23.6 7.6 8.7 8.8 38.2 27.0 17.4 27.4 33.7 37.6
All Non-Agriculture n.a. n.a. n.a. n.a. 5.8 5.8 5.8 2.9 2.9 2.9 4.3 4.3
RRAc ─ ─ ─ ─ 2.8 2.8 30.6 23.4 14.1 23.9 28.2 31.9
Source: Own calculations using data from OECD, FAOSTAT, UN, Eurostat, and Unctad Trains a NRA including product-specific subsidies; b NRA including other (incl. decoupled & non-product-specific) subsidies; c The RRA is defined as 100*[(100+NRAagt)/(100+NRAnonagt) - 1], where NRAagt and NRAnonagt are the average percentage NRAs for the tradables part of the agricultural and non-agricultural sectors, respectively.

59
Table A10: Nominal rates of assistance to agricultural industries, Estonia, 1992-2003
Crop 1992 1993 1994 1995 1996 1997 1998 1999 2000 2001 2002 2003 Importables
Wheat 6.5 -5.7 -1.5 1.0 1.3 14.3 42.5 35.3 12.7 10.4 17.4 8.9
Rye 22.4 -13.8 10.2 36.4 20.5 22.3 98.4 60.8 34.1 20.6 -2.5 3.0
Barley -28.3 -6.8 -9.6 16.4 8.7 12.8 70.0 33.0 2.7 1.1 17.9 11.3
Poultry -33.6 6.3 34.2 60.1 59.8 48.0 47.4 28.7 33.7 28.2 68.7 78.3 Mixed Trade Status
Oats -45.9 -38.5 -27.8 -3.7 19.7 50.4 29.5 50.3 21.5 5.9 -13.8 -8.1
Oilseeds 22.4 -2.9 -14.4 15.9 -2.0 -1.1 18.1 35.7 24.7 42.0 30.3 21.7
Milk -41.1 -22.4 -9.7 14.0 29.2 31.3 41.5 -7.4 14.8 7.9 22.8 42.2
Beef -57.1 -29.7 -23.4 -28.9 -22.9 -30.7 -7.8 -20.7 -25.9 15.7 21.1 0.1
Pigmeat -50.2 -22.0 15.0 0.4 -4.6 -12.1 41.9 44.7 26.3 18.0 18.7 20.4
Eggs -40.8 -31.8 -14.5 14.3 10.7 25.7 24.9 53.2 22.8 25.9 10.5 4.6
Importables -31.4 -18.1 -3.0 11.7 10.5 11.4 37.9 40.4 12.2 14.7 21.5 27.4
Exportables -50.8 -26.1 -21.1 -18.1 -2.0 -1.1 23.3 -4.7 24.7 9.6 20.6 13.5 Weighted average of above -39.0 -21.8 -8.1 4.4 10.4 11.3 36.8 8.9 12.5 12.1 21.1 26.2
Standard Deviation 33.8 15.4 19.5 25.3 22.5 26.0 29.1 35.2 18.3 13.5 21.8 26.7
Share of above products in total gross value of agricultural production*
58.9 64.6 54.1 59.1 62.7 63.1 63.3 54.2 61.3 65.3 62.4 59.5
Source: Own calculations using data from OECD, FAOSTAT, UN, Eurostat, and Unctad Trains * Share is calculated in terms of undistorted prices and is simple average

60
Table A11: Nominal rates of assistance to agricultural relative to non-agricultural industries, Estonia, 1992-2003
1992 1993 1994 1995 1996 1997 1998 1999 2000 2001 2002 2003
Covered productsa -39.0 -21.8 -8.1 4.4 10.4 11.3 36.8 8.9 12.5 12.1 21.1 26.2
Non-covered products -39.0 -21.8 -8.1 4.4 10.4 11.3 36.8 8.9 12.5 12.1 21.1 26.2
All agric. productsa -39.0 -21.8 -8.1 4.4 10.4 11.3 36.8 8.9 12.5 12.1 21.1 26.2
Non-product specific assistance (NPS) 1.4 2.2 2.2 3.6 2.5 2.3 3.9 3.6 2.6 1.3 2.2 3.8
Total agriculture incl. NPSa,b -37.7 -19.6 -5.8 8.0 12.9 13.6 40.7 12.5 15.1 13.5 23.3 30.0
Tradables
All Agriculturea,b -37.7 -19.6 -5.8 8.0 12.9 13.6 40.7 12.5 15.1 13.5 23.3 30.0
All Non-Agriculture n.a. n.a. n.a. 0.4 0.4 0.4 0.4 0.4 0.9 0.9 0.8 0.8
RRAc ─ ─ ─ 7.6 12.4 13.1 40.1 12.1 14.1 12.4 22.3 28.9
Source: Own calculations using data from OECD, FAOSTAT, UN, Eurostat, and Unctad Trains a NRA including product-specific subsidies; b NRA including other (incl. decoupled & non-product-specific) subsidies; c The RRA is defined as 100*[(100+NRAagt)/(100+NRAnonagt) - 1], where NRAagt and NRAnonagt are the average percentage NRAs for the tradables part of the agricultural and non-agricultural sectors, respectively.

61
Table A12: Nominal rates of assistance to agricultural industries, Hungary, 1992-2003
Crop 1992 1993 1994 1995 1996 1997 1998 1999 2000 2001 2002 2003
Exportables
Wheat -18.2 13.6 -2.7 -35.1 -4.2 -15.3 -9.4 15.9 12.8 -10.6 9.5 28.5
Maize -3.6 25.0 -2.5 -12.6 -13.4 -25.4 -22.8 -12.0 -1.0 -24.5 -9.2 31.9
Sheep 45.8 -7.2 -11.8 -2.9 6.9 -7.2 17.2 -49.0 -53.3 -52.3 -48.3 -48.3
Pigmeat 17.2 30.2 44.0 29.9 6.3 6.6 46.4 38.5 15.3 37.5 47.4 22.6
Poultry 19.6 28.8 37.3 32.8 33.1 32.4 39.2 28.4 37.5 48.2 60.7 50.9 Mixed Trade Status
Milk 48.1 72.2 75.9 41.8 27.7 57.5 111.3 97.4 55.1 60.1 116.2 113.1
Barley -9.9 27.3 15.4 -31.5 2.6 -10.5 18.9 9.2 -0.9 -2.5 7.1 -14.7
Sunflower -23.7 -36.1 -17.2 -11.1 -6.8 -9.7 -8.7 -1.9 -5.2 1.5 15.3 0.8
Sugar 99.9 84.1 70.0 64.5 74.8 94.1 81.3 128.8 94.6 110.7 232.2 286.7
Beef 45.5 18.1 25.3 14.7 -1.0 -13.5 -6.6 4.5 3.5 6.1 8.1 7.3
Eggs 63.2 52.3 59.3 59.8 33.8 62.8 81.4 95.8 68.3 81.9 26.9 -9.8
Potatoes 23.0 15.5 -6.7 -2.0 16.9 51.9 3.4 9.3 34.8 20.5 82.6 86.2 Importables 23.0 49.9 41.6 21.3 2.6 0.0 3.4 9.3 18.1 50.9 38.4 61.2
Exportables 15.4 21.8 15.3 4.4 6.7 4.8 22.4 25.5 21.9 13.4 34.3 32.2
Weighted average of above 15.8 27.5 23.3 7.3 6.5 4.8 21.4 24.6 21.7 17.2 34.5 33.9
Standard Deviation 38.1 32.3 33.1 33.9 26.0 41.9 43.8 52.1 39.1 47.0 74.0 88.5
Share of above products in total gross value of agricultural production*
74.9 73.3 73.6 71.6 67.2 73.6 71.1 71.4 72.5 78.1 74.8 75.0
Source: Own calculations using data from OECD, FAOSTAT, UN, Eurostat, and Unctad Trains * Share is calculated in terms of undistorted prices and is simple average

62
Table A13: Nominal rates of assistance to agricultural relative to non-agricultural industries, Hungary, 1992-2003
1992 1993 1994 1995 1996 1997 1998 1999 2000 2001 2002 2003
Covered productsa 15.8 27.5 23.3 7.3 6.5 4.8 21.4 24.6 21.7 17.2 34.5 33.9
Non-covered products 15.8 27.5 23.3 7.3 6.5 4.8 21.4 24.6 21.7 17.2 34.5 33.9
All agric. productsa 15.8 27.5 23.3 7.3 6.5 4.8 21.4 24.6 21.7 17.2 34.5 33.9
Non-product specific assistance (NPS) 0.0 0.4 0.4 0.1 0.0 1.7 4.3 8.2 4.3 5.6 10.1 8.9
Total agriculture incl. NPSa,b 15.8 28.0 23.7 7.4 6.6 6.5 25.7 32.8 26.0 22.8 44.6 42.8
Tradables
All Agriculturea,b 15.8 28.0 23.7 7.4 6.6 6.5 25.7 32.8 26.0 22.8 44.6 42.8
All Non-Agriculture 10.1 9.0 9.0 9.0 8.4 4.2 4.2 4.2 4.2 4.2 7.8 7.8
RRAc 5.1 17.4 13.5 -1.5 -1.7 2.3 20.7 27.5 20.9 17.8 34.1 32.5
Source: Own calculations using data from OECD, FAOSTAT, UN, Eurostat, and Unctad Trains a NRA including product-specific subsidies; b NRA including other (incl. decoupled & non-product-specific) subsidies; c The RRA is defined as 100*[(100+NRAagt)/(100+NRAnonagt) - 1], where NRAagt and NRAnonagt are the average percentage NRAs for the tradables part of the agricultural and non-agricultural sectors, respectively.

63
Table A14: Nominal rates of assistance to agricultural industries, Latvia, 1992-2003
Crop 1992 1993 1994 1995 1996 1997 1998 1999 2000 2001 2002 2003
Importables
Barley -30.0 -16.8 -6.0 -21.7 -8.9 -3.0 26.7 29.2 18.6 6.0 8.4 -2.8
Poultry -55.7 24.2 73.8 70.0 49.6 59.4 76.4 87.4 109.0 95.5 152.7 54.7 Mixed Trade Status
Wheat -24.3 -21.8 -10.1 -4.0 0.5 5.1 20.6 20.0 12.1 1.9 -8.8 -5.6
Milk -68.6 -40.1 -20.7 -18.6 -12.6 -6.9 15.3 5.8 -0.4 1.5 9.6 5.8
Rye -5.5 -33.8 -13.5 17.3 15.7 18.3 39.4 71.6 60.1 34.2 -16.1 7.4
Oats -44.5 -38.5 -11.1 -12.2 0.5 40.6 10.8 60.9 64.3 21.3 -15.4 -6.2
Oilseeds 8.8 -14.4 -27.1 -22.2 -22.3 9.6 144.0 25.6 23.1 31.6 4.8 -2.2
Sugar 64.8 77.8 77.8 55.1 58.9 83.4 135.5 126.1 100.9 100.6 109.1 133.6
Beef -78.1 -66.2 -32.4 -25.8 -18.2 -28.3 -13.6 -1.6 -6.2 57.7 36.9 -9.7
Pigmeat -61.3 14.5 79.2 26.6 12.1 5.8 29.6 121.8 78.0 56.7 34.8 36.8
Eggs -44.2 -0.1 22.0 57.7 34.8 50.8 57.1 63.7 50.4 36.3 4.0 -9.7 Importables -43.6 27.3 50.6 25.1 10.8 26.8 62.3 48.4 30.0 37.4 18.2 10.2
Exportables -46.9 -45.7 -21.6 -9.3 -6.8 -2.0 19.8 37.0 48.6 14.3 52.6 46.2 Weighted average of above
-46.0 -25.0 5.2 1.2 3.5 12.4 44.8 46.4 31.2 33.3 32.8 25.7
Standard Deviation 44.2 41.9 44.5 37.6 28.2 34.5 50.8 45.0 42.8 35.3 54.2 44.1
Share of above products in total gross value of agricultural production*
49.8 60.4 63.6 58.5 63.4 62.7 63.8 65.8 67.9 62.8 59.1 57.4
Source: Own calculations using data from OECD, FAOSTAT, UN, Eurostat, and Unctad Trains * Share is calculated in terms of undistorted prices and is simple average

64
Table A15: Nominal rates of assistance to agricultural relative to non-agricultural industries, Latvia, 1992-2003
1992 1993 1994 1995 1996 1997 1998 1999 2000 2001 2002 2003
Covered productsa -46.0 -25.0 5.2 1.2 3.5 12.4 44.8 46.4 31.2 33.3 32.8 25.7 Non-covered products -46.0 -25.0 5.2 1.2 3.5 12.4 44.8 46.4 31.2 33.3 32.8 25.7
All agric. productsa -46.0 -25.0 5.2 1.2 3.5 12.4 44.8 46.4 31.2 33.3 32.8 25.7
Non-product specific assistance (NPS) 0.5 0.6 1.5 2.0 1.7 1.4 3.3 7.7 6.7 6.8 2.2 5.2
Total agriculture incl. NPSa,b -45.5 -24.4 6.8 3.2 5.1 13.8 48.1 54.1 38.0 40.2 35.0 30.9
Tradables
All Agriculturea,b -45.5 -24.4 6.8 3.2 5.1 13.8 48.1 54.1 38.0 40.2 35.0 30.9 All Non-
Agriculture n.a. n.a. n.a. n.a. 2.2 3.0 3.0 3.0 3.0 2.4 2.4 2.4
RRAc ─ ─ ─ ─ 2.9 10.4 43.7 49.6 33.9 36.8 31.8 27.9
Source: Own calculations using data from OECD, FAOSTAT, UN, Eurostat, and Unctad Trains a NRA including product-specific subsidies; b NRA including other (incl. decoupled & non-product-specific) subsidies; c The RRA is defined as 100*[(100+NRAagt)/(100+NRAnonagt) - 1], where NRAagt and NRAnonagt are the average percentage NRAs for the tradables part of the agricultural and non-agricultural sectors, respectively.

65
Table A16: Nominal rates of assistance to agricultural industries, Lithuania, 1992-2003
Crop 1992 1993 1994 1995 1996 1997 1998 1999 2000 2001 2002 2003
Importables
Oats -53.4 -34.5 -39.4 -15.6 28.2 51.3 12.4 35.6 4.4 2.7 -15.2 10.4 Exportables
Milk -74.1 -57.0 -55.0 -35.5 -30.1 -20.2 2.6 -10.9 -27.0 -28.4 -9.0 -0.7
Beef -71.0 -48.1 -31.4 -24.3 -18.2 -15.0 27.8 10.2 -9.6 53.8 37.6 -5.2 Mixed Trade Status
Wheat -30.9 -21.2 -26.6 -5.5 -1.5 -0.6 6.2 35.1 5.5 10.9 25.5 17.5
Rye -8.9 -24.2 -30.5 7.4 8.8 32.8 55.7 102.7 32.4 17.2 -4.9 4.3
Barley -31.4 -2.3 -15.2 -6.7 -3.4 7.3 24.1 25.8 4.6 7.7 30.9 16.5
Oilseeds 72.8 -39.0 -28.5 -9.1 6.8 -8.5 -4.0 -9.2 17.0 19.6 15.6 11.4
Sugar 106.6 73.6 35.3 64.9 73.3 97.2 144.7 190.4 171.8 116.0 148.7 202.6
Pigmeat -46.8 14.4 60.0 39.2 26.8 19.4 59.8 86.5 72.4 51.2 34.8 40.5
Poultry -45.3 18.6 79.0 87.5 73.6 82.4 107.6 111.1 95.8 85.9 92.5 51.8
Eggs -41.8 -18.1 -0.8 22.0 14.0 23.4 17.6 31.3 14.4 10.9 -9.9 -6.1 Importables -2.5 19.5 35.3 24.2 23.8 56.4 97.5 64.3 38.0 33.0 34.4 79.8
Exportables -70.5 -49.6 -26.5 -11.4 -13.9 -6.5 18.7 35.8 17.4 12.6 32.3 3.3
Weighted average of above
-45.9 -21.0 -18.3 0.2 3.4 13.7 41.1 42.0 22.8 17.9 32.8 33.2
Standard Deviation 63.7 38.3 45.9 40.2 35.8 40.4 47.2 62.7 58.9 43.8 49.7 59.7
Share of above products in total gross value of agricultural production*
70.8 64.1 60.7 55.5 63.0 64.2 59.1 59.2 64.1 62.1 65.6 60.2
Source: Own calculations using data from OECD, FAOSTAT, UN, Eurostat, and Unctad Trains * Share is calculated in terms of undistorted prices and is simple average

66
Table A17: Nominal rates of assistance to agricultural relative to non-agricultural industries, Lithuania, 1992-2003
1992 1993 1994 1995 1996 1997 1998 1999 2000 2001 2002 2003
Covered productsa -45.9 -21.0 -18.3 0.2 3.4 13.7 41.1 42.0 22.8 17.9 32.8 33.2
Non-covered products -45.9 -21.0 -18.3 0.2 3.4 13.7 41.1 42.0 22.8 17.9 32.8 33.2
All agric. productsa -45.9 -21.0 -18.3 0.2 3.4 13.7 41.1 42.0 22.8 17.9 32.8 33.2
Non-product specific assistance (NPS) 0.9 1.2 2.9 2.3 2.7 3.3 3.6 4.5 4.4 3.9 4.9 6.1
Total agriculture incl. NPSa,b -45.0 -19.8 -15.5 2.5 6.1 17.0 44.7 46.5 27.3 21.8 37.7 39.3
Tradables
All Agriculturea,b -45.0 -19.8 -15.5 2.5 6.1 17.0 44.7 46.5 27.3 21.8 37.7 39.3
All Non-Agriculture n.a. n.a. n.a. 2.7 2.7 2.3 2.3 2.3 2.3 2.3 0.6 0.6
RRAc ─ ─ ─ -0.2 3.3 14.3 41.4 43.2 24.4 19.1 36.9 38.5
Source: Own calculations using data from OECD, FAOSTAT, UN, Eurostat, and Unctad Trains a NRA including product-specific subsidies; b NRA including other (incl. decoupled & non-product-specific) subsidies; c The RRA is defined as 100*[(100+NRAagt)/(100+NRAnonagt) - 1], where NRAagt and NRAnonagt are the average percentage NRAs for the tradables part of the agricultural and non-agricultural sectors, respectively.

67
Table A18: Nominal rates of assistance to agricultural industries, Poland, 1992-2003
Crop 1992 1993 1994 1995 1996 1997 1998 1999 2000 2001 2002 2003
Importables
Maize 40.2 33.4 29.2 24.5 23.4 27.7 30.1 0.4 -3.8 7.2 13.4 8.9 Mixed Trade Status
Wheat 10.0 23.0 11.3 9.0 27.9 22.2 30.2 15.4 22.6 18.8 15.4 5.8
Milk 17.0 19.1 5.2 17.7 23.4 34.0 51.8 38.6 34.5 34.6 36.3 28.1
Other grains 2.7 26.5 9.2 5.5 25.9 24.7 22.7 24.5 28.9 6.3 4.7 14.5
Oilseeds 16.1 23.3 38.4 11.6 25.4 9.2 14.7 10.7 26.4 11.5 7.3 16.8
Sugar 26.1 14.1 18.4 19.6 35.4 28.7 42.0 43.1 62.9 40.1 48.8 52.2
Beef 15.4 5.4 16.2 12.6 45.6 28.7 19.0 -12.0 -33.5 -29.7 -38.6 -43.7
Sheep 9.6 4.0 21.8 19.4 10.9 11.3 9.2 -52.2 -47.6 -11.7 -11.9 -1.2
Pigmeat -31.7 -6.7 8.9 -11.7 -15.7 -14.4 12.5 18.3 -18.1 -13.7 -19.8 -29.4
Poultry 59.3 32.9 65.6 48.1 54.2 32.4 40.7 29.8 11.9 9.2 10.1 1.6
Eggs 72.8 63.7 92.3 93.8 68.2 58.9 109.1 98.2 55.5 18.3 6.5 -13.9 Importables 23.4 11.9 15.5 19.5 35.4 28.1 43.4 38.3 31.5 22.9 6.1 23.8
Exportables -24.2 0.0 20.2 -6.8 4.1 7.2 17.0 15.3 -12.0 -8.8 4.4 -18.8 Weighted average of NRA of above
-3.9 11.9 16.1 8.1 15.6 14.3 29.8 24.6 10.8 8.0 4.7 -3.3
Standard Deviation 38.9 21.3 30.3 31.6 26.5 20.8 28.6 37.6 35.2 20.6 24.3 27.3
Share of above products in total gross value of agricultural production*
70.0 59.0 60.1 55.3 61.7 63.8 65.2 61.9 53.6 55.7 55.7 54.5
Source: Own calculations using data from OECD, FAOSTAT, UN, Eurostat, and Unctad Trains * Share is calculated in terms of undistorted prices and is simple average

68
Table A19: Nominal rates of assistance to agricultural relative to non-agricultural industries, Poland, 1992-2003
1992 1993 1994 1995 1996 1997 1998 1999 2000 2001 2002 2003
Covered productsa -3.9 11.9 16.1 8.1 15.6 14.3 29.8 24.6 10.8 8.0 4.7 -3.3
Non-covered products -3.9 11.9 16.1 8.1 15.6 14.3 29.8 24.6 10.8 8.0 4.7 -3.3
All agric. productsa -3.9 11.9 16.1 8.1 15.6 14.3 29.8 24.6 10.8 8.0 4.7 -3.3
Non-product specific assistance (NPS) 2.1 2.3 2.3 1.1 1.8 3.7 4.3 2.3 1.9 1.5 2.8 1.7
Total agriculture incl. NPSa,b -1.7 14.3 18.5 9.2 17.4 18.0 34.2 26.8 12.7 9.5 7.4 -1.6
Tradables
All Agriculturea,b -1.7 14.3 18.5 9.2 17.4 18.0 34.2 26.8 12.7 9.5 7.4 -1.6
All Non-Agriculture 9.8 9.8 9.8 6.3 8.3 6.9 5.4 3.2 2.8 2.3 3.0 2.0
RRAc -10.5 4.1 7.9 2.8 8.5 10.4 27.3 22.9 9.6 7.1 4.3 -3.5
Source: Own calculations using data from OECD, FAOSTAT, UN, Eurostat, and Unctad Trains a NRA including product-specific subsidies; b NRA including other (incl. decoupled & non-product-specific) subsidies; c The RRA is defined as 100*[(100+NRAagt)/(100+NRAnonagt) - 1], where NRAagt and NRAnonagt are the average percentage NRAs for the tradables part of the agricultural and non-agricultural sectors, respectively.

69
Table A20: Nominal rates of assistance to agricultural industries, Romania, 1992-2005 Crop 1992 1993 1994 1995 1996 1997 1998 1999 2000 2001 2002 2003 2004 2005
Importables
Milk -8.4 34.6 65.2 61.7 67.6 62.7 146.6 75.1 78.5 94.3 87.8 126.4 142.6 169.3
Sugar 130.8 171.7 159.8 100.4 124.8 113.3 126.9 180.6 140.7 90.0 173.3 227.7 292.9 308.8
Poultry 37.1 22.1 57.4 40.3 31.4 32.7 100.9 55.9 45.4 129.6 192.0 146.4 167.0 50.9 Exportables
Rape -30.6 15.9 -39.5 -45.0 -45.0 -52.0 -36.3 -19.1 -4.3 -3.6 3.3 4.5 -2.3 15.6 Mixed Trade Status
Wheat 33.4 49.4 56.1 -1.9 23.2 -4.2 15.8 26.4 48.2 54.2 17.5 60.6 36.5 22.2
Maize 15.0 66.8 14.8 -8.1 1.9 5.6 8.4 17.5 23.0 67.8 7.2 74.9 78.8 28.4
Barley -11.3 100.1 50.3 -10.0 19.9 -4.0 24.0 16.2 13.9 35.9 16.3 73.2 60.0 32.9
Soybean 24.4 89.0 45.0 20.3 21.6 0.4 -14.9 -8.8 -4.0 27.5 19.3 -6.6 -2.0 -3.8
Oats -23.9 21.4 -4.9 -1.4 13.7 25.1 49.3 56.0 101.7 124.0 12.7 124.4 67.8 59.9
Sunflower -15.0 -5.4 -12.3 -15.7 -5.2 -22.0 -19.7 -21.5 -1.5 -16.0 -22.7 -28.6 -4.6 2.7
Beef 33.1 -15.5 -27.9 -25.9 -31.7 -34.6 51.7 -2.6 -15.7 84.2 92.8 37.4 7.1 46.8
Pigmeat -1.3 18.7 29.1 21.1 10.5 -26.2 53.9 26.5 4.3 54.5 64.1 11.1 39.7 70.3
Eggs 6.9 30.1 47.4 71.0 39.7 61.8 111.8 86.9 17.3 73.7 46.1 21.8 101.0 138.3 Importables 12.4 52.0 44.2 32.3 35.6 28.1 90.2 50.2 37.6 73.9 85.3 70.2 71.2 69.8
Exportables 7.2 9.2 4.2 1.8 7.5 -4.4 4.9 12.2 16.9 7.7 5.8 -28.5 62.2 22.2
Weighted average of above
10.0 33.8 29.8 13.7 18.3 4.4 56.2 33.1 33.3 68.7 50.1 61.8 68.0 56.5
Standard Deviation 41.8 52.1 51.6 42.1 42.7 46.8 59.6 55.4 47.1 44.5 66.2 73.0 85.6 88.6
Share of above products in total gross value of agricultural production*
63.0 57.7 55.5 57.2 59.1 61.7 59.8 54.9 54.3 65.0 58.4 55.1 55.3 48.5
Source: Own calculations using data from OECD, FAOSTAT, UN, Eurostat, and Unctad Trains * Share is calculated in terms of undistorted prices and is simple average

70
Table A21: Nominal rates of assistance to agricultural relative to non-agricultural industries, Romania, 1992-2005
1992 1993 1994 1995 1996 1997 1998 1999 2000 2001 2002 2003 2004 2005
Covered products 10.0 33.8 29.8 13.7 18.3 4.4 56.2 33.1 33.3 68.7 50.1 61.8 68.0 56.5
Non-covered products 10.0 33.8 29.8 13.7 18.3 4.4 56.2 33.1 33.3 68.7 50.1 61.8 68.0 56.5
All agric. productsa 10.0 33.8 29.8 13.7 18.3 4.4 56.2 33.1 33.3 68.7 50.1 61.8 68.0 56.5
Non-product specific assistance (NPS) 1.8 2.1 2.1 2.7 1.6 1.5 3.1 2.1 2.3 1.3 1.0 0.9 3.9 1.8
Total agriculture incl. NPSa,b 11.8 35.8 31.8 16.4 19.9 5.9 59.3 35.2 35.7 69.9 51.2 62.7 71.9 58.3
Tradables
All Agriculturea,b 11.8 35.8 31.8 16.4 19.9 5.9 59.3 35.2 35.7 69.9 51.2 62.7 71.9 58.3
All Non-Agriculture 11.2 11.2 11.2 11.2 11.2 11.2 11.2 7.6 7.6 7.9 7.9 7.9 3.0 2.7
RRAc 0.5 22.2 18.6 4.7 7.9 -4.7 43.3 25.7 26.1 57.4 40.0 50.7 66.9 54.2
Source: Own calculations using data from OECD, FAOSTAT, UN, Eurostat, and Unctad Trains a NRA including product-specific subsidies; b NRA including other (incl. decoupled & non-product-specific) subsidies; c The RRA is defined as 100*[(100+NRAagt)/(100+NRAnonagt) - 1], where NRAagt and NRAnonagt are the average percentage NRAs for the tradables part of the agricultural and non-agricultural sectors, respectively.

71
Table A22: Nominal rates of assistance to agricultural industries, Slovakia, 1992-2003
Crop 1992 1993 1994 1995 1996 1997 1998 1999 2000 2001 2002 2003
Importables
Pigmeat -1.0 15.4 23.4 20.4 9.8 14.3 50.4 71.2 43.6 36.1 44.7 40.8
Sugar 72.3 44.2 24.5 18.5 25.4 36.1 52.9 43.5 55.2 25.9 23.7 51.7
Poultry 59.1 62.3 50.2 52.7 47.8 42.5 57.9 33.6 46.6 44.0 57.4 58.9 Exportables
Maize 42.1 32.0 12.8 9.1 -4.8 5.6 -3.7 -11.2 3.5 -8.8 -18.2 -1.0
Milk 48.2 69.6 47.7 34.0 31.3 57.0 94.7 66.6 44.5 35.1 69.1 79.2
Barley 5.2 56.8 41.1 -5.1 -20.2 3.0 47.4 4.0 -3.5 -7.7 22.1 -1.5
Sunflower 11.1 -6.6 -21.2 -0.6 -0.7 1.8 -13.6 -5.8 23.7 -15.3 -14.1 3.8 Mixed Trade Status
Wheat 5.2 24.5 17.1 -17.9 -25.2 -6.8 18.2 7.2 11.2 -3.9 -1.8 0.5
Rye 13.9 10.8 31.8 29.3 1.1 20.9 61.7 50.5 60.5 22.0 -10.9 16.4
Rape 16.8 -4.4 -27.1 -4.7 -11.6 -12.4 -17.4 3.0 11.8 -7.5 -11.5 -8.5
Oats -19.0 -2.5 5.4 6.3 1.8 63.4 44.5 34.9 46.8 22.7 -5.5 9.5
Beef 72.2 12.4 13.5 15.2 6.3 4.1 -0.4 2.8 9.2 9.5 2.1 16.7
Eggs 35.0 28.0 26.8 37.2 16.9 36.4 49.6 45.6 42.3 23.1 19.5 13.1 Importables 24.6 23.2 20.7 20.2 14.1 17.1 39.7 43.5 31.9 20.3 34.0 29.5
Exportables 23.9 40.9 29.6 6.8 -3.2 14.6 36.1 21.4 28.4 11.6 17.6 30.3
Weighted average of above 24.3 30.8 24.8 12.7 3.8 15.7 37.9 31.5 30.6 16.8 24.2 29.9
Standard Deviation 29.4 26.0 24.2 20.0 20.7 24.9 34.3 28.5 21.7 20.4 30.8 28.7
Share of above products in total gross value of agricultural production*
76.2 78.0 75.1 72.9 72.2 76.0 76.3 75.1 74.1 77.6 76.5 71.5
Source: Own calculations using data from OECD, FAOSTAT, UN, Eurostat, and Unctad Trains * Share is calculated in terms of undistorted prices and is simple average

72
Table A23: Nominal rates of assistance to agricultural relative to non-agricultural industries, Slovakia, 1992-2003
1992 1993 1994 1995 1996 1997 1998 1999 2000 2001 2002 2003
Covered products 24.3 30.8 24.8 12.7 3.8 15.7 37.9 31.5 30.6 16.8 24.2 29.9
Non-covered products 24.3 30.8 24.8 12.7 3.8 15.7 37.9 31.5 30.6 16.8 24.2 29.9
All agric. productsa 24.3 30.8 24.8 12.7 3.8 15.7 37.9 31.5 30.6 16.8 24.2 29.9
Non-product specific assistance (NPS) 5.8 4.5 4.7 4.1 3.2 3.4 4.7 4.8 4.5 3.3 5.5 5.2
Total agriculture incl. NPSa,b 30.1 35.3 29.5 16.8 6.9 19.1 42.6 36.3 35.0 20.1 29.7 35.1
Tradables
All Agriculturea,b 30.1 35.3 29.5 16.8 6.9 19.1 42.6 36.3 35.0 20.1 29.7 35.1
All Non-Agriculture n.a. n.a. n.a. n.a. n.a. n.a. n.a. n.a. n.a. n.a. 21.3 21.3
RRAc ─ ─ ─ ─ ─ ─ ─ ─ ─ ─ 6.9 11.3
Source: Own calculations using data from OECD, FAOSTAT, UN, Eurostat, and Unctad Trains a NRA including product-specific subsidies; b NRA including other (incl. decoupled & non-product-specific) subsidies; c The RRA is defined as 100*[(100+NRAagt)/(100+NRAnonagt) - 1], where NRAagt and NRAnonagt are the average percentage NRAs for the tradables part of the agricultural and non-agricultural sectors, respectively.

73
Table A24: Nominal rates of assistance to agricultural industries, Slovenia, 1992-2003
Crop 1992 1993 1994 1995 1996 1997 1998 1999 2000 2001 2002 2003
Importables
Pigmeat 22.8 42.1 40.6 37.7 19.5 24.7 56.4 82.1 42.5 33.3 33.4 38.0
Wheat 90.9 90.6 82.2 48.7 37.7 44.4 94.5 107.2 94.7 71.8 81.4 77.3
Sugar 125.9 135.8 84.2 75.1 75.7 78.9 110.7 156.4 83.0 74.3 87.2 139.2
Maize 53.8 41.3 22.5 10.5 11.2 -3.6 3.6 13.0 32.2 23.9 2.7 47.6
Barley 80.9 116.2 84.8 30.6 31.1 55.7 75.1 58.1 61.8 93.3 107.4 78.5
Sheep 192.9 105.2 97.8 242.9 138.2 116.8 150.6 121.7 80.5 82.6 72.2 80.7
Exportables
Milk 101.1 102.3 108.3 91.5 77.0 101.6 168.6 141.6 85.0 79.0 107.9 116.8
Poultry 109.9 92.9 95.3 110.4 87.1 71.4 73.7 90.7 69.3 61.0 74.4 81.7 Mixed Trade Status
Beef 61.7 33.7 40.8 68.2 62.5 97.4 112.0 114.6 109.7 143.7 151.6 147.4
Eggs 46.8 22.9 24.8 60.2 42.3 41.5 65.5 64.9 27.0 9.8 28.5 0.3 Importables 37.4 50.8 42.5 46.3 34.6 22.9 52.6 66.1 61.3 35.3 32.9 47.4
Exportables 83.4 61.0 90.0 92.3 73.9 87.3 123.9 121.8 80.6 90.6 111.4 104.7
Weighted average of above 64.3 57.0 58.3 62.2 48.0 58.5 89.3 97.7 69.1 64.5 73.0 82.4
Standard Deviation 54.7 45.5 34.0 67.1 39.6 37.8 47.7 42.7 27.4 38.6 43.9 45.5
Share of above products in total gross value of agricultural production*
62.1 59.8 55.8 59.1 56.3 55.9 58.5 59.1 58.9 61.5 56.0 58.9
Source: Own calculations using data from OECD, FAOSTAT, UN, Eurostat, and Unctad Trains * Share is calculated in terms of undistorted prices and is simple average

74
Table A25: Nominal rates of assistance to agricultural relative to non-agricultural industries, Slovenia, 1992-2003
1992 1993 1994 1995 1996 1997 1998 1999 2000 2001 2002 2003
Covered products 64.3 57.0 58.3 62.2 48.0 58.5 89.3 97.7 69.1 64.5 73.0 82.4
Non-covered products 64.3 57.0 58.3 62.2 48.0 58.5 89.3 97.7 69.1 64.5 73.0 82.4
All agric. productsa 64.3 57.0 58.3 62.2 48.0 58.5 89.3 97.7 69.1 64.5 73.0 82.4
Non-product specific assistance (NPS) 3.4 3.1 3.0 3.3 2.9 4.6 6.1 7.9 7.4 6.7 6.5 9.7
Total agriculture incl. NPSa,b 67.7 60.1 61.3 65.5 50.9 63.1 95.4 105.6 76.5 71.2 79.5 92.0
Tradables
All Agriculturea,b 67.7 60.1 61.3 65.5 50.9 63.1 95.4 105.6 76.5 71.2 79.5 92.0
All Non-Agriculture n.a. n.a. n.a. n.a. n.a. n.a. n.a. 11.5 11.5 10.1 1.5 1.5
RRAc ─ ─ ─ ─ ─ ─ ─ 84.4 58.3 55.6 76.9 89.1
Source: Own calculations using data from OECD, FAOSTAT, UN, Eurostat, and Unctad Trains a NRA including product-specific subsidies; b NRA including other (incl. decoupled & non-product-specific) subsidies; c The RRA is defined as 100*[(100+NRAagt)/(100+NRAnonagt) - 1], where NRAagt and NRAnonagt are the average percentage NRAs for the tradables part of the agricultural and non-agricultural sectors, respectively.

75
Table A26: The development of trade and price policies among CEECs, 1990 to 1996 Instrument Country Commodity Date Import tariffs All All 1990 Nontariff barriers (NTBs)
Removal or substantial reduction of import and export NTBs1
Poland Hungary Bulgaria Romania Czechoslovakia
Most Most Most Most Most
1990 1991 1991 1991 1991
Reintroduction of import NTBs
Poland Bulgaria Czechoslovakia Hungary
Most including processed food, fruit juice, dairy products Most agrofood products and some inputs Temperate zone agricultural products Grains, sugar
1992 1992 1992 1992
Reintroduction of export NTBs2
Czech R. Poland Bulgaria Romania Hungary
Important food commodities Grains, oilseeds, poultry, bovine animals Grains, flour, seeds, livestock, sunflower oil Grains, flour, sugar, milk, animals Milling wheat, meat, sugar
1993 1992 1992 1992 1992
Appearance of variable import levies3
Czechoslovakia Poland
Oilseeds, sugar prod., wine, live animals, beef, poultry, butter, starches Meat, milk products, cereals, eggs, etc.
19924
19944
Credit programs All Working capital, capital investment, processing and storage, loan guarantees
1990-1996
Minimum and guaranteed prices via purchases and market price support
Visegrad-4 Bulgaria Romania
Various commodities
1991 1992 1993
Export subsidies Poland Czech R. Hungary Slovak R.
Mainly milk, sugar pork, wheat; others ad hoc
1990-1996
Production quotas Poland Slovak R. Hungary
Sugar Milk Milk
1994 1994 1996
Notes: 1 Includes various combinations of import and export licensing and fees, import quotas, global quotas, monopolized importing agencies, exchange rate manipulation, etc.
2 Primarily permits and fees but also licenses, taxes, quotas, and, in extreme situations, export prohibitions
3 Variable import levies or similarly named mechanisms which bridge the difference between some predetermined threshold price and the lower international price for a commodity
4 Variable import levies have been abolished and tariffs increased for affected products in 1995 under these countries’ Uruguay Round GATT commitments
Source: Hartell and Swinnen (2001).

76
Table A27: Summary of policy instrument developments in selected CEECs, 1998-1999
Country Market and Price Support Domestic Support Credit Programmes Bulgaria • Import duties, tariffs and tariff rate quotas
• Export constraints liberalized • Price intervention abolished • Intervention purchases of grains for market stabilization • Temporary import ban on vegetables; ban on meat cuts for processing as a public health measure
• Direct payments (financial support and investment stimulation under numerous programs) • Grain storage support • Temporary discount on freight costs for grains
• Preferential credit for production and harvest of wheat, maize, sunflower and sugar • Interest subsidies on loans
Estonia • Effectively none • Limited export marketing credits • Removed system of import quotas for grain • Food import licenses fee increased • Announced: customs tariffs to be introduced in 2000; policy reforms planed to bring farm policy in line with the EU
• Direct payments: dairy cow and arable crops; allowances for hardship • Subsidies: capital investments, fuel tax and liming • Subsidized premiums for new crop insurance program
• Long term interest rate credits and loan guarantees
Czech Republic • Import tariffs and tariff rate quotas • Price regulation: intervention and guaranteed prices subject to quota for wheat and planned for pork; minimum prices for milk • Export subsidies: direct for milk; export credit subsidies for pork purchased at min. price and some other commodities ad hoc • Nonautomatic export licensing: major commodities incl. wheat, oilseeds, isoglucos; export quota: rapeseed • Contingency import protection introduced, includes:
- additional duties effective for one year - import quotas for up to four years - minimum import prices
• Planned: sugar production quotas and minimum guaranteed prices
• Direct payments: area and headage payments (beef cattle, sheep, suckler cows) in LFAs; support for organic farming; and ‘highland’ countryside support • Cattle herd maintenance and revitalization subsidy for most areas starting in 2000
• Credit subsidies and loan guarantees for both working capital and investment

77
Table A27: Continued
Country Market and Price Support Domestic Support Credit Programmes Hungary • Import tariffs and tariff rate quotas
• Guidance price system with intervention: milk, beef, pigmeat with subsidies to processors • Minimum guaranteed prices with some state purchasing: wheat and maize • Deficiency payments for those not receiving orientation prices • Export subsidies: milk, pigmeat, poultry, wine • Target price with import surcharge: sugar • Retaliatory duties on imported Polish food products
• Direct payments: area payments for LFAs • Quality payments for pigmeat • Wage subsidies for promotion of agricultural employment • Fuel tax subsidies • Various production subsidies
• Interest rate subsidies • Capital investment grants • Interest relief for land purchases
Poland • Import tariffs and tariff rate quotas • Intervention purchases (some with min. prices): wheat, rye, milk, pork; ad hoc intervention purchases and selling for others • Price support, production quotas and export subsidies: sugar; gradual introduction for tobacco, hops, fruit, vegetables. Plans to introduce quotas in milk and grains sectors in 2000 • Threshold system for import quantity or price triggering additional import levies: most crops and livestock • Ad hoc (temporary) import levies: wheat, maize, sugar, pork
• Subsidies for productivity enhancing inputs and field liming • Direct aid based on output to grain producers • Rural development action planned:
- traditional forms of support - support for organic farming - improved access to credit - restructuring and enlargement of
farms - export support program
• Subsidies on loans for inputs
Slovak Republic • Import tariffs and tariff rate quotas • Administered prices and quota: milk • Minimum prices: sugar • Intervention prices: wheat, maize, slaughter bulls; ad hoc interventions in other commodities • Export subsidies: milk, sugar, malt, tobacco, others ad hoc • Nonautomatic import licenses: wheat • Nonautomatic export licenses: wheat, barely, maize • Import ban: Czech potatoes; import quotas: Czech pigmeat, sugar, beer • Import surcharge until 2001 on most imports
• Direct payments: area payments for LFAs • Various input subsidies • Dairy cow subsidies for:
- breeding stock and breeding activities
- construction of buildings for cattle
• Interest subsidies, guaranteed loans and payment of interest • Operational credit

78
Table A27: Continued
Country Market and Price Support Domestic Support Credit Programmes Slovenia • Tariffs and tariff rate quotas
• Fixed prices: wheat and sugar • Price regulation: milk • Intermittent intervention purchases: pigmeat, wine • Temporary special import levy: wheat • Policy reform proposed: align market systems with the EU and include area payments for environmentally friendly farming, subsidies for sustainable farming, special subsidies for LFAs
• Direct payments: (headage payments for cow and sheep in LFAs) • Area payments for wheat (1999) • Input subsidies • Export promotion
• Credit subsidies for working capital and investments
Romania • Import tariffs and tariff rate quotas; additional duties ad hoc • Import licensing only under preferential tariff quotas • Export licenses only under EU preferential tariff quotas • Export subsidy with quota: wheat, maize, pigmeat, poultry
• Voucher system for input purchases, since 1997 • Premia paid for wheat • Subsidized seed purchases for arable crop producers
• Subsidized interest: short-term for current production, medium-term for investment, machinery • Credits for purchase of live animals
Source: Hartell and Swinnen (2001).
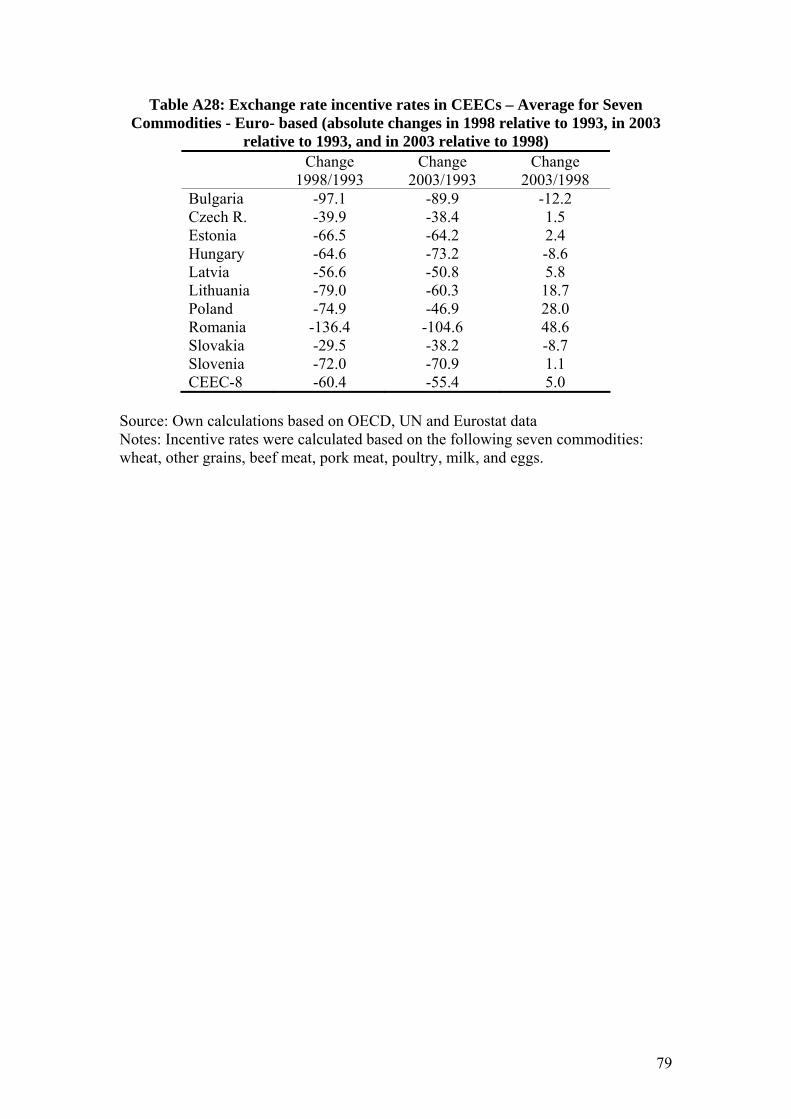
79
Table A28: Exchange rate incentive rates in CEECs – Average for Seven Commodities - Euro- based (absolute changes in 1998 relative to 1993, in 2003
relative to 1993, and in 2003 relative to 1998)
Change
1998/1993 Change
2003/1993 Change
2003/1998 Bulgaria -97.1 -89.9 -12.2 Czech R. -39.9 -38.4 1.5 Estonia -66.5 -64.2 2.4 Hungary -64.6 -73.2 -8.6 Latvia -56.6 -50.8 5.8 Lithuania -79.0 -60.3 18.7 Poland -74.9 -46.9 28.0 Romania -136.4 -104.6 48.6 Slovakia -29.5 -38.2 -8.7 Slovenia -72.0 -70.9 1.1 CEEC-8 -60.4 -55.4 5.0
Source: Own calculations based on OECD, UN and Eurostat data Notes: Incentive rates were calculated based on the following seven commodities: wheat, other grains, beef meat, pork meat, poultry, milk, and eggs.

80
Table A29: MFN and preferential tariffs CEFTA Baltics
Yea
r
MFN
EU
EFT
A
Bul
gari
a
Cze
ch R
.
Hun
gary
Pola
nd
Rom
ania
Slov
akia
Slov
enia
Cro
atia
Est
onia
Lith
uani
a
Lat
via
Mac
edon
ia
Tur
key
LD
C
Bulgaria all products 2002 11.5 4.0 4.3 X 2.5 2.6 2.5 2.6 2.5 2.6 4.4 4.9 4.8 4.9 5.0 4.9
Agriculture 2002 22.4 17.5 20.9 X 12.2 12.8 12.1 12.7 12.0 12.7 13.1 22.1 22.1 22.1 22.0 22.1
non-agriculture 2002 8.7 0.5 0.0 X 0.0 0.0 0.0 0.0 0.0 0.0 2.1 0.4 0.4 0.5 0.6 0.5
Hungary all products 1997 14.3 9.4 9.3 4.7 X 4.4 6.0 4.7
Agriculture 1997 37.1 37.1 36.3 18.9 X 17.6 21.1 18.9
industrial 1997 8.2 2.0 2.0 0.9 X 0.9 1.9 0.9
Slovakia all products 2001 6.1 2.4 2.5 2.1 0.0 2.1 1.9 2.1 X 2.1 2.5 2.3 2.3 2.6 0
Agriculture 2001 11.8 10.8 11.1 9.4 0.0 9.2 8.4 9.5 X 9.3 11.0 10.2 10.2 11.8 0
industrial 2001 4.4 0.0 0.0 0.0 0.0 0.0 0.0 0.0 X 0.0 0.0 0.0 0.0 0.0 0
Romania all products 2005 17.5 4.8 5.2 3.5 X 6 6.0
Agriculture 2005 27.9 21.3 25.2 17.2 X 25.6 25.2
non-agriculture 2005 14.8 0.5 0.0 0.0 X 1.0 1.0
Poland all products 1999 15.9 6.5 7.0 3.8 4.9 X 6.0 9.9
Agriculture 1999 17.0 15.3 13.2 3.1 5.5 X 4.2 6.1
Manufactures 1999 16.1 5.9 6.7 3.9 4.9 X 6.2 10.3
Czech R. all products 2001 6.1 2.3 2.4 2.1 X 2.0 1.9 2.1 0.0 2.0 2.4 2.2 2.2 2.5 0
Agriculture 2001 12.0 11.0 11.3 9.8 X 9.6 8.7 9.9 0 9.6 11.3 10.4 10.4 12 0 industrial 2001 4.5 0 0 0 X 0 0 0 0 0 0 0 0 0 0
Source: WTO

81
Figure A1: Black market foreign exchange rate premia in Hungary, Poland, and Romania, 1986 to 1999
(percent)
0
100
200
300
400
500
600
1986-87 1989-90 1996-97 1998-99
Bla
ck M
arke
t Pre
miu
m (%
) .
Romania Poland Hungary
Source: Levine and Renelt; World Currency Yearbook (for 1985, 1990-93); WB Discussion paper no. 35. 1988; Global Development Finance; World Development Indicators (for 1996-1997, calculated as: parallel Xrate/official Xrate-1)*100.