Embed Size (px)
Citation preview

lable at ScienceDirect
Atmospheric Environment 167 (2017) 476e486
Contents lists avai
Atmospheric Environment
journal homepage: www.elsevier .com/locate/atmosenv
Distinguishing the roles of meteorology, emission control measures,regional transport, and co-benefits of reduced aerosol feedbacks in“APEC Blue”
Meng Gao a, *, 1, Zirui Liu b, Yuesi Wang b, **, Xiao Lu c, Dongsheng Ji b, Lili Wang b,Meng Li d, Zifa Wang b, Qiang Zhang d, Gregory R. Carmichael a, ***
a Center for Global and Regional Environmental Research, The University of Iowa, Iowa City, IA 52242, USAb State Key Laboratory of Atmospheric Boundary Layer Physics and Atmospheric Chemistry (LAPC), Institute of Atmospheric Physics, Chinese Academy ofSciences, Beijing 100029, Chinac Laboratory for Climate and OceaneAtmosphere Sciences, Department of Atmospheric and Oceanic Sciences, School of Physics, Peking University, Beijing100871, Chinad Ministry of Education Key Laboratory for Earth System Modeling, Department of Earth System Science, Tsinghua University, Beijing 100084, China
h i g h l i g h t s
� Meteorological and air quality variables are reproduced well by our WRF-Chem simulations during APEC.� Meteorological conditions were relatively favorable for pleasant air quality during air quality, and synectic control were also important.� Co-benefits of reduced aerosol feedbacks account for about 10.9% of the total decreases in PM2.5 concentrations in urban Beijing.
a r t i c l e i n f o
Article history:Received 3 June 2017Received in revised form6 August 2017Accepted 22 August 2017Available online 26 August 2017
Keywords:APEC BlueEmission controlsMeteorology conditionsAerosol feedbacksBC absorption
* Corresponding author.** Corresponding author.*** Corresponding author.
E-mail addresses: [email protected] (M.(Y. Wang), [email protected] (G.R. Ca
1 Now at: John A. Paulson School of Engineering aUniversity, Cambridge, MA 02138, United States.
http://dx.doi.org/10.1016/j.atmosenv.2017.08.0541352-2310/© 2017 Elsevier Ltd. All rights reserved.
a b s t r a c t
Air quality are strongly influenced by both emissions and meteorological conditions. During the AsiaPacific Economic Cooperation (APEC) week (November 5e11, 2014), the Chinese government imple-mented unprecedented strict emission control measures in Beijing and surrounding provinces, and thena phenomenon referred to as “APEC Blue” (rare blue sky) occurred. It is challenging to quantify theeffectiveness of the implemented strict control measures solely based on observations. In this study, weuse the WRF-Chem model to distinguish the roles of meteorology, emission control measures, regionaltransport, and co-benefits of reduced aerosol feedbacks during APEC week. In general, meteorologicalvariables, PM2.5 concentrations and PM2.5 chemical compositions are well reproduced in Beijing. Positiveweather conditions (lower temperature, lower relative humidity, higher wind speeds and enhancedboundary layer heights) play important roles in “APEC Blue”. Applying strict emission control measuresin Beijing and five surrounding provinces can only explain an average decrease of 17.7 mg/m3 (�21.8%)decreases in PM2.5 concentrations, roughly more than half of which is caused by emission controls thatimplemented in the five surrounding provinces (12.5 mg/m3). During the APEC week, non-local emissionscontributed to 41.3% to PM2.5 concentrations in Beijing, and the effectiveness of implementing emissioncontrol measures hinges on dominant pathways and transport speeds. Besides, we also quantified thecontribution of reduced aerosol feedbacks due to strict emission control measures in this study. Duringdaytime, co-benefits of reduced aerosol feedbacks account for about 10.9% of the total decreases in PM2.5
concentrations in urban Beijing. The separation of contributions from aerosol absorption and scatteringrestates the importance of controlling BC to accelerate the effectiveness of aerosol pollution control.
© 2017 Elsevier Ltd. All rights reserved.
Gao), [email protected]).nd Applied Sciences, Harvard
1. Introduction
In the past decade, severe haze pollution events, characterizedby high PM2.5 (aerosols with diameter less than or equal to 2.5 mm)

M. Gao et al. / Atmospheric Environment 167 (2017) 476e486 477
concentrations, have been frequently reported in city clusters (e.g.,Beijing-Tianjin-Hebei (BTH), Yangtze River Delta (YRD), and PearlRiver Delta (PRD) clusters) in China. These haze events havebecome critical concerns due to their adverse influences on visi-bility, public health, and climate. Haze in Beijing and surroundingNorth China Plain (NCP) cities have attracted more attentionbecause of unprecedentedly high PM2.5 concentrations duringevents, especially in winter (Cheng et al., 2016; Gao et al., 2016a).Beijing is located at the northern tip of the NCP, with Taihangmountains range to the west, Yanshan mountains range to thenorth, and plains to the east and south. Such topography is notfavorable for diffusion of air pollutants associated with southerlyand/or easterly winds.
The contribution of regional transport to PM2.5 concentrationsin Beijing has been a controversial topic (Guo et al., 2014; Li et al.,2015a,b) and has been studied using multiple observations fromdifferent platforms and various chemical transport models (Gaoet al., 2016a; Hua et al., 2016; Wang et al., 2014c). Guo et al.(2014) concluded that local aerosol nucleation and growth domi-nates over the insignificant role of regional transport, while otherstudies (Gao et al., 2016a; Hua et al., 2016; Li et al., 2015a,b; Wanget al., 2014c) emphasized that regional transport made a significantcontribution to PM2.5 concentrations in Beijing. These discussionsare of great importance for implementation of air quality controlmeasures during special events in Beijing, such as the 2014 Asia-Pacific Economic Cooperation (APEC) Economic Leaders' Weekand the 2015 China Victory Day Parade.
On November 5e11, Beijing, China hosted the 2014 APECmeeting. To ensure good air quality during the APEC week, Beijingand surrounding regions including Hebei Province, Tianjin City,Shanxi Province, Shandong Province and Inner Mongolia Provincecooperated to take strict air pollution control measures. The laststrict air quality control applied in Beijing before APEC was duringthe 2008 Summer Olympic Games. Post analysis of the air qualitysuggested that the mean PM2.5 concentrations during the Olympicperiod was 31% lower compared to the non-Olympic period andfavorable meteorology played a large role in reducing PM concen-trations (Wang et al., 2009). Summer is generally more favorable forgood air quality with more precipitation and more unstableweather conditions. However, the APEC month, November, is thetransition month from fall to winter. And stagnant weather con-ditions (weaker wind speeds and less precipitation) usually happenmore frequently than during spring and summer. In addition,people in North China start to use residential heating in November,which produces large amounts of air pollutants. These combinedadverse factors exert enormous pressure upon Beijing government.Thus, unprecedented efforts were made to guarantee good airquality during APEC in Beijing. The air control measures taken inBeijing included odd-even plate number rule for local vehicles, aban on driving for non-local cars, and suspended or reduced op-erations of construction sites, power plants, and factories (Li et al.,2015a,b).
According to the report from Beijing Municipal EnvironmentalProtection Bureau, sulfur dioxide (SO2), nitrogen oxides (NOx),PM10, PM2.5 and volatile organic compounds (VOCs) emissionswere reduced by 39.2%, 49.6%, 66.6%, 61.6% and 33.6% respectively(BMEPB, 2014). During the APEC week, air quality in Beijing waspleasant with frequently seen blue skies, and Chinese created a newword, “APEC Blue”, to describe it.
A number of studies have used multi-platform based measure-ments to characterize ambient VOCs, ozone, and aerosols duringAPEC, and the influences of emission controls (Chen et al., 2015a,2015b; Huang et al., 2015; Li et al., 2015a,b; Sun et al., 2016; Tanget al., 2015; Wen et al., 2016; Xu et al., 2015; Zhang et al., 2016a).Most studies have concluded that aerosol concentrations
significantly decreased, when compared to non-emission controlperiod in Beijing (Huang et al., 2015; Wen et al., 2016). However,different meteorological conditions during emission control andnon-emission control periods could have played important roles inthe pleasant air quality. Huang et al. (2015) compared temperature,wind speeds, Relative Humidity (RH) during the whole studyperiod (October 15-November 30) in each year from 2011 to 2014,and concluded no significant differences of meteorological condi-tions and attributed changes of air pollutants mainly to emissionchanges. It is not persuasive enough to draw conclusions based onlimited meteorological variables since the evolution of the crucialfactor planetary boundary layer height (PBLH) is not just simplydetermined by temperature, but other factors, such as sinkingmotion, as well (Gao et al., 2016a; Wu et al., 2017b). In addition, theroles of aerosol feedbacks during extreme haze events, andenhanced magnitudes of aerosol feedbacks due to emissionchanges from 1960 to 2010 have been highlighted in previousstudies (Gao et al., 2016a, 2016b; Hong et al., 2017; Wang et al.,2014a; Xing et al., 2015, 2016). These studies suggest thatreducing emissions of air pollutants may have co-benefits ofreducing the roles of aerosol feedbacks to accelerate the improve-ments of air quality. Therefore, the roles of meteorology, emissioncontrol measures, and co-benefits of reduced aerosol effects needto be better understood.
It is challenging to distinguish the roles of these factors solelybased on measurements, and air quality modeling elaborately fill inthe gaps of measurements and provide supplemental answers tothese questions. In this study, we distinguish the roles of meteo-rology, emission control measures, and co-benefits of reducedaerosol effects during APEC week using a fully online coupledmeteorology-chemistry model: Weather Research Forecastingcoupled with Chemistry (WRF-Chem). We also calculate thecontribution of regional transport to PM2.5 concentrations in Bei-jing to provide additional information on the controversy onregional transport contributions. In Sect. 2, we describe the WRF-Chem model configurations, used measurements, and design ofexperiment simulations. The results are presented in Sect. 3, andconclusions are provided in Sect. 4.
2. Methodology
2.1. WRF-Chem model
We used the WRF-Chem model (Grell et al., 2005) version 3.6.1to simulate meteorology, gaseous and aerosol concentrations inthis study, which has been shown to be capable of reproducing airquality in China in previous studies (Gao et al., 2015, 2016a, 2016b,2016c, 2017). WRF-Chem allows the selections of flexible combi-nations of gas phase chemistry and aerosol modules. We used theCarbon Bond Mechanism version Z (CBMZ) gas phase chemistry(Zaveri and Peters, 1999) coupled with the Model for SimulatingAerosol Interactions and Chemistry (MOSAIC) (Zaveri et al., 2008)aerosol module. CBMZ was extended from CBM-IV (Gery et al.,1989) to function properly at larger and longer timescales, whichconsiders 52 total species and 132 chemical reactions (Zaveri andPeters, 1999). The augmented version coupled with MOSAIC con-sists of 67 total species and 164 reactions (Zaveri et al., 2008).MOSAIC treats all important aerosol species, and size distributionwas implemented with discrete size bins. We used 8 bins version inthis study, and the range of particle diameters for each size bin islisted in Table 1. The Multicomponent Taylor Expansion Method(MTEM) method, instead of the widely used ISORROPIA, was usedin MOSAIC to calculate thermodynamics and phase equilibrium(Zaveri et al., 2008). Secondary organic aerosol (SOA) formation hasbeen added into MOSAIC using the volatility basis set (VBS)

Table 1Model configuration options.
Configurations Descriptions
Vertical layers 27Cloud Microphysics Lin schemeLongwave Radiation Rapid Radiative Transfer Model (RRTM)Shortwave Radiation Goddard shortwaveLand Surface Model NoahPlanetary Boundary Layer Yonsei UniversityGas phase chemistry CBM-ZMOSAIC Aerosol Bins 0.039e0.078 mm, 0.078e0.156 mm,
0.156e0.312 mm, 0.312e0.625 mm,0.625e1.25 mm, 1.25e2.5 mm,2.5e5.0 mm, 5.0e10 mm
M. Gao et al. / Atmospheric Environment 167 (2017) 476e486478
(Shrivastava et al., 2011). In the simulations, both aerosol direct andindirect effects were included. In the WRF-Chem model, aerosoloptical properties are determined based on aerosol chemicalproperties and sizes using Fast et al. (2006) method, and then theeffect of aerosols on incoming solar radiation is determined bytransferring related parameters to radiation scheme (Chapmanet al., 2009). For aerosol indirect effects, aerosols are activatedfrom interstitial aerosols to generate cloud-borne “attachmentstate” based on a maximum supersaturation (Chapman et al.,2009).
Two nested domains with horizontal resolutions of 81 km and27 km (Fig.1) and 27 vertical layers up to a pressure level of 100 hPawere configured to cover most areas of East Asia and focus on theNCP (Fig. 1). Selected physical parameterizations include the Linmicrophysics scheme (Lin et al., 1983), the Yonsei University (YSU)PBL scheme (Hong et al., 2006), the rapid radiative transfer model(RRTM) longwave radiation (Mlawer et al., 1997), and the Goddardshortwave radiation (Chou et al., 1998). Other chosen physical andchemistry parameterization modules are listed in Table 1. The NCEP1� � 1� degree final reanalysis dataset (FNL) was used to providemeteorological initial and boundary conditions. To reflect the
Fig. 1. Model domain settings and m
aerosol effects on meteorological variables, observation nudgingand reanalysis nudging were not used. Chemical initial andboundary conditions were obtained from the MOZART globalchemistry simulations (Emmons et al., 2010). The simulation periodis from October 16 to November 14, and the first three days werediscarded as spin-up to overcome the influences of initial condi-tions. The model was re-initialized every five days, and chemicalpredictions from previous simulation cycle were used as chemicalinitial conditions for each re-initialization.
2.2. Emissions
The anthropogenic emissions were taken from the MIX Asianemission inventory developed for MICS-Asia and HTAP, whichcombines five emission inventories, including REAS inventoryversion 2.1, the Multi-resolution Emission Inventory for China(MEIC) developed by Tsinghua University, a high NH3 emissioninventory by Peking University, an Indian emission inventorydeveloped by Argonne National Laboratory, and the official Koreanemission inventory from the Clean Air Policy Support System(CAPSS) (Li et al., 2017). The MIX inventory provides monthlyemissions of SO2, NOx, CO, NMVOC, NH3, PM10, PM2.5, BC, OC, andCO2 at 0.25� � 0.25� from power, industry, residential, trans-portation, and agriculture sectors for year 2008 and 2010 (Li et al.,2017). We replaced the emissions in China with MEIC emissioninventory for year 2012 to reflect the recent levels of emissions, andconsidered the diurnal variation and vertical distributions of thembased on different sources.
The MEGAN model version 2.1 was used to calculate onlineemissions of gases and particles from terrestrial ecosystems(Guenther et al., 2006, 2012). This model is driven by multiplevariables, including leaf area index (LAI), meteorological conditions(solar radiation, temperature andmoisture), CO2 concentration, etc.(Guenther et al., 2012). For emissions from biomass burning, weused the Global Fire Emissions Database version 4 (GFEDv4)(Randerson et al., 2015).
arked emission control regions.

M. Gao et al. / Atmospheric Environment 167 (2017) 476e486 479
2.3. Observations
The hourly surface concentrations of PM2.5 and daily PM2.5chemical compositions were provided by Dr. Yuesi Wang's group (Jiet al., 2014; Liu et al., 2015, 2017; Xin et al., 2015; Wang et al.,2014b), which were measured at the Institute of AtmosphericPhysics (IAP), Chinese Academy of Sciences (CAS) site. The meteo-rological measurements were downloaded from the NationalCenters for Environmental Information website (https://gis.ncdc.noaa.gov/maps/ncei#app¼cdo), which includes near surface tem-perature, relative humidity (RH), wind speed, and wind direction.
2.4. Numerical experiments and data analysis method
To investigate the influences of local emission control, sur-rounding emission control, regional transport, and reduced aerosoleffects on PM2.5 concentration in Beijing during APEC, we per-formed the following six WRF-Chem simulations.
NOCTL: Simulations were performed for the period fromOctober 16 to November 14 with normal emission settings and thefirst three days were discarded as spin-up time to overcome theinfluences of initial conditions. Aerosol feedbacks were turned onin this simulation.
CTL: Same as NOCTL except that emissions of SO2, NOx, PM10,PM2.5, VOCs, and other species in Beijing were reduced by 39.2%,49.6%, 66.6%, 61.6%, 33.6%, and 50% percent, respectively. Emissionsin the five surrounding provinces, namely Inner Mongolia, Shanxi,Hebei, Tianjin, and Shandong were reduced by 35%. These re-ductions are based on BMEPB reports (BMEPB, 2014). The locationsof these provinces are marked in Fig. 1.
OnlyBJ: Same as CTL except that only emissions in Beijing werereduced.
SUR5: Same as CTL except that only emissions in the five sur-rounding provinces were reduced.
BJ0: Same as CTL except that emissions in Beijing were reducedto zero.
NOCTL-NF: Same as NOCTL except that aerosol feedbacks wereturned off.
CTL-NF: Same as CTL except that aerosol feedbacks were turnedoff.
CTL-NBCA: Same as CTL except that BC absorptionwas excludedin the model.
We used multiple model performance metrics to assess ourmodel, including the correlation coefficient (r), the root meansquare error (RMSE), the mean bias (MB), the mean fractional bias
Fig. 2. Simulated and observed daily mean near surface temperature and RH, and
(MFB), the mean fractional error (MFE). The calculation equationsof these metrics are documented in Boylan and Russell (2006).
3. Results and discussions
3.1. Model performance
Although our WRF-Chem configuration has been shown toreliably reproduce evolutions of PM during winter episodes inprevious studies (Gao, 2015; Gao et al., 2015, 2016a, 2016b, 2016c,2017), its performance might exhibit different features during fall,when APEC took place. Thus, we used surface meteorological andPM measurements to evaluate how our model performs beforeinterpreting its results. The model value for the grid cell containingthe monitor was used to compare against measurements. Twometeorological sites in Beijing were averaged to conduct meteo-rological comparisons. Fig. 2 shows the time series of simulated andobserved daily mean temperature, RH, and hourly wind vectors inBeijing. Simulated temperature, RH and wind vectors generallycapture the features of observations. From before the APEC to theAPEC period, temperature and RH became relatively lower, andthere were more winds from northern areas, which is morefavorable for pleasant air quality. As mentioned in Gao et al.(2016a), from clean to haze days, temperature and RH are gener-ally higher, which is related to warm and moist air parcels fromsouthern regions, and higher RH conditions favoring and conduciveto aerosol growth. The higher temperature and RH before APEC isconsistent with frequent southerly winds shown in Fig. 2. Thecalculated model performance metrics MB, RMSE, and r for tem-perature, RH and wind speeds are summarized in Table 2. The rvalues are 0.95 (p < 0.01), 0.95 (p < 0.01), and 0.84 (p < 0.01),respectively. It was proposed that good model performance shouldhave temperature bias smaller than 0.5� and wind speed RMSEsmaller than 2 m/s (Emery et al., 2001). Our calculated statisticsmeet this standard.
Fig. 3(a) shows the simulated and observed hourly PM2.5 con-centration at the IAP/CAS site. Before the APEC, observed high PM2.5concentration is well reproduced by our model. However, duringAPEC, our model overestimates PM2.5 concentration in the NOCTLcase, because the implemented strict air quality control measureswere not reflected in the emissions. After including this (the CTLcase), model shows better agreements with measurements, withenhanced r value from 0.78 to 0.79. Besides, MB decreases from38.0 to 28.4 mg/m3, and RMSE decreases from 68.1 to 62.7 mg/m3
(Table 3). It is also found that MFB reduces from 54.7% to 44.8%, and
hourly wind vectors (Before APEC: October 19e31, APEC: November 5e11).

Table 3Model evaluation statistics for PM2.5.
r MB RMSE MFB MFE
NOCTL 0.78 38.0 mg/m3 68.1 mg/m3 54.7% 60.5%CTL 0.79 28.4 mg/m3 62.7 mg/m3 44.8% 55.0%
Table 2Model evaluation statistics for meteorological variables.
r MB RMSE
Temperature 0.95 (p < 0.01) �0.4 �C 1.1 �CRH 0.95 (p < 0.01) 0.3% 6.2%Wind speed 0.84 (p < 0.01) �0.6 m/s 1.2 m/s
M. Gao et al. / Atmospheric Environment 167 (2017) 476e486480
MFE reduces from 60.5% to 55.0% (Table 3). According to the pro-posed good performance of PM2.5 with MFB within ±60% and MFEbelow 75% (Boylan and Russell, 2006), our model is reasonablysatisfactory even before applying reductions in emissions.
The accuracy of simulated PM2.5 major chemical compositionswas validated in previous winter haze studies (Gao et al., 2016a,2016c). However, due to the different characteristics of aerosolformation in different seasons, we use extra chemical compositionmeasurements in fall season to verify our model here. As shown inFig. 3(aef), the high nitrate and ammonium concentrations duringhigh PM episode in Beijing are captured well by our model, butmeasured peak sulfate concentration is underestimated by ourmodel, probably due to some missing sulfate formation pathwaysin the model (Cheng et al., 2016; Gao et al., 2016c). Simulated BCconcentration is generally consistent with observations, but OC isunderestimated due to large uncertainties in current status of SOAmodeling (Fig. 3). Generally, the variations andmagnitudes of thesecompositions are well represented in our model.
All the comparisons shown above suggest that the model iscapable of simulating the major meteorological and chemicalevolution during fall season, providing solid basis for further modelanalysis in the following sections.
3.2. Relatively more favorable meteorological conditions duringAPEC
During November, Beijing is usually characterized with low
Fig. 3. Simulated and observed hourly mean PM2.5 concen
wind winds, less precipitation, and frequent stagnant weatherconditions, which is not favorable for diffusions of air pollutants(Huang et al., 2015). For example, during the APEC (November5e11), accumulated precipitation in North China is negligible(Fig. S1). However, the diffusion conditions during APEC are actu-ally better, compared with the conditions before APEC. Asmentioned above, from before the APEC to the APEC period, tem-perature decreases by 34.5% (from 12.5 �C to 8.2 �C), RH decreasesby 24.3% (from 66.1% to 50%), and wind speeds increased by 60.2%(from 1.8 m/s to 2.8 m/s). The hygroscopic growth of aerosol,aerosol size distribution and chemical processes are largely deter-mined by RH (Sun et al., 2006; Wang et al., 2017). Thus, the rela-tively lower RH during APEC (50%) is not favorable for aerosolchemistry and growth, and relatively lower temperature could havereduced chemical reaction rate (Gao et al., 2016b). The relativelyhigher wind speeds and more northerly wind direction duringAPEC was associated with two cold surges that resulted from thesoutheastward expansion of the Siberian high (Zhang et al., 2016b).
In addition to wind speed, PBLH is another essential factor inpollution formation (Gao et al., 2016a). Fig. 4 illustrates the timeseries of PBLH derived from the European Center for Medium-Range Weather Forecasts (ECMWF) ERA-Interim reanalysis data,the NCEP FNL reanalysis data, and WRF model simulations, beforethe APEC and during the APEC. From before the APEC to the APECperiod, PBLH increased by 59.7%. Because of the inverse relation-ship between PBLH and PM2.5, the relatively higher PBLH duringAPEC would lead to lower PM2.5 concentrations, even if strictemission control measures had not been applied.
trations and daily mean PM2.5 chemical compositions.

Fig. 4. Boundary layer heights from model and reanalysis data.
M. Gao et al. / Atmospheric Environment 167 (2017) 476e486 481
From above, relatively lower RH and temperature, higher windspeeds and enhanced PBLH might have played remarkable role inthe good air quality during APEC. However, some previous obser-vational studies simply compared concentrations of air pollutantsduring APEC to the concentrations before the APEC, and thenconcludes the influences of emission control, which fails to fullyexplain the good air quality during APEC. In the next section, wedistinguish the role of emission control measures from the role ofmeteorology using modeling tool, which can provide supplemen-tary information to observational information.
Fig. 5. Time series of simulated PM2.5 concentrations in the NOCTL, OnlyBJ, CTL, BJ0and SUR5 case.
3.3. Separate influences of emission control measures implementedin Beijing and surrounding provinces
Since two days before the APEC week, strict emission controlmeasures were implemented not just in Beijing, but in the fivesurrounding provinces as well. Four simulations, namely the CTLcase, the NOCTL case, the OnlyBJ, and the SUR5 case, are used toreflect the separate influences of emission implemented in Beijingand surrounding provinces. The difference between PM2.5 con-centrations in the CTL case and in the NOCTL case represents theinfluences of emission control applied in both Beijing and sur-rounding provinces, the difference between PM2.5 concentrationsin the OnlyBJ case and in the NOCTL case denotes the influence ofonly implementing emission control in Beijing, and the differencesbetween PM2.5 concentrations in the SUR5 case and in the NOCTLcase represents the influence of only implementing emission con-trol in the five surrounding provinces.
As shown in Fig. 5 (the concentrations were averaged overBeijing areas that shownwith green box in Fig. S2), the influences ofemission control applied in both Beijing and surrounding provinces(CTL-NOCTL) show large variations with time. For example, theinfluences reach over 30mg/m3 on November 8, but were almostnegligible on November 6.
During the APEC week, implementing emission control in Bei-jing and five surrounding provinces led to an averaged decrease of17.7 mg/m3 (�21.8%). Fig. 6 shows the spatial distributions ofchanges in PM2.5 and PM2.5 individual species due to emissioncontrol measures. In the Beijing region, the decreases in nitrate, BCand OC mass concentrations are higher than sulfate and ammo-nium. Given the relatively better performance of model in repro-ducing nitrate and BC during APECweek, it is less uncertain that the
roles of decreased nitrate and BC were important. However, theestimates in the roles of reduced OC have larger uncertaintyconsidering the poor performance of model in simulating OC. Ifcontrol measures were only applied in Beijing, PM2.5 concentra-tions in Beijing decrease by only about half of the total influences,which is 8.4 mg/m3 (�11.8%). Only implementing emission controlmeasures in the five surrounding provinces could have led to12.5 mg/m3 (SUR5-NOCTL) decrease in PM2.5 concentrations. Con-trolling emissions in the five surrounding provinces are equallyimportant as take strict emission control emissions in Beijing,particularly during days like November 8 (Fig. 5). The effectivenessof implementing emission control hinges on the characteristics oftransport pathways and transport speed, which is discussed in Sect.3.4.
3.4. Characteristics of regional transport and implications foremission control
When the Beijing local emissions are not included in simula-tions (the BJ0 case), Beijing still experiences notable PM2.5 pollu-tion. On some days, averaged PM2.5 pollution in Beijing can reachover 50mg/m3. Compared with the CTL case, the average PM2.5

Fig. 6. The spatial distributions of changes in sulfate (a), nitrate (b), ammonium (c), BC (d), and OC (e) and PM2.5 (f) due to emission controls (CTL-NOCTL) (mg/m3).
M. Gao et al. / Atmospheric Environment 167 (2017) 476e486482
contribution from non-local sources is 41.3%. The average contri-butionwas calculated using grid cells that shownwith green box inFig. S2, and during the November 5e11 period. This is lower thanthe contribution of 64.5% that calculated during the January 2010severe haze episode (Gao et al., 2016a), and slightly lower than51.6% that calculated during January 2013 (Wang et al., 2014c) and61.5% that calculated during summer time (Wu et al., 2017a). Dur-ing haze episodes, there were continuously southerly windsbrought air pollutants northwards to Beijing, while the transportpathways during APEC greatly differ.
We use the FLEXible PARTicle dispersion (FLEXPART) (Stohlet al., 1998) model driven by hourly WRF meteorological simula-tions to produce 36 h backward dispersions from urban Beijingregion. We released 50,000 particles from a 1� � 1� � 500 m box,and initiated at three moments, namely November 5 00:00,November 6 00:00, and November 8 12:00. These three momentswere selected with three different characteristics: PM2.5 concen-trations reduced but still at high level, PM2.5 concentrations notreduced, and PM2.5 concentrations reduced to low level. The spatialdistributions of released particles at 12 h and 6 h before thereleased moments are shown in Fig. 7. As shown in the first columnof Fig. 7, from 12 h before to 6 h before, the sources from southHebei are dominant. A large number of coal mines and highemission industry are located in South Hebei, which emit hugeamounts of air pollutants (Gao et al., 2016a). Thus, althoughemission control measures are implemented, PM2.5 concentrationsaveraged over Beijing still reach about 150mg/m3 on November 500:00. As shown in the second column, clean air masses fromnorthwestern regions are quickly moved after 6 h, indicating hightransport speed and wind speeds. During this period, implement-ing emission control measures shows no effective impacts on PM2.5concentrations. PM2.5 concentrations in the NOCTL, CTL, OnlyBJ and
SUR5 cases all drop to a level below 50mg/m3. The last columnshows that sources are mostly from westerly and southerly di-rections, and particles do not move far away after 6 h. Under thiscircumstance, strict emission control is more effective.
The transport pathways and transport speed are meaningful fordesigning emission control strategies. If fast transport from cleannorthwestern regions, reducing emissions from that upwind regionis not necessary. Under other circumstances, surrounding regionsare as important as Beijing local emissions. More effectively way isto refer to reliable air quality forecasts, and design near real-timeair quality control strategies based on the predicted transportcharacteristics.
3.5. Co-benefits of reducing emissions
It was pointed out in previous studies that both reduced radia-tion at the surface due to aerosol scattering and absorption, andheated upper PBL due to BC absorption can increase atmosphericstability and exacerbate PM2.5 pollution (Gao et al., 2016a). Themagnitudes of this effects also increased from 1960 to 2010 due toenhanced emissions and aggravated aerosol pollution in China (Gaoet al., 2016b). Thus, reducing emissions can also have co-benefits ofreducing aerosol effects, enhancing PBLHs and further reducingPM2.5 concentrations.
Due to emission control measures during APEC, daytime aver-aged PM2.5 concentrations over APEC week in Beijing decrease byabout 10e24mg/m3 (Fig. S3). It is interesting to know how much ofthese total changes are resulted from reduced aerosol effects. Toanswer question, we simulated another two cases: CTL-NF andNOCTL-NF. Fig. 8(a, d) shows the daytime averaged changes in PBLHand PM2.5 concentration due to aerosol feedbacks, with imple-mented emission control during APEC. Consistent with previous
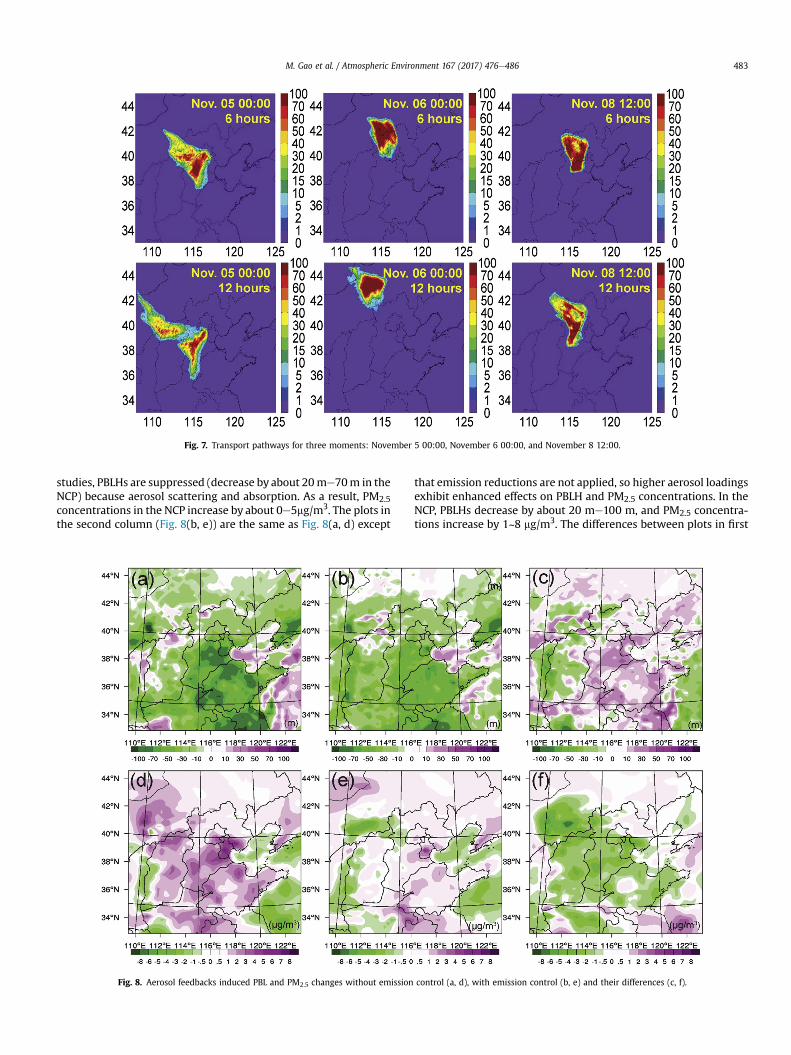
Fig. 7. Transport pathways for three moments: November 5 00:00, November 6 00:00, and November 8 12:00.
M. Gao et al. / Atmospheric Environment 167 (2017) 476e486 483
studies, PBLHs are suppressed (decrease by about 20me70m in theNCP) because aerosol scattering and absorption. As a result, PM2.5
concentrations in the NCP increase by about 0e5mg/m3. The plots inthe second column (Fig. 8(b, e)) are the same as Fig. 8(a, d) except
Fig. 8. Aerosol feedbacks induced PBL and PM2.5 changes without emission
that emission reductions are not applied, so higher aerosol loadingsexhibit enhanced effects on PBLH and PM2.5 concentrations. In theNCP, PBLHs decrease by about 20 me100 m, and PM2.5 concentra-tions increase by 1~8 mg/m3. The differences between plots in first
control (a, d), with emission control (b, e) and their differences (c, f).

M. Gao et al. / Atmospheric Environment 167 (2017) 476e486484
column and second column are the consequences of reducedaerosol effects resulted from emission control measures duringAPEC on PBLHs and PM2.5 concentrations. As shown in Fig. 8(c, f),PBLHs increase by about 0 me40 m, and PM2.5 concentrationsdecrease by about 1~5 mg/m3. In south Beijing areas, PM2.5 con-centrations decreases by 1~2 mg/m3. During daytime, PM2.5 con-centrations in urban Beijing region decrease by about 17.5 mg/m3
(Fig. S3), and the co-benefits of reduced aerosol feedbacks lead toabout 1.9 mg/m3 decreases (Fig. 7(f)), accounting for 10.9%.
Fig. 9 shows the BC absorption contribution to PBL changes andPM2.5 changes during daytime. On average, about 34.3% of PBLdecreases and 21.2% of PM2.5 increases are resulted from BC ab-sorption, and the remaining are caused by aerosol scattering.Although BC contributes a small amount to total aerosol massconcentration, its contribution to aerosol feedbacks are appre-ciable, which is consistent with results in Gao et al. (2016a). Thus,giving enough priority to BC for emission control will effectivelyaccelerate cleaning the air.
4. Summary
In this present study, we have presented detailed modelingstudy to distinguish the roles of meteorology, emission controlmeasures, regional transport, and the co-benefits of reducedaerosol effects during APEC using WRF-Chem model, which canprovide more sophisticated interpretations of the observed goodair quality during APEC. This study is unique from several per-spectives. Firstly, the influences of implementing local emissioncontrol and regional emission control are separated; secondly, mostprevious studies of regional transport contribution are conductedduring winter (Gao et al., 2016a; Wang et al., 2014c) and summer(Wu et al., 2017a) episode, and this study can provide supple-mentary information for fall season; thirdly, the reducing emissionsalso have co-benefits of lowering aerosol feedbacks, which hasbeen shown in several studies (Xing et al., 2016), but still lacked forAPEC study.
In general, the predicted temporal variations of the magnitudesof temperature, RH, wind, and PM2.5 agree well with observationsin Beijing. Model biases still exist, particularly in wind vectors,which is likely caused by errors in model land use data and usedcoarse horizontal and vertical model resolutions (Gao et al., 2016a).
Fig. 9. BC absorption contribution to PBL change
The comparisons of PM2.5 chemical compositions in October showthat themodel performs reasonablywell in capturing the variationsof aerosol evolutions. However, peak values of sulfate and OC areunderestimated by our model, which is due to the incompleteunderstanding and parameterizations of sulfate and SOA formationin current models.
The analyses of meteorological conditions in Beijing suggest thatgood air quality during APEC are largely resulted from positiveweather conditions (lower temperature, lower RH, higher windspeeds and enhanced PBLHs). Applying strict emission controlmeasures in Beijing and the five surrounding provinces can onlyexplain averaged 17.7 mg/m3 (�21.8%) decreases in PM2.5 concen-trations, among which emission reductions in surrounding prov-inces contribute to about half (9.3 mg/m3, 52.5%).
The effectiveness of implementing emission control measureshinges on dominant pathways and transport speeds. When trans-port fromhighly polluted regions (south Hebei) are dominant, strictemission control could not reduce to low level. When transportpathway from north region is dominant, PM2.5 concentrations arequickly dispersed even if no emission reduction is applied. Duringthe APEC week, non-local emissions contributed to 41.3% to PM2.5
concentrations in Beijing, emphasizing the correctness of synergicstrict control between local Beijing and surrounding provinces.
In addition, reduced aerosol feedbacks caused by strict emissioncontrol measures are studied in this study. Without emissioncontrol, PBLHs decrease by about 20 me100 m, and PM2.5 con-centrations increase by 1~8 mg/m3. These two number change to20 me70 m and 0~5 mg/m3 when strict emission reductions areapplied. During daytime, PM2.5 concentrations in urban Beijingregion decrease by about 17.5 mg/m3, and the co-benefits of reducedaerosol feedbacks lead to about 1.9 mg/m3 decreases, accounting for10.9%. The separation of contributions from aerosol absorption andscattering reiterates the importance of controlling BC (Gao et al.,2016a) to accelerate the effectiveness of aerosol pollution control.
5. Data availability
Contact Meng Gao ([email protected]) or Gregory R. Car-michael ([email protected]) for modeling data re-quests, and Yuesi Wang ([email protected]) for measurementsdata requests.
s (a) and PM2.5 changes (b) during daytime.

M. Gao et al. / Atmospheric Environment 167 (2017) 476e486 485
Acknowledgments
This work was partially supported by grants from NASA AppliedScience (NNX11AI52G) and EPA STAR (RD-83503701) programs.Weacknowledge all developers for contributing to the development ofthe WRF-Chem model, and thank use of the WRF-Chem prepro-cessor tool mozbc and fire_emiss provided by the AtmosphericChemistry Observations and Modeling Lab (ACOM) of NCAR.
Appendix A. Supplementary data
Supplementary data related to this article can be found at http://dx.doi.org/10.1016/j.atmosenv.2017.08.054.
References
Beijing Municipal Environmental Protection Bureau (BMEPB), 2014, viewed May 5,2017, http://www.bjepb.gov.cn/bjepb/332423/332446/416697/index.html.
Boylan, J.W., Russell, A.G., 2006. PM and light extinction model performance met-rics, goals, and criteria for three-dimensional air quality models. Atmos. Envi-ron. 40 (26), 4946e4959. http://dx.doi.org/10.1016/j.atmosenv.2005.09.087.
Chapman, E.G., Gustafson Jr., W.I., Easter, R.C., Barnard, J.C., Ghan, S.J., Pekour, M.S.,Fast, J.D., 2009. Coupling aerosol-cloud-radiative processes in the WRF-Chemmodel: investigating the radiative impact of elevated point sources. Atmos.Chem. Phys. 9 (3), 945e964.
Chen, C., Sun, Y.L., Xu, W.Q., Du, W., Zhou, L.B., Han, T.T., Wang, Q.Q., Fu, P.Q.,Wang, Z.F., Gao, Z.Q., Zhang, Q., Worsnop, D.R., 2015a. Characteristics andsources of submicron aerosols above the urban canopy (260 m) in Beijing,China, during the 2014 APEC summit. Atmos. Chem. Phys. 15 (22),12879e12895. http://dx.doi.org/10.5194/acp-15-12879-2015.
Chen, Z., Zhang, J., Zhang, T., Liu, W., Liu, J., 2015b. Haze observations by simulta-neous lidar and WPS in Beijing before and during APEC, 2014. Sci. China Chem.58 (9), 1385e1392. http://dx.doi.org/10.1007/s11426-015-5467-x.
Cheng, Y., Zheng, G., Wei, C., Mu, Q., Zheng, B., Wang, Z., Gao, M., Zhang, Q., He, K.,Carmichael, G., P€oschl, U., Su, H., Asia, E., 2016. Reactive nitrogen chemistry inaerosol water as a source of sulfate during haze events in China. Sci. Adv. (2)http://dx.doi.org/10.1126/sciadv.1601530.
Chou, M.-D., Suarez, M.J., Ho, C.-H., Yan, M.M.-H., Lee, K.-T., 1998. Parameterizationsfor cloud overlapping and shortwave single-scattering properties for use ingeneral circulation and cloud ensemble models. J. Clim. 11 (2), 202e214.
Emery, C., Tai, E., Yarwood, G., 2001. Enhanced meteorological modeling and per-formance evaluation for two Texas ozone episodes. Env. Int. Corp. 235.
Emmons, L.K., Walters, S., Hess, P.G., Lamarque, J.-F., Pfister, G.G., Fillmore, D.,Granier, C., Guenther, a., Kinnison, D., Laepple, T., Orlando, J., Tie, X., Tyndall, G.,Wiedinmyer, C., Baughcum, S.L., Kloster, S., 2010. Description and evaluation ofthe model for ozone and related chemical tracers. version 4 (MOZART-4).Geosci. Model Dev. 3 (1), 43e67. http://dx.doi.org/10.5194/gmd-3-43-2010.
Fast, J.D., Gustafson, W.I., Easter, R.C., Zaveri, R.A., Barnard, J.C., Chapman, E.G.,Grell, G.A., Peckham, S.E., 2006. Evolution of ozone, particulates, and aerosoldirect radiative forcing in the vicinity of Houston using a fully coupledmeteorology-chemistry-aerosol model. J. Geophys. Res. Atmos. 111 (D21).
Gao, M., Carmichael, G.R., Wang, Y., Saide, P.E., Yu, M., Xin, J., Liu, Z., Wang, Z., 2016a.Modeling study of the 2010 regional haze event in the North China Plain.Atmos. Chem. Phys. 16, 1673e1691. http://dx.doi.org/10.5194/acp-16-1673-2016.
Gao, M., 2015. Improving Understanding of Haze Pollution in the North China Plainvia Atmospheric Modeling and Data Assimilation. The University of Iowa.
Gao, M., Carmichael, G.R., Saide, P.E., Lu, Z., Yu, M., Streets, D.G., Wang, Z., 2016b.Response of winter fine particulate matter concentrations to emission andmeteorology changes in North China. Atmos. Chem. Phys. 16 (18), 11837e11851.http://dx.doi.org/10.5194/acp-16-11837-2016.
Gao, M., Carmichael, G.R., Wang, Y., Ji, D., Liu, Z., Wang, Z., 2016c. Improving sim-ulations of sulfate aerosols during winter haze over Northern China: the im-pacts of heterogeneous oxidation by NO2. Front. Environ. Sci. Eng. 10 (5) http://dx.doi.org/10.1007/s11783-016-0878-2.
Gao, M., Guttikunda, S.K., Carmichael, G.R., Wang, Y., Liu, Z., Stanier, C.O., Saide, P.E.,Yu, M., 2015. Health impacts and economic losses assessment of the 2013 se-vere haze event in Beijing area. Sci. Total Environ. 511 (January 2013), 553e561.http://dx.doi.org/10.1016/j.scitotenv.2015.01.005.
Gao, M., Saide, P.E., Xin, J., Wang, Y., Liu, Z., Wang, Y., Wang, Z., Pagowski, M.,Guttikunda, S.K., Carmichael, G.R., 2017. Estimates of health impacts and radi-ative forcing in winter haze in eastern China through constraints of surfacePM2.5 predictions. Environ. Sci. Technol. (February) http://dx.doi.org/10.1021/acs.est.6b03745 acs.est.6b03745.
Gery, M.W., Whitten, G.Z., Killus, J.P., Dodge, M.C., 1989. A photochemical kineticsmechanism for urban and regional scale computer modeling. J. Geophys. Res. 94(D10), 12925. http://dx.doi.org/10.1029/JD094iD10p12925.
Grell, G.a., Peckham, S.E., Schmitz, R., McKeen, S.a., Frost, G., Skamarock, W.C.,Eder, B., 2005. Fully coupled “online” chemistry within the WRF model. Atmos.Environ. 39 (37), 6957e6975. http://dx.doi.org/10.1016/j.atmosenv.2005.04.027.
Guenther, A.B., Jiang, X., Heald, C.L., Sakulyanontvittaya, T., Duhl, T., Emmons, L.K.,Wang, X., 2012. The model of emissions of gases and aerosols from natureversion 2.1 (MEGAN2.1): an extended and updated framework for modelingbiogenic emissions. Geosci. Model Dev. 5 (6), 1471e1492. http://dx.doi.org/10.5194/gmd-5-1471-2012.
Guenther, A., Karl, T., Harley, P., Wiedinmyer, C., Palmer, P.I., Geron, C., 2006. Esti-mates of global terrestrial isoprene emissions using MEGAN (model of emis-sions of gases and aerosols from nature). Atmos. Chem. Phys. 6 (1), 107e173.http://dx.doi.org/10.5194/acpd-6-107-2006.
Guo, S., Hu, M., Zamora, M.L., Peng, J., Shang, D., Zheng, J., Du, Z., Wu, Z., Shao, M.,Zeng, L., Molina, M.J., Zhang, R., 2014. Elucidating severe urban haze formationin China. Proc. Natl. Acad. Sci. 111, 17373e17378. http://dx.doi.org/10.1073/pnas.1419604111.
Hong, Song-You, Noh, Yign, Dudhia, J., 2006. A new vertical diffusion package withan explicit treatment of. Mon. Weather Rev. 134 (9), 2318e2341.
Hong, Chaopeng, Zhang, Qiang, Zhang, Yang, Tang, Youhua, Tong, Daniel, He, Kebin,2017. Multi-year downscaling application of two-way coupled WRF v3. 4 andCMAQ v5. 0.2 over east Asia for regional climate and air quality modeling:model evaluation and aerosol direct effects. Geosci. Model Dev. 10 (6), 2447.
Hua, Y., Wang, S., Wang, J., Jiang, J., Zhang, T., Song, Y., Kang, L., Zhou, W., Cai, R.,Wu, D., Fan, S., Wang, T., Tang, X., Wei, Q., Sun, F., Xiao, Z., 2016. Investigating theimpact of regional transport on PM<sub>2.5</sub> formation using verticalobservation during APEC 2014 Summit in Beijing. Atmos. Chem. Phys. 16 (24),15451e15460. http://dx.doi.org/10.5194/acp-16-15451-2016.
Huang, K., Zhang, X., Lin, Y., 2015. The “APEC Blue” phenomenon: regional emissioncontrol effects observed from space. Atmos. Res. 164e165, 65e75. http://dx.doi.org/10.1016/j.atmosres.2015.04.018.
Ji, D., Li, L., Wang, Y., Zhang, J., Cheng, M., Sun, Y., Liu, Z., Wang, L., Tang, G., Hu, B.,Chao, N., Wen, T., Miao, H., 2014. The heaviest particulate air-pollution episodesoccurred in northern China in January, 2013: insights gained from observation.Atmos. Environ. 92, 546e556. http://dx.doi.org/10.1016/j.atmosenv.2014.04.048.
Li, J., Xie, S.D., Zeng, L.M., Li, L.Y., Li, Y.Q., Wu, R.R., 2015a. Characterization ofambient volatile organic compounds and their sources in Beijing, before, dur-ing, and after Asia-Pacific Economic Cooperation China 2014. Atmos. Chem.Phys. 15 (14), 7945e7959. http://dx.doi.org/10.5194/acp-15-7945-2015.
Li, P., Yan, R., Yu, S., Wang, S., Liu, W., Bao, H., 2015b. Reinstate regional transport ofPM 2. 5 as a major cause of severe haze in Beijing. Proc. Natl. Acad. Sci. 2e3http://dx.doi.org/10.1073/pnas.1502596112.
Li, M., Zhang, Q., Kurokawa, J.-I., Woo, J.-H., He, K., Lu, Z., Ohara, T., Song, Y.,Streets, D.G., Carmichael, G.R., Cheng, Y., Hong, C., Huo, H., Jiang, X., Kang, S.,Liu, F., Su, H., Zheng, B., 2017. MIX: a mosaic Asian anthropogenic emissioninventory under the international collaboration framework of the MICS-Asiaand HTAP. Atmos. Chem. Phys. 17, 935e963. https://doi.org/10.5194/acp-17-935-2017.
Lin, Yuh-Lang, Farley, Richard D., Orville, H.D., 1983. Bulk parameterization of thesnow field in a cloud model. J. Clim. Appl. Meteorol. 22 (6), 1065e1092.
Liu, Z., Hu, B., Zhang, J., Xin, J., Wu, F., Gao, W., Wang, M., Wang, Y., 2017. Charac-terization of fine particles during the 2014 Asia-Pacific economic cooperationsummit: number concentration, size distribution and sources. Tellus B Chem.Phys. Meteorol. 69 (1), 1303228. http://dx.doi.org/10.1080/16000889.2017.1303228.
Liu, Z., Hu, B., Wang, L., Wu, F., Gao, W., Wang, Y., 2015. Seasonal and diurnalvariation in particulate matter (PM10 and PM2.5) at an urban site of Beijing:analyses from a 9-year study. Environ. Sci. Pollut. Res. Int. 22 (1), 627e642.http://dx.doi.org/10.1007/s11356-014-3347-0.
Mlawer, E.J., Taubman, S.J., Brown, P.D., Iacono, M.J., Clough, S.a, 1997. Radiativetransfer for inhomogeneous atmospheres: RRTM, a validated correlated-kmodel for the longwave. J. Geophys. Res. 102 (D14), 16663. http://dx.doi.org/10.1029/97JD00237.
Randerson, J.T., van der Werf, G.R., Giglio, L., Collatz, G.J., Kasibhatla, P.S., 2015.Global Fire Emissions Database. Version 4, (GFEDv4). ORNL DAAC, Oak Ridge,Tennessee, USA. http://dx.doi.org/10.3334/ORNLDAAC/1293.
Shrivastava, M., Fast, J., Easter, R., Gustafson, W.I., Zaveri, R.A., Jimenez, J.L., Saide, P.,Hodzic, A., 2011. Modeling organic aerosols in a megacity: comparison of simpleand complex representations of the volatility basis set approach. Atmos. Chem.Phys. 11 (13), 6639e6662. http://dx.doi.org/10.5194/acp-11-6639-2011.
Stohl, a., Hittenberger, M., Wotawa, G., 1998. Validation of the lagrangian particledispersion model FLEXPART against large-scale tracer experiment data. Atmos.Environ. 32 (24), 4245e4264. http://dx.doi.org/10.1016/S1352-2310(98)00184-8.
Sun, Y., Zhuang, G., Tang, A., Wang, Y., An, Z., 2006. Chemical characteristics ofPM2.5 and PM10 in haze� fog episodes in Beijing. Environ. Sci. Technol. 40 (10),3148e3155.
Sun, Y., Wang, Z., Wild, O., Xu, W., Chen, C., Fu, P., Du, W., Zhou, L., Zhang, Q., Han, T.,Wang, Q., Pan, X., Zheng, H., Li, J., Guo, X., Liu, J., Worsnop, D.R., 2016. “APECBlue”: secondary aerosol reductions from emission controls in Beijing. Sci. Rep.6 (November 2015), 20668. http://dx.doi.org/10.1038/srep20668.
Tang, G., Zhu, X., Hu, B., Xin, J., Wang, L., Münkel, C., Mao, G., Wang, Y., 2015. Impactof emission controls on air quality in Beijing during APEC 2014: lidar ceilometerobservations. Atmos. Chem. Phys. 15 (21), 12667e12680. http://dx.doi.org/10.5194/acp-15-12667-2015.
Wang, J., Wang, S., Jiang, J., Ding, A., Zheng, M., Zhao, B., Wong, D.C., Zhou, W.,Zheng, G., Wang, L., Pleim, J.E., 2014a. Impact of aerosolemeteorology in-teractions on fine particle pollution during China's severe haze episode in

M. Gao et al. / Atmospheric Environment 167 (2017) 476e486486
January 2013. Environ. Res. Lett. 9 (9), 094002.Wang, L., Ji, D., Li, Y., Gao, M., Tian, S., Wen, T., Liu, Z., Wang, L., Xu, P., Jiang, C.,
Wang, Y., 2017. The impact of relative humidity on the size distribution andchemical processes of major water-soluble inorganic ions in the megacity ofChongqing, China. Atmos. Res. 192, 19e29. http://dx.doi.org/10.1016/j.atmosres.2017.03.016.
Wang, Wentao, Primbs, Toby, Tao, Shu, Simonich, S.L.M., 2009. Comment on “ at-mospheric particulate matter pollution during the 2008 Beijing olympics”.Environ. Sci. Technol. 43, 5314e5320. http://dx.doi.org/10.1029/2006JD007448.Xiaohong.
Wang, Y., Yao, L., Wang, L., Liu, Z., Ji, D., Tang, G., Zhang, J., Sun, Y., Hu, B., Xin, J.,2014b. Mechanism for the formation of the January 2013 heavy haze pollutionepisode over central and eastern China. Sci. China Earth Sci. 57 (1), 14e25.http://dx.doi.org/10.1007/s11430-013-4773-4.
Wang, Z., Li, J., Wang, Z., Yang, W., Tang, X., Ge, B., Yan, P., Zhu, L., Chen, X., Chen, H.,Wand, W., Li, J., Liu, B., Wang, X., Zhao, Y., Lu, N., Su, D., 2014c. Modeling study ofregional severe hazes over mid-eastern China in January 2013 and its impli-cations on pollution prevention and control. Sci. China Earth Sci. 57 (1), 3e13.http://dx.doi.org/10.1007/s11430-013-4793-0.
Wen, W., Cheng, S., Chen, X., Wang, G., Li, S., Wang, X., Liu, X., 2016. Impact ofemission control on PM2.5 and the chemical composition change in Beijing-Tianjin-Hebei during the APEC summit 2014. Environ. Sci. Pollut. Res. 23 (5),4509e4521. http://dx.doi.org/10.1007/s11356-015-5379-5.
Wu, J., Li, G., Cao, J., Bei, N., Wang, Y., Feng, T., Huang, R., Liu, S., Zhang, Q., Tie, X.,2017a. Contributions of trans-boundary transport to the summertime airquality in Beijing, China. Atmos. Chem. Phys. 17, 2035e2051. http://dx.doi.org/10.5194/acp-2016-705.
Wu, P., Ding, Y., Liu, Y., 2017b. Atmospheric circulation and dynamic mechanism forpersistent haze events in the BeijingeTianjineHebei region. Adv. Atmos. Sci. 34(4), 429e440. http://dx.doi.org/10.1007/s00376-016-6158-z.
Xin, J., Wang, Y., Pan, Y., Ji, D., Liu, Z., Wen, T., Wang, Y., Li, X., Sun, Y., Sun, J., Wang, P.,Wang, G., Wang, X., Cong, Z., Song, T., Hu, B., Wang, L., Tang, G., Gao, W., Guo, Y.,Miao, H., Tian, S., Wang, L., 2015. The campaign on atmospheric aerosol researchnetwork of China: CARE-China. Bull. Am. Meteorol. Soc. 96 (7), 1137e1155.http://dx.doi.org/10.1175/BAMS-D-14-00039.1.
Xing, J., Mathur, R., Pleim, J., Hogrefe, C., Gan, C.M., Wong, D.C., Wei, C., Wang, J.,2015. Air pollution and climate response to aerosol direct radiative effects: amodeling study of decadal trends across the northern hemisphere. J. Geophys.Res. Atmos. 120 (23).
Xing, J., Wang, J., Mathur, R., Pleim, J., Wang, S., Hogrefe, C., Gan, C.M., Wong, D.C.,Hao, J., 2016. Unexpected benefits of reducing aerosol cooling effects. Environ.Sci. Technol. 50 (14), 7527e7534.
Xu, W.Q., Sun, Y.L., Chen, C., Du, W., Han, T.T., Wang, Q.Q., Fu, P.Q., Wang, Z.F.,Zhao, X.J., Zhou, L.B., Ji, D.S., Wang, P.C., Worsnop, D.R., 2015. Aerosol compo-sition, oxidation properties, and sources in Beijing: results from the 2014 Asia-Pacific Economic Cooperation summit study. Atmos. Chem. Phys. 15 (23),13681e13698. http://dx.doi.org/10.5194/acp-15-13681-2015.
Zaveri, R.a., Easter, R.C., Fast, J.D., Peters, L.K., 2008. Model for simulating aerosolinteractions and chemistry (MOSAIC). J. Geophys. Res. 113 (D13), D13204. http://dx.doi.org/10.1029/2007JD008782.
Zaveri, R.a., Peters, L.K., 1999. A new lumped structure photochemical mechanismfor large-scale applications. J. Geophys. Res. Atmos. 104 (D23), 30387e30415.http://dx.doi.org/10.1029/1999JD900876.
Zhang, J.K., Wang, L.L., Wang, Y.H., Wang, Y.S., 2016a. Submicron aerosols during theBeijing Asia-pacific economic cooperation conference in 2014. Atmos. Environ.124, 224e231. http://dx.doi.org/10.1016/j.atmosenv.2015.06.049.
Zhang, L., Shao, J., Lu, X., Zhao, Y., Hu, Y., Henze, D.K., Liao, H., Gong, S., Zhang, Q.,2016b. Sources and processes affecting fine particulate matter pollution overNorth China: an adjoint analysis of the Beijing APEC period. Environ. Sci.Technol. 50 (16), 8731e8740. http://dx.doi.org/10.1021/acs.est.6b03010.