Embed Size (px)
Citation preview
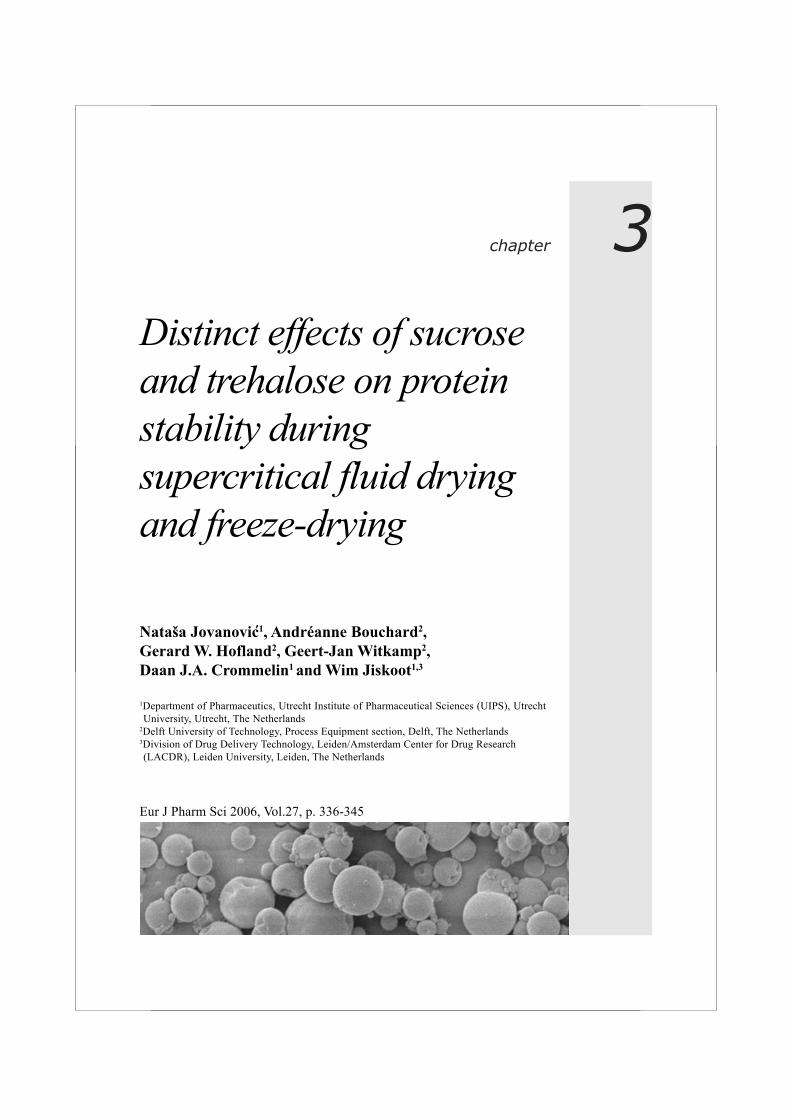
chapter 3Distinct effects of sucroseand trehalose on proteinstability duringsupercritical fluid dryingand freeze-drying
Eur J Pharm Sci 2006, Vol.27, p. 336-345
'Nataša Jovanovic1, Andréanne Bouchard2,Gerard W. Hofland2, Geert-Jan Witkamp2,Daan J.A. Crommelin1 and Wim Jiskoot1,3
1Department of Pharmaceutics, Utrecht Institute of Pharmaceutical Sciences (UIPS), UtrechtUniversity, Utrecht, The Netherlands
2Delft University of Technology, Process Equipment section, Delft, The Netherlands3Division of Drug Delivery Technology, Leiden/Amsterdam Center for Drug Research(LACDR), Leiden University, Leiden, The Netherlands

chapter 3
52
ABSTRACT
Supercritical fluid (SCF) drying has been proposed as an alternative for freeze-dryingto stabilize proteins. Here we studied the influence of sucrose and trehalose duringSCF drying on the protein stability and the physical powder characteristics oflysozyme and myoglobin formulations. The results obtained with SCF drying werecompared with the results after freeze-drying of the same solutions. Aqueous proteinsolutions, with or without sugar, were sprayed into a SCF mixture of carbon dioxideand ethanol. The dried products were analyzed by residual water measurements,scanning electron microscopy, X-ray powder diffraction and differential scanningcalorimetry. After reconstitution the protein structure was studied by UV/VIS, circulardichroism and fluorescence spectroscopy, sodium dodecyl sulfate-polyacrylamide gelelectrophoresis, and bioactivity assay (lysozyme). The SCF dried and freeze-driedformulations showed comparable water contents, but their physical properties weresubstantially different. All freeze-dried cakes were amorphous with fully preservedprotein structure. SCF dried sucrose-containing formulations showed agglomeratedcrystalline particles, whereas SCF dried trehalose-containing formulations appeared toconsist of amorphous spherical particles. Particle morphology of excipients-freeproteins was protein specific. Nearly all SCF dried lysozyme could be readilyreconstituted, but for myoglobin significant fractions of SCF protein did not dissolve,especially in the absence of sugars. Covalent aggregation was not observed for the twoproteins. For the recovered soluble fractions, the secondary protein structure waspreserved. The tertiary structure was preserved for lysozyme, but not entirely formyoglobin. Surprisingly, during SCF drying trehalose was less protective than sucrosefor myoglobin.

Supercritical fluid drying of protein formulations
53
INTRODUCTION
Recent developments in biotechnology have resulted in a rapidly increasing number oftherapeutic proteins. The relative instability of new potential protein therapeuticsrequires systematic approaches to rationally design stable protein formulations (1, 2).In the presence of water proteins can undergo a variety of chemical and physicaldegradation reactions (3) and one of the ways to achieve long-term stability is to dryprotein formulations (1, 4, 5). Among the several drying techniques available, ourresearch interest is supercritical fluid (SCF) drying as a relatively new drying methodfor protein stabilization (6, 7).SCF drying is especially attractive for reasons of mild process conditions, cost-effectiveness, possible sterilizing properties of supercritical carbon dioxide (SC-CO2),capability of producing microparticulate protein powders and feasibility of scaling-up.However, general rules regarding protein stabilization by SCF drying are yet to beestablished. For instance, it is not known how stabilizers affect the physical propertiesof SCF dried powder (e.g., appearance, solubility and crystallinity) and how theyinfluence protein stability during the processing and on long-term storage.
Spraying into SC-CO2 as a drying process to stabilize protein formulations wasreported in only a few publications (8-10). Partial preservation of the protein structureand activity after SCF drying has been reported for recombinant immunoglobulin G1(8). However, no information about particle morphology and crystallinity of the driedformulation was given. Sellers et al. (11) studied the protein structure and powdercharacteristics of dried lysozyme formulations, but the process used was similar totraditional spray-drying, i.e. SC-CO2 was used for enhancing the atomization only.
The aim of this work was to gain more insight into the potential of SCF processing forthe drying of aqueous protein solutions in the presence of frequently used stabilizers,sucrose and trehalose. As model proteins lysozyme and myoglobin were used.Lysozyme is widely used as a model protein with a measurable functional activity(12). Myoglobin has characteristic spectral features, which enables monitoring subtlechanges in the interaction between the protein and the heme group (13). To assure thatphysico-chemical properties of the SCF dried formulation will depend mainly on thesugar used, a high sugar-to-protein ratio was selected (100:1 (w/w)). The solutionswere dried by spraying into SC-CO2 and dry formulations further analyzed for proteinintegrity in the reconstituted solutions and physical characteristics of the driedpowder. To directly compare the SCF process with freeze-drying, the same solutionswere freeze-dried. To the best of our knowledge, this is the first time that a direct

chapter 3
54
comparison is made between SCF drying and freeze-drying of the same proteinformulations with regard to protein structure preservation. For comparison, sugar freeprotein solutions were dried as well to obtain pure amorphous material. Our resultsshow clear differences between the crystalline/amorphous properties of SCF driedformulations containing sucrose or trehalose, whereas in freeze-drying both sugarcakes were amorphous. Surprisingly, under the chosen conditions the SCF driedtrehalose formulation, although amorphous, gave the most significant changes inmyoglobin tertiary structure.
MATERIALS AND METHODS
MaterialsHen egg white lysozyme (~70000U/mg) was purchased from Fluka (Buchs,Switzerland), myoglobin (from horse heart), trehalose (crystalline, dihydrate fromSaccharomyces cerevisiae), Micrococcus lysodeikticus (Micrococcus luteus) wereacquired from Sigma-Aldrich (Steinheim, Germany) and sucrose (crystalline,European Pharmacopeia grade) from Riedel- de Haën. All other chemicals used wereobtained from commercial suppliers and were analytical grade.
Protein formulationsProtein formulations used in SCF drying and freeze-drying were prepared bydissolving the protein (lysozyme or myoglobin) and excipients in reverse-osmosis(RO) water. 25 g solution was prepared for each formulation containing 0.1 % (w/w)protein and 10 % (w/w) excipient (sucrose or trehalose). When excipient-free protein(further called “unformulated protein”) solution was dried, the protein concentrationused was 2 % (w/w). For each formulation at least three batches were dried.
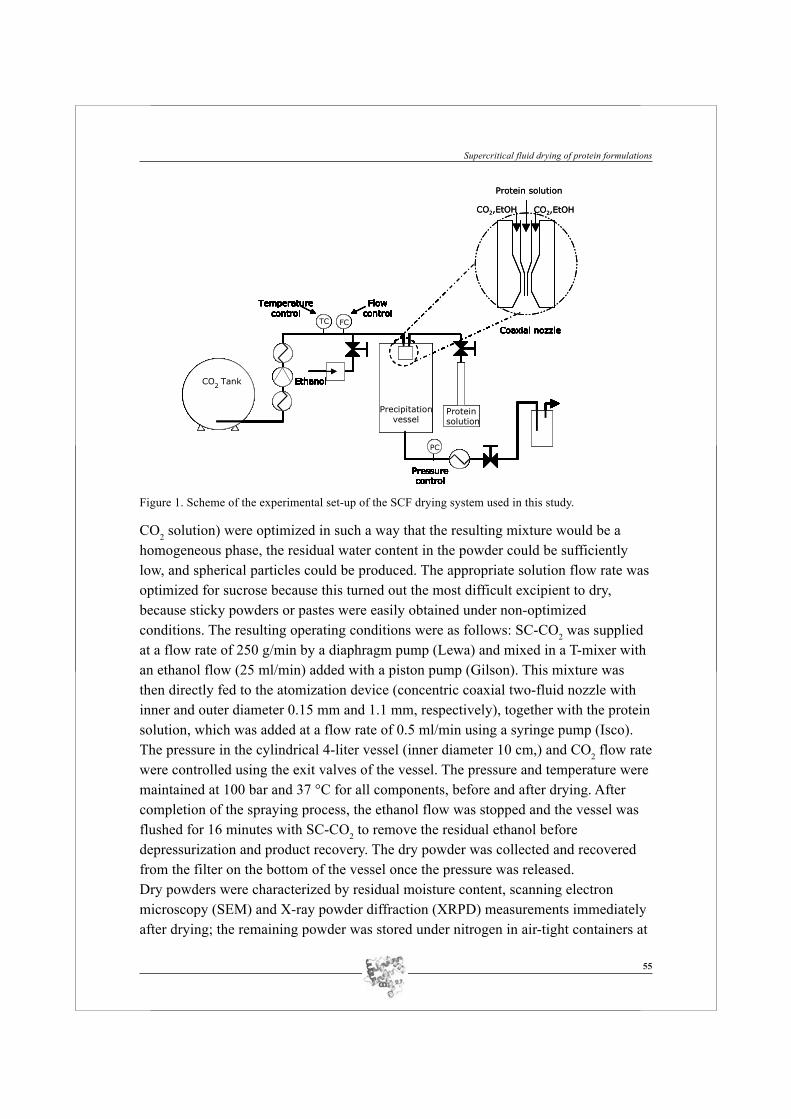
SCF dryingSCF drying was performed in a supercritical drying apparatus, type SFP4 (Separex,Champigneulles, France). The drying process used consisted of spraying the aqueousprotein solution into a SCF mixture containing CO2 and ethanol. Drying is basicallyachieved by the extraction of water towards the SCF phase. A small amount of ethanolis expected to condense into the droplet, which could help the precipitation of thesugar and protein within the drop to occur by anti-solvent precipitation. Thetheoretical principles are summarized in our previous publication (6).The scheme of the experimental set-up is shown in Figure 1. Temperature and pressurewere selected such that the CO2 and ethanol were fully miscible. Flow rates (ethanol,
Supercritical fluid drying of protein formulations
55
CO2 solution) were optimized in such a way that the resulting mixture would be ahomogeneous phase, the residual water content in the powder could be sufficientlylow, and spherical particles could be produced. The appropriate solution flow rate wasoptimized for sucrose because this turned out the most difficult excipient to dry,because sticky powders or pastes were easily obtained under non-optimizedconditions. The resulting operating conditions were as follows: SC-CO2 was suppliedat a flow rate of 250 g/min by a diaphragm pump (Lewa) and mixed in a T-mixer withan ethanol flow (25 ml/min) added with a piston pump (Gilson). This mixture wasthen directly fed to the atomization device (concentric coaxial two-fluid nozzle withinner and outer diameter 0.15 mm and 1.1 mm, respectively), together with the proteinsolution, which was added at a flow rate of 0.5 ml/min using a syringe pump (Isco).The pressure in the cylindrical 4-liter vessel (inner diameter 10 cm,) and CO2 flow ratewere controlled using the exit valves of the vessel. The pressure and temperature weremaintained at 100 bar and 37 °C for all components, before and after drying. Aftercompletion of the spraying process, the ethanol flow was stopped and the vessel wasflushed for 16 minutes with SC-CO2 to remove the residual ethanol beforedepressurization and product recovery. The dry powder was collected and recoveredfrom the filter on the bottom of the vessel once the pressure was released.Dry powders were characterized by residual moisture content, scanning electronmicroscopy (SEM) and X-ray powder diffraction (XRPD) measurements immediatelyafter drying; the remaining powder was stored under nitrogen in air-tight containers at
Precipitation vessel
CO2 Tank Ethanol
FCTC
PC
Proteinsolution
Temperature control
Flow control
Pressure control
Coaxial nozzle
Precipitation vessel
CO2 Tank Ethanol
FCTC
PC
Proteinsolution
Temperature control
Flow control
Pressure control
Precipitation vessel
CO2 Tank Ethanol
FCTC
PC
Proteinsolution
Temperature control
Flow control
Pressure control
Precipitation vessel
CO2 Tank Ethanol
FCTC
PC
Proteinsolution
Temperature control
Flow control
Pressure control
Coaxial nozzle
Precipitation vessel
CO2 Tank Ethanol
FCTC
PC
Proteinsolution
Temperature control
Flow control
Pressure control
Precipitation vessel
CO2 Tank Ethanol
FCTC
PC
Proteinsolution
Temperature control
Flow control
Pressure control
Coaxial nozzle
Precipitation vessel
CO2 Tank Ethanol
FCTC
PC
Proteinsolution
Temperature control
Flow control
Pressure control
Precipitation vessel
CO2 Tank Ethanol
FCTC
PC
Proteinsolution
Temperature control
Flow control
Pressure control
Precipitation vessel
CO2 Tank Ethanol
FCTC
PC
Proteinsolution
Temperature control
Flow control
Pressure control
Precipitation vessel
CO2 Tank Ethanol
FCTC
PC
Proteinsolution
Temperature control
Flow control
Pressure control
Coaxial nozzle
Temperature control
Flow control
Pressure control
Coaxial nozzle
CO2,EtOH
Protein solution
CO2,EtOH
Precipitation vessel
CO2 Tank Ethanol
FCTC
PC
Proteinsolution
Temperature control
Flow control
Pressure control
Precipitation vessel
CO2 Tank Ethanol
FCTC
PC
Proteinsolution
Temperature control
Flow control
Pressure control
Coaxial nozzle
Precipitation vessel
CO2 Tank Ethanol
FCTC
PC
Proteinsolution
Temperature control
Flow control
Pressure control
Precipitation vessel
CO2 Tank Ethanol
FCTC
PC
Proteinsolution
Temperature control
Flow control
Pressure control
Precipitation vessel
CO2 Tank Ethanol
FCTC
PC
Proteinsolution
Temperature control
Flow control
Pressure control
Precipitation vessel
CO2 Tank Ethanol
FCTC
PC
Proteinsolution
Temperature control
Flow control
Pressure control
Coaxial nozzle
Precipitation vessel
CO2 Tank Ethanol
FCTC
PC
Proteinsolution
Temperature control
Flow control
Pressure control
Precipitation vessel
CO2 Tank Ethanol
FCTC
PC
Proteinsolution
Temperature control
Flow control
Pressure control
Coaxial nozzle
Precipitation vessel
CO2 Tank Ethanol
FCTC
PC
Proteinsolution
Temperature control
Flow control
Pressure control
Precipitation vessel
CO2 Tank Ethanol
FCTC
PC
Proteinsolution
Temperature control
Flow control
Pressure control
Precipitation vessel
CO2 Tank Ethanol
FCTC
PC
Proteinsolution
Temperature control
Flow control
Pressure control
Precipitation vessel
CO2 Tank Ethanol
FCTC
PC
Proteinsolution
Temperature control
Flow control
Pressure control
Coaxial nozzle
Temperature control
Flow control
Pressure control
Coaxial nozzle
CO2,EtOH
Protein solution
CO2,EtOH
Figure 1. Scheme of the experimental set-up of the SCF drying system used in this study.
chapter 3
56
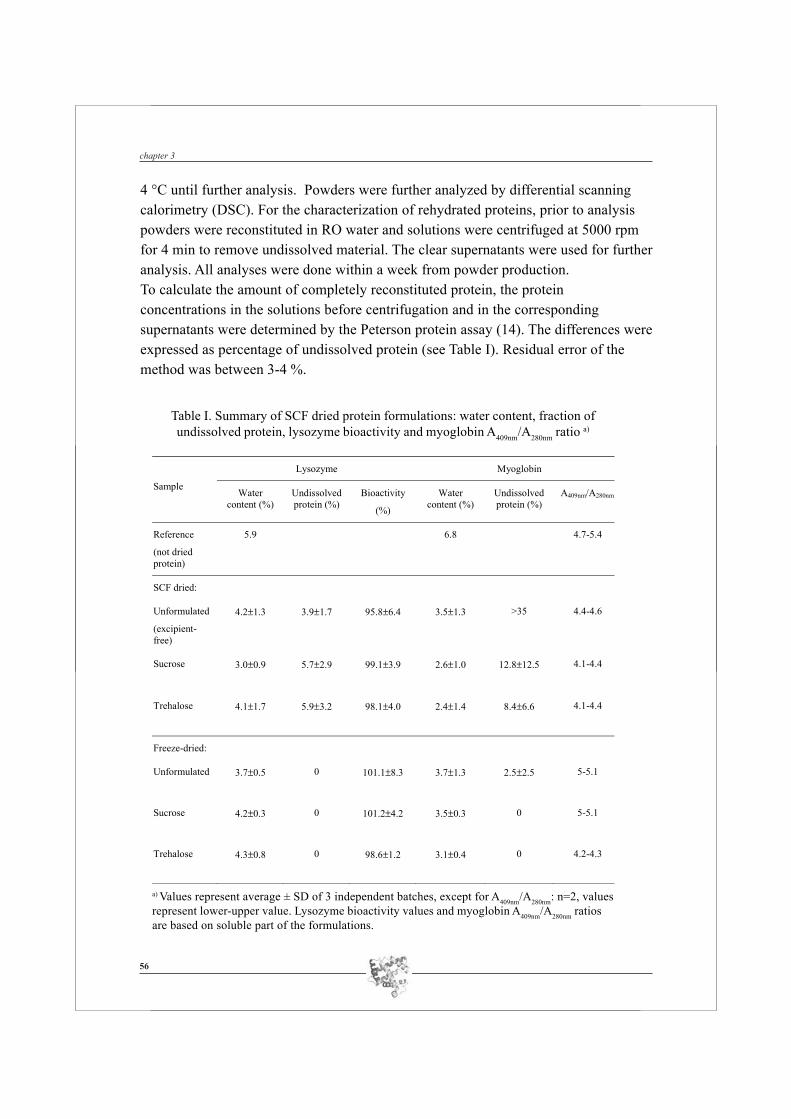
4 °C until further analysis. Powders were further analyzed by differential scanningcalorimetry (DSC). For the characterization of rehydrated proteins, prior to analysispowders were reconstituted in RO water and solutions were centrifuged at 5000 rpmfor 4 min to remove undissolved material. The clear supernatants were used for furtheranalysis. All analyses were done within a week from powder production.To calculate the amount of completely reconstituted protein, the proteinconcentrations in the solutions before centrifugation and in the correspondingsupernatants were determined by the Peterson protein assay (14). The differences wereexpressed as percentage of undissolved protein (see Table I). Residual error of themethod was between 3-4 %.
Table I. Summary of SCF dried protein formulations: water content, fraction ofundissolved protein, lysozyme bioactivity and myoglobin A409nm/A280nm ratio a)
Lysozyme Myoglobin
Sample Water content (%)
Undissolved protein (%)
Bioactivity
(%)
Water content (%)
Undissolved protein (%)
A409nm/A280nm
Reference
(not dried protein)
5.9 6.8 4.7-5.4
SCF dried:
Unformulated
(excipient-free)
4.2±1.3 3.9±1.7 95.8±6.4 3.5±1.3 >35 4.4-4.6
Sucrose 3.0±0.9 5.7±2.9 99.1±3.9 2.6±1.0
12.8±12.5 4.1-4.4
Trehalose
4.1±1.7 5.9±3.2 98.1±4.0 2.4±1.4
8.4±6.6 4.1-4.4
Freeze-dried:
Unformulated
3.7±0.5 0 101.1±8.3 3.7±1.3 2.5±2.5 5-5.1
Sucrose
4.2±0.3 0 101.2±4.2 3.5±0.3 0 5-5.1
Trehalose
4.3±0.8 0 98.6±1.2 3.1±0.4 0 4.2-4.3
a) Values represent average ± SD of 3 independent batches, except for A409nm/A280nm: n=2, valuesrepresent lower-upper value. Lysozyme bioactivity values and myoglobin A409nm/A280nm ratiosare based on soluble part of the formulations.

Supercritical fluid drying of protein formulations
57
Freeze-dryingThe freeze-drying procedure described below was selected to obtain comparable watercontents as in SCF drying. Protein formulations were freeze-dried in a ZIRBUSsublimator 400 (ZIRBUS technology, Bad Grund, Germany). The shelf temperaturewas lowered to -45 °C, and freezing was completed within ca 10 min. After cooling at-45 °C, primary drying was initiated. The temperature of the frozen product wasmaintained between -40 °C and -45 °C for 30 min at a pressure of 0.12 mbar, afterwhich the shelf temperature was increased to 20 °C to complete drying at the samepressure. This stage of drying was carried out for 24 h. Lyophilization was terminatedby automatic stoppering of the vials in the freeze-dryer.Amorphous sucrose and trehalose as the references for the XRPD and DSCmeasurements were prepared from aqueous sugar solutions (10 % (w/w)) by anestablished freeze-drying procedure (15). The amorphous character of the productswas confirmed by DSC and XRPD (see below).
Residual moisture contentResidual moisture content of dried formulations was measured with the Karl-Fishermethod on a Metrohm 756 KF (Metrohm, Herisau, Switzerland) as described in themanufacturer’s manual. The samples (ca. 30g) were dispersed in methanol and thewater content was determined. Methanol was used as a blank. The water content ofevery formulation is given as the average of the calculated water contents of 3independent batches.
Scanning electron microscopy (SEM)SEM (JSM-5400, Jeol, Peabody, USA) images were used to examine the morphologyof the dried particles. Conductive double sided tape was used to fix the particles to thespecimen holder before sputtering them with a thin layer of gold.
Differential scanning calorimetry (DSC)DSC was performed on a Q-1000 calorimeter (TA instruments, New Castle, Delaware,USA). Dry powder (5-10 mg) was placed in an aluminum pan that was hermeticallysealed. For conventional DSC measurements, samples were equilibrated at 0 °C andheated at a rate of 10 °C/min. For modulated DSC (MDSC) measurements, sampleswere heated at a rate of 1 °C/min and a modulation of ±1 °C/min. MDSC was run todistinguish reversible thermal events such as glass transition temperature (Tg) fromirreversible thermal events.

chapter 3
58
X-ray powder diffraction (XRPD)XRPD was performed using a D8 Discover X-ray diffractometer with a general areadetector diffraction system (Bruker AXS, Madison, USA). The incident Cu radiationof 1.54 Å was used and the sample-to-detector distance was set to 6 cm. An incidentbeam with a cross section of 0.5 mm was used and dried sample powders wereprepared in a 0.5-mm thick holder. Background (air scattering) was measured for thesame sampling time, typically 30 minutes, and subtracted from each measurement.Data were integrated along the χ angle, giving rise to plots of intensity versusscattering angle (2θ). Diffraction profiles were used to confirm the amorphous orcrystalline state of the powders.
Spectroscopic analysis of protein structureAbsorption spectra from 240-350 nm for lysozyme or from 240-700 nm for myoglobin(path length 1 cm) were acquired with a Lambda 2 UV/VIS spectrophotometer(Perkin-Elmer, Ûberlingen, Germany) at room temperature. For myoglobin the ratiobetween the peak heights at 409 nm and 280 nm (A409nm/A280nm ratio) was calculatedfrom the spectra.Far-UV (195-260 nm) circular dichroism (CD) spectroscopy was performed at roomtemperature in a 0.02-cm quartz cuvette and near-UV/VIS CD (250-310 nm or 250-450 nm) in a 1-cm quartz cuvette with a dual beam DSM 1000 CD spectrometer (On-Line Instrument Systems, Bogart, GA, USA). The subtractive double-gratingmonochromator was equipped with a fixed disk, holographic gratings (2400 lines/mm,blaze wavelength 230 nm) and 1.24 mm slits. Each measurement was the average of atleast 5 repeated scans. The measured CD signals were converted to delta molarextinction (Δε).Intrinsic tryptophan fluorescence emission spectra were measured on a Fluorologfluorimeter (Jobin Yvon-Horriba, Edison, NJ, USA). The excitation wavelength wasset at 295 nm to selectively excite the tryptophan residues. The excitation andemission slits were set at 5 nm. Measurements were carried out at room temperature ina quartz cuvette (1 cm path length). Concentrations of analyzed solutions wereadjusted to A280nm<0.1. Spectra were normalized for the concentration differences.
Sodium dodecyl sulfate-polyacrylamide gel electrophoresis (SDS-PAGE)SDS-PAGE was performed under reducing (samples were solubilized with samplebuffer containing β-mercaptoethanol) and non-reducing (without β-mercaptoethanol)conditions at 200 V at room temperature on a Biorad Protean III system (Biorad,Veenendaal, The Netherlands). The gels consisted of a separating gel containing 15 %
Supercritical fluid drying of protein formulations
59
(w/v) acrylamide and 0.1 % SDS, and a stacking gel containing 5 % acrylamide and0.1 % SDS. The electrophoresis buffer was 25 mM tris (hydroxymethyl)aminomethane, 192 mM glycine and 0.1 % (w/v) SDS. Amount of solution loaded onthe gel was adjusted to 1-2 μg of protein per lane. Protein bands were stained withCoomassie Brilliant Blue and afterwards with a silver stain kit (Bio-Rad, Veenendaal,The Netherlands) to increase sensitivity. A low range molecular weight standard (Bio-Rad) was used for determination of the molecular weight.
Enzymatic activityLysozyme enzymatic activity was determined by using a bacteriolysis assay based onthe decrease in optical dispersion at 450 nm of a M. luteus suspension (12). Enzymaticactivity is expressed as a percentage of activity of reference lysozyme solution.
RESULTS
Analysis of the dried formulationsThe water contents of the freeze-dried cakes and the powders obtained by SCF dryingwere comparable (Table I). SEM was used to evaluate particle morphology and size inSCF dried formulations. As can be seen from Figure 2 the particle morphology wasdependent on the formulation composition. For the unformulated proteins, particlemorphology was protein dependent. SEM pictures show for myoglobin particlesreminding of collapsed capsules and varying in size between 1-20 μm. Lysozymeparticles formed were diverse in shape and size, with small primary particles (mostly< 1 μm) that were agglomerated in bigger clusters (up to ~ 20 μm), which have beenreported earlier for SCF dried lysozyme (7). For the formulated proteins, particlemorphology was primarily dependent on the excipients. Whereas trehaloseformulations consisted mainly of smooth, spherical particles with a size range of 1-20μm, sucrose formulations consisted of agglomerated structures. A similar morphologywas seen when pure sugars were SCF dried. Figure 2 shows representative SEMpictures for each sugar.DSC thermograms of SCF dried formulations are shown in Figure 3. DSC scans ofamorphous sugars (freeze-dried) and crystalline sugars (as received) are shown forcomparison. For all samples conventional DSC and MDSC scans were performed.MDSC scanning confirmed the presence of a Tg by distinguishing it as reversibleevent.In Figure 3a conventional DSC thermograms of SCF dried lysozyme-sucroseformulation, amorphous sucrose and crystalline sucrose are shown. The DSCthermogram of the SCF dried lysozyme-sucrose formulation shows only a melting

chapter 3
60
peak and no Tg, and is similar to the thermogram obtained with crystalline sucrose,indicating that the SCF sucrose formulation is also crystalline. MDSC gave the sameresults.
Figure 2. SEM pictures of SCF dried myoglobin (left upper panel) and lysozyme (right upper panel),trehalose-containing (left middle panel) and sucrose-containing protein formulation (right middle panel),and pure SCF dried trehalose (left lower panel) and sucrose (right lower panel).

Supercritical fluid drying of protein formulations
61
(a) (b)
(c)
Figure 3. DSC thermograms:(a). Conventional DSC of sucrose samples: SCF dried lysozyme-sucrose formulation (solid line);amorphous, freeze-dried sucrose (dotted line); crystalline sucrose (dashed line).(b). MDSC of trehalose samples (total scans): SCF dried lysozyme-trehalose formulation (solid line);amorphous, freeze-dried trehalose (dotted line); crystalline trehalose dihydrate (dashed line). Insetrepresents the enlargement of the Tg area of amorphous trehalose.(c). MDSC of SCF dried lysozyme-trehalose formulation (split thermal events): total scan (solid line);non-reversing heat flow events (dashed line); reversing heat flow events (dotted line).Direction of thetotal heat flow (y-axes) resembles the direction of exothermic events. The y-axis scale is arbitrary and itsmagnitude differs for the various thermograms. Each thermogram is a representative example of 2 DSCruns.
Figure 3b shows MDSC thermograms (total scans) of SCF dried lysozyme-trehaloseformulation, amorphous trehalose and crystalline trehalose dihydrate (amorphous andcrystalline properties of the references were checked with XRPD). The MDSCthermogram of the SCF dried lysozyme-trehalose formulation shows the presence of aTg (ca. 36 °C), directly followed by so-called enthalpic relaxation (16), and anexothermic peak at ca. 70 °C representing crystallization of amorphous trehalose.
chapter 3
62
However, the DSC scans of SCF dried lysozyme-trehalose formulations differ fromthose of amorphous trehalose for the presence of an endothermic event around 100 °C,beyond the exothermic crystallization peak (ca. 70 °C). A similar endothermic event isalso observed for crystalline trehalose dihydrate, suggesting the formation of trehalosedihydrate in the SCF dried lysozyme-trehalose formulation at ca. 70 °C andsubsequent dehydration during the DSC run (Figure 3b). In Figure 3c the total MDSCscan of SCF dried lysozyme-trehalose is split to analyze reversing and non-reversingevents. Indeed, the reversing scan confirms the presence of a Tg, and thus anamorphous phase in this sample.Myoglobin showed DSC results comparable to those of lysozyme with both sugars(data not shown), indicating that the sugar rather than the protein dictates the physicalcharacteristics of the SCF dried powders, as expected.Furthermore, DSC thermograms of freeze-dried formulations (for both proteins andboth sugars) were similar in shape to DSC thermograms of amorphous sucrose andtrehalose references shown in Figure 3a and 3b.XRPD measurements were used to support the DSC data (Figure 4). In Figure 4a, thediffraction pattern of sucrose formulations of myoglobin and lysozyme are presented.For comparison, the XRPD patterns of amorphous and crystalline sucrose are shownas well. The results indicate that the SCF dried protein-sucrose formulations werecrystalline. This was also true for pure SCF dried sucrose (results not shown). InFigure 4b the XRPD scans of myoglobin-trehalose and lysozyme-trehaloseformulations, and amorphous and crystalline trehalose (dihydrate) are shown. InXRPD scans of the SCF dried trehalose formulations of both proteins no peakresembling the crystalline phase is observed, confirming the amorphous character ofthese formulations.Overall, the above results show that SCF dried formulations and freeze-driedformulations, although containing comparable water contents (see Table I), hadsubstantially different physical properties. All freeze-dried formulations resulted inamorphous cakes. Although the SCF dried protein-trehalose formulations were alsoamorphous, their Tg (ca. 36 °C) was much lower as compared to their freeze-driedcounterparts (Tg ca. 70 °C). SCF dried protein-sucrose formulations were notamorphous but crystalline.

Supercritical fluid drying of protein formulations
63
Analysis of reconstituted proteinsIn this section, results of reconstituted SCF dried formulations are presented. Freeze-dried results are only scarcely discussed, when necessary for the comparison with SCFdried formulations. Reconstitution of lysozyme powder formulations was almostcomplete, resulting in less than 6 % undissolved material (see Table I). The amount ofundissolved myoglobin was substantially higher: more than 35 % of the unformulatedSCF dried myoglobin remained undissolved; in the presence of sucrose or trehalosestill ca. 8-12 % remained undissolved (Table I). Freeze-dried formulations could becompletely reconstituted (Table I). For the SCF dried formulations, undissolvedprotein was removed from the reconstituted powders by centrifugation and thesupernatants were used for further analysis.The enzymatic activity of SCF dried unformulated lysozyme and lysozyme formulatedwith sugars was fully preserved (Table I).UV spectra of redissolved lysozyme formulations were similar to that of lysozymesolution before drying (not shown). Myoglobin has two characteristic peaks when it isanalyzed by UV/VIS spectroscopy (Figure 5). One peak is a typical protein absorptionpeak (280 nm) and the other, the so-called Soret band (409 nm), results frominteractions of the heme with the heme pocket of myoglobin. The position andintensity of the Soret band as well the absorbance ratio A409nm/A280nm can be used for
Figure 4a Figure 4b
Figure 4. XRPD scans:(a). XRPD patterns of sucrose samples (from the bottom to the top): freeze-dried sucrose (dotted line),SCF dried myoglobin-sucrose formulation (solid line); SCF dried lysozyme-sucrose formulation (dashedline); crystalline sucrose (dashed-dotted line).(b). XRPD patterns of trehalose samples (from the bottom to the top): freeze-dried trehalose (dottedline), SCF dried myoglobin-trehalose formulation (solid line); SCF dried lysozyme-trehaloseformulation (dashed line); crystalline trehalose dihydrate (dashed-dotted line).

chapter 3
64
overall estimation of the myoglobin structure and heme environment changes (13, 17,18). The reported A409nm/A280nm ratio is about 4-5 for different species of myoglobin(17-19). We compared the A409nm/A280nm ratio of SCF dried myoglobin formulationswith that of reference myoglobin (Table I). The presented values in Table 1 and theappearance of the UV/VIS spectra (Figure 5) indicate that SCF drying did not inducemajor conformational changes. Rather, small differences in the spectra as compared toreference myoglobin suggest that some minor changes in myoglobin structure and/orin protein-heme interactions may have occurred.
250 350 450 550 650 7500.0
0.5
1.0
1.5
2.0
Wavelength (nm)
Abs
orba
nce
Figure 5. UV/VIS absorption spectra of SCF dried myoglobin formulations: Myoglobin reference (solidline); SCF dried unformulated myoglobin (dashed line); SCF dried myoglobin-sucrose formulation(dotted line), SCF dried myoglobin-trehalose formulation (dashed-dotted line). The spectrum ofunformulated myoglobin shows a lower intensity because a substantial fraction of undissolved materialwas removed from the supernatant (Table I).
Far-UV and near-UV/VIS CD spectroscopy were used for monitoring the secondaryand tertiary structure, respectively, of the proteins. No changes in CD spectra in thefar-UV and near-UV region were observed for the SCF dried lysozyme formulationsas compared to the reference lysozyme solution (data not shown). For myoglobin,none of the formulations showed changes in secondary structure according to far-UVCD (data not shown). However, in the near-UV and in the Soret regions, the CDspectra showed differences in peak intensity between reference myoglobin and SCFdried myoglobin formulations (Figure 6). For all dried formulations the intensity ofthe Soret CD band had decreased. Unformulated myoglobin and myoglobin-sucroseformulation showed comparable spectral intensities, whereas the trehalose formulationshowed the most significant decrease in intensity. These results support ourconclusions based on UV/VIS spectroscopy, i.e. SCF dried myoglobin shows small

Supercritical fluid drying of protein formulations
65
but significant differences in the tertiary structure or in protein-heme interactions,especially for the myoglobin-trehalose formulation.
300 350 400 450
-0.1
0.0
0.1
0.2
0.3
Wavelength (nm)
Δ m
ol. e
xtin
ctio
n
Figure 6. CD spectra of SCF dried myoglobin formulations (near-UV and Soret region):Myoglobin reference (solid line); SCF dried unformulated myoglobin (dashed line); SCF driedmyoglobin-sucrose formulation (dotted line), SCF dried myoglobin-trehalose formulation (dashed-dotted line).
In native myoglobin tryptophan fluorescence is quenched by the heme, which resultsin a low emission intensity (20). This is consistent with reference myoglobin, whichshowed weak fluorescence (Figure 7). As can be seen from Figure 7, all SCF driedformulations showed an increase in fluorescence intensity, indicating changes in theheme-protein interaction (13). Unformulated myoglobin and the sucrose formulationshowed a similar intensity increase; the most significant increase was observed for the
Figure 7. Normalized fluorescence emission spectra of SCF dried myoglobin formulations:Myoglobin reference (solid line); SCF dried unformulated myoglobin (dashed line); SCF driedmyoglobin-sucrose formulation (dotted line), SCF dried myoglobin-trehalose formulation (dashed-dotted line).
310 360 410Wavelength (nm)
Rel
ativ
e in
tens
ity

chapter 3
66
trehalose formulation. On the other hand, all freeze-dried formulations showed spectracomparable to those of the reference (non-dried) myoglobin; (data not shown). SDS-PAGE of reconstituted solutions showed for all SCF dried protein formulationssimilarity in band position, consistent with monomeric protein, when compared to thereference protein. No new bands where observed in SCF dried lysozyme andmyoglobin formulations on gels run under reducing or non-reducing conditions (datanot shown), indicating the absence of covalent aggregates.
DISCUSSION
In this study we have investigated the capabilities of sucrose and trehalose to preservethe structure of lysozyme and myoglobin during a SCF drying process, in comparisonwith an established freeze-drying process. Differences were observed between theSCF and freeze-dried formulations, as well as between the stabilizing effect of sucroseand trehalose in SCF dried formulations. Besides the observation that in SCF driedmaterial the protein was partly aggregated (see Table I), the bioactivity ofreconstituted lysozyme was fully preserved and no changes in the structure wereobserved by CD and fluorescence spectroscopy. For myoglobin, far-UV CD spectraindicated preservation of the secondary structure. However, some changes in thetertiary structure of myoglobin occurred, as noticed by a decrease in CD signal in thenear-UV and the Soret region and an increase in tryptophan fluorescence for all SCFdried myoglobin formulations. These results probably reflect changes at the level ofheme-myoglobin interactions (13, 17-20) rather than a gross change in myoglobinconformation.
The stabilization of myoglobin as indicated by the selected formulation parameterswas not fully achieved in SCF dried formulations, whereas the selected sugars andprotein-to-sugar ratio were sufficient for the stabilization of myoglobin in freeze-drying. Still, the presence of sugars improved the recovery of SCF dried myoglobin(Table I), although the difference in concentration between formulated andunformulated myoglobin might also play a role. From the existing knowledge fromother drying techniques it can be expected that the presence of stabilizers such ascertain sugars is necessary for successful drying and storage stability of the driedproteins (1, 21, 22). Remarkably, the sugars used in the present study, sucrose andtrehalose, had a strong impact on the particle morphology (Figure 2), and showeddistinct physical characteristics. Whereas both sucrose and trehalose were amorphouswhen freeze- or spray-dried, the sucrose formulations showed crystalline

Supercritical fluid drying of protein formulations
67
characteristics after SCF drying (Figure 3a and Figure 4a). On the other hand, thetrehalose formulations showed XRPD patterns similar to amorphous rather thancrystalline trehalose (Figure 4b). The DSC thermograms of these formulations showthe presence of a Tg and a subsequent crystallization peak upon heating (Figure 3b).This is comparable with the thermogram of freeze-dried, amorphous trehalose.However, the presence of an endothermic peak (ca. 100 °C) just after thecrystallization peak is comparable with the broad endothermic event (ca. 70-120 °C)seen with crystalline trehalose dihydrate (Figure 3b).This endothermic event has been interpreted differently by several authors (16, 23, 24)but always attributed to the presence of trehalose dihydrate. This endothermic peakwas reported for amorphous trehalose as a consequence of crystallization, but onlywhen the water content was higher than 6 % (24). In our case the amorphous trehaloseformulations measured by DSC had water contents between 2.5-4.0 %. However, theTg (ca. 36 °C, Figure 3c) of the trehalose formulations was much lower than would beexpected from the water content (15, 24). Moreover the freeze-dried trehaloseformulations with comparable water content (Table I) gave higher Tg values (ca. 70°C). Thus, the endothermic peak and the low Tg could be characteristics of a wetamorphous phase (>6 % residual water). As the trehalose formulations had a loweroverall water content (< 4.0 %), the low Tg might be due to an inhomogeneous waterdistribution through the dried sample. This could lead to high local waterconcentrations in some parts of the dried powder, which may consequently lead to thecrystallization observed during DSC. Another possibility is that trehalose was notcompletely amorphous from the beginning (i.e., in the freshly dried powder) andcontained some crystal nuclei, which could not be detected by X-ray diffraction (25).Such crystalline nuclei may act as starting points for the crystallization observed inDSC.Interestingly, the highest extent of the alterations of the myoglobin structure wasobserved for the trehalose formulation, whereas crystalline sucrose was lessdetrimental. It could be that the sucrose formulation, although crystalline, is a stablesystem, whereas the trehalose forms a heterogeneous system, locally differing in watercontent and/or the presence of crystalline phases. This could also make trehalose anunstable matrix and changes of the formulation matrix in time could influence theprotein conformation (21, 26).In summary, this study showed the possibility to produce dry protein-sugarformulations by SCF drying with preserved gross structure of lysozyme andmyoglobin. However, there are some important issues to be addressed. First of all, thepercentage of undissolved protein is still high when compared to freeze-drying (Table I).

chapter 3
68
Considering the differences between the recovery of lysozyme and myoglobin,formulation and process parameters probably have to be optimized for each protein ona case by case basis. Also, long-term stability studies are necessary to estimate thestorage stability of SCF dried protein formulations. We showed distinct physicalpowder properties and stabilizing effects on the protein conformation when differentsugars were used in SCF drying. Furthermore, the physical properties of SCF driedsucrose and trehalose formulations substantially differed from those of the samefreeze-dried formulations, which remained amorphous and showed full preservation ofprotein conformation. Clearly, the drying principles of freeze-drying and SCF dryingare completely different. In freeze-drying the properties of the frozen solution have alarge influence on the properties of the final dried product. In SCF drying the freezingstep is bypassed, but factors like mixing and mass transport rates, droplet size,composition of the SCF, etc. can play a crucial role in the drying kinetics and thephysical properties of the dried product. Therefore, further optimization offormulation (e.g., protein-to-stabilizer ratio, selection of stabilizers) and process (e.g.,flow rate, selection of the nozzle type) parameters is necessary, which will beaddressed in follow-up papers. The acquired insights in this study can be used tooptimize the SCF drying process, in conjunction with rational formulation design, forthe stabilization of protein pharmaceuticals.

Supercritical fluid drying of protein formulations
69
REFERENCES
1. J. F. Carpenter and M. C. Manning. Rational Design of Stable ProteinFormulations, Theory and Practice, Kluwer Academic/Plenum Publishers,2002.
2. D. J. A. Crommelin and R. D. Sindelar. Pharmaceutical Biotechnology, AnIntroduction for Pharmacists and Pharmaceutical Scientists, Taylor andFrancis, London, 2002.
3. M. C. Manning, K. Patel, and R. T. Borchardt. Stability of proteinpharmaceuticals. Pharm Res. 6: 903-918 (1989).
4. M. J. Pikal. Freeze-drying of proteins, Part I: Process design. BioPharm. 3 (8):18-27 (1990).
5. M. J. Pikal. Freeze-drying of proteins, Part II: Formulation selection. BioPharm.3 (9): 26-30 (1990).
6. N. Jovanovic, A. Bouchard, G. W. Hofland, G. J. Witkamp, D. J. Crommelin,and W. Jiskoot. Stabilization of proteins in dry powder formulations usingsupercritical fluid technology. Pharm Res. 21: 1955-1969 (2004).
7. A. Bouchard, N. Jovanovic, G. W. Hofland, D. J. A. Crommelin, W. Jiskoot, andG. J. Witkamp. Nozzle Selection And Optimisation Of Process Conditions ForThe Supercritical-Drying Of Lysozyme, 9th Meeting on supercritical fluids,Trieste, Italy, 2004.
8. D. P. Nesta, J. S. Elliott, and J. P. Warr. Supercritical fluid precipitation ofrecombinant human immunoglobulin from aqueous solutions. BiotechnolBioeng. 67: 457-464 (2000).
9. M. Gentile, C. Di Palma, and M. C. Cesta. Supercritical fluids processing inpreparation of protein microparticles and their stabilization, PCT Int. Appl.,(Dompe S.P.A., Italy). Wo, 2003, pp. 40 pp.
10. H. Todo, K. Lida, H. Okamoto, and K. Danjo. Improvement of insulinabsorption from intratracheally administrated dry powder prepared bysupercritical carbon dioxide process. J Pharm Sci. 92: 2475-2486 (2003).
11. S. P. Sellers, G. S. Clark, R. E. Sievers, and J. F. Carpenter. Dry powders ofstable protein formulations from aqueous solutions prepared using supercriticalCO2-assisted aerosolization. J Pharm Sci. 90: 785-797 (2001).
12. M. van de Weert, J. Hoechstetter, W. E. Hennink, and D. J. Crommelin. Theeffect of a water/organic solvent interface on the structural stability oflysozyme. J Control Release. 68: 351-359 (2000).

chapter 3
70
13. L. Tofani, A. Feis, R. E. Snoke, D. Berti, P. Baglioni, and G. Smulevich.Spectroscopic and interfacial properties of myoglobin/surfactant complexes.Biophys J. 87: 1186-1195 (2004).
14. G. L. Peterson. A simplification of the protein assay method of Lowry et al.which is more generally applicable. Anal Biochem. 83: 346-356 (1977).
15. A. Saleki-Gerhardt and G. Zografi. Non-isothermal and isothermalcrystallization of sucrose from the amorphous state. Pharm Res. 11: 1166-1173(1994).
16. R. Surana, A. Pyne, and R. Suryanarayanan. Effect of preparation method onphysical properties of amorphous trehalose. Pharm Res. 21: 1167-1176 (2004).
17. N. A. Nicola, E. Minasian, C. A. Appleby, and S. J. Leach. Circular dichroismstudies of myoglobin and leghemoglobin. Biochemistry. 14: 5141-5149 (1975).
18. D. Puett. The equilibrium unfolding paramters of horse and sperm whalemyoglobin. J Biol Chem. 248: 4623-4634 (1973).
19. G. McLendon and P. Murphy. Metal electronic effect on myoglobinconformational stability. J Biol Chem. 255: 4035-4039 (1980).
20. Y. Kawamura-Konishi, H. Kihara, and H. Suzuki. Reconstitution of myoglobinfrom apoprotein and heme, monitored by stopped-flow absorption, fluorescenceand circular dichroism. Eur J Biochem. 170: 589-595 (1988).
21. W. Wang. Lyophilization and development of solid protein pharmaceuticals. IntJ Pharm. 203: 1-60 (2000).
22. K. Imamura, T. Ogawa, T. Sakiyama, and K. Nakanishi. Effects of types ofsugar on the stabilization of protein in the dried state. J Pharm Sci. 92: 266-274(2003).
23. L. S. Taylor and P. York. Characterization of the phase transitions of trehalosedihydrate on heating and subsequent dehydration. J Pharm Sci. 87: 347-355(1998).
24. O. S. McGarvey, V. L. Kett, and Q. M. Craig. An investigation into thecrystallization of a,a-trehalose from the amorphous state. J. Phys. Chem. B. 107:6614-6620 (2003).
25. V. K. Sharma and D. S. Kalonia. Effect of vacuum drying on protein-mannitolinteractions: the physical state of mannitol and protein structure in the driedstate. AAPS PharmSciTech. 5: 1-12 (2004).
26. S. D. Allison, M. C. Manning, T. W. Randolph, K. Middleton, A. Davis, and J.F. Carpenter. Optimization of storage stability of lyophilized actin usingcombinations of disaccharides and dextran. J Pharm Sci. 89: 199-214 (2000).


![Trehalose 6-Phosphate Regulates Photosynthesis and · Trehalose 6-Phosphate Regulates Photosynthesis and Assimilate Partitioning in Reproductive Tissue1[OPEN] Maria Oszvald,a Lucia](https://img.dokumen.tips/doc/110x75/611f5cf3b1f8956e674d52f9/trehalose-6-phosphate-regulates-photosynthesis-trehalose-6-phosphate-regulates-photosynthesis.jpg)


![The Role of Trehalose 6-Phosphate in Crop Yield and … · 2020. 5. 18. · Update on Trehalose 6-Phosphate Signaling The Role of Trehalose 6-Phosphate in Crop Yield and Resilience1[OPEN]](https://img.dokumen.tips/doc/110x75/60a94aac2e9d0b10d12c4d11/the-role-of-trehalose-6-phosphate-in-crop-yield-and-2020-5-18-update-on-trehalose.jpg)