Embed Size (px)
Citation preview

May 25, 2006 14:22 WSPC/Trim Size: 11in x 8.5in for Proceedings csb˙huan
1
DISTANCE-BASED IDENTIFICATION OF STRUCTURE MOTIFS IN PROTEINS USINGCONSTRAINED FREQUENT SUBGRAPH MINING
Jun Huan1, Deepak Bandyopadhyay1 , Jan Prins1,
Jack Snoeyink1, Alexander Tropsha2 , Wei Wang1
1Computer Science Department2The Laboratory for Molecular Modeling, School of Pharmacy
University of North Carolina at Chapel HillEmail :1{huan, debug, prins, snoeyink, weiwang}@cs.unc.edu, [email protected]
Structure motifs are amino acid packing patterns that occur frequently within a set of protein structures. We define a labeled graphrepresentation of protein structure in which vertices correspond to amino acid residues and edges connect pairs of residues and arelabeled by (1) the Euclidian distance between the Cα atoms of the two residues and (2) a boolean indicating whether the two residuesare in physical/chemical contact. Using this representation, a structure motif corresponds to a labeled clique that occurs frequentlyamong the graphs representing the protein structures. The pairwise distance constraints on each edge in a clique serve to limit thevariation in geometry among different occurrences of a structure motif. We present an efficient constrained subgraph mining algorithmto discover structure motifs in this setting. Compared with contact graph representations, the number of spurious structure motifs isgreatly reduced.
Using this algorithm, structure motifs were located for several SCOP families including the Eukaryotic Serine Proteases, NuclearBinding Domains, Papain-like Cysteine Proteases, and FAD/NAD-linked Reductases. For each family, we typically obtain a handfulof motifs within seconds of processing time. The occurrences of these motifs throughout the PDB were strongly associated with theoriginal SCOP family, as measured using a hyper-geometric distribution. The motifs were found to cover functionally important siteslike the catalytic triad for Serine Proteases and co-factor binding sites for Nuclear Binding Domains. The fact that many motifs arehighly family-specific can be used to classify new proteins or to provide functional annotation in Structural Genomics Projects.
Keywords: protein structure comparison, structure motif, graph mining, clique
1. INTRODUCTION
This paper studies the following structural comparisonproblem: given a set G of three dimensional (3D) proteinstructures, identify all structure motifs that occur withsufficient frequency among the proteins in G. Our study ismotivated by the large number of (> 35, 000) 3D proteinstructures stored in public repositories such as the Pro-tein Data Bank (PDB, 4). The recent Structural Genomicsprojects 28 aim to generate many new protein structuresin a high-throughput fashion, which may further increasethe available protein structures significantly. With fastgrowing structure data, automatic and effective knowl-edge discovery tools are needed to gain insights from theavailable structure data in order to generate testable hy-potheses about the functional role of proteins and the evo-lutionary relationship among proteins.
Our study is also motivated by the complex rela-tionship between protein structure and protein function8. It is well known that global structure similarity doesnot necessarily imply similar function. For example, theTIM barrels are a large group of proteins with remark-ably similar global structures, yet widely varying func-tions 23. Conversely, similar function does not necessar-
ily imply similar global structure: the most versatile en-zymes, hydro-lyases and the O-glycosyl glucosidases, areassociated with 7 different global structural families 11.Many globally dissimilar structures show convergent evo-lution of biological function. Because of the puzzling re-lationship between global protein structure and function,recent research effort in protein structure comparison hasshifted to identifying local structural features (referred toas structure motifs) responsible for biological functionsincluding protein-protein interaction, ligand binding, andcatalysis 3, 5, 30–33. A recent review of methods and ap-plications involved in protein structure motif identifica-tion can be found in 19.
Using a graph representation of proteins, we formal-ize the structure motif identification problem as a fre-quent clique mining problem in a set of graphs G andpresent a novel constrained clique mining algorithm toobtain recurring cliques from G that satisfy certain ad-ditional constraints. The constraints are encoded inthe graph representation of protein structure as pair-wise amino acid residue distances, pair-wise amino acidresidue interactions, and the physical/chemical propertiesof the amino acid residues and their interactions in a pro-tein structure.

May 25, 2006 14:22 WSPC/Trim Size: 11in x 8.5in for Proceedings csb˙huan
2
Compared to other methods, our method offers thefollowing advantages. First, our method is efficient. Itusually takes only a few seconds to process a group ofproteins of moderate size (ca. 30 proteins), which makesit suitable for processing protein families defined by var-ious classifications such as SCOP or EC (Enzyme Com-mission). Second, our results are specific. As we showin our experimental study section, by requiring structuremotifs to recur among a group of proteins, rather than injust two proteins, we significantly reduce spurious pat-terns without losing structure motifs that have clear bio-logical relevance. With a quantitative definition of sig-nificance based on the hyper-geometric distribution, wefind that the structure motifs we identify are specificallyassociated with the original family. This association maysignificantly improve the accuracy of feature-based func-tional annotation of structures from structural genomicsprojects.
The rest of this paper is organized as follows. InSection 1.1, we review recent progress in discoveringprotein structure motifs. In Section 2, we review def-initions related to graphs and introduce the constrainedsubgraph mining problem. In Section 3, we discuss ourgraph representation of proteins structures. In Section4, we present a detailed description of our method. Wealso include a practical implementation of the algorithmthat supports the experimental study in Section 5. Fi-nally, Section 6 concludes with a brief discussion of fu-ture work.
1.1. Related work
There is an extensive body of literature on comparing andclassifying proteins using multiple sequence or structurealignment, such as VAST 9 and DALI 12. Here we fo-cus on the recent algorithmic techniques for discoveringstructure motifs from protein structures. The methods canbe classified into the following five types:
• Depth-first search, starting from simple geomet-ric patterns such as triangles, progressively find-ing larger patterns 5, 25, 30.
• Geometric hashing, originally developed incomputer vision, applied pairwise betweenprotein structures to identify structure mo-tifs 3, 24, 35.
• String pattern matching methods that encode thelocal structure and sequence information of a
protein as a string, and apply string search al-gorithms to derive motifs 17, 18, 32.
• Delaunay tessellation (DT) 6, 20, 33 partition-ing the structure into an aggregate of non-overlapping, irregular tetrahedra thus identify-ing all unique nearest neighbor residue quadru-plets for any protein 33.
• Graph matching methods comparing proteinstructures modeled as graphs and discoveringstructure motifs by finding recurring subgraphs1, 10, 14, 22, 29, 31, 38.
Geometric hashing 21 and graph matching 38 meth-ods have been extended for inferring recurring structuremotifs from multiple structures, but both methods haveexponential running time in the number of structures in adata set.
2. CONSTRAINED FREQUENT CLIQUEMINING
2.1. Labeled graphs
We define a labeled graph G as a four-element tupleG = (V,E,Σ, λ) where V is a set of vertices or nodesand E ⊆ V × V is a set of undirected edges. Σ is a setof (disjoint) vertex and edge labels, and λ: V ∪ E → Σ
is a function that assigns labels to vertices and edges. Weassume that a total ordering is defined on the labels in Σ.
p2 p5
a
b
b d
y
y
y
y
x
(P)
p1
p3p4
c
a
b
b
y
yx
(Q)
q1
q3
q2
a
b
b
y
x
(S)
s1
s3
s2
p2 p5
a
b
b d
y
y
y
y
x
(P)
p1
p3p4
cp2 p5
a
b
b d
y
y
y
y
x
(P)
p1
p3p4
c
a
b
b
y
yx
(Q)
q1
q3
q2
a
b
b
y
x
(S)
s1
s3
s2
Fig. 1. Database G of three labeled graphs. The mapping (isomorphism)q1 → p2 , q2 → p1, and q3 → p3 demonstrates that clique Q is isomorphicto a subgraph of P and so we say that Q occurs in P . Set {p1, p2, p3} is anembedding of Q in P . Similarly, graph S (non-clique) occurs in both graph Pand graphQ.
G′ = (V ′, E′) is a subgraph of G, denoted by G′ ⊆
G, if vertices V ′ ⊆ V , and edges E ′ ⊆ (E ∩ (V ′ × V ′)),i.e. E′ is a subset of the edges of G that join vertices inV ′.
2.2. Constraints on structure motifs
A constraint in our discussion is a function that assignsa boolean value to a subgraph such that true implies that

May 25, 2006 14:22 WSPC/Trim Size: 11in x 8.5in for Proceedings csb˙huan
3
the subgraph has some desired property and false indi-cates otherwise. For example, the following statement“each amino acid residue in a structure motif must havea solvent accessible surface of sufficient size” is a con-straint. This constraint selects only those structure motifsthat are close to the surface of proteins. The task of for-mulating the right constraint(s) is left for domain experts.As part of our computational concern, we answer the fol-lowing two questions: (1) what types of constraints canbe efficiently incorporated into a subgraph mining algo-rithm and (2) how to incorporate a constraint if it can beefficiently incorporated. The answer to the two questionsis the major contribution of this paper and is discussed indetails in Section 4.
2.3. Graph matching
A fundamental part of our constrained subgraph miningmethod is to find an occurrence of a graph H within an-other graph G. To make this more precise, we say thatgraph H occurs in G if we can find an isomorphism be-tween graph H = (VH , EH ,Σ, λH ) and some subgraphof G = (VG, EG,Σ, λG). An isomorphism from H tothe subgraph of G defined by vertices V ⊆ VG is a 1-1 mapping between vertices f : VH → V that preservesedges and edge/node labels. The set V is an embeddingof H in G. This definition is illustrated in Figure 1.
In this paper, we restrict ourselves to matchingcliques, i.e. fully connected subgraphs. For example, thegraphQ in Figure 1 is a clique since each pair of (distinct)nodes is connected by an edge inQwhile S is not. In pro-tein structure graphs, a clique corresponds to a structuremotif with all pairwise inter-residue distances specified.
2.4. The constrained frequent cliquemining problem
Given a set of graphs, or a graph database G, we de-fine the support of a clique C, denoted by s(C), as thefraction of graphs in G in which C occurs. We choosea support threshold 0 < σ ≤ 1, and define C to be fre-quent if it occurs in at least fraction σ of the graphs in G.Note that while C may occur many times within a singlegraph, for the purpose of measuring support, these countas only one occurrence. Given a constraint ρ, the problemof Constrained Frequent Clique Mining is to identify allfrequent cliquesC in a graph database G such that ρ(C) istrue. Figure 2 shows all cliques (without any constraint)
which appear in at least two graphs in the graph databaseshown in Figure 1. If we use support threshold σ = 2/3
without any constraint, all six cliques will be reportedto users. If we increase σ to 3/3, only cliques A1, A2,A3, and A4 will be reported. If we use support thresh-old σ = 2/3 and the constraint that each clique shouldcontains at least one node with label “a”, the constrainedfrequent cliques are A1, A3, A4, and A6.
a b a bx ya bya b a
b
b
y
yx
a
b
b
y
yx
(A1) (A2) (A3) (A4) (A5)
yb byb b
(A6)
Fig. 2. All (non-empty) frequent cliques with support ≥ 2/3 in G from Figure1. The actual support values are: (3/3, 3/3, 3/3, 3/3, 2/3, 2/3) for cliques from A1
to A6.
3. HYBRID GRAPH REPRESENTATIONOF PROTEIN STRUCTURES
3.1. Graph representation overview
We model a protein structure as a labeled undirectedgraph by incorporating pairwise amino acid residue dis-tances and contact relation in the following way. Thenodes of our protein graphs represent the Cα atoms ofeach amino acid residue. We create edges connectingeach and every pair of (distinct) residues, labeled by twotypes of information: (1) The Euclidian distance betweenthe two related Cα atoms and (2) A boolean indicateswhether the two residues have physical/chemical contact.More precisely, a protein in our study is a labeled graphP = (V,E,Σ, λ) where
• V is a set of nodes that represents the set ofamino acid residues in the protein
• E = V × V - (u, u) for all u ∈ V
• Σ = ΣV ∪ ΣE is the set of disjoint node labels(ΣV ) and edge labels (ΣE)
• ΣV is the set of 20 amino acid types• ΣE = R
+ × {true, false} where R+ is the set
of positive real numbers• λ assigns labels to nodes and edges.
Our graph representation can be viewed as a hybridof two popular representation of proteins: that of distancematrix representation 8 and that of contact map represen-tation 13.

May 25, 2006 14:22 WSPC/Trim Size: 11in x 8.5in for Proceedings csb˙huan
4
In practice we are not concerned with interactionsover long distances (say > 13 A), so proteins need not berepresented by complete graphs. Since each amino acidoccupies a real volume, the number of edges per vertexin the graph representation can be bounded by a smallconstant.
The graph representation presented here is similar tothose used by other groups 25, 38. The major differenceis that in our representation, geometric constraints are inthe form of pairwise distance constraints and are embed-ded into the graph representation to model geometricallyconserved patterns. The absence of geometric constraintscan lead to many spurious matches as noticed in 25, 38.Another difference is that we explicitly specify the “con-tact” relation. The contact relation enables us to incorpo-rate various constraints into the subsequent graph miningprocess and further reduce irrelevant patterns.
In the following, we discuss how to discretize dis-tances into distance bins, which is important for our struc-ture motif identification algorithm.
Fig. 3. Mapping distances l to bins. The unit is A.
3.2. Distance discretization
To map continuous distances to discrete values, we dis-cretize distances into bins. The width of such bins is com-monly referred to as the distance tolerance, and popularchoices are 1 A 22, 1.5 A 5, and 2 A 26. In our system, wechoose the median number 1.5 A as shown in Figure 3,which empirically delivers patterns with good geometricconservation.
4. THE CONSTRAINED CLIQUEMINING ALGORITHM
In this section, we present a detailed discussion on (1)what types of constraints can be incorporated efficientlyinto a subgraph mining algorithm and (2) how to incor-porate them.
Our strategy relies on designing graph normalizationfunctions that map cliques to one dimensional sequences
of labels. A graph normalization function is a 1-1 map-ping N such that N (G) = N (G′) if and only if G = G′.In other words, a graph normalization function alwaysassigns a unique string to each unique graph. The stringN (G) is the canonical code (code in short) of the graphG with respect to the function N .
Many graph normalization functions have a very de-sirable property: prefix-preservation. A graph normaliza-tion function is prefix-preserving if for every graph G,there always exists a subgraph G′ ⊂ G such that thecode of G′ is a prefix of the code of G. Examples ofprefix-preserving graph normalization functions includethe DFS code 39 and the CAM code 15. As we prove inTheorem 4.8, with a generic depth first search algorithm,a prefix-preserving graph normalization function guaran-tees that no frequent constrained patterns can be missed.The design challenge here is to construct a graph normal-ization function that is prefix-preserving in the presenceof constraints.
4.1. A synthetic example ofconstraints
The following constraint is our driving example for con-strained clique mining. The constraint states that weshould only report frequent cliques that contain at leastone edge label of “y”. The symbol “y” is selected tomake the constraint works best with the graph examplewe show in Figure 1. Applying this constraint to all thefrequent cliques shown in Figure 2, we find that there areonly three cliques satisfying the constraint, namely A4,A5, and A6. We name this simple constraint an edge la-bel constraint and show a specific graph normalizationfunction that is prefix-preserving for this edge label con-straint. Before we do that, we introduce a normalizationthat does not support any constraints. Our final solutionwill adapt this constraint-unaware graph normalizationfunction.
4.2. A graph normalization functionthat does not support constraints
We use our previous canonical code 15 for graph normal-ization, outlined below for completeness.
Given an n × n adjacency matrix M of a graphG with n nodes, we define the code of M , denotedby code(M), as the sequence of lower triangular en-tries of M (including the node labels as diagonal entries)
May 25, 2006 14:22 WSPC/Trim Size: 11in x 8.5in for Proceedings csb˙huan
5
in the order: M1,1M2,1M2,2...Mn,1Mn,2...Mn,n−1Mn,n
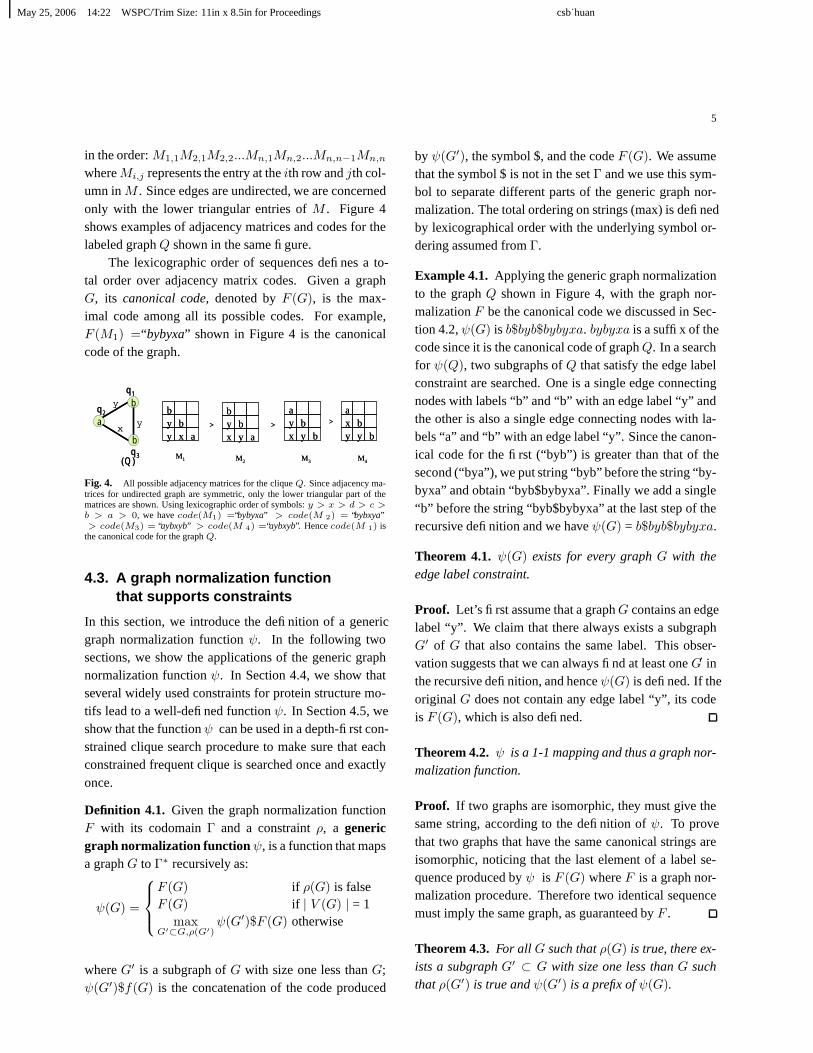
whereMi,j represents the entry at the ith row and jth col-umn in M . Since edges are undirected, we are concernedonly with the lower triangular entries of M . Figure 4shows examples of adjacency matrices and codes for thelabeled graphQ shown in the same figure.
The lexicographic order of sequences defines a to-tal order over adjacency matrix codes. Given a graphG, its canonical code, denoted by F (G), is the max-imal code among all its possible codes. For example,F (M1) =“bybyxa” shown in Figure 4 is the canonicalcode of the graph.
M1
abyxy
b
M2 M3
> >
abyyx
b
bbyyx
a
M4
bbxyy
a>
M1
abyxy
b
M2 M3
> >
abyyx
b
bbyyx
a
M4
bbxyy
a> a
b
b
y
yx
(Q)
q1
q3
q2
a
b
b
y
yx
(Q)
q1
q3
q2
Fig. 4. All possible adjacency matrices for the clique Q. Since adjacency ma-trices for undirected graph are symmetric, only the lower triangular part of thematrices are shown. Using lexicographic order of symbols: y > x > d > c >b > a > 0, we have code(M1) =“bybyxa” > code(M 2) = “bybxya”> code(M3) = “aybxyb” > code(M 4) =“aybxyb”. Hence code(M 1) is
the canonical code for the graph Q.
4.3. A graph normalization functionthat supports constraints
In this section, we introduce the definition of a genericgraph normalization function ψ. In the following twosections, we show the applications of the generic graphnormalization function ψ. In Section 4.4, we show thatseveral widely used constraints for protein structure mo-tifs lead to a well-defined function ψ. In Section 4.5, weshow that the functionψ can be used in a depth-first con-strained clique search procedure to make sure that eachconstrained frequent clique is searched once and exactlyonce.
Definition 4.1. Given the graph normalization functionF with its codomain Γ and a constraint ρ, a genericgraph normalization functionψ, is a function that mapsa graph G to Γ∗ recursively as:
ψ(G) =
F (G) if ρ(G) is falseF (G) if | V (G) | = 1
maxG′⊂G,ρ(G′)
ψ(G′)$F (G) otherwise
where G′ is a subgraph of G with size one less than G;ψ(G′)$f(G) is the concatenation of the code produced
by ψ(G′), the symbol $, and the code F (G). We assumethat the symbol $ is not in the set Γ and we use this sym-bol to separate different parts of the generic graph nor-malization. The total ordering on strings (max) is definedby lexicographical order with the underlying symbol or-dering assumed from Γ.
Example 4.1. Applying the generic graph normalizationto the graph Q shown in Figure 4, with the graph nor-malization F be the canonical code we discussed in Sec-tion 4.2, ψ(G) is b$byb$bybyxa. bybyxa is a suffix of thecode since it is the canonical code of graphQ. In a searchfor ψ(Q), two subgraphs of Q that satisfy the edge labelconstraint are searched. One is a single edge connectingnodes with labels “b” and “b” with an edge label “y” andthe other is also a single edge connecting nodes with la-bels “a” and “b” with an edge label “y”. Since the canon-ical code for the first (“byb”) is greater than that of thesecond (“bya”), we put string “byb” before the string “by-byxa” and obtain “byb$bybyxa”. Finally we add a single“b” before the string “byb$bybyxa” at the last step of therecursive definition and we have ψ(G) = b$byb$bybyxa.
Theorem 4.1. ψ(G) exists for every graph G with theedge label constraint.
Proof. Let’s first assume that a graphG contains an edgelabel “y”. We claim that there always exists a subgraphG′ of G that also contains the same label. This obser-vation suggests that we can always find at least one G′ inthe recursive definition, and hence ψ(G) is defined. If theoriginal G does not contain any edge label “y”, its codeis F (G), which is also defined.
Theorem 4.2. ψ is a 1-1 mapping and thus a graph nor-malization function.
Proof. If two graphs are isomorphic, they must give thesame string, according to the definition of ψ. To provethat two graphs that have the same canonical strings areisomorphic, noticing that the last element of a label se-quence produced by ψ is F (G) where F is a graph nor-malization procedure. Therefore two identical sequencemust imply the same graph, as guaranteed by F .
Theorem 4.3. For all G such that ρ(G) is true, there ex-ists a subgraph G′ ⊂ G with size one less than G suchthat ρ(G′) is true and ψ(G′) is a prefix of ψ(G).

May 25, 2006 14:22 WSPC/Trim Size: 11in x 8.5in for Proceedings csb˙huan
6
Proof. This property is a direct result of the recursivedefinition 4.1.
We notice that in proving Theorems 4.2 and 4.3, wedo not use the definition of the constraint ρ. In otherwords, Theorems 4.2 and 4.3 can be proved as long aswe have Theorem 4.1. Therefore, we have the followingtheorem:
Theorem 4.4. If ψ is defined for every graph with re-spect to a given constraint ρ, ψ is 1-1 and prefixing-preserving.
Proof. This is a direct result of the recursive definition4.1.
4.4. More examples related to proteinstructure motifs
Let’s first view a real-world example of constraint that iswidely used in structure motif discovery. The connectedcomponent constraint (CC constraint for short) assertsthat in a structure motif, each amino acid residue is con-nected to at least another amino acid residue by a contactrelation and that the motif is a connected component withrespect to the contact relation. The intuition of the CCconstraint is that a structure motif should be compact andhence has no isolated amino acid residue. To be formal,the CC constraint is a function cc that assigns value trueto a graph if it is a connected component according to thecontact relation and false otherwise.
As another example, the contact density constraintasserts that the ratio of the number of contacts and the to-tal number of edges in a structure motif should be greaterthan a predefined threshold. Such ratio is referred to asthe contact density (density) of the motif and the con-straint is referred to as the density constraint. The in-tuition of the density constraint is that a structure motifshould be compact and the amino acid residues in the mo-tif should well interact with other. This constraint maybe viewed as a more strict version of the CC constraintwhich only requires a motif to be connected component.Again, to be formal, the density constraint is a function dthat assigns value true to a graph if its contact density isat least some predefined threshold and false otherwise.
It would be an awkward situation if we need to de-fine a new graph normalization procedure for each of theconstraints we discuss above. Fortunately, this is not the
case. In the following discussion, we show that genericgraph normalization function ψ is well defined for thesetwo constraints.
Theorem 4.5. ψ(G) exist for every graphG with respectto the CC constraint or the density constraint.
Proof. We only show the proof of the theorem for theCC constraint and that for the density constraint can beproved similarly. The key observation is for every graphG of size n that is a connected component with respect tothe node contact relation, there exists a subgraphG′ ⊆ G
such that G′ is a connected component according to thesame contact relation. The observation is a well-knownresult from graph theorem and a detail proof can be foundin 15.
Following Theorem 4.4, we have the following theo-rem.
Theorem 4.6. ψ is a 1-1 mapping and prefix-preservingfor the CC constraint or the density constraint.
After working several example constraints, we studythe sufficient and necessary condition such that our graphnormalization function ψ is well defined for a constraintρ. The following theorem formalize the answer.
Theorem 4.7. Given a constraint ρ, ψ(G) exist for everygraphG with respect to the constraint ρ if and only if foreach graphG of size n such that ρ(G) is true, there existsa subgraph G′ ⊂ G of size n− 1 such that ρ(G′) is alsotrue.
Proof. (if) For a graph G such that ρ(G) is true, if thereexists one G′ ⊂ G such that ρ(G′) is also true, by thedefinition of ψ, ψ(G) exists.
(only if) If ψ(G) exists for every graph G with re-spect to a constraint ρ, for a graph G such that ρ(G) istrue, by the definition of ψ, we always have at least oneG′ ⊂ G such that ρ(G′) is also true.
4.5. cliquehashing
We have designed an efficient algorithm identifying fre-quent cliques from a labeled graph database with con-straints, as described below. At the beginning of the algo-rithm we scan a graph database and find all frequent nodetypes (line 1-4, Figure 5). The node types and their occur-rences are kept in a hash table counter. At a subsequentstep, a frequent clique with size n ≥ 1 is picked from the

May 25, 2006 14:22 WSPC/Trim Size: 11in x 8.5in for Proceedings csb˙huan
7
CliqueHashing(G, σ, ρ)begin1. for each node label t ∈ λ(v), v ∈ V [G], G ∈ G do2. counter[t]← counter[t] ∪ {v}3. C ← C ∪ {t}4. end for5. for t ∈ C do6. if( s(t) ≥ σ, ρ(s) is true ) do7. F ← F ∪ backtrack search(t, counter[t])8. end if9. end for10. return Fend
backtrack search(t0,O, ρ)begin1. for each clique h ∈ O do2. O′ ← {f |f = h ∪ v, h ⊂ V [G], v ∈ (V [G]− h)}3. for each occurrence of a clique f ∈ O′ do4. t← ψ(f)5. counter[t]← counter[t] ∪ {f}6. C ← C ∪ {t}6. end for7. end for8. for each t ∈ C do9. if( s(t) ≥ σ, t0 v t, and ρ(t) is true ) do10. F ← F ∪ backtrack search(t, counter[t])11. end if12. end for13. return Fend
Fig. 5. The CliqueHashing algorithm which reports frequent cliques, F , from a group of graphs G with support at least σ and with a constraint ρ. ψ is the graphnormalization function defined in Definition 4.1. x v y if string x is a prefix of string y. s(G) is the support of a graphG.
hash table and is extended to all possible n + 1 cliquesby attaching one additional node to its occurrences in allpossible ways. These newly discovered cliques and theiroccurrences, are again indexed in a separate hash tableand enumerated recursively. The algorithm backtracks tothe parents of a clique if no further extension from theclique is possible. The overall algorithm stops when allfrequent node types have been enumerated. We illustratethe CliqueHashing algorithm, with the edge label con-straint, in Figure 6.
Theorem 4.8. If ψ is well defined for all possible graphswith the constraint ρ, the CliqueHashing algorithm iden-tifies all frequent constrained cliques from a graphdatabase exactly once.
Proof. The prefix preserving property of Definition 4.1implies that at least one subclique of a frequent cliquewill pass the IF statement of line 9, in the back-track search procedure in CliqueHashing. Therefore thealgorithm will not miss any frequent cliques in the pres-ence of a constraint ρ.
The proof that the algorithm discovers every con-strained frequent cliques exactly once may not be obviousat first glance. The key observation is that for a clique Gof size n, there is only one subclique with size n− 1 thathas a code matching a prefix of ψ(G). If we can prove theobservation, by the line 9 of the backtrack search proce-dure, the CliqueHashing algorithm guarantees that eachconstrained frequent cliques will be discovered exactly
once.To prove the observation, we assume to the contrary
that there are at least two such subcliques with the samesize and both give codes as prefixes of ψ(G). We claimthat one of the two codes must be a prefix of the other(by the definition of prefix). The claim leads to the con-clusion that one of two subcliques must be a subclique ofthe other (by the definition of ψ). The conclusion con-tradicts our assumption that the two subcliques have thesame size.
{p5}
{p4}“d”
“c”
{s2}
{q2}
{s3}
“b”
{p1}
{s1}
{q3}
{q1}
{p3}
{p2}
“a”
{p5}
{p4}“d”
“c”
{s2}
{q2}
{s3}
“b”
{p1}
{s1}
{q3}
{q1}
{p3}
{p2}
“a”
{q1, q3, q2}
{p2, p3, p1}“bybyxa”
{q1, q3, q2}
{p2, p3, p1}“bybyxa”
step1
step2
{p2, p3}“byb”
{q1, q3}
{s1,s2}
“bya”
{q1,q2}
{p2,p1}
{p2, p3}“byb”
{q1, q3}
{s1,s2}
“bya”
{q1,q2}
{p2,p1}
step3
Fig. 6. The contents of the hash table counter after applying theCliqueHashing algorithm to the data set shown in Figure 1 withthe edge label constraint.

May 25, 2006 14:22 WSPC/Trim Size: 11in x 8.5in for Proceedings csb˙huan
8
p2 p5
a
b
b d
y
y
y
x/y
x
(P)
p1
p3p4
cp2 p5
a
b
b d
y
y
y
x/y
x
(P)
p1
p3p4
c
a
b
b
y
yx/y
(Q)
q1
q3
q2
a
b
b
y
x/y
(S)
s1
s3
s2
Fig. 7. A graph database of three graphs with multiple labels.
{p5}
{p4}“d”
{s4}
“c”
{s2}
{q2}
{s3}
“b”
{p1}
{s1}
{q3}
{q1}
{p3}
{p2}
“a”
{p5}
{p4}“d”
{s4}
“c”
{s2}
{q2}
{s3}
“b”
{p1}
{s1}
{q3}
{q1}
{p3}
{p2}
“a”
{q1, q3, q2}
{p2, p3, p1}“bybyxa”
{q1, q3, q2}
{p2, p3, p1}“bybyxa”
step1
step2
{s1,s2}
{q1,q2}
{p2, p3}“byb”
{q1, q3}
{s3,s2}
“bya”
{q3,q2}
{p2,p1}
{s1,s2}
{q1,q2}
{p2, p3}“byb”
{q1, q3}
{s3,s2}
“bya”
{q3,q2}
{p2,p1}
step3
Fig. 8. the contents of the hash table counter after applying theCliqueHashing algorithm to the data set shown left.
4.6. CliqueHashing on Multi-labeledGraphs
A multi-labeled graph is a graph where there are two ormore labels associated with a single edge in the graph.The CliqueHashing algorithm can be applied to multi-labeled graphs directly without major modifications. Thekey observation is that our enumeration is based on oc-currences of cliques (line 3 in function backtrack search).In Figure 7, we show a graph database with three multi-labeled graphs. In figure 8, we show (pictorially) how theCliqueHashing algorithm can be applied to graphs withmultilables.
In the context of the structure motifs detection, han-dling multi-labeled graphs is important for the followingreason. First, due to the imprecision in 3D coordinatesdata in motif discovery, we need to tolerate distance vari-ations between different instances of the same motif. Sec-ond, partitioning the 1D distance space into distance binsis not a perfect solution since distance variations can notbe well handled at the boundary of the bins. In our ap-plication distance bins may lead to a significant numberof missing motifs. Using a multi-labeled graph we cansolve the boundary problem by using “overlapping” binsto take care of boundary effect.
5. EXPERIMENTAL STUDY
5.1. Experimental setup
To exclude redundant structures from our analysis, weused the culled PDB list (http://www.fccc.edu/research/labs/dunbrack/pisces/culledpdb.html) with sequence sim-ilarity cutoff value 90% (resolution = 3.0, R factor = 1.0).This list contains about one quarter of all protein struc-tures in PDB; remaining ones are regarded as duplicatesto proteins in the list. We study four SCOP families:Eukaryotic Serine Protease (ESP), Papain-like CysteineProtease (PCP), Nuclear Binding Domains (NB), andFAD/NAD-linked reductase (FAD). Each protein struc-ture in a SCOP family was converted to its graph repre-sentation as outlined in Section 3. The pairwise aminoacid residue contacts are obtained by computing thealmost-Delaunay edges 2 with ε = 0.1 and with lengthup to 8.5 A, as was also done in 14. Structure motifs froma SCOP family were identified using the CliqueHash-ing algorithm with the CC constraint that states “eachamino acid residue in a motif should contact at least an-other residue and the motif should be a connected compo-nent with respect to the contact relation”. Timings of thesearch algorithm were reported using the same hardwareconfiguration used in14.
In Table 1, we document the four families includ-ing their SCOP ID, total number of proteins in the family(N ), the support threshold we used to retrieve structuremotifs (σ), and the processing time (T , in seconds). In thesame table, we also record all the structure motifs identi-fied, giving the motifs’ compositions (a sequence of one-letter residue codes), actual support values (κ), the num-ber of occurrences outside the family in the representa-tive structures in PDB (referred to as the background fre-quencies hereafter) (δ), and their statistical significancein the family (P ). The statistical significance is computedby a hyper-geometric distribution, specified in Appendix7.1. Images of protein structures were produced usingVMD 16 and residues in the images were colored by theresidue identity using default VMD settings.
5.2. Eukaryotic serine protease
The structure motifs identified from the ESP family weredocumented at the top part of Table 1. The data indicatedthat the motifs we found are highly specific to the ESPfamily, measured by P−value ≤ 10−82. We have inves-tigated the spatial distribution of the residues covered by

May 25, 2006 14:22 WSPC/Trim Size: 11in x 8.5in for Proceedings csb˙huan
9
Table 1. Motifs
Motif Composition κ δ −log(P ) Motif Composition κ δ −log(P ) Motif Composition κ δ −log(P )
Eukaryotic Serine Protease (ID: 50514) N : 56 σ: 48/56, T : 31.51 DHAC 54 13 100 14 DHAC 50 6 100 27 DASC 49 20 922 ACGG 52 9 100 15 HACA 50 8 100 28 SAGG 49 31 903 DHSC 52 10 100 16 ACGA 50 11 100 29 DGGL 49 53 834 DHSA 52 10 100 17 DSAG 50 16 100 30 DSAGC 48 9 995 DSAC 52 12 100 18 SGGC 50 17 100 31 DSSC 48 12 976 DGGG 52 23 100 19 AGAG 50 27 95 32 SCSG 48 19 937 DHSAC 51 9 100 20 AGGG 50 58 85 33 AGAG 48 19 938 SAGC 51 11 100 21 ACGAG 49 4 100 34 SAGG 48 23 889 DACG 51 14 100 22 SCGA 49 6 100 35 DSGS 48 23 9410 HSAC 51 14 100 23 DACS 49 7 100 36 DAAG 48 27 8911 DHAA 51 18 100 24 DGGS 49 8 100 37 DASG 48 32 8712 DAAC 51 32 99 25 SACG 49 10 98 38 GGGG 48 71 7613 DHAAC 50 5 100 26 DSGC 49 15 98
Papain-like cysteine protease (ID: 54002) N : 24, σ: 18/24, T : 18.41 HCQS 18 2 34 3 WWGS 18 3 44 5 WGSG 18 5 432 HCQG 18 3 34 4 WGNS 18 4 44
Nuclear receptor ligand-binding domain (ID: 48509) N : 23, σ: 17/23, T : 15.31 FQLL 20 21 43 3 DLQF 17 8 39 4 LQLL 17 40 312 DLQF 18 7 42
FAD/NAD-linked reductase (ID: 51943) N : 20 σ: 15/20, T : 90.01 AGGG 17 34 34 2 AGGA 17 91 27
those motifs, by plotting all residues covered by at leastone motif in the structure of a trypsin: 1HJ9, shown inFigure 9. Interestingly we found that all these residuesare confined to the vicinity of the catalytic triad of 1HJ9,namely: HIS57-ASP102-SER195, confirming a knownfact that the geometry of the catalytic triad and its spa-tially adjacent residues are rigid, which is probably re-sponsible for functional specificity of the enzyme.
Fig. 9. Left: Spatial distribution of residues found in 38 common structure mo-tifs within protein 1HJ9. The residues of catalytic triad, HIS57-ASP102-SER195,are connected by white dotted lines. Right: Performance comparison of graphmining (GM) and geometric hashing (GH) for structure motif identification.
We found that there are five motifs that occur sig-nificantly (P−value < 10−7) in another SCOP family:Prokaryotic Serine Protease (details not shown). This isnot surprising since both prokaryotic and eukaryotic ser-ine proteases are quite similar at both structural and func-tional levels and they share the same SCOP superfamilyclassification. None of the motif has significant presence
outside these two families.Comparing to our own previous study that uses
generic subgraph mining algorithm (without constraintsand without utilizing pairwise amino acid residue dis-tance information), and pairwise structural comparisonperformed by other groups 1, 10, 22, 31, 29, 38, we reporta significant improvement of the “precision” of structuremotifs. For example, rather than reporting thousands ofmotifs for a small data set like serine proteases 38, 14, wereport a handful of structure motifs that are highly spe-cific to the serine protease family (as measured by lowP -values) and highly specific to the catalytic sites of theproteins (as shown in Figure 9).
To further evaluate our algorithm, we randomly sam-ple two proteins from the ESP family and search for com-mon structure motifs. We obtain an average of 2300 mo-tifs per experiment for a total of thousand runs. Such mo-tifs are characterized by poor statistical significance andwere not specific to known functional sites in the ESP. Ifwe require a structure motif to appear in at least 24 of a31 randomly selected ESP proteins and repeat the sameexperiment, we obtain an average of 65 motifs per exper-iment with improved statistical significance. This exper-iment demonstrates that comparing a group of proteinsimproves the quality of the motifs, as observed by 38.
Beside improved quality of structure motifs, we ob-serve a significant speed up for our structure motif com-

May 25, 2006 14:22 WSPC/Trim Size: 11in x 8.5in for Proceedings csb˙huan
10
parison algorithm comparing to other methods such asgeometric hashing. At the right part of Figure 9, we showperformance comparison of graph mining (GM) and geo-metric hashing (GH)21 ( executable download from thecompanion website) for serine proteases. We notice ageneral trend that with the increasing number of proteinsstructures, the running time of graph mining decreases(since there are fewer common structure motifs) but therunning time of geometric hashing increases. The twotechniques have different set of parameters that make anydirect comparison of running time difficult, however, thetrend is very clear that graph mining has better scalabilitythan geometric hashing for data set contains large numberof proteins structures.
Fig. 10. Left: Residues included in the motifs from PCP family in protein1CQD. The residues in catalytic dyad CYS27-HIS161 are connected by a whitedotted line and two important surrounding residues ASN181 and SER182 are la-beled. Right: Residues included in motifs from the NB family in protein 1OVL.The labeled residue GLN 435 has direct interaction with the cofactor of the pro-tein.
5.3. Papain-like cysteine protease andnuclear binding domain
We applied our approach to two additional SCOP fam-ilies: Papain-Like Cysteine Protease (PCP, ID: 54002)and Nuclear Receptor Ligand-Binding Domain (NB, ID:48509). The results are documented in the middle part ofTable 1.
For the PCP family, we identified five structuremotifs which covered the catalytic CYC-HIS dyad andnearby residues ASN and SER which are known to inter-act with the dyad 7, as shown in Figure 10. For the NBfamily, we identified four motifsa which map to the co-factor binding sites 37, shown in the same figure. In ad-dition, four members missed by SCOP: 1srv, 1khq, and1o0e were identified for the PCP family and six members1sj0, 1rkg, 1osh, 1nq7, 1pq9, 1nrl were identified for the
NB family.
Fig. 11. The motif appears in two proteins 1LVL (belongs to the FAD/NAD-linked reducatase family without Rossman fold ) and 1JAY (belongs to the 6-phosphogluconate dehydrogenase-like, N-terminal domain family with Rossmanfold) with conserved geometry.
5.4. FAD/NAD binding proteins
In the SCOP database, there are two superfamilies ofNADPH binding proteins, the FAD/NAD(P)-binding do-mains and the NAD(P)-binding Rossmann-fold domains,which share no sequence or fold similarity to each other.This presents a challenging test case for our system tocheck whether we would be able to find patterns acrossthe two groups with biological significance.
To address the question, we applied our algorithmto the largest family in SCOP FAD/NAD(P)-binding do-main: FAD/NAD-linked reductases (SCOPID: 51943).With support threshold 15/20, we obtained two recurringstructure motifs from the family, and both showed strongstatistical significance in the NAD(P)-binding Rossmann-fold superfamily as shown in bottom part of Table 1.
In Figure 11, we show a motif that is statistically en-riched in both families; it has conserved geometry andis interacting with the NADPH molecule in two proteinsbelonging to the two families. Notice that we do not in-clude any information from NADPH molecule during oursearch, and we identified this motif due to its strong struc-tural conservation among proteins in a SCOP superfam-ily. The two proteins have only 16% sequence similarityand adopt different folds (DALI z-score 4.5). The resultsuggests that significantly common features can be in-ferred from proteins with no apparent sequence and foldsimilarity.
aStructure motifs 2 and 3 have the same residue composition but they have different residue contact patterns and therefore regarded as two patterns.They do not map to the same set of residues.

May 25, 2006 14:22 WSPC/Trim Size: 11in x 8.5in for Proceedings csb˙huan
11
5.5. Random proteins
Our last case study is a control experiment to empiricallyevaluate the statistical significance of the structure motifsregardless of the P−value definition. To that end, 20 pro-teins were randomly sampled from the culled PDB list inorder to obtain common motifs with support ≥ 15. Theparameters 20 and 15 were set up to mimic the size of atypical SCOP family. We repeated the experiment a mil-lion times, and did not find a single recurring structuremotif. Limited by the available computational resources,we did not test the system further; however, we are con-vinced that the chance of observing a random structuremotif in our system is rather small.
6. CONCLUSIONWe present a method to identify recurring structure mo-tifs in a protein family with high statistical significance.This method was applied to selected SCOP families todemonstrate its applicability to finding biologically sig-nificant motifs with statistical significance. In futurestudies, we will apply this approach to all families inSCOP as well as from other classification systems suchas Gene Ontology and Enzyme Classification. The accu-mulation of all significant motifs characteristic of knownprotein functional and structural families will aid proteinstructures resulting from structural genomics projects.
References1. Peter J. Artymiuk, Andrew R. Poirrette, Helen M. Grind-
ley, David W. Rice, and Peter Willett. A graph-theoreticapproach to the identification of three-dimensional patternsof amino acid side-chains in protein structures. Journal ofMolecular Biology, 243:327–44, 94.
2. D. Bandyopadhyay and J. Snoeyink. Almost-Delaunaysimplices : Nearest neighbor relations for imprecise points.In ACM-SIAM Symposium On Distributed Algorithms,pages 403–412, 2004.
3. JA Barker and JM Thornton. An algorithm for constraint-based structural template matching: application to3d templates with statistical analysis. Bioinformatics,19(13):1644–9, 2003.
4. H.M. Berman, J. Westbrook, Z. Feng, G. Gilliland, T.N.Bhat, H. Weissig, I.N. Shindyalov, and P.E. Bourne. Theprotein data bank. Nucleic Acids Research, 28:235–242,2000.
5. Philip Bradley, Peter S. Kim, and Bonnie Berger. TRIL-OGY: Discovery of sequence-structure patterns across di-verse proteins. Proceedings of the National Academy ofSciences, 99(13):8500–8505, June 2002.
6. SA Cammer, CW Carter, and A. Tropsha. Identification ofsequence-specific tertiary packing motifs in protein struc-tures using delaunay tessellation. Lecture notes in Compu-tational Science and Engineering,, 24:477–494, 2002.
7. K. H. Choi, R. A. Laursen, and K. N. Allen. The 2.1angstrom structure of a cysteine protease with prolinespecificity from ginger rhizome, zingiber officinale. Bio-chemistry, 7, 38(36):11624–33, 1999.
8. I. Eidhammer, I. Jonassen, and W. R. Taylor. Protein Bioin-formatics: An Algorithmic Approach to Sequence andStructure Analysis. John Wiley & Sons, Ltd, 2004.
9. JF Gibrat, T Madej, and SH. Bryant. Surprising simi-larities in structure comparison. Curr Opin Struct Biol,(6(3)):683–92, 1996.
10. H.M. Grindley, P.J. Artymiuk, D.W. Rice, and P. Willet.Identification of tertiary structure resemblance in proteinsusing a maximal common subgraph isomorphism algo-rithm. J. Mol. biol., 229:707–721, 1993.
11. H. Hegyi and M. Gerstein. The relationship between pro-tein structure and function: a comprehensive survey withapplication to the yeast genome. J Mol Biol, 288:147–164,1999.
12. L. Holm and C. Sander. Mapping the protein universe. Sci-ence, 273:595–602., 1996.
13. J. Hu, X. Shen, Y. Shao, C. Bystroff, and M. J. Zaki. Min-ing protein contact maps. 2nd BIOKDD Workshop on DataMining in Bioinformatics, 2002.
14. J. Huan, W. Wang, D. Bandyopadhyay, J. Snoeyink,J. Prins, and A. Tropsha. Mining protein family specificresidue packing patterns from protein structure graphs. InProceedings of the 8th Annual International Conferenceon Research in Computational Molecular Biology (RE-COMB), pages 308–315, 2004.
15. J. Huan, W. Wang, and J. Prins. Efficient mining of fre-quent subgraph in the presence of isomorphism. In Pro-ceedings of the 3rd IEEE International Conference onData Mining (ICDM), pages 549–552, 2003.
16. William Humphrey, Andrew Dalke, and Klaus Schulten.VMD – Visual Molecular Dynamics. Journal of MolecularGraphics, 14:33–38, 1996.
17. I. Jonassen, I. Eidhammer, D. Conklin, and W. R. Taylor.Structure motif discovery and mining the PDB. Bioinfor-matics, 18:362–367, 2002.
18. I. Jonassen, I. Eidhammer, and W. R. Taylor. Discov-ery of local packing motifs in protein structures. Proteins,34:206–219, 1999.
19. Susan Jones and Janet M Thornton. Searching for func-tional sites in protein structures. Current Opinion in Chem-ical Biology, 8:3–7, 2004.
20. Bala Krishnamoorthy and Alexander Tropsha. Develop-ment of a four-body statistical pseudo-potential to discrim-inate native from non-native protein conformations. Bioin-formatics, 19(12):1540–48, 2003.
21. N. Leibowitz, ZY Fligelman, R. Nussinov, and HJ Wolf-son. Automated multiple structure alignment and detectionof a common substructural motif. Proteins, 43(3):235–45,May 2001.
22. M Milik, S Szalma, and KA. Olszewski. Common struc-tural cliques: a tool for protein structure and function anal-ysis. Protein Eng., 16(8):543–52., 2003.
23. N Nagano, CA Orengo, and JM Thornton. One fold withmany functions: the evolutionary relationships between

May 25, 2006 14:22 WSPC/Trim Size: 11in x 8.5in for Proceedings csb˙huan
12
tim barrel families based on their sequences, structuresand functions. Journal of Molecular Biology, 321:741–765, 2002.
24. Ruth Nussinov and Haim J. Wolfson. efficient detec-tion of three-dimensional structural motifs in biologicalmacromolecules by computer vision techniques. PNAS,88:10495–99, 1991.
25. Robert B. Russell. Detection of protein three-dimensionalside-chain patterns: new examples of convergent evolution.Journal of Molecular Biology, 279:1211–1227, 1998.
26. S. Schmitt, D. Kuhn, and G. Klebe. A new method to detectrelated function among proteins independent of sequenceand fold homology. J. Mol. Biol., 323(2):387–406, 2002.
27. J. P Shaffer. Multiple hypothesis testing. Ann. Rev. Psych,pages 561–584, 1995.
28. Jeffrey Skolnick, Jacquelyn S. Fetrow, and Andrzej Kolin-ski. Structural genomics and its importance for gene func-tion analysis. nature biotechnology, 18:283–287, 2000.
29. R. V. Spriggs, P. J. Artymiuk, and P. Willett. Searching forpatterns of amino acids in 3D protein structures. J ChemInf Comput Sci, 43:412–421, 2003.
30. A Stark and RB Russell. Annotation in three dimensions.pints: Patterns in non-homologous tertiary structures. Nu-cleic Acids Res, 31(13):3341–4, 2003.
31. A. Stark, A. Shkumatov, and R. B. Russell. Findingfunctional sites in structural genomics proteins. Structure(Camb), 12:1405–1412, 2004.
32. William R. Taylor and Inge Jonassen. A method for evalu-ating structural models using structural patterns. Proteins,July 2004.
33. A. Tropsha, C.W. Carter, S. Cammer, and I.I. Vais-man. Simplicial neighborhood analysis of protein packing(SNAPP) : a computational geometry approach to studyingproteins. Methods Enzymol., 374:509–544, 2003.
34. J. R. Ullman. An algorithm for subgraph isomorphism.Journal of the Association for Computing Machinery,23:31–42, 1976.
35. AC Wallace, N Borkakoti, and JM Thornton. Tess: a geo-metric hashing algorithm for deriving 3d coordinate tem-plates for searching structural databases. application to en-zyme active sites. Protein Sci, 6(11):2308–23, 1997.
36. G. Wang and R. L. Dunbrack. PISCES: a proteinsequence culling server. Bioinformatics, 19:1589-1591,2003. http://www.fccc.edu/research/labs/dunbrack/pisces/culledpdb.html.
37. Z. Wang, G. Benoit, J. Liu, S. Prasad, P. Aarnisalo, X. Liu,H. Xu, NP. Walker, and T. Perlmann. Structure and func-tion of nurr1 identifies a class of ligand-independent nu-clear receptors. Nature, 423(3):555–60, 2003.
38. PP Wangikar, AV Tendulkar, S Ramya, DN Mali, andS Sarawagi. Functional sites in protein families uncovered
via an objective and automated graph theoretic approach. JMol Biol, 326(3):955–78, 2003.
39. X. Yan and J. Han. gspan: Graph-based substructure pat-tern mining. In Proc. International Conference on DataMining’02, pages 721–724, 2002.
7. APPENDIX
7.1. Statistical significance ofstructure motifs
Any cliques that are frequent in a SCOP family are checked againsta data set of 6500 representative proteins from CulledPDB 36, se-lected from all proteins in the Protein Data Bank. For each clique c,we used Ullman’s subgraph isomorphism algorithm 34 to search forits occurrence(s) and record the search result in an occurrence vectorV = v1, v2, . . . , vn, where vi is 1 if c occurs in the protein pi, and0, otherwise. Such cliques are referred to as structure motifs. We de-termine the statistical significance of a structure motif by computingthe related P -value, defined by a hyper-geometric distribution 5. Thereare three parameters in our statistical significance formula: a collectionof representative proteins M , which stands for all known structures inPDB; a subset of proteins T ⊆ M in which a structure motif m occurs,a subset of proteins F ⊆ M stands for the family we would like toestablish the statistical significance. The probability of observing a setof motif m containing proteins K = F ∩T with size at least k is givenby the following formula:
P−value = 1 −
k−1�i=0
�|F |i �
�|M|−|F ||T |−i ��
|M||T | �
. (1)
where |X| is the cardinality of a set X. For example, if a motif m oc-curs in every member of a family F and in no proteins outside F (i.e.K = F = T ) for a large family F , we would estimate that this motifis specifically associated with the family; the statistical significance ofsuch case is measured by a P−value close to zero.
We adopt the Bonferroni correction for multiple independent hy-potheses 27: 0.001/|C|, where |C| is the set of categories, is used asthe default threshold to measure the significance of the P -value of in-dividual test. Since the total number of SCOP families is 2327, a goodstarting point of P -value upper bound is 10−7.
7.2. Background frequencyUsing the culledpdb list (http://www.fccc.edu/research/labs/dunbrack/pisces/culledpdb.html) as discussed in Section 5.1, we obtain around6000 proteins as the “representative proteins” in PDB. We treat the pro-teins as a sample from PDB and for each motif, we estimate its back-ground frequency (the number of occurrences in proteins) using graphmatching. Specifically, each sample protein is transformed to its graphrepresentation using the procedure outline in Section 3 and we use sub-graph isomorphism testing to obtain the total number of proteins themotif occurs in.