Embed Size (px)
Citation preview

Dissolution Performance Improvement of
Fenofibrate through Secondary Solid
Dispersion Using PEG6000 and
Croscarmellose Sodium Combination
A Project Submitted By
Tonima Akter Khan ID: 12146039
Session: Spring’12 to
The Department of Pharmacy in partial fulfillment of the requirements for the degree of
Bachelor of Pharmacy
Dhaka, Bangladesh February, 2016.

Dedicated to my parents, who sacrificed their every desire since my birth and
inspire me in every step of my life and to my beloved friend Farhana Jafrin Onee

Certification Statement
This is to certify that this project titled “Dissolution Performance Improvement of
Fenofibrate through Secondary Solid Dispersion Using PEG6000 and Croscarmellose
Sodium Combination ” submitted for the partial fulfillment of the requirements for the
degree of Bachelor of Pharmacy, BRAC University constitutes my own work under the
supervision of Mrs. Shahana Sharmin, Senior Lecturer, Department of Pharmacy, BRAC
University and that proper credit has been given where I have used the language, ideas or
writings of another.
Signed,
__________________________________
Countersigned by the supervisor
____________________________________

I
Acknowledgment
I would like to express my thanks and gratitude to the Department of Pharmacy, BRAC
University for providing me the laboratory facilities for the completion of the project. I am
also thankful to my supervisor, Mrs. Shahana Sharmin for her dedicated supervision and at
the same time, I am grateful for the enormous support of the Associate Professor, Dr. Eva
Rahman Kabir, Chairperson, Department of Pharmacy, BRAC University. Additionally, I
am obliged to all those who have given me their valuable time and energy from their hectic
work schedule to express their full experience about the instrumental terms, conditions and
working procedures.

II
Abstract
The potential of solid dispersion based formulation using the combination of PEG6000 and
croscarmellose sodium as drug carrier to enhance the dissolution performance and oral
bioavailability of Fenofibrate, a poorly water soluble drug was investigated. Fenofibrate is a
hydrophobic drug in fibrate class of drug which is mainly used in patients at risk of
cardiovascular disease in the treatment of hypercholesterolemia and hypertriglyceridemia.
Solid dispersions with different drug-to-carrier ratios were prepared by the physical mixture
method and solvent method and characterized by dissolution testing within 30minutes. In
vitro drug release were performed using US pharmacopeia type II apparatus (paddle-
method) in 1000ml distilled water containing 0.75% w/v sodium lauryl sulfate at 75rpm for
30minutes. UV visible spectrophotometric method was selected for dissolution performance
investigation at max 290 nm. In physical mixture method F5 (32.5%) and F11 (83%) and in
solvent method F6 (39%) and F11 (38.5%) have showed good percentage of drug release.

III
Tables of Contents
Acknowledgement---------------------------------------------------------------------------- I
Abstract----------------------------------------------------------------------------------------- II
Table of Contents------------------------------------------------------------------------------ III-IV
List of Tables------------------------------------------------------------------------------------ V
List of Figures----------------------------------------------------------------------------------- VI
List of Acronyms------------------------------------------------------------------------------- VII
Chapter 1:
Introduction
1.1 Introduction------------------------------------------------------------------------------- 2
1.2 Solubility---------------------------------------------------------------------------------- 2-3
1.3 Dissolution-------------------------------------------------------------------------------- 3-4
1.4 Biopharmaceutical Classification System--------------------------------------------- 5-6
1.5 Definition of Solid Dispersion---------------------------------------------------------- 7
1.6 Advantages of solid dispersion--------------------------------------------------------- 8-9
1.7 Applications of Solid Dispersion-------------------------------------------------------- 9
1.8 Disadvantages of Solid Dispersion----------------------------------------------------- 10-11
1.9 Advantages of Solid Dispersions over the Other Strategies ----------------------- 12-13
1.10 Factors that Influence the Drug Release from the Solid Dispersion------------- 14
1.11 Classification of Solid Dispersion---------------------------------------------------- 15-19
1.12 Methods of Solid Dispersion----------------------------------------------------------- 20-22
1.13 Criteria for the selection of carriers---------------------------------------------------- 23
1.14 Polymers used in the Solid Dispersion------------------------------------------------ 23-25
1.15 Reasons for Choosing Combination of PEG6000 and Croscarmellose Sodium--25
1.16 Fenofibrate

IV
1.16.1 Description---------------------------------------------------------------------------------26 1.16.2 Clinical Pharmacology-------------------------------------------------------------------26
1.16.3 Fenofibrate as an Ideal Candidate for Solid Dispersion-----------------------------26
1.17 Literature Review-------------------------------------------------------------------------27
Chapter 2:
Methodology
2.1 List of Instruments, Apparatus and Glass Wares------------------------------------------29
2.2 Preparation of 0.72% sodium lauryl sulphate----------------------------------------------30
2.3 Preparation of Solid Dispersion by Solvent Method--------------------------------------30
2.4 Preparation of Physical Mixture Method---------------------------------------------------30
2.5 List of Formulation Code with their Compositions and Respective Method----------31-32
2.6 Pictures & Images of the Instruments-------------------------------------------------------33-34
2.7 In vitro Dissolution Study
2.7.1 Principle---------------------------------------------------------------------------------------35 2.7.2 Conditions------------------------------------------------------------------------------------35 2.7.3 Preparation of Standard Solution----------------------------------------------------------35 2.7.4 Standard Curve of Fenofibrate-------------------------------------------------------------36 2.7.5 Preparation of Sample Solutions-----------------------------------------------------------37
2.8 Collection of Samples--------------------------------------------------------------------------- 37
Chapter 3:
Result and Discussion
3.1 In Vitro Dissolution Study Results----------------------------------------------------------- 39-48
3.2 Discussion---------------------------------------------------------------------------------------- 49-51
Chapter 4:
Conclusion and References
4.1 Conclusion------------------------------------------------------------------------------------------53
References----------------------------------------------------------------------------------------------54-55

V
List of Tables
Table 1.1: The Biopharmaceutical classification system----------------------------------------------5
Table 2.1: List of instruments and equipment used in the analysis----------------------------------29
Table 2.2: List of apparatus and glass wares used in the experiment--------------------------------29
Table 2.3: Name of Methods, Compositions of Formulation, Ratio of drug and excipients and Product coding-----------------------------------------------------------------------------------------------32
Table 2.4: Conditions in dissolution testing--------------------------------------------------------------35
Table 2.5: Standard Curve of Fenofibrate----------------------------------------------------------------36
Table 3.1: Table showing percentage of drug release in physical method from F1 to F7---------39
Table 3.2: Table showing percentage of drug release in physical mixture from F8 to F13-------41
Table 3.3: Table showing percentage of drug release in Solvent method from F4 to F6----------43
Table 3.4: Table showing percentage of drug release in Solvent method from F8 to F11---------45
Table 3.5: Table showing Difference percentage of drug release in Solvent method and Physical
Method from F4 to F6---------------------------------------------------------------------------------------47
Table 3.6: Table showing Difference percentage of drug release in Solvent method and Physical
Method from F8 to F11------------------------------------------------------------------------------------- 48

VI
List of Figures
Figure 2.1: Picture showing an electronic balance--------------------------------------------------33
Figure 2.2: Picture showing UV-Visible spectrophotometer--------------------------------------33
Figure 3: Picture showing dissolution tester---------------------------------------------------------34
Figure 2.4: Picture showing the paddle of dissolution tester--------------------------------------34
Figure 2.5: Standard curve of Fenofibrate-----------------------------------------------------------36
Figure 3.1: The line showing the increase and decrease of the percentage of drug release in
physical Mixture from F1 to F7------------------------------------------------------------------------39
Figure 3.2: Bar chart showing the percentage of drug release in physical mixture from
F1 to F7---------------------------------------------------------------------------------------------------- 40
Figure 3.3: The line showing the increase and decrease of the percentage of drug release in
physical mixture from F8 to F13------------------------------------------------------------------------41
Figure 3.4: Bar chart showing the percentage of drug release in physical mixture from
F8 to F13----------------------------------------------------------------------------------------------------42
Figure 3.5: The line showing the increase and decrease of the percentage of drug release in
Solvent method from F4 to F6----------------------------------------------------------------------------43
Figure 3.6: Bar chart showing the percentage of drug release in Solvent Method from
F4 to F6----------------------------------------------------------------------------------------------------- 44
Figure 3.7: The line showing the increase and decrease of the percentage of drug release in
Solvent method from F8 to F11---------------------------------------------------------------------------45
Figure 3.8: Bar chart showing the percentage of drug release in Solvent Method
from F8 to F11-----------------------------------------------------------------------------------------------46
Figure 3.9: Bar Chart showing Difference in percentage of drug release Between Solvent method
and Physical Method from F4 to F6-----------------------------------------------------------------------47
Figure 3.10: Bar Chart showing Difference in percentage of drug release Between Solvent
method --------------------------------------------------------------------------------------------------------48

VII
List of Acronyms:
GI Tract = Gastrointestinal Tract
BCS = Biopharmaceutical Classification System
FDA = Food and Drug Administration
IR = Immediate Release
SLS = Sodium Lauryl Sulfate
NSAIDS = Non-Steroidal Anti-Inflammtory Drugs
PVP = Polyvinylpyrrolidine
HPMC = Hydroxy Propyl Methyl Cellulose
NCE = New Chemical Entities
PEGs = Polyethylene Glycols
MW = Molecular Weight
MC = Methyl Cellulose
HPC – Hydroxy Propyl Cellulose
VLDL = Very Low Density Lipoprotein
TGs = Triglycerides
PPAR- = Paroxisome Proliferation Activated Receptor Gene
LDL = Low Density Lipoprotein
USP = United States of Pharmacopoeia
BP = British Pharmacopeia
PD = Pure Drug

1 | P a g e
Chapter 1:
Introduction

2 | P a g e
1.1 Introduction
The release of drug substance from the delivery system is depended upon drug absorption
from solid oral dosage form, the dissolution of drugs under the physiological conditions and
the drug permeability across the GI tract (Tiwari, Tiwari, Srivastava, & Rai, 2009).
Dissolution is the rate limiting step in case of absorption for poorly water soluble drugs. So
increase solubility can increase drug absorption and in result, drug bioavailability. Solid
dispersion technique is a popular method to improve the dissolution and consequently the
bioavailability of poorly water soluble drugs (Singh, Baghel, & Yadav, 2011).
1.2 Solubility
Solubility is an important feature of a liquid, solid or vaporous solute that dissolve in a
liquid, solid or vaporous solvent to obtain a homogeneous solution of the solute in the
solvent. The solubility of a solute depends in the solvent used, temperature and pressure.
Saturation concentration measures the level of solubility of a substance in a particular
solvent in which addition of more solute does not improve the concentration of that solute in
the solution (Lachman, Lieberman, & Kanig, 1986).
The unadulterated solvent is normally a liquid or a mixture of two liquids, solid solution and
even a gas. Solubility measurement widely ranges from infinitely soluble (completely
miscible- e.g. ethanol in water) to poorly soluble (e.g. silver chloride in water). For poorly or
very poorly soluble compounds are termed as insoluble compounds in a specific solvent.
(Clugston & Fleming, 2000).
Sometimes solubility is mistaken with the capacity to melt or dissolve a substance in the
dissolution process and for the chemical reaction. For instant, zinc chemically reacts with
hydrochloric acid to form zinc chloride yet zinc is insoluble in hydrochloric acid. In
addition, solubility does not depend on the molecular size of components in the formulation
(Martin, 2011).

3 | P a g e
Solubility broadly expresses in different ways like as a concentration, either by mass,
molarity, molality, mole fraction etc. the solubility of the solute in this way can be defined
as the maximum equilibrium amount of solute to dissolve per amount of solvent (Aulton,
2007) . The major disadvantage in this way is it’s dependability upon the different species
present in the solvent.
1.3 Dissolution
Poorly water soluble drugs show very negligible availability which next result in their low
dissolution performance. Consequently, it delays the absorption from the gastrointestinal
tract. Solubility property of a drug is really an important factor.
Dissolution performance relies on the solubility and permeability of the oral dosage form. If
the drug solubility in water is less than 10mg/ml, dissolution is considered as rate limiting
step for the process of drug absorption.
Two important points are involved in drug dissolution. One is the transportation of drug
within the dissolution medium and second is drug release from the dosage form.
The factors affecting dissolution are-
- Physical and chemical properties of drug(e.g. drug’s solubility. drug’s particle size,
drug’s molecular structure)
- Characteristics of formulation (e.g. excipients, coating substance)
- Techniques for dissolution (e.g. types of apparatus, volume, viscosity and pH of the
dissolution medium etc), (Abdou, 1989)

4 | P a g e
From the Noyesh-whitney equation the hints to improve dissolution rate of drugs specially
poorly soluble drugs in water can be obtained.
dc/dt = AD(Cs-C)/h
Where-
dc/dt – The rate of dissolution
A- The available surface area for dissolution
D- Compound’s dissolution coefficient
Cs – Compound’s solubility in the dissolution medium
C – The concentration of drug in the medium at time t and
h- The thickness of the diffusion boundary layer which is adjacent with the surface of the
dissolving compound
So to increase dissolution performance of the poor water soluble drugs following approach
can be used according to the Noyes- Whitney equation-
-increasing the surface area that is available for dissolution
- decreasing the particle size of the insoluble drug
-to optimize the wetting features of compound surface
-decreasing the boundary layer thickness
-ensuring sink condition for dissolution
-administration of drugs in the feed state
-to improve apparent solubility of drug under physiological relevant conditions
Among all these possibilities maintaining the sink condition depends on the permeability of
the gastrointestinal mucosa of the compounds, and on the composition as well as volume of
the luminal fluids (Singh, Baghel, & Yadav, 2011).

5 | P a g e
1.4 Biopharmaceuticals Classification System
Taking into accounts the aqueous solubility, dissolution characteristics of the drug and
intestinal permeability drug substances are classified into a logical classification that can
connect both in vitro disintegration and in vivo bioavailability of the drugs. This
classification is termed as Biopharmaceutics classification system (BCS) (Wagh & Patel,
2010).
In BCS point of view, the solubility class obtains by calculating the sufficient volume of
aqueous medium that is needed to dissolve the highest anticipated dose strength. When the
highest strength of a drug is soluble in 250ml or less aqueous medium over the pH range 1 to
8, the drug is called a highly soluble drug. When a test drug has an extent of absorption
>90% from the intestinal mucosa in humans, the drug is considered as highly permeable
drugs.
Table 1.1: The Biopharmaceutical classification system
BCS
Class
Solubility permeability Absorption
pattern
Examples of
drugs
Class I High high Well
Class
II
Low High Well Metoprolol,
propranolol
Class
III
High Low Various Danazol,
nifedipine
Class
IV
Low Low poor Taxol,
furosemide
From FDA Guidance for industry (2000) and Amidon et al (1995)

6 | P a g e
Drug dissolves very fast and drug absorption is good in class I drugs. There is no
bioavailability problem usually in this class for IR drug products. Dissolution is a rate
limiting step for class II drugs and bioavailability is generally controlled by the drug dosage
form as well as release rate of the drug substance. Drug is permeability limited in class III
drugs and bioavailability may not be completed if drug is not released from the dosage form
and dissolved in the absorption window. Finally, both the dissolution and permeability are
limited steps and an alternative route of administration is needed for class IV drugs (Shargel,
Wu-Pong, & Yu, 2012).
Solid dispersion technique is used to increase the solubility and dissolution performance of
drugs by using carriers with the target drug. In this case, BCS II drugs are the suitable
candidates for solid dispersion technique as dissolution is the rate limiting step for the
absorption of drugs in this class and solid dispersion techniques can show promising
improvement of the dissolution performance (Singh, Baghel, & Yadav, 2011).

7 | P a g e
1.5 Definition of Solid Dispersion
Sekiguchi and Obi in 1961 first proposed the utilization of solid dispersion for increasing the
dissolution performance and oral bioavailability of poorly water soluble drugs. They
proposed a solid dispersion formulation as a eutectic mixture where the poorly water soluble
drugs are dispersed in a physiologically inert and easily water soluble carriers.
Next, Chiou and Riegelman in 1971 termed solid dispersion as “the dispersion of one or
more active ingredients in an inert carrier matrix at solid-state prepared by the melting
(fusion), solvent or melting-solvent method”.
Mayersohn and Gibaldi in 1966 called solid dispersion as “Solid State”.
Corrigan defined solid dispersion as “Product formed by converting a fluid drug-carrrier
combination to the solid state”.
In current review works Dhirendra et al defined solid dispersion as “a group of solid
products consisting of at least two different components, generally a hydrophilic matrix and
hydrophobic drug. The matrix can be either crystalline or amorphous. The drug can be
dispersed molecularly,in amorphous particles (clusters) or in crystalline particles” (Saffoon,
Uddin, Huda, & Bishwajit, 2011).
Some drugs whose solubility performance is enhanced by solid dispersion are- Mifepristone,
Dyhdroartemisinin, Furosemide, Piroxicam and Others (Ingle, Gaikwad, Bankar, & Pawar,
2011).

8 | P a g e
1.6 Advantages of solid dispersion The common advantages of solid dispersion are-
1. Particles with reduced particle size and increased dissolution rate:
From the Noyes –whitney equation it is clear that increasing the surface area is one way to
increase the dissolution of the poor water soluble drugs and this can be obtained through
reducing particle size. For reducing particle size many common methods are used like
micronization, recrystallization, and freeze drying and spray drying. For many years
micronization is used to reduce the particle size in the pharmaceutical industries but the
main disadvantages are aggregation, agglomeration and poor wettability of the fine particles.
This leads to have poor dissolution performance. On the other hand, in solid dispersion the
particle size of the drug is reduced to the minimum level to prevent aggregation and
agglomeration. Additionally, the solubilizing and wettability properties of the carriers
contribute to increase the dissolution rate.
2. Particles with improved Wettability:
The enhancement of solubility of poor water soluble drugs is due to the improved wettability
of the particles and carriers used in the solid dispersion contribute this property. Moreover,
addition of surface active agents in the third generation solid dispersion with both drug and
polymeric carriers greatly enhance the dissolution of the drug particles.
3. Particles with higher porosity:
Normally the increased porosity can lead to increase drug release profile and the carriers
used in the solid dispersion usually contribute the porosity of the particles in the
formulation.

9 | P a g e
4. Drugs in Amorphous state:
Amorphous state of crystalline drugs which are poorly water soluble has greater water
solubility due to no energy requirement to break up the crystalline lattice in the dissolution
process. Second and third generation solid dispersions are in the amorphous state and thus
enhance the dissolution performance (Kumari, Chandel, & Kapoor, 2013).
1.7 Applications of Solid Dispersion
Some of the applications of solid dispersion are given below-
In case of lung transplant patients, it helps to improve immunosuppressive therapy
through formulation of dry powder solid dispersion for inhalation. This formulation can
avoid problems associated with the use of local anesthesia and irritating solvents.
Solid dispersion formulations accelerate the onset of action of NSAIDS when they are
needed crucially for acute pain and inflammation.
To improve patient comfort and compliance the standard injections of anti cancer drugs
can be substituted with their oral dosage solid dispersion form (Kumari, Chandel, &
Kapoor, 2013).

10 | P a g e
1.8 Disadvantages of Solid Dispersion
2. Problems with dosage form Formulation:
a. Poor flow and compressibility-
In sieving and pulverization process, solid dispersion shows complexity. In addition it shows
compressibility and stability problems.
To avoid these problems drug granulation follows in-situ granulation method. At first the
excipients are pre-heated and rotated by using water jacket blender at 700C. Next, the drug
and carrier mixture is melted at 1000C and is added in the moving power of excipients. After
that, granules are passed through a 20-mesh sieve and harden at 250C. Finally, magnesium
stearate (1%) is mixed with the granules and compressed to form tablets. However, wet
granulation process cannot use here due to the possibility of disruption of its physical
structure.
b. Sticking of granules of solid dispersion to Die and Punches:
The formulations of solid dispersion usually stick to the die and punches. For that, a grease
proof paper is placed between the metal surface of the die and punches and the granules to
avoid their direct contact.
3. Problems with manufacturing:
a. Risk of moisture during cooling process of the solid dispersion:
In the condensation process during evaporation moisture can be trapped in the solid
dispersion. A continuous cooling process is done on the surface moving belt or rotating to
avoid this problem.
b. Reproducibility of the physical and chemical properties:
Investigators observe that the manufacturing conditions like rate of heating, the temperature,
and rate of cooling and cooling methods, pulverization methods, and particle size influence
the physical and chemical properties of solid dispersion.
c. Stability problems:
In hot melt method, a certain fraction of drug sometimes remains dispersed in carrier
molecularly. That result in the separation of amorphous and crystalline phase.

11 | P a g e
To overcome such problems some common carriers like PVP, HPMC etc are used. These
carriers form kinetic barrier to nucleation and the rate of efficiency of the barrier is directly
proportional to the concentration of the polymer and is independent of the physical and
chemical properties of that polymer. (Ingle, Gaikwad, Bankar, & Pawar, 2011) (Craig, 2002).

12 | P a g e
1.9 Advantages of Solid Dispersions over the Other Strategies
The popular strategies to improve the dissolution and bioavailability of poor water soluble
drugs can be divided into two categories’, they are-
Chemical Approaches
Formulation Approaches
Chemical Approaches:
In this approaches the bioavailability of poorly water soluble drugs are increased by using
one of the following ways-
Salt Formation
Introducing a polar group in the Structure
Introducing an ionized group. In these ways the active target site of the drugs is kept
unchanged and resulting in the formation of pro-drugs.
However, Chemical approaches have such limitations like-
Formation of pro-drug is difficult task
Salt formation can only be used for weakly acidic or basic drugs but not for the
neutral
Salt formation can hamper the bioavailability of drugs in vivo due to the formation of
acidic or basic form
In case of NCE, sponsoring company has to perform clinical trials for chemical
approaches
On the other hand, solid dispersions have no such problems. They are easy to produce
and more applicable. In addition, the formulation of drugs in solid dispersion
techniques gives option to choose methods among various methods and excipients
option. Hence, the process provides flexibility to formulate oral dosages form of poor
water soluble drugs (Singh, Baghel, & Yadav, 2011).

13 | P a g e
Formulation Approaches:
Formulation approaches to improve the aqueous solubility of poor water soluble drugs are-
Particle Size Reduction
Solubilization
Solid Dispersion.
Between the solubilization and solid dispersion , solid dispersion are more preferable
to most of the patients since it provides the solid oral dosages form then the products
of solubilization.
The particle size reduction is most common way to improve the bioavailability of
poor water soluble drugs on the basis of increase surface area of the drugs, but it also
has certain disadvantages which limit it’s use to use as a convenient method to
improve aqueous solubility. The disadvantages are-
The limit of the milling or micronization process to reduce particle size is around 2-
5mm which does not frequently increase the bioavailability and the drug release in
the small intestine.
They have poor mechanical properties such as low flow properties and high adhesion
capacity.
The fine particles of the drugs are difficult to handle.
Micronizing of drugs can lead to formation of agglomerate of particles which gives
poor wettability of drugs.
The water soluble carrier in solid dispersion reduced all the above problems and
increase dissolution. The drugs need not to be micronized in solid dispersions. Here
the fraction of drug molecularly disperse in the matrix of carrier and in exposure of
aqueous media the carrier dissolve where drug releases as fine colloidal. This gives
greater dissolution rate as a result of sufficient surface area enhancement. Moreover,
one portion of drug dissolves and saturates the gastrointestinal fluid and rest of the
drugs precipitates as fine colloidal particles or oily globules of submicron size
(Singh, Baghel, & Yadav, 2011).

14 | P a g e
1.10 Factors that Influence the Drug Release from the Solid Dispersion
Nature Of carriers:
Drug release of poorly water soluble drug from the formulation depends on the nature of the
carriers used in the formulation. The nature of carriers can be either hydrophilic or
hydrophobic. So, incorporation of drug in hydrophobic or slightly water soluble carrier
result in retardation of drug release from the matrix and incorporation of drug in hydrophilic
or water soluble carriers result in acceleration of drug release.
Drug Carrier Ratio:
The dissolution rate of drug release increases with the increase proportion of drug carrier but
it is up to certain limit of the ratio. Beyond the certain limit the rate of the drug dissolution
decreases.
Method of Preparation:
Generally solid dispersion prepared by melting method shows greater effect and faster
dissolution rate the solvent method and co-grinding method. However, among all the
methods a particular method can show greater effectiveness for a particular solid dispersion
formulation.
Cooling condition:
The cooling condition is a important factor specially for the solid dispersion prepared by
melting method. The rate of cooling whether faster or slower affects the rate of dissolution.
Synergistic Effect of Two Carriers Used:
If two carriers are used in the solid dispersion technique, their synergistic effect is then
considered as an important factor. The different properties of two carriers can attribute to
increase the dissolution performance of the poorly water soluble drugs (Bhusnure, Kazi,
Gholve, Ansari, & Kazi, 2014).
1.11 Classification of Solid Dispersion

15 | P a g e
Solid dispersion is classified on the basis of two criteria-
On the basis of carrier used
On the basis of solid state structure in the solid state (Bhusnure, Kazi, Gholve, Ansari, &
Kazi, 2014)
On the basis of carrier used solid dispersion is classified into three types. They are briefly
described below-
I. First generation solid dispersion:
In 1961, Sekiguchi and Obi developed first generation solid dispersion. First
generation solid dispersion is prepared by crystalline carriers for instance urea, sugar.
The preparation of eutectic mixture that was prepared by Sekiguchi and Obi showed
better drug release which resulted in increased bioavailability than the conventional
formulations of the same drug. The main reasons of this better drug release are small
particle size and the better wettability (Singh, Baghel, & Yadav, 2011).
The major disadvantage of this type is it leads to the formation of crystalline solid
dispersion that is thermodynamically more stable then the amorphous ones results in
slower drug release from the dosage form (Kumari, Chandel, & Kapoor, 2013).
II. Second generation solid dispersion:
A second generation solid dispersion appeared in the late sixties to overcome the
problems associated with the first generation solid dispersion. Here polymers are
used instead of crystalline carriers.
This type originates a homogenous molecular interaction between drug and
polymeric carriers because they are totally miscible, soluble and possesses higher
interaction energy between the drug and the carriers. It also reduce particle size and
gives better wettability to increase the bioavailability of the poorly water soluble
drugs but works greater than the first generation solid dispersion (Singh, Baghel, &
Yadav, 2011).
The different kinds of polymers used in the second generation are-

16 | P a g e
- Fully synthetic polymers-
E.g.polyvinylpyrrolidone(povidone),polyethylene glycols, polymethacrylates.
- Natural product based polymers ( cellulose derivatives, starch derivatives)-
E.g. hydroxypropylmellylcellulose, ehtylcellulose, hydroxypropylcellulose,
cyclodextrins (Bhusnure, Kazi, Gholve, Ansari, & Kazi, 2014).
III. Third generation solid dispersion:
The third generation solid dispersion appears to solve the problems with first and
second generation. Second generation solid dispersion has some common problems
like recrystallization, chemical and physical instability etc. fortunately addition of
surfactants with the second generation carriers can solve almost all the problems
associated with second generation solid dispersion. So, adding surface active agent
with the polymeric carriers is referred to as third generation solid dispersion. In third
generation solid dispersion, the formulation can be stabilized for at least sixteen
month. It also helps the formulation containing polymeric carriers to prevent
recrystallization and precipitation which can be occurred from the agglomeration of
much larger hydrophobic particles (Singh, Baghel, & Yadav, 2011).
The common surfactants used in the third generation solid dispersion are inulin,
inutec SP1, compritol 888 ATO, gelucire 44/14 and poloxamer 407 (Bhusnure, Kazi,
Gholve, Ansari, & Kazi, 2014).

17 | P a g e
On the basis of solid state structure, solid dispersion is classified into
following ways-
A. Drug and polymer exhibiting immiscibility in the fluid state:
The immiscible mixtures of drug and polymer in their fluid state are
grouped in this class. In addition, the mixture of drug and polymer
normally do not exhibit miscibility on the solidification of the fluid state
and phase separation can be occurred. They may enhance the dissolution
performance through following ways-
-modifying the morphology of drug and/or polymer because of physical
transformation.
- intimate drug/polymer mixture
-enhancing surface area
However, the rate of solidification of mixture and the rate of
crystallization process of drug and/or polymer bias the formation of
crystalline solid dispersion and amorphous solid dispersion.
B. Drug and polymer exhibiting miscibility in the fluid state:
The miscible mixtures of drug and polymers in their fluid state may or
may not show miscibility and phase separation in their solidification
process. Additionally, this state influences the structure of solid
dispersions.
C. Eutectic Mixtures:
In 1961 Sekiguchi and Obi described eutectic mixture as solid dispersion.
When drug and polymer are miscible in their molten state but on cooling
they form two separate components with negligible miscibility is referred
to as eutectic mixture. Generally, the melting point of the eutectic mixture
is lower than the components of the mixture. Here the mechanism is to
increase the surface area of the drug to enhance the bioavailability.

18 | P a g e
D. Crystalline solid dispersion:
In the crystalline solid dispersion, the rate of drug crystallization from the
drug/polymer miscible mixture is greater than the rate of the solidification
of the drug/polymer in their fluid state.
E. Amorphous solid dispersion:
Amorphous solid dispersion can be formed if the drug crystallization is
not allowed by the cooling rate of drug/polymer cooling fluid mixture.
This state can also be referred as “solidified-liquid” state. Still, the
amorphous solid dispersion has potential to form a more stable and less
soluble crystalline formulations.
F. Solid solution:
When drug/polymer mixture is miscible in both fluid and solid state, it is
called solid solution. Generally there are two types of solid solution-
1.Amorphous solid solution
2. Crystalline solid solution
1. Amorphous solid solution:
Amorphous solid solutions are those where the drugs are molecularly dispersed in the
carrier matrix and miscible in both fluid and solid state. This type of solid dispersion is
effective as it increases the surface area in greater rate and enhances the dissolution
performance. Moreover, it enhances physical stability of the formulation through
preventing crystallization by minimizing molecular mobility.
2. Crystalline solid solution :
When a crystalline drug is trapped in crystalline carrier with miscibility in both fluid and
solid state then the solid dispersion is termed as crystalline solid solution.
Again on the basis of miscibility solid solution is divided into two types-
1. Continuous solid solution
2. Discontinuous solid solution

19 | P a g e
1. Continuous solid solution:
The two components are miscible in their solid state in all proportion in case of
continuous solid dispersion.
2. Discontinuous solid solution:
In discontinuous solid dispersion, the two components are immiscible in their
intermediate composition but miscible at extremes of composition.
Furthermore, on the basis of the size of the molecule of the two components, solid
solution is divided into two types. They are-
1. Substitutional solid solution
2. Interstitial solid solution
1. Substitutional solid solution:
In the crtstal lattice the solute molecules substitutes for the solvent molecule to obtain
substitutional solid solution and the molecular size of the two components should not
exceed 15%.
2. Interstitial solid solution:
When the solute molecule occupies the interstitial space in the solvent lattice, interstitial
solid solution can be obtain. Here, the solute is referred as the guest and the solvent is
referred as host. For the interstitial solid solution the ideal molecular diameter of the
solute should be less than 0.59 than the molecular diameter of the solvent. In addition,
the volume of the solute molecules should be less than 20% than the volume of the
solvent molecules (Bhusnure, Kazi, Gholve, Ansari, & Kazi, 2014).

20 | P a g e
1.12 Methods of Solid Dispersion
There is numerous method of solid dispersion. Among them the most common methods are
described briefly in below-
1. Kneading Technique
In this method, at first carrier and drugs are weighted separately. Then carriers are wetted
with water and turn into paste. Next, drugs are added to the paste and kneaded for a
particular time. Lastly, the mixture is dried and passes through sieve.
2. Solvent evaporation method
In solvent evaporation method drugs and carrier are weighted and dissolve in a suitable
organic solvent. After that the solvent is evaporated. Finally, the solid mass is grounded,
sieved and dried.
3. Co-precipitation method
Co-precipitation method involves both water and solvent. Firstly, drug is dissolve in a
suitable organic solvent and carrier is dissolve in water. Next, the aqueous solution of
carrier is added to the drug solution. Then, the solvent is evaporated through heat and
pulverized by using mortar and pestle. Finally, the mixture is dried and sieved.
4. Melting method
Drugs and carrier are weighted perfectly. Next, the drug and carrier are mixed
homogenously by the help of mortar and pestle. Then the whole mixture is melted
through heating at or above the melting point of all the components to get a homogenous
dispersion. After that, the mixture is cooled, pulverized in mortar and pestle, sieved and
dried.

21 | P a g e
5. Co-grinding method
This is one of the simple methods of solid dispersion. In this method the physical mixture
of drug and carrier is obtained through mixing in blender for some time at a particular
speed. Finally, the mixture is pulverized, sieved and stored in dry place at room
temperature.
6. Gel entrapment technique
Here carrier is dissolved in suitable organic solvent and made it into transparent and clear
gel. Then the drug is dissolved in the gel by sonication for few minutes. Next, the solvent
is evaporated under vacuum condition. Finally the solid dispersion is reduced in size by
mortar and sieved.
7. Spray-Drying Method
Spray dry method is a new approach. In this method, drug is dissolve in suitable organic
solvent and carrier is dissolved in water. Afterwards, solution is mixed through sonication
or other suitable methods to get a clear solution. In the final step the solution is spray
dried using spray drier.
8. Lyophilization Technique
This is a costly procedure. Lyophilization technique is also regarded as an alternative
method of solvent evaporation. It is a molecular mixing technique where both drug and
carrier are co-dissolve in a common solvent. Finally the solution is frozen and sublimed
to achieve a lyophilized molecular dispersion.
9. Electrospinning Method
In future this technique can be used in the preparation of solid dispersion. The technique
is the combination of the dispersion technology with the nanotechnology. The stream of
liquid of solid dispersion solution is given a potential between 5 and 30 kV. As a result
fibers of submicron diameters are produced. The fibers can be collected on a screen after
the evaporation of the solvent. Since the technique is simplest and cheapest for producing
nanofibers and controlling the release of biomedicine, the technique has great potential.

22 | P a g e
10. Dropping method solution
In 1997, Ulrich developed the dropping method. The method is said to facilitate the
crystallization process of various chemicals and produces round shape particle in solid
dispersions. At first, physical mixture of drug-carrier is melted at or above the melting
point of the components through heating. Next the melted solid dispersion is pipette and
is dropped on to a plate. Therefore, it produces round particles upon solidification. The
use of carriers that solidifies at room temperature facilitates the process. As it does not
involve any use of solvent it can overcome problems associated with solvent evaporation
method. However, the size and shape of the particles can be influenced by the pipette
size, temperature require to solidify and viscosity of the melted mixture.
11. Direct Capsule Filling
Liquid melt of solid dispersions can directly fill in to the hard gelatin capsule. As a result
it can avoid the problems associated with grinding procedure like changes in the
crystallinity of the drug. It can also avoid cross contamination and operator exposure in
the dust-full environment. In addition, it facilitates better fill weight and content
uniformity (Singh, Baghel, & Yadav, 2011) (Kumari, Chandel, & Kapoor, 2013)
(Saffoon, Uddin, Huda, & Bishwajit, 2011).
12. Physical Mixture Method
It is one of the simple methods in solid dispersion technique but not so effective.
However, homogenous mixture of drugs and carriers can be obtained from drugs and
carriers are weighed and then mixing them in a mortar and pestle by triturating. The
resulted physical mixtures are passed through 44-mesh sieve (generally) and are stored in
desiccators until used for further (Bonthagarala, Nama, Nuthakki, Kiran, & Pasumsrthi,
2014).
23 | P a g e
1.13 Criteria for the selection of carriers
In solid dispersion the performance of the dissolution is improved due to the properties of
the carriers. Selection of a suitable carrier or mixture of carriers for a particular water
insoluble drug follows some common criteria. They are-
They should be water soluble and also readily soluble in gastrointestinal
fluids
They should be physiologically inert
The melting point of the formulation with drug and carrier should be less than
of the drug
The carrier should have thermal stability at melting temperature
They should have low vapor pressure
The carriers should have high molecular weight
They must be non-toxic (Tiwari, Tiwari, Srivastava, & Rai, 2009)
1.14 Polymers used in the Solid Dispersion
Sugars:
Sugars are highly water soluble but due to the toxicity issues, they are not widely used in the
solid dispersion preparation.
Sugars that are commonly used in the solid dispersion formulation are dextrose, sucrose,
lactose, sorbital, maltose, mannitol, galactose.
Acids:
Several researches found out that the rate of drug release can be increased twenty times with
the use of these organic acids. Moreover, they can also increase stability of the formulation
like citric acid shows improved stability in inhalation formulation of spray-dried insulin
powder.
E.g. citric acids, succinic acids, tartaric acids etc

24 | P a g e
Polymeric materials:
a. PEGs are the polymers of ethylene oxide and have MW in the range 200 ± 3, 00,000.
Generally their water solubility is good but the solubility can decrease with MW. The
major advantages of PEGs are they are soluble in many organic solvent and their melting
point (m.p.) remains under 650C. Production of product with sticky consistency is the
main disadvantage of lower MW PEGs.
b. Polyvinyl pyrrolidone (PVP)-
PVP is the polymerization of vinylpyrrolidone and their MW ranges from 2500 to
3,00,000. The advantageous points of PVP are their good solubility in many organic
solvents, good solubility in the water and can improve the wettability of the dispersed
substances. Additionally the chain length is an important factor for increasing the water
solubility of poor water soluble drugs. The aqueous solubility of the PVPs decreases and
they become less viscous with the increased chain length.
c. Cellulose derivatives-
Naturally occurring polysaccharides are known as cellulose and they have higher molecular
weight unbranched chains which forms through joining the saccharide units linking by β-1,
4-glycoside bonds.
Common cellulose derivatives are MC, HPC, HPMC, pectin
Emulsifiers:
Through two mechanisms namely solubilization of the drugs and improvement of wettability
emulsifiers increase the dissolution performance that results in increase aqueous solubility of
poor water soluble drugs. However for exhibiting toxicity they are used with the other
carriers in the solid dispersion preparations.
E.g. poloxomers, gelucire 44/14 and other grades of gelucire etc. Bile salts and their
derivatives are natural emulsifiers.
Surfactants-
Surfactants are used in the third generation solid dispersion to improve the surface area of
the particles to enhance the aqueous solubility of poorly water soluble drugs in greater way.

25 | P a g e
E.g. poloxamers, Tweens (polyethoxylated sorbitan esters), Spans (sorbitan esters),
polyoxethylene stearates etc.
Miscellaneous:
Other carriers are urea (the end product of human protein metabolism), urethanes (a class of
synthetic elastomers), and polyurethane (a polymer containing a chain of organic units
joined by urethane or carbamate links) (Kumari, Chandel, & Kapoor, 2013).
1.15 Reasons for Choosing Combination of PEG6000 and Croscarmellose
Sodium
Firstly, PEG6000 has well an aqueous solubility and miscible with most of the organic
solvent. In addition, its melting point is in 55-65oC range (Kumari, Chandel, & Kapoor,
2013) and has no incompatibility with croscarmellose sodium (Rowe, Sheskey, & Quinn,
2009). Furthermore, the polymer is inexpensive and available.
Secondly, croscarmellose sodium is a super disintegrant. It facilitates the water uptake
through promoting liquid penetration, using capillary forces to suck water into the pores of
granules or tablets (Aulton, 2007). Moreover, it does not show any incompatibility with
PEG6000 in normal condition (Rowe, Sheskey, & Quinn, 2009). Croscarmellose sodium is
also inexpensive and available.

26 | P a g e
1.16 Fenofibrate
1.16.1 Description
Fenofibrate, isopropyl ester of 2-[4-(4-chlorobenzoyl)phenoxy]-2-methyl propanoic acid, is
hydrophobic in nature and has molecular weight of 360.84. Fenofibrate is white or almost
white, crystalline powder. It is practically insoluble in water, slightly soluble in alcohol and
very soluble in methylene chloride (BP, 2005). Its melting point is 79-82oC.
1.16.2 Clinical Pharmacology
Fenofibrate is a lipid lowering drug and fall under fibrates group of hypolipidaemic drugs.
Fibrates are isobutyric acid derivatives. Fenofibrate is a second generation prodrug fibric
acid derivatives. They primarily activate lipoprotein lipase (a key enzyme in the degradation
of VLDL). Consequently, it lowers the circulating TGs. Lipropotein lipase production and
fatty acid oxidation increase through the activation of PPAR- (a gene transcription
regulating the expression of receptor in liver, fat and muscles). In addition second generation
fibrates like fenofibrates also mediate enhanced LDL receptor expression in liver (Singh,
Baghel, & Yadav, 2011).
Fenofibrate is most effective in type III, IV and V hyperlipoproteinaemia. The drug may use
as an adjuvant drug in type IIb patients. The reported adverse effects are myalgia and
hepatitis rashes (Tripathi, 2008).
1.16.3 Fenofibrate as an Ideal Candidate for Solid Dispersion
Fenofibrate is an ideal candidate for solid dispersion as it is in BCS class II drug that have
low aqueous solubility and high permeability. Hence, bioavailability is a rate limiting step
for the absorption of drug from the gastrointestinal tract. The drug is practically insoluble in
water where it has higher lipophilicity (log= 5.24). Recently this drug is marketed in 85
countries and available mostly in micronized form (Singh, Baghel, & Yadav, 2011).

27 | P a g e
1.17 Literature Review
Dissolution enhancement work on Fenofibrate using the combination of croscarmellose
sodium and PEG6000 has not been done yet. Very few works have been done with
PEG6000 using physical mixture method and solvent method with ethanol.
In research work of “Study on the effect of different polymers on in-vitro dissolution profile
of Fenofibrate by solid dispersion technique” in “Journal of Applied Pharmaceutical
Science” the solid dispersion with PEG6000 was carried out using solvent method. The
formulation containing 1200mg PEG6000 has showed greater dissolution 100.61% within
60 minutes of dissolution (Saffoon, Uddin, Huda, & Bishwajit, 2011).
In “Solubility enhancement and solid state characterization of Fenofibrate solid dispersions
with polyethylene glycol 6000 and 8000” in “Journal of Pharmacy Research” physical
method and melting method were carried out at drug and PEG6000 ratio 1:1, 1:2, 1:3 and
1:5. It has been found out that the dissolution performance increases with increasing amount
of PEG6000 (Bonthagarala, Nama, Nuthakki, Kiran, & Pasumsrthi, 2014).

28 | P a g e
Chapter 2:
Methodology

29 | P a g e
2.1 List of Instruments, Apparatus and Glass Wares
Table 2.1: List of instruments and equipment used in the analysis
Serial
Number
Instrument Model/Manufacturer Country of
Origin
1 Electronic balance Shimadzu Japan
2 Dissolution Tester Logan Instruments Corp.,UDT-804
USA
3 UV-Visible Spectrophotometer
Hitachi Japan
4 Water suction filtration
Shimadzu Bangladesh
Table 2.2: List of apparatus and glass wares used in the experiment
Serial
Number Name Specification
1 Volumetric flask 10ml
2 Pipette(graduated & volumetric)
1ml,10ml
3 Beakers 10ml,50ml,100ml
4 Measuring cylinder 100ml,1000ml
5 Pipette filler Bangladesh
6 Mortar & Pestle Small

30 | P a g e
2.2 Preparation of 0.72% sodium lauryl sulphate 7.2g of sodium lauryl sulphate was dissolved in 1000ml of distilled water to produce 1litre
0.72% dissolution media.
2.3 Preparation of Solid Dispersion by Solvent Method 200mg of seven times Fenofibrate were correctly weighed and were kept in seven 10ml
beakers separately. 8ml of ehanol was added in each formulation (F4, F5, F6, F8, F9, F10
and F11). Drug was completely dissolved in the solvent. Different ratios of PEG6000 and
croscarmellose sodium were added in the solution at specific amount according to
formulations. Then they were sonicated for five minutes. All solutions were kept at normal
environment for one day. When the solutions were evaporated completely, they were
crushed in morter and pestle.
2.4 Preparation of Physical Mixture Method
Physical mixture of Fenofibrate with different combination of PEG6000 and croscarmellose
sodium of from F1 to F13 was prepared separately. In each formulation Fenofibrate and the
combine form of PEG6000 and croscarmellose sodium at specific amount according to the
formulation were accurately weighed, pulverized and then mixed thoroughly by light
tituration for five minutes in small mortar and pestle for each formulation until homogenous
mixture was obtained.

31 | P a g e
2.5 List of Formulation Code with their Compositions and Respective
Method
Table 2.3 is showing the composition of each formulation both in physical mixture method
and solvent evaporation method. Here the pure drug ratio is always same for each
formulation. Only thing differ is the different ratio of combination of PEG6000 and
croscarmellose sodium.

32 | P a g e
Table 2.3: Name of Methods, Compositions & code of Formulation, Ratio of drug and excipients
Name of Methods
Compositions Drug: Polymer: Disintegrate Ratio(mg)
Formulation Code
Physical Mixture
Fenofibrate (200mg)
_ PD
Fenofibrate: PEG6000:
Croscarmellose Sodium
200:2:5 F1 200:5:10 F2 200:10:20 F3 200:15:30 F4 200:20:40 F5 200:30:60 F6 200:80:160 F7 200:40:20 F8 200:50:25 F9 200:60:30 F10 200:70:35 F11 200:80:40 F12
200:160:80 F13
Solvent Method
Fenofibrate: PEG6000:
Croscarmellose Sodium
200:15:30 F4 200:20:40 F5 200:30:60 F6 200:40:20 F8 200:50:25 F9 200:60:30 F10 200:70:35 F11

33 | P a g e
2.6 Pictures & Images of the Instruments
Figure 2.1: Picture showing an electronic balance
Figure 2.2: Picture showing UV-Visible spectrophotometer

34 | P a g e
Figure 2.3: Picture showing dissolution tester
Figure 2.4: Picture showing the paddle of dissolution tester

35 | P a g e
2.7 In vitro Dissolution Study 2.7.1Principle
Release rate of fenofibrate solid dispersions are carried on according to the general
procedure of United States Pharmacopoeia (USP). Samples of dissolution fluid are
withdrawn and analyzed by UV Spectrophotometer. The measurement is done at the
wavelength at which the absorption is maximum. By comparing with absorbance of
standard solution, the amount of active fenofibrate in solid dispersions released is
calculated.
2.7.2 Conditions
Table 2.4: Conditions in dissolution testing
Apparatus USP 2 Paddle Dissolution medium 0.72% Sodium lauryl sulfate in distilled
water, 1000mL, deaerated. Temperature 36.7oC (±0.5) Stirring Speed 75rpm Time 30 inutes
2.7.3 Preparation of Standard Solution
10mg of working standard of Fenofibrate was weighed and transferred into a clean
and dry 10ml volumetric flask. Then 10ml of methanol was added to the volumetric
flask and shaken properly to get concentration about 1000µg/ml. 2ml of above stock
solution was diluted to 10ml with methanol in another 10ml volumetric flask to get a
secondary stock solution of 200µg/ml. From this stock solution series of dilutions
with concentration of 5, 10, 15, 20, 25, 30µg/ml in methanol were prepared in
separate volumetric flasks.

36 | P a g e
2.7.3Standard Curve of Fenofibrate
Table 2.5: Standard Curve of Fenofibrate
Concentration (µg/ml) Absorbance
5 0.1
10 0.21
15 0.32
20 0.434
25 0.54
30 0.62
Figure 2.5: Standard curve of Fenofibrate
y = 0.0212x
R² = 0.9975
0
0.1
0.2
0.3
0.4
0.5
0.6
0.7
0 5 10 15 20 25 30 35
Ab
sorb
ance
Concentration (µg/ml)
Standard Curve of Fenofibrate
Absorbance
Linear (Absorbance)

37 | P a g e
2.7.1 Preparation of Sample Solutions
1000ml of dissolution media was placed into each of six dissolution vessels and
the temperature was set to 370C (±0.5). Solid dispersion formulations were
transferred to each six baskets. The baskets were immersed into the medium to a
distance 25±2 mm between the basket and bottom of the vessel. The apparatus
was started to operate at the specified rpm. At the end of 30min, 10ml samples
were withdrawn from each vessel. 1ml sample from that withdrawn sample was
taken in a 10ml volumetric flask and 9ml media was added to it. This was done
for every withdrawn sample to get a concentration of 20µg/ml.
Then the absorbance of the above solution in a 1cm silica cell were measured at
the wavelength of maximum absorbance at 290mm(according to USP) by UV-
visible spectrophotometer using media as blank. The percentage of drug release
from the solid dispersion formulations were calculated with the help of straight-
line equation obtained from the standard curve of Fenofibrate. The dissolution
was continued for 30 minute in the in-vitro condition.
2.8 Collection of Samples
The source of Fenofibrate was Nexchem pharmaceutical company, china. PEG 6000 and
Croscarmellose sodium were obtained pharmaceutical technology laboratory in Pharmacy
department of BRAC University. All other reagents and solvent used were of analytical
grade.
38 | P a g e
Chapter 3:
Result and Discussion

39 | P a g e
3.1 In Vitro Dissolution Study Results
Table 3.1: Table showing percentage of drug release in physical method from F1 to F7
Physical Mixture
Formulation Code % of Drug Release
PD 8.9 F1 10.5 F2 29 F3 29.5 F4 31 F5 32.5 F6 22 F7 22.5
Figure 3.1: The line showing the increase and decrease of the percentage of drug release in
physical Mixture from F1 to F7
% 0f drug release
0
10
20
30
40
F1 F2 F3 F4 F5 F6 F7
% o
f D
rug R
ele
ase
Formulation Code
Graphical representation of percentage of drug release in
"Physical Mixture" method
% 0f drug release

40 | P a g e
Figure 3.2: Bar chart showing the percentage of drug release in physical mixture from F1 to
F7
0
5
10
15
20
25
30
35
PD F1 F2 F3 F4 F5 F6 F7
8.9
10.5
29 29.5
31
32.5
22 22.5
% o
f D
rug
Re
leas
e
Formulation Code
Graphical representation of percentage of drug release in
"Physical Mixture" method
% 0f drug release

41 | P a g e
Table 3.2: Table showing percentage of drug release in physical mixture from F8 to F13
Figure 3.3: The line showing the increase and decrease of the percentage of drug release in
physical mixture from F8 to F13
% 0f drug release
0
20
40
60
80
100
PD F8 F9 F10 F11 F12 F13
% o
f D
rug R
ele
ase
Formulation Code
% Of drug release in "Physical Mixture" method
% 0f drug release
Physical Mixture
Formulation Code % of Drug release
PD 8.9 F8
40 F9
42.5 F10
47.5 F11 83 F12
35 F13
25.5

42 | P a g e
Figure 3.4: Bar chart showing the percentage of drug release in physical mixture from F8 to
F13
0
10
20
30
40
50
60
70
80
90
PD F8 F9 F10 F11 F12 F13
8.9
40 42.5
47.5
83
35
25.5
% o
f D
rug R
ele
ase
Formulation Code
Graphical representation of percentage of drug release in
"Physical Mixture" method
% 0f drug release

43 | P a g e
Table 3.3: Table showing percentage of drug release in Solvent method from F4 to F6
Solvent Method
Formulation Code % of Drug Release
PD 8.9
F4 30.5
F5 32.5
F6 39
Figure 3.5: The line showing the increase and decrease of the percentage of drug release in
Solvent method from F4 to F6
% of Drug Release
0
10
20
30
40
PDF4
F5F6
% o
f Dru
g Re
lease
Formulation Code
% Of drug release in "Solvent Method"
% of Drug Release

44 | P a g e
Figure 3.6: Bar chart showing the percentage of drug release in Solvent Method from F4 to
F6
0
5
10
15
20
25
30
35
40
PD F4 F5 F6
8.9
30.5
32.5
39
% o
f Dru
g Re
lease
Formulation Code
Graphical representation of percentage of drug release in
"Solvent Method"
% of Drug Release
45 | P a g e
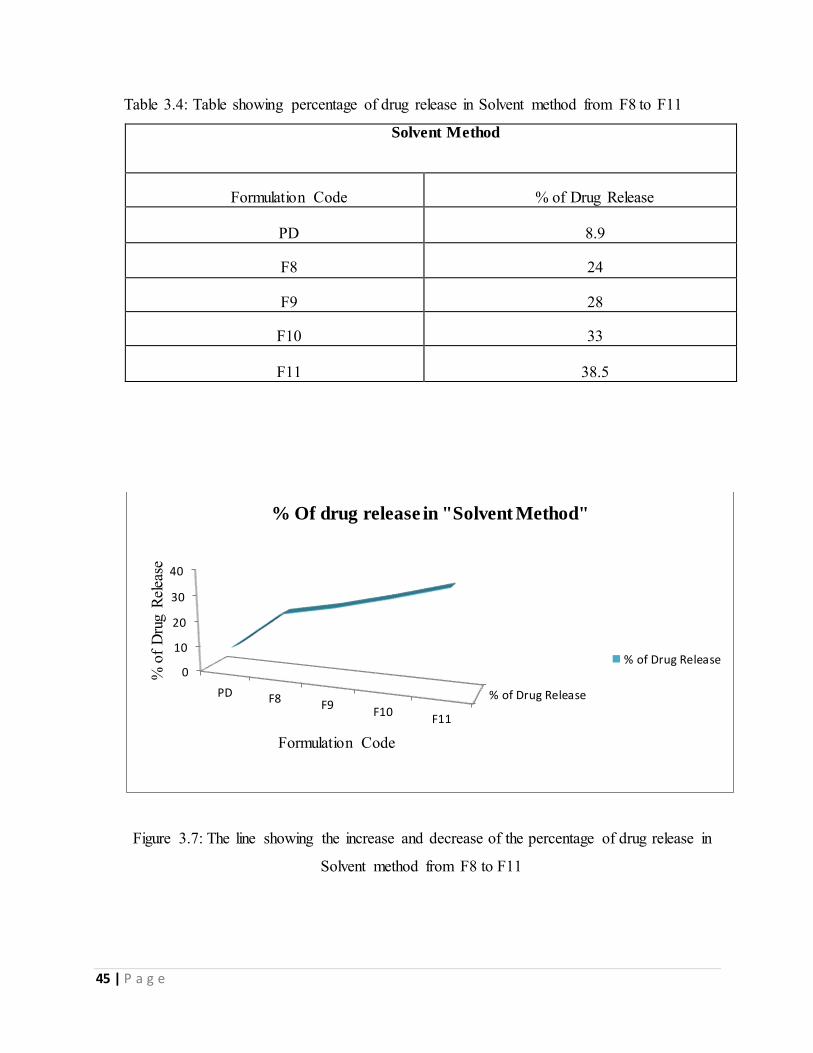
Table 3.4: Table showing percentage of drug release in Solvent method from F8 to F11
Solvent Method
Formulation Code % of Drug Release
PD 8.9
F8 24
F9 28
F10 33
F11 38.5
Figure 3.7: The line showing the increase and decrease of the percentage of drug release in
Solvent method from F8 to F11
% of Drug Release
0
10
20
30
40
PD F8 F9F10
F11
% o
f Dru
g Re
lease
Formulation Code
% Of drug release in "Solvent Method"
% of Drug Release

46 | P a g e
Figure 3.8: Bar chart showing the percentage of drug release in Solvent Method from F8 to
F11
0
5
10
15
20
25
30
35
40
PD F8 F9 F10 F11
8.9
24
28
33
38.5
% o
f Dru
g Re
lease
Formulation Code
Graphical representation of percentage of drug release in
"Solvent Method"
% of Drug Release

47 | P a g e
Table 3.5: Table showing Difference percentage of drug release in Solvent method and
Physical Method from F4 to F6
Formulation Code % of Drug Release in
Solvent Method % of Drug Release in
Physical Mixture
F4 30.5 31
F5 32.5 32.5
F6 39 22
Figure 3.9: Bar Chart showing Difference in percentage of drug release Between Solvent
method and Physical Method from F4 to F6
30.5
32.5
39
31
32.5
22
0 10 20 30 40 50
F4
F5
F6
% of Drug Release
Form
ulatio
n C
ode
Graphical representation of percentage of drug release in
Solvent and Physical Methods
% of Drug Release inPhysical Mixture
% of Drug Release inSolvent Method

48 | P a g e
Table 3.6: Table showing Difference percentage of drug release in Solvent method and
Physical Method from F8 to F11
Formulation Code % of Drug Release in Solvent SD Method
% of Drug Release in Co-grinding SD Method
F8 24 40
F9 28 42.5
F10 33 47.5
F11 38.5 83
Figure 3.10: Bar Chart showing Difference in percentage of drug release Between Solvent
method And Physical Method from F8 to F11
24
28
33
38.5
40
42.5
47.5
83
F8
F9
F10
F11
% of drug release
Form
ulatio
n C
ode
Graphical representation of percentage of drug release in
Solvent and Physical Methods
% of Drug Release in Co-grinding SD Method % of Drug Release in Solvent SD Method

49 | P a g e
3.2 Discussion
The prime aim of this project is to overcome the solubility problems of Fenofibrate through
two easy and inexpensive methods in solid dispersion named physical mixture method and
solvent evaporation method. Different formulations with different ratio of polymer and
disintegrant mixture were designed. Percentages of drug release of each formulation were
calculated from the slope of the appropriate plot and regression coefficient (r2) was
determined.
Table 3.1 is showing the percentage of drug release in physical mixture method of solid
dispersion from F1 to F7 within 30mintutes. All the formulations showed a small extent of
dissolution improvement from the plain drug. Among these formulations F5 showed higher
percentage of drug release than other and it was 32.5%. It was seen that from F1 to F5 the
percentage of drug release were increasing but from F6 to F7 the percentage of drug release
has fallen to some extent. So it can be said, in the ratio between PEG6000 and
croscarmellose sodium with drug, if the amount of croscarmellose sodium is higher than the
PEG6000 then the percentage of drug release increases. However, from 30:60 ratio of
PEG6000 and croscarmellose sodium with same amount of drug, the percentage of drug
release has fallen. It can be concluded that up to 20:40 ratio the percentage of drug release
increase in physical mixture method but from 30:60 the percentage of drug release falls. As
a hydrophilic polymer PEG6000 offers usually better surface area for the hydrophobic
Fenofibrate drug and croscarmellose sodium as a super disintegrants break up granules into
primary powder particles in order to increase surface area and in addition to facilitate water
uptake. Still high swelling disintegrant like sodium croscarmellose should be given in low
concentration in the formulation or up to (1-5) % (Aulton, 2007). Otherwise the high
concentration of disintegrants make too much fine particles that aggregates and produces
lump instead of deaggregation and affects the dissolution and oral bioavailability. In result,
with high concentration of croscarmellose sodium the percentage of drug release falls. In
figure (3.1 and 3.2) up and downing of the percentage of drug release from F1 to F7 has
shown.
Next, table 3.2 is showing the percentage of drug release in physical mixture method of solid
dispersion from F8 to F13 within 30mintutes. All the formulations showed a small extent of
dissolution improvement from the plain drug. Among these formulations F11 showed higher

50 | P a g e
percentage of drug release than all F1 to F13 and it was 83%. It was seen that from F8 to
F11 the percentage of drug release were increasing but from F12 to F13 the percentage of
drug release has fallen to some extent. So it can be said, in the ratio between PEG6000 and
croscarmellose sodium with drug, if the amount of the PEG6000 is higher than
croscarmellose sodium then the percentage of drug release increases. However, from 80:40
ratio of PEG6000 and croscarmellose sodium with same amount of drug, the percentage of
drug release has fallen. It can be concluded that below 80:40 ratio the percentage of drug
release increase in physical mixture method but from 80:40 the percentage of drug release
falls. The falling of percentage of drug may be due to the higher concentration of both
polymer and disintegrant that form lumps and interact drug release from its dosage form. In
figure (3.3 and 3.4) up and downing of the percentage of drug release from F8 to F13 has
shown.
Several mechanisms may be possible to the enhanced release of Fenofibrate in the physical
mixture method in solid dispersion. The faster dissolution of the drug from the solid
dispersions is attributed to the enhancement of wettability as hydrophilic carrier PEG6000
and disintegrant croscarmellose sodium are used and decrease in the aggregation of the
hydrophobic drug particles.
Table 3.3 is showing the percentage of drug release in solvent evaporation method of solid
dispersion from F4 to F6 within 30mintutes. All the formulations showed a small extent of
dissolution improvement from the plain drug. Among these formulations F6 showed higher
percentage of drug release than other and it was 39%. It was seen that from F4 to F6 the
percentage of drug release were increasing. So it can be said, in the ratio between PEG6000
and croscarmellose sodium with drug and solvent, if the amount of croscarmellose sodium is
higher than the PEG6000 then the percentage of drug release increases. In figure (3.5 and
3.6) the gradual increasing of the percentage of drug release from F4 to F6 has shown.
Table 3.4 is showing the percentage of drug release in solvent evaporation method of solid
dispersion from F8 to F11 within 30mintutes. All the formulations showed a small extent of
dissolution improvement from the plain drug. Among these formulations F11 showed higher
percentage of drug release than other and it was 38.5%. It was seen that from F8 to F11 the
percentage of drug release were increasing. So it can be said, in the ratio between PEG6000
and croscarmellose sodium with drug and solvent, if the amount of the PEG6000 is higher

51 | P a g e
than croscarmellose sodium then the percentage of drug release increases. In figure (3.7 and
3.8) the gradual increasing of the percentage of drug release from F8 to F11 has shown.
Increased dissolution of Fenofibrate in solvent evaporation method of solid dispersion could
be probable reduction in its particle size, wetting of the hydrophobic particles and
amplification of its solubility by PEG6000 and croscarmellose sodium. Furthermore, due to
the uniform distribution when this system comes in contact with an aqueous dissolution
medium, the hydrophilic carrier dissolves and results in fine particles drugs with increased
surface area. Moreover, other factors can be absence of aggregation or crystal growth of
drug during dissolution.
Between physical mixture and solvent evaporation method, physical mixture method
showed better result than solvent method in F4, F5, F6, F8, F9, F10, and F11. The
comparison is shown in table (3.5 and 3.6) and figure (3.9 and 3.10). This is because drug,
polymer and disintegrant have any incompatibility with ehanol and it lowers the percentage
of drug release from the physical mixture in case whether the amount of disintegrant
increases or PEG6000 increases.
In conclusion it can be said that, though in both methods of the solid dispersion the
percentage of drug release within 30minutes have increased to some extent but only
F11(83%) prepared in physical mixture method meet the specifications as the percentage of
Fenofibrate release within 30minutes should be 80% according to USP.

52 | P a g e
Chapter 4:
Conclusion

53 | P a g e
4.1 Conclusion
Physical mixture method and solvent method are two simple and effective methods in solid
dispersion for increase dissolution performance and solubility. The present study was carried
out to investigate the utility of the combination of PEG6000 and croscarmellose sodium in
physical mixture method and solvent method. All the preparations in both physical mixture
method and solvent method have showed better drug dissolution than that of plain drug
within 30minutes. It can be assume that both techniques increase the solubility of the
Fenofibrate in aqueous medium. Therefore, the percentage of drug release showed better
dissolution within 30 minutes. For further investigation with the combination of PEG6000
and croscarmellose sodium and Fenofibrate, this work can help in many ways.

54 | P a g e
References
Abdou, H.M. (1989). Dissolution, Bioavailability and Bioequivalence. P. Easton: Mack Publishing Company.
Aulton, M. E. (2007). Aulton's Pharmaceutics The Design And Manufacture Of Medicines (Third ed.) . China: Elsevier Limited .
Bhusnure, O., Kazi, P., Gholve, S., Ansari, M., & Kazi, S. (2014). Solid Dispersion: An Ever Green Method For Solubility Enhancement Of Poorly Water Soluble Drugs. International Journal Of Research In Pharmacy And Chemistry, 4(4), 906-918. Bonthagarala, B., Nama, S., Nuthakki, S., Kiran, K. V., & Pasumsrthi, P. (2014). Enhancement Of Dissolution Rate Of Fenofibrate By Using Various Solid Dispersion Techniques. World Journal Of Pharmacy And Pharmaceutical Sciences, 3(3) 914-932.
Clugston, M. & Fleming, R. (2000). Advanced Chemistry (First ed.). Oxford, UK: Oxford Publishing. Craig, D. Q. (2002). The Mechanism of Drug release from Solid Dispersions and Water Soluble Polymers. International Journal of Pharmaceutics, 3(1), 131-144. Ingle, U., Gaikwad, P., Bankar, V., & Pawar, S. (2011). A review on solid dispersion: A dissolution enhancement technique. International Journal of Research in Ayurveda and Pharmacy, 2(3), 751-757. Kumari, R., Chandel, P., & Kapoor, A. (2013). Paramount Role Of Solid Dispersion in Enhancement of Solubility. Indo Global Journal of Pharmaceutical Sciences, 3(1), 78-89. Lachman, L., Lieberman, H. A., & Kanig, J. L. (1986). The Theory and Practice of Industrial Pharmacy (Third ed.). United States Of America: Lea and Febiger.
Martin, A. (2011). Solubility and Distribution Phenomena, Physical Pharmacy and Pharmaceutical Sciences (Sixth ed.) .Lippincott Williams and Wilkins.
Rowe, R. C., Sheskey, P. J., & Quinn, M. E. (2009). Handbook of Pharmaceutical Excipients (Sixth ed.) . London and Washington: The Pharmaceutical Press and the American Pharmacists Association.
Saffoon, N., Uddin, R., Huda, N. H., & Bishwajit, K. (2011). Enhancement of Oral Bioavailability and Solid Dispersion: A Review. Journal of Applied Pharmaceutical Science, 1(7), 13-20. Shargel, L., Wu-Pong, S., & Yu, A. B. (2012). Applied Biopharmaceutics and Pharmacokinetics (Sixth ed.) . Singapore: Mc Graw Hill.
Singh, S., Baghel, R. S., & Yadav, L. (2011). A review on solid dispersion. International Journal of Pharmacy & Life sciences, 2(9), 1078-1095.
Tiwari, R., Tiwari, G., Srivastava, B., & Rai, A. K. (2009). Solid Dispersion: An Overview To Modify Bioavailability Of Poorly Water Soluble Drugs. International Journal of PharnTech Research, 1(4), 1338-1349.

55 | P a g e
Tripathi, K. (2008). Essential Medical Pharmacology (Sixth ed.) . New Delhi: Jaypee Brothers Medical Publishers (P) Ltd.
Wagh, M. P., & Patel, J. S. (2010). Biopharmaceutical Classification System: Scientific Basis For Biowaiver Extentions. International Journal of Pharmacy and Pharmaceutical Science,
2(1), 13-19.