Embed Size (px)
Citation preview

Dissolution of Duluth Complex Rock
from the Babbitt and Dunka Road Prospects:
Eight-year laboratory experiment
June 2013
Minnesota Department of Natural Resources Division of Lands and Minerals
500 Lafayette Road, Box 45 Saint Paul, MN 55155-4045


Dissolution of Duluth Complex Rock
from the Babbitt and Dunka Road Prospects:
Eight-year laboratory experiment
June 2013
Kim A. Lapakko Michael C. Olson
David A. Antonson
Minnesota Department of Natural Resources Division of Lands and Minerals
500 Lafayette Road, Box 45 St. Paul, MN 55155-4045

Table of Contents
List of Tables ................................................................................................................................. iii List of Figures ................................................................................................................................ iv List of Appendices ...........................................................................................................................v EXECUTIVE SUMMARY ........................................................................................................... vi 1. INTRODUCTION ..............................................................................................................1 1.1 Background ..............................................................................................................1 1.2 Duluth Complex Geological Summary ....................................................................1 2. OBJECTIVES ......................................................................................................................3 3. METHODS ..........................................................................................................................4 3.1. Materials ..................................................................................................................4
3.1.1. Babbitt Prospect ...........................................................................................4 3.1.2. Dunka Road Prospect ...................................................................................4
3.2. Apparatus .................................................................................................................5 3.2.1. Small Reactors .............................................................................................5 3.2.2. Humidity Cells .............................................................................................5
3.3. Experimental Procedure ...........................................................................................6 3.4. Reaction Conditions .................................................................................................7
3.5. Analyses ...................................................................................................................7 3.5.1. Solid Phase Analyses ...................................................................................7 3.5.2. Drainage Quality Analyses ..........................................................................8
3.6. Release Rate Calculation Methods ..........................................................................8 4. RESULTS ..........................................................................................................................10 4.1. Introduction ............................................................................................................10 4.2. Solid-Phase Analyses .............................................................................................10 4.3 Reaction Conditions ...............................................................................................11 4.3.1 Temperature and Relative Humidity ........................................................11 4.3.2 Water Retention ........................................................................................11 4.3.3 Leachate Volume ......................................................................................12 4.4 Dissolution of Babbitt and Dunka Road rock ........................................................12 4.4.1. Water Quality Replication ........................................................................12 4.4.2. Drainage pH .............................................................................................13 4.4.3. Sulfate Release (Acid Production) ...........................................................13 4.4.4. Major Cation Release (Acid Neutralization) ............................................13 4.4.5. Heavy Metal Concentrations ....................................................................14 i

5. DISCUSSION 5.1 Introduction ............................................................................................................15 5.2 Conceptual Overview.............................................................................................15 5.3 Comparison of Fine-Grained and Coarse-Grain Particles .....................................16 5.4 Comparison of Babbitt and Dunka Road Samples ................................................17 5.4.1. Solids ........................................................................................................18 5.4.2. Solute Release ..........................................................................................18 5.5 Comparison of Duluth Complex Waste Rock and Tailings...................................20 5.6 Comparison of Partridge River and South Kawishiwi Intrusion Samples .............23 6. SUMMARY .......................................................................................................................26 7. ACKNOWLEDGMENTS .................................................................................................28 8. REFERENCES ..................................................................................................................29
ii

List of Tables Table 1. Samples selected from the Dunka Road prospect. .......................................................31 Table 2. Particle size distribution ...............................................................................................32 Table 3. Total sulfur analyses ....................................................................................................33 Table 4. Whole rock chemistry ..................................................................................................34 Table 5. Heavy metal composition ............................................................................................35 Table 6. Babbitt and Dunka Road prospect chemical composition comparison .......................36 Table 7. Babbitt and Dunka Road prospect mineral content and chemistry comparison ..........37 Table 8. Water retention statistics for weeks 1-400 ...................................................................38 Table 9. Annual minimum pH and rates of SO4, Ca, Mg, Na, and K release ............................39 Table 10. Annual minimum pH and rates of SO4, Cu, Ni, Co, and Zn release............................44 Table 11. Total mass release, sulfur and heavy metal depletion ..................................................49 Table 12. Annual linear regression slopes and R2 values ............................................................50 Table 13. Heavy metal release factor analysis for Babbitt and Dunka Road prospect samples ..51 Table 14. Major cation release factor analysis for Babbitt and Dunka Road prospect samples ..52 Table 15. Annual average SO4 release rates for Partridge River and South Kawishiwi intrusion
samples .........................................................................................................................53 Table 16. Rates of metal release from Dunka Mine (SKI) samples ............................................54
iii

List of Figures
Figure 1. Map of Duluth Complex mineral prospects .................................................................55 Figure 2. Schematic of small reactor. ..........................................................................................56 Figure 3. Schematic of humidity cell. .........................................................................................57 Figure 4. Drainage quality replication for 75-g samples .............................................................58 Figure 5. Drainage quality replication for 1000-g samples .........................................................59 Figure 6. Water retention after rinse vs. mass -10 mesh rock .....................................................60 Figure 7. Drainage pH vs. time for Babbitt and Dunka Road prospect samples.........................61 Figure 8. Sulfate release vs. time for Babbitt and Dunka Road prospect samples ......................62 Figure 9. Specific conductivity vs. time for reactors and humidity cell samples........................63 Figure 10. Calcium release vs. time for Babbitt and Dunka Road prospect samples ...................64 Figure 11. Magnesium release vs. time for Babbitt and Dunka Road prospect samples ..............65 Figure 12. Sodium release vs. time for Babbitt and Dunka Road prospect samples .....................66 Figure 13. Potassium release vs. time for Babbitt and Dunka Road prospect samples .................67 Figure 14. Copper release vs. time for Babbitt and Dunka Road prospect samples .....................68 Figure 15. Nickel release vs. time for Babbitt and Dunka Road prospect samples ......................69 Figure 16. Cobalt release vs. time for Babbitt and Dunka Road prospect samples ......................70 Figure 17. Zinc release vs. time for Babbitt and Dunka Road prospect samples ..........................71 Figure 18. Minimum pH vs. %S for Babbitt and Dunka Road prospect samples (weeks 6-400)...............................................................................................................72 Figure 19. Average SO4 release vs. %S for Babbitt and Dunka Road prospect samples (weeks 6-400)...............................................................................................................72 Figure 20. Annual average SO4 release vs. %S (Years 2 and 4) for Babbitt and Dunka Road
prospect samples ..........................................................................................................73 Figure 21. Annual average SO4 release per gram of sulfur vs. time for Babbitt and Dunka Road
prospect samples ..........................................................................................................73 Figure 22. Annual average Ca and Mg release per gram of sulfur vs. time for Babbitt and Dunka
Road prospect samples .................................................................................................74 Figure 23. Annual average Na and K release per gram of sulfur vs. time for Babbitt and Dunka
Road prospect samples .................................................................................................74 Figure 24. Annual average Cu and Ni release per gram of sulfur vs. time for Babbitt and Dunka
Road prospect samples .................................................................................................75 Figure 25. Annual average Co and Zn release per gram of sulfur vs. time for Babbitt and Dunka
Road prospect samples .................................................................................................75 Figure 26. Average Ni and Co release vs. %S for Babbitt and Dunka Road prospect samples (weeks 6-104)...............................................................................................................76 Figure 27. Drainage from 75-g Babbitt (0.31% S) and Dunka Road (0.31% S) samples .............77 Figure 28. Drainage from 1000-g Babbitt (0.21% S) and Dunka Road (0.23% S) samples .........78 Figure 29. Drainage from 1000-g Babbitt (0.33% S) and Dunka Road (0.31% S) samples .........79 Figure 30. Drainage from 1000-g Babbitt (0.55% S) and Dunka Road (0.61% S) samples .........80 Figure 31. Drainage pH and SO4, Ca, Mg release vs. time for 75-g Babbitt (0.20%S) waste rock
sample and 75-g (0.20%S) Duluth Complex unsaturated tailings sample ..................81 Figure 32. Cu, Ni, Co, Zn release vs. time for 75-g Babbitt (0.20%S) waste rock sample and 75-g (0.20%S) Duluth Complex unsaturated tailings sample ......................................82 iv

Figure 33. Copper content vs. %S for Partridge River (PRI) and South Kawishiwi (SKI)
intrusion samples .........................................................................................................83 Figure 34. Nickel content vs. %S for Partridge River (PRI) and South Kawishiwi (SKI) intrusion samples .........................................................................................................83 Figure 35. Cobalt content vs. %S for Partridge River (PRI) and South Kawishiwi (SKI) intrusion samples .........................................................................................................84 Figure 36. Zinc content vs. %S for Partridge River (PRI) and South Kawishiwi (SKI) intrusion samples .........................................................................................................84 Figure 37. Minimum pH vs. %S for Partridge River (PRI) and South Kawishiwi (SKI) intrusion samples (weeks 6-400) .................................................................................85 Figure 38. Week of minimum pH vs. %S for Partridge River (PRI) and South Kawishiwi (SKI) intrusion samples ...............................................................................................85 Figure 39. Annual average SO4 release vs. %S (Years 2 and 6) for Partridge River (PRI) and
South Kawishiwi (SKI) intrusion samples ...................................................................86 Figure 40. Annual average SO4 release per gram of sulfur vs. time for Partridge River (PRI) and South Kawishiwi (SKI) intrusion samples ............................................................86 Figure 41. Average Ni release vs. %S for Partridge River (PRI) and South Kawishiwi (SKI)
intrusion samples (weeks 6-74) ...................................................................................87 Figure 42. Average Cu release vs. %S for Partridge River (PRI) and South Kawishiwi (SKI)
intrusion samples (weeks 6-74) ...................................................................................87 Figure 43. Average Co release vs. %S for Partridge River (PRI) and South Kawishiwi (SKI)
intrusion samples (weeks 6-74) ...................................................................................88 Figure 44. Average Zn release vs. %S for Partridge River (PRI) and South Kawishiwi (SKI)
intrusion samples (weeks 6-74) ...................................................................................88
List of Appendices Appendix 1 Solid phase Appendix 2. Laboratory methods Appendix 3. Drainage quality Appendix 4. Mass release Appendix 5. Quality Assurance program Appendix 6. Additional data analysis
v

0. EXECUTIVE SUMMARY The research reported will be applied in the environmental review and permitting of future nonferrous mines in Minnesota, particularly those in the Duluth Complex. These regulatory activities require prediction of solute release from waste rock during mine operation and in the decades and centuries following mine closure. As a foundation for such predictions, the reactions occurring in waste rock stockpiles and variables affecting these reactions must be understood. This knowledge and a description of the proposed method of waste rock disposal are necessary to 1) design appropriate tests for predicting the release of potential pollutants from waste rock, 2) extrapolate results of such tests to field conditions, and 3) if necessary, implement mitigation measures that will ensure that water resources are not adversely impacted. In the present project, laboratory studies were conducted to examine solute release and variables affecting this release from waste rock from the Partridge River intrusion of the Duluth Complex. The studies provide scientific and technical information necessary to address questions inherent to environmental review and permitting of nonferrous metal mines. The project also provides empirical data describing eight years of rock dissolution for comparison with and extrapolation of data submitted for environmental review and permitting by companies proposing mining in the Duluth Complex. To summarize the laboratory work, dissolution tests were initiated in August 2003 on 10 well-characterized (particle size, chemical composition, mineral content, mineral chemistry) Duluth Complex rock samples from the Babbitt and Dunka Road prospects of the Partridge River intrusion. Dissolution tests were conducted on 10 coarse samples (d < 6.35 mm = 0.25 in.; 0.13 ≤ %S ≤ 1.36) and seven fine samples (0.053 < d < 0.149 mm; 0.07 ≤ %S ≤ 0.94). The experiments remain in progress and the following report presents data generated through week 400. This report summarizes results and provides a conceptual structure to frame these results. In general, drainage pH tended to decrease and release rates of heavy metals (copper, nickel, cobalt, zinc) and major cations (calcium, magnesium, sodium, potassium) tended to increase with increasing sulfur content. These results were consistent with the previously reported 1) dependence of sulfide mineral oxidation (as reflected by sulfate release) and the attendant acid production on the amount of sulfide minerals present and 2) importance of sulfide mineral oxidation as a driving force for release of heavy metals and major cations. More specifically, numerous relationships between drainage quality and both solid-phase sulfur content and dissolution time were identified and quantified to quantitatively describe solute release and its dependence on solid-phase composition and dissolution time. For the 10 coarse samples, drainage pH decreased with increasing sulfur content, with a minimum value of 4.1. For all but the two highest sulfur samples, pH decreased throughout the eight-year experiment. Rates of sulfate release, reflecting sulfide mineral oxidation, increased with increasing sulfur content. The strong correlation between average annual rates for the 10 samples and corresponding sulfur contents was quantified for each year using regression analysis (0.91 < r2 < 0.94). This analysis was used to derive composite annual sulfate release rates (per gram sulfur), which were found to decrease slightly over the eight-year experiment. vi

Release rates for copper, nickel, cobalt, and zinc also correlated highly with sulfur content (typically 0.80 < r2 < 0.95). Magnesium was the dominant cation released, followed by calcium, and sodium. Their releases tended to parallel that of sulfate, reflecting silicate minerals dissolving to neutralize acid produced by iron sulfide mineral oxidation. Similar analysis was conducted on data generated in the seven fine-grained samples. As with the larger particles, drainage pH decreased and release rates for sulfate, heavy metals, and major cations increased with increasing sulfur content. Although the relationship between minimum drainage pH and sulfur content was similar to that for the larger particles, pH from the finer samples declined more rapidly, reaching minimums between weeks 60 and 120. Sulfate release from the fine particles were initially three times those from the coarse particles, reflecting the greater sulfide mineral surface area per unit mass of the fine particles, and this rapid release contributed to the aforementioned early pH depression. Sulfate release rates from the fine particles decreased fairly quickly over time and by year seven equaled those from the coarse particles, for which rates decreased more slowly. The rapid decline of rates from the fine particles was attributed to sulfur depletion and probable coating of sulfide minerals. Dissolution testing of Dunka Road samples was limited to one sample in the 0.053-0.149 mm size fraction and three samples in the d < 6.35 mm fraction. The most notable difference between Dunka Road and Babbitt prospect rock was elevated heavy metal release from the latter. Whereas some of the difference could be ascribed to higher metal content of the Babbitt prospect rock examined, differences between prospects in total sulfide mineral oxidation rates and drainage pH also played a role. Because the number of samples for comparison was limited, these results should be viewed as preliminary. The Partridge River rock samples yielded higher sulfate rates than Partridge River tailings of similar sulfur content, due to greater exposure of sulfide minerals in the rock samples. Heavy metal release from the rock was also higher than that from the tailings. This was due to the aforementioned elevated sulfide mineral exposure, higher heavy metal contents, and lower drainage pH associated with the rock samples. Drainage pH from the Partridge River rock tended to be about 0.7 units higher than that from previously tested South Kawishiwi rock of similar sulfur content. This was attributed to the higher heavy metal content (and consequent lower iron sulfide content) of the Partridge River rock examined in the present study. In conclusion, for both ten coarse and seven fine samples, testing generated data describing drainage pH and release of sulfate, heavy metals, and major cations over a period of eight years. Drainage pH and solute release were correlated with solid-phase sulfur content and time of dissolution. Furthermore, the two data sets allowed comparison of solute release from the two size fractions, consequently providing insight on the influence of particle size. In total, the project 1) quantifies the dependence of drainage pH and release rates of sulfate, heavy metals, and major cations on solid-phase sulfur content, dissolution time, and particle size; 2) interprets results with respect to mineral dissolution reaction; and 3) provides context for the results generated by comparisons with dissolution data on Partridge River tailings and South Kawishiwi intrusion rocks. Thus, the project will help inform design of predictive test programs for
vii
environmental review and permitting and interpretation of results generated by such program. It also provides a robust empirical data base to provide a benchmark for data submitted. Additional work should be conducted to further the benefits generated to date. This includes continued dissolution testing to confidently define long-term trends, analysis of leached solids to increase understanding of chemical reactions controlling solute release (e.g. chemical precipitation and adsorption), and more detailed analysis of the present data, including calculation of mineral dissolution rates. Calculation of mineral dissolution rates will facilitate application of the data generated to a wider range of mineralogical compositions of Duluth Complex rock.
viii

1. INTRODUCTION
1.1. Background Several areas of the Duluth Complex are presently being considered for mineral resource development. Prior to development, potential mine wastes must be characterized (particle size, chemistry, mineralogy, petrology) and well-characterized samples must be subjected to dissolution studies. These studies assess the potential of mine wastes (e.g. waste rock, mine walls, tailings, and processing residues) to adversely impact water resources. The Minnesota Department of Natural Resources is conducting dissolution studies on well-characterized samples of South Kawishiwi intrusion (SKI) Duluth Complex rock. The period of record for some of these samples exceeds 24 years. Although there is some homogeneity in the bulk mineral content of rock throughout the Duluth Complex, the degree to which compositional variations within the complex might affect the water quality resulting from rock dissolution has not been determined. The present project examines laboratory dissolution of rock from a bulk sample in the Babbitt prospect and from drill core samples from the Dunka Road prospect, both in the Partridge River intrusion (PRI) of the Duluth Complex. These samples might simulate waste rock or mine walls resulting from mineral resource development. Two different methods of dissolution testing were used, one of which allows comparison of results from the Partridge River intrusion samples with those from long-term dissolution studies conducted on rock from the Dunka Mine in the South Kawishiwi intrusion of the Duluth Complex. Thus, the present project addresses a comparison of test methods and the dissolution of rock from different locations in the Duluth Complex. The present report summarizes data generated over the first 400 weeks of dissolution testing.
1.2. Duluth Complex Geology Summary Miller et al. (2002) reported on the mineral occurrences and geology of the Duluth Complex, and the following summarizes information on the Partridge River and South Kawishiwi intrusions from that report. Dissolution of rocks from these two intrusions is the focus of the present report. The Partridge River intrusion hosts at least four copper-nickel prospects (Babbitt, Dunka Road, Wetlegs, Wyman Creek) and at least seven potential iron-titanium prospects (Miller et. al., 2002) (Section 17, Longear, Longnose, Wyman Creek, Section 22, Skibo, Water Hen) (Figure 1). The Section 22, Skibo, and Water Hen prospects all lie south, and within 12 miles, of the Wyman Creek prospect and are not depicted in Figure 1. The Partridge River intrusion consists mainly of troctolitic rocks that form an arc-shaped exposure (Figure 1). It is estimated to be 2.5 km thick, and is underlain by the Virginia Formation slates and greywackes and the Biwabik Iron Formation. The basal 900 meters of the intrusion has been subdivided into seven stratigraphic units (Severson and Hauck 1990, 1997; Geerts 1991; Severson 1991, 1994) that can be correlated over a strike length of 24 km. These units dip 10 to 20 degrees to the southeast and have been described in detail due to the presence
1

of copper-nickel (Cu-Ni) mineralization. Rocks overlying the Partridge River intrusion include other Duluth Complex rocks and metamorphosed basalts (probably North Shore Volcanic Group). These rocks are also present in the interior of the intrusion as large inclusions. The contact zone between the Partridge River and South Kawishiwi intrusions is poorly exposed and sparsely drilled. The seven basal units become unrecognizable in the contact zone. This contact is complicated by the presence of a fault (Grano fault of Severson 1994) that was repeatedly activated during and after the emplacement of the two intrusions. The South Kawishiwi intrusion hosts at least five copper-nickel prospects (Spruce Road, South Filson Creek, Maturi, Dunka Pit, Serpentine) and a potential platinum group element copper-nickel prospect (Birch Lake). The South Kawishiwi intrusion is composed of troctolitic rocks exposed in an 8-by-32 kilometer arc-shaped band (Figure 1). The Giant’s Range batholith is the dominant footwall rock, although Virginia Formation and Biwabik Iron Formation underlie the intrusion in some areas. Five major map units in the South Kawishiwi intrusion have been identified, although some geologists have further subdivided these units (e.g. Severson 1994). The units are not continuous throughout the intrusion. Major sulfide mineralization occurs at the base of the intrusion. Virginia Formation and Biwabik Iron Formation inclusions occur throughout the intrusion. Inclusions of basaltic hornfels (probably from the North Shore Volcanic Group) and quartz sandstone hornfels (probably from the Puckwunge and Nopeming sandstones) occur near some of the copper-nickel prospects. The lower ultramafic unit contains the majority of the high platinum group element values.
2

2. OBJECTIVES The objectives of the present research on samples from the Partridge River intrusion of the Duluth Complex are as follows.
1. Determine the variation of laboratory drainage quality and rates of chemical release as a function of sulfur content and time for 0.053 < d < 0.149 mm samples.
2. Determine the variation of laboratory drainage quality and rates of chemical release as a function of sulfur content and time for d < 6.35 mm samples.
3. Compare the dependences of drainage quality and chemical release rates on sulfur
content and time determined for 0.053 < d < 0.149 mm rock with those determined for d < 6.35 mm rock.
4. Compare the dependences of drainage quality and chemical release rates on sulfur
content and time determined for Babbitt prospect rock samples with those generated by Dunka Road rock.
5. Compare results for 0.053 < d < 0.149 mm rock samples with those for Duluth
Complex tailings sample (unsaturated reactor) produced by processing of Duluth Complex rock from the Babbitt prospect on which testing was initiated in 2002.
6. Compare results for 0.053 < d < 0.149 mm rock samples with those for basal Duluth
Complex rock samples from the South Kawishiwi intrusion on which testing was initiated in 1989 and 1990.
3

3. METHODS
3.1. Materials 3.1.1. Babbitt Prospect
Duluth Complex rock samples from the Babbitt prospect were obtained from a bulk sample taken in 2001. The bulk sample site was in the SE of the NW, Section 29, Township 60N, Range 12W, near the approximate location of AMAX drill hole number 321. The excavated area for the bulk sample was approximately 300 feet by 200 feet and had roughly 25 feet of glacial overburden above the bedrock. Although the overburden contained large rocks and boulders, it appeared to be fairly silt-rich. There was a very distinct boundary between the oxidized upper layer of the soil and the lower reducing layer of soil, the upper layer being red and the lower layer being grey. There was at least five feet of the reducing layer above the bedrock, which was not weathered and seemed very competent (Eger 2001). After the bulk sample was blasted, rock was trucked to a loading pocket, crushed to approximately minus six inches, and a sample was taken and transported by rail for metallurgical testing. From the remaining pile, several buckets of rock were collected for possible dissolution testing. Highly mineralized rock, as determined by visual examination, was excluded from this collection. Fourteen samples, approximately two to four kg each, were selected from the buckets. The objective of this sampling was to obtain, by visual examination, samples with a range of sulfur contents. The 14 samples were sent to Lerch Brothers Inc. (Hibbing, MN) where they were stage crushed to −0.64-cm to limit generation of fines. The process entailed screening the drill core sample to −0.64 cm and three crushing steps (large jaw crusher set at 1.92 cm, small jaw crusher set at 0.95 cm, roll crusher set at 0.64 cm). After each of the first two crushing steps, the −0.64 cm fraction was collected and the oversize was passed to the next crushing phase. Five 250-gram samples and one 100-gram sample were split from each bulk sample. The five 250-gram samples were stored in sealed plastic bags until filling the cells. The 100-gram split was pulped for subsequent analysis. Sulfur and carbon dioxide contents of the pulps were determined, and seven samples were selected for dissolution testing in humidity cells based on these analyses. In addition, a 400-gram sample was split from six of the samples, crushed to –100 / +270 mesh (0.053 < d < 0.149 mm) and wet sieved for use in the small reactors. 3.1.2. Dunka Road Prospect The Dunka Road prospect is approximately three kilometers west southwest of the Babbitt prospect (Figure 1). On 16 August 2001, Minnesota Department of Natural Resources (MN DNR) personnel examined information (rock unit, mineral grain size, sulfur and copper content, and visually estimated plagioclase, olivine, and pyroxene contents) on drill holes from the Dunka Road Cu-Ni prospect for the purpose of selecting samples for laboratory waste characterization experiments. The information was from a total of 32 drill holes that were drilled in 1999 and 2000. The drill core had a diameter of either 1 3/4" or 2" (depending on the year of drilling) and 4

the required footage needed for a single laboratory cell was five feet, yielding a mass of approximately 1200 to 2000 grams. Based on the drill core logs and mass requirements 26 intervals were selected, and the core (half of the original) was brought to the MN DNR Hibbing office and sawed in half. One quarter of the core was packaged, labeled, and inventoried in the core building for future work. The remaining core was returned to the mining company. Ten of the inventoried samples were selected for possible use in the laboratory experiment. All samples were stage crushed to –6.35 mm and one sample was crushed and sieved to obtain the 0.053-0.149 mm fraction (see section 3.1.1 for methods). A split of each sample was analyzed for sulfur content at Lerch Brothers Inc. Samples were selected for laboratory testing based on sulfur content. The majority of the samples had relatively low sulfur contents and these samples were excluded from the experiment. A 0.23% sulfur sample was selected for testing in a humidity cell. The remaining higher sulfur samples lacked sufficient mass to run in large cells. Due to the sample mass available a 0.25% sulfur sample was mixed with a 0.36% sulfur sample and a 1.30% sulfur sample was mixed with a 0.03% sulfur sample (Table 1). The two mixed samples were analyzed at Lerch Brothers for sulfur and carbon dioxide. Sulfur contents for the 0.25% and 0.36% S composite and the 1.30% and 0.03%S composite were 0.31% and 0.61% S, respectively. All three samples (0.23, 0.31, 0.61% S) were run in humidity cells using a 1000-gram mass of rock finer than 6.35 mm rock. The 0.31% S sample was also run in a small reactor using a 75-gram mass of 0.053-0.149 mm rock. 3.2. Apparatus
3.2.1. Small Reactors (75 g charge) The samples were placed onto a 1.6-micron Whatman GF/A glass fiber filter (5.5 cm diameter) resting on a perforated plastic plate in the upper section of a two-stage filter unit or reactor (Figure 2). On 19 August 2003 the reactors were filled. A plastic weighing boat was placed on a scale and 75 grams was weighed out and added to the top section of the small reactors. The calculated bed depth was about 15 mm (density = 3 g cm-3, 40% voids, d = 5.66 cm), but the depth was measured as roughly 18 mm after 400 weeks (Appendix 2, Attachment A2.2).
3.2.2. Humidity Cells (1 kg charge) Cylindrical cells (I.D. = 10.2 cm, h = 19.0 cm) constructed of acrylic plastic were used in the experiment. A 0.64-cm high acrylic sleeve was glued into the bottom of the cell to support a 0.16-cm thick PVC plate, which was perforated with 0.32-cm holes spaced 0.48 cm on center. The plate was covered with a polypropylene filter (National Filter Media Corporation, Polymax B, Style 226-075-2) that supported the solids. The bottom was sealed with an acrylic plate with a 0.85-cm outlet port in the center and a removable cover, with a 0.85-cm vent hole, was place on top of the cell (Figure 3). Prior to filling, the cells were acid washed with 10% HNO3 and
5

then rinsed three times with distilled water. The cells were weighed and the weight was recorded on the cell. On 20 August 2003 the cells were each filled with 1000 g of rock. A plastic pan was placed on a scale and four of the five 250-gram splits were added. The weight was generally about 50 grams over the desired 1000-gram sample size. A plastic spoon was used to randomly remove the excess and add it to the remaining 250-gram split. The 1000-gram sample was then poured into the cell. The samples were very dry and some of the very fine dust-like particles were lost due to suction from the exhaust hood. The plastic pan and spoon were rinsed with distilled water after each reactor was filled. The cells with dry solids were weighed and the tare weight recorded. Measured bed depth was in the range of 6.8 to 7.2 cm, and the depth was calculated as 6.9 cm, assuming a density of 3 g cm-3 and 40% voids used for calculation (Appendix 2, Attachment A2.2). 3.3. Experimental Procedure A total of eight small reactors and eleven humidity cells were used. The small reactors were used to allow direct correlation of data with those generated previously using these reactors to examine the dissolution of Duluth Complex rock. The eleven humidity cells were intended to provide a comparison of the small reactors and the ASTM D5744 method that uses these cells (ASTM 2007). Both methods provided for weekly rinsing of solutes from the rock samples. Between rinses the rock samples were maintained at fairly constant temperature and humidity. The solids were rinsed three times (week 0) to remove oxidation products that accumulated on the solids from the time they were processed until the beginning of the experiment. Distilled water (200 mL) was slowly dripped into the small reactors from a buret and was allowed to drain freely from the cell. The reactors have since been rinsed weekly with one 200-mL volume of distilled water. Between rinses these samples are exposed to air and virtually all the pore water evaporates during the one-week oxidation period. For the humidity cells, a rubber cap was placed on the outlet port and 500 mL of distilled water was slowly dripped into each cell from a separatory funnel. The water remained in the cell for ten minutes after the last one was filled, and then the cells were uncapped and allowed to drain. The cells were subsequently rinsed weekly with one 500 mL volume of distilled water. These cells were covered during the oxidation period, and evaporation from them was minimal. Effluent (or drainage) samples were weighed and analyzed for pH, specific conductance, and alkalinity or acidity at the MN DNR laboratory. From the remaining drainage, samples were collected and filtered for subsequent determinations of sulfate and metal concentrations. After filtration, samples to be analyzed for metals were preserved with 0.2 mL Baker Instra-Analyzed nitric acid per 50 mL sample.
6

3.4. Reaction Conditions Between rinses the samples were retained in the cells to oxidize. The cells were stored in a room (8.5 × 10.5 × 9.5 ft) in which temperature and humidity were controlled by commercially available equipment. Temperature was maintained by a thermostatically controlled heater (Lakewood 750) and humidity was maintained by a Holmes HM 3500 humidifier and a Sears Kenmore dehumidifier, both of which were controlled by Honeywell humidistats. Water retention in the small reactors and large cells was determined by weighing. During the first seven weeks of the experiment the units were weighed four to five times a week. Subsequently, weights were determined immediately before and one day after rinsing.
3.5. Analyses
3.5.1. Solid Phase Analyses Samples were analyzed at Lerch Brothers for particle size, total sulfur and carbon dioxide. Particle size distribution for the –6.35-mm samples was determined using method ASTM E 276-93. Total sulfur contents of all samples were determined using a LECO combustion furnace (method ASTM E395-95A) and carbon dioxide content was determined using a gas evolution method (ASTM E350-89C). The remaining solid-phase constituents were determined by Chemex (ALS Minerals) in Reno, NV (Appendix 1, Tables A1.3-A1.8). Whole rock constituents were determined using a lithium borate fusion method (ME-ICP06) and analysis by inductively coupled plasma-atomic emission spectroscopy (ICP-AES). Concentrations of Ag, As, Cd, Co, Cu, Mo, Ni, Pb, Sc, and Zn were determined using a 4-acid digestion for base metals (ME-4ACD81), with analysis by ICP-MS. Other trace elements were determined using a lithium metaborate fusion for resistive elements (ME-MS81). Chemex also measured total sulfur and carbon (by combustion furnace) as well as copper and nickel (aqua regia digestion and ICP) for five size fractions of the -6.35-mm samples (-270 mesh, +270/-100 mesh, +100/-35 mesh, +35/-10 mesh, +10 mesh/-6/35 mm). Peter McSwiggen (McSwiggen & Associates, Minneapolis, MN) determined mineral content and chemistries (Appendix 1, Attachment A1.2). Grains from seven waste rock samples were mounted into a one-inch epoxy mount, which was then polished and carbon coated. Over one hundred grains were randomly selected for analysis. Each grain was analyzed using a JEOL 8600 Electron Probe Microanalyzer (15 kV accelerating voltage, 20 namp beam current, 5 second dwell time, 5 μm beam diameter). McSwiggen determined the grain size distribution of the particles using image analysis techniques. Using the program NIH ImageJ, a threshold was applied to the backscattered electron image to separate the particles from the mounting medium using the intensity of the backscattered electron signal. ImageJ was then used to process the resulting image to determine the actual particles, and then measure each particle’s longest length, perimeter, and area. In Microsoft Excel, the particles were sorted based on their area, and a cumulative area was calculated. The percent cumulative area was than calculated, as well as the circular diameter of
7

each particle. This data was plotted onto percent cumulative area vs. circular diameter graphs in order to determine P5, median, P95 grain size for each sample. This process was done for both the sulfide grains and all grains (Appendix 1, Attachment A1.3). Using the individually measured sulfide particle sizes, the probability of a sulfide grain to be exposed at the surface of a silicate particle was calculated using the radial differences of the sulfide and silicate grains (Appendix 1, Attachment A1.4).
3.5.2. Drainage Quality Analyses Water samples were analyzed for specific conductance, pH, and alkalinity or acidity at the MN DNR laboratory. Specific conductance was analyzed using a Myron L conductivity meter, and an Orion SA720 meter, equipped with a Ross combination pH electrode (8165), was used for pH analyses. Alkalinity (for pH 6.3) and acidity were determined using standard titration techniques for endpoints of 4.5 and 8.3, respectively (APHA et al. 1992). The remaining sample was filtered for metals and sulfate analyses. Metals samples were acidified with 0.2 mL ultra-pure nitric acid per 60 mL sample. Metals and sulfate samples were analyzed at Minnesota Department of Agriculture (MDA) in St. Paul, MN. Ca, Mg, Na, and K were determined with a Varian 400 SPECTRAA; inductively coupled plasma mass spectrometry (ICP-MS, Hewlett Packard HP4500 Series, model #G1820A) was used for the remaining metals analyses. Sulfate concentrations were determined using a Lachat QuickChem 8000 or, for [SO4] < 5 mg/L, a Dionex ion chromatograph. More detailed analyses were conducted on samples collected on weeks 88, 126, 158, and 174 using a Perkin Elmer Elan 6000 ICP-Mass Spectrometer. These analyses were conducted by ACME Analytical Laboratories Ltd., Vancouver, BC. The results are not discussed but are presented in Appendix 1, Attachment A1.1.
3.6. Release Rate Calculation Methods Weekly chemical mass release for each solute was calculated as the product of drainage volume and solute concentration. For weeks that solute concentrations were not determined, the concentration was estimated as the average of previous and subsequent measured values. Cumulative release was calculated as the sum of weekly release values. Rates of solute release were calculated for every week drainage quality samples were analyzed for a specified solute. For each solute, the weekly rate of release was calculated as the product of the volume and solute concentration divided by the rock mass originally present. The weekly release rates were averaged over 52 week periods to determine temporal variability over the 400 week period of record. Standard deviations were calculated to provide a measure of rate variability during the periods. In order to gain a better understanding of the rates of release as a function of sulfur content, the annual average release rates (Tables 9, 10) were plotted as a function of sulfur content for both fine and coarse particles (see Figure 20 for example). A set of graphs for each parameter (SO4, Ca, Mg, Na, K, Cu, Ni, Co, Zn) were developed for each year in the 400 week period of record
8

and a linear regression was fit for each data set (Appendix 4, Figures A4.20-A4.29). The slopes of these regressions were normalized per gram of sulfur (mass of rock x g sulfur/g rock) to calculate an annual composite release rate per gram of sulfur for both particle sizes. These composite rates were plotted annually for comparative purposes between the particle sizes (Figures 21-25). This examination of annual composite release rates per gram of sulfur was done for all parameters (SO4, Ca, Mg, Na, K, Cu, Ni, Co, Zn). The regression fit is very good for those parameters that exhibit a strong correlation with sulfur (i.e. sulfate), but not as good for those that have a weak correlation with sulfur, such as potassium (Table 12). It should be noted that for all parameters these linear regressions have associated y-intercept values (Appendix 4, Table A4.21) that are not accounted for in Figures 21-25. It should also be noted that magnesium release from reactor 7 was omitted due to lower than expected drainage quality which resulted in a weak correlation with respect to sulfur. This does not necessarily mean the drainage quality data from reactor 7 is inaccurate, but rather the magnesium release from this sample does not represent the bulk release from the finer particles as a function of sulfur content.
9

4. RESULTS
4.1. Introduction In August 2003, tests were initiated on the dissolution of Duluth Complex rock samples from the Babbitt and Dunka Road prospects of the Partridge River intrusion. Seven –100/+270 mesh (0.053 < d < 0.149 mm) samples were tested, six from the Babbitt prospect and one from the Dunka Road prospect. Sulfur and carbon dioxide content ranges were 0.07 to 0.94 percent and 0.07 to 0.2 percent, respectively. Ten –0.25-inch (d < 6.35 mm) samples were tested, seven from the Babbitt prospect and three from the Dunka road prospect. Sulfur and carbon dioxide content ranges were 0.13 to 1.36 percent and 0.05 to 0.21 percent, respectively. One sample in each size fraction was run in duplicate and drainage quality for both pairs replicated well (Figures 4, 5). These experiments remain in progress and the following reporting represent an assessment of the data through week 400.
4.2. Solid-Phase Analyses Particle size distribution of the –6.35-mm humidity cell samples was determined. Roughly 29 to 57 percent of the sample masses were finer than 10 mesh (2 mm). The corresponding ranges for 35 and 200 mesh (0.5 and 0.074 mm, respectively) were 12 to 23 percent and 3.4 to 5.6 percent (Table 2). Total sulfur content for the bulk samples ranged from 0.07 to 1.36 percent and correspondingly the carbon dioxide contents ranged from 0.05 to 0.2 percent (Tables 3 and 4). There were no major differences in whole rock chemistry, heavy metal composition, and mineral contents between the reactors and humidity cells. The average major whole rock components were SiO2 (44.8%), Al2O3 (17.2%), and Fe2O3 (14.0%) (Table 4). Average copper, nickel, cobalt and zinc contents were determined as 0.21, 0.06, 0.008, 0.01%, respectively (Table 5). Mineral contents and chemistries were 36-65% plagioclase (Ca0.54-0.67Na0.35-0.46)Al1.52-1.61Si2.34-2.46O8, 12-38% olivine (Mg1.05-1.27Fe0.73-0.98)Si0.97-1.00O4, and 2-19% augite (Ca0.73-0.90Na0.017-0.025)(Mg0.73-
0.82Fe0.27-0.41Ti0.013-0.035)(Si1.91-1.96Al0.07-0.10)O6. Ilmenite, biotite, potassium feldspar, and orthopyroxene were also reported present, on average, at 1-6% (Appendix 1, Attachment A1.2). The Babbitt prospect samples were marginally finer than Dunka Road prospect samples of similar sulfur content (Table 2). Differences in major cation contents were generally small, For example CaO contents of the Babbitt prospect rock that were about 0.8 to 0.9 and times those of the Dunka Road samples (Table 6). The largest difference was observed for potassium, for which Babbitt prospect contents were 1.6 - 2.2 times those of the Dunka Road samples. These differences were reflected in the relative biotite contents of the samples (Table 7). Copper, nickel, and zinc contents of the Babbitt prospect rock were consistently higher than those from the Dunka Road samples and cobalt contents were similar (Table 6).
10

4.3. Reaction Conditions
4.3.1. Temperature and Relative Humidity Over the 400-week period of record temperature and relative humidity (in the room in which reactors and humidity cells were stored) were measured three to four times a week with a Taylor wet-bulb, dry-bulb hygrometer. Average weekly values for temperature ranged from 20 to 28 oC, averaging 23.6 oC (s.d. = 1.3 oC, n = 392). The corresponding range for relative humidity was 42% to 75%, averaging 57.9% (s.d. = 4.2%, n = 392) (Appendix 2, Table A2.2). Data from 3 May to 28 June 2004 were lost. 4.3.2 Water Retention Water retention did not replicate exceptionally well for the duplicate pairs of small reactors or humidity cells. In both cases, the typical variation among different solids appeared to be less than that between the duplicates (Appendix 2, Figures A2.1 and A2.2). The reason for this is unclear. As indicated by results from the following section, drainage quality from the paired reactors was in good agreement, suggesting that the magnitude of the differences in water retention did not substantially affect rock dissolution and the consequent drainage quality. For the small reactors, the average water retention after the rinse ranged from 17 to 27 g. Water retention after the rinse continued to decrease to approximately 5 mL by week 300 and plateaued. The average water retention before the rinse was less than -2 mL (Table 8). The low water retention before the rinse indicated that virtually all water evaporated during the weekly cycle. Although the rate of evaporation was not measured for these samples, daily measurements were made during a six-week trial on the 75 gram, -100/+270 mesh Duluth Complex waste rock samples from South Kawishiwi blast hole samples from the Dunka Mine (MNDNR 2013). These measurements determined that approximately 75% of retained water evaporated within three days of rinsing, with approximately equal amounts lost each day. Reactors were completely dry before the next weekly water addition and, at the rate of drying from the first two days, would have completely dried less than four days after water was added. For the large cells, average water retention after the rinse ranged from 100 to 166 g, and the variation was apparently related to particle size distribution (Table 2). Additional data analysis was conducted to examine the relationship between water retention after the rinse and the fraction of a sample finer than 2 mm. The average water retained after the rinse was plotted against the sample mass occurring in the -10 mesh (2 mm) fraction. Linear regression analysis was conducted and yielded respective slope and intercept values of 0.22 and 34 (n = 11, r2 = 0.713) (Figure 6). The slope suggests that 0.22 g water were retained per gram of -10 mesh rock. Water retention in the -10 mesh fraction was determined using a rock density of 3 g cm-3, estimating a bed with 40% voids, and assuming all pores in the -10 fraction are filled yields a water retention value of 0.22 g per gram -10 mesh rock (Appendix 2, Attachment A2.3). This interpretation is reasonably consistent with interpretation of the linear regression analysis. Furthermore, the y-axis intercept derived by the regression suggests that 34 grams of water were associated with the +10 mesh fraction and the humidity cell itself. The 34 grams represents from 11
20 to 34 percent of the entire water retention, with most values near 30 percent. The range before the rinse was 94 to 151 g, with most values between roughly 100 and 110 g (Table 8). Water loss during the week ranged from roughly 4 to 15 g, indicating that little evaporation occurred during the weekly cycle.
4.3.3 Leachate Volume
The drainage volumes for the duplicate reactors were in good agreement for the period of record. There were some excursions in Reactor 5, where drainage volume would drop 30-40 mL during a weekly rinse period (Appendix 2, Figure A2.7). However, the average drainage volumes were in very good agreement for reactors 4 and 5 at 167.8±4.3 mL and 168.0±4.8 mL respectively. The average drainage volume for the 8 reactors for the 400 week period of record was 164.6±2.7 mL (Appendix 2, Table A2.5). The drainage volumes for the duplicate humidity cells were also in good agreement. The average drainage volumes for reactors 12 and 13 were 480.3±6.5 and 486.4±6.3 mL respectively. Drainage volumes from reactor 13 were typically 5-7 mL higher than reactor 12 for the entire period of record (Appendix 2, Figure A2.8). The average drainage volume for the 11 humidity cells for the 400 week period of record was 481.2±3.1 mL (Appendix 2, Table A2.5).
4.4. Dissolution of Babbitt and Dunka Road Prospects rock 4.4.1 Water Quality Replication
For the following discussion, differences in dissolution behaviors of the Babbitt and Dunka Road samples identified in Section 5.3 will be neglected, and the samples will be considered as a single collection of Partridge River intrusion samples. Duplicate 75-g reactors and humidity cells were run with the 0.31%S and 0.55% S, respectively, Babbitt prospect samples and drainage quality agreement between duplicates was generally very good (Figures 4 and 5). For the reactors (finer particles), replication of pH and concentrations of sulfate and major cations (Ca, Mg, Na, K) was excellent (Figure 4). This agreement is corroborated by average rates of mass release calculated over the period of record. Replicate rates for all five solutes were within 5% of the mean value (Table 9). Rates of nickel, cobalt and zinc release were similarly in good agreement between duplicates. However, copper rates were roughly 20 percent of the mean value, due to higher rates in reactor 4 from year 2 to 6 (Table 10). For the humidity cells (coarser particles), pH replication was excellent. Small deviations were observed for concentrations of sulfate, calcium, and magnesium, but agreement between replicates was nonetheless very good (Figure 5). This agreement was quantified by average solute release rates determined over the period of record. Replicate rates for sulfate, calcium, magnesium, sodium, and potassium differed by no more than 4% of the respective mean (Table 9). Although the agreement in nickel and cobalt release rates was similar, the difference from the mean for copper and zinc rates was 10 and 8 percent, respectively, of the mean value (Table 10). 12

4.4.2 Drainage pH
Considering the Babbitt prospect and Dunka Road samples as a whole, drainage pH from both size fractions tended to decrease with time and sulfur content. For the reactors, drainage pH typically decreased over periods of 30 to 50 weeks and then become relatively stable (Figure 7). Drainage pH values from samples with sulfur contents less than 0.31% were generally greater than 6.0, although the 0.20%-S sample did produce several drainage pH values in the range of 5.8 to 6.0. Samples with sulfur contents of 0.63% and 0.94% produced minimum drainage pH values of near 5.2 and 4.3, respectively (Figure 7). For the humidity cells, drainage pH tended to decrease steadily over time (Figure 7). Drainage pH from samples with sulfur contents of 0.13% to 0.72% typically plateaued after 150-300 weeks and reached minimum pH values ranging from 5.3 to 6.4. Samples with sulfur contents of 1.03% and 1.36% went acidic after 20 weeks and produced minimum pH values of 4.2 and 4.3, respectively, by week 150 (Figure 7).
4.4.3 Sulfate Release (Acid Production)
Sulfate release rates in drainage from the finer particles increased with increasing solid-phase sulfur content. Sulfate release rates tended to peak between weeks 30 and 50 and decreased over the remaining period of record (Figure 8). This behavior coincides with specific conductance over time (Figure 9). Sulfate release rates for most reactors after year 8 were approximately 3-11% of those in year 1. However, the higher sulfur samples (0.63 and 0.94%S) displayed sulfate rates after year 8 that were about 22% of those in year 1 (Table 9). The fraction of solid-phase sulfur depleted during the 8-year period ranged from 13 to 57% (Table 11). As with the finer particles, sulfate release rates in the humidity cells tended to increase with solid-phase sulfur content. In contrast with the sulfate peaks observed for the finer particles, sulfate release in drainage from the d < 6.35 mm rock tended to be relatively stable over time (Figure 8). Sulfate release rates for most humidity cells after year 8 were approximately 29-83% of those in year 1. One exception was the 1.03%S sample, for which sulfate release at year 8 was the same as year 1 (Table 9). Unlike the other humidity cells, this sample displayed an increasing trend in sulfate release from weeks 50 to 200. The fraction of solid-phase sulfur depleted during the 8-year period ranged from 8 to 37% (Table 11).
4.4.4 Major Cation Release (Acid Neutralization) For the reactors, molar concentrations of major cations initially decreased in the order Ca > Mg > K > Na and the ordering subsequently evolved to Mg > Ca > Na > K. Release rates tended to parallel those of sulfate, where release rates peaked during weeks 30-50 and decreased for the remainder of the period of record (Figures 10-13). Calcium and potassium release rates in year 8 were on average, 9 and 5 % of those in year 1, respectively (Table 9). In contrast, magnesium and sodium release rates were slightly less variable over the period of record, with release rates at year 8 averaging 29 and 39 % respectively, of year 1 release rates (Table 9). Total molar release of magnesium was the highest, measuring 1.2±0.4 times that of calcium and roughly 13
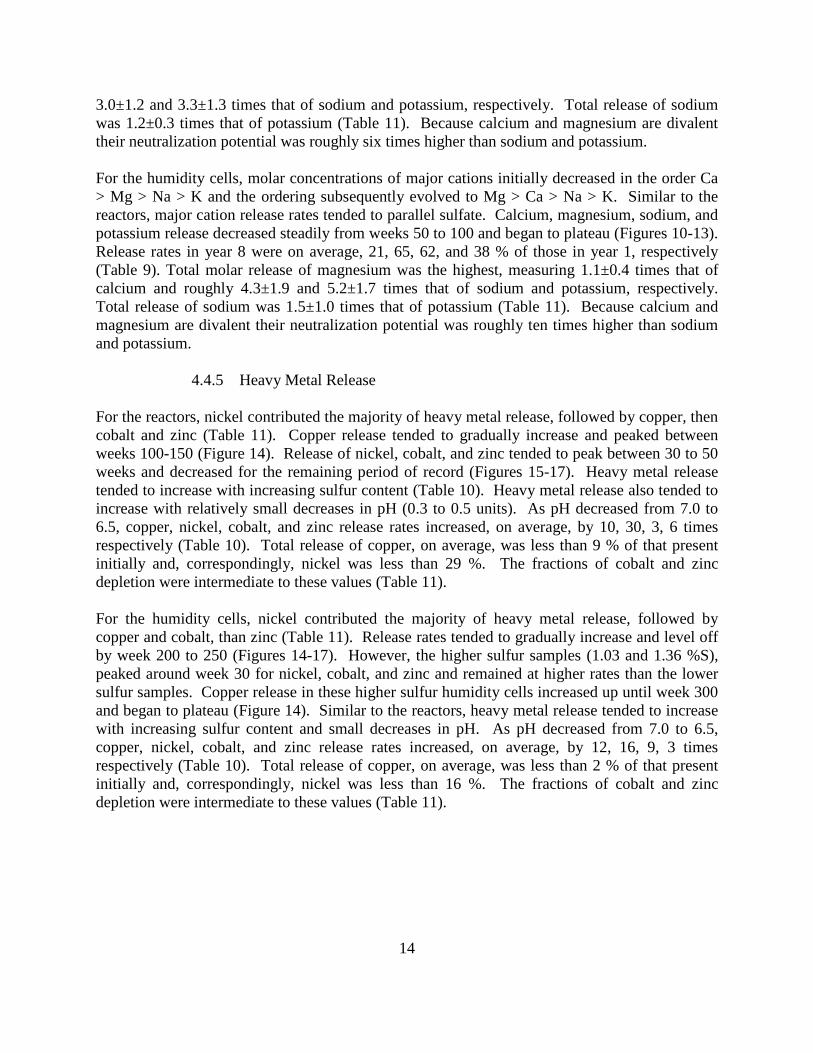
3.0±1.2 and 3.3±1.3 times that of sodium and potassium, respectively. Total release of sodium was 1.2±0.3 times that of potassium (Table 11). Because calcium and magnesium are divalent their neutralization potential was roughly six times higher than sodium and potassium. For the humidity cells, molar concentrations of major cations initially decreased in the order Ca > Mg > Na > K and the ordering subsequently evolved to Mg > Ca > Na > K. Similar to the reactors, major cation release rates tended to parallel sulfate. Calcium, magnesium, sodium, and potassium release decreased steadily from weeks 50 to 100 and began to plateau (Figures 10-13). Release rates in year 8 were on average, 21, 65, 62, and 38 % of those in year 1, respectively (Table 9). Total molar release of magnesium was the highest, measuring 1.1±0.4 times that of calcium and roughly 4.3±1.9 and 5.2±1.7 times that of sodium and potassium, respectively. Total release of sodium was 1.5±1.0 times that of potassium (Table 11). Because calcium and magnesium are divalent their neutralization potential was roughly ten times higher than sodium and potassium.
4.4.5 Heavy Metal Release
For the reactors, nickel contributed the majority of heavy metal release, followed by copper, then cobalt and zinc (Table 11). Copper release tended to gradually increase and peaked between weeks 100-150 (Figure 14). Release of nickel, cobalt, and zinc tended to peak between 30 to 50 weeks and decreased for the remaining period of record (Figures 15-17). Heavy metal release tended to increase with increasing sulfur content (Table 10). Heavy metal release also tended to increase with relatively small decreases in pH (0.3 to 0.5 units). As pH decreased from 7.0 to 6.5, copper, nickel, cobalt, and zinc release rates increased, on average, by 10, 30, 3, 6 times respectively (Table 10). Total release of copper, on average, was less than 9 % of that present initially and, correspondingly, nickel was less than 29 %. The fractions of cobalt and zinc depletion were intermediate to these values (Table 11). For the humidity cells, nickel contributed the majority of heavy metal release, followed by copper and cobalt, than zinc (Table 11). Release rates tended to gradually increase and level off by week 200 to 250 (Figures 14-17). However, the higher sulfur samples (1.03 and 1.36 %S), peaked around week 30 for nickel, cobalt, and zinc and remained at higher rates than the lower sulfur samples. Copper release in these higher sulfur humidity cells increased up until week 300 and began to plateau (Figure 14). Similar to the reactors, heavy metal release tended to increase with increasing sulfur content and small decreases in pH. As pH decreased from 7.0 to 6.5, copper, nickel, cobalt, and zinc release rates increased, on average, by 12, 16, 9, 3 times respectively (Table 10). Total release of copper, on average, was less than 2 % of that present initially and, correspondingly, nickel was less than 16 %. The fractions of cobalt and zinc depletion were intermediate to these values (Table 11).
14

5. DISCUSSION 5.1 Introduction
Duluth Complex waste rock was characterized (particle size distribution, chemistry, mineralogy) and subjected to laboratory dissolution testing. Although the dissolution tests remain in progress, the following discussion presents the first 400 weeks of data. The dissolution tests were conducted to examine 1) drainage quality from fine particles (0.053-0.149 mm, 75 grams), 2) drainage quality from coarser particles (–6.35-mm, 1000 grams) and 3) differences in drainage quality between these size fractions. The data also provided a comparison between 4) Babbitt and Dunka Road prospect samples, 5) waste rock and tailings, and 6) Partridge River and South Kawishiwi Intrusion samples.
5.2 Conceptual Overview This section presents a brief description of the mineral dissolution reactions that occur during chemical weathering of Duluth Complex rock. This summary is intended to provide a conceptual structure to frame the discussion of results. It should be noted that detailed analysis of mineral dissolution reactions, such as calculation of mineral dissolution rates, is beyond the scope of this report. Iron sulfide and base metal sulfide minerals present in Duluth Complex rock oxidize when in contact with oxygen and water. Pyrrhotite is the predominant iron sulfide mineral present and its oxidation releases acid and sulfate. Some or all of the acid released can be neutralized by dissolution of silicate minerals present, including plagioclase, olivine, and augite. The balance of acid production and acid neutralization reactions determines the solution pH. Oxidation of base metal sulfides such as chalcopyrite and pentlandite releases copper and nickel, respectively. The metals released can remain in solution or be removed in secondary phases due to chemical precipitation, adsorption, or coprecipitation. The extent to which metals released from the sulfide phase remain in solution increases as solution pH decreases, that is, as the solution becomes more acidic base metal concentrations tend to increase. Sulfide mineral oxidation and silicate mineral dissolution are surface reactions and, therefore, the rates of solute release depend on the mineral surface area exposed. All other factors being equal, the mineral surface area exposed will increase as the mineral abundance increases. In addition, two factors contribute to mineral surface area exposed increasing as rock particle size decreases. First, for a given mineral mass the total mineral surface area increases as the mineral particle size decreases. That is, a kilogram of fine mineral particles will have more surface area than a kilogram of coarse particles. Second, the mineral surface area exposed increases as the degree of mineral “liberation” from the mineral matrix of the rock increases, and the extent of liberation increases as the rock particle size decreases. That is, a mineral occurring between or within other minerals in a large rock fragment will become exposed if the fragment is crushed to a finer size. Sulfide mineral oxidation and silicate mineral dissolution rates are also affected by solution pH. Assuming oxidation of sulfide minerals in general parallels that of pyrite, abiotic rates of oxidation by oxygen decreases slightly as pH decreases. However, the overall abiotic rate increases as pH decreases into a range where ferric iron becomes the dominant oxidant (Williamson and Rimstidt 1994; Nordstrom 1982). As pH further decreases, bacterial oxidation of ferrous iron becomes the rate limiting step in the oxidation by ferric iron (Singer and Stumm 15
1970). In laboratory tests on Duluth Complex rock, the pyrrhotite oxidation rate in the pH range of 3.5 to 4.05 was roughly six to seven times that in the range of 5.35 to 6.1, and the higher rate was attributed to bacterially mediated oxidation (Lapakko and Antonson 1994). Silicate mineral dissolution rates also tend to increase as pH decreases but to a lesser degree (White and Brantley 1995).
5.3 Comparison of Fine-Grained and Coarse-Grained Particles
Certain general trends related to solid-phase sulfur content and time were apparent for both the fine (0.053 < d < 0.149 mm) and coarse (d < 6.35 mm) particles. For both particle sizes, as sulfur content increased, the rates of sulfate release increased and drainage pH decreased (Figures 18, 19). The increasing sulfur content reflected increasing sulfide mineral surface area, which yielded increased sulfide mineral oxidation and consequent acid production. The more rapid acid production tended to result in decreasing drainage pH and more rapid release of both major cations and heavy metals. With respect to general temporal variations, sulfate release rates for both size fractions tended to decrease over time and plateau. Rates of major cation release tended to parallel sulfate release rates, although peak sodium release occurred later than peaks for other solutes. The major cation release was a response to the variation of rates of acid production reflected by sulfate concentrations. Heavy metal concentrations were largely controlled by drainage pH and, consequently, tended to increase as sulfur content increased. Heavy metal release from the fines tended to peak within the first 50 weeks and then decline and plateau, whereas release from the coarse particles was more gradual in response to slowly declining pH. Although similar trends were observed for the two size fraction samples, the variations in solute release with respect to sulfur content and time differed quantitatively. Per unit mineral mass, the finer particles had greater sulfide mineral surface area exposed and available for oxidation. As a result, sulfate release rates from the finer fraction were approximately three times those from the coarse fraction during the first year of dissolution (Figure 21). Sulfate release rates from the fine fraction tended to peak within 30 to 50 weeks of reaction and declined fairly rapidly over time, influenced by depletion of the sulfide minerals and probably coating of the sulfide minerals remaining (Figure 8). Corresponding drainage pH minimums were reached between weeks 60 and 120, lagging about a year behind the observed maximums for sulfate release (Figure 7). In contrast, sulfate release from the coarse particles declined fairly slowly, and drainage pH from all but the two highest sulfur samples declined over the entire period of record (Figures 7, 8). In response to the associated decreasing rates of acid production the rates of calcium and magnesium release declined correspondingly, hence the parallelism between the release of major cations and sulfate (Figures 10, 11). For both particle sizes, the dissolution of calcium and magnesium-bearing minerals contributed the most acid neutralization (Appendix 4, Figures A4.1-A4.19). The elevated sulfide oxidation in the finer fraction resulted in more rapid silicate mineral dissolution and consequent acid neutralization. Release of calcium and magnesium from the fine fraction in the first year was 1.6 and 1.9 times that from the coarse fraction, respectively (Figure 22). Total mass release of
16

calcium and magnesium from the fine fraction for the period of record averaged 1.4 and 1.6 times that from the coarse fraction, respectively (Table 11). It should be noted, however, that calcium release rates from the coarse fraction exceeded that from the fine fraction after year 4 (Figure 22). Sulfate and heavy metal release result from oxidation of sulfide mineral phases, such as pyrrhotite and chalcopyrite. Roughly 75 to 90 percent of the calcium occurs in plagioclase and the majority of the remainder is with augite (App 1, Attach A1.2 - Table A1.2.8). The small amount of carbon dioxide present is likely associated with calcium, and the rapid dissolution of this phase contributes to the initially elevated calcium release (Figure 10). Plagioclase also hosts virtually all of the sodium present (App 1, Attach A1.2 - Table A1.2.8). If plagioclase were dissolving stoichiometrically, calcium would be released at a ratio of 1.5:1 to sodium (App 1, Table A1.2.1). However the ratio of Ca: Na total molar release was approximately 1.5 to 3 times the stoichiometric ratio of plagioclase dissolution after 400 weeks. This indicates calcium was being released by other minerals such as augite, the second largest host of calcium. Potential sources of magnesium release were olivine, augite, and biotite dissolution (App 1, Attach A1.2 - Table A1.2.8). Additional data analysis should be conducted in the future to better assess major cation contributions from individual mineral phases and rates of mineral dissolution. Such efforts are beyond the scope of the present project. This rapid decrease of drainage pH in the finer fraction resulted in heavy metal release rates approximately three to four times those from the coarser fraction during the first two years of dissolution (Figure 26). In contrast, sulfide oxidation from the coarser fraction remained fairly constant throughout the period of record, and drainage pH declined slowly over time. Consequently by year 7 the nickel and cobalt release rates from the coarser particles were roughly five times higher than the fines (Figures 24, 25). Although it appeared that drainage pH was the largest influence on heavy metal release, it also was likely influenced by the greater degree of metal depletion from the fine grained samples with sulfur contents of at least 0.2 % (Table 11). Similar dependences on particle size and sulfur content were observed for copper and zinc, although release rates were higher in the reactors over the entire period of record (Figures 24, 25).
5.4 Comparison of Babbitt and Dunka Road Samples Comparison of the Babbitt prospect and Dunka Road prospect rocks is tenuous because of the limited number of Dunka Road samples tested. Only one Dunka Road sample was tested in the 0.053-0.149 mm size fraction and three samples in the d < 6.35 mm fraction. For the finer fraction, results for the 0.31 %S Dunka Road sample were compared to those from the duplicated 0.31 %S Babbitt prospect samples. For the coarser fraction, Dunka Road samples with sulfur contents of 0.23, 0.31, and 0.61 % were compared with Babbitt prospect samples with sulfur contents of 0.21, 0.33, and 0.55 % (duplicated). Differences in dissolution of rocks from the two prospects would be expected to result from differences in mineral content, mineral chemistries, and modes of mineral occurrence.
17

5.4.1 Solids
The total sulfide mineral content of each pair was largely normalized by selecting samples of similar sulfur content for comparison of the two prospects. However the heavy metal content of the Babbitt Prospect samples tended to be higher than that of the Dunka Road samples, especially for the fine samples. This was particularly true for copper, for which Babbitt prospect sample contents were 1.3 to 5.5 times those of Dunka Road samples (Table 13). This indicates that chalcopyrite and cubanite constitute a larger fraction of the sulfides in the Babbitt Prospect samples. Nickel, cobalt, and zinc contents of the Babbitt Prospect samples were typically 0.9 to 1.4 times the associated Dunka Road contents, with only three ratios being below 1.0. Evolved carbon dioxide contents of the paired fine samples (~0.20 %) and the low sulfur coarse samples (~0.08 %) were similar. However, for the two highest sulfur content coarse samples, the CO2 contents of Dunka Road samples were 2 to 2.5 times their associated Babbitt prospect pair (Table 4). This suggests that the Dunka Road humidity cell samples had higher calcite contents than their Babbitt prospect pairs. The only consistent trends regarding silicate mineral content were higher biotite and potassium feldspar contents of the Babbitt Prospect samples, reflecting potassium contents that were about twice those in the Dunka Road samples (Table 7).
5.4.2 Solute Release
For fine particles, solute release is largely dependent on mineral content and mineral chemistry. The particle size is fairly uniform (0.053 to 0.149 mm) and virtually all mineral surfaces are exposed rather than being obstructed due to occurrence among or within other minerals in larger rock particles. Although drainage pH from the fine Babbitt prospect sample was slightly higher than that from the fine Dunka Road samples during the first 30 weeks, values from the two prospects were quite close subsequently (Figure 27). Concentrations of sulfate, major cations (Ca, Mg, Na, K), and base metals (Cu, Ni, Co, Zn) in drainage from the Babbitt prospect sample were typically higher than associated values in drainage from the Dunka Road sample (Figure 27). For sulfate and major cations the elevated release was most marked during the first year, whereas this trend extended beyond two years for base metals (Figure 27). These trends were driven largely by more rapid sulfide mineral oxidation for Babbitt Prospect samples. Accelerated iron sulfide mineral oxidation enhanced acid generation, which in turn accelerated silicate mineral dissolution and the consequent major cation release. The cause of the accelerated oxidation of sulfide minerals in the Babbitt Prospect rock cannot be determined conclusively. As mentioned above, base metal sulfides (especially chalcopyrite and cubanite) comprised a larger fraction of the total sulfide content in the Babbitt Prospect samples. A similar phenomenon was reported for Dunka Road waste rock with a higher copper sulfide mineral fraction (SRK 2007). Either the sulfide chemistry or features related to this chemistry (e.g. grain size, surface roughness, mineral lattice dislocation density) apparently accelerated oxidation of all sulfide minerals present. Accelerated iron sulfide oxidation and the consequent acid production enhanced silicate mineral dissolution and the associated major cation release. Accelerated base metal sulfide mineral oxidation, due in part to a higher base metal sulfide content, enhanced release of copper, nickel, cobalt, and zinc from the Babbitt prospect samples. 18

It should be noted that the higher base metal sulfide content of the Babbitt prospect samples does not entirely explain the higher base metal sulfide release. The copper, nickel, cobalt, and zinc contents of the Babbitt prospect sample were 1.3 to 5.5 times the respective values in the Dunka Road sample. The corresponding metal mass releases from the Babbitt prospect sample during the initial 400 weeks of reaction were 2.6 to 42 times those from the Dunka Road samples (Table 13). Thus, the mass release ratios were roughly 2 to 9 times those expected based on the differences in base metal content alone (Table 13). Some of the additional acceleration can be attributed to the more rapid rate of sulfate release from the Babbitt prospect samples. Specifically, the more rapid release of nickel and zinc from the Babbitt prospect samples is roughly bounded by consideration of differences in metal content and sulfate release rate (Table 13). The degree of copper release acceleration was well beyond that inferred by the compounded influences of solid-phase concentration and sulfate release rates (Table 13). The acceleration cannot be attributed to differences in pH because the pH of drainages from the two samples was similar (Figure 27). This suggests that the copper sulfide minerals present in the Babbitt prospect samples oxidized more rapidly than those in the Dunka Road samples. For coarse particles, relative magnitudes of pH and sulfate and major cation release varied among the three samples subjected to humidity cell testing. For the two lower sulfur Dunka Road samples, pH was higher and rates of sulfate, calcium, magnesium, and sodium release were generally lower than or equal to corresponding values for Babbitt prospect samples (Figures 28, 29). For the highest sulfur sample pair these trends were generally reversed, magnesium being an exception (Figure 30). It should be noted that the difference in sulfur contents for this pair was the largest of the four pairs examined. Thus, there were no consistent major differences in drainage pH, acid production rates, or acid neutralization rates among the three pairs of samples examined. This is consistent with the general mineralogical similarity between the Babbitt and Dunka Road prospect samples. The only common trend was that potassium release from the Dunka Road samples was roughly half that from the Babbitt prospect samples of similar sulfur content (Tables 11). As mentioned above, this was likely due to the lower potassium-bearing minerals in the Dunka Road rock, as was the case for the fine-grained samples. The lack of a consistent relationship between copper content and sulfate release from the coarse samples indicates that the sulfide mineral composition did not greatly influence the rate of total sulfide mineral oxidation. However, heavy metal release from the Babbitt prospect samples tended to exceed that from the Dunka Road samples. For the two lower sulfur samples, the relative difference in heavy metal release through 400 weeks was beyond that which would be expected based on differences in heavy metal content and sulfate release rate (Table 13). Lower drainage pH from the Babbitt prospect samples contributed to part of the elevated release. That is, more acidic conditions associated with the Babbitt prospect samples, in addition to higher metal contents and sulfate release rates, likely enhanced metal release. In contrast, drainage pH from the Dunka Road sample was lower than that from the Babbitt prospect sample for the high sulfur pair (Figure 30). Despite this “advantage” for the Dunka Road rock, the relative metal release from the Babbitt Prospect samples was roughly equal to the differential indicated by the differences in metal content and sulfate release rate (Table 13). As was the case for the fine 19

particles, it appears that the oxidation rates of heavy metal sulfides present in the Babbitt prospect exceeded that of heavy metal sulfides in the Dunka Road prospect. In summary, there were no consistent differences between the Dunka Road and Babbitt prospects in drainage pH or rates of sulfate, calcium, and sodium release. Magnesium release from the Babbitt prospect samples was consistently 1.1 to 1.2 times that from the Dunka Road samples (Table 14), but there was no obvious solid-phase attribute to which this difference could be correlated. Although the largest observed ratio (2.8) was associated with the largest difference in olivine content, no trend between magnesium release and olivine content was apparent (Table 7). Potassium release from the Dunka Road fine and coarse samples was roughly half that from their paired Babbitt prospect sample. This reasonably reflected differences in biotite contents between the two prospects. Heavy metal release from the Dunka Road rock tended to be lower than that from the Babbitt prospect rock. Whereas some of the difference could be ascribed to higher metal content of the Babbitt prospect rock, differences in total sulfide mineral oxidation, and drainage pH also played a role. Data from the fine sample pair suggested that heavy metal sulfides from the Babbitt prospect oxidized more rapidly (when normalized per unit mass). This was particularly the case for copper sulfides. Whereas the aforementioned trends were observed for the sample pairs tested, it should be emphasized that these comparisons consider only a few samples and may not represent general trends for the two prospects.
5.5 Comparison of Duluth Complex Waste Rock and Tailings
A sample of 0.2% S tailings from the Babbitt Prospect of the Partridge River Intrusion was subjected to dissolution in duplicate under the same conditions to which the waste rock samples were exposed (unsaturated tailings reactors 1 and 2). This section compares results from this tailings sample to those from the reactor containing the 0.20 %S waste rock sample. The waste rock particles ranged from 0.053 to 0.149 mm in diameter and were coarser than the tailings, for which roughly 51 % were in the aforementioned range, 29 % were finer than 0.053 mm, and 16 % were finer than 0.025 mm (Lapakko 2013, Table 2). The plagioclase contents of the waste rock and tailings were similar (50 and 57 percent, respectively), as were the calcium contents of the plagioclase present (Appendix 1, Table A1.11). Augite and biotite contents of the waste rock were reported to be slightly lower than those of the tailings (11 vs. 7.8% and 5.7 vs. 2.3%, respectively). In contrast, the olivine content of the waste rock was considerably higher than that in the tailings (26 vs. 9%). Respective concentrations of copper, nickel, and cobalt in the waste rock were 2.0, 1.2, and 1.2 times those in the tailings (Appendix 1, Table A1.10). The pH of drainage from the waste rock sample was typically 0.8 to 1 unit lower than that of the tailings, with respective minimum values of 5.7 and 6.5 (Figure 31). Both higher sulfide mineral oxidation rates and lower silicate mineral dissolution rates contributed to the lower pH values from the waste rock. The rates of sulfate release from the tailings averaged about 60 μmol (kg rock∙wk)-1 over the first eight years of the experiment (Lapakko et al. 2013), 80 percent of the 75 μmol (kg rock∙wk)-1 20

reported for the 0.20 %S waste rock over the same period (Table 9). Sulfate release rates for the tailings and rock were very close in year 1 (260 vs 240 μmol (kg rock∙wk)-1) and year 8 (16 vs 15 μmol (kg rock∙wk)-1). Rates for the rock tended to be somewhat higher in the intermediate years (Figure 31). Sulfate release rates are influenced by the sulfide mineral surface area exposed, the availability of oxygen, and the sulfide mineral chemistry. Because the rates of sulfate release from the waste rock and tailings were not substantially different, these factors did not appear to exert a major influence. Nonetheless, these factors are briefly discussed in the interest of providing perspective on the oxidation of sulfide minerals present in the two solids. Considering the finer particle size of the tailings, and associated higher specific surface area, it would be expected that they would exhibit higher sulfate release rates. The lower observed sulfate release rates observed for the tailings are apparently the result of removal of “liberated” sulfide minerals during mineral processing. Consequently, relative to unprocessed waste rock, a greater fraction of sulfide minerals present in the tailings are included within other rock particles and, therefore, less available for reaction. This is supported by mineralogical analyses that reported respective liberation probabilities of 100 and 87 percent for the rock and tailings (Appendix 1, Attachment A1.4). The finer grained tailings also might have limited oxygen diffusion to sulfide mineral surfaces and thereby inhibited sulfide mineral oxidation. Both the finer grain size itself and increased water retention with finer grain size would tend to reduce diffusion. However limitation of oxygen diffusion was probably not substantial due to the thin tailings beds used in the experiment and the fact that water retained after the rinse evaporated within about three days (Lapakko et al. 2013). Although evaporation rates were not determined in the present study, similar evaporation rates were measured for 75-gram samples of -100/+270 mesh rock in previous work (see Section 4.3.2). It should be noted that there were also differences in the specific sulfide minerals present in the two samples. Respective copper contents of 0.1 and 0.051 percent for the waste rock and tailings were used to estimate the fraction of sulfur present with chalcopyrite. Assuming all copper was present as chalcopyrite indicated an estimated 50 percent of the sulfur in the waste rock and 25 percent of the sulfur in the tailings was associated with chalcopyrite. This infers that the pyrrhotite content of the tailings was about 1.5 times that of the waste rock. Pyrrhotite is reported to oxidize more rapidly than chalcopyrite (e.g. Steger and Desjardins 1978), so this would tend to accelerate sulfate release from the tailings relative to the waste rock. However, as discussed in the previous section, samples of higher copper sulfide mineral content tended to have higher sulfate release rates. Thus, it is unclear if the difference in sulfide mineral partitioning between the rock and tailings samples was of substantial influence. Average rates of calcium and magnesium release from the tailings were on the order of twice those from the rock (Figure 31). For calcium this was apparently largely due to the finer particle size of the tailings, resulting in a greater surface area of calcium-bearing silicate minerals. Plagioclase was the major calcium-bearing mineral in both the waste rock and tailings. There 21

was little difference between the waste rock and tailings in plagioclase contents (50 vs. 57%) or the atom fractions of calcium in the plagioclase (0.54 vs. 0.57; Appendix 1, Table A1.11). Thus, mineralogical differences between the samples were small and any associated influences on calcium release would likely be minimal. There were differences in magnesium-bearing contents of the waste rock and tailings. Relative to the tailings, the waste rock had less augite and biotite (7.8 vs. 11%, 2.3 vs. 5.7%, respectively) and more olivine (26% vs. 9.8%). Particle size, and its associated influence on silicate mineral surface area, would be expected to have a similar effect on magnesium release. That is, if there were no differences in magnesium-bearing mineral content, magnesium release from the tailings would be expected to be twice that from the waste rock due to particle size influences alone. If this is so, mineralogical differences between the tailings and rock had little influence on magnesium release. This further suggests, given that the olivine content of the waste rock was more than 2.5 times that of the tailings, that olivine was not a major contributor of magnesium to solution. That is, if olivine were a major magnesium contributor, the waste rock would yield much higher magnesium release than the tailings. Respective annual rates of copper and nickel from the waste rock, on average, were 40 and 150 times greater than those from the tailings. Similarly annual rates of zinc and cobalt release from the waste rock averaged 4 and 8 times those from than the tailings, respectively. These rates tended to be highest during years 2 and 3 (Figure 32). The differences are attributed to pH values from the waste rock that was near 1 unit lower than those from the tailings. Concentrations of copper, nickel, and cobalt in the waste rock were 2.0, 1.2, and 1.2 times those in the tailings, respectively (Appendix 1, Table A1.10). These differences and a lower degree of base metal sulfide liberation in the tailings probably contributed to a lesser degree. In summary, the rate of sulfate release from the tailings averaged 80 percent of that from the waste rock sample of similar sulfur content. The difference is believed to be largely the result of a higher degree of sulfide mineral liberation in the rock. In contrast, rates of calcium and magnesium release from the tailings were roughly twice those from the waste rock. The combination of lower sulfide mineral oxidation (and consequent acid production) and higher calcium and magnesium silicate mineral dissolution (and consequent acid neutralization) resulted in drainage pH values from the tailings that were roughly a unit higher than those from the waste rock. Due to the lower waste rock drainage pH (and to a lesser extent, elevated base metal content of the waste rock), base metal release rates from the waste rock averaged 4 to 150 times those from the tailings.
22

5.6 Comparison of Partridge River and South Kawishiwi Intrusion Samples The dissolution behavior of Partridge River Intrusion rock (PRI), samples from the Babbitt and Dunka Road prospects, was compared to that of the South Kawishiwi Intrusion rock (SKI), samples from the Dunka Mine. Data from laboratory experiments on samples with diameters of 0.053 to 0.149 mm were used for the comparison because that was the only dissolution test to which the South Kawishiwi samples were subjected. Data from seven PRI samples (0.07 ≤ percent sulfur ≤ 0.94) and eleven SKI samples (0.18 ≤ percent sulfur ≤ 1.16) were used. Whereas comparisons of the intrusions were made based on normalized sulfur content, the variation of base metal contents with sulfur for the intrusions differed. Copper and nickel contents in the PRI rock tended to increase with sulfur content but not in the SKI samples. Consequently, copper and nickel contents of the PRI higher sulfur samples were 2 to 5 times higher than respective contents of the SKI samples with similar sulfur content (Figures 33, 34). Conversely, the zinc content of SKI samples increased with sulfur content, but the PRI samples did not respond in a similar manner (Figure 35). Cobalt content did not vary systematically with sulfur content for samples in either intrusion (Figure 36). PRI samples on average had higher olivine content than the SKI samples, 31 vs 8%. SKI samples on average had higher plagioclase and hypersthene (compared to Opx), 52 vs 45 and 15 vs 3.5%, respectively than the PRI. Average contents between the two intrusion samples were similar for augite, biotite, potassium feldspar, and ilmenite (Appendix 1, Table A1.14). Drainage pH from the PRI samples tended to be higher than that from the SKI samples. For a specified sulfur content, the minimum drainage pH from the PRI samples was roughly 0.7 units higher than that from the SKI samples (Figure 37). Unlike the PRI samples which were mainly circumneutral (exceptions being the 0.63 and 0.94%S samples), SKI samples with sulfur content as low as 0.41% generated acidic drainage within 400 weeks of reaction. However, the drainage pH from PRI samples reached minimums by week 50-100, the SKI samples declined more slowly, taking as long as 300-350 weeks to reach minimum pH values (Figure 38). During the first three years, the annual rate of sulfate release from the PRI samples averaged 1.2 to 2 those from the SKI samples of similar sulfur content (Figure 39, 40, Table 15). Sulfate release from the PRI samples peaked in the first 30-50 weeks, a trend associated with the relatively rapid initial decrease in pH. After 250-300 weeks, as drainage pH from the SKI samples continued to decline, sulfate responded with release rates as much as 10 times those from the PRI samples (Figure 40, Table 15). This rapid increase in sulfate release occurred when pH fell below 4, and the increase likely reflected biological mediation of sulfide mineral oxidation. During the 8 year period of record, average sulfur depletion in the PRI and SKI samples was 41 and 54 percent respectively. The cause of differences in drainage pH from SKI and PRI samples was investigated further. Solid-phase and drainage quality data for the two highest sulfur PRI samples (0.63 and 0.94% S) was compared with associated data for the three SKI samples with comparable sulfur contents (0.57, 0.58, and 0.71%; 0.71, 1.12, and 1.16%, respectively). The minimum drainage pH for the 23

0.63% S PRI sample was 5.2 as compared to a range of 3.6 to 4.0 for the corresponding SKI samples (Appendix 6, Figure A6.4). Similarly the minimum drainage pH for the 0.94% S PRI sample was 4.9, as compared to a range of 3.2 to 3.6 for the corresponding SKI samples (Appendix 6, Figure A6.5). This indicates that the SKI samples had either a higher capacity to produce acid or a lower capacity to neutralize acid. Because the SKI samples had lower contents of copper and nickel, a larger fraction of their sulfur was associated with iron. Thus, for samples of the same sulfur content the SKI samples had more iron sulfide and therefore more potential to produce acid. This hypothesis was pursued by comparing solid-phase and reactor release rate data for PRI samples (0.63 and 0.94% S) with associated data for the three SKI samples with comparable sulfur contents (0.57, 0.58, and 0.71%; 0.71, 1.12, and 1.16%, respectively). This comparison indicated that, per unit sulfur present, acid producing fractions of sulfides for the 0.63% S and 0.94% S PRI samples were 0.70 and 0.65, respectively. For comparison the average acid producing fractions of sulfides for the 0.57% S, 0.58% S, and 0.71% S SKI samples was 0.85 and for the 0.71% S, 1.12% S, and 1.16 % S SKI samples was 0.91 (Appendix 6, Table A6.4). Thus, the acid producing fraction of sulfide present in the two PRI sample was roughly 80 and 70 percent, respectively, of the average for the SKI samples with similar sulfur contents. Thus, the amount of acid-producing iron sulfide per unit sulfur present in the SKI samples was greater than that present in the PRI samples. This likely contributed to the lower drainage pH values observed for the SKI samples. It should be noted that this solid-phase difference is rather subtle relative to the large difference in minimum pH values, suggesting a high sensitivity of drainage pH to small changes in sulfur content. For the five SKI and two PRI samples discussed above, there was no indication that the potential of SKI samples to neutralize acid was less than that of the PRI samples. The CO2 content range for SKI samples was <0.03 – 0.10% as opposed to 0.2% and 0.07%, respectively, for the PRI samples with sulfur contents of 0.63% and 0.94%. Although the 0.2% CO2 concentration for the 0.63% S PRI sample is easily the highest reported, the 0.07% concentration for the second sample is in the middle of the range for the SKI samples. Consequently, the calcite contents inferred by the CO2 contents do not provide compelling insight into the lower drainage pH from the SKI samples. Dissolution of minerals releasing calcium and magnesium provided the majority of acid neutralization. Besides trace amounts of calcite, calcium was largely present in plagioclase (~70-80% of Ca) and augite. There were some differences in the neutralizing silicate mineral contents and chemistries for the two intrusions. The plagioclase contents (volume percent) of the five SKI samples averaged 48% as compared to 40% for the two PRI samples. The respective average mole fractions of calcium present were 0.50 and 0.55 (Appendix 6, Table A6.5). Thus, the plagioclase content suggested slightly greater neutralization capacity for the SKI samples while the opposite was implied by the calcium contents of the plagioclase. Augite contents and chemistries of the SKI and PRI samples were similar. Thus there is no evidence suggesting that calcium-bearing mineral dissolution would limit acid neutralization by the SKI rocks. This is consistent with the observation that average rates of calcium release as a function of sulfur
24
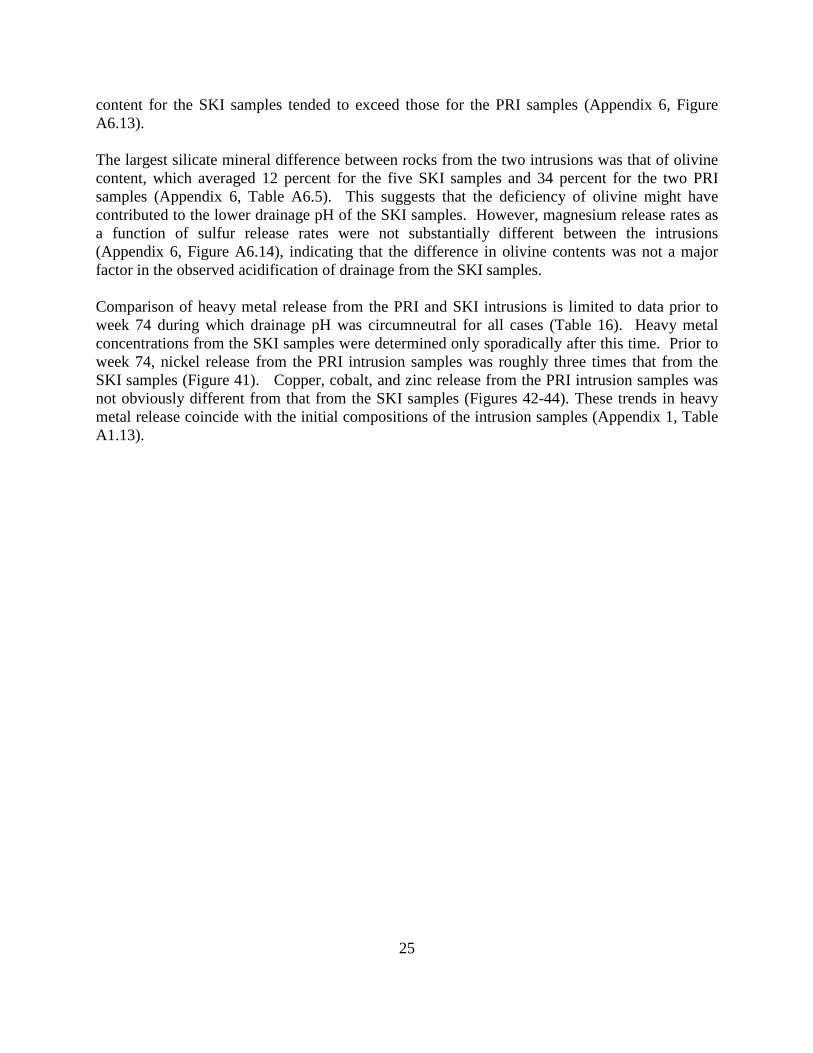
content for the SKI samples tended to exceed those for the PRI samples (Appendix 6, Figure A6.13). The largest silicate mineral difference between rocks from the two intrusions was that of olivine content, which averaged 12 percent for the five SKI samples and 34 percent for the two PRI samples (Appendix 6, Table A6.5). This suggests that the deficiency of olivine might have contributed to the lower drainage pH of the SKI samples. However, magnesium release rates as a function of sulfur release rates were not substantially different between the intrusions (Appendix 6, Figure A6.14), indicating that the difference in olivine contents was not a major factor in the observed acidification of drainage from the SKI samples. Comparison of heavy metal release from the PRI and SKI intrusions is limited to data prior to week 74 during which drainage pH was circumneutral for all cases (Table 16). Heavy metal concentrations from the SKI samples were determined only sporadically after this time. Prior to week 74, nickel release from the PRI intrusion samples was roughly three times that from the SKI samples (Figure 41). Copper, cobalt, and zinc release from the PRI intrusion samples was not obviously different from that from the SKI samples (Figures 42-44). These trends in heavy metal release coincide with the initial compositions of the intrusion samples (Appendix 1, Table A1.13).
25

6. SUMMARY In August 2003 laboratory dissolution tests were initiated on 10 Duluth Complex rock samples from the Babbitt and Dunka Road prospects of the Partridge River intrusion. These experiments remain in progress and the present report analyzes and summarizes data generated through week 400. Dissolution tests were conducted on 10 coarse samples (d < 6.35 mm = 0.25 in.; 0.13 ≤ %ST ≤ 1.36; 0.05 ≤ %CO2 ≤ 0.21) and seven fine samples (0.053 < d < 0.149 mm; 0.07 ≤ %ST ≤ 0.94; 0.07 ≤ %CO2 ≤ 0.21). All samples were characterized with respect to chemistry, mineral content, and mineral chemistry. Of the 10 coarse samples, seven were from the Babbitt prospect and three from the Dunka Road prospect. For these samples particle size distribution and abbreviated chemistry (S, CO2, Cu, Ni) as a function of particle size were also determined (Appendix 1, Table A1.2). The seven 0.053-0.149 mm samples consisted of six samples from the Babbitt prospect and one from the Dunka Road prospect. The tests generated data that described mineral dissolution reactions that release acid and heavy metals (sulfide mineral oxidation reactions) and reactions that neutralize acid (silicate mineral dissolution reactions). In general, drainage pH tended to decrease and release rates of heavy metals (copper, nickel, cobalt, zinc) and major cations (calcium, magnesium, sodium, potassium) tended to increase with increasing sulfur content. These results were consistent with the previously reported 1) dependence of sulfide mineral oxidation (as reflected by sulfate release) and the attendant acid production on the amount of sulfide minerals present and 2) importance of sulfide mineral oxidation as a driving force for release of heavy metals and major cations. The pH of drainage from the 10 coarse samples decreased with increasing sulfur content, with a minimum value of 4.1. For all but the two highest sulfur samples, pH decreased throughout the eight-year experiment. Numerous relationships between drainage quality and both solid-phase sulfur content and dissolution time were identified and quantified to accurately describe solute release and its dependence on solid-phase composition and dissolution time. Regression analysis was used to quantify a strong relationship between rates of sulfate release (reflecting sulfide mineral oxidation) and sulfur content, reflecting exposed sulfide mineral surface area (0.91 < r2 < 0.94). This analysis was used to derive composite annual sulfate release rates (per gram sulfur), which were found to decrease slightly over the eight-year experiment. Release rates for copper, nickel, cobalt, and zinc also correlated highly with sulfur content (typically 0.80 < r2 < 0.95). Copper release rates for year 8 were roughly five times those during year 1. In contrast rates of nickel, cobalt, and zinc release at the end of the experiment were roughly half those at the beginning. Magnesium was the dominant cation released, followed by calcium, and sodium. Their releases tended to parallel that of sulfate, reflecting silicate minerals dissolving to neutralize acid produced by iron sulfide mineral oxidation. Similar analysis was conducted on data generated in the seven finer-sized samples. As with the larger particles, drainage pH decreased and release rates for sulfate, major cations, and heavy metals increased with increasing sulfur content. Although the relationship between minimum drainage pH and sulfur content was similar to that for the larger particles, pH from the finer 26

samples declined more rapidly, reaching minimums between weeks 60 and 120. Sulfate release from the fine particles were initially three times those from the coarse particles, reflecting the greater sulfide mineral surface area per unit mass of the fine particles, and this rapid release contributed to the aforementioned early pH depression. Sulfate release rates from the fine particles decreased fairly quickly over time and by year seven equaled those from the coarse particles, for which rates decreased more slowly. The rapid decline of rates from the fine particles was attributed to sulfur depletion and probable coating of sulfide minerals. Dissolution testing of Dunka Road samples was limited to one sample in the 0.053-0.149 mm size fraction and three samples in the d < 6.35 mm fraction. The most notable difference between Dunka Road and Babbitt prospect rock was elevated heavy metal release from the latter. Whereas some of the difference could be ascribed to higher metal content of the Babbitt prospect rock, differences between prospects in total sulfide mineral oxidation rates and drainage pH also played a role. Because the number of samples for comparison was limited, these results should be viewed as preliminary. The Partridge River rock samples yielded higher sulfate rates than Partridge River tailings of similar sulfur content, due to greater sulfide mineral exposure in the rock samples. Heavy metal release from the rock was also higher than that from the tailings. This was due to the aforementioned elevated sulfide mineral exposure, higher heavy metal contents, and lower drainage pH associated with the rock samples. Drainage pH from the Partridge River rock tended to be about 0.7 units higher than that from previously tested South Kawishiwi rock of similar sulfur content. This was attributed to the higher heavy metal content (and consequent lower iron sulfide content) of the Partridge River rock examined in the present study. Additional work should be conducted to further benefit the application of results generated to date. This includes continued dissolution testing to confidently define long-term trends, analysis of leached solids to increase understanding of chemical reactions controlling solute release (e.g. chemical precipitation and adsorption), and more detailed analysis of the present data, including calculation of mineral dissolution rates. The more detailed analysis should include calculation of mineral dissolution rates to allow application of the data generated to a wider range of mineralogical compositions.
27

7. ACKNOWLEDGMENTS Funding for this report and laboratory work since July 2011 was provided by Minerals Cooperative Environmental Research and Iron Ore Cooperative Research State funding plus industry match. Funding for laboratory work prior to July 2011 was provided by State general fund. Drill core and bulk sample rock were supplied by PolyMet and Teck Cominco, respectively. Rick Ruhanen of the MN DNR Division of Lands and Minerals summarized geological information on the Partridge River and South Kawishiwi intrusions for the introduction. Pat Geiselman conducted laboratory dissolution experiments. Debra Mayerich was responsible for data entry, and Mike Olson performed calculations and produced tables and graphs for the text and appendices.
28

8. REFERENCES ASTM International. 2007. D5744-07, Standard test method for laboratory weathering of solid materials using a humidity cell. In Annual book of ASTM Standards, 11.04. American Society for Testing and Materials, West Conschohocken, PA. 19 p. American Public Health Association (APHA), American Water Works Association, Water Environment Federation. 1992. Standard Methods for the Examination of Water and Wastewater, 18th edition. American Public Health Association, Washington, D.C. Eger, A.P. 2001. Field notes 18 April 2001 from Paul Eger, Principle Engineer, MN DNR. Geerts, S.D. 1991. Geology, stratigraphy, and mineralization of the Dunk Road Cu-Ni prospect, northeastern Minnesota: Natural Resources Research Institute, Technical Report NRRI/TR-91/14, 63p. Lapakko, K.A., Olson, M.C., Antonson, D.A. 2013. Duluth Complex Tailings Dissolution: 10-year laboratory experiment. 54 pages plus appendices. Lapakko, K.A., and Antonson, D.A., 1994, Oxidation of sulfide minerals present in Duluth Complex rock: A laboratory study, in Environmental Geochemistry of Sulfide Oxidation; ACS Symposium Series 550; American Chemical Society: Washington, DC, 1993, p. 593-607. Miller, J.D., Jr., Green, J.C., Severson, M.J., Chandler, V.W., Hauck, S.A., Peterson, D.M., Wahl, T.E. 2002. Geology and mineral potential of the Duluth Complex and related rocks of northeastern Minnesota: Minnesota Geological Survey Report of Investigations 58. Minnesota Geological Survey, St. Paul, MN. 207 p. Minnesota Department of Natural Resources (MNDNR). 2013. Duluth Complex Laboratory Dissolution Experiment, High S (Dunka Blast Hole). Report in Progress. Nordstrom, D. K. 1982. Aqueous pyrite oxidation and the consequent formation of secondary iron minerals. In Acid Sulfate Weathering. J.A. Kittrick, D.S. Fanning, and L.R. Hossner (eds.), Soil Sci. Soc. America Spec. Pub. 10. Pp. 37-56. Severson, M.J. 1991. Geology, Mineralization, and geostatistics of the Minnamax/Babbitt Cu-Ni deposit (Local Boy Area), Minnesota. Part I: Geology. Natural Resources Research Institute, Univ. Minn., Duluth. Tech. Rept. NRRI/TR-91/13a. 95 p. plus appendix. Severson, M.J. 1994. Igneous stratigraphy of the South Kawishiwi intrusion, Duluth Complex, northeastern Minnesota: Natural Resources Research Institute, Technical Report NRRI/TR-93-34, 210p., 15 pls.
29

Severson, M.J., Hauck, S.A. 1990. Geology, geochemistry and stratigraphy of a portion of the Partridge River intrusion: Natural Resources Research Institute, Technical Report NRRI/GMIN-TR-89-11, 236p., 4 pls. ________. 1997. Igneous stratigraphy and mineralization in the basal portion of the Partridge River intrusion, Duluth Complex, Allen quadrangle, Minnesota: Natural Resources Research Institute, Technical Report NRRI/TR-97/19, 102p. 4 pls. Singer, P.C., Stumm, W. 1970. Acid mine drainage: The rate determining step. Science, 167. P. 1121-1123. SRK Consulting Engineers and Scientists. 2007. RS53/RS42 - Waste Rock Characteristics and Waste Water Quality Modeling - Waste Rock and Lean Ore. NorthMet Project - DRAFT. Steger, H.F., Desjardins, L.E. 1978. Oxidation of sulfide minerals, 4. Pyrite, chalcopyrite and pyrrhotite. Chemical Geology, 23, p. 225-237. White, A.F., Brantley, S.F. (eds.). 1995. Reviews in Mineralogy, Volume 31 – Chemical weathering rates of silicate minerals. Mineralogical Society of America, 583 pp. Williamson, M.A. and Rimstidt, J.D. 1994. The kinetics and electrochemical rate-determining step of aqueous pyrite oxidation. Geochim. Cosmochim. Acta, 58. 5443-5454.
30

Table 1. Dunka Road drill hole data obtained from PolyMet (16 August 2001) for samples selected for laboratory dissolution tests.
DNR Sample
#
Drill Hole
Footage
Lerch Total %S
Pmet Total %S1
Cu
ppm
Grain Size2
%
Plag
%
Olivine
%
Pyroxene
Rock Unit
12046 3
99318
60
65
0.03
0.15
290
m-vcg
50
40
10
3
99318
55
60
1.30
0.93
1835
mg
55
45
0
3
12049 3
00340
165
170
0.25
0.31
391
m-fg
80
20
trace
3
00340
55
60
0.36
0.33
539
f-cg
50
50
0
3
12051 00366
110
115
0.23
0.45
1365
m-fg
77
20
3
3
1 Total %S reported for drill core by PolyMet were included for comparison with analyses of –6.25-mm samples by Lerch Brothers. 2 f = fine, m = medium, c = coarse, vc = very coarse, g = grain 3 Drill hole footages were mixed to produce samples 12046 and 12049 with sulfur contents of 0.61 and 0.31 percent, respectively.
31

Table 2. Particle size distribution data for the d < 6.35 mm samples (percent passing). Analyses by Lerch Brothers Inc.
Size Fraction Sample / Cell #
(mesh) (microns) 12037/9 12040/10 12041/11 12042/12 12033/14 12112/15 12110/16 12051/17 12046/18 12049/19
%S 0.13 0.21 0.33 0.55 0.72 1.03 1.36 0.23 (D) 0.31 (D) 0.61 (D)
10 2000 42.26 39.90 35.75 40.78 36.83 56.99 53.00 28.67 31.07 32.97
20 841 27.01 24.75 22.06 26.22 23.02 35.23 30.25 18.36 19.68 20.64
35 500 17.72 16.27 14.79 17.77 15.09 23.28 19.18 12.74 13.21 13.88
48 297 14.37 13.22 11.81 14.42 12.42 18.69 15.86 10.41 11.01 11.50
65 210 11.32 10.37 9.44 11.47 9.82 14.52 12.33 8.24 8.78 9.49
100 149 8.83 7.84 7.13 8.61 7.57 10.90 9.26 6.17 6.74 7.29
150 105 6.53 5.79 5.50 6.74 5.59 7.82 6.99 4.76 5.02 5.46
200 74 4.80 4.29 3.93 5.00 4.05 5.65 5.20 3.43 3.80 3.81
270 53 3.36 2.89 2.77 3.63 2.74 3.96 3.76 2.41 2.57 2.49 Note: Samples are from Babbitt prospect unless noted with (D), which indicates Dunka Road prospect. Note: All samples had 100% passing ¼ inch.
32

Table 3. Total sulfur analyses. Analyses by Lerch Brothers Inc.
Sample # Reactor %S 75 g, 0.053 < d < 0.149mm rock
12037 1 0.07 12040 2 0.11 12041 3 0.20 12042 4 0.31 12042 5 (dup. of 4) 0.31 12033 6 0.63 12110 7 0.94 12046 8 (D) 0.31
1000 g, d < 6.35 mm rock 12037 9 0.13 12040 10 0.21 12041 11 0.33 12042 12 0.55 12042 13 (dup. of 12) 0.55 12033 14 0.72 12112 15 1.03 12110 16 1.36 12051 17 (D) 0.23 12046 18 (D) 0.31 12049 19 (D) 0.61
Note: Samples are from Babbitt prospect unless noted with (D), which indicates Dunka Road prospect.
33

Table 4. Whole rock chemistry (%) for Duluth Complex waste rock reactors (0.053<d<0.149 mm) and humidity cells (d<6.35 mm). Analysis performed by Lerch Brothers Inc. and ALS USA Inc. Reactor 1 2 3 4 6 7 8 (D)
%S 0.07 0.11 0.2 0.31 0.63 0.94 0.31 CO2 0.08 0.13 0.12 0.2 0.2 0.07 0.08 SiO2 45.1 44.5 44.9 43.9 43.3 43.7 46 Al2O3 17.35 16.3 17.35 14.75 13.7 16.1 19.9 Fe2O3 14.15 14.4 14.35 14.25 15.8 16.25 11.2 CaO 8.29 8.35 8.53 7.28 6.58 8.18 9.5 MgO 10.35 8.66 8.12 9.59 9.67 8.09 7.53 Na2O 2.3 2.46 2.51 2.25 2.25 2.38 2.56 K2O 0.39 0.55 0.52 0.52 0.57 0.54 0.31
Cr2O3 0.02 0.03 0.03 0.02 0.02 0.02 0.04 TiO2 0.95 2.4 1.83 1.91 1.78 2.01 0.93 MnO 0.16 0.16 0.16 0.16 0.17 0.17 0.13 P2O5 0.08 0.14 0.14 0.18 0.22 0.18 0.08 SrO 0.03 0.03 0.03 0.03 0.03 0.03 0.03 BaO 0.01 0.02 0.02 0.02 0.02 0.02 0.01
HC 9 10 11 12 14 15 16 17 (D) 18 (D) 19 (D) %S 0.13 0.21 0.33 0.55 0.72 1.03 1.36 0.23 0.31 0.61 CO2 0.05 0.08 0.08 0.08 0.08 0.06 0.1 0.08 0.07 0.21 SiO2 45 45.4 44.8 44.2 43.7 44.3 43.5 45.6 47.4 46.2 Al2O3 18.15 17.3 18 16.65 14.95 17.8 16.05 19.3 20.7 18.8 Fe2O3 12.6 13.4 13.2 13.7 16.5 14.8 16.45 12.4 11.15 13.4 CaO 8.6 8.66 8.68 8.09 7.25 8.75 8.36 9.25 10.25 9.65 MgO 9.29 8.14 7.42 9.24 10.05 6.97 7.84 9.16 7.31 7.96 Na2O 2.4 2.58 2.57 2.37 2.26 2.52 2.33 2.34 2.6 2.49 K2O 0.42 0.62 0.58 0.63 0.65 0.53 0.56 0.28 0.34 0.39
Cr2O3 0.02 0.02 0.02 0.01 0.02 0.04 0.04 0.03 0.04 0.05 TiO2 0.96 2.25 1.69 1.84 1.85 1.91 2.11 0.61 0.85 1.62 MnO 0.14 0.15 0.15 0.15 0.17 0.15 0.16 0.14 0.12 0.14 P2O5 0.13 0.18 0.17 0.2 0.22 0.16 0.2 0.09 0.11 0.11 SrO 0.04 0.03 0.04 0.03 0.03 0.03 0.03 0.03 0.03 0.03 BaO 0.01 0.02 0.02 0.02 0.02 0.02 0.02 0.01 0.01 0.01
Note: Samples are from Babbitt prospect unless noted with (D), which indicates Dunka Road prospect.
34
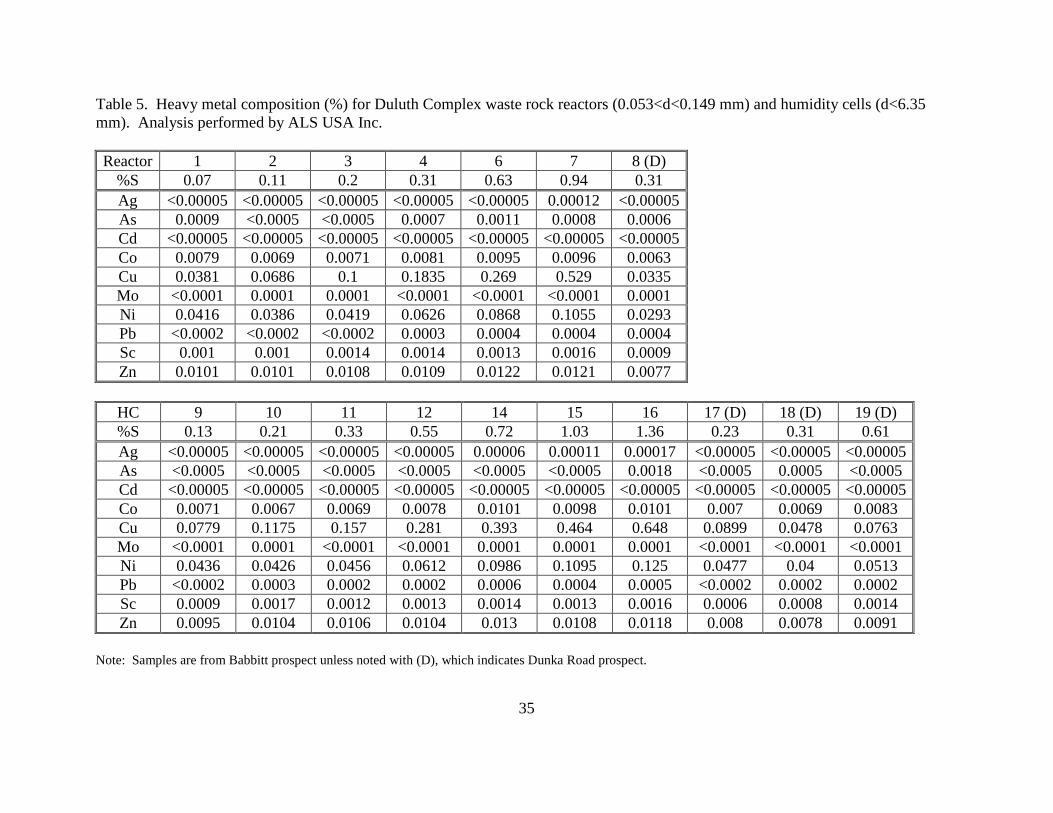
Table 5. Heavy metal composition (%) for Duluth Complex waste rock reactors (0.053<d<0.149 mm) and humidity cells (d<6.35 mm). Analysis performed by ALS USA Inc. Reactor 1 2 3 4 6 7 8 (D)
%S 0.07 0.11 0.2 0.31 0.63 0.94 0.31 Ag <0.00005 <0.00005 <0.00005 <0.00005 <0.00005 0.00012 <0.00005 As 0.0009 <0.0005 <0.0005 0.0007 0.0011 0.0008 0.0006 Cd <0.00005 <0.00005 <0.00005 <0.00005 <0.00005 <0.00005 <0.00005 Co 0.0079 0.0069 0.0071 0.0081 0.0095 0.0096 0.0063 Cu 0.0381 0.0686 0.1 0.1835 0.269 0.529 0.0335 Mo <0.0001 0.0001 0.0001 <0.0001 <0.0001 <0.0001 0.0001 Ni 0.0416 0.0386 0.0419 0.0626 0.0868 0.1055 0.0293 Pb <0.0002 <0.0002 <0.0002 0.0003 0.0004 0.0004 0.0004 Sc 0.001 0.001 0.0014 0.0014 0.0013 0.0016 0.0009 Zn 0.0101 0.0101 0.0108 0.0109 0.0122 0.0121 0.0077
HC 9 10 11 12 14 15 16 17 (D) 18 (D) 19 (D) %S 0.13 0.21 0.33 0.55 0.72 1.03 1.36 0.23 0.31 0.61 Ag <0.00005 <0.00005 <0.00005 <0.00005 0.00006 0.00011 0.00017 <0.00005 <0.00005 <0.00005 As <0.0005 <0.0005 <0.0005 <0.0005 <0.0005 <0.0005 0.0018 <0.0005 0.0005 <0.0005 Cd <0.00005 <0.00005 <0.00005 <0.00005 <0.00005 <0.00005 <0.00005 <0.00005 <0.00005 <0.00005 Co 0.0071 0.0067 0.0069 0.0078 0.0101 0.0098 0.0101 0.007 0.0069 0.0083 Cu 0.0779 0.1175 0.157 0.281 0.393 0.464 0.648 0.0899 0.0478 0.0763 Mo <0.0001 0.0001 <0.0001 <0.0001 0.0001 0.0001 0.0001 <0.0001 <0.0001 <0.0001 Ni 0.0436 0.0426 0.0456 0.0612 0.0986 0.1095 0.125 0.0477 0.04 0.0513 Pb <0.0002 0.0003 0.0002 0.0002 0.0006 0.0004 0.0005 <0.0002 0.0002 0.0002 Sc 0.0009 0.0017 0.0012 0.0013 0.0014 0.0013 0.0016 0.0006 0.0008 0.0014 Zn 0.0095 0.0104 0.0106 0.0104 0.013 0.0108 0.0118 0.008 0.0078 0.0091
Note: Samples are from Babbitt prospect unless noted with (D), which indicates Dunka Road prospect.
35

Table 6. Chemical composition (%) comparison for Babbitt and Dunka Road prospect samples
%S CaO MgO Na2O K2O Cu Ni Co Zn Fine rock (75 g, 0.053<d<0.149 mm): Reactors 4, 5 vs 8
0.311 (B) 7.28 9.59 2.25 0.52 0.184 0.0626 0.0081 0.0109
0.31 (D) 9.50 7.53 2.57 0.31 0.0335 0.0293 0.0063 0.0077 B/D 0.77 1.27 0.88 1.68 5.49 2.14 1.29 1.42
Coarse rock (1000g, d<6.35 mm): H. Cell 10 vs 17 0.21 (B) 8.66 8.14 2.58 0.62 0.118 0.0426 0.0067 0.0104 0.23 (D) 9.25 9.16 2.34 0.28 0.0899 0.0477 0.007 0.008 B/D 0.94 0.89 1.10 2.21 1.31 0.89 0.96 1.3
Coarse rock (1000g, d<6.35 mm): H. Cell 11 vs 18 0.33 (B) 8.68 7.42 2.57 0.58 0.157 0.0456 0.0069 0.0106 0.31 (D) 10.25 7.31 2.6 0.34 0.0478 0.04 0.0069 0.0078 B/D 0.85 1.02 0.99 1.71 3.28 1.14 1.00 1.36
Coarse rock (1000g, d<6.35 mm): H. Cells 12, 13 vs 19 0.551 (B) 8.09 9.24 2.37 0.63 0.281 0.0612 0.0078 0.0104 0.61 (D) 9.65 7.96 2.49 0.39 0.0763 0.0513 0.0083 0.0091 B/D 0.84 1.16 0.95 1.62 3.68 1.19 0.94 1.14
B, D indicate Babbitt prospect and Dunka Road prospect, respectively 1 Average values for duplicates
36

Table 7. Mineral content and chemistry comparison for Babbitt and Dunka Road prospect samples.
75 g, 0.053<d<0.149 mm rock, 0.31 %S.
Mineral Babbitt Prospect, 0.31 %S Dunka Road Prospect, 0.31 %S Vol % Formula Vol % Formula
Plagioclase 40 Ca0.56Na0.39 57 Ca0.63Na0.38 Olivine 30 Mg1.25Fe0.75 28 Mg1.21Fe0.80 Augite 14 Ca0.78Mg0.74 3.9 Ca0.86Mg0.82 Hypersthene 3.1 Mg1.27 2.4 Mg1.26 Biotite 2.3 Mg3.95K1.7 0.0 K-spar 2.3 K0.87Na0.085 1.6 K0.80Na0.11
1000 g, d<6.35 mm rock, ~0.2 %S.
Mineral Babbitt Prospect, 0.21 %S Dunka Road Prospect, 0.23 %S Vol % Formula Vol % Formula
Plagioclase 55 Ca0.55Na0.41 53 Ca0.61Na0.36 Olivine 15 Mg1.19Fe0.80 42 Mg1.23Fe0.76 Augite 7.2 Ca0.81Mg0.75 1.7 Ca0.80Mg0.79 Hypersthene 3.6 Mg1.08 0.8 Mg1.37 Biotite 4.5 Mg3.68K1.75 0.8 Mg3.75K1.72 K-spar 1.8 K0.81Na0.16 0.0
1000g, d<6.35 mm rock, ~0.3 %S.
Mineral Babbitt Prospect, 0.33 %S Dunka Road Prospect, 0.31 %S Vol % Formula Vol % Formula
Plagioclase 46 Ca0.55Na0.41 60 Ca0.60Na0.37 Olivine 28 Mg1.11Fe0.87 23 Mg1.22Fe0.77 Augite 8.0 Ca0.80Mg0.78 3.4 Ca0.86Mg0.78 Hypersthene 1.8 Mg1.17 2.5 Mg1.23 Biotite 2.7 Mg3.54K1.71 0.0 K-spar 1.8 K0.78Na0.17 1.7 K0.92Na0.081
1000g, d<6.35 mm rock, ~0.6 %S.
Mineral Babbitt Prospect, 0.55 %S Dunka Road Prospect, 0.61 %S Vol % Formula Vol % Formula
Plagioclase 49 Ca0.58Na0.39 48 Ca0.57Na0.38 Olivine 20 Mg1.27Fe0.73 27 Mg1.16Fe0.84 Augite 3.6 Ca0.81Mg0.78 5.0 Ca0.78Mg0.76 Hypersthene 7.1 Mg1.18 2.5 Mg1.09 Biotite 1.8 Mg3.96K1.68 0.0 K-spar 2.7 K0.74Na0.22 0.8 K0.82Na0.16
37

Table 8. Water retention (g) for the Duluth Complex waste rock samples for weeks 1-400.
Reactor % S Water retention before rinse1 Water retention after rinse count min max mean SD count min max mean SD
75-g Reactors 1 0.07 389 -4.9 4.6 -2.0 1.6 399 8.8 38.0 25.0 5.6 2 0.11 396 -7.9 4.2 -2.6 2.6 397 7.6 33.1 22.2 5.4 3 0.20 396 -8.3 1.1 -2.6 2.5 395 5.7 31.0 17.8 5.7 4 0.31 398 -10.9 5.5 -3.0 3.4 398 2.3 36.6 16.7 7.5 5 0.31 399 -11.1 0.3 -6.0 4.0 399 -0.4 29.6 13.8 7.0 6 0.63 398 -3.0 5.7 -0.8 1.3 397 16.9 36.1 27.0 3.3 7 0.94 396 -7.9 9.1 -1.8 2.9 394 7.4 37.8 24.3 6.4
8 (D) 0.31 395 -3.1 2.6 -1.3 1.4 396 14.7 34.8 23.9 4.1 1000-g Cells
9 0.13 395 90 133 108.1 8.0 397 92 150 117.1 10.0 10 0.21 399 83 126 106.0 6.7 398 88 136 114.8 7.1 11 0.33 398 82 124 101.2 6.9 397 96 147 111.8 6.6 12 0.55 399 96 126 107.9 5.1 400 101 138 119.4 5.9 13 0.55 399 74 110 93.8 5.6 400 80 115 99.7 5.6 14 0.72 397 98 119 108.8 3.4 398 103 132 118.1 4.4 15 1.03 397 133 164 151.3 4.9 399 136 176 166.4 6.5 16 1.36 399 135 161 148.4 4.5 400 140 178 163.4 6.4
17 (D) 0.23 398 79 123 99.1 6.4 399 86 161 108.3 7.6 18 (D) 0.31 398 71 111 88.9 4.2 399 84 119 99.3 4.4 19 (D) 0.61 399 105 135 119.1 5.1 400 107 145 125.7 5.8
1 To calculate water retention the original mass of the reactor and dry solids (at the beginning of the experiment)
was subtracted from the mass before the rinse. Negative values indicate that some solids were lost during the course of the experiment.
Note: Samples are from Babbitt prospect unless noted with (D), which indicates Dunka Road prospect.
38

Table 9. Page 1 of 5. Minimum pH and average annual rates of release for sulfate, calcium, magnesium, sodium, and potassium in µmol*(kg rock*week)-1. Period of record is 6 – 400 weeks for reactors and humidity cells. During the first year, 8-11 concentrations were sampled for each parameter. Sampling frequency for subsequent years decreased to approximately 3-5 per year.
ID Year min pH1
Sulfate Calcium Magnesium Sodium Potassium
rate s.d. rate s.d. rate s.d. rate s.d. rate s.d.
Reactor 1 0.07 %S
1 6.48 65.6 26.2 64.9 18.8 41.6 8.59 17 4.35 47.1 18.6 2 6.42 68.9 21.8 38.6 10.3 37.8 14.1 14.4 3.32 11.4 6.1 3 6.42 32.9 6.61 23.1 3.1 26.1 2.21 10.5 2.98 2.73* 0.0168 4 6.41 22.1 3.96 15.9 3.55 20.8 5.78 8.36 4.23 2.73* 0.0239 5 6.58 14 1.92 12.3 1.42 22.4 1.41 4.66* 0.0633 5.43 6.03 6 6.65 7.58* 5.26 17 5.31 22.4 4.32 6.69 5.32 4.25 2.93 7 6.42 6.86* 3.15 18.6 5.14 23.4 4.7 5.68 2.25 2.79* 0.0303 82 6.48 7.63* 3.82 12.8 3.46 21.1 2.5 4.79* 0.0504 2.82* 0.0268
Total3 6.42 28.2 9.37 25.4 5.68 26.9 4.19 9.02 1.94 9.9 6.38
Reactor 2 0.11 %S
1 6.38 145 80.2 106 21.7 73.7 29.8 19.3 4.78 52.8 22.5 2 6.23 91.7 31.2 40.5 12.6 50.4 14.6 15.9 2.72 16.8 8.04 3 6.45 44.6 8.33 25.3 3.49 35.3 4.11 12.4 1.46 3.45 1.34 4 6.34 29.1 3.53 15.4 3.75 24.1 3.99 11.5 4.22 5.46 3.09 5 6.53 21.1 2.85 11.9 1.62 26.1 1.93 4.82* 0.0324 4.98 3.09 6 6.49 16.7 3.3 13.8 3.32 26.6 2.64 6.17 2.33 5.81 4.39 7 6.36 11.3 5.28 19.8 8.6 29.3 8.45 6.64 3.06 6.67 4.71 82 6.43 10.1 4.94 12.1 5.07 23.7 4.5 4.86* 0.0228 2.86* 0.0134
Total3 6.35 46.2 27.1 30.5 6.73 36.2 9.45 10.2 1.76 12.4 7.11
Reactor 3 0.20 %S
1 6.06 245 129 145 53.1 88.9 39.6 32.1 8.56 96.7 47.9 2 5.75 133 31.6 45.8 11.3 34.2 12.6 27.8 7.93 20.3 11.8 3 5.68 72.6 11.5 26.8 3.01 20 3.05 15.8 3.57 3.81 1.49 4 5.71 50 3.76 19.6 3.98 14.7 2.54 10.3 4.34 2.8* 0.129 5 5.83 34.6 6.05 10.7 0.646 12.2 1.34 4.92* 0.0301 2.89* 0.0189 6 5.86 25.5 3.04 10.4 3.96 9.7 3.73 5.83 2.59 3.42* 1.5 7 5.79 21 3.92 13.8 4.18 9.1 3.53 7.81 5.88 2.87* 0.0302 82 5.98 16.5 2.47 6.46 0.394 4.68* 0.0801 10.3 10.7 2.91 2.91
Total3 5.73 74.8 43.6 34.8 17.7 24.2 13.2 14.6 3.51 17 17
Reactor 4 0.31 %S
1 6.34 256 189 179 63 114 69.6 27.4 9.01 78.8 39.2 2 5.84 183 37.8 48.6 13.4 91.1 17.5 23.1 4.21 18.6 10.7 3 6.09 102 13.1 26.5 4.48 67.4 8.4 14.8 2.86 4.46 1.99 4 6.07 68.9 11.8 17.4 2.31 51.2 7.86 8.66 4.36 2.88* 0.052 5 6.21 45.8 7.16 10.3 2.09 45.9 5.67 4.91* 0.0297 2.9* 0.0366 6 6.28 30.8 5.74 10.5 3.11 36.2 4.25 5.95* 2.64 3.5* 1.54 7 6.23 25.4 5.62 11.9 6.28 36.4 8 8.2 7.89 2.95* 0.0426 82 6.29 19.8 3.04 6.35 1.19 27.3 4.52 8.54 7.03 2.95* 0.00858
Total3 6.07 91.4 63.6 38.8 21 58.7 22.2 12.7 3.02 14.6 13.6 1 5th percentile value 2 Year 8 represented by weeks 365-400 3 Average and standard deviation for entire period of record
* Majority of concentrations during this time interval were below detection limit. One half of the detection limit was used to calculate the annual average release rate.
Note: Samples are from Babbitt prospect unless noted with (D), which indicates Dunka Road prospect.
39

Table 9. Page 2 of 5. Minimum pH and average annual rates of release for sulfate, calcium, magnesium, sodium, and potassium in µmol*(kg rock*week)-1. Period of record is 6 – 400 weeks for reactors and humidity cells. During the first year, 8-11 concentrations were sampled for each parameter. Sampling frequency for subsequent years decreased to approximately 3-5 per year.
ID Year min pH1
Sulfate Calcium Magnesium Sodium Potassium
rate s.d. rate s.d. rate s.d. rate s.d. rate s.d.
Reactor 5 0.31 %S
(dup. of 4)
1 6.30 238 178 172 54.2 107 62.6 25.1 7.26 70.2 30.4 2 5.93 163 30.4 43.9 14 81.3 17.4 22.3 1.93 15 7.69 3 6.16 96.9 12.4 24.6 2.94 61.1 8.75 17.5 2.14 11.4 3.8 4 6.09 62.7 13.2 17.1 4.08 44.3 10.2 11.5 4.48 7.59 3.9 5 6.34 38.7 6.8 9.68 0.837 38.5 4.76 6.93 4.38 3.73 1.8 6 6.28 24.1 2.93 9.34 2.51 33.7 2.7 4.92* 0.0316 2.89* 0.0186 7 6.34 21.2 7.17 11.9 5.18 41.7 6.8 12.3 9.29 2.9* 0.0199 82 6.38 19.1 2.79 9.35 9.24 31.8 6.54 4.94* 0.0288 2.9* 0.0169
Total3 6.10 83 59.6 37.3 17.7 55 19.7 13.2 3.33 14.6 10.2
Reactor 6 0.63 %S
1 5.96 322 278 138 73.2 151 110 24.2 9.91 65.5 24.3 2 5.37 320 54.7 69.3 14.9 133 29.7 38.7 2.3 34.8 6.72 3 5.17 232 35.3 47.8 6.14 89.5 15.8 30.3 4.64 17.7 6.64 4 5.19 159 21.4 29.7 4.23 65 13.1 22 2.87 21.8 3.4 5 5.31 130 19.7 19.4 2.11 64.6 9.92 9.32 5.95 9.89 10.2 6 5.40 90.2 10.3 15.2 6.08 45.6 18.7 10.5 4.12 4.94 3.46 7 5.69 74 9.86 16.6 3.85 45.9 4.61 17.7 3.57 4.35 2.59 82 5.67 71.5 10.7 14.6 4.28 42.6 5.12 23.5 9.17 5.43 5.28
Total3 5.19 175 91.3 43.9 24.1 79.8 34.9 22 2.84 20.6 7.1
Reactor 7 0.94 %S
1 4.53 530 263 191 65.3 93.7 47.7 49.9 26.6 81.4 32.3 2 4.42 452 44.9 83.8 16.3 45.2 11.6 56.4 6.33 35.2 19.2 3 4.50 314 34 54.3 7.9 28 4.14 38.3 6.06 12.2 8.14 4 4.55 239 26.8 39.7 3.98 21.3 4.21 30.1 4.78 9.42 2.22 5 4.55 193 26.6 26.1 5.03 18.2 2.69 17.6 5.12 2.8* 0.0214 6 4.60 154 15.9 28.7 6.65 18.3 2.2 17.1 2.2 6.17 6.15 7 4.49 140 19.5 26.7 6.91 15 6.5 25.9 6.67 5.13 4.49 82 4.69 125 5.67 22.9 3.02 15.8 1.21 24.6 9.76 2.81* 0.0119
Total3 4.47 268 85 59.1 21 31.9 15.6 32.5 7.62 19.4 11.2
Reactor 8(D) 0.31 %S
1 6.34 156 78.7 127 32.3 57.3 30.7 14.3 3.71 32.5 14.8 2 5.89 135 36.3 48.5 18.3 74.8 16.7 12.9 3.2 7.63 4.16 3 6.19 69 24.2 22.6 5.19 51.9 12.9 7.76 2.94 3.14* 1.1 4 6.15 42.7 6.9 15.5 2.86 35.2 6.45 4.73* 0.0521 2.78* 0.0307 5 6.28 24.8 4.56 8.57 0.659 30.3 2.57 4.78* 0.0223 5.29 4.14 6 6.32 19.8 4.92 11.1 3.17 29.6 4.78 5.44* 1.79 2.8* 0.023 7 6.23 15.1 5.55 14.2 6.21 29 6.35 4.76* 0.068 3.5* 1.82 82 6.18 13.7 6.27 8.55 0.492 25.4 3.85 4.8* 0.0358 2.82* 0.0211
Total3 6.05 59.5 26.1 32 11.1 41.7 9.45 7.44 1.62 7.55 4.99 1 5th percentile value 2 Year 8 represented by weeks 365-400 3 Average and standard deviation for entire period of record
* Majority of concentrations during this time interval were below detection limit. One half of the detection limit was used to calculate the annual average release rate.
Note: Samples are from Babbitt prospect unless noted with (D), which indicates Dunka Road prospect.
40

Table 9. Page 3 of 5. Minimum pH and average annual rates of release for sulfate, calcium, magnesium, sodium, and potassium in µmol*(kg rock*week)-1. Period of record is 6 – 400 weeks for reactors and humidity cells. During the first year, 8-11 concentrations were sampled for each parameter. Sampling frequency for subsequent years decreased to approximately 3-5 per year.
ID Year min pH1
Sulfate Calcium Magnesium Sodium Potassium
rate s.d. rate s.d. rate s.d. rate s.d. rate s.d.
Humidity cell 9
0.13 %S
1 6.92 32.9 6.46 34.5 3.83 29.4 11.3 7.67 5.21 7.97 2.15 2 6.76 32 3.91 20.8 3.83 17.4 1.7 3.02 0.486 5.76 0.39 3 6.54 27.1 2.82 14.6 2.17 17.2 2.31 2.74 0.424 5.61 0.522 4 6.47 22.1 2.12 10.3 1.38 14.7 1.35 1.68 0.701 4.3 0.33 5 6.49 18.5 1.6 7.09 0.587 14.7 0.773 1.06* 0.0124 3.97 0.911 6 6.44 14.6 1.07 6.11 0.798 13.2 0.558 1.27* 0.556 3.61 0.524 7 6.37 14.4 2.11 6.67 1.09 14.1 1.85 1.66 0.792 4.21 0.509 82 6.30 13.2 0.935 4.69 0.296 12.9 0.888 1.06* 0.00281 3.69 0.398
Total3 6.42 21.8 1.82 13.1 1.4 16.7 3.57 2.52 1.72 4.89 0.607
Humidity cell 10
0.21 %S
1 6.92 67.6 12.9 54 11.3 38.4 9.96 8.43 4.44 8.94 1.41 2 6.61 50.3 5.73 27.1 5.68 23.5 2.94 3.76 0.778 7.38 0.818 3 6.39 43.2 5.95 19.4 1.95 22.9 2.93 3.99 0.616 6.83 0.537 4 6.27 33.6 4.15 12.8 1.87 18.3 2.36 3.78 0.534 5.16 0.514 5 6.27 27.8 2.11 9.17 0.868 16.9 1.06 2.04 0.916 3.99 0.64 6 6.19 21.6 1.16 7.94 0.845 14.9 0.907 2.64 0.571 3.92 0.496 7 6.12 19.8 3.13 7.71 0.939 14.7 1.47 2.42 0.742 4.22 0.366 82 6.16 20.3 2.66 6.25 0.715 15 1.51 1.39 0.65 4.35 0.377
Total3 6.18 35.5 3.7 18.1 3.73 20.6 2.96 3.56 1.33 5.6 0.342
Humidity cell 11
0.33 %S
1 7.00 50.9 8.86 42 3.75 31.8 10.9 8.66 5.61 11.9 2.15 2 6.44 52.7 2.66 28.3 4.05 21.7 1.4 3.51 0.92 9.81 0.788 3 5.99 54.7 7.03 23.1 3.05 23.7 3.59 5.06 1.51 10.1 0.932 4 5.69 48.4 3.66 16.4 2.19 19.9 2.34 5.85 0.43 7.74 0.828 5 5.57 46.3 4.98 13.7 1.32 19.4 1.62 5.15 0.497 5.99 0.705 6 5.45 37 3.09 12.1 1.82 16.1 1.96 4.8 0.805 5.56 1.24 7 5.28 34.9 5.53 11.9 2 15.7 2.12 5.98 1.57 5.29 0.981 82 4.88 35 4.22 10.1 0.775 14.4 1.25 8.5 2.47 4.57 0.51
Total3 5.31 45 2.1 19.7 1.15 20.3 3.2 5.94 1.71 7.63 0.504
Humidity cell 12
0.55 %S
1 7.06 71.8 9.31 59.8 5.62 40.4 12.8 9.09 5.6 10.6 1.91 2 6.54 68.8 8.25 42.9 7.92 28.4 2.53 3.77 0.625 8.18 0.518 3 6.27 68.5 7.99 29.7 3.72 32.5 5.76 4.76 1.12 7.84 0.695 4 6.02 63.8 3.56 20.9 2.39 32.2 1.67 5.04 0.367 6.21 0.356 5 5.87 59.1 7.33 13.9 1.98 32.5 3.44 3.32 0.926 5.01 0.899 6 5.76 50.3 3.84 11.5 1.1 30.2 2.42 3.62 0.323 5.13 0.83 7 5.67 47.1 5.15 10.3 1.43 30.9 3.53 4.33 1.34 5.03 0.497 82 5.47 43.4 3.73 8.22 0.954 28.3 1.75 3.92 1.98 5.13 0.69
Total3 5.70 59.1 2.33 24.7 2.48 31.9 3.71 4.73 1.73 6.64 0.484 1 5th percentile value 2 Year 8 represented by weeks 365-400 3 Average and standard deviation for entire period of record
* Majority of concentrations during this time interval were below detection limit. One half of the detection limit was used to calculate the annual average release rate.
Note: Samples are from Babbitt prospect unless noted with (D), which indicates Dunka Road prospect.
41

Table 9. Page 4 of 5. Minimum pH and average annual rates of release for sulfate, calcium, magnesium, sodium, and potassium in µmol*(kg rock*week)-1. Period of record is 6 – 400 weeks for reactors and humidity cells. During the first year, 8-11 concentrations were sampled for each parameter. Sampling frequency for subsequent years decreased to approximately 3-5 per year.
ID Year min pH1
Sulfate Calcium Magnesium Sodium Potassium
rate s.d. rate s.d. rate s.d. rate s.d. rate s.d.
Humidity cell 13
0.55 %S
1 6.92 72 12.2 59.9 7.85 39.9 14.3 10 6.69 10.2 2.32 2 6.64 61.6 5.9 38.4 5.94 25.7 1.93 3.58 0.627 7.73 0.82 3 6.34 62.6 10.9 27.5 4.33 30.6 6.52 4.35 1.23 7.26 0.911 4 6.04 57.3 4.83 18.7 2.72 29.1 2.93 4.47 0.419 5.67 0.464 5 5.90 57.1 5.69 13.7 2.09 31.8 3.24 2.83 1.23 4.78 0.885 6 5.85 44.7 3.7 10.4 1 27.7 3.46 3.18 0.298 4.48 0.574 7 5.62 40.9 6.22 9.31 1.57 26.6 3.71 3.05 1.29 4.63 0.39
82 5.66 40.2 3.6 7.4 0.582 26.4 1.52 3.49 1.76 4.38 0.254
Total3 5.75 54.5 3.2 23.2 2.57 29.7 4.15 4.37 2.08 6.14 0.648
Humidity cell 14
0.72 %S
1 6.69 103 12.7 53.2 7.64 67.5 13.7 8.41 6.3 12.9 4.06 2 6.11 113 6.33 43.5 4.71 59 3.43 4.58 0.72 10.5 0.57 3 5.90 103 11.2 29.4 4.14 57.5 8.43 6.79 1.29 9.39 0.91 4 5.67 89.9 7.36 21.2 2.98 50.1 5.23 6.47 0.519 6.91 0.675 5 5.61 87.7 7.4 17 1.9 48.8 5.26 5.91 1.05 5.53 0.824 6 5.55 70.7 3.82 14.4 1.43 41.3 3.14 6.1 0.883 4.93 0.65 7 5.37 66.9 9.24 12.9 2.02 40 5.53 6.25 1.45 5.13 0.518 82 5.23 66.9 5.08 12 0.494 39.6 2.47 8.11 2.37 4.7 0.286
Total3 5.43 87.7 3.01 25.4 2.28 50.5 3.67 6.58 1.9 7.49 1.22
Humidity cell 15
1.03 %S
1 4.95 175 24.1 89.2 38.9 43.4 7.37 14.3 3.33 16 3.81 2 4.50 136 16.2 40.7 3.67 39.6 5.51 20.5 2.18 9.13 1.16 3 4.40 165 20.6 42 5.29 58.4 10 28.2 4.1 7.18 0.764 4 4.16 180 15.1 39 2.96 58 7.38 29.2 3.99 5.71 0.864 5 4.17 185 15.4 33.5 3.64 50.1 9.41 24 4.19 4.01 0.903 6 4.18 157 8.63 29.6 2.39 48.9 7.72 19.7 3.68 5.01 2.11 7 4.09 161 31.1 30.4 5.33 49.9 7.48 22.2 4.38 4.87 0.704 82 4.07 148 12.2 27.4 1.56 45 3.14 19.8 2.82 4.74 0.266
Total3 4.17 164 7.12 41.5 12.6 49.2 2.15 22.2 0.76 7.08 1.14
Humidity cell 16
1.36 %S
1 4.91 242 24.1 121 50.8 67.1 13.6 17.2 4.52 21.8 4.8 2 4.61 189 10.4 51.2 6.04 50 4.7 23.2 1.28 11.4 1.43 3 4.46 188 15.6 46.9 4.51 52.1 6.69 27.1 3 8.28 0.869 4 4.34 174 6.3 38.4 1.5 44.6 4.25 24 1.87 5.71 0.675 5 4.28 177 10.1 35.1 2.92 37.8 4.99 22 1.99 4.08 0.692 6 4.31 154 6.71 29.2 5.05 36.4 5.94 20.3 3.8 4.46 1.66 7 4.19 173 41.8 34.5 7.95 40.2 8.24 25.3 5.24 5.21 0.885 82 4.13 144 12.5 28.9 2.05 34.6 2.96 20.5 3.16 5.07 1.4
Total3 4.28 180 11.9 48.2 16.6 45.3 3.32 22.4 1.37 8.25 1.36 1 5th percentile value 2 Year 8 represented by weeks 365-400 3 Average and standard deviation for entire period of record
* Majority of concentrations during this time interval were below detection limit. One half of the detection limit was used to calculate the annual average release rate.
Note: Samples are from Babbitt prospect unless noted with (D), which indicates Dunka Road prospect.
42

Table 9. Page 5 of 5. Minimum pH and average annual rates of release for sulfate, calcium, magnesium, sodium, and potassium in µmol*(kg rock*week)-1. Period of record is 6 – 400 weeks for reactors and humidity cells. During the first year, 8-11 concentrations were sampled for each parameter. Sampling frequency for subsequent years decreased to approximately 3-5 per year.
ID Year min pH1
Sulfate Calcium Magnesium Sodium Potassium
rate s.d. rate s.d. rate s.d. rate s.d. rate s.d.
Humidity cell 17(D)
0.23 %S
1 7.19 32 12.6 43.3 10.4 17.6 7.01 8.45 6.98 4.91 1.18 2 6.97 13.2 1.64 21.1 4.09 8.7 0.801 1.63 0.62 3.51 0.351 3 6.84 10.7 1.26 14.6 2.33 8.87 1.76 1.42 0.555 3.39 0.479 4 6.64 8.5 0.472 9.39 1.21 7.11 1.18 1.04* 0.0147 2.48 0.203 5 6.60 8.75 0.612 7.57 0.424 8.9 0.452 1.06* 0.0206 2.08 0.404 6 6.47 7.27 0.703 6.86 0.668 8.28 0.34 1.06* 0.00937 2.53 0.824 7 6.35 7.76 1.47 7.23 1.12 9.31 1.42 1.05* 0.0102 2.5 0.383 82 6.30 7.07 0.35 5.06 0.211 8.59 0.557 1.06* 0.0109 2.24 0.48
Total3 6.40 11.9 4.14 14.4 3.4 9.66 2.21 2.1 2.42 2.96 0.314
Humidity cell 18(D)
0.31 %S
1 7.07 62.4 9.32 65.9 9.31 16.7 5.7 12.4 11.4 5.52 1.05 2 6.44 52.2 4.83 37.7 7.04 15.7 2.23 3.24 0.447 4.75 0.438 3 6.28 49 6.33 26.2 3.87 22.2 4.02 2.96 0.521 4.54 0.726 4 6.10 40.1 5.09 16.6 2.59 20.7 2.58 1.94 0.898 3.31 0.359 5 6.09 36 3.74 12.7 1.37 21.2 1.65 1.05* 0.02 2.57 0.586 6 6.00 28.3 1.64 10.4 0.953 18.5 1.72 1.38 0.581 2.64 0.344 7 5.83 30.5 10.7 11.8 3.25 20.9 6.34 1.78 0.958 2.86 0.648 82 5.53 27.6 3.98 8.58 0.865 18.5 1.87 1.36 0.625 2.56 0.521
Total3 5.85 40.8 3 23.7 3.05 19.3 1.87 3.27 3.83 3.6 0.231
Humidity cell 19(D)
0.61 %S
1 7.00 92.6 12 85 18.4 26 5.98 20.4 22.1 5.52 1.42 2 6.43 109 7.56 94.9 11.7 23.7 3.49 4.92 0.823 5.74 0.717 3 6.14 105 11.7 67.7 11.2 32.1 5.15 6.83 1.41 5.72 1.47 4 5.83 87.7 6.6 45.6 5.33 29.5 3.7 7.37 0.824 3.42 0.46 5 5.64 78.1 11.1 35.9 4.2 28.2 2.18 6.07 0.861 2.02 0.569 6 5.36 65.9 6.21 29.2 2.68 24.8 1.82 6.66 1.02 2.23 0.268 7 5.06 71.9 8.44 31.8 4.61 30.3 3.65 9.97 1.93 1.85 1.02 82 4.96 68.9 6.32 26.9 1.77 29.2 1.86 8.66 1.46 1.75 0.188
Total3 5.09 84.8 2.48 52.1 5.74 28 1.53 8.86 7.41 3.53 0.494 1 5th percentile value 2 Year 8 represented by weeks 365-400 3 Average and standard deviation for entire period of record
* Majority of concentrations during this time interval were below detection limit. One half of the detection limit was used to calculate the annual average release rate.
Note: Samples are from Babbitt prospect unless noted with (D), which indicates Dunka Road prospect.
43

Table 10. Page 1 of 5. Minimum pH and average annual rates of release for sulfate, copper, nickel, cobalt, and zinc in µmol*(kg rock*week)-1. Period of record is 6 – 400 weeks for reactors and humidity cells. During the first year, 8-11 concentrations were sampled for each parameter. Sampling frequency for subsequent years decreased to approximately 3-5 per year.
ID Year min pH1
Sulfate Copper Nickel Cobalt Zinc rate s.d. rate s.d. rate s.d. rate s.d. rate s.d.
Reactor 1 0.07 %S
1 6.48 65.6 26.2 3.92E-02 1.63E-02 7.66E-02 7.21E-02 3.60E-02* 3.61E-04 4.14E-02 2.53E-02 2 6.42 68.9 21.8 3.35E-02* 3.59E-04 6.09E-01 6.77E-02 3.61E-02* 3.87E-04 1.02E-01 6.00E-02 3 6.42 32.9 6.61 5.04E-02 3.40E-02 4.78E-01 1.02E-01 3.59E-02* 6.24E-04 1.34E-01 4.35E-02 4 6.41 22.1 3.96 7.42E-02 5.42E-02 3.58E-01 1.21E-01 3.63E-02* 3.67E-04 1.27E-01 7.32E-02 5 6.58 14 1.92 3.37E-02* 4.75E-04 2.19E-01 5.37E-02 3.63E-02* 5.12E-04 6.09E-02 4.02E-02 6 6.65 7.58* 5.26 4.93E-02 2.71E-02 1.25E-01 2.82E-02 3.63E-02* 1.07E-04 8.82E-02 5.01E-02 7 6.42 6.86* 3.15 3.43E-02* 4.04E-04 6.39E-02 3.71E-02 3.70E-02* 4.36E-04 4.73E-02* 3.14E-02 82 6.48 7.63* 3.82 6.18E-02 3.12E-02 1.60E-01 1.46E-02 3.74E-02* 3.93E-04 6.66E-02 5.67E-02
Total3 6.42 28.2 9.37 4.70E-02 1.97E-02 2.61E-01 3.65E-02 3.64E-02 1.48E-04 8.34E-02 1.57E-02
Reactor 2 0.11 %S
1 6.38 145 80.2 4.66E-02 2.10E-02 9.91E-01 1.84E+00 7.18E-02 7.54E-02 9.34E-02 1.05E-01 2 6.23 91.7 31.2 1.07E-01 1.70E-02 2.66E+00 7.82E-01 1.72E-01 3.69E-02 2.44E-01 1.59E-01 3 6.45 44.6 8.33 1.16E-01 2.10E-02 1.21E+00 3.30E-01 9.39E-02 2.56E-02 1.72E-01 6.80E-02 4 6.34 29.1 3.53 1.08E-01 1.07E-01 4.73E-01 3.25E-01 4.78E-02 2.02E-02 1.89E-01 5.97E-02 5 6.53 21.1 2.85 7.18E-02 5.26E-02 3.84E-01 1.24E-01 3.76E-02* 4.16E-04 8.31E-02 2.25E-02 6 6.49 16.7 3.3 1.55E-01 1.04E-01 3.84E-01 6.41E-02 3.74E-02* 6.79E-05 1.78E-01 1.53E-02 7 6.36 11.3 5.28 2.74E-01 1.46E-01 4.31E-01 1.81E-01 3.78E-02* 2.56E-04 3.01E-01 2.32E-01 82 6.43 10.1 4.94 2.41E-01 8.24E-02 2.91E-01 4.47E-02 3.79E-02* 1.78E-04 9.48E-02 8.24E-02
Total3 6.35 46.2 27.1 1.40E-01 4.83E-02 8.54E-01 6.05E-01 6.70E-02 2.66E-02 1.69E-01 7.25E-02
Reactor 3 0.20 %S
1 6.06 245 129 4.54E-01 7.60E-01 7.38E+00 1.22E+01 5.80E-01 9.27E-01 4.48E-01 6.76E-01 2 5.75 133 31.6 1.21E+01 2.76E+00 1.32E+01 3.09E+00 8.98E-01 2.58E-01 8.51E-01 3.97E-01 3 5.68 72.6 11.5 1.30E+01 1.73E+00 6.75E+00 1.90E+00 4.15E-01 1.25E-01 4.56E-01 8.63E-02 4 5.71 50 3.76 8.82E+00 6.98E-01 3.10E+00 5.54E-01 1.86E-01 3.23E-02 1.96E-01 6.49E-02 5 5.83 34.6 6.05 7.41E+00 1.39E+00 1.54E+00 5.08E-01 9.37E-02 1.81E-02 4.17E-01 8.89E-02 6 5.86 25.5 3.04 5.63E+00 5.23E-01 8.06E-01 8.88E-02 3.78E-02* 1.83E-04 3.04E-01 3.06E-02 7 5.79 21 3.92 5.25E+00 7.50E-01 6.79E-01 6.16E-02 3.82E-02* 4.01E-04 1.38E-01 1.51E-01 82 5.98 16.5 2.47 3.46E+00 1.76E+00 4.13E-01 9.59E-02 3.86E-02* 6.61E-04 1.48E-01 2.27E-01
Total3 5.73 74.8 43.6 7.02E+00 7.64E-01 4.24E+00 4.15E+00 2.86E-01 3.19E-01 3.70E-01 2.20E-01
Reactor 4 0.31 %S
1 6.34 256 189 4.32E-01 8.32E-01 1.43E+01 2.47E+01 7.89E-01 1.24E+00 4.60E-01 7.40E-01 2 5.84 183 37.8 5.28E+00 6.92E-01 1.86E+01 4.75E+00 1.11E+00 2.72E-01 8.56E-01 2.65E-01 3 6.09 102 13.1 6.00E+00 9.08E-01 8.96E+00 2.33E+00 5.51E-01 1.41E-01 4.97E-01 1.49E-01 4 6.07 68.9 11.8 4.45E+00 1.17E+00 3.88E+00 8.63E-01 2.59E-01 4.90E-02 2.79E-01 1.45E-01 5 6.21 45.8 7.16 1.91E+00 2.28E+00 1.55E+00 1.22E+00 1.09E-01 9.86E-02 1.87E-01 2.65E-02 6 6.28 30.8 5.74 1.05E+00 1.02E+00 9.24E-01 1.32E-01 1.03E-01 9.22E-03 2.70E-01 4.17E-02 7 6.23 25.4 5.62 1.51E+00 1.60E+00 6.77E-01 1.08E-01 5.70E-02 2.43E-02 3.89E-01 1.12E-01 82 6.29 19.8 3.04 7.74E-01 4.61E-01 4.55E-01 8.68E-02 3.92E-02* 1.14E-04 2.40E-01 8.92E-02
Total3 6.07 91.4 63.6 2.67E+00 5.77E-01 6.18E+00 8.39E+00 3.78E-01 4.18E-01 3.97E-01 2.32E-01 1 5th percentile value 2 Year 8 represented by weeks 365-400 3 Average and standard deviation for entire period of record
* Majority of concentrations during this time interval were below detection limit. One half of the detection limit was used to calculate the annual average release rate.
Note: Samples are from Babbitt prospect unless noted with (D), which indicates Dunka Road prospect.
44

Table 10. Page 2 of 5. Minimum pH and average annual rates of release for sulfate, copper, nickel, cobalt, and zinc in µmol*(kg rock*week)-1. Period of record is 6 – 400 weeks for reactors and humidity cells. During the first year, 8-11 concentrations were sampled for each parameter. Sampling frequency for subsequent years decreased to approximately 3-5 per year.
ID Year min pH1
Sulfate Copper Nickel Cobalt Zinc
rate s.d. rate s.d. rate s.d. rate s.d. rate s.d.
Reactor 5 0.31 %S
(dup. of 4)
1 6.30 238 178 3.85E-01 8.03E-01 1.25E+01 2.39E+01 6.50E-01 1.25E+00 3.68E-01 6.31E-01 2 5.93 163 30.4 3.17E+00 1.40E+00 1.61E+01 3.89E+00 9.65E-01 2.11E-01 7.62E-01 2.24E-01 3 6.16 96.9 12.4 3.02E+00 9.76E-01 8.70E+00 2.18E+00 5.63E-01 1.37E-01 6.77E-01 1.34E-01 4 6.09 62.7 13.2 1.82E+00 1.22E+00 3.80E+00 1.08E+00 2.50E-01 6.51E-02 4.26E-01 5.70E-02 5 6.34 38.7 6.8 6.80E-01 2.77E-01 1.58E+00 6.53E-01 1.17E-01 2.14E-02 3.22E-01 4.33E-02 6 6.28 24.1 2.93 1.02E+00 3.80E-01 7.84E-01 2.38E-01 7.91E-02 3.70E-02 2.15E-01 8.16E-02 7 6.34 21.2 7.17 9.56E-01 6.14E-01 6.28E-01 9.54E-02 3.81E-02* 9.63E-04 1.27E-01 1.42E-01 82 6.38 19.1 2.79 1.73E+00 1.83E+00 4.60E-01 4.85E-02 1.49E-01 2.21E-01 2.13E-01 1.52E-01
Total3 6.10 83 59.6 1.60E+00 5.29E-01 5.57E+00 8.16E+00 3.51E-01 4.16E-01 3.89E-01 1.90E-01
Reactor 6 0.63 %S
1 5.96 322 278 6.50E-01 8.94E-01 3.72E+01 5.15E+01 2.08E+00 2.92E+00 1.10E+00 1.38E+00 2 5.37 320 54.7 9.91E+00 5.58E+00 5.43E+01 1.99E+01 3.31E+00 1.22E+00 2.21E+00 7.81E-01 3 5.17 232 35.3 2.38E+01 2.97E+00 2.60E+01 5.61E+00 1.47E+00 3.88E-01 1.09E+00 3.37E-01 4 5.19 159 21.4 2.31E+01 1.37E+00 1.18E+01 2.46E+00 6.53E-01 1.17E-01 5.72E-01 7.19E-02 5 5.31 130 19.7 2.25E+01 3.70E+00 7.92E+00 3.31E+00 4.62E-01 1.93E-01 4.50E-01 6.11E-02 6 5.40 90.2 10.3 1.40E+01 5.08E+00 3.42E+00 4.40E-01 2.12E-01 3.47E-02 4.86E-01 2.12E-01 7 5.69 74 9.86 1.49E+01 4.54E+00 2.41E+00 4.92E-01 6.27E-02 5.76E-02 6.96E-01 2.67E-01 82 5.67 71.5 10.7 1.17E+01 1.53E+00 1.79E+00 3.08E-01 1.23E-01 1.86E-02 3.27E-01 5.39E-02
Total3 5.19 175 91.3 1.51E+01 1.80E+00 1.81E+01 1.78E+01 1.05E+00 1.01E+00 8.68E-01 4.64E-01
Reactor 7 0.94 %S
1 4.53 530 263 4.47E+01 4.65E+01 9.48E+01 1.02E+02 4.71E+00 5.09E+00 2.30E+00 2.54E+00 2 4.42 452 44.9 6.35E+01 9.26E+00 6.99E+01 1.71E+01 2.97E+00 8.53E-01 1.23E+00 4.71E-01 3 4.50 314 34 5.50E+01 3.55E+00 3.41E+01 7.00E+00 1.33E+00 2.91E-01 5.57E-01 1.46E-01 4 4.55 239 26.8 5.14E+01 3.33E+00 1.74E+01 4.49E+00 7.02E-01 1.49E-01 4.01E-01 6.49E-02 5 4.55 193 26.6 5.37E+01 6.88E+00 9.06E+00 3.64E+00 3.94E-01 1.53E-01 3.22E-01 5.28E-02 6 4.60 154 15.9 4.55E+01 5.36E+00 4.46E+00 1.65E+00 1.81E-01 4.90E-02 2.61E-01 1.81E-03 7 4.49 140 19.5 4.63E+01 2.80E+00 3.83E+00 7.23E-01 3.76E-02* 4.96E-04 7.48E-01 1.32E-01 82 4.69 125 5.67 3.38E+01 1.54E+00 1.99E+00 1.24E+00 1.23E-01 1.97E-02 4.00E-01 5.18E-02
Total3 4.47 268 85 4.92E+01 1.50E+01 2.94E+01 3.45E+01 1.31E+00 1.75E+00 7.77E-01 8.64E-01
Reactor 8(D)
0.31 %S
1 6.34 156 78.7 7.44E-02 8.29E-02 9.08E-01 1.97E+00 8.37E-02 1.16E-01 1.34E-01 1.76E-01 2 5.89 135 36.3 4.42E-02 2.45E-02 5.33E+00 1.28E+00 3.18E-01 9.47E-02 3.27E-01 2.20E-01 3 6.19 69 24.2 7.91E-02 2.00E-02 2.98E+00 1.44E+00 1.91E-01 9.35E-02 2.11E-01 7.71E-02 4 6.15 42.7 6.9 7.67E-02 5.04E-02 9.63E-01 5.72E-01 9.89E-02 2.12E-02 1.17E-01 5.59E-02 5 6.28 24.8 4.56 3.48E-02* 2.97E-05 4.37E-01 1.06E-01 3.76E-02* 3.20E-05 1.66E-01 4.93E-03 6 6.32 19.8 4.92 4.69E-02 2.20E-02 4.14E-01 6.46E-02 3.69E-02* 1.33E-04 1.71E-01 2.97E-02 7 6.23 15.1 5.55 7.12E-02 6.28E-02 4.12E-01 2.40E-01 3.73E-02* 3.79E-04 1.03E-01 9.59E-02 82 6.18 13.7 6.27 7.93E-02 2.99E-02 3.26E-01 1.40E-01 6.28E-02 3.12E-02 5.83E-02 4.28E-02
Total3 6.05 59.5 26.1 6.33E-02 2.68E-02 1.47E+00 7.36E-01 1.08E-01 4.87E-02 1.61E-01 7.43E-02 1 5th percentile value 2 Year 8 represented by weeks 365-400 3 Average and standard deviation for entire period of record
* Majority of concentrations during this time interval were below detection limit. One half of the detection limit was used to calculate the annual average release rate.
Note: Samples are from Babbitt prospect unless noted with (D), which indicates Dunka Road prospect.
45

Table 10. Page 3 of 5. Minimum pH and average annual rates of release for sulfate, copper, nickel, cobalt, and zinc in µmol*(kg rock*week)-1. Period of record is 6 – 400 weeks for reactors and humidity cells. During the first year, 8-11 concentrations were sampled for each parameter. Sampling frequency for subsequent years decreased to approximately 3-5 per year.
ID Year min pH1
Sulfate Copper Nickel Cobalt Zinc
rate s.d. rate s.d. rate s.d. rate s.d. rate s.d.
Humidity cell 9
0.13 %S
1 6.92 32.9 6.46 7.52E-03* 9.01E-05 2.58E-02 1.01E-02 8.11E-03* 9.71E-05 7.31E-03* 8.75E-05 2 6.76 32 3.91 7.58E-03* 9.25E-05 7.85E-02 1.37E-02 8.17E-03* 9.98E-05 1.00E-02* 6.48E-03 3 6.54 27.1 2.82 8.95E-03* 4.00E-03 1.75E-01 3.60E-02 8.23E-03* 6.46E-05 9.31E-03 3.82E-03 4 6.47 22.1 2.12 1.84E-02 1.44E-02 2.16E-01 2.15E-02 8.20E-03* 4.87E-05 7.39E-03* 4.39E-05 5 6.49 18.5 1.6 7.65E-03* 1.67E-04 1.47E-01 5.42E-02 8.25E-03* 1.80E-04 7.44E-03* 1.62E-04 6 6.44 14.6 1.07 1.73E-02 8.90E-03 2.09E-01 4.69E-02 8.23E-03* 9.80E-06 1.36E-02 5.66E-03 7 6.37 14.4 2.11 1.26E-02* 9.96E-03 1.85E-01 2.57E-02 8.21E-03* 6.10E-05 7.40E-03* 5.50E-05 82 6.30 13.2 0.935 9.75E-03* 4.23E-03 1.52E-01 9.61E-03 8.24E-03* 2.19E-05 7.42E-03* 1.97E-05
Total3 6.44 21.8 1.82 1.12E-02 5.35E-03 1.49E-01 1.70E-02 8.21E-03 5.37E-05 8.74E-03 2.81E-03
Humidity cell 10
0.21 %S
1 6.92 67.6 12.9 7.61E-03 8.41E-05 6.77E-02 5.39E-02 8.20E-03* 9.07E-05 7.39E-03* 8.17E-05 2 6.61 50.3 5.73 1.32E-02 6.20E-03 3.22E-01 4.86E-02 8.29E-03* 7.15E-05 2.11E-02 2.16E-02 3 6.39 43.2 5.95 5.39E-02 2.39E-02 7.44E-01 2.46E-01 3.37E-02 1.21E-02 1.93E-02 9.65E-03 4 6.27 33.6 4.15 9.05E-02 6.08E-03 9.76E-01 9.96E-02 4.75E-02 6.10E-03 1.82E-02 7.66E-03 5 6.27 27.8 2.11 1.10E-01 1.55E-02 8.67E-01 1.59E-01 4.43E-02 5.15E-03 1.57E-02 1.17E-02 6 6.19 21.6 1.16 1.42E-01 2.76E-02 7.00E-01 2.63E-02 4.03E-02 7.15E-04 2.45E-02 5.94E-03 7 6.12 19.8 3.13 1.67E-01 3.34E-02 6.58E-01 6.61E-02 3.52E-02 4.14E-03 1.15E-02* 9.41E-03 82 6.16 20.3 2.66 1.39E-01 9.40E-03 5.57E-01 6.40E-02 3.30E-02 3.20E-03 9.69E-03* 4.46E-03
Total3 6.18 35.5 3.7 9.03E-02 1.19E-02 6.12E-01 7.31E-02 3.13E-02 4.03E-03 1.59E-02 6.31E-03
Humidity cell 11
0.33 %S
1 7.00 50.9 8.86 1.10E-02 5.44E-03 4.61E-02 1.93E-02 8.16E-03* 5.03E-05 7.35E-03* 4.54E-05 2 6.44 52.7 2.66 2.91E-02 1.21E-02 4.77E-01 2.35E-01 1.47E-02 1.07E-02 7.44E-03* 1.13E-04 3 5.99 54.7 7.03 2.04E-01 1.38E-01 2.30E+00 1.01E+00 1.10E-01 5.92E-02 5.47E-02 3.35E-02 4 5.69 48.4 3.66 6.04E-01 1.53E-01 3.38E+00 3.95E-01 2.05E-01 3.58E-02 1.06E-01 1.96E-02 5 5.57 46.3 4.98 1.14E+00 2.47E-01 3.43E+00 5.60E-01 2.43E-01 2.15E-02 1.35E-01 1.45E-03 6 5.45 37 3.09 1.69E+00 3.00E-01 3.04E+00 1.90E-01 2.09E-01 8.58E-03 1.37E-01 9.64E-03 7 5.28 34.9 5.53 1.93E+00 3.29E-01 2.71E+00 4.43E-01 1.78E-01 1.85E-02 1.41E-01 3.46E-02 82 4.88 35 4.22 2.44E+00 1.14E-01 2.46E+00 1.06E-01 1.54E-01 2.01E-02 1.01E-01 1.01E-02
Total3 5.31 45 2.1 1.01E+00 1.22E-01 2.23E+00 3.16E-01 1.40E-01 1.84E-02 8.61E-02 1.42E-02
Humidity cell 12
0.55 %S
1 7.06 71.8 9.31 1.12E-02 5.74E-03 1.23E-01 4.22E-02 8.09E-03* 6.76E-05 7.29E-03* 6.09E-05 2 6.54 68.8 8.25 1.04E-01 6.15E-02 8.44E-01 3.29E-01 4.10E-02 1.48E-02 2.17E-02 2.21E-02 3 6.27 68.5 7.99 4.01E-01 1.29E-01 2.98E+00 1.03E+00 1.46E-01 5.56E-02 8.32E-02 3.52E-02 4 6.02 63.8 3.56 9.62E-01 2.14E-01 5.10E+00 7.61E-01 2.85E-01 5.15E-02 1.77E-01 2.42E-02 5 5.87 59.1 7.33 1.55E+00 2.59E-01 5.27E+00 6.79E-01 3.24E-01 2.25E-02 2.18E-01 6.85E-03 6 5.76 50.3 3.84 1.76E+00 9.26E-02 4.51E+00 3.66E-01 2.55E-01 1.29E-02 1.73E-01 9.90E-03 7 5.67 47.1 5.15 1.82E+00 2.22E-01 3.98E+00 3.97E-01 2.15E-01 1.75E-02 1.64E-01 2.75E-02 82 5.47 43.4 3.73 1.97E+00 1.03E-01 3.26E+00 1.73E-01 1.78E-01 1.22E-02 1.23E-01 1.93E-02
Total3 5.70 59.1 2.33 1.07E+00 8.80E-02 3.26E+00 3.27E-01 1.81E-01 1.97E-02 1.21E-01 1.17E-02 1 5th percentile value 2 Year 8 represented by weeks 365-400 3 Average and standard deviation for entire period of record
* Majority of concentrations during this time interval were below detection limit. One half of the detection limit was used to calculate the annual average release rate.
Note: Samples are from Babbitt prospect unless noted with (D), which indicates Dunka Road prospect.
46

Table 10. Page 4 of 5. Minimum pH and average annual rates of release for sulfate, copper, nickel, cobalt, and zinc in µmol*(kg rock*week)-1. Period of record is 6 – 400 weeks for reactors and humidity cells. During the first year, 8-11 concentrations were sampled for each parameter. Sampling frequency for subsequent years decreased to approximately 3-5 per year.
ID Year min pH1
Sulfate Copper Nickel Cobalt Zinc
rate s.d. rate s.d. rate s.d. rate s.d. rate s.d.
Humidity cell 13
0.55 %S
1 6.92 72 12.2 1.15E-02 6.16E-03 9.47E-02 2.58E-02 8.28E-03* 2.77E-05 8.78E-03* 3.22E-03 2 6.64 61.6 5.9 3.88E-02 1.78E-02 6.11E-01 3.24E-01 2.38E-02 1.44E-02 2.28E-02 1.04E-02 3 6.34 62.6 10.9 2.07E-01 1.04E-01 2.84E+00 1.04E+00 1.31E-01 5.54E-02 6.37E-02 3.02E-02 4 6.04 57.3 4.83 6.22E-01 1.39E-01 4.72E+00 7.88E-01 2.63E-01 5.43E-02 1.63E-01 3.22E-02 5 5.90 57.1 5.69 1.37E+00 1.41E-01 5.03E+00 1.16E+00 3.07E-01 5.08E-02 2.08E-01 7.60E-03 6 5.85 44.7 3.7 1.63E+00 1.49E-01 4.02E+00 2.29E-01 2.38E-01 4.04E-03 1.60E-01 1.61E-02 7 5.62 40.9 6.22 1.71E+00 3.31E-01 3.42E+00 4.31E-01 1.91E-01 1.55E-02 1.41E-01 4.79E-02 82 5.66 40.2 3.6 1.83E+00 2.49E-02 2.99E+00 1.21E-01 1.67E-01 9.58E-03 1.02E-01 3.52E-03
Total3 5.75 54.5 3.2 9.27E-01 1.06E-01 2.96E+00 4.29E-01 1.66E-01 2.38E-02 1.09E-01 1.62E-02
Humidity cell 14
0.72 %S
1 6.69 103 12.7 2.20E-02 1.92E-02 3.31E-01 3.32E-01 1.26E-02* 1.09E-02 7.37E-03* 4.59E-05 2 6.11 113 6.33 3.54E-01 1.13E-01 4.69E+00 1.33E+00 1.90E-01 6.03E-02 6.89E-02 2.36E-02 3 5.90 103 11.2 7.69E-01 1.26E-01 7.38E+00 6.86E-01 3.34E-01 3.46E-02 1.32E-01 2.80E-02 4 5.67 89.9 7.36 1.34E+00 2.69E-01 7.56E+00 7.45E-01 3.78E-01 5.27E-02 1.72E-01 3.22E-02 5 5.61 87.7 7.4 2.01E+00 2.34E-01 8.44E+00 2.23E-01 4.45E-01 2.16E-03 2.13E-01 2.54E-02 6 5.55 70.7 3.82 2.50E+00 1.23E-01 7.02E+00 6.35E-01 3.76E-01 6.81E-03 1.79E-01 2.31E-02 7 5.37 66.9 9.24 2.93E+00 5.16E-01 6.48E+00 9.06E-01 3.47E-01 4.11E-02 1.81E-01 5.38E-02 82 5.23 66.9 5.08 3.57E+00 2.61E-01 6.21E+00 3.33E-01 3.36E-01 1.97E-02 1.58E-01 3.95E-03
Total3 5.43 87.7 3.01 1.69E+00 1.51E-01 6.01E+00 3.63E-01 3.02E-01 2.19E-02 1.39E-01 1.67E-02
Humidity cell 15
1.03 %S
1 4.95 175 24.1 2.29E+00 1.75E+00 2.62E+01 1.79E+01 1.26E+00 8.98E-01 3.89E-01 2.94E-01 2 4.50 136 16.2 3.97E+00 4.84E-01 2.57E+01 3.74E+00 1.08E+00 1.79E-01 4.09E-01 5.40E-02 3 4.40 165 20.6 5.47E+00 5.46E-01 1.88E+01 2.42E+00 8.06E-01 8.76E-02 3.23E-01 5.24E-02 4 4.16 180 15.1 1.03E+01 3.44E+00 1.64E+01 1.52E+00 7.58E-01 6.86E-02 2.94E-01 2.64E-02 5 4.17 185 15.4 1.33E+01 1.83E-02 2.44E+01 7.72E+00 7.95E-01 4.08E-02 2.82E-01 1.67E-02 6 4.18 157 8.63 1.67E+01 5.22E-01 1.58E+01 1.33E+00 6.92E-01 7.60E-02 2.06E-01 9.47E-03 7 4.09 161 31.1 2.42E+01 8.61E+00 1.60E+01 2.52E+00 8.45E-01 1.33E-01 3.57E-01 1.43E-01 82 4.07 148 12.2 2.03E+01 5.73E-01 1.29E+01 9.33E-01 6.03E-01 5.14E-02 1.98E-01 2.79E-02
Total3 4.17 164 7.12 1.21E+01 2.89E+00 1.95E+01 5.72E+00 8.55E-01 2.89E-01 3.07E-01 9.70E-02
Humidity cell 16
1.36 %S
1 4.91 242 24.1 6.23E+00 5.61E+00 3.07E+01 2.38E+01 1.93E+00 1.84E+00 7.96E-01 7.94E-01 2 4.61 189 10.4 1.29E+01 1.27E+00 3.92E+01 4.95E+00 1.68E+00 2.55E-01 7.89E-01 1.32E-01 3 4.46 188 15.6 1.50E+01 6.11E-01 2.93E+01 4.16E+00 1.26E+00 1.80E-01 6.57E-01 2.90E-01 4 4.34 174 6.3 1.78E+01 2.24E+00 2.28E+01 9.95E-01 9.57E-01 4.80E-02 4.18E-01 2.12E-02 5 4.28 177 10.1 2.19E+01 2.85E-01 2.17E+01 2.89E+00 8.20E-01 1.61E-01 3.77E-01 4.47E-02 6 4.31 154 6.71 2.79E+01 1.11E+00 1.73E+01 2.02E+00 6.52E-01 8.07E-02 2.89E-01 2.06E-02 7 4.19 173 41.8 4.16E+01 1.70E+01 1.66E+01 4.31E+00 7.23E-01 1.80E-01 4.08E-01 1.66E-01 82 4.13 144 12.5 2.65E+01 3.29E+00 1.25E+01 1.31E+00 5.43E-01 6.08E-02 2.35E-01 2.57E-02
Total3 4.28 180 11.7 2.12E+01 5.57E+00 2.38E+01 7.51E+00 1.07E+00 6.05E-01 4.96E-01 2.63E-01 1 5th percentile value 2 Year 8 represented by weeks 365-400 3 Average and standard deviation for entire period of record
* Majority of concentrations during this time interval were below detection limit. One half of the detection limit was used to calculate the annual average release rate.
Note: Samples are from Babbitt prospect unless noted with (D), which indicates Dunka Road prospect.
47

Table 10. Page 5 of 5. Minimum pH and average annual rates of release for sulfate, copper, nickel, cobalt, and zinc in µmol*(kg rock*week)-1. Period of record is 6 – 400 weeks for reactors and humidity cells. During the first year, 8-11 concentrations were sampled for each parameter. Sampling frequency for subsequent years decreased to approximately 3-5 per year.
ID Year min pH1
Sulfate Copper Nickel Cobalt Zinc
rate s.d. rate s.d. rate s.d. rate s.d. rate s.d.
Humidity cell 17(D) 0.23 %S
1 7.19 32 12.6 7.51E-03* 1.00E-04 8.13E-03* 1.08E-04 8.10E-03* 1.08E-04 7.30E-03* 9.73E-05
2 6.97 13.2 1.64 7.58E-03* 6.20E-05 8.21E-03* 6.71E-05 8.17E-03* 6.68E-05 7.37E-03* 6.02E-05
3 6.84 10.7 1.26 9.49E-03 3.68E-03 1.39E-02 1.28E-02 8.21E-03* 6.88E-05 1.37E-02 9.51E-03
4 6.64 8.5 0.472 1.23E-02 5.69E-03 2.53E-02 1.25E-02 8.15E-03* 1.44E-04 7.35E-03* 1.29E-04
5 6.60 8.75 0.612 2.97E-02 3.10E-02 8.33E-03 1.45E-04 8.30E-03* 1.44E-04 7.48E-03* 1.30E-04
6 6.47 7.27 0.703 1.67E-02 7.89E-03 3.09E-02 1.37E-02 8.20E-03* 9.45E-05 1.09E-02* 6.10E-03
7 6.35 7.76 1.47 1.12E-02* 8.69E-03 1.39E-02 8.90E-03 8.20E-03* 8.70E-05 7.39E-03* 8.65E-05
82 6.30 7.07 0.35 7.68E-03* 4.81E-05 1.77E-02 8.26E-03 8.28E-03* 5.18E-05 7.46E-03* 4.67E-05
Total3 6.40 11.9 4.14 1.28E-02 1.03E-02 1.58E-02 6.05E-03 8.20E-03 3.45E-05 8.62E-03 3.69E-03
Humidity cell 18(D) 0.31 %S
1 7.07 62.4 9.32 9.64E-03* 5.05E-03 1.61E-02 9.31E-03 8.20E-03* 1.08E-04 1.06E-02 7.86E-03
2 6.44 52.2 4.83 7.57E-03* 3.68E-05 2.64E-01 1.53E-01 1.03E-02* 5.16E-03 1.49E-02 1.22E-02
3 6.28 49 6.33 1.51E-02 5.78E-03 1.02E+00 2.36E-01 4.23E-02 9.03E-03 1.08E-02 5.66E-03
4 6.10 40.1 5.09 1.51E-02 1.30E-02 1.26E+00 8.75E-02 5.81E-02 3.13E-03 1.19E-02 7.86E-03
5 6.09 36 3.74 2.41E-02 1.04E-02 1.13E+00 2.41E-01 5.85E-02 6.74E-03 7.43E-03* 3.24E-05
6 6.00 28.3 1.64 4.10E-02 2.95E-02 9.22E-01 7.65E-02 5.63E-02 3.89E-03 1.37E-02 6.08E-03
7 5.83 30.5 10.7 1.20E-01 5.75E-02 1.13E+00 4.47E-01 7.64E-02 3.25E-02 1.25E-02* 1.24E-02
82 5.53 27.6 3.98 7.32E-02 1.14E-03 7.89E-01 8.60E-02 5.43E-02 4.91E-03 7.39E-03* 2.34E-05
Total3 5.85 40.8 3 3.82E-02 1.94E-02 8.17E-01 1.39E-01 4.55E-02 1.02E-02 1.12E-02 4.71E-03
Humidity cell 19(D) 0.61 %S
1 7.00 92.6 12 7.56E-03* 1.14E-04 6.00E-02 2.22E-02 8.15E-03* 1.23E-04 7.35E-03* 1.11E-04 2 6.43 109 7.56 1.22E-02 7.69E-03 9.45E-01 7.43E-01 4.40E-02 3.66E-02 1.21E-02 8.32E-03 3 6.14 105 11.7 5.82E-02 2.17E-02 3.75E+00 6.85E-01 2.22E-01 5.27E-02 3.24E-02 2.02E-02 4 5.83 87.7 6.6 1.64E-01 4.83E-02 4.47E+00 4.73E-01 3.44E-01 5.66E-02 7.58E-02 1.24E-02 5 5.64 78.1 11.1 3.15E-01 6.00E-02 4.70E+00 9.69E-02 3.85E-01 1.93E-02 1.03E-01 2.75E-02 6 5.36 65.9 6.21 7.24E-01 3.67E-01 4.60E+00 5.58E-01 4.01E-01 6.62E-02 1.60E-01 4.86E-02 7 5.06 71.9 8.44 1.05E+00 1.43E-01 4.87E+00 7.04E-01 4.35E-01 5.27E-02 1.94E-01 4.95E-02 82 4.96 68.9 6.32 1.03E+00 7.66E-02 4.25E+00 4.42E-01 3.94E-01 3.43E-02 1.29E-01 9.64E-03
Total3 5.09 84.8 2.48 4.20E-01 1.21E-01 3.46E+00 2.73E-01 2.79E-01 2.19E-02 8.92E-02 1.86E-02 1 5th percentile value 2 Year 8 represented by weeks 365-400 3 Average and standard deviation for entire period of record
* Majority of concentrations during this time interval were below detection limit. One half of the detection limit was used to calculate the annual average release rate.
Note: Samples are from Babbitt prospect unless noted with (D), which indicates Dunka Road prospect.
48

Table 11. Total mass release, sulfur and heavy metal depletion for Duluth Complex waste rock reactors and humidity cells for weeks 0-400.
ID, %S Total mass release after 400 weeks, mmol/kg rock Percent remaining
after 400 weeks
SO4 Ca Mg Na K Cu Ni Co Zn S Cu Ni Co Zn 75 g reactors
1, 0.07 12 11 11.8 4.64 4.31 0.0185 0.106 0.0147 0.035 45.2% 99.7% 98.5% 98.9% 97.7% 2, 0.11 19.7 13.3 15.6 5.24 5.36 0.0555 0.404 0.0294 0.0756 42.7% 99.5% 93.9% 97.5% 95.1% 3, 0.20 31.5 15.2 10.7 7.01 6.95 2.82 2.07 0.144 0.173 49.4% 82.1% 71.0% 88.0% 89.5% 4, 0.31 39.1 16.9 25.2 6.42 6.11 1.09 3.24 0.191 0.182 59.5% 96.2% 69.6% 86.1% 89.1% 5, 0.31 35.5 16.3 23.6 6.85 6.51 0.671 2.93 0.179 0.178 63.3% 97.7% 72.5% 87.0% 89.3% 6, 0.63 73.7 18.9 33.8 9.72 8.84 6.20 7.4 0.426 0.347 62.5% 85.4% 49.9% 73.6% 81.4% 7, 0.94 111 25.4 14 14 7.84 19.9 12.5 0.556 0.323 62.2% 76.0% 30.6% 65.9% 82.6%
8(D), 0.31 24.7 14.1 17.5 3.96 3.22 0.0261 0.641 0.0466 0.0712 87.0% 99.5% 87.2% 95.6% 94.0% 1000 g humidity cells
9, 0.13 9.1 5.43 7 1.28 1.99 0.00426 0.0581 0.00329 0.00341 77.6% 100.0% 99.2% 99.7% 99.8% 10, 0.21 14.7 7.44 8.63 1.74 2.27 0.0345 0.245 0.0124 0.00661 77.5% 99.8% 96.6% 98.9% 99.6% 11, 0.33 18.6 8.09 8.5 2.64 3.14 0.382 0.895 0.0564 0.0344 82.0% 98.5% 88.5% 95.2% 97.9% 12, 0.55 24.5 10.2 13.3 2.22 2.71 0.412 1.3 0.0726 0.049 87.9% 99.1% 87.5% 94.5% 96.9% 13, 0.55 22.5 9.56 12.3 2.02 2.52 0.361 1.19 0.0666 0.0441 88.9% 99.2% 88.6% 95.0% 97.2% 14, 0.72 36.1 10.5 20.8 2.81 3.04 0.65 2.4 0.12 0.0557 83.9% 98.9% 85.7% 93.0% 97.2% 15, 1.03 66.9 17.2 20.4 9.34 2.89 4.65 7.89 0.344 0.123 79.2% 93.6% 57.7% 79.3% 92.6% 16, 1.36 74 20 19.2 9.4 3.36 8.31 9.73 0.436 0.201 82.6% 91.9% 54.3% 74.6% 88.9%
17(D), 0.23 5.01 5.98 3.98 1.44 1.21 0.00516 0.00626 0.0033 0.00341 93.0% 100.0% 99.9% 99.7% 99.7% 18(D), 0.31 16.6 9.65 7.81 2.13 1.45 0.0143 0.324 0.0179 0.00447 91.3% 99.8% 95.2% 98.5% 99.6% 19(D), 0.61 34.4 21.1 11.2 4.42 1.45 0.151 1.35 0.108 0.0337 64.4% 98.7% 84.5% 92.3% 97.6% Note: Samples are from Babbitt prospect unless noted with (D), which indicates Dunka Road prospect.
49

Table 12. Annual linear regression slopes ((µmol/kg*wk)/%S) and R2 values for reactors and humidity cells Year SO4 Ca Mg Na K Cu Ni Co Zn
slope R2 slope R2 slope R2 slope R2 slope R2 slope R2 slope R2 slope R2 slope R2
Rea
ctor
s
1 454 0.883 94.4 0.433 170 0.710 29.2 0.576 22.9 0.103 44.1 0.663 106 0.905 5.26 0.915 2.51 0.920 2 442 0.985 53.7 0.970 178 0.883 46.9 0.856 28.9 0.688 63.0 0.729 85.3 0.938 3.91 0.822 1.67 0.514 3 338 0.973 39.8 0.870 121 0.809 33.5 0.858 14.7 0.569 60.7 0.858 41.2 0.944 1.70 0.825 0.670 0.372 4 257 0.969 28.7 0.899 86.8 0.785 25.9 0.796 13.7 0.372 58.2 0.880 20.6 0.945 0.850 0.899 0.391 0.484 5 215 0.950 18.2 0.762 81.2 0.758 14.5 0.880 0.710 0.008 60.8 0.868 11.6 0.894 0.518 0.790 0.287 0.318 6 169 0.946 15.5 0.509 46.5 0.575 12.8 0.808 2.07 0.214 49.4 0.831 5.33 0.930 0.213 0.769 0.222 0.298 7 152 0.939 9.32 0.296 45.3 0.461 23.7 0.890 1.27 0.069 50.7 0.841 4.34 0.942 0.00986 0.076 0.815 0.750 8 139 0.940 14.0 0.557 44.6 0.515 26.2 0.812 1.13 0.131 37.4 0.857 2.36 0.902 0.111 0.463 0.387 0.808
Hum
idity
Cel
ls
1 163 0.933 59.6 0.790 33.1 0.538 7.03 0.391 11.4 0.721 4.34 0.715 26.5 0.749 1.52 0.760 0.580 0.744 2 132 0.926 24.6 0.205 31.7 0.618 17.8 0.803 4.60 0.486 8.74 0.704 31.6 0.813 1.34 0.812 0.586 0.783 3 143 0.941 27.5 0.431 38.2 0.753 22.8 0.808 2.22 0.172 10.5 0.739 23.4 0.899 1.01 0.916 0.482 0.844 4 145 0.917 26.3 0.628 35.8 0.731 21.9 0.777 1.41 0.108 13.7 0.801 18.7 0.952 0.809 0.976 0.337 0.922 5 151 0.919 24.9 0.707 29.0 0.648 19.7 0.811 0.530 0.022 17.1 0.816 20.9 0.875 0.749 0.946 0.313 0.857 6 132 0.924 21.0 0.714 28.7 0.711 17.1 0.858 1.10 0.128 21.7 0.816 15.5 0.945 0.616 0.909 0.229 0.833 7 144 0.928 23.8 0.696 30.5 0.782 20.7 0.859 1.25 0.151 32.1 0.802 15.1 0.930 0.709 0.875 0.355 0.934 8 123 0.914 21.5 0.716 26.6 0.713 17.4 0.846 1.41 0.196 22.1 0.829 11.8 0.926 0.528 0.870 0.203 0.888
* Note that Mg release from reactor 7 was omitted due to low values that resulted in poor correlation with sulfur. Mg slopes and R2 values when including reactor 7 ranged from 0.27-62.2 and 0.0004-0.273, respectively.
Considerably lower cobalt slope and R2 values for reactors in year 7 due to drainage quality reaching detection limit values
50

Table 13. Factor analysis of heavy metal release from Babbitt and Dunka Road prospect samples.
%S (B, D) min pHB
min pHD
MSO4B/MSO4D Cu Ni Co Zn
Fine (0.31, 0.31%) 6.07 6.05 1.58 MB/MD 41.76 5.05 4.10 2.56 CB/CD 5.49 2.14 1.29 1.42 (MSO4B/MSO4D)(CB/CD) 8.69 3.38 2.04 2.24 Coarse (0.21, 0.23%) 6.18 6.4 2.93 MB/MD 6.69 39.14 3.76 1.94 CB/CD 1.31 0.89 0.96 1.30 (MSO4B/MSO4D)(CB/CD) 3.85 2.62 2.81 3.81 Coarse (0.33, 0.31%) 5.31 5.85 1.12 MB/MD 26.71 2.76 3.15 7.70 CB/CD 3.28 1.14 1.00 1.36 (MSO4B/MSO4D)(CB/CD) 3.68 1.28 1.12 1.52 Coarse (0.55, 0.61%) 5.7 5.09 0.68 MB/MD 2.56 0.92 0.64 1.38 CB/CD 3.68 1.19 0.94 1.14 (MSO4B/MSO4D)(CB/CD) 2.52 0.81 0.64 0.78 B, D indicate Babbitt prospect and Dunka Road prospect, respectively MB/MD Ratio of Babbitt prospect to Dunka Road prospect mass release after 400 weeks CB/CD Ratio of Babbitt prospect to Dunka Road prospect solid-phase chemical content min pH 5th percentile pH value for 400-week period of record Note: Highlighted values are those which still have a high ratio of metal release when compared to the ratio of sulfate release multiplied by the ratio of chemical content
51

Table 14. Factor analysis of major cation release from Babbitt and Dunka Road prospect samples.
%S (B, D) min pHB
min pHD
MSO4B/MSO4D Ca Mg Na K
Fine (0.31, 0.31%) 6.07 6.05 1.58 MB/MD 1.20 1.44 1.62 1.90 CB/CD 0.77 1.27 0.88 1.68 (MSO4B/MSO4D)(CB/CD) 1.21 2.02 1.39 2.66 Coarse (0.21, 0.23%) 6.18 6.4 2.93 MB/MD 1.24 2.17 1.21 1.88 CB/CD 0.94 0.89 1.10 2.21 (MSO4B/MSO4D)(CB/CD) 2.75 2.61 3.24 6.50 Coarse (0.33, 0.31%) 5.31 5.85 1.12 MB/MD 0.84 1.09 1.24 2.17 CB/CD 0.85 1.02 0.99 1.71 (MSO4B/MSO4D)(CB/CD) 0.95 1.14 1.11 1.91 Coarse (0.55, 0.61%) 5.7 5.09 0.68 MB/MD 0.47 1.14 0.48 1.80 CB/CD 0.84 1.16 0.95 1.62 (MSO4B/MSO4D)(CB/CD) 0.57 0.79 0.65 1.10 B, D indicate Babbitt prospect and Dunka Road prospect, respectively MB/MD Ratio of Babbitt prospect to Dunka Road prospect mass release after 400 weeks CB/CD Ratio of Babbitt prospect to Dunka Road prospect solid-phase chemical content min pH 5th percentile pH value for 400-week period of record
52

Table 15. Annual average sulfate release rates (µmol/kg*wk) for Partridge River intrusion (PRI) and South Kawishiwi intrusion (SKI) samples Partridge River Intrusion reactors (75 grams, 0.053<d<0.149 mm)
ID # 1 2 3 4 5 8 (D) 6 7 %S 0.07 0.11 0.2 0.31 0.31 0.31 0.63 0.94 Yr 1 65.6 145 245 256 238 156 322 530 Yr 2 68.9 91.7 133 183 163 135 320 452 Yr 3 32.9 44.6 72.6 102 96.9 69 232 314 Yr 4 22.1 29.1 50 68.9 62.7 42.7 159 239 Yr 5 14 21.1 34.6 45.8 38.7 24.8 130 193 Yr 6 7.58 16.7 25.5 30.8 24.1 19.8 90.2 154 Yr 7 6.86 11.3 21 25.4 21.2 15.1 74 140 Yr 8 7.63 10.1 16.5 19.8 19.1 13.7 71.5 125
South Kawishiwi Intrusion reactors (75 grams, 0.053<d<0.149 mm) ID # 1,2 3,4 5,6 7,8 9,10 11,12 13,14 15,16 17,18 35,36 29,30 %S 0.18 0.22 0.4 0.41 0.51 0.54 0.57 0.58 0.71 1.12 1.16 Yr 1 56.5 64.8 277 39.2 107 219 230 199 161 624 279 Yr 2 117 103 250 159 215 274 194 149 188 468 213 Yr 3 81.7 75.5 147 90.6 119 174 151 166 127 384 165 Yr 4 48.3 48.9 93.5 52 77.7 140 95.9 260 101 553 316 Yr 5 42.6 39.4 86.2 49.2 100 159 117 353 153 873 607 Yr 6 50.1 45.9 124 88.7 372 393 301 349 373 1430 1810 Yr 7 25.3 38.9 95.9 89.2 391 365 340 255 654 412 659 Yr 8 20.8 19.7 73.2 NA1 312 216 262 211 469 NA1 182
1 Reactors terminated after year 7 Note: Samples are from Babbitt prospect unless noted with (D), which indicates Dunka Road prospect.
53

Table 16. Rates of metal release from the Dunka Mine samples, weeks 6-74.
Reactor %S Release rate, μmol kg-1 wk-1
Cu Ni Co Zn
1 0.18 0.254 0.551 0.431 0.565 2 0.18 0.366 0.713 0.315 0.426 3 0.22 0.255 0.513 0.314 0.460 4 0.22 0.294 0.438 0.317 0.465 5 0.40 0.295 4.118 0.717 0.790 6 0.40 0.371 3.699 0.481 1.191 7 0.41 0.377 3.792 0.569 0.732 8 0.41 0.371 4.897 0.520 0.793 9 0.51 0.905 2.980 0.610 1.466 10 0.51 1.041 9.501 1.042 1.373 11 0.54 0.292 2.216 0.591 0.959 12 0.54 0.336 1.173 0.443 0.617 13 0.57 0.904 6.188 0.663 1.301 14 0.57 0.821 5.574 0.603 1.124 15 0.58 1.677 12.225 2.130 2.318 16 0.58 1.553 12.409 2.193 2.623 17 0.71 2.176 10.943 1.551 1.685 18 0.71 2.845 10.002 1.634 1.903 35 1.12 1.511 60.638 9.694 3.939 36 1.12 2.231 53.380 8.419 3.577 29 1.16 3.692 17.226 1.642 1.295 30 1.16 4.328 16.942 1.675 1.258
54

Figure 1. Map of Duluth Complex mineral prospects.
55

Figure 2. Schematic and photo of small reactor.
72.5 mm
55 mm
195 mm
95 mm
56

Figure 3. Schematic and photo of humidity cell apparatus. All humidity cell materials are acrylic except the perforated plate (polyvinyl chloride) and the outlet pipe (high density polyethylene).
57

Figure 4. Drainage quality replicated well for duplicate 75-g sample of 0.31 %S Babbitt prospect rock. Weeks 0-5 were excluded to improve resolution.
Red = Reactor 4, Blue = Reactor 5
5
6
7
8
pH
0
10
20
30
[SO
4], m
g/L
0
2
4
6
[Ca]
,[Mg]
, m
g/L
0
2
4
[Na]
,[K],
mg/
L
0
1
2
[Cu]
,[Ni],
m
g/L
0
0.05
0.1
0 100 200 300 400[Co]
,[Zn]
, mg/
L
Weeks
♦ Ca × Mg
♦ Na × K
♦ Cu × Ni
♦ Co × Zn
58

Figure 5. Drainage quality replicated well for duplicate 1000-g sample of 0.55 %S Babbitt prospect rock. Weeks 0-5 were excluded to improve resolution.
Red = Humidity cell 12, Blue = Humidity cell 13
5
6
7
8
pH
0
10
20
30
[SO
4], m
g/L
0
5
10
[Ca]
,[Mg]
, m
g/L
0
0.5
1
1.5
[Na]
,[K],
mg/
L
0
0.5
1
[Cu]
,[Ni],
m
g/L
0
0.02
0.04
0.06
0 100 200 300 400[Co]
,[Zn]
, mg/
L
Weeks
♦ Ca × Mg
♦ Na × K
♦ Cu × Ni
♦ Co × Zn
59

Figure 6. Water retention after rinse vs. mass – 10 mesh rock
m b R2 Average +SD 0.223 39.2 0.720
Average 0.220 34.0 0.713 Average -SD 0.217 28.8 0.699
80
100
120
140
160
180
200 300 400 500 600
Ave.
wat
er re
tent
ion
afte
r rin
se, g
Mass -10 mesh, g
60

Figure 7. pH vs. time for reactors and humidity cells. Weeks 0-5 excluded to improve resolution and duplicates are averaged.
Reactors, 75 grams, 0.053<d<0.149 mm
Humidity cells, 1000 grams, d<6.35 mm
4
5
6
7
8
0 100 200 300 400
pH
Week
R1, 0.07%S
R2, 0.11%S
R3, 0.20%S
R8(D), 0.31%S
R4,5, 0.31%S
R6, 0.63%S
R7, 0.94%S
4
5
6
7
8
0 100 200 300 400
pH
Week
HC9, 0.13%S
HC10, 0.21%S
HC17(D), 0.23%S
HC11, 0.33%S
HC18(D), 0.31%S
HC12,13, 0.55%S
HC19(D), 0.61%S
HC14, 0.72%S
HC15, 1.03%S
HC16, 1.36%S
61

Figure 8. Sulfate release vs. time for reactors and humidity cells. Weeks 0-5 excluded to improve resolution and duplicates are averaged.
Reactors, 75 grams, 0.053<d<0.149 mm
Humidity cells, 1000 grams, d<6.35 mm
0
200
400
600
800
1000
1200
0 100 200 300 400
dSO
4/dt
(um
ol/k
g*w
k)
Week
R1, 0.07%S
R2, 0.11%S
R3, 0.20%S
R8(D), 0.31%S
R4,5, 0.31%S
R6, 0.63%S
R7, 0.94%S
0
50
100
150
200
250
300
350
0 100 200 300 400
dSO
4/dt
(um
ol/k
g*w
k)
Week
HC9, 0.13%S
HC10, 0.21%S
HC17(D), 0.23%S
HC11, 0.33%S
HC18(D), 0.31%S
HC12,13, 0.55%S
HC19(D), 0.61%S
HC14, 0.72%S
HC15, 1.03%S
HC16, 1.36%S
62

Figure 9. Specific conductivity vs. time for reactors and humidity cells. Weeks 0-5 excluded to improve resolution and duplicates are averaged.
Reactors, 75 grams, 0.053<d<0.149 mm
Humidity cells, 1000 grams, d<6.35 mm
0
20
40
60
80
100
120
140
160
0 100 200 300 400
Spec
ific
Con
duct
ivity
(uS/
cm)
Week
R1, 0.07%S
R2, 0.11%S
R3, 0.20%S
R8(D), 0.31%S
R4,5, 0.31%S
R6, 0.63%S
R7, 0.94%S
0
20
40
60
80
100
120
140
160
0 100 200 300 400
Spec
ific
Con
duct
ivity
(uS/
cm)
Week
HC9, 0.13%S
HC10, 0.21%S
HC17(D), 0.23%S
HC11, 0.33%S
HC18(D), 0.31%S
HC12,13, 0.55%S
HC19(D), 0.61%S
HC14, 0.72%S
HC15, 1.03%S
HC16, 1.36%S
63

Figure 10. Calcium release vs. time for reactors and humidity cells. Weeks 0-5 excluded to improve resolution and duplicates are averaged.
Reactors, 75 grams, 0.053<d<0.149 mm
Humidity cells, 1000 grams, d<6.35 mm
0
50
100
150
200
250
300
350
0 100 200 300 400
dCa/
dt (u
mol
/kg*
wk)
Week
R1, 0.07%S
R2, 0.11%S
R3, 0.20%S
R8(D), 0.31%S
R4,5, 0.31%S
R6, 0.63%S
R7, 0.94%S
0
50
100
150
200
250
0 100 200 300 400
dCa/
dt (u
mol
/kg*
wk)
Week
HC9, 0.13%S
HC10, 0.21%S
HC17(D), 0.23%S
HC11, 0.33%S
HC18(D), 0.31%S
HC12,13, 0.55%S
HC19(D), 0.61%S
HC14, 0.72%S
HC15, 1.03%S
HC16, 1.36%S
64

Figure 11. Magnesium release vs. time for reactors and humidity cells. Weeks 0-5 excluded to improve resolution and duplicates are averaged.
Reactors, 75 grams, 0.053<d<0.149 mm
Humidity cells, 1000 grams, d<6.35 mm
0
100
200
300
400
0 100 200 300 400
dMg/
dt (u
mol
/kg*
wk)
Week
R1, 0.07%S
R2, 0.11%S
R3, 0.20%S
R8(D), 0.31%S
R4,5, 0.31%S
R6, 0.63%S
R7, 0.94%S
0
20
40
60
80
100
120
0 100 200 300 400
dMg/
dt (u
mol
/kg*
wk)
Week
HC9, 0.13%S
HC10, 0.21%S
HC17(D), 0.23%S
HC11, 0.33%S
HC18(D), 0.31%S
HC12,13, 0.55%S
HC19(D), 0.61%S
HC14, 0.72%S
HC15, 1.03%S
HC16, 1.36%S
65

Figure 12. Sodium release vs. time for reactors and humidity cells. Weeks 0-5 excluded to improve resolution and duplicates are averaged.
Reactors, 75 grams, 0.053<d<0.149 mm
Humidity cells, 1000 grams, d<6.35 mm
0
20
40
60
80
100
0 100 200 300 400
dNa/
dt (u
mol
/kg*
wk)
Week
R1, 0.07%S
R2, 0.11%S
R3, 0.20%S
R8(D), 0.31%S
R4,5, 0.31%S
R6, 0.63%S
R7, 0.94%S
0
20
40
60
80
0 100 200 300 400
dNa/
dt (u
mol
/kg*
wk)
Week
HC9, 0.13%S
HC10, 0.21%S
HC17(D), 0.23%S
HC11, 0.33%S
HC18(D), 0.31%S
HC12,13, 0.55%S
HC19(D), 0.61%S
HC14, 0.72%S
HC15, 1.03%S
HC16, 1.36%S
66

Figure 13. Potassium release vs. time for reactors and humidity cells. Weeks 0-5 excluded to improve resolution and duplicates are averaged.
Reactors, 75 grams, 0.053<d<0.149 mm
Humidity cells, 1000 grams, d<6.35 mm
0
50
100
150
200
250
0 100 200 300 400
dK/d
t (um
ol/k
g*w
k)
Week
R1, 0.07%S
R2, 0.11%S
R3, 0.20%S
R8(D), 0.31%S
R4,5, 0.31%S
R6, 0.63%S
R7, 0.94%S
0
5
10
15
20
25
30
0 100 200 300 400
dK/d
t (um
ol/k
g*w
k)
Week
HC9, 0.13%S
HC10, 0.21%S
HC17(D), 0.23%S
HC11, 0.33%S
HC18(D), 0.31%S
HC12,13, 0.55%S
HC19(D), 0.61%S
HC14, 0.72%S
HC15, 1.03%S
HC16, 1.36%S
67
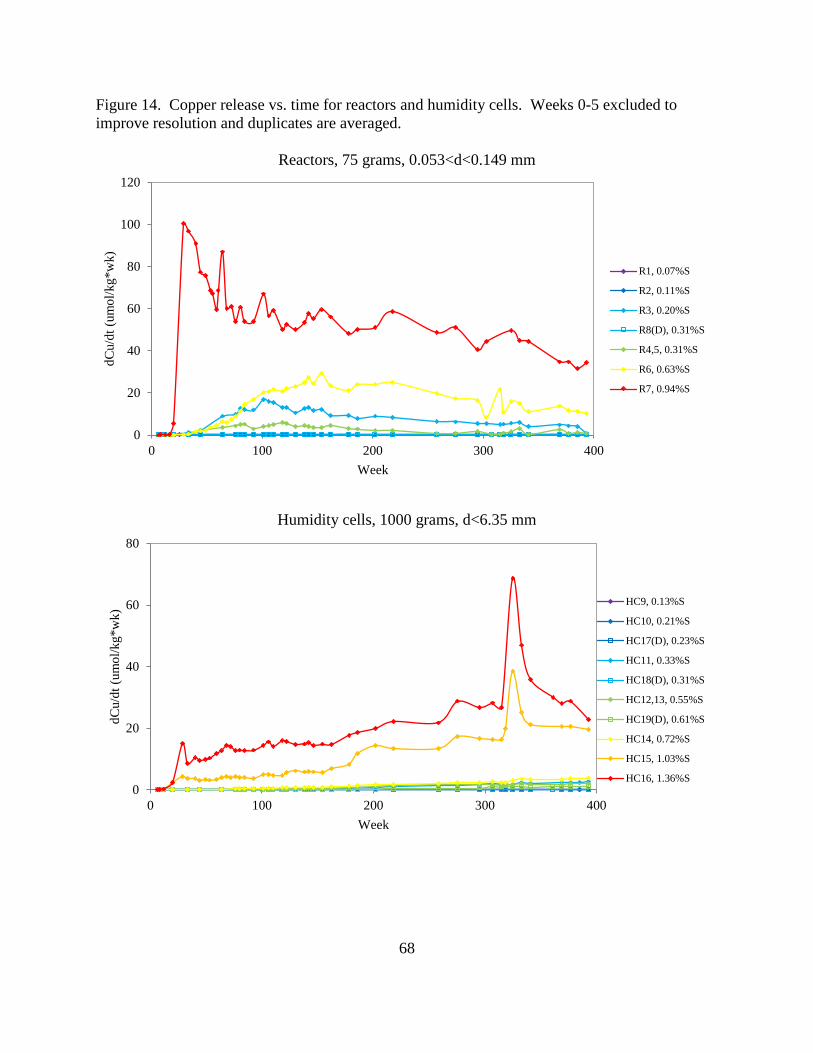
Figure 14. Copper release vs. time for reactors and humidity cells. Weeks 0-5 excluded to improve resolution and duplicates are averaged.
Reactors, 75 grams, 0.053<d<0.149 mm
Humidity cells, 1000 grams, d<6.35 mm
0
20
40
60
80
100
120
0 100 200 300 400
dCu/
dt (u
mol
/kg*
wk)
Week
R1, 0.07%S
R2, 0.11%S
R3, 0.20%S
R8(D), 0.31%S
R4,5, 0.31%S
R6, 0.63%S
R7, 0.94%S
0
20
40
60
80
0 100 200 300 400
dCu/
dt (u
mol
/kg*
wk)
Week
HC9, 0.13%S
HC10, 0.21%S
HC17(D), 0.23%S
HC11, 0.33%S
HC18(D), 0.31%S
HC12,13, 0.55%S
HC19(D), 0.61%S
HC14, 0.72%S
HC15, 1.03%S
HC16, 1.36%S
68

Figure 15. Nickel release vs. time for reactors and humidity cells. Weeks 0-5 excluded to improve resolution and duplicates are averaged.
Reactors, 75 grams, 0.053<d<0.149 mm
Humidity cells, 1000 grams, d<6.35 mm
0
50
100
150
200
250
300
350
0 100 200 300 400
dNi/d
t (um
ol/k
g*w
k)
Week
R1, 0.07%S
R2, 0.11%S
R3, 0.20%S
R8(D), 0.31%S
R4,5, 0.31%S
R6, 0.63%S
R7, 0.94%S
0
10
20
30
40
50
60
0 100 200 300 400
dNi/d
t (um
ol/k
g*w
k)
Week
HC9, 0.13%S
HC10, 0.21%S
HC17(D), 0.23%S
HC11, 0.33%S
HC18(D), 0.31%S
HC12,13, 0.55%S
HC19(D), 0.61%S
HC14, 0.72%S
HC15, 1.03%S
HC16, 1.36%S
69

Figure 16. Cobalt release vs. time for reactors and humidity cells. Weeks 0-5 excluded to improve resolution and duplicates are averaged.
Reactors, 75 grams, 0.053<d<0.149 mm
Humidity cells, 1000 grams, d<6.35 mm
0
5
10
15
20
0 100 200 300 400
dCo/
dt (u
mol
/kg*
wk)
Week
R1, 0.07%S
R2, 0.11%S
R3, 0.20%S
R8(D), 0.31%S
R4,5, 0.31%S
R6, 0.63%S
R7, 0.94%S
0
1
2
3
4
5
6
0 100 200 300 400
dCo/
dt (u
mol
/kg*
wk)
Week
HC9, 0.13%S
HC10, 0.21%S
HC17(D), 0.23%S
HC11, 0.33%S
HC18(D), 0.31%S
HC12,13, 0.55%S
HC19(D), 0.61%S
HC14, 0.72%S
HC15, 1.03%S
HC16, 1.36%S
70

Figure 17. Zinc release vs. time for reactors and humidity cells. Weeks 0-5 excluded to improve resolution and duplicates are averaged.
Reactors, 75 grams, 0.053<d<0.149 mm
Humidity cells, 1000 grams, d<6.35 mm
0
2
4
6
8
0 100 200 300 400
dZn/
dt (u
mol
/kg*
wk)
Week
R1, 0.07%S
R2, 0.11%S
R3, 0.20%S
R8(D), 0.31%S
R4,5, 0.31%S
R6, 0.63%S
R7, 0.94%S
0
1
2
3
0 100 200 300 400
dZn/
dt (u
mol
/kg*
wk)
Week
HC9, 0.13%S
HC10, 0.21%S
HC17(D), 0.23%S
HC11, 0.33%S
HC18(D), 0.31%S
HC12,13, 0.55%S
HC19(D), 0.61%S
HC14, 0.72%S
HC15, 1.03%S
HC16, 1.36%S
71

Figure 18. Minimum pH vs. %S for reactors (-100/+270 mesh) and humidity cells (-1/4 inch) for weeks 6-400.
Figure 19. Average sulfate release vs. %S for reactors (-100/+270 mesh) and humidity cells (-1/4 inch) for weeks 6-400.
0.053<d<0.149 mmy = -2.09x + 6.35
R² = 0.947
d<6.35 mmy = -1.79x + 6.30
R² = 0.775
3.0
4.0
5.0
6.0
7.0
0 0.2 0.4 0.6 0.8 1 1.2 1.4 1.6
Min
imum
pH
(5th
per
cent
ile)
Percent Sulfur
Reactors, 0.053<d<0.149 mm Humidity Cells, d<6.35 mm
0.053<d<0.149 mmy = 270.2x + 5.75
R² = 0.969
d<6.35 mmy = 143.3x - 6.13
R² = 0.946
0
100
200
300
0 0.2 0.4 0.6 0.8 1 1.2 1.4 1.6
dSO
4/dt
(µm
ol/k
g*w
k)
Percent Sulfur
72

Figure 20. Annual average sulfate release (µmol/kg*wk) vs. %S for Partridge River intrusion samples. Annual rates are shown for Years 2 and 4.
Blue = reactors (0.053<d<0.149), Green = humidity cells (d<6.35 mm)
Figure 21. Annual average sulfate release per gram of sulfur vs. time. Average R2 values for the reactors and humidity cells were 0.948 and 0.925 respectively. Solid line = reactors, dashed line = humidity cells.
0.053<d<0.149 mmy = 442x + 34.0
R² = 0.985d<6.35 mm
y = 132x + 7.53R² = 0.926
0100200300400500
Year 2 (weeks 53-104)
0.053<d<0.149 mmy = 257x - 8.14
R² = 0.969d<6.35 mm
y = 145x - 6.33R² = 0.917
0
100
200
300
0 0.2 0.4 0.6 0.8 1 1.2 1.4 1.6%S
Year 4 (weeks 157-208)
0
10
20
30
40
50
1 2 3 4 5 6 7 8
Ann
ual a
ve su
lfate
rele
ase
(µm
ol/w
k*g
Sulfu
r)
Year
73

Figure 22. Annual average calcium and magnesium release per gram of sulfur vs. time. Average R2 values for the reactors and humidity cells were 0.662 and 0.611 for Ca and 0.687 and 0.687 for Mg, respectively. Solid line = reactors, dashed line = humidity cells.
Figure 23. Annual average sodium and potassium release per gram of sulfur vs. time. Average R2 values for the reactors and humidity cells were 0.810 and 0.769 for Na and 0.269 and 0.248 for K, respectively. Solid line = reactors, dashed line = humidity cells.
0
5
10
15
20
1 2 3 4 5 6 7 8
Ann
ual a
ve C
a, M
g re
leas
e(µ
mol
/wk*
g Su
lfur)
Year
Ca
Mg
0
1
2
3
4
5
1 2 3 4 5 6 7 8
Ann
ual a
ve N
a, K
rele
ase
(µm
ol/w
k*g
Sulfu
r)
Year
Na
K
74

Figure 24. Annual average copper and nickel release per gram of sulfur vs. time. Average R2 values for the reactors and humidity cells were 0.816 and 0.778 for Cu and 0.925 and 0.886 for Ni, respectively. Solid line = reactors, dashed line = humidity cells.
Figure 25. Annual average cobalt and zinc release per gram of sulfur vs. time. Average R2 values for the reactors and humidity cells were 0.695 and 0.883 for Co and 0.558 and 0.851 for Zn, respectively. Solid line = reactors, dashed line = humidity cells.
0
2
4
6
8
10
12
1 2 3 4 5 6 7 8
Ann
ual a
ve C
u, N
i rel
ease
(µm
ol/w
k*g
Sulfu
r)
Year
Cu
Ni
0
0.1
0.2
0.3
0.4
0.5
0.6
1 2 3 4 5 6 7 8
Ann
ual a
ve C
o, Z
n re
leas
e(µ
mol
/wk*
g Su
lfur)
Year
Co
Zn
75

Figure 26. Average nickel and cobalt release vs. %S for reactors (-100/+270 mesh) and humidity cells (-1/4 inch) for weeks 6-104.
0.053<d<0.149 mmy = 94.2x - 11.9
R² = 0.949 d<6.35 mmy = 29.3x - 9.49
R² = 0.808
0
20
40
60
80
100
0 0.2 0.4 0.6 0.8 1 1.2 1.4 1.6
dNi/d
t (µm
ol/k
g*w
k)
%S
Reactors, 0.053<d<0.149 mm Humidity cells, d<6.35 mm
0.053<d<0.149 mmy = 4.50x - 0.440
R² = 0.940
d<6.35 mmy = 1.43x - 0.466
R² = 0.8040
1
2
3
4
0 0.2 0.4 0.6 0.8 1 1.2 1.4 1.6
dCo/
dt (µ
mol
/kg*
wk)
%S
76

Figure 27. Drainage quality from 75-g samples of 0.31 %S Babbitt Prospect and Dunka Road rocks. Weeks 0-5 were excluded to improve resolution.
Red = Babbitt prospect, Blue = Dunka Road prospect
5
6
7
8
pH
0
10
20
30
[SO
4], m
g/L
0
2
4
6
[Ca]
,[Mg]
, m
g/L
0
2
4
[Na]
,[K],
mg/
L
0
1
2
[Cu]
,[Ni],
m
g/L
0
0.05
0.1
0 100 200 300 400
[Co]
,[Zn]
, mg/
L
Weeks
♦ Ca × Mg
♦ Na × K
♦ Cu × Ni
♦ Co × Zn
77
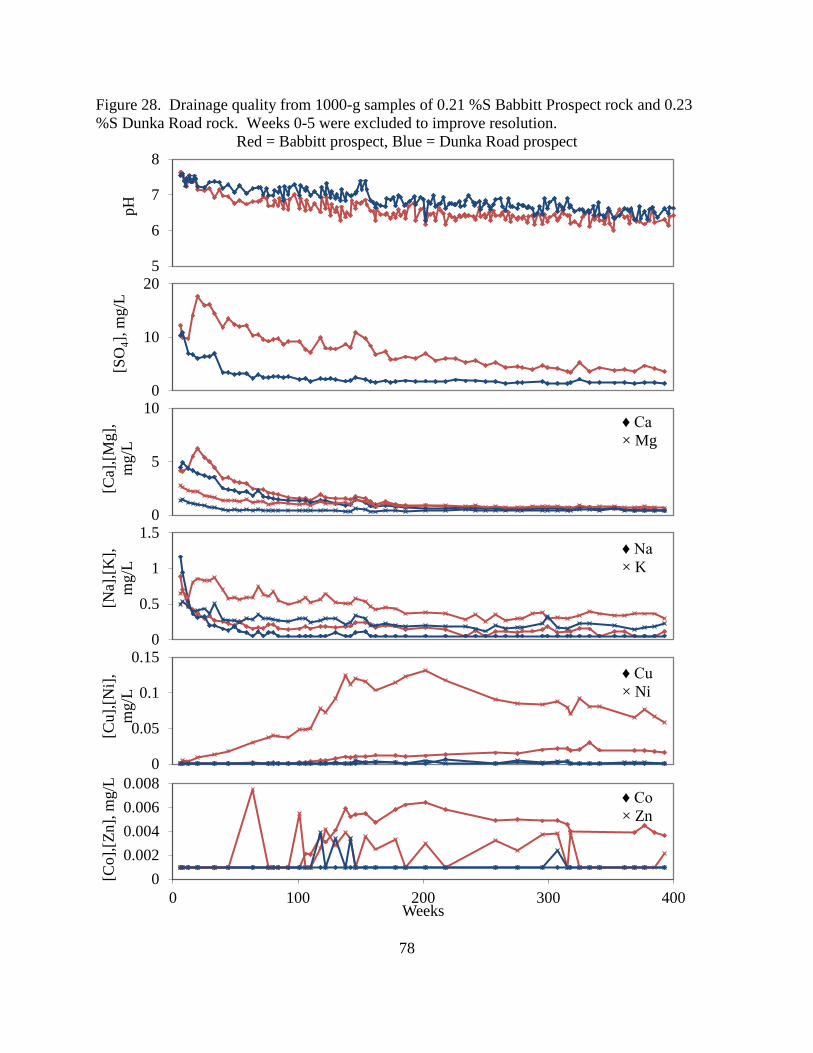
Figure 28. Drainage quality from 1000-g samples of 0.21 %S Babbitt Prospect rock and 0.23 %S Dunka Road rock. Weeks 0-5 were excluded to improve resolution.
Red = Babbitt prospect, Blue = Dunka Road prospect
5
6
7
8
pH
0
10
20
[SO
4], m
g/L
0
5
10
[Ca]
,[Mg]
, m
g/L
0
0.5
1
1.5
[Na]
,[K],
mg/
L
0
0.05
0.1
0.15
[Cu]
,[Ni],
m
g/L
00.0020.0040.0060.008
0 100 200 300 400
[Co]
,[Zn]
, mg/
L
Weeks
♦ Ca × Mg
♦ Na × K
♦ Cu × Ni
♦ Co × Zn
78

Figure 29. Drainage quality from 1000-g samples of Babbitt prospect (0.33 %S) and Dunka Road rock (0.31 %S). Weeks 0-5 were excluded to improve resolution.
Red = Babbitt prospect, Blue = Dunka Road prospect
4
6
8
pH
0
10
20
[SO
4], m
g/L
0
5
10
[Ca]
,[Mg]
, m
g/L
0
1
2
3
[Na]
,[K],
mg/
L
0
0.2
0.4
0.6
[Cu]
,[Ni],
m
g/L
00.010.020.030.04
0 100 200 300 400
[Co]
,[Zn]
, mg/
L
Weeks
♦ Ca × Mg
♦ Na × K
♦ Cu × Ni
♦ Co × Zn
79

Figure 30. Drainage quality from the 1000-g sample of 0.55 %S Babbitt Prospect and 0.61 %S Dunka Road rock. Weeks 0-5 were excluded to improve resolution.
Red = Babbitt prospect, Blue = Dunka Road prospect
4
6
8
pH
0
10
20
30
[SO
4], m
g/L
0
5
10
15
[Ca]
,[Mg]
, m
g/L
0
2
4
[Na]
,[K],
mg/
L
0
0.5
1
[Cu]
,[Ni],
m
g/L
00.020.040.060.08
0 100 200 300 400
[Co]
,[Zn]
, mg/
L
Weeks
♦ Ca × Mg
♦ Na × K
♦ Cu × Ni
♦ Co × Zn
80

Figure 31. Drainage pH and sulfate, calcium, and magnesium release (µmol/kg*wk) vs. time from the 75-g sample of 0.20 %S Babbitt Prospect waste rock and unsaturated sample of 0.20 %S Duluth Complex tailings rock. Weeks 0-5 were excluded to improve resolution.
5
6
7
8
pH
DC tails, 0.2%S DCWR, 0.2%S
0
250
500
dSO
4/dt
0
250
500
dCa/
dt
0
100
200
0 100 200 300 400
dMg/
dt
Weeks
81

Figure 32. Heavy metal release (µmol/kg*wk) vs. time from the 75-g sample of 0.20 %S Babbitt Prospect waste rock and unsaturated sample of 0.20 %S Duluth Complex tailings rock. Weeks 0-5 were excluded to improve resolution. Note logarithmic scale on y-axis.
0.01
0.1
1
10
100
dCu/
dt
DC tails, 0.2%S DCWR, 0.2%S
0.01
0.1
1
10
100
dNi/d
t
0.01
0.1
1
10
dCo/
dt
0.01
0.1
1
10
0 100 200 300 400
dZn/
dt
Weeks
82

Figure 33. Copper content vs. % sulfur for Partridge River (PRI) and South Kawishawi (SKI) intrusion samples. Blue = PRI, Red = SKI.
Figure 34. Nickel content vs. % sulfur for Partridge River (PRI) and South Kawishawi (SKI) intrusion samples. Blue = PRI, Red = SKI.
0
2000
4000
6000
0 0.2 0.4 0.6 0.8 1 1.2 1.4
Cop
per c
ompo
sitio
n (p
pm)
% Sulfur
0
400
800
1200
0 0.2 0.4 0.6 0.8 1 1.2 1.4
Nic
kel c
ompo
sitio
n (p
pm)
% Sulfur
83

Figure 35. Zinc content vs. % sulfur for Partridge River (PRI) and South Kawishawi (SKI) intrusion samples. Blue = PRI, Red = SKI.
Figure 36. Cobalt content vs. % sulfur for Partridge River (PRI) and South Kawishawi (SKI) intrusion samples. Blue = PRI, Red = SKI.
0
100
200
300
400
0 0.2 0.4 0.6 0.8 1 1.2 1.4
Zinc
com
posi
tion
(ppm
)
% Sulfur
0
50
100
150
0 0.2 0.4 0.6 0.8 1 1.2 1.4
Cob
alt c
ompo
sitio
n (p
pm)
% Sulfur
84

Figure 37. Minimum pH vs. % sulfur for Partridge River (PRI) and South Kawishawi (SKI) intrusion samples through 400 weeks. Blue = PRI, Red = SKI
Figure 38. Week of minimum pH vs. %S for Partridge River (PRI) and South Kawishawi (SKI) intrusion samples. Blue = PRI, Red = SKI. Higher sulfur SKI samples typically took 250-350 weeks to reach minimum pH values.
PRIy = -2.17x + 6.56
R² = 0.923
SKIy = -2.91x + 6.24
R² = 0.672
2
3
4
5
6
7
0 0.2 0.4 0.6 0.8 1 1.2 1.4
Min
imum
pH
(5th
per
cent
ile)
%S
0
100
200
300
400
0 0.2 0.4 0.6 0.8 1 1.2 1.4
Min
imum
pH
wee
k
%S
85

Figure 39. Annual average sulfate release (µmol/kg*wk) vs. %S for Partridge River (PRI) intrusion and South Kawishiwi intrusion (SKI) samples. Annual rates are shown for Years 2 and 6. Blue = PRI, Red = SKI
Figure 40. Annual average sulfate release per gram of sulfur vs. time between Babbitt and Dunka Road prospect rock (PRI) and Dunka Mine rock (SKI).
PRIy = 442x + 34.0
R² = 0.985SKI
y = 212x + 88.3R² = 0.4538
0
250
500
0 0.2 0.4 0.6 0.8 1 1.2 1.4
Year 2 (weeks 53-104)
PRIy = 169x - 14.7
R² = 0.946
SKIy = 1740x - 526
R² = 0.889
0
1000
2000
0 0.2 0.4 0.6 0.8 1 1.2 1.4%S
Year 6 (weeks 261-312)
0
50
100
150
200
0 1 2 3 4 5 6 7 8 9
Ann
ual a
ve S
O4
rele
ase
(µm
ol/w
k*g
Sulfu
r)
Year
PRI
SKI
86
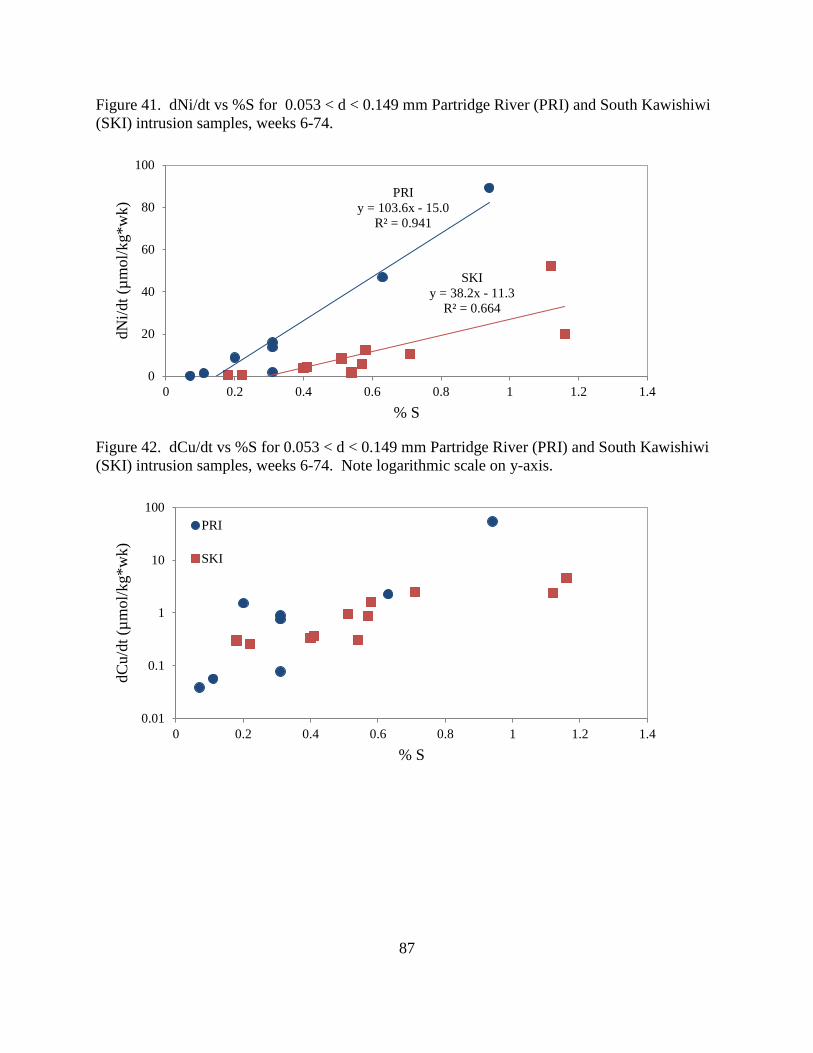
Figure 41. dNi/dt vs %S for 0.053 < d < 0.149 mm Partridge River (PRI) and South Kawishiwi (SKI) intrusion samples, weeks 6-74.
Figure 42. dCu/dt vs %S for 0.053 < d < 0.149 mm Partridge River (PRI) and South Kawishiwi (SKI) intrusion samples, weeks 6-74. Note logarithmic scale on y-axis.
PRIy = 103.6x - 15.0
R² = 0.941
SKIy = 38.2x - 11.3
R² = 0.664
0
20
40
60
80
100
0 0.2 0.4 0.6 0.8 1 1.2 1.4
dNi/d
t (µm
ol/k
g*w
k)
% S
0.01
0.1
1
10
100
0 0.2 0.4 0.6 0.8 1 1.2 1.4
dCu/
dt (µ
mol
/kg*
wk)
% S
PRI
SKI
87

Figure 43. dCo/dt vs %S for 0.053 < d < 0.149 mm Partridge River (PRI) and South Kawishiwi (SKI) intrusion samples, weeks 6-74.
Figure 44. dZn/dt vs %S for 0.053 < d < 0.149 mm Partridge River (PRI) and South Kawishiwi (SKI) intrusion samples, weeks 6-74.
PRIy = 5.04x - 0.62
R² = 0.941
SKIy = 5.10x - 1.4
R² = 0.511
0
2
4
6
8
10
0 0.2 0.4 0.6 0.8 1 1.2 1.4
dCo/
dt (µ
mol
/kg*
wk)
% S
PRIy = 2.35x - 0.14
R² = 0.913
SKIy = 2.05x + 0.19
R² = 0.512
0
1
2
3
4
0 0.2 0.4 0.6 0.8 1 1.2 1.4
dZn/
dt (µ
mol
/kg*
wk)
% S
88