Embed Size (px)
Citation preview

Acta Materialia 97 (2015) 392–403
Contents lists available at ScienceDirect
Acta Materialia
journal homepage: www.elsevier .com/locate /actamat
Dissolution and precipitation behaviour in steels microalloyedwith niobium during thermomechanical processing
http://dx.doi.org/10.1016/j.actamat.2015.06.0571359-6454/� 2015 Acta Materialia Inc. Published by Elsevier Ltd. All rights reserved.
⇑ Corresponding author.E-mail address: [email protected] (E.J. Palmiere).
P. Gong, E.J. Palmiere ⇑, W.M. RainforthDepartment of Materials Science and Engineering, The University of Sheffield, Sir Robert Hadfield Building, Mappin Street, Sheffield S1 3JD, UK
a r t i c l e i n f o
Article history:Received 8 June 2015Revised 24 June 2015Accepted 25 June 2015
Keywords:Microalloyed steelThermomechanical processingPrecipitate dissolution kineticsStrain-induced precipitationAustenite grain growth
a b s t r a c t
The thermomechanical processing of high strength low allow (HSLA) steels during low-temperatureroughing, followed by rapid reheating to higher temperatures was investigated to better understandthe Nb dissolution kinetics in austenite, and the subsequent precipitation behaviour during the final fin-ishing passes. For comparative purposes, two experimental 0.06 wt% C steels were studied, one contain-ing 0.03 wt% Nb (Nb steel), and the second containing both 0.03 wt% Nb and 0.02 wt% Ti (Nb–Ti steel).Processing of these steels consisted of a simulated roughing schedule, with the final roughing pass takingplace at 850 �C. The strain-induced precipitation intensity in the steels subsequently quenched wherecharacterised using transmission electron microscopy. Following this, the steels were rapidly reheatedat a rate of 10 �C/s to a temperature of 1200 �C, held at temperature for various times, and waterquenched to room temperature so that both the precipitate dissolution kinetics, together with theaustenite grain coarsening kinetics could be established.
� 2015 Acta Materialia Inc. Published by Elsevier Ltd. All rights reserved.
1. Introduction
Thermomechanical controlled processes (TMCP), consisting ofcontrolled hot rolling followed by controlled cooling, have beendeveloped to improve strength, toughness and weldability ofmicroalloyed steels [1,2]. The improvement in mechanical proper-ties from TMCP is due to the refinement of the austenitemicrostructure, maximising the austenite boundary area anddeformation band density, subsequently increasing the numberof nucleation sites prior to the development of the transformationmicrostructure. The enhanced mechanical properties of low-carbon microalloyed steels thereby arises from a combination ofthe refined ferrite grain size and the dispersion hardening throughthe precipitation in ferrite [3–7].
Microalloying elements in steels, such Nb, facilitate grainrefinement through precipitation of carbides/carbonitrides inaustenite thereby inhibiting the static recrystallisation of austen-ite, resulting in a fine final microstructure. In addition, titaniumhas frequently been added to HSLA steels to enhance the controlof the austenite and transformed ferrite grain sizes during boththe deformation and subsequent heat treatment process [8].Therefore, during TMCP, these microalloying elements can
precipitate as carbides or carbonitrides to increase the nucleationsites for obtaining a fine ferrite grain size [9,10].
The consequence of a low finishing temperature is high energyconsumption through high mill loads [11]. To improve the produc-tion efficiency and reduce energy consumption, a new rollingprocess is explored in this work, which involves the addition of areheating process between rough and finish rolling. The effect ofthis reheating on the deformed austenite, and particularly theprecipitate dissolution kinetics, is the focus of this study.
Much of the existing published work is concerned with the typeand distribution of precipitates based on single microalloy addi-tions with idealised solution treated and ageing experiments afterdeformation [9,11–15]. Less work has been directed towards theeffects of multiple microalloy additions during the thermomechan-ical processing. Therefore, in this work, two types of Nb and Nb–Tisteels were selected for comparative reasons. These two steelswere rough rolled at 850 �C, followed by the immediate reheatingto 1200 �C. This low roughing temperature of 850 �C was below therecrystallisation-stop temperature (T5%) for each steel. The state ofNb (Nb in solution or Nb(CN) as a precipitate) was analysed as afunction of hold time at this isothermal reheat temperature, toestablish the precipitate dissolution and austenite grain coarseningkinetics. Through a comparison of the two steels, the effect ofTi on the NbC precipitates and dissolution kinetics has been beclarified.

Fig. 1. Schematic representation of rough rolling and reheating process within theTMC machine, indicating the conditions where specimens were quenched to enablefor microstructural characterisation.
P. Gong et al. / Acta Materialia 97 (2015) 392–403 393
2. Experimental procedure
2.1. Compositions and processing conditions
The materials used in the research consisted of two laboratorycast microalloyed steels containing Nb (designated ‘‘Nb steel’’),and Nb and Ti (designated ‘‘Nb–Ti steel’’), which were made byvacuum induction melting and poured into ingots having dimen-sions 220 mm � 65 mm � 28 mm at ArcelorMittal. The composi-tions of these steels were analysed by Sheffield TestingLaboratories and are listed in Table 1. The ingots were soaked at1300 �C for 2 h and hot-rolled from 28 mm to 12 mm thick platesby two passes in a 2-high experimental 50 tonne Hille rolling millwith a finishing temperature of 1100 �C followed by an ice waterquench. Plane strain compression (PSC) specimens, having a geom-etry 60 mm long � 30 mm wide � 10 mm high, were machinedfrom the hot-rolled plate. PSC testing was performed using thethermomechanical compression (TMC) machine at The Universityof Sheffield [16]. Samples were reheated to 1100 �C, held for 30 sand then force-air cooled to the deformation temperature of850 �C. Deformation was undertaken in a single pass using a strainof 0.3 with a constant true strain rate of 10 s�1. Immediately fol-lowing this, the steels were rapidly reheated at a rate of 10 �C/sto a temperature of 1200 �C, held for various times at this temper-ature, and subsequently water quenched to room temperature, asshown in Fig. 1.
2.2. Grain size and microstructure
Longitudinal specimens were prepared for metallographicexamination using standard techniques. The polished specimenswere etched by picric acid at 60 �C to reveal the prior-austenitegrain boundaries. The average austenite grain size was measuredusing the linear intercept method (ASTM E-112) by opticalmicroscopy.
2.3. Micro-hardness testing
Micro-hardness testing was conducted using a Durascan 70micro-hardness tester on the polished Nb and Nb–Ti steels. AVickers diamond indenter tip was used with load of 1 N and a holdtime of 15 s for each micro-hardness tests. An array of micro-hardness tests were performed at distances of 0.5 mm with fortytest measurements on each sample.
2.4. Precipitates calculation
Transmission electron microscopy (TEM) was carried out toidentify the strain-induced precipitation. Carbon extraction replicaspecimens were prepared in the standard manner using a light 2%Nital etch. The extraction replica samples were examined in FEITecnai 20 and JEOL 2010F TEM to observe the precipitates details.The particle diameter distribution of precipitates was measuredwith quantitative image software Image J. In addition, the chemicalanalysis for the precipitates was conducted using an Oxford instru-ments energy dispersive X-ray spectroscopy (EDX) detector(Oxford Instruments, Oxford, UK) and electron energy loss spec-troscopy (EELS) analysis. The measurement of the sample thickness
Table 1Chemical composition of the laboratory steels (wt%).
C Si Mn Cr
Nb steel 0.067 0.11 0.77 0.01Nb–Ti steel 0.065 0.11 0.77 0.01
was carried out using EELS in Gatan GIF. This was estimated fromthe low energy region of the spectrum, given by Eq. (1) [17,18]:
t ¼ k ln It=I0ð Þ ð1Þ
where t represents the thickness of material; k is the mean free pathof specimen; It is the total number of electrons in the EEL spectrumand I0 is the number of electrons having lost no energy.
3. Results
3.1. Microstructures
Specimens were examined following rough rolling at 850 �C andreheating at 1200 �C for various holding times. Optical micro-graphs, Figs. 2 and 3, reveal different prior-austenite grain mor-phologies as a function of process conditions and composition. Asthe roughing temperature was below T5%, the deformed prior-austenite grains had been elongated and measured to be18.7 ± 1.6 lm in the Nb steel and 16.9 ± 0.7 lm in the Nb–Ti steel(Figs. 2(a) and 3(a)). The deformed and reheated opticalmicrostructures are presented in Figs. 2(b–f) and 3(b–f) for boththe Nb and Nb–Ti steels, respectively. Figs. 2(b) and 3(b) showthe samples reheated to 1200 �C followed by an immediatequench, which exhibited a fully recrystallised prior-austenite grainstructure with an average size of 73.1 ± 3.9 lm in the Nb steel and47.8 ± 3.6 lm in the Nb–Ti steel. When the steels were held for 10 sat 1200 �C, the recrystallised structure had coarsened slightly(Figs. 2(c) and 3(c)) with 86.4 ± 3.5 lm in the Nb steel and50 ± 5.5 lm in the Nb–Ti steel. The prior-austenite grain sizeincreased to 109.7 ± 2.9 lm at 20 s and 120.5 ± 3.9 lm at 40 s inthe Nb steel, and 64.5 ± 2.5 lm at 40 s in the Nb–Ti steel. Morecoarsening occurred with an increase in holding time from 100 sto 1000 s, while the measurement of the average prior-austenitegrain rapidly increased from 141.3 ± 5.3 lm to 260.7 ± 9.8 lm inthe Nb steel, and from 91.2 ± 4.7 lm to 112.4 ± 5.4 lm in theNb–Ti steel (Figs. 2(f), (g), and 3(e), (f)). Clearly the prior-austenitegrain size of Nb steel grew more rapidly during the reheatingprocess compared to the Nb–Ti steel.
Ni Nb Ti N P
0.02 0.03 <0.01 0.0058 0.0160.02 0.03 0.02 0.0062 0.016
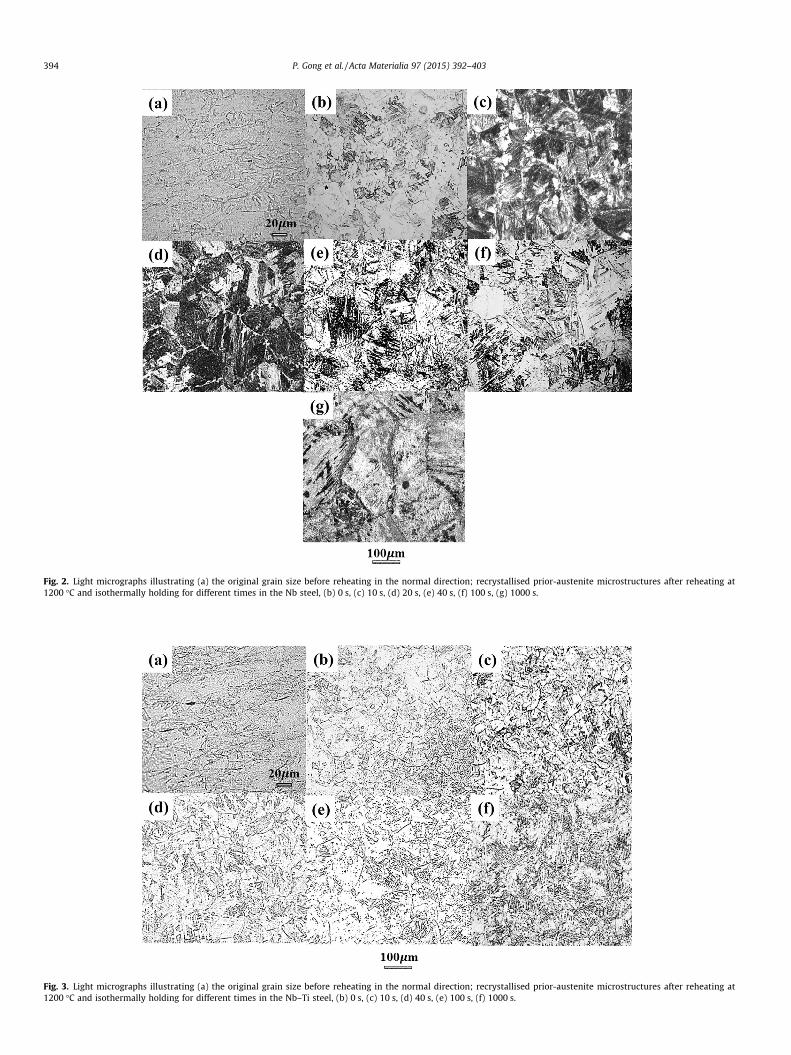
Fig. 2. Light micrographs illustrating (a) the original grain size before reheating in the normal direction; recrystallised prior-austenite microstructures after reheating at1200 �C and isothermally holding for different times in the Nb steel, (b) 0 s, (c) 10 s, (d) 20 s, (e) 40 s, (f) 100 s, (g) 1000 s.
Fig. 3. Light micrographs illustrating (a) the original grain size before reheating in the normal direction; recrystallised prior-austenite microstructures after reheating at1200 �C and isothermally holding for different times in the Nb–Ti steel, (b) 0 s, (c) 10 s, (d) 40 s, (e) 100 s, (f) 1000 s.
394 P. Gong et al. / Acta Materialia 97 (2015) 392–403

P. Gong et al. / Acta Materialia 97 (2015) 392–403 395
3.2. Transmission electron microscopy
Fig. 4 shows the morphologies of the strain-induced precipita-tion were observed by TEM after rough rolling at 850 �C for bothsteels. After deformation at 850 �C followed by an immediate tem-perature increase to 1200 �C for different durations, the precipitateparticle diameter, morphology, composition and number density ofprecipitates were observed as a function of isothermal holding byTEM, EDX and EELS, shown in Figs 5–8. For the Nb steel, the precip-itates continually dissolved into the matrix during the reheatingprocess (Fig. 5). The round-shaped precipitates shown in Fig. 5were confirmed by TEM, EDX and EELS analysis (Fig. 6) to beNbC with the size less than 10 nm and Nb(CN) with the size largerthan 10 nm. There were always particles with a size larger than10 nm at 100 s. In comparison to the precipitates in the Nb steel,the precipitates in the Nb–Ti steel changed to cubic-shaped, dueto the Ti concentration in those particles (Figs. 7 and 8). The precip-itates in the Nb–Ti steel continually coarsened with increasedisothermal holding time. From TEM, EDX and EELS analysis(Fig. 8), it was confirmed that the particles in Fig. 8(a) are (Ti,Nb)C with the size less than 10 nm and in Fig. 8(b) are (Ti, Nb)(C,N) with the size larger than 10 nm. The atomic ratio of Nb to Ticontained within these precipitates continually reduced with thehold time, as shown in Fig. 8(g). The composition of Nb and Ti inprecipitates changed from near equal ratio at 0 s to Ti-rich (Ti,Nb)(C, N) carbonitrides at 10 s, 100 s and 1000 s.
The precipitate diameter distribution for different holding timesare summarised in Figs. 5(f) and 7(f) for the Nb and Nb–Ti steels,respectively. In the Nb steel, the distribution of precipitates overthe entire range was unimodal, and the number density of precip-itates reduced with increasing holding time. The average diameterof the precipitates initially increased, followed by a continuousreduction to 16.4 nm after a 10 s hold (Fig. 5(f)). In the Nb–Ti steel,the precipitates were divided into two groups, i.e. precipitates withdiameters less than about 30 nm and those with a diameter greaterthan about 30 nm. It can be seen that the distribution of particleswith the diameter less than �30 nm is unimodal with the numberof precipitates decreasing with increasing holding times. Forprecipitate diameters greater than �30 nm, the peak value of thedistribution moves from 30 nm after 0 s and 10 s to 50 nm after40 s, up until 100 nm after holding to 100 s and 1000 s. The averagediameter of the particles increased over the entire period (Fig. 7(f)).To summarise, there appeared to be a difference in behaviour ofthe two steels. In the Nb–Ti steel, coarsening of the precipitateswas dominant. In contrast, in the Nb steel, after initial coarsening,
Fig. 4. TEM bright field images of strain-induced precipitates in the Nb steel and Nb–Ti(b) Nb–Ti steel.
dissolution of the precipitates occurred during isothermal heattreatment at 1200 �C.
The volume fraction of precipitates determined from TEMreplicas is shown in Table 2. It is clear that the volume fractionof precipitates decreases with the increasing isothermal holdingat 1200 �C. The amount of Nb in solution can be expressed byincorporating the experimentally measured volume fraction ofprecipitates using Eqs. (2) and (3) [19–21]:
f ðtÞ ¼qr=qprecipitate � ððZ þ 1Þ=ZÞ
100
� �� Wm � ½Nb�ð Þ ð2Þ
Z ¼ fNbg=fCg ð3Þ
where f(t) is volume fraction of precipitates coordinated with hold-ing times; qr and qprecipitate represent the densities of the austeniteand that of the precipitates, respectively; Wm is the total atomicweight of microalloy elements in each steel; [Nb] is Nb in solution;{Nb}and {C} are the Nb and C in precipitates as NbC at equilibrium.The data of Nb in solution has been shown in Table 2. For the Nbsteel, most of the Nb (0.029 (wt%)) has been dissolved into thematrix after holding for 100 s. However, the amount of Nb in solu-tion is only 0.0165 (wt%) at the same holding time for the Nb–Tisteel. From the data shown in Table 2, it can be inferred that thepresence of Ti increases the thermodynamic stability of theNb(CN), thus suppressing the dissolution kinetics.
3.3. Vickers micro-hardness
Fig. 9 shows that the Vickers micro-hardness increased with theincreasing holding time in both Nb and Nb–Ti steels. At 0 s, themicro-hardness was 209.5 ± 4.6 Hv in the Nb steel and196.9 ± 3.3 Hv in the Nb–Ti steel, which were similar to the roughrolling micro-hardness with 205.7 ± 2.6 Hv in the Nb steel and198.2 ± 3.6 Hv in the Nb–Ti steel. The micro-hardness increasedrapidly to 239.9 ± 3.9 Hv for 10 s in the Nb steel. However, themicro-hardness in the Nb–Ti steel increased only slightly to210.6 ± 3.3 Hv for the same holding time. After an initial rapid risein micro-hardness, the rate of increase slowed down for holdingtime of 100 s for both steels. For the Nb steel, the micro-hardnessslightly increased to 246.5 ± 8.3 Hv, and for Nb–Ti steel it was218.9 ± 9.0 Hv. Finally, after holding for 1000 s at 1200 �C, themicro-hardness increased to 251.8 ± 6.9 Hv in the Nb steel and233 ± 4.3 Hv in the Nb–Ti steel.
steel rough rolled at 850 �C followed by immediate water quenching, (a) Nb steel,

Fig. 5. TEM bright field images of NbC and Nb(C, N) precipitates in the Nb steel isothermally held at 1200 �C for various durations, (a) 0 s, (b) 10 s, (c) 20 s, (d) 40 s, (e) 100 s, (f)frequency distribution of the NbC and Nb(C, N) particle size observed in the specimens above.
396 P. Gong et al. / Acta Materialia 97 (2015) 392–403
4. Discussion
4.1. The effect of Zener pinning and solute drag factors on reheatedgrain size
Figs. 2 and 3 showed that the austenite grains continually coar-sen with increasing holding time at 1200 �C for the Nb and Nb–Tisteels. Moreover, the austenite grain growth rate during reheatingdepended on the composition of the steel, the heating temperatureand holding time. The grain growth rate in the Nb steel was muchquicker than that in the Nb–Ti steel, which can be explained by thefollowing analysis. The reheating temperature of 1200 �C for thisinvestigation was higher than the equilibrium dissolution temper-ature of niobium and carbon in the Nb steel, calculated using the
modified solubility product expression which Palmiere et al. [22]gave as:
log½Nb�½C� ¼ 2:06� 6700T
ð4Þ
However, for the Nb–Ti steel, the reheating temperature waslower than the dissolution temperature of titanium, carbon andnitrogen precipitates using previously published solubility prod-ucts for these precipitates [23–25]. With the presence of the morestable TiNb carbonitrides in the Nb–Ti steel, there is a much higherpinning force suppressing grain coarsening, compared to the Nbsteel, resulting in a slower growth rate in Nb–Ti during the entirereheating period.

Fig. 6. TEM bright field images of NbC precipitates in the Nb steel isothermally held at 1200 �C for various durations, (a) and (b) 0 s, (e) and (f) 10 s, (i) and (j)100 s, (c) EDXspectra from precipitate in (a); (d) EELS spectrum from precipitate in (b); (g) EDX spectra from precipitate in (e); (h) EELS spectrum from precipitate in (f); (k) EDX spectrafrom precipitate in (i); (l) EDX spectra from precipitate in (j).
P. Gong et al. / Acta Materialia 97 (2015) 392–403 397
To further analyse the grain growth mechanism combined withZener pinning and solute drag effect, there are several models toexplain that in different systems. The grain coarsening behaviour[26,27] of austenite during the isothermal holding period can beunderstood using the theory developed by Burke [28], Smith [29]and Beck [30]. Following from their theories, Feltham [31] devel-oped a more rigorous theory by using the grain diameters andgrain boundary curvatures. He further indicated that the variablegrain diameter to the time of isothermal growth can be calculatedby Eq. (5)
D�ð Þ2 � D�0� �2 ¼ ðkVarÞt expð�H=TKÞ ¼ K � t ð5Þ
where D�0 is the grain size at t = 0 s; is the grain diameter at a certaintime; k is the number constant of order unity; V is the volume peratom; a is lattice spacing; r is the specific grain-boundary energy;
H is Planck’s constant. Under isothermal conditions, Eq. (5) is equalto K � t and K is constant coefficient. Using Eq. (5) and the graindiameter data at the holding time of 0 s and 10 s, the constant of Kis 174.9 in the Nb steel and 23.4 in the Nb–Ti steel. The simulationof austenite grain diameters with the different values of K for theNb and Nb–Ti steels by Eq. (5) has been shown in Fig. 10. Using thisrelationship, the predicted austenite grain diameter in the Nb steelwas 94.7 lm at 20 s, 111.7 lm at 40 s and 151.5 lm at 100 s, as wellas 423 lm at 1000 s (Fig. 10(a)). In the Nb–Ti steel, they are 56.7 lmat 40 s, 95.5 lm at 100 s and 160.3 lm at 1000 s (Fig. 10(b)). Asshown in Fig. 10, the grain sizes predicted for the Nb and Nb–Tisteels by the Feltham theory gave a very satisfactory description ofthe experimentally data, but with the exception of the simulationdata at 1000 s for the Nb steel, where the prediction of grain sizewas about 5� larger than the experimentally measured value.

Fig. 7. TEM images of precipitates in the Nb–Ti steel isothermally held at 1200 �C for various durations, (a) 0 s, (b) 10 s, (c) 40 s, (d) 100 s, (e)1000 s, (f) frequency distributionof the particles size observed in the specimens holding from 0 to 1000 s.
398 P. Gong et al. / Acta Materialia 97 (2015) 392–403
Considering the interaction between second phase particles anda migrating grain boundary, Zener and Smith [29] proposed ananalytical model for the pinning effect of particles on grain growth.Based on this theory, grain growth can be stopped when the freeenergy to pull the boundary away from the particles equals the freeenergy from retarding boundary motion through the particles.Therefore, it is predicted that the ratio D/r should be proportionalto 1/f v, where D is the average grain diameter, r is the radius ofsecond phase and f v is the volume fraction of second phase.However, Zener’s theory failed to account for the pinning forcesproduced by the relative positions of particles with respect to theboundary. He also only accounted for the particle-boundary inter-actions during normal coarsening, thus omitting the interactiondynamics during abnormal grain coarsening. Therefore, the origi-nal model of Zener for the pinning effect of second-phase particleson grain boundaries was subsequently modified by Hellman and
Hillert [32], illustrating that the mean grain size with volume frac-tion and diameter of particles can be expressed by:
Dmax=Dp ¼ 4 Dmax=�D� �
� 1� ��
3f v ð6Þ
where Dmax is the largest limiting grain diameter; Dp is the meansecond phase particle diameter; the �D is the mean grain diameter;f v is the particle volume fraction. Hellman and Hillert also indicatedthat the ratio of Dmax=�D should be in the range of 1–2, when the lim-iting grain coarsening occurred. If Dmax > 2�D, the grains would growwithout being limited, called abnormal grain coarsening. Dependingon the experimental data from the present investigation, the abnor-mal grain growth was not observed in either the Nb or the Nb–Tisteels during the isothermal holding at 1200 �C until 1000 s.Considering the experimental data for a holding time of 0 s in thesesteels, the ratio of Dmax=�D is 1.5 for the Nb steel and 1.8 for the Nb–

Fig. 8. TEM images of the complex TiNb(CN) in the Nb–Ti steel isothermally held at 1200 �C followed by immediate water quenching, (a) A HRTEM image of a precipitate withsize less than 10 nm; (b) EDX spectra and (c) EELS spectrum of the precipitate in (a); (d) a TEM image of a precipitate with size larger than 10 nm; (e) EDX spectra and (f) EELSspectrum of the precipitate in (d); (g) the ratio of Ti and (Ti + Nb) by EDX method.
P. Gong et al. / Acta Materialia 97 (2015) 392–403 399
Ti steel. Then, accounting for the given data of precipitates volumefraction (f v) and the average diameter (DpÞ in Table 2, the limitingprior austenite grain size would be calculated by Eq. (6), shown in
Fig. 10. For the Nb steel, the predicted grain sizes are 65.8 lm at0 s, 95.9 lm at 10 s, 126.5 lm at 20 s, and 176.8 lm at 40 s, as wellas 770 lm at 100 s. The predicted grains sizes using Eq. (6)

Table 2Data from carbon extraction replicas results in the Nb and Nb–Ti steels showing the average diameter of precipitates, volume fraction of precipitates, as well as the amount of[Nb] (Nb in solution) under different holding times at 1200 �C.
Materials Reheating temperature (�C) Time (s) Diameter (nm) Volume fraction of precipitates (10�5 lm�3) [Nb] (wt%)
Nb steel 1200 0 20.0 ± 0.4 13.5 ± 1.6 0.018 ± 0.00110 21.8 ± 1.1 9.8 ± 1.4 0.021 ± 0.00120 20.4 ± 1.2 7.2 ± 0.7 0.024 ± 0.000640 19 ± 0.4 4.8 ± 0.5 0.026 ± 0.0004
100 16.4 ± 1.8 1.0 ± 0.6 0.029 ± 0.0006Nb–Ti steel 0 31 ± 0.8 60.4 ± 2.9 0.007 ± 0.001
10 32.4 ± 1.2 53.6 ± 1.7 0.012 ± 0.001240 34.2 ± 1.8 47.7 ± 3.1 0.015 ± 0.0028
100 39 ± 1.2 46.7 ± 4.3 0.0165 ± 0.0031000 46.8 ± 1.6 34.6 ± 3.2 0.025 ± 0.0023
Fig. 9. Average Vickers micro-hardness values for the Nb and Nb–Ti steels underdifferent isothermal holding times at 1200 �C.
400 P. Gong et al. / Acta Materialia 97 (2015) 392–403
corroborate well with the experimental data, except at 100 s. Thereason for this behaviour will be explained later by taking intoaccount solute drag. For the Nb–Ti steel, the average prior-austenitegrain sizes are 32.4 lm at 0 s, 38.2 lm at 10 s, 45.3 lm at 40 s,52.6 lm at 100 s and 85.4 lm at 1000 s. The predicted data ofprior-austenite grain size are lower than the experimental data overthe entire holding period, due to the data predicted using Eq. (6)over-estimating the pinning effect exerted on the boundaries by
Fig. 10. Measured and modelled values for average grain size in the Nb and Nb–Ti steexperimental data, (a) Nb steel; (b) Nb–Ti steel.
second phase particles. The reason for this is that the volume frac-tion of precipitates in the Nb–Ti steel includes a number of particleslarger than 30 nm, because of the larger the precipitates, the lessthe Zener pinning effect on grain boundaries.
Furthermore, as Hellman and Hillert’s theory only considers theeffect of the Zener pinning effect on boundaries, the predicted dataof the austenite grain diameter is larger than the experimental datawhen the holding time at 100 s for Nb steel. This is because for alonger isothermal holding time, most of the niobium, carbon andnitrogen rapidly dissolved into the matrix in the Nb steel, shownin Table 2. The Zener pinning effect by precipitates on a grainboundary becomes weak after holding for 100 s at 1200 �C.However, the actual data of grain diameter does not grow as largeas would be predicted. The result illustrates that solute drag repre-sents another force acting to retard the motion of grain boundaries.To study the effect of solute drag on the migration of a grainboundary, Fan et al. [33] developed the grain growth power lawfollowed as:
Rmt � Rm
0 ¼ kt ð7Þ
where R0 is the initial average grain size, Rt is the average grain sizeat time t, and k is the kinetic coefficient, m is the growth exponent.According to the Fan’s theory, if the lattice diffusion is much slowerthan grain boundary migration, m is close to 3, with the motion ofthe grain boundary controlled by lattice diffusion, regarded as anOstwald ripening process. For solute drag, m is between 2 and 3,which depends on the ratio of lattice diffusion and grain boundarymobility. In the current work, m is assumed to be 2.5 and the con-stant K is calculated by the average grain size at 0 s and 10 s and isequal to 1950.5. The predict data of grain boundary by Eq. (7) is
els as a function of isothermal holding time using Eqs. (5) and (6), compared with

Fig. 11. Measured and modelled average grain size values for the Nb steelconsidering the solute drag theory, compared with experimental data.
P. Gong et al. / Acta Materialia 97 (2015) 392–403 401
much better than Eq. (5), when compared with the experimentaldata.
Cahn and other researchers [34–37] also studied the effect ofsolute drag on migration of a grain boundary from different aspect.Cahn suggested that the grain boundary migration is affected bythe interaction of impurity atmosphere and predicted that, accord-ing to the migration velocity and driving force, the average grainsize at time t is equal to V�t, where V is velocity of a mobile grainboundary. The velocity of grain boundary can be expressed by
V ¼ Meff � Fmet ð8Þ
where the Meff is the grain boundary mobility and Fmet the drivingforce for grain boundary migration. It is now necessary to evaluatethe Meff and Fmet. Considering the effect of solute drag, Meff is calcu-lated by
1=Meff ¼ 1=M0 þ kCSð1=ð1þx2v2ÞÞ ð9Þ
where k is the constant, M0 is solute-free mobility and is expressedby
M0 ¼ aDIFeVmd=ðb2RTÞ ð10Þ
where a is mobility factor which varies between 0.1 and 0.7 forsteel, d is the grain boundary thickness, b is the burger vector, andDI
Fe is the diffusion coefficient of Fe, Vm is the molar volume, CS issolute atomic concentration and is given by
CS ¼ C0 � f pCp ð11Þ
where C0 is the content of Nb in steels, and Cp is the content of Nb inprecipitates. The Meff can be simplified by assuming that the drivingforce of grain boundary migration is low:
Meff ¼ M0ð1þM0kCSÞ�1 ð12Þ
The driving force for grain boundary migration depends on theinteraction between recrystallization and the Zener pinning
Fmet ¼ Fc � Pz ð13Þ
where Fc is recrystallisation driving force and is given by
Fc ¼ 0:5lqb2 ð14Þ
where l is Shear modulus, q is dislocation density, b is burger vec-tor. Pz is the Zener pinning force and can be shown to be
Pz ¼ uf pr�1p ð15Þ
where fp is the volume fraction of precipitates, rp is the radius ofprecipitates and u is constant and is given by
u ¼ ð1:5� 3Þ � ð1:3115� 0:0005TÞ ð16Þ
With all the equations from (8) to (16), the predicted averagegrain size is shown in Fig. 11.
From Fig. 11, the calculated average grain size taking intoaccount both particle pinning and solute drag effect provides a bet-ter fit to the experimental data than from that of Feltham andHellman and Hillert’s theories alone. From Fan’s theory, the aver-age grain size is slightly lower than the experimental data from20 s to 100 s. At 1000 s, the simulated average grain size is331.2 lm, which is a better fit to the experimental data than fromthat predicted by Feltham’s theory. In Cahn’s theory, the predictedaverage grain size is lower at the short holding times, and then itgradually approaches the experimental data with the increasingholding times. The comparison of solute drag and Zener pinningcan be made by comparing the predictions from Hellman andHillert’s and Cahn’s theories. Using Hellman and Hillert’s theory,without considering the solute drag effect, the simulated grain sizefor a 100 s hold was substantially overestimated at 770 lm
compared to the measured value of 141 lm in the Nb steel.When considering the Zener pinning and solute drag effects at100 s, the predicted grain size using Cahn’s theory was much lowerat 273 lm. This shows that the effect of solute drag on graingrowth could not be neglected for Nb steel at 100 s. In summary,for the Nb steel, the migration of grain boundaries was suppressedby both solute drag and Zener pining for times up to 100 s, but forlonger times solute drag was the main contribution, since the vol-ume fraction of precipitates available at the grain boundaries topromote Zener pinning was small. The solute drag effect is moresignificant for the Nb steel than it is for the Nb–Ti steel after hold-ing for a longer time, which is a result of most of the niobium andcarbon being dissolved into the austenite in the Nb steel after hold-ing for 100 s at 1200 �C (Table 2).
4.2. The dissolution behaviour of Ti and Nb during high temperaturereheating process
In order to predict the Ti and Nb dissolution kinetics [38], thevolume fraction of precipitates in the Nb and Nb–Ti steels was cal-culated using TEM measurements shown in Figs. 5 and 7. Then,with the experimental measurements for precipitate volume frac-tion, the amount of Nb in solution during isothermal heat treat-ment was calculated by Eq. (2) and the data presented in Table 2.These results indicate that, in the case of continuous isothermalholding at 1200 �C, precipitates in the Nb steel rapidly dissolvedinto the matrix with �97% of the total Nb in solution after 100 s.However, in the Nb–Ti steel, there was only �55% of the total Nbin solution after holding for 100 s at 1200 �C, showing that theaddition of Ti significantly retards the dissolution kinetics of Nb,as a result of increasing the thermodynamic stability of the com-plex TiNb(CN) [39].
The TEM observations of the precipitation behaviour, and sub-sequently inferred dissolution behaviour of precipitates in the Nbsteel and the Nb–Ti steel during isothermal reheating at 1200 �Ccan suggested to two key results: first, it was observed that the dis-solution kinetics of Nb was much more rapid in the Nb steel than inthe Nb–Ti steel. It is believed that the presence of Ti in precipitatesof Nb–Ti steel restricts the dissolution behaviour of Nb; second, theTi-rich precipitates are more stable during heat treatment at1200 �C, even when held for 1000 s. These Ti-rich precipitatesoccurred to Zener pinning of the grain boundaries, leading to alower coarsening rate in the Nb–Ti steel than in the Nb steel(Figs. 2 and 3).

Fig. 12. (a) Experimentally determined and modelled solution behaviour of Nb in austenite as a function of isothermal holding time at 1200 �C for the Nb and Nb–Ti steelsusing Eqs. (2) and (18); (b) experimentally measured average precipitate diameter for the Nb and Nb–Ti steels as a function of isothermal holding time at 1200 �C.
402 P. Gong et al. / Acta Materialia 97 (2015) 392–403
4.3. Modelling the Nb in solution in austenite during the reheatingprocess in the Nb and Nb–Ti steels
The modelling of the amount of Nb in solution during reheatingin both Nb and Nb–Ti steels can been simulated by using a modi-fied JMAK equation to estimate the volume fraction of precipitatethat formed as a function of time [40–42]. The form of the JMAKequation is given by
f ðtÞ ¼ 1� expð�ktnÞ ð17Þ
where f(t) is the volume fraction of precipitates; t is the isothermaltime; k is a factor related to the nucleation rate and growth rate;and n is factor of nucleation rate. From classical nucleation theory,the volume fraction of precipitates at the start time is zero.However, in the present study, at the start, there were a smallamount of undissolved precipitates in the Nb and Nb–Ti steels.Thus, the measurement of this initial volume fraction of precipitatesat the start has been added, and the modified JMAK equation isgiven by
f ðtÞ ¼ 1þ f 0 � expð�ktnÞ ð18Þ
where f 0 is the volume fraction of precipitates at the beginning ofthe isothermal heat treatment. In the present case, the amount ofNb contained in the matrix can be analysed by Eq. (2) using thevolume fraction of precipitates. Therefore, the modelling of Nb insolution as a function of holding time was simulated using theEqs. (2) and (18). The values of k and n in Eq. (18) were determinedby the experimental data of 10 s and 100 s.
The measurement of average diameter of precipitates in boththe Nb and Nb–Ti steels with different holding time is given inFig. 12 and compared with the calculations using Eqs. (2) and(18). Additional experimental data was included, namely a 20 sand 40 s hold at 1200 �C for the Nb steel and one at 40 s in theNb–Ti steel. It can be seen that the Nb solution model as a functionof holding time provides a reasonable prediction of the amount ofNb in the precipitates.
The simulation indicates that the Nb was fully dissolved into thematrix after 115 s in the Nb steel. However, at the same time, therewas only 0.017 (wt%) of Nb dissolved into matrix in the Nb–Ti steel.This is consistent with the observed dimensions of the precipitates.As shown in Fig. 12(b), the average diameter of the niobiumcarbonitrides in the Nb steel coarsens slightly for a 10 s hold andthen reduces after that point whereas in the Nb–Ti steel, coarseningwas observed for the entire reheating process.
4.4. Vickers micro-hardness
The Vickers micro-hardness results were given in Fig. 9, whichshowed a continuous increase in hardness with hold time. Thisincrease in hardness was despite the increase in grain size and areduction in volume fraction of precipitates, which would beexpected to decrease hardness [43]. This showed that the solidsolution of microalloyed elements in both steels (Table 2) providedmuch higher effect on hardness than the coarsening grains (Figs. 2and 3) and resolution precipitates (Table 2). The change in Nb insolution with time given in Fig. 12 for both Nb and Nb–Ti steelsshows a similar trend to the micro-hardness curves (Fig. 9), provid-ing further evidence of the importance of Nb in solution in definingthe hardness.
5. Conclusions
(1) Following rolling at 850 �C and subsequent isothermal heat-ing at 1200 �C for various times, the prior-austenite grainsize exhibited coarsening, an inevitable effect of the reducedpinning force of precipitates on the grain boundaries. Therate of coarsening was less for the Nb–Ti steel than the Nbsteel because of the higher temperature stability of the (Ti,Nb)C or (Ti, Nb)(C, N) than the NbC or Nb(C, N).
(2) The Nb continually dissolved into the austenite duringreheating in both the Nb and Nb–Ti steels. However, the dis-solution rate of Nb in the Nb steel was considerably quickerthan that in the Nb–Ti steel.
(3) The average diameter of the Nb precipitates in the Nb steelinitially coarsen up to 10 s hold, but then decreased as theydissolved into the matrix. However, the (Ti, Nb)C or (Ti,Nb)(C, N) particles in the Nb–Ti steel exhibited continuouscoarsening over the duration of the holding period.
(4) The austenite grain coarsening kinetics was predicted usingthe theories of Feltham, Fan, Hellman & Hillert and Cahn’stheories, that allowed for average grain size, volume fractionand diameter of precipitates. It was shown that both grainboundary pinning and solute drag must be considered topredict the austenite grain coarsening kinetics for the Nbsteel. In particular, Fan and Cahn’s theories fitted well withexperimental data when solute drag was taken into account.
(5) The kinetics of Nb in solution can be characterised usingmodified JMAK equation by f ðtÞ ¼ 1þ f 0 � expð�ktnÞ. Thismodelling provides a quick and accurate method to predictthe amount of Nb in solution as a function of holding time.

P. Gong et al. / Acta Materialia 97 (2015) 392–403 403
(6) The effect of solid solution from the microalloy elements onmicro-hardness is significant higher than the negative effectof increasing grain size and resolution of precipitates.
Acknowledgements
The authors would like to thank both ArcelorMittal Maizièresand Companhia Brasileira de Metalurgia e Mineração (CBMM) forthe financial support of this research programme.
References
[1] A. Ghosh, S. Das, S. Chatterjee, B. Mishra, P. Ramachandra Rao, Influence ofthermo-mechanical processing and different post-cooling techniques onstructure and properties of an ultra low carbon Cu bearing HSLA forging,Mater. Sci. Eng. A 348 (1–2) (2003) 299–308.
[2] M.C. Zhao, K. Yang, Y. Shan, The effects of thermo-mechanical control processon microstructures and mechanical properties of a commercial pipeline steel,Mater. Sci. Eng. A 335 (1–2) (2002) 14–20.
[3] A.J. Craven, K. He, L.A.J. Garvie, T.N. Baker, Complex heterogeneousprecipitation in titanium–niobium microalloyed Al-killed HSLA steels-I. (Ti,Nb)(C, N) particles, Acta Mater. 48 (2000) 3857–3868.
[4] B. Dutta, C.M. Sellars, Effect of composition and process variables on Nb (C, N)precipitation in niobium microalloyed austenite, Mater. Sci. Technol. 3 (1987)197–206.
[5] A.M. Elwazri, S. Yue, P. Wanjara, Effect of prior-austenite grain size andtransformation temperature on nodule size of microalloyed hypereutectoidsteels, Metall. Mater. Trans. A 36 (2005) 2297–2305.
[6] M.P. Phaniraj, B.B. Behera, A.K. Lahiri, Thermo-mechanical modeling of twophase rolling and microstructure evolution in the hot strip mill, J. Mater.Process. Technol. 170 (1–2) (2005) 323–335.
[7] S.Q. Yuan, G.L. Liang, X.J. Zhang, Interaction between elements Nb and Moduring precipitation in microalloyed austenite, J. Iron Steel Res. 17 (9) (2010)60–63.
[8] S.G. Hong, H.J. Jun, K.B. Kang, C.G. Park, Evolution of precipitates in the Nb–Ti–V microalloyed HSLA steels during reheating, Scr. Mater. 48 (8) (2003) 1201–1206.
[9] S.G. Hong, K.B. Kang, C.G. Park, Strain-induced precipitation of NbC in Nb andNb–Ti microalloyed HSLA steels, Scr. Mater. 46 (2) (2002) 163–168.
[10] B.K. Show, R. Veerababu, R. Balamuralikrishnan, G. Malakondaiah, Effect ofvanadium and titanium modification on the microstructure and mechanicalproperties of a microalloyed HSLA steel, Mater. Sci. Eng. A 527 (6) (2010)1595–1604.
[11] B. Eghbali, A. Abdollah-zadeh, Influence of deformation temperature on theferrite grain refinement in a low carbon Nb–Ti microalloyed steel, J. Mater.Process. Technol. 180 (1–3) (2006) 44–48.
[12] S.K. Dhua, A. Ray, D.S. Sarma, Effect of tempering temperatures on themechanical properties and microstructures of HSLA-100 type copper-bearingsteels, Mater. Sci. Eng. A 318 (1–2) (2001) 197–210.
[13] S.K. Dhua, S.K. Sen, Effect of direct quenching on the microstructure andmechanical properties of the lean-chemistry HSLA-100 steel plates, Mater. Sci.Eng. A 528 (21) (2011) 6356–6365.
[14] J. Fernández, S. Illescas, J.M. Guilemany, Effect of microalloying elements onthe austenitic grain growth in a low carbon HSLA steel, Mater. Lett. 61 (11–12)(2007) 2389–2392.
[15] W.M. Guo, Z.C. Wang, S. Liu, X.B. Wang, Effects of finish rolling temperature onmicrostructure and mechanical properties of ferritic-rolled P-added highstrength interstitial-free steel sheets, J. Iron Steel Res. Int. 18 (5) (2011) 42–46.
[16] M.S. Loveday, G.J. Mahon, B. Roebuck, A.J. Lacey, E.J. Palmiere, C.M. Sellars, M.R.van der Winden, Measurement of flow stress in hot plane strain compressiontests, Mater. High Temp. 23 (2) (2006) 85–118.
[17] D.C. Joy, R.F. Egerton, D.M. Maher, Progress in the Quantitation of ElectronEnergy-Loss Spectra, Scanning Electron Microsc Vol IIAMF O’Hare, Chicago,1979, pp. 817–826.
[18] R.D. Leapman, Detecting single atoms of calcium and iron in biologicalstructures by electron energy loss spectrum imaging, J. Microsc. 210 (2003) 5–15.
[19] G.E. Dieter, Mechanical Metallurgy, third ed., McGraw-Hill, 1986.[20] C.H.P. Lupis, J.F. Elliott, Generalized interaction coefficients, Acta Metall. 14 (4)
(1966) 529–538.[21] E.J. Palmiere, Suppression of Recrystallization During the Hot Deformation of
Microalloyed Austenite, University of Pittsburgh, 1991.[22] E.J. Palmiere, C.I. Garcia, A.J. DeArdo, Compositional and microstructural
changes which attend reheating and grain coarsening in steels containingniobium, Metall. Mater. Trans. A 25 (1994) 277–286.
[23] G.B. Olson, H.C. Ling, J.S. Montgomery, J.B. Vander, M. Cohenmit, Grain-coarsening resistance and the stability of second-phase dispersions in rapidlysolidified steels, MRS Proc. 8 (1981) 355–362.
[24] K. Wang, A Study of HSLA Steels Microalloyed with Vanadium and TitaniumDuring Simulated Controlled Rolling Cycles, University of Canterbury, 2003.
[25] S.Q. Yuan, G.L. Liang, Dissolving behaviour of second phase particles in Nb–Timicroalloyed steel, Mater. Lett. 63 (27) (2009) 2324–2326.
[26] S. Illescas, J. Fernández, J.M. Guilemany, Kinetic analysis of the austenitic graingrowth in HSLA steel with a low carbon content, Mater. Lett. 62 (20) (2008)3478–3480.
[27] T.H. Zhou, H.S. Zurob, Abnormal and post-abnormal austenite grain growthkinetics in Nb–Ti microalloyed steels, Can. Metall. Q. 50 (4) (2011) 389–395.
[28] J.E. Burke, Y.G. Shiau, The effect of mechanical deformation on grain growth inalpha brass, AIME Trans. 175 (1948) 141–154.
[29] C.S. Smith, Grains, phases, and interfaces: an interpretation of microstructure,Trans. Am. Inst. (Metall.) Eng. 175 (1948) 15–51.
[30] P.A. Beck, Annealing of cold worked metals, Adv. Phys. 3 (11) (1954) 245–324.[31] P. Feltham, Grain growth in metals, Acta Metall. 5 (1957) 97–105.[32] P. Hellman, M. Hillert, Effect of second-phase particles on grain growth, Scand.
J. Metall. 4 (5) (1975) 211–219.[33] D. Fan, S.P. Chen, L.Q. Chen, Computer simulation of grain growth kinetics with
solute drag, J. Mater. Res. 14 (3) (2011) 1113–1123.[34] J.W. Cahn, The impurity-drag effect in grain boundary motion, Acta Metall. 10
(1962) 789–798.[35] A. Mallick, Effect of second phase mobile particles on polycrystalline grain
growth: a phase-field approach, Comput. Mater. Sci. 67 (2013) 27–34.[36] A. Michels, C.E. Krill, H. Ehrhardt, R. Birringer, D.T. Wu, Modelling the influence
of grain-size-dependent solute drag on the kinetics of grain growth innanocrystalline materials, Acta Mater. 47 (7) (1999) 2143–2152.
[37] R. Le Gall, J.J. Jonas, Solute drag effects during the dynamic recrystallization ofnickel, Acta Mater. 47 (17) (1999) 4365–4374.
[38] B. Dutta, E.J. Palmiere, C.M. Sellars, Modelling the kinetics of strain inducedprecipitation in Nb microalloyed steels, Acta Mater. 49 (5) (2001) 785–794.
[39] Y.L. Qin, H.W. Luo, B.J. Kooi, J. De Hosson, Influence of a trace amount of Ti onprecipitates in Nb microalloyed steel during reheating, in: Proceedings of the4th International Conference on Physical and Numerical Simulation ofMaterials Processing, Shanghai, 2004.
[40] E.V. Pereloma, B.R. Crawford, P.D. Hodgson, Strain-induced precipitationbehaviour in hot rolled strip steel, Mater. Sci. Eng. A 299 (1–2) (2001) 27–37.
[41] I.B. Timokhina, P.D. Hodgson, S.P. Ringer, R.K. Zheng, E.V. Pereloma, Precipitatecharacterisation of an advanced high-strength low-alloy (HSLA) steel usingatom probe tomography, Scr. Mater. 56 (7) (2007) 601–604.
[42] H.W. Yen, P.Y. Chen, C.Y. Huang, J.R. Yang, Interphase precipitation ofnanometer-sized carbides in a titanium–molybdenum-bearing low-carbonsteel, Acta Mater. 59 (16) (2011) 6264–6274.
[43] R. Okamoto, A. Borgenstam, J. Ågren, Interphase precipitation in niobium-microalloyed steels, Acta Mater. 58 (14) (2010) 4783–4790.