Embed Size (px)
Citation preview

Dissertation submitted to
the Combined Faculties for Natural Sciences and Mathematics of the Ruperto-Carola University
of Heidelberg, Germany for the degree of Doctor of Natural Sciences
Presented by
Diplom-Biologin Sheena Dominique Pinto Mumbai, India
Date of Oral Examination: 10th May 2010
Promiscuous Gene Expression in
Thymic Medullary Epithelial Cells: Scope, Phylogenetic Conservation and
Regulation at the Single Cell Level
Referees: Prof. Dr. Günter Hämmerling Prof. Dr. Bruno Kyewski

This thesis was completed in the Department of Developmental Immunology, headed by Prof. Dr. Bruno Kyewski, at the German Cancer Research Center, Heidelberg.
I hereby confirm that the research and analysis performed on this thesis is entirely my own without contributions from any third party. Wherever my research on this thesis entailed reference to established theories and publications, appropriate mention has been made.
Sheena Pinto
Heidelberg, 25th March 2010
Table of Contents
i
Table of Contents
Table of Contents ............................................................................................ i
Summary.........................................................................................................iv
Zusammenfassung ..........................................................................................v
Abbreviations..................................................................................................vi
1. Introduction................................................................................................. 1 1.1. The thymus............................................................................................................... 2
1.1.1. Evolution of the thymus......................................................................................................... 2 1.1.2. Cellular composition of the thymus...................................................................................... 3
1.2. Thymocyte differentiation and selection ................................................................. 5 1.2.1. Early T-cell development within the thymic cortex ........................................................... 5 1.2.2. Positive selection ..................................................................................................................... 6 1.2.3. CD4/CD8 lineage commitment............................................................................................ 7
1.3. Central tolerance....................................................................................................... 7 1.3.1. Negative selection.................................................................................................................... 9 1.3.2. Dominant tolerance - regulatory T-cells ............................................................................ 10
1.4. Models of selection of the T-cell repertoire which is self-MHC restricted and self-tolerant .............................................................................................................. 11
1.5. MTEC differentiation and promiscuous gene expression (pGE) ..........................14 1.5.1. MTEC development ............................................................................................................. 14 1.5.2. The role of Aire in pGE....................................................................................................... 17
1.6. Objective of this study.............................................................................................19
2. Materials and Methods .............................................................................. 20 2.1. Materials ................................................................................................................. 20
2.1.1. Chemicals................................................................................................................................ 20 2.1.2. Buffers, solutions and media................................................................................................ 21
2.1.2.1. General buffers and stock solutions............................................................................. 21 2.1.2.2. Immunohistology ............................................................................................................ 21 2.1.2.3. Agarose gel electrophoresis ........................................................................................... 22 2.1.2.4. Isolation of TECs............................................................................................................ 22 2.1.2.5. Illumina expression profiling whole genome BeadArrays ........................................ 23 2.1.2.6. µMACS™ SuperAmp™ Technology for Illumina BeadArrays............................... 23 2.1.2.7. Fluorescence in situ hybridization ................................................................................. 24
2.1.3. Enzymes and proteins........................................................................................................... 25 2.1.4. Antibodies, secondary reagents ........................................................................................... 26 2.1.5. MicroBeads used for MACS purification........................................................................... 27 2.1.6. Conventional PCR................................................................................................................. 27
2.1.6.1. Primers for conventional PCR...................................................................................... 27 2.1.6.2. Real-time PCR primers................................................................................................... 28
2.1.7. Nucleotide and nucleic acids................................................................................................ 34 2.1.8. Microarrays, kits and standards ........................................................................................... 34 2.1.9. Instruments............................................................................................................................. 35 2.1.10. Consumables .......................................................................................................................... 36

Table of Contents
ii
2.1.11. Software .................................................................................................................................. 37 2.1.12. Mouse, rat and human material ........................................................................................... 38
2.2. Methods .................................................................................................................. 40 2.2.1. Antibody labeling................................................................................................................... 40 2.2.2. Immunohistochemistry......................................................................................................... 40
2.2.2.1. Organ preparation for cryosections ............................................................................. 40 2.2.2.2. Immunohistochemical staining ..................................................................................... 41
2.2.3. Isolation of thymic epithelial cells....................................................................................... 43 2.2.3.1. Isolation of mouse thymic epithelial cells.................................................................... 43 2.2.3.2. Isolation of rat thymic epithelial cells........................................................................... 45 2.2.3.3. Isolation of human thymic epithelial cells ................................................................... 46
2.2.4. Counting of live cells............................................................................................................. 50 2.2.5. RNA isolation ........................................................................................................................ 50 2.2.6. RNA precipitation and RT-PCR......................................................................................... 51
2.2.6.1. RNA precipitation........................................................................................................... 51 2.2.6.2. RT-PCR............................................................................................................................ 51
2.2.7. Conventional PCR................................................................................................................. 52 2.2.8. Quantitative PCR (qPCR) .................................................................................................... 52 2.2.9. Microarrays ............................................................................................................................. 55 2.2.10. µMACS™ SuperAmp™ Technology for Illumina BeadArrays ..................................... 55 2.2.11. Single-cell PCR (SC-PCR) .................................................................................................... 55
2.2.11.1. Primer design, dilution and storage .............................................................................. 55 2.2.11.2. Efficiency and competition primer tests...................................................................... 56 2.2.11.3. Cell sorting and storage.................................................................................................. 56 2.2.11.4. Lysis of cells, reverse transcription and PCRs ............................................................ 58
2.2.12. Fluorescence in situ hybridization (FISH) .......................................................................... 60 2.2.12.1. FISH probes ....................................................................................................................60 2.2.12.2. Cell fixation ...................................................................................................................... 60 2.2.12.3. In situ hybridization (ISH) .............................................................................................. 61 2.2.12.4. Image acquisition and analysis ...................................................................................... 61
3. Results ....................................................................................................... 65 3.1. Expression patterns and evolutionary conservation of promiscuous gene
expression (pGE).................................................................................................... 65 3.1.1. Estimation of the number of differentially expressed genes between MHCIIlo and
MHCIIhi mTECs .................................................................................................................... 66 3.1.2. Linking features of promiscuous gene expression............................................................ 68
3.1.2.1. Defining tissue-restricted antigens (TRAs) ................................................................. 68 3.1.2.2. Gene clustering................................................................................................................72
3.1.3. Gene clusters are present in syntenic regions across species .......................................... 75 3.1.4. Gene homology within TRA clusters in the mouse genome.......................................... 78 3.1.5. Analysis of gene expression between immature and mature mTECs in the thymus .. 80
3.1.5.1. Analysis of the differentially expressed gene content in murine mTECs: TRAs and Aire dependency ...................................................................................................... 80
3.1.5.2. How is pGE projected onto pre-existing genome-wide mouse TRA clusters?..... 82 3.1.5.3. Are TRAs regulated over non-TRAs within gene clusters in murine mTECs?..... 85 3.1.5.4. Analysis of the differentially expressed gene content in rat mTECs....................... 86 3.1.5.5. Analysis of the differentially expressed gene content in human mTECs ............... 88

Table of Contents
iii
3.2. “Holes” in the thymic antigen repertoire: implications for central tolerance and autoimmunity ...................................................................................................91
3.2.1. Regulation of the GAD65/GAD67 loci in human thymus............................................ 91 3.2.2. Regulation of the MYH6/MYH7 locus in human and murine thymus........................ 97
3.3. Study of pGE in mTEC subsets expressing a particular antigen .........................102 3.3.1. Co-expression studies of MUC1 expressing mTECs at the population level ............ 102 3.3.2. Co-expression studies of MUC1-expressing mTECs at the single cell level .............. 110 3.3.3. Co-localization studies of chromosomes 1 and 19 in MUC1 expressing mTECs
using FISH............................................................................................................................ 117
4. Discussion ............................................................................................... 123 4.1. Evolutionary conservation of pGE ........................................................................123 4.2. TRAs cluster genome-wide and project onto the thymus ....................................124 4.3. Aire’s action: cluster-wide or gene-specific?.........................................................126 4.4. Highly variable promiscuously expressed gene pool in human thymus..............127 4.5. Lack of antigen expression in the thymus subverts central tolerance..................129 4.6. Co-regulated gene expression in single mTECs...................................................130 4.7. Analysis of mTECs reveal partially overlapping co-expression groups ...............134 4.8. Conclusions and future perspectives.....................................................................137
5. References................................................................................................ 138
Acknowledgements ..................................................................................... 154

Summary
iv
Summary
In the thymus a specific subset of thymic stromal cells - medullary thymic epithelial cells (mTECs) - express a highly diverse set of tissue-restricted antigens (TRAs) representing essentially all tissues of the body, which is known as promiscuous gene expression (pGE). This allows self-antigens, which otherwise are expressed in a spatially or temporally restricted manner to become continuously accessible to developing T-cells thus, rendering them tolerant to most self-antigens. The scope of central tolerance is to a large extent dictated by this pool of promiscuously expressed genes. Lack of a single TRA can result in spontaneous organ-specific autoimmunity. Therefore, it is important to define the scope of pGE and parameters/mechanisms that regulate this gene pool.
Promiscuously expressed genes display two prominent features: they are highly clustered in the genome and show a preference for TRAs. To link these features we focused on studying genes which are up-regulated in mature mTECs. The analysis was performed in mouse, rat and human in order to assess evolutionary conservation of pGE. Our analysis proceeded from the bioinformatic definition of TRA clusters, gene clustering and homology mapping via gene expression analysis using whole genome arrays to the in depth analysis of selected TRA clusters by RT-PCR at the population level. The mTEC compartment represents a mosaic of clonally derived mTEC clusters undergoing continuous renewal, whereby the sets of genes expressed in single mTECs ultimately add up to a complete representation of the promiscuous gene pool at the population level. Hence, we wanted to elucidate what dictates pGE at the single cell level, i.e. whether it was random or subject to rules of co-expression.
We observed that TRAs per se are clustered in the genome in all three species irrespective of structural relatedness or antigenic properties. Most of the clusters are localized in syntenic regions. In the thymus, the promiscuously expressed genes are enriched in TRAs that are partitioned into clusters, again conserved between species. These clusters harbor both TRAs and non-TRAs that are interspersed among each other. TRAs are preferentially regulated over non-TRAs during mTEC differentiation. Moreover, genes within a particular gene cluster are subject to partial co-regulation. Based on these data, we propose these clusters to be the “operational genomic unit” of pGE in the thymus.
Single cell studies of a mTEC subpopulation expressing a particular antigen revealed a deterministic component in the regulation of pGE. Co-expression groups in single cells not only defined intra-chromosomal but also inter-chromosomal (e.g. chromosome 1 and 19) gene co-regulation. Strikingly, these co-expression patterns correlated with in situ co-localization of the respective chromosomal domains upon mTEC maturation as analyzed by fluorescence in situ hybridization. Taken together, our data show that pGE is highly conserved between species, maps to gene clusters and is governed by certain co-expression rules at the single cell level.

Zusammenfassung
v
Zusammenfassung
Medulläre Thymusepithelzellen (mTEZ), ein spezieller Zelltyp des Thymus, exprimieren ein höchst diverses Repertoire an gewebespezifischen Antigenen (tissue restricted antigens, TRAs), welche (vermutlich) jedes Gewebe des Körpers repräsentieren. Dieses Phänomen ist als promiske Genexpression (pGE) bekannt. PGE ermöglicht es, Selbst-Antigene, welche sonst nur in peripheren Geweben örtlich und zeitlich begrenzt exprimiert werden, den T-Zellen während ihrer Entwicklung im Thymus permanent zugänglich zu machen und dadurch Toleranzinduktion gegenüber diesen TRAs zu gewährleisten. Selbst das Fehlen eines einzigen Selbstantigens im Thymus kann zu einer spontanen organspezifischen Auto-immunantwort führen. Daher ist es wichtig, den Umfang des im Thymus exprimierten Genpools im Detail zu bestimmen und die Regulation dieser Genexpression zu verstehen.
Promisk exprimierte Gene zeigen zwei Charakteristika: Zum einen liegen sie im Genom größtenteils in Clustern vor, zum anderen sind die meisten von ihnen TRAs. Um eine mögliche Verbindung zwischen diesen Eigenschaften herzustellen, wurden Gene untersucht, deren Expression in reifen mTEZ im Vergleich zu unreifen mTEZ hochreguliert ist. Die Expression dieser Gene wurde in Maus, Ratte und Mensch vergleichend analysiert, um das Ausmaß der evolutionären Konservierung von pGE zu bestimmen. Die Analyse umfasste die bioinformatische Definition von TRA- und Gen-Clustern, das Erfassen von Homologien mittels genomweiter Genexpressionsanalysen und die detaillierte Untersuchung ausgewählter TRA-Cluster mittels RT-PCR auf der Ebene von Zellpopulationen. Diese Analysen ergaben, dass TRAs in allen untersuchten Spezies im Genom als Cluster organisiert sind unabhängig von ihren Funktionen und Struktur. Die meisten Cluster, die sowohl TRAs als auch Nicht-TRA beinhalten, liegen in syntenischen Regionen. Gene eines einzelnen Clusters war teilweise co-reguliert. TRAs in Clustern waren im Thymus häufiger exprimiert als Nicht-TRAs. Wir postulieren daher, dass diese Cluster die operationelle genomische Einheit darstellen, die der pGE im Thymus zugrunde liegt.
Das mTEZ-Kompartiment setzt sich aus einem Mosaik von mTEZ-Klonen zusammen, die sich ständig erneuern. Da die Gesamtheit promisk exprimierter Gene in der mTEZ-Population sich aus der Summe der pGE der einzelnen mTEZ-Klone zusammensetzt, ist es notwendig, die Regulation von pGE auf Einzelzellebene zu verstehen: Ist pGE auf Einzelzellebene ein völlig zufälliger Prozess oder werden Gene co-reguliert? Dazu wurden zusätzlich Analysen in Einzelzellen durchgeführt. Diese zeigten, dass Gengruppen in einzelnen Zellen entweder auf demselben oder auch auf unterschiedlichen Chromosomen co-reguliert werden. Dabei co-lokalisierten die Genloci von gemeinsam regulierten Gene in situ, wie mittels FISH Analyse gezeigt werden konnte. Wir schließen aus diesen Ergebnissen, dass pGE neben einer stochastischen auch eine deterministische Komponente beinhaltet.

Abbreviations
vi
Abbreviations
APS-1 autoimmune polyglandular syndrome type 1
LPA linear polyacrylamide
APC antigen presenting cell Lti lymphoid tissue inducer cell aRNA antisense RNA MACS magnetic cell separation ATP adenosine tri-phosphate MHC major histocompatibility complex BAC bacterial artificial chromosome mTEC medullary thymic epithelial cell BSA bovine serum albumin mTEChi mTEC expressing high levels of
co-stimulatory molecules CD cluster of differentiation mTEClo mTEC expressing low levels of co-
stimulatory molecules cDNA complementary DNA PBS phosphate buffered saline CLSM confocal laser scanning
microscopy PCR polymerase chain reaction
cRNA complementary RNA PE phycoerythrin cTEC cortical thymic epithelial cell PerCP peridinin chlorophyll protein Cy cyanine PFA paraformaldehyde DC dendritic cell pGE promiscuous gene expression DEPC diethylpyrocarbonate PI propidium iodide DN double negative psi pound per square inch DNA deoxyribonucleic acid qPCR quantitative PCR DNase deoxyribonuclease rpm revolutions per minute DNMT DNA-methyltransferase RAG recombinase activating genes dNTP deoxyribonucleoside triphosphate RANKL receptor activator for nuclear factor
κ B ligand DP double positive RNA ribonucleic acid DTT dithiothreitol RPMI-
1640 medium developed at Roswell Park Memorial institute
dTTP deoxythymidine-triphosphate RT reverse transcription dUTP deoxyuridine-triphosphate Sav streptavidin EDTA ethylene diamine tetra acetic acid SC single cell eGE ectopic gene expression SD rats Sprague Dawley rats FACS fluorescence activated cell sorting SP single positive FISH fluorescence in situ hybridization SSC sodium saline citrate FITC fluorescein isothiocyanate TAE tris-acetate EDTA FCS fetal calf serum TCR T-cell receptor HEPES 4-(2-hydroxyethyl)-1-
piperazineethanesulfonic acid TRA tissue-restricted antigen
HPSF high pure salt free Treg regulatory T-cell KO knock-out WT wild type

Introduction
1
1. Introduction
The immune system is a remarkably versatile defense system that has evolved to protect multi-cellular organisms from invading pathogens. The hallmark of all metazoan species is innate immunity, which primarily depends on the recognition of highly conserved pathogen associated molecular patterns (PAMPs) by germ line-encoded pattern recognition receptors. However, microorganisms continually develop new ways to evade host defense tactics that have been termed the “host-versus-pathogen arms race’’. This selective pressure presumably led to the evolution of a new, more sophisticated defense mechanism, called adaptive immune system (Cannon et al., 2004; Flajnik and Du Pasquier, 2004). The adaptive immune system is capable of specifically recognizing an apparently limitless variety of foreign invaders owing to its ability to generate an enormous variety of cells and molecules that act together in a dynamic network whose complexity rivals that of the nervous system.
It was approximately 500 million years ago in jawed vertebrates that the adaptive immune system evolved the remarkable ability to mount specific immune responses to a virtually unlimited variety of antigens. The two arms of recombinatorial adaptive effector system are developmentally separated, but functionally intertwined lineages of clonally diverse lymphocytes. These are named T- and B-cells because they are generated in the thymus or in the avian bursa of Fabricius respectively (Cooper et al., 1965; Cooper and Alder, 2006). For antigen recognition, both T- and B-cells use the same type of immunoglobulin domain (Ig)-based receptors. The T-cell receptors (TCR) and B cell receptors (BCR) are assembled during lymphocyte differentiation by somatic recombination of different variable (V), diversity (D) and joining (J) immunoglobulin (Ig) gene segments, imprecise V(D)J splicing, and insertion of non-template nucleotides at the junctions (Tonegawa, 1983; Yanagi et al., 1984). As a consequence of this random rearrangement process potentially harmful receptors that recognize self constituents are also generated. Thus, to eliminate these auto-reactive lymphocytes, self-tolerance mechanisms are invoked to distinguish foreign from self, which is a fundamental feature of the adaptive immune system.
The T-cells which are one of the main players in adaptive immunity carry a highly diverse repertoire of TCRs which they use to recognize foreign- or self-antigens in combination with self major histocompatibility complex (MHC) (self-restriction of the T-cell repertoire). The generation, maturation and selection of this highly diverse T-cell repertoire occur in the thymus. In the thymus immature T-cells (designated thymocytes) undergo a strict quality control ensuring a repertoire of T-cells that under normal, i.e. healthy conditions does not attack and destroy host tissue (i.e. self-tolerant), but holds the competence to react to a vast range of foreign antigens. Thus, the function of the thymus which was only discovered in the early 1960s by Jacques Miller confers this fundamental self-tolerance (Miller, 1961).

Introduction
2
1.1. The thymus
1.1.1. Evolution of the thymus
The appearance of the thymus in evolution is linked to the appearance of lymphocytes expressing highly diverse antigen-recognition receptors. T-cell development is strictly restricted to well-organized three-dimensional microenvironments of a specialized organ-the thymus, while B-cell development proved rather flexible with regards to its site, occurring in the bursa of Fabricius in birds, Ileal Peyer’s patches in sheep, appendix in rabbits and bone marrow in mammals (Alitheen et al., 2010). The thymus evolved as the primary lymphoid organ to allow the generation of a large MHC-restricted T-cell repertoire. Only T-cells required an autonomous, physically separated organ, and not merely a niche to develop and confine the destructive potential of T-cells (Rodewald, 2008).
Invertebrates and the most primitive vertebrates are not known to posses a thymus. Among vertebrates, the lowest showing key features of an adaptive immune system, such as re-arranging T- and B-cell receptor, RAG genes, MHC genes and a thymus, are the cartilaginous fish (jawed vertebrates, gnathostomes) like rays and sharks. The jawless (agnatha such as lamprey and hagfish), vertebrates have no thymus. They have been found to assemble diverse lymphocyte antigen receptor (VLRs) through gene conversion of leucine-rich repeat (LRR)-encoding modular units that are expressed on the surface of two distinct lymphocyte lineages (Cooper and Alder, 2006; Guo et al., 2009). Thus, recombinatorial mechanisms for the generation of anticipatory receptors have evolved independently in both jawless and jawed vertebrates (Cooper and Alder, 2006).
The origin of the thymus in the inner layer of an embryonic gut ancestor is reminiscent of GALT (gut-associated lymphoid tissue), which is a key lymphoid structure in species prior to the appearance of a thymus. Thus, the thymus may have evolved as a GALT derivative (Du Pasquier, 1993). In the most primitive thymus-bearing species i.e. cartilaginous fish (rays and sharks), the thymus anlagen are located in the second to sixth pouch, whereas they are found in the second pouch in frogs, in the second and third in reptiles, and in the third and/or fourth in bony fish, birds and mammals. Thus, species are flexible in positioning of the thymus anlage somewhere along the pharyngeal foregut endoderm. Numbers and positions of the final thymus or thymi may also vary. Chickens have seven, sharks five, and urodele amphibians (e.g. salamander) three thymus pairs, while many teleost fish species, anuran amphibians (e.g. frogs), and many mammals have only one thymus composed of two bilateral lobes (Rodewald, 2008). In the end, irrespective of the number and positioning, the function of the thymus is T-cell development and the
Introduction
3
selective elimination of potentially auto-reactive T-cells that is likely to be universal throughout all jawed vertebrates (Hansen and Zapata, 1998).
1.1.2. Cellular composition of the thymus
The thymus is the primary site for T lymphopoiesis, providing the essential niches and signals for maturing T-cells not only during the fetal stages of development but throughout postnatal life. The thymic structure and cellular composition is conserved throughout evolution (Anderson and Jenkinson, 2001) into anatomical separate compartments which include the sub-capsular area, the cortex, the cortical-medullary junction and the medulla (Figure 1). Thymic epithelial cells (TECs) constitute the major component of the stromal compartment and can be subdivided according to their function, morphology and specific antigen profile into different subpopulations- the cortical (c) and medullary (m) TECs. The different TECs together with other stromal cells of hematopoietic (dendritic cells, macrophages) and non-hematopoietic origin (fibroblasts and endothelial cells) form a three dimensional meshwork (Boyd et al., 1993). The thymic stroma plays a key role at multiple stages of thymocyte development: on the one hand it ensures T-cell lineage specification of common lymphoid precursors and on the other hand it is essential for self-MHC restriction via positive selection and the elimination of auto-reactive T-cells via negative selection (Petrie, 2003; Starr et al., 2003). “Thymic-cross-talk” between the thymic stromal cells and developing thymocytes is essential to provide appropriate signals for promoting and regulating thymocyte development and in turn thymocyte-derived signals are essential for the development of the stromal cell compartment (van Ewijk et al., 1995; van Ewijk et al., 2000).

Introduction
4
Figure 1
Cellular composition of and traffic of thymocytes within the thymus
In the post-natal thymus, a) circulating multi-potent lymphoid progenitors enter the thymus through the vasculature that is enriched around the cortico-medullary junction. This entry is regulated by (P)-selectin glycoprotein ligand 1 (PSGL1). b) They migrate towards the capsule as CD4- CD8- double-negative (DN) thymocytes, which is regulated by chemokine signals through CXC-chemokine receptor 4 (CXCR4) and CC-chemokine receptor 7 (CCR7). c) Further migration to the subcapsular region is mediated by CCR9 signals. d) These DN thymocytes go through a transition from DN to DP which is marked by the up-regulation of the CD4 and CD8 co-receptors. The double positive (DP) CD4+ CD8+ thymocytes expressing appropriate TCRαβs, undergo positive selection. High-affinity interactions or lack of interactions result in deletion of thymocytes via apoptosis. e) Those that survive this selection differentiate into either CD4 or CD8 single-positive (SP) thymocytes. They show an increase in surface expression of CCR7, are attracted to the medulla by a gradient, where mTECs express CCR7 ligands. f) In the medulla, further selection (negative) of SP thymocytes includes the deletion of tissue-specific-antigen-reactive T-cells, survival of non-self reactive T-cells and the generation of regulatory T-cells. g) Mature SP T-cells express sphingosine-1-phosphate receptor 1 (S1P1) through which the cells are attracted back to the circulation that contains a high concentration of sphingosine-1-phosphate. cTEC, cortical thymic epithelial cell; DC, dendritic cell; mTEC, medullary thymic epithelial cell. (Adapted from Takahama, 2006)

Introduction
5
1.2. Thymocyte differentiation and selection
Most of the hematopoietic cell lineages undergo differentiation in the bone marrow, whereas T- cells develop within the thymus. This process consists of multiple steps that require a relocation of developing lymphocytes into the thymus (Figure 1). During their journey through the thymus, developing thymocytes pass several checkpoints at which they either die or survive until they are released to join the peripheral T-cell pool as mature T-cells.
1.2.1. Early T-cell development within the thymic cortex
The seeding of the thymus with lymphoid progenitor cells occurs in the area close to the cortico-medullary junction, where the vasculature is well developed (Lind et al., 2001). This mechanism is not completely understood, however it has been reported that the seeding into the adult thymus is regulated by the adhesive interaction between platelet (P)-selectin glycoprotein ligand 1 (PSGL1), which is expressed by circulating lymphoid progenitor cells, and P-selectin, which is expressed by the thymic endothelium (Rossi et al., 2005). Interestingly, the entry of lymphoid progenitor cells into the thymus is not a continuous event but an intermittent and gated event that occurs in waves during embryogenesis and in adulthood (Le Douarin and Jotereau, 1975; Havran and Allison, 1988; Fossa et al., 2001).
Upon entry into the thymus, T-lymphoid progenitor cells begin to differentiate, proceeding through the double-negative (DN) stages of T-cell development (Benz et al., 2008). These cells lack the expression of CD4 and CD8 and are named CD4/CD8 double-negative thymocytes (Scollay et al., 1988). The DN T-lymphoid progenitor cells are commonly identified by the expression profiles of CD25 and CD44 (Pearse et al., 1989; Shinkai et al., 1992) and sequentially go through the DN1 (CD44+CD25-), DN2 (CD44+CD25+), DN3 (CD44-CD25+) and DN4/pre-DP (CD44-CD25-) stages. The survival and development of DN thymocytes are supported by Notch ligands (delta-like 4) and cytokines such as interleukin-7, both of which are produced by cTECs (Zuniga-Pflucker, 2004).
Along this developmental process, DN thymocytes migrate outward from the cortico-medullary junction to the sub-capsular region of the cortex (Lind et al., 2001; Petrie, 2003). Chemokine receptors, especially CXCR4, CCR9 and CCR7, are important in this outward migration of DN thymocytes (Plotkin et al., 2003; Benz et al., 2004; Misslitz et al., 2004). A prerequisite for directional cell migration is not only a gradient of an attractant, but also a substrate for cell adhesion. Adhesion molecules, such as integrins a4b1 and a4b7 expressed by DN thymocytes and
Introduction
6
vascular cell adhesion molecule-1 (VCAM-1) expressed by cTECs mediate this adhesion. In addition, chemokines are critical for the “crawl” and are involved in the movement of DN thymocytes to the sub-capsular region (Prockop et al., 2002).
DN1 cells have by far the longest single period of intra-thymic residence lasting for up to two weeks until they progress to the DN2 stage, during which they expand by about 1000-fold (Egerton et al., 1990; Porritt et al., 2003). In the thymic cortex, on their way to the sub-capsular region, DN thymocytes begin to rearrange their Tcrβ locus. The cells that succeed in generating an in-frame Tcrβ rearrangement begin assembling TCRβ and along with the invariant pre-TCRα chain form the cell-surface pre-TCR complex (von Boehmer and Fehling, 1997). This first checkpoint of thymocyte development known as β-selection allows cells to progress beyond the DN3 stage. This is marked by an up-regulation of the CD4 and CD8 co-receptors (Petrie and Zuniga-Pflucker, 2007). The transition from CD4/CD8 double negative to double positive immature T-cells is referred to as DN4 or pre-DP stage. They show a low expression of CD25 and CD44 and are immediate precursors to CD4/CD8 double-positive (DP) thymocytes (Petrie and Zuniga-Pflucker, 2007). The rearrangement of the TCRα gene locus is initiated only after a massive expansion of cells carrying a functional pre-TCR. During this expansion phase, the Rag genes are turned off to prevent any premature rearrangements of the TCRα locus. The expression of the pre-TCR complex on the cell surface along with Delta-Notch interactions, initiate the signals for further development to DP thymocytes that express αβTCR antigen receptors (Zuniga-Pflucker, 2004). The DP thymocytes expressing a αβTCR in the cortex constitute the unselected repertoire of T-cells (Jameson et al., 1995).
1.2.2. Positive selection
Highly motile DP thymocytes pause to interact through their TCR with peptide-MHC complexes that are expressed on cTECs (Bousso et al., 2002; Ehrlich et al., 2009). Following TCR recognition of peptide-MHC ligands with low-affinity, DP thymocytes receive signals for survival and further differentiation into single-positive (SP) thymocytes. This second checkpoint, referred to as positive selection, enriches for ‘useful’ T-cells that recognize self-MHC molecules. High-affinity interactions result in deletion of thymocytes via apoptosis, this process contributes to the deletion of self-reactive T-cells. DP thymocytes which fail to receive TCR signals are also destined to die at this stage. Only 3-5 % of developing thymocytes survive this checkpoint of T-cell development at the cortical DP-thymocyte stage (Egerton et al., 1990; Goldrath and Bevan, 1999).

Introduction
7
1.2.3. CD4/CD8 lineage commitment
Concomitantly with positive selection occurs the so-called CD4/CD8 lineage choice in which thymocytes either differentiate into MHCII-restricted CD4 or MHCI-restricted CD8 single positive (SP) T-cells. This decision-making process is not yet fully understood. Two models have been proposed based on a stochastic or instructive mechanism of lineage choice.
Both models are based on the assumption that the selective termination of one or the other co-receptor irreversibly defines the lineage fate. The stochastic selection model suggests that the termination of CD4 or CD8 co-receptor gene expression during positive selection of DP thymocytes occurs randomly and thymocytes receive a second TCR rescue signal in case the expression of the right co-receptor was maintained, otherwise they die. The instructional model suggested that MHCI- and MHCII-restricted TCR signals are distinct from one another with respect to signal strength. A modification of the instructive model is the kinetic model which poses that the duration of the TCR signal and not the signal strength determines the lineage choice. TCR signals of long duration result in CD4 expression, short TCR signals result in CD8 expression. The kinetic model is the most compatible with experimental data (Singer et al., 2008).
The positively selected thymocytes then begin relocating from the cortex to the medulla (Witt et al., 2005). The CCR7 ligands (CCL19 and CCL21), predominantly produced by mTECs, were shown to be involved in the chemotactic attraction of these cells into the medulla (Ueno et al., 2004). It was recently shown that CCR7-mediates chemotaxis of CD4 SP cells towards the medulla can be separated from migration into the medulla which is under the control of distinct G protein-coupled receptors (GPCR). Both CCR7 and GPCR act in concert to properly target CD4 SP cells to the medulla (Ehrlich et al., 2009).
1.3. Central tolerance
It was more than 100 years ago that the clonal selection theory by Paul Ehrlich first conceptualized the problem of self-reactivity (‘horror autotoxicus’) as inherent to the adaptive immune system and postulated the existence of mechanisms (contrivances) that could prevent deleterious self-reactivity. It took eighty years of work and great advance in immunology until the paradigm of “developmental tolerance” was demonstrated in the chicken/quail model by Le Douarin and associates. They found that embryonic tissues from quail engrafted into age-matched chickens were rejected soon after birth and more importantly, this graft rejection could be prevented by solely transplanting thymic rudiments from the graft donor (Ohki et al., 1987). Subsequent studies in mice demonstrated that transplantation of the thymus anlage, i.e., pure thymic epithelium, confers tolerance to transplanted tissues such as limb buds or skin

Introduction
8
(Salaun et al., 1990; Le Douarin et al., 1996; Salaun et al., 2005). In addition, neonatal thymectomy up to day 3 was shown to lead to a multiorgan autoimmune syndrome including gastritis, sialadenitis, hepatitis, and diabetes (Asano et al., 1996). At that time, the mechanism how thymic epithelium can induce tolerance to a wide spectrum of peripheral antigens was not understood. In 1989 Linsk et al. proposed on pure theoretical grounds that the thymus represents a patch quilt of ectopically expressed genes (Linsk et al., 1989).
It was long believed that the pool of self-epitopes available for T-repertoire selection comprises ubiquitous antigens and antigens specific to the various types of thymic antigen-presenting cells (APCs). Moreover, self-antigens were known to gain access to the thymus either via the circulation or by association with immigrating cells (Kyewski et al., 1984; Klein and Kyewski, 2000b; Klein et al., 2009). The first impactful evidence for ectopic expression of insulin in wild type mice was reported by Hanahan and colleagues (Jolicoeur et al., 1994) in a study of tolerance toward antigens implicated in diabetes. This seminal study was supported over the years by several reports showing the existence of specialized peripheral antigen expressing cells in the thymus (Pribyl et al., 1996; Wakkach et al., 1996; Egwuagu et al., 1997; Kojima et al., 1997; Pugliese et al., 1997; Hanahan, 1998; Heath et al., 1998; Klein et al., 1998; Sospedra et al., 1998; Mallet et al., 1999; Klein et al., 2000; Diez et al., 2001; Bruno et al., 2002). Direct proof of the expression of a highly diverse set of TRA (tissue-restricted antigens) representing essentially all tissues of the body by medullary thymic epithelial cells (mTECs) within the thymus was shown by two groups (Derbinski et al., 2001; Anderson et al., 2002). This phenomenon of “promiscuous gene expression” (pGE) allows self-antigens, which are expressed in a spatially or temporally restricted manner (such as pregnancy- or puberty-associated self-antigens) to become continuously accessible to developing T-cells (Derbinski et al., 2005), thus rendering the T-cell repertoire self-tolerant (pGE, is described in more detail in later chapters).
Two modes of how auto-reactive T-cells are directly rendered harmless were shown; first T-cells are clonally deleted from the repertoire, a hallmark of T-cells central tolerance (negative selection) and second potentially harmful T-cells are silenced by undergoing anergy. “Clonal anergy” involves the functional inactivation of self-reactive T-cells. There are several mouse models supporting this model (Ramsdell et al., 1989). It should be added that the molecular definition of anergy lags behind its functional characterization (Mueller, 2010).

Introduction
9
1.3.1. Negative selection
Negative selection is the third and last checkpoint, which is crucial for the induction of tolerance to self-antigens (central T-cell tolerance). In this process, autoreactive SP thymocytes are removed from the repertoire. In 1987, Marrack et al. showed that T-cells carrying the Vβ17a TCR chain were deleted in animals expressing super-antigens derived from the mouse mammary tumor virus and presented in the context of I-E MHC molecules, while the same T-cells normally matured and migrated to the periphery in the absence of super-antigens. Thus, for the first time clonal deletion of T-cells that recognized antigen in the thymus was reported (Kappler et al., 1987). The clonal deletion model was further validated in various TCR transgenic mouse models expressing a receptor for a self-antigen along with the corresponding self-antigen (e.g. Hemagglutinin, HA) or a naturally expressed antigen (e.g. H-Y) (Starr et al., 2003).
SP thymocytes migrating from the cortex to the medulla are negatively selected through high-affinity interactions with peptide-MHC presenting APCs, which lead to apoptosis. This clonal deletion of self-reactive thymocyte occurring mainly in the medulla is induced by mTECs and DCs. MTECs do so by promiscuous gene expression while DCs can cross-present mTEC derived self-peptides (Lo and Sprent, 1986; Marrack et al., 1988; Matzinger and Guerder, 1989; Gallegos and Bevan, 2004; Kyewski and Derbinski, 2004; Koble and Kyewski, 2009). Gallegos et al. showed that presentation of Ova peptide exclusively by mTECs allowed deletion of cognate CD8+ T-cells. It was only for the deletion of Ova specific CD4+ T-cells, that cross-presentation of Ova on DCs was indispensable (Gallegos and Bevan, 2004). Thus, clonal deletion can be induced autonomously by mTECs and DCs, but different thresholds for deletion may exist.
Several co-stimulatory cell surface molecules like CD28, CD5, CD43, CD40 and Fas have been described to play a role in the induction of negative selection (Punt et al., 1994; Kishimoto and Sprent, 1999; Williams et al., 2002). It has also been reported that CCR4 ligands, TSLP, CCL17 and CCL22 expressed in the medulla by Hassall’s corpuscles, DCs and mTECs play a role in establishing central tolerance, though the precise function still remains obscure (Takahama, 2006).
The SP thymocytes spend approximately 4 days in the medulla where they presumably scan a sufficient number of APCs to cover the entire self-antigen repertoire presented by these APCs before being exported from the thymus (McCaughtry et al., 2007). Negative selection is believed to occur mainly in the medulla or at the cortical-medullary junction (Sprent, 2005). This process involves several synergistic events including the activation of the JNK/p38 pathways which leads to the induction of the pro-apoptotic factors- BIM, Bax and Bak, ultimately resulting in induced cell death which is the basis of negative selection (Bouillet et al., 2002; Rathmell et al., 2002).

Introduction
10
1.3.2. Dominant tolerance - regulatory T-cells
The mechanisms of T-cell tolerance described above act by elimination or inactivation of a given T-cell specificity and thus can be defined as “recessive” (cell-intrinsic) mechanisms. Yet self-reactive T-cells exist in the normal periphery despite the existence of deletion operative in the thymus (Sakaguchi et al., 2007). Obviously, central tolerance mechanisms do not cripple all self-reactive T-cells, thus raising the question of the existence of additional mechanisms of tolerance to keep these cells in check. Efforts in the 1980s propounded another mechanism of self- tolerance, namely “dominant tolerance” (trans-acting), in which regulatory T-cells actively and dominantly suppress lymphocytes, in particular the self-reactive T-cells that exist in the normal periphery. Three main cell types have been considered as potential regulatory T-cell subsets: CD4+CD25+ regulatory T-cells (Treg), CD8αα+ intestinal epithelial lymphocytes and natural killer T (NKT) cells. All are thought to be induced by cognate recognition of self-peptide-MHC in the thymus (Baldwin et al., 2004; Hogquist et al., 2005).
It was in the early 1970s that Gershon demonstrated that T-cells not only enhance but also suppress immune responses to exogenous antigens (Gershon and Kondo, 1970). Treg cells were first recognized as natural controllers of self-reactive T-cells and characterized by CD25+CD4+
and were later shown to specifically express the transcription factor FoxP3. The deficiency of Tregs produces autoimmune disease and also other aberrant or excessive immune responses to non-self antigens (Sakaguchi, 2005).
Foxp3+ Treg cells make up 5-10 % of the peripheral CD4+ T-cell repertoire and are generated in the thymus (natural Tregs) but also in the periphery from naive T-cells (induced Tregs). In the thymus, Foxp3+ cells are detected as early as late CD4+CD8+ double-positive to CD4+CD8-
single-positive stages (Fontenot et al., 2005). The interaction of developing thymocytes with thymic stromal cells activates a transcriptional program in parallel with or upstream of Foxp3. Once the Foxp3 gene is switched on, Foxp3 may stabilize and sustain the Treg cell phenotype and confer suppressive activity (Gavin et al., 2007). It has been suggested that Treg fate is instructed by high-affinity/avidity self-reactive TCRs for self-antigens, which is just below the threshold for negative selection (Maloy and Powrie, 2001; Hogquist and Moran, 2009), as discussed in the next chapter (Figure 2). Recent studies show that TCR repertoires of Treg cell and conventional T-cell overlap, although according to different studies the extent of overlap varies (Pacholczyk et al., 2006; Pacholczyk et al., 2007). Thus, it appears that additional signals and molecules seem to play a role in the branching of Treg lineage from the conventional developing thymocyte.

Introduction
11
MTECs were hypothesized to be the major Treg-inducing cells but other APCs such as cTECs or DCs were also considered (Bensinger et al., 2001; Watanabe et al., 2005). The absence of mature mTECs due to deficiency of NF-κB kinase or TRAF6, which transduce CD40 signals from the TNF receptor family, hampers Treg cell development (Kajiura et al., 2004; Akiyama et al., 2005). Aschenbrenner et al. directly showed mTECs to be able to generate Tregs (Aschenbrenner et al., 2007). Presently it is known that thymic epithelial cells as well as different thymic DC-subtypes can efficiently induce Treg development of immature thymocytes, albeit strikingly different optimal doses of cognate antigen were needed in in vitro studies (Wirnsberger et al., 2009). A combination of factors, TCR affinity/avidity and the time point of Treg induction by different APCs seem to matter.
Notably, Treg cell deficiency and Aire deficiency produce a similar spectrum of autoimmune diseases (Anderson et al., 2002; Kuroda et al., 2005). It is supposed, however not formally shown, whether Aire deficiency affects the generation of tissue-restricted antigen-specific Foxp3+ Treg cells in addition to its established effect on negative selection of tissue-restricted antigen-specific self-reactive T-cells. The significance of central tolerance processes has been highlighted in two inherited autoimmune syndromes. In both cases, the affected molecules are transcriptional regulators that are crucial for these two distinct central-tolerance mechanisms (recessive and dominant): mutations in the autoimmune regulator-AIRE gene lead to defective pGE and as a result a defective clonal deletion of auto-reactive T-cells resulting in a multi-organ syndrome known as autoimmune polyendocrinopathy-candidiasis-ectodermal-dystrophy (APECED) (Villasenor et al., 2005), whereas mutations in the forkhead box P3 (FOXP3) gene impairs the development of Treg cells causing immune deficiency-polyendocrinopathy-X-linked syndrome (IPEX) (Sakaguchi, 2005). Although, there are various peripheral mechanisms (not described in this thesis) that control self-reactive lymphocyte, central-tolerance mechanisms, are essential for the maintenance of self-tolerance. Foxp3+ Treg cells bridge central and peripheral tolerance. The two tolerance mechanisms are complementary as Aire-/-Foxp3-/- mice show a faster and more extensive disease than either Aire-/-Foxp3+/+ or Aire+/+Foxp3-/- mice (Chen et al., 2005; Mathis and Benoist, 2010).
1.4. Models of selection of the T-cell repertoire which is self-MHC
restricted and self-tolerant
At present there are two hypotheses based on the avidity or the affinity of the TCR-peptide-MHC interaction. The avidity model predicts that the quantity of peptide-MHC complexes expressed by cTECs dictates whether a thymocyte expressing an interacting TCR will be positively selected or deleted, whereas the affinity model instead postulates a crucial role of the quality of the individual TCR-peptide-MHC interaction. Fetal thymic organ culture (FTOC) with

Introduction
12
very low concentrations of antigenic peptide could mediate positive selection, while high avidity interactions promoted cell death, thus, supporting the avidity model (Sebzda et al., 1994). Other studies clearly speak in favor of the affinity hypothesis. Irrespective of whether the selecting peptide was related or not, in vitro studies supported the idea that the TCR affinity for ligands mediating positive selection was much lower than for negative selection (Hogquist et al., 1994). More recent refinements of the affinity model suggest a very small window of affinity defining whether a thymocyte is positively or negatively selected (Daniels et al., 2006). Additionally, thymocytes having a TCR with an affinity too low to interact sufficiently with any self-protein/MHC complex undergo apoptosis, an event also termed as ‘death by neglect’. Thymocytes having a high affinity (higher than those positively selected but lower than those negatively selected) may become natural Tregs (Figure 2). Nevertheless, Tregs require additional signals to commit to the Treg lineage.
A recent study by Hinterberger, M. provided evidence for the avidity model of Treg induction. She showed that high antigen dose presented by mTECs lead to deletion of specific T-cells, whereas lower antigen doses on mTECs favored Treg development at the expense of negative selection. The optimal antigen dose might vary between different TCR affinities as well as between different APC, i.e. DC and mTECs. Thus, there is a window of avidity for the development of Tregs that might partially overlap with positive selection or negative selection. This could explain why negative selection and Treg induction of T-cells with the very same TCR occurs in parallel in vivo (Hinterberger, 2009). There appears to be a balance between Treg induction and negative selection, which is shifted to the one or the other direction depending on the availability of the given antigen and the overall avidity.

Introduction
13
PositiveSelection
NegativeSelection
Treg
Death byNeglect
Affinity/Avidity
setycomyhTforeb
muN
Figure 2
The affinity/avidity model of thymocyte selection
The affinity/avidity of the T-cell receptor for self-peptide-MHC ligands is a crucial parameter that drives the developmental outcome of T-cell selection. Progenitors having no affinity or very low affinity will die by neglect. This is the fate of most thymocytes. If the TCR has a low affinity/avidity for self-peptide-MHC, the progenitor survives and is positively selected. If the progenitor has a higher affinity/avidity for self-peptide-MHC, it may lead to clonal deletion or differentiate into a ‘regulatory’-cell phenotype-Treg. It is not exactly known what determines whether an individual T-cell is tolerized by negative selection or is selected to become a regulatory T-cell. (Adapted from Hogquist et al., 2005)
Another controversial issue of T-cell selection is the nature of the peptides presented in the cortex that are required for positive selection. The so-called “altered peptide hypothesis” suggested that the ligands presented by cTECs differ from those presented in the medulla and in the periphery. Previous findings did not support an altered peptide hypothesis, though several recent studies changed this view. They indicate that cTECs generate MHC-bound peptides through pathways distinct from other APCs (i.e. peripheral and thymic medullary, also mTECs) (Klein et al., 2009). First evidence for a distinct proteolytic pathway was the detection of a cTEC-specific endoprotease, Cathepsin L that was critical for CD4+ T-cell development, presumably generating peptides for MHCII suitable for positive selection (Nakagawa et al., 1998). Similarly, a cTEC-specific serine protease TSSP was identified, whose inactivation lead to the decreased positive selection of some transgenic TCRs (Gommeaux et al., 2009). Recently, a cTEC-specific thymoproteosome was identified which is essential for normal CD8 T-cell development (Murata et al., 2007; Nitta et al., 2010). Furthermore, another study by the Klein group showed the

Introduction
14
importance of macroautophagy in the generation of certain but not all peptide-MHCII complexes for positive selection (Nedjic et al., 2008). It is argued that the generation of a unique set of self-peptides for positive selection would prevent a disproportionately large fraction of SP cells to be subject to clonal deletion due to the re-encounter of the same/shared peptides on mTECs or DCs that promoted their positive selection. Such an “excessive” loss of T-cells could have resulted in an evolutionary pressure on cTECs to evolve mechanisms for an altered peptide generation (Klein et al., 2009).
1.5. MTEC differentiation and promiscuous gene expression (pGE)
In order to render T-cells tolerant to most self-antigens, developing T-cells are presented with a comprehensive repertoire of antigens by thymic APCs including spatially and temporally restricted antigens. It was in 1989 that Linsk et al. proposed that the thymus represents a patch quilt of ectopically expressed genes (Linsk et al., 1989). Efforts since then put forth the present scenario in which a specific subset of thymic stromal cells - mTECs - express a highly diverse set of tissue-restricted antigens (TRAs) representing essentially all tissues of the body, a phenomenon which is known as “promiscuous gene expression” (pGE) (Derbinski et al., 2001; Anderson et al., 2002). This allows self-antigens to become continuously accessible to developing T-cells.
PGE is a characteristic feature of mTECs, though a less pronounced expression of tissues specific transcripts could be detected in other thymic APCs; mTECs show the highest expression of promiscuous genes, followed by cTECs, thymic DCs and macrophages (Gotter et al., 2004; Derbinski et al., 2005). MTECs are highly heterogeneous with regard to ectopic gene expression as only 1-3 % of all mTECs express a given antigen at the protein or mRNA level (Smith et al., 1997; Hanahan, 1998; Derbinski et al., 2001; Klein et al., 2001; Avichezer et al., 2003; Chentoufi et al., 2004; Cloosen et al., 2007; Taubert et al., 2007; Derbinski et al., 2008).
1.5.1. MTEC development
During mouse development, the thymic anlage arises from the third pharyngeal pouch around E10, with the potential to generate both cortical and medullary structures (Bennett et al., 2002). Recent studies indicate that a common TEC progenitor can give rise to both lineages during embryonic thymogenesis and during adulthood (Bleul et al., 2006; Rossi et al., 2006). The early thymus development occurs independently of thymocytes, showing that TEC differentiation is either cell autonomous or involves input from additional non-hematopoietic and/or non-T- lineage hematopoietic cells (Klug et al., 2002; Jenkinson et al., 2005). In addition, it was found that the neural crest-derived mesenchyme and its product, fibroblast growth factor (FGF) is crucial

Introduction
15
for early thymus organogenesis and thymus function (Jenkinson et al., 2003). A member of the forkhead family of transcription factors, Foxn1 is necessary to direct differentiation of bipotential progenitor cells into fully functional TECs and to date is the only marker that identifies early thymic epithelial cell commitment (Nehls et al., 1996; Bleul et al., 2006). Reversion of a conditional allele of Foxn1 to wild-type function in single cells in vivo leads to the formation of either delineated mTEC clusters (“clones”), cTEC clusters or both suggesting the existence of bi- and uni-potent precursors in the postnatal thymus. Hence, from these data one can envisage two scenarios, the first being a self-renewing bipotent precursor that gives rise to two lineage-committed and transient precursors without self-renewing capacity (Figure 3). Alternatively, a committed precursor may have limited self-renewing capacity thus replenishing a finite precursor pool throughout adult-hood without resorting to bipotent TEC stem cells (Anderson et al., 2007).
MTECs can be subdivided into three populations based on their expression of the co-stimulatory molecules CD80, MHCII and the transcriptional regulator Aire with the sequential order of differentiation: CD80loMHCIIloAire- mTECs, CD80hiMHCIIhiAire- mTECs and CD80hiMHCIIhiAire+ mTECs. PGE increases in this order (i.e. the ability to express a larger and more diverse array of TRAs), being highest in Aire+ mTECs (Figure 3). PGE is largely governed by the transcriptional regulator Aire and is crucial for central tolerance (Anderson et al., 2002; Derbinski et al., 2005; Johnnidis et al., 2005; Gray et al., 2007).
There have been debates as to whether MHCIIhi expressing mTECs represent the most mature terminally differentiated cell or immature cell subset. Two models have been proposed: the ‘‘developmental or progressive restriction model’’ contends that immature mTECs transcribe the greatest number and diversity of promiscuous genes, and can be thought of as ‘‘multi-potential.’’ As a consequence of Aire expression, the cells would be provoked to differentiate according to peripheral epithelial cell type specific programs, during which each mTEC would follow one particular pathway and pGE would be progressively restricted to adhere to that program (Gillard and Farr, 2005). An alternative explanation, the ‘‘terminal differentiation model’’, proposes a hierarchy in pGE based on the mTEC differentiation stage: as these cells mature from an Aire-CD80loMHCIIlo (immature) stage to the end-stage Aire+CD80hiMHCIIhi (mature), they would transcribe and display the highest degree and diversity of pGE. According to this model, single mTECs would express TRAs of mixed tissue origin rather than emulating cell lineage-affiliated patterns (Derbinski et al., 2005). In recent years there has been accumulating evidence that strongly supports the ‘‘terminal differentiation model’’. For example Gray and colleagues showed that MHCIIlo mTECs contain actively dividing cells while Aire+ MHCIIhi mTEC cells are post-mitotic and undergo apoptosis within a few days (Gray et al., 2007). The turnover of MHCIIhi mTECs was recently shown to be around 3 weeks (Gabler et al., 2007). This post-mitotic cell population had a longer half-life in the absence of Aire (in Aire-/- mice). Thus, Aire has been implicated in mediating apoptosis in post-mitotic mTECs (Gray et al., 2007; Dooley et

Introduction
16
al., 2008). It remains an unresolved issue why Aire+ mTECs are driven into apoptosis. One possible explanation would be that the overload of the transcription and translation machinery (due to pGE) may lead to apoptosis of Aire+ mTECs and the other would be that Aire promotes DNA double-stranded breaks, that would incite the DNA-damage response, thus providing an explanation for induction of mTEC death (Kyewski and Derbinski, 2004; Ferguson et al., 2008; Abramson et al., 2010).
cTEC
cTEC progenitor
mTEC progenitor
Bipotent progenitor
Apoptosis
?
?
?
?
CD80lo
MHCII lo
Aireneg
mTEC
CD80hi
MHCIIhi
Aireneg
mTEC
CD80hi
MHCIIhi
Airepos
mTEC
LTi
CD4
SP
RANKL CD40/LTα
pGE
Figure 3
Development and differentiation of TEC subpopulations
CTECs and mTECs are derived from a common self-renewing bipotent progenitor that gives rise to two lineage-committed, transient precursors with/without self-renewing capacity. Further, the progenitor differentiates from immature MHCIIlo mTECs to Aire- MHCIIhi mTECs to finally form the mature Aire+ MHCIIhi mTECs. During embryogenesis mTECs receive critical RANKL signals from lymphoid tissue inducer cells. Postnatally the CD4 SP thymocytes provide RANKL, CD40 and lymphotoxin signals. As the mTECs mature, the level of pGE increases and finally terminally differentiated Aire+ MHCIIhi mTECs are driven into apoptosis (Adapted from Tykocinski et al., 2008).
The identification of precursor-progeny relationships and different stages of mTECs that are developmentally connected is important in elucidating the checkpoints that regulate formation of thymic microenvironments and provides an opportunity to identify the molecular mediators. Early TEC development is independent of thymocytes, proper cTEC and mTEC development however requires “cross-talk” with T-cells. Several molecules and pathways have been implicated in mTEC development. The NF-κB pathway plays an important role in mTEC development.

Introduction
17
Inactivation of the TNF receptor-associated factor TRAF6 or the NF-κB complex component RelB and NF-κB inducing kinase (NIK) severely disrupted mTEC development and medulla formation (Burkly et al., 1995; Boehm et al., 2003; Kajiura et al., 2004; Akiyama et al., 2005; Tykocinski et al., 2008). Also, the receptor activator of NF-κB (RANK) expression by mTECs, is directly responsible for differentiation of Aire+ mTECs (Rossi et al., 2007). During fetal thymus development, lymphoid tissue inducer cells were identified as a key population of RANK ligand (RANKL)-expressing cells. Subsequent studies have shown a role for RANK and CD40 in postnatal thymic maintenance and development of adult mTECs (Akiyama et al., 2008; Hikosaka et al., 2008; Irla et al., 2008). Interestingly in the adult thymus both RANKL and CD40L are provided by CD4+CD8- thymocytes (Hikosaka et al., 2008; White et al., 2008). The lymphotoxin-β receptor (LTβ-R) was also initially thought to induce development of Aire+ mTECs (Chin et al., 2003), though others showed that this was not the case although LTβ-R signalling clearly influences some aspects of mTEC development (Boehm et al., 2003; Martins et al., 2008; Seach et al., 2008). Collectively these data imply the persistence of a common TEC progenitor throughout life that can finally differentiate into mature cTEC and mTEC lineages through signalling pathways that are non-redundant but complementary and share common second messengers.
1.5.2. The role of Aire in pGE
The importance of the transcriptional regulator Aire in tolerance was revealed in the genetic analysis of a rare autosomal recessive disorder, autoimmune polyendocrinopathy-candidiasis ectodermal dystrophy (APECED). Over 60 mutations have by now been localized in the AIRE gene of different APECED patients (Mathis and Benoist, 2009). Affected patients develop a spontaneous autoimmune disease targeted primarily at endocrine organs including the parathyroids, adrenals, thyroid, ovaries and pancreatic islets (Vogel et al., 2002). After the generation of Aire-deficient mice, it became clear that Aire is directly linked to central tolerance and loss of Aire resulted in the development of multi-organ immune infiltrates and autoantibodies (Anderson et al., 2002; Ramsey et al., 2002; Kuroda et al., 2005). Within the thymus, several studies have consistently demonstrated that Aire is restricted to mTECs and DCs (Derbinski et al., 2001; Anderson et al., 2002). It was these initial observation that lead to the speculation that Aire might control TRA expression in the thymus (Klein and Kyewski, 2000a). This was confirmed by detailed analysis using microarrays. Aire controls the expression of a large set (hundreds or thousand) of TRAs in mTECs (Anderson et al., 2002; Derbinski et al., 2005; Johnnidis et al., 2005). It was however observed that even lack of a single TRA can result in organ-specific autoimmunity as shown in the case of an eye-specific antigen (IRBP), stomach-specific antigen (Mucin 6) and insulin (DeVoss et al., 2006; Gavanescu et al., 2007; Fan et al., 2009).
Introduction
18
Aire targets an unusually diverse set of genes that are highly enriched in tissue-specific genes and preferentially clustered in the genome. The precise molecular mechanism of Aire’s action is still unclear. It was observed that Aire is necessary but not sufficient for transcription of its target genes in single-mTECs and their expression appears to be stochastic (Derbinski et al., 2008). Moreover, a number of Aire-dependent genes have been identified which are expressed independently of their tissue-specific transcription factors in mTECs. Regulation of these genes thus differs between the peripheral tissue and their ectopic expression in mTECs. It is therefore perhaps not surprising that different transcriptional start sites are used in the thymus and periphery (Villasenor et al., 2008).
Previous studies from several groups show Aire to have multiple potentials (Peterson et al., 2008; Tykocinski et al., 2008; Kyewski and Peterson, 2010). Recently, the Mathis group screened for Aire interaction partners and identified a large set of proteins that associate with Aire. They fell into four major functional classes involving nuclear transport, chromatin binding/structure, transcription and pre-mRNA processing. They speculate that after translocation in the nucleus through the nucleopore complex, Aire preferentially localizes to transcriptionally inert chromatin regions via binding to unmethylated H3/4 tails, thus conferring targeting of specific genes. Within these regions, it interacts with TOP2a to promote DNA double-stranded breaks, activates DNA-PK and other partners and in turn attracts chromatin remodeling complexes. Several of these Aire-interactors might also participate in the so-called ‘‘eviction complex’’ that removes H2A-H2B dimer in front of RNAPII as it proceeds along nucleosome-packaged DNA, and reassembles the octamer behind, thereby enhancing elongation efficiency. Additionally, Aire-containing complex would promote the accumulation of fully mature mRNA by re-activating RNAPII stalled at the 5’ end, by suppressing improperly initiated transcripts, and/or by stabilizing short-lived pre-mRNAs through proper splicing (Abramson et al., 2010).
Two recent papers showed the expression of Aire in peripheral lymphoid stromal cells. Lee et al. described a population of lymph node stromal cells expressing a repertoire of TRA transcripts that overlaps quite a bit, with that of thymic mTECs (Lee et al., 2007). Gardner et al. also found TRA transcripts in stromal cells residing in both the lymph nodes and spleen (Gardner et al., 2008). The repertoire of TRA transcripts in these stromal cells appeared to be of limited diversity and seemed rather distinct from that of thymic mTECs. Till date the physiological relevance of this phenomenon is unknown, though there are speculations that Aire participates in peripheral tolerance.

Introduction
19
1.6. Objective of this study
In view of the essential role of pGE by mTECs in negatively selecting T-cells, this project aimed at studying certain aspects of the regulation of pGE. The scope of central tolerance is to a large extent dictated by the pool of promiscuously expressed genes. Promiscuous genes expressed at sufficient levels will induce self-tolerance. More so, lack of a single TRA can result in spontaneous organ-specific autoimmunity. Therefore, it is important to precisely define the scope of pGE and parameters/mechanisms that regulate this gene pool. Promiscuously expressed genes display two prominent features: they are highly clustered in the genome and show a preference for TRAs. To link these features it was set out to precisely define the genomic organization of this gene pool in mouse, rat and human. In particular, we probed to what extent and according to which rules predefined genomic clusters of TRAs are transcribed in mTEC subsets (immature and mature mTECs). Our analysis proceeded from the bioinformatic definition of TRA clusters, gene clustering and homology mapping via gene expression analysis using whole genome arrays to the in depth analysis of selected TRA clusters by RT-PCR at the population level.
Promiscuous genes expressed in single mTECs is to some degree stochastic with a heterogeneous pattern, that in sum all patterns add up resulting in a constant, complete representation at the population level. Hence, to elucidate: what dictates the pool of pGE at the single cell level, whether it was constraint or random, studies were performed on single mTECs. Gene expression and chromosomal co-localization studies of single mTECs expressing a particular antigen (like Mucin1, MUC1) were carried out. Patterns emerging from these combined studies could yield insights into the evolutionary mechanisms responsible for selecting this gene pool. Conceivably, positional clues in the genome and/or particular properties of self-antigens (e.g. immunogenicity) could have been driving forces during the co-evolution of pGE and adaptive immunity.
Materials and Methods
20
2. Materials and Methods
2.1. Materials
2.1.1. Chemicals
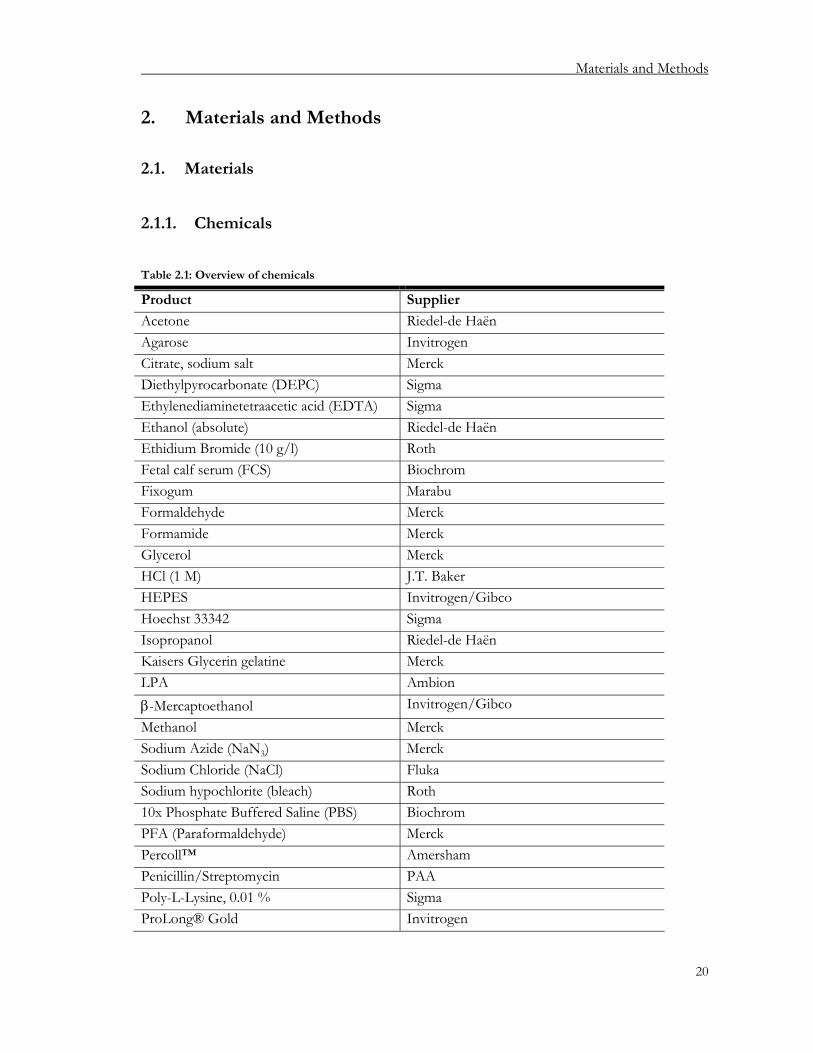
Table 2.1: Overview of chemicals
Product Supplier
Acetone Riedel-de Haën Agarose Invitrogen Citrate, sodium salt Merck Diethylpyrocarbonate (DEPC) Sigma Ethylenediaminetetraacetic acid (EDTA) Sigma Ethanol (absolute) Riedel-de Haën Ethidium Bromide (10 g/l) Roth Fetal calf serum (FCS) Biochrom Fixogum Marabu Formaldehyde Merck Formamide Merck Glycerol Merck HCl (1 M) J.T. Baker HEPES Invitrogen/Gibco Hoechst 33342 Sigma Isopropanol Riedel-de Haën Kaisers Glycerin gelatine Merck LPA Ambion β-Mercaptoethanol Invitrogen/Gibco Methanol Merck Sodium Azide (NaN3) Merck Sodium Chloride (NaCl) Fluka Sodium hypochlorite (bleach) Roth 10x Phosphate Buffered Saline (PBS) Biochrom PFA (Paraformaldehyde) Merck Percoll™ Amersham Penicillin/Streptomycin PAA Poly-L-Lysine, 0.01 % Sigma ProLong® Gold Invitrogen

Materials and Methods
21
Product Supplier
Propidium Iodide Sigma RPMI 1640 Invitrogen/Gibco TetraSpeck™ beads, 0.2 µm Invitrogen Tissue-Tek® Sakura Triton-X-100 Merck Trizol® Invitrogen Trypan Blue Merck Tween 20 Gerbu
2.1.2. Buffers, solutions and media
All solutions were prepared with double distilled water purified by Millipore Milli-Q Plus (Millipore, Billerica, USA). Reagents were sterilized by autoclaving.
2.1.2.1. General buffers and stock solutions
DEPC Water (RNase free) 0.1 % (v/v) DEPC in water. Dissolved over-night under the hood and then autoclaved.
1x TE Buffer Invitrogen
PBS 136 mM NaCl 2.56 mM KCl 10 mM Na2HPO4 1.76 mM KH2PO4 pH 7.2-7.4
2.1.2.2. Immunohistology
PBS/Tween 20 0.1 % (v/v) Tween 20 in 1x PBS, pH 7.2-7.4

Materials and Methods
22
2.1.2.3. Agarose gel electrophoresis
Agarose 1.5 % (w/v) Agarose in 100 ml 1x TAE 5 μl Ethidium Bromide (10 mg/ml)
TAE Buffer 40 mM Tris/Acetate 1 mM EDTA pH 7.5-8.0
2.1.2.4. Isolation of TECs
RPMI 1640 Medium 5 % Fetal Calf Serum (FCS) 10 mM HEPES 2 mM Glutamine 50 μM β-Mercaptoethanol 50 μg/ml Streptomycin 50 U/ml Penicillin
Serum-free RPMI Medium Same supplements as above only without FCS
Collagenase Solution 0.2 mg/ml Collagenase IV 10 mM HEPES 2 % FCS (v/v) in RPMI 1640 medium pH 7.3 (Stored at -20 °C; thawed for the experiment and warmed)
Collagenase/Dispase Solution 0.2 mg/ml Collagenase IV 0.2 mg/ml Dispase Grade I 25 μg/ml DNase 10 mM HEPES 2 % FCS (v/v) in RPMI 1640 medium pH 7.3 (Stored at -20 °C; thawed for the experiment and warmed)

Materials and Methods
23
Trypsin Solution 0.05 % Trypsin 0.5 mM EDTA 0.3 % BSA 50 μg/ml DNase in PBS, pH 7.3 (Stored at -20 °C; thawed for the experiment and warmed)
Percoll Stock 9 parts Percoll (ρ 1.13 g/cm3) 1 part 10x RPMI/HEPES (ρ 1.00 g/cm3) gives ρ 1.117 g/cm3
FACS Buffer 3-5 % FCS (v/v) 0.1 % NaN3 in PBS, pH 7.2-7.4
Trypan Blue 0.2 % Trypan Blue 150 mM NaCl pH 7.0
MACS Buffer 0.5 % BSA (v/v) 5 mM EDTA in PBS, pH 7.2-7.4
2.1.2.5. Illumina expression profiling whole genome BeadArrays
Reagents as described in company protocol (performed by Genomics and Proteomics Core Facility - Dr. B. Korn).
2.1.2.6. µMACS™ SuperAmp™ Technology for Illumina BeadArrays
Reagents as described in TechNote (Pinto et al., 2009).

Materials and Methods
24
2.1.2.7. Fluorescence in situ hybridization
20x SSC 3 M sodium chloride 300 mM trisodium citrate pH 7.0
0.3x PBS 150 ml 1x PBS 500 ml autoclaved Millipore water pH 7.0
4 % Paraformaldehyde/0.3x PBS 4 g PFA 0.3x PBS pH 7.0
0.5 % Triton-X-100/PBS 1 ml Triton-X-100 500 ml 1x PBS
20 % Glycerol/PBS 25 ml Glycerol 500 ml 1x PBS (Store at 4 °C)
0.1 N HCl/H2O 50 ml 1 N HCl 500 ml 1x PBS
50 % Formamide/2x SSC 100 ml Formamide (v/v) 200 ml 2x SSC pH 7.4 (Store at 4 °C)
70 % Formamide/2x SSC 140 ml Formamide (v/v) 200 ml 2x SSC pH 7.0 (Store at 4 °C)
0.2 % Tween 20/4x SSC 1 ml Tween 20 500 ml 4x SSC

Materials and Methods
25
2.1.3. Enzymes and proteins
Table 2.2: Overview of enzymes and proteins
Product Supplier
AmpliTaq Gold Applied Biosystems BSA Sigma Collagenase Type IV Worthington Dispase Grade I (neutral Protease) Worthington DNase (for collagenase/dispase and trypsin Mix)
ICN
DNase I (1U/μl) with 10x buffer and 25 mM EDTA
Invitrogen
DNAaway MβP Electro Zap Ambion FCS Biochrom MuLV Reverse Transcriptase Applied Biosystems Mouse Serum Dianova Power SYBR Green Master Mix Applied Biosystems Proteinase K Merck RedTaqTM
DNA Polymerase (1 U/μl) with
10x buffer Sigma
RNase Block Ribonuclease Inhibitor Stratagene RNase H (2 U/μl) Fermentas RNA Zap Ambion Superase•In (20 U/μl) Ambion SuperScript IITM
Reverse Transcription
(200 U/μl) with 5x buffer and 100 mM DTT
Invitrogen
T4gp32 USB Trypsin (2.5 %) ICN Uracil-DNA Glycosylase (1 U/μl) Eurogentec

Materials and Methods
26
2.1.4. Antibodies, secondary reagents
Table 2.3: Overview of primary and secondary antibodies used for FACS
Antigen Clone Species/
Isotype Conjugate
Reference/
Supplier
CD45 30-F11 Rat IgG2b, κ PerCP Pharmingen CD45 2D1 Mouse IgG1, κ PerCP Pharmingen CD45 OX-1 Mouse IgG1, κ PE-Cy5 Pharmingen CD80 16-10A1 Hamster
IgG2, κ PE Pharmingen
EpCAM GZ1 Mouse IgG1 Alexa 488 BioVendor Laboratory Medicine Inc.
EpCAM HEA125 Mouse IgG1 Biotin G. Moldenhauer, DKFZ Heidelberg
FcR (FcγIII/IIR) 2.4G2 Rat IgG2b, κ Supernatant AG Altevogt, DKFZ Heidelberg
F(ab’)2 anti-Mouse
- Goat IgM (μ chain specific)
RPE SouthernBiotech
gp40 (EpCAM/ Tacstd1)
G8.8 Rat IgG Cy5 (Farr et al., 1991)
His38 - Mouse IgM Ascites Jan Rozing, University of Groningen
HLA-DR L243 Mouse Alexa 647 Alexa 680
G. Moldenhauer, DKFZ Heidelberg
Ly51 (6C3/BP-1 Antigen/Enpep)
6C3 Rat IgG2a, κ FITC Pharmingen
MHC Class II (I-A/I-E)
2G9 Rat IgG2a, κ PE Pharmingen
MUC1 214D4 Mouse IgG1 Alexa 647 Upstate MUC1 214D4 Mouse IgG1 Alexa 647 University of Maastricht RT1B OX-6 Mouse IgG1, κ Purified Pharmingen Streptavidin - - PE Pharmingen TEZ CDR2 Mouse IgG2b Alexa 488 AG Kyewski, DKFZ
Heidelberg

Materials and Methods
27
Table 2.4: Overview of primary and secondary antibodies used for immunohistology
Antigen Clone Species/
Isotype Conjugate
Reference/
Supplier
Keratin 14 AF64 Rabbit Purified Covalence Goat IgG - Rabbit Cy3 Jackson Research
2.1.5. MicroBeads used for MACS purification
Table 2.5: Overview of MACS beads used for cell separation
Name Company
Anti-CD45-Microbeads (Human)
Miltenyi Biotech
Anti-CD45-Dynal Beads (Human) Invitrogen
2.1.6. Conventional PCR
All primers were HPSF-purified and obtained from MWG-Biotech. Almost all primers were designed to cross intron-exon boundaries.
2.1.6.1. Primers for conventional PCR
Table 2.6: Overview of primers for conventional PCR
Primer Name Primer Sequence
Mouse/Rat ß-Actin Primer (348 bp)
Forward 5’- TGG AAT CCT GTG GCA TCC ATG AAA C -3’ Reverse 5’- TAA AAC GCA GCT CAG TAA CAG TCC G -3’ Annealing-Temperature 55 °C Human ß-Actin Primer (208 bp)
Forward 5’- CGT GGA CAT CCG TAA AGA CC -3’ Reverse 5’- ACA TCT GCT GGA AGG TGG AC -3’ Annealing-Temperature 58 °C

Materials and Methods
28
2.1.6.2. Real-time PCR primers
Mouse gene expression analysis:
Table 2.7: Overview of primers for mouse gene expression analysis with real-time PCR
Primer Name and Conc. (µM/µM)
Primer Sequence
5430425J12Rik (300/300)
Forward 5’- CAC CCT TGA GAA CCA ACT TTC C -3’ Reverse 5’- TGC CCT AGG CCC ACT TTG -3’ Aire (300/900)
Forward 5’- GTA CAG CCG CCT GCA TAG C -3’ Reverse 5’- CCC TTT CCG GGA CTG GTT TA -3’ Brd9 (900/300)
Forward 5’- AGT GAG AGC CTG CCG AAC AC -3’ Reverse 5’- CTC TGT AGC TGG CGG AGG AA -3’ Cep72 (900/900)
Forward 5’- GAG TCT GACT ACC GCC TGT TTG T -3’ Reverse 5’- TTC TCT CAC AGG ACG GTC ATC TAG -3’ Clptm1l (900/900)
Forward 5’- CCA ACT GCA TCC AGC CCT AT -3’ Reverse 5’- GAC CGT GTG GTG GTG TAA ACA C -3’ Csnb (300/900)
Forward 5’- TGT GCT CCA GGC TAA AGT TCA CT -3’ Reverse 5’- GGT TTG AGC CTG AGC ATA TGG -3’ Ins2 (300/300)
Forward 5’- CAC CAG CCC TAA GTG ACT CG -3’ Reverse 5’- ATC CAC AGG GCC ATG TTG AA -3’ Irx1 (300/50)
Forward 5’- ACC CTC ACA CAG GTC TCC AC -3’ Reverse 5’- TCG ATG TCA ATG CTC TCC AG -3’ Irx2 (50/300)
Forward 5’- GAA CAC CGA AAG AAC CCG TA -3’ Reverse 5’- CAT CCT GTG CCT TGT CTG AA -3’ Irx4 (900/900)
Forward 5’- CCC GTC TAC TGC CCT GTC TA -3’ Reverse 5’- TCC TTG GAC TCG AAG CTG TT -3’

Materials and Methods
29
Primer Name and Conc. (µM/µM)
Primer Sequence
Lpcat1 (300/300)
Forward 5’- TGG AGG AAG GTC GTG GAC TT -3’ Reverse 5’- GAA GCC GCC AGC AAA CC -3’ Mrpl36 (900/900)
Forward 5’- GAG GTG CGC TCA GTT CTC TGT -3’ Reverse 5’- TTG ATG ACA CCT TTG GTT TTG AA -3’ Ndufs6 (900/900)
Forward 5’- TTG TAG ATC GTC AGA AAG AGG TGA A -3’Reverse 5’- GCG GTG CTC CAC CTC ATT -3’ Nkd2 (900/300)
Forward 5’- CCT GAT GCA CAC CAT CTA CG -3’ Reverse 5’- CAA TCT CTG TTC TGC CAC GA -3’ Slc12a7 (900/900)
Forward 5’- GCG TCC ACG CTT CAA GTT C -3’ Reverse 5’- CAG CGC GAG GCA GAG ACT -3’ Slc6a18 (900/900)
Forward 5’- TTT GAG GGT ATC CCG CTT TTC -3’ Reverse 5’- GCC TAC GCC ACC GAG GTA -3’ Slc6a19 (900/900)
Forward 5’- CAT CAG TGA CTC AGG CTC CA -3’ Reverse 5’- CCA CGG ATG AGA AAG ATG GT -3’ Slc6a3 (900/900)
Forward 5’- TGG CTT CGT TGT CTT CTC CT -3’ Reverse 5’- CAG CTG GAA CTC ATC GAC AA -3’ Tert (900/900)
Forward 5’- TGT TGG TGA CGC CTC ACT TG -3’ Reverse 5’- CAT ACT CAG GAA CGC CAT GGA -3’ Tppp (900/300)
Forward 5’- TCT CTG GCG TCA CGA AAG CT -3’ Reverse 5’- TTG GTC GAA ACG CTC CTT GT -3’ Trip13 (900/900)
Forward 5’- TTC CTG GCT CAT GCT CTC TAC A -3’ Reverse 5’- TGT TTG TCC ACT GCC AGA GAT AG -3’ Ubc (300/900)
Forward 5’- CAC CAG CCC TAA GTG ACT CG -3’ Reverse 5’- ATC CAC AGG GCC ATG TTG AA -3’

Materials and Methods
30
Primer Name and Conc. (µM/µM)
Primer Sequence
Zdhhc11 (50/50)
Forward 5’- CGA CAG GTC CAA ACA CAC AC -3’ Reverse 5’- ACA CCA AGA ATC CCA ACT GC -3’
Rat gene expression analysis:
Table 2.8: Overview of primers for rat gene expression analysis with real-time PCR
Primer Name and Conc. (µM/µM)
Primer Sequence
Aire (900/300)
Forward 5’- TCT GGC CTC AAA GAG CAT CTC T -3’ Reverse 5’- TTG CCC TCT GGC TTC TTA GG -3’ Hprt (900/900)
Forward 5’- GCC CTT GAC TAT AAT GAG CAC TTC A -3’ Reverse 5’- TCT TTT AGG CTT TGT ACT TGG CTT TT -3’ Ins2 (900/900)
Forward 5’- GCC CAG GCT TTT GTC AAA CA -3’ Reverse 5’- TCC CCA CAC ACC AGG TAG AGA -3’
Human gene expression analysis:
Table 2.9: Overview of primers for human gene expression analysis with real-time PCR
Primer Name and Conc. (µM/µM)
Primer Sequence
AC007405.6-202 (50/900)
Forward 5’- AAG AAT ACT CAG GCC CCA CTA GAG -3’ Reverse 5’- CCT TGG CCT CAG GAT TTT CTG -3’ ACBD5 (900/300)
Forward 5’- TGA AGT CAA GCA TGG AGG AGA A -3’ Reverse 5’- CAA GTG TTG CAT CCT ATG TCC TCT T -3’
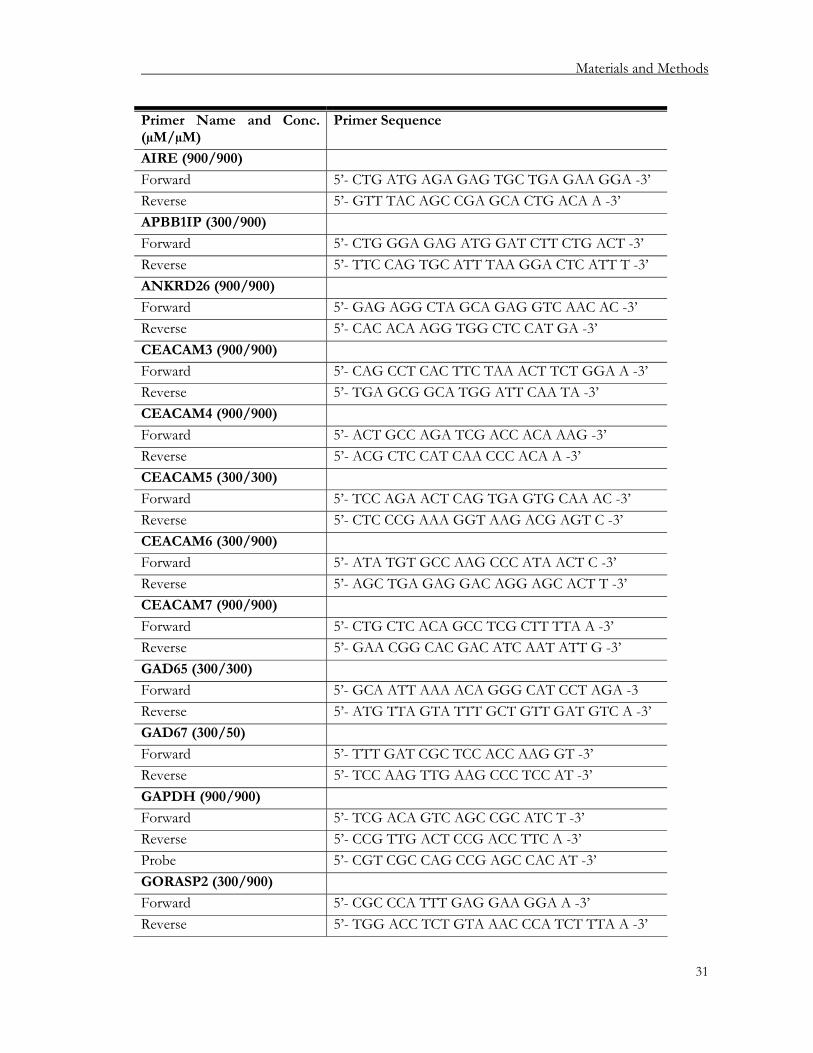
Materials and Methods
31
Primer Name and Conc. (µM/µM)
Primer Sequence
AIRE (900/900)
Forward 5’- CTG ATG AGA GAG TGC TGA GAA GGA -3’ Reverse 5’- GTT TAC AGC CGA GCA CTG ACA A -3’ APBB1IP (300/900)
Forward 5’- CTG GGA GAG ATG GAT CTT CTG ACT -3’ Reverse 5’- TTC CAG TGC ATT TAA GGA CTC ATT T -3’ ANKRD26 (900/900)
Forward 5’- GAG AGG CTA GCA GAG GTC AAC AC -3’ Reverse 5’- CAC ACA AGG TGG CTC CAT GA -3’ CEACAM3 (900/900)
Forward 5’- CAG CCT CAC TTC TAA ACT TCT GGA A -3’ Reverse 5’- TGA GCG GCA TGG ATT CAA TA -3’ CEACAM4 (900/900)
Forward 5’- ACT GCC AGA TCG ACC ACA AAG -3’ Reverse 5’- ACG CTC CAT CAA CCC ACA A -3’ CEACAM5 (300/300)
Forward 5’- TCC AGA ACT CAG TGA GTG CAA AC -3’ Reverse 5’- CTC CCG AAA GGT AAG ACG AGT C -3’ CEACAM6 (300/900)
Forward 5’- ATA TGT GCC AAG CCC ATA ACT C -3’ Reverse 5’- AGC TGA GAG GAC AGG AGC ACT T -3’ CEACAM7 (900/900)
Forward 5’- CTG CTC ACA GCC TCG CTT TTA A -3’ Reverse 5’- GAA CGG CAC GAC ATC AAT ATT G -3’ GAD65 (300/300)
Forward 5’- GCA ATT AAA ACA GGG CAT CCT AGA -3 Reverse 5’- ATG TTA GTA TTT GCT GTT GAT GTC A -3’ GAD67 (300/50)
Forward 5’- TTT GAT CGC TCC ACC AAG GT -3’ Reverse 5’- TCC AAG TTG AAG CCC TCC AT -3’ GAPDH (900/900)
Forward 5’- TCG ACA GTC AGC CGC ATC T -3’ Reverse 5’- CCG TTG ACT CCG ACC TTC A -3’ Probe 5’- CGT CGC CAG CCG AGC CAC AT -3’ GORASP2 (300/900)
Forward 5’- CGC CCA TTT GAG GAA GGA A -3’ Reverse 5’- TGG ACC TCT GTA AAC CCA TCT TTA A -3’

Materials and Methods
32
Primer Name and Conc. (µM/µM)
Primer Sequence
GPR158 (900/900)
Forward 5’- CCG ATC TGG ATC CTA CCT GA -3’ Reverse 5’- CGT AAT GCG TCT CAT GAT GG -3’ HMG1L4P (900/900)
Forward 5’- AAC TTG TCG GGA GGA GTG TAA GAA -3’ Reverse 5’- ATG GCC TTC CAC CTC TCT GA -3’ INS (900/300)
Forward 5’- GCA GCC TTT GTG AAC CAA CA -3’ Reverse 5’- GTG TGT AGA AGA AGC CTC GTT CC -3’ PDSS1 (300/900)
Forward 5’- GCA CAC TAC CTT GAG AAG ACA TTC A -3’ Reverse 5’- ACA TCC TAG AAC AGA GAC ATA CTG CTT
T -3’ MASTL (900/300)
Forward 5’- CGT TGA TGA TGG GCG AAT TC -3’ Reverse 5’- TTC TGG CCA AGG GAT ATC ATG -3’ METTL8 (50/300)
Forward 5’- TGA TGT ATG TGA TGA TGG CTT ACC T -3’ Reverse 5’- TTA CAA CAC CTT GCA TCC TGT CA -3’ MUC1 (300/300)
Forward 5’- CTT TCT TCC TGC TGC TGC TCC T -3’ Reverse 5’- AGC CGA AGT CTC CTT TTC TCC A -3’ Probe 5’- AGC TTG CAT GAC CAG AAC CTG TAA CAA
CTG T -3’ MUC4 (900/300)
Forward 5’- AGA GGT ATC GCC CTG ATA GAT TCC -3’ Reverse 5’- ACG GTA GTT GGG CCT TTC TTC -3’ MYH6 (900/300)
Forward 5’- TTC TCC GTG AAG GGA TAA CC -3’ Reverse 5’- CGT CTT CCC ATT CTC GGT TTC AGC -3’ MYH7 (900/900)
Forward 5’- GGC CCC TTT CCT CAT CTG TAG -3’ Reverse 5’- CGG TCA CTG TCT TGC CAT ACT CAG -3’ MYO3A (300/50)
Forward 5’- CTA GCT GAC CTT CAT CCC ATG AG -3’ Reverse 5’- GAA GTC ATT GAA TTC TGC TGA CCA T -3’
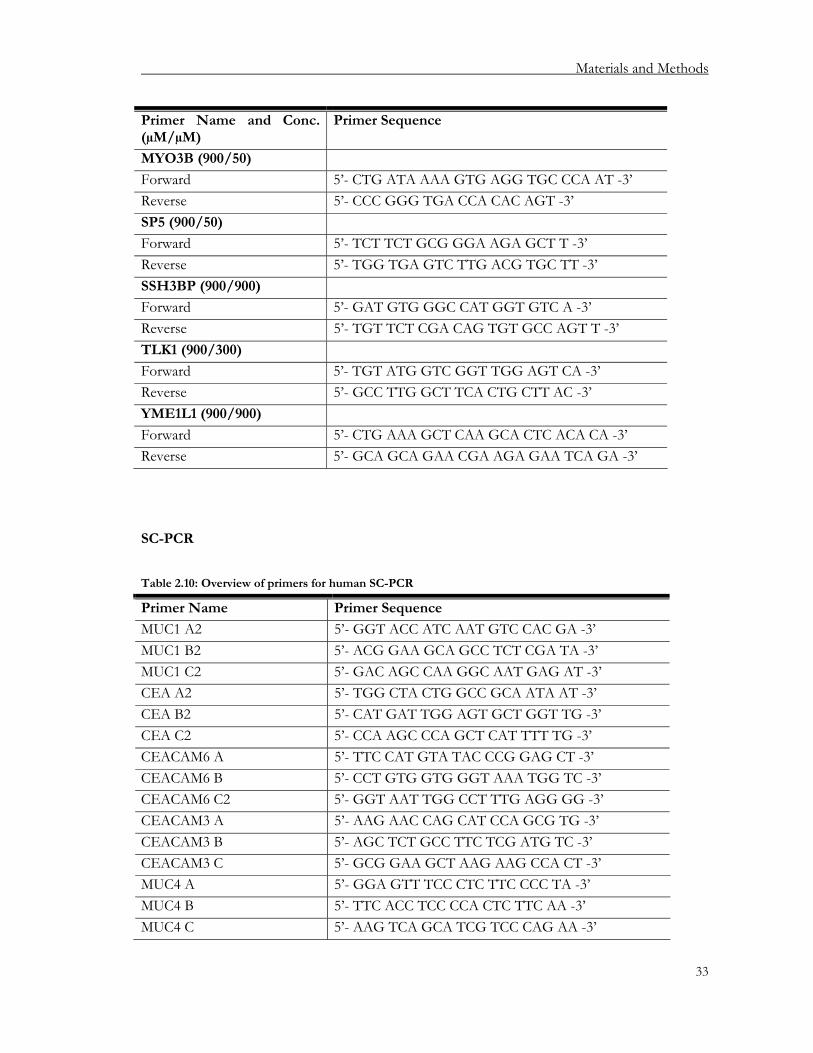
Materials and Methods
33
Primer Name and Conc. (µM/µM)
Primer Sequence
MYO3B (900/50)
Forward 5’- CTG ATA AAA GTG AGG TGC CCA AT -3’ Reverse 5’- CCC GGG TGA CCA CAC AGT -3’ SP5 (900/50)
Forward 5’- TCT TCT GCG GGA AGA GCT T -3’ Reverse 5’- TGG TGA GTC TTG ACG TGC TT -3’ SSH3BP (900/900)
Forward 5’- GAT GTG GGC CAT GGT GTC A -3’ Reverse 5’- TGT TCT CGA CAG TGT GCC AGT T -3’ TLK1 (900/300)
Forward 5’- TGT ATG GTC GGT TGG AGT CA -3’ Reverse 5’- GCC TTG GCT TCA CTG CTT AC -3’ YME1L1 (900/900)
Forward 5’- CTG AAA GCT CAA GCA CTC ACA CA -3’ Reverse 5’- GCA GCA GAA CGA AGA GAA TCA GA -3’
SC-PCR
Table 2.10: Overview of primers for human SC-PCR
Primer Name Primer Sequence
MUC1 A2 5’- GGT ACC ATC AAT GTC CAC GA -3’ MUC1 B2 5’- ACG GAA GCA GCC TCT CGA TA -3’ MUC1 C2 5’- GAC AGC CAA GGC AAT GAG AT -3’ CEA A2 5’- TGG CTA CTG GCC GCA ATA AT -3’ CEA B2 5’- CAT GAT TGG AGT GCT GGT TG -3’ CEA C2 5’- CCA AGC CCA GCT CAT TTT TG -3’ CEACAM6 A 5’- TTC CAT GTA TAC CCG GAG CT -3’ CEACAM6 B 5’- CCT GTG GTG GGT AAA TGG TC -3’ CEACAM6 C2 5’- GGT AAT TGG CCT TTG AGG GG -3’ CEACAM3 A 5’- AAG AAC CAG CAT CCA GCG TG -3’ CEACAM3 B 5’- AGC TCT GCC TTC TCG ATG TC -3’ CEACAM3 C 5’- GCG GAA GCT AAG AAG CCA CT -3’ MUC4 A 5’- GGA GTT TCC CTC TTC CCC TA -3’ MUC4 B 5’- TTC ACC TCC CCA CTC TTC AA -3’ MUC4 C 5’- AAG TCA GCA TCG TCC CAG AA -3’
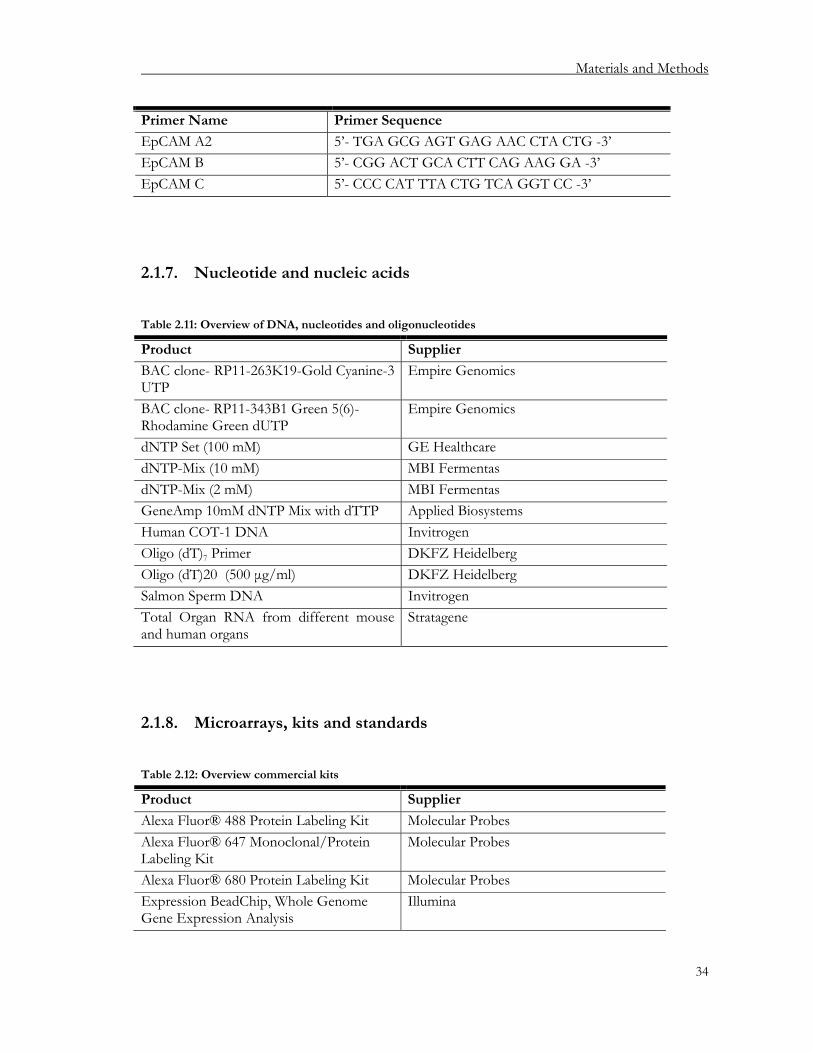
Materials and Methods
34
Primer Name Primer Sequence
EpCAM A2 5’- TGA GCG AGT GAG AAC CTA CTG -3’ EpCAM B 5’- CGG ACT GCA CTT CAG AAG GA -3’ EpCAM C 5’- CCC CAT TTA CTG TCA GGT CC -3’
2.1.7. Nucleotide and nucleic acids
Table 2.11: Overview of DNA, nucleotides and oligonucleotides
Product Supplier
BAC clone- RP11-263K19-Gold Cyanine-3 UTP
Empire Genomics
BAC clone- RP11-343B1 Green 5(6)-Rhodamine Green dUTP
Empire Genomics
dNTP Set (100 mM) GE Healthcare dNTP-Mix (10 mM) MBI Fermentas dNTP-Mix (2 mM) MBI Fermentas GeneAmp 10mM dNTP Mix with dTTP Applied Biosystems Human COT-1 DNA Invitrogen Oligo (dT)7 Primer DKFZ Heidelberg Oligo (dT)20 (500 μg/ml) DKFZ Heidelberg Salmon Sperm DNA Invitrogen Total Organ RNA from different mouse and human organs
Stratagene
2.1.8. Microarrays, kits and standards
Table 2.12: Overview commercial kits
Product Supplier
Alexa Fluor® 488 Protein Labeling Kit Molecular Probes Alexa Fluor® 647 Monoclonal/Protein Labeling Kit
Molecular Probes
Alexa Fluor® 680 Protein Labeling Kit Molecular Probes Expression BeadChip, Whole Genome Gene Expression Analysis
Illumina

Materials and Methods
35
Product Supplier
GeneRulerTM 100 bp DNA Ladder plus (0.5 µg/µl)
MBI Fermentas
High Pure RNA Isolation Kit Roche Illumina® TotalPrep RNA Amplification Kit
Ambion
Power SYBR Green Applied Biosystems qPCRTM Core Kit for SYBR™ Green I Eurogentec qPCRTM Core Kit Eurogentec RNeasy® Mini Kit Qiagen
2.1.9. Instruments
Table 2.13: Overview of equipment
Product Supplier
Agilent 2100 Bioanalyzer Agilent Technologies AutoMACSTM Pro Separator Miltenyi Biotech BD FACSAriaTM (SOP) Cell Sorter Becton Dickinson BD FACSCantoTM Flow Cytometer Becton Dickinson BD FACSVantageTM SE Cell Sorter Becton Dickinson CCD Camera (Cosmicar) Pentax Centrifuge Rotatanta 460 R Hettich Cryostat (CM 3050 S) Leica Gel electrophoresis Camera AGS GeneAmp® 7300 Sequence Detector ABI GeneArray Scanner Hewlett-Packard Heating Block Grant/Eppendorf Homogenisator (Ultra-Turrax® T25) IKA Incubator HeraCell 240 Heraeus Leica CM 1900 Cryostat Leica Leica TCS SP5 Leica Magnetic bar (MR 2000) Heidolph Microscope Axio Imager.Z1 Zeiss Nano Drop® 1000 photometer Thermo Scientific PCR-Machine (PTC-100™) MJ Research Power Supply (EPS 500/ 400) Pharmacia

Materials and Methods
36
Product Supplier
Quadro MACS® separator Miltenyi Biotech Sterile Hood HeraSafe Typ KS12 Kendro Table Centrifuge (Biofuge fresco) Heraeus UV Table Konrad Benda Water Bath (Thermomix® M) Braun Zeiss Axio Imager.Z1 fluorescence microscope
Zeiss
2.1.10. Consumables
Table 2.14: Overview of consumables
Product Supplier
ABI PRISM 96-well Optical Reaction Plate and Optical Caps
Applied Biosystems
AutoMACS columns Miltenyi Biotech Cell-Strainer-Cap-Tubes (5 ml) Becton Dickinson Centrifuge tubes (15 ml and 50 ml) TPP Coverslips, all sizes Lankenbrinck Filter tipps (10 μl, 20 μl, 200 μl and 1000 μl)
Starlabs
Gauze (PA-60 Nybolt) Eckert Glass slides (Histobond) Marienfeld Laborglas MicroAmp Optical Adhesive Film Applied Biosystems MicroSpinTM G-50 columns Amersham Multi-pipets (0.1 ml, 0.2 ml, 0.5 ml, 2.5 ml and 5 ml)
Eppendorf
Neubauer chamber Blau Brand Pasteur pipets WU-Mainz PCR reaction tubes (200 μl) Biozym Petri dishes (all sizes) TPP Round-bottom screw-cap tube (sterile) Nunc Round bottom tubes (13 ml) Becton Dickinson Safe-Lock reaction tubes (0.5-2 ml) Eppendorf Sterile filters (0.2 μm and 0.45 μm) Millipore Strips of 8 thermo tubes-Ultra Clear Cap Strips
Abgene

Materials and Methods
37
Product Supplier
Strips of 8 tubes, thin wall micro test tubes, 0.2 ml and Domed cap for thin wall micro test tubes 0.2 ml, stripes of 8 caps
Nerbe
Syringes (10 ml and 50 ml) Terumo Thermo-Fast® 96 Detection Plate Abgene
2.1.11. Software
Table 2.15: Overview of software used
Software Company
AxioVision 4.5 Zeiss Amplify 3.1.4 Freeware BD FACSDiva Becton Dickinson BeadStudio 3.1 Illumina Bioconductor Freeware ChromasLite Freeware ClustalW Freeware EditSeq 5.06 DNAStar FlowJo 8.6 Tree Star GeneAmp 7300 SDS Software Applied Biosystems Image J National Institutes of Health, USA LAS AF Lite Leica LinRegPCR LinRegPCR MatLab The MathWorks Inc. Microsoft Office Microsoft Primer ExpressTM 1.0 Applied Biosystems Applied Biosystems Primer ExpressTM 2.0 Applied Biosystems Applied Biosystems R Project Freeware

Materials and Methods
38
2.1.12. Mouse, rat and human material
C57BL/6 mice and SD rats were bought from Charles River Wiga (females, 3-4 weeks old) and were used for organ preparations at the age of 5-6 weeks.
The Aire knock-out (KO) mice were bred in the barrier of the central animal facility at the DKFZ. The mice were originally from Peltonen’s lab. All mice were kept under specific pathogen-free conditions at the animal facility of the German Cancer Research Center.
Human thymus samples for this study were obtained in the course of corrective cardiac surgery at the Department of Cardiac Surgery, Medical School, University of Heidelberg headed by Prof. Dr. med. Matthias Karck. This study has been approved by the Ethics Committee of the University of Heidelberg.
Table 2.16: List of individuals from which thymic samples were studied
Human Sample Number Gender Age
14 male 4 months 24 female 2 months 32 male 2 months 53 male 2 months 55 male 7 days 59 male 7 days 72 male 5 days 74 female 3 years 76 male 6 months 77 male 4 months 83 male 7 months 87 female 4 months 88 female 3 months 89 male 7 days 92 male 5 months 93 female 8 months 94 male 2 months 96 female 3.5 months 97 female 4 months 101 female 5 months 102 female 10 months 103 female 3 months

Materials and Methods
39
Human Sample Number Gender Age
104 male 3 days 105 female 7 days 106 male 9 months 108 male 7 days 109 male 14 days

Materials and Methods
40
2.2. Methods
2.2.1. Antibody labeling
Table 2.17: List of antibodies conjugated using labeling kits
Antibodies Conjugate Kits
anti-mouse EpCAM Alexa 647 Alexa Fluor® 647 Protein Labeling Kit anti-rat EpCAM Alexa 488 Alexa Fluor® 488 Protein Labeling Kit anti-rat MHCII Alexa 647 Alexa Fluor® 647 Protein Labeling Kit anti-human CDR2 Alexa 488 Alexa Fluor® 488 Protein Labeling Kit anti-human HLA-DR Alexa 647
Alexa 680 Alexa Fluor® 647 Protein Labeling Kit Alexa Fluor® 680 Protein Labeling Kit
anti-human MUC1 Alexa 647 Alexa Fluor® 647 Monoclonal Labeling Kit
All conjugations were performed using labeling kits from Invitrogen and according to the manufacturer’s instructions, in which 1 mg/ml antibody was used for the protein labeling kit, while 100 µg/100 µl antibody was labeled using the monoclonal antibody kit.
2.2.2. Immunohistochemistry
2.2.2.1. Organ preparation for cryosections
After the removal of the thymus from the thorax of the mouse or rat, the organ was embedded in a plastic mold with Tissue-Tek® and gradually frozen on dry ice. The organ was then preserved at -80 °C until further use.
5 µm cryosections were cut at -22 °C to -24 °C using the Leica CM 1900 Cryostat. The sections were then dried over-night on Histobond® slides.
Materials and Methods
41
2.2.2.2. Immunohistochemical staining
The tissue sections were fixed with Acetone (-20 °C) for 10 min at room temperature. Subsequently they were air dried and encircled using a Pap pen. The slides were then washed for 5 min in 1x PBS pH 7.4 at room temperature and blocked with 3 % BSA/1x PBS for 20 min at room temperature in a humidity chamber. After washing the slides with 1x PBS/0.1 % Tween for 10 min at room temperature, the primary antibody (diluted with PBS and centrifuged) was added and incubated for 30 min at 37 °C and then 30 min at room temperature in a humidity chamber. The slides were then washed once in 1x PBS/0.1 % Tween for 5 min and twice in 1x PBS pH 7.4 for 5 min each and then briefly rinsed in distilled water. The secondary antibody was treated in the same way as the primary antibody. After incubation for 30 min at 37 °C and 30 min at room temperature in a dark humidity chamber, the slides were washed as prior. In some cases, the sections were counter stained with Hoechst 33342 for 2 min and washed as mentioned above. All samples were embedded with warm Kaiser’s Glycerol Gelatine and covered with coverslips. Images were taken with a Zeiss Axio Imager Z.1 fluorescence microscope. Immunohistochemical staining was performed to establish the staining of the anti-His38 ascites and anti-MHCII on rat thymus (Figure 4).

Materials and Methods
42
Figure 4
Immunohistochemical staining with the anti-His38 ascites and anti-MHCII mAb on rat thymus
(A) MHCII antibody labeled with Alexa 647 stained the rat medulla more intensely than the cortex (40x).
(B) His38 ascites-Cy3 stained the rat thymic cortex and the outer cortex (C) just below the thymic capsule (20x). Marking: M = medulla; C = cortex.
M
C
C
M
M
C
M
C
C
M
M
C
A
B
C
Materials and Methods
43
2.2.3. Isolation of thymic epithelial cells
2.2.3.1. Isolation of mouse thymic epithelial cells
2.2.3.1.1. Enzymatic digestion of mouse thymic tissue
Mice were killed with CO2 and the thymi were removed from the thorax into a petri plate filled with RPMI 1640 medium (containing 5 % FCS) on ice. Residual fat and connective tissue if any were removed from the thymi. The thymi were then cut into small pieces and stirred in a round-bottom tube containing ~20-25 ml medium at low speed on a magnetic stirrer for 10-15 min at room temperature. The supernatant containing thymocytes was decanted and the remaining tissue was further digested until complete dissociation into a single cell suspension. The tissue was digested thrice with 10 ml collagenase for 15 min each at 37 °C, thrice with collagenase/dispase for 25 min each at 37 °C and two-three rounds of trypsin for 20 min each at 37 °C in a water bath with magnetic stirring. During the digestion steps, the tissue was agitated regularly with a pasteur pipet. After each digestion step, the supernatant was collected separately on ice and washed in RPMI 1640 medium containing 5 % FCS (1400 rpm for 5 min at 4 °C). The cell pellet was then resuspended in 10 ml RPMI 1640 medium containing 5 % FCS and kept on ice. The cells from each fraction were then counted and depending on the cell count, usually from the 2nd collagenase/dispase fraction till the last trypsin fraction, were pooled and filtered through 60 µm gauze.
2.2.3.1.2. Enrichment of mouse TECs using density gradients
In order to enrich for TECs, density gradients were used, as described below. After pooling the digestion fractions the cells were washed twice (1400 rpm for 5 min at 4 °C) in RPMI 1640 medium without FCS. In the meanwhile, the various density solutions were prepared as described in Table 2.18. The cell pellet was then suspended in Percoll stock/RPMI, ρ = 1.07 g/cm3, over which, the other two gradient layers (6 ml of Percoll stock/RPMI, ρ = 1.045 g/cm3 and 6 ml of medium (-FCS), ρ = 1.00 g/cm3) were carefully added using a glass pasteur pipet. Not more that 5 x 10⁸ cells were used for one gradient. The gradients were then centrifuged at 4000 rpm (3500 g, Hettich Rotanta 460R; without breaks) at 4 °C for 30 min.
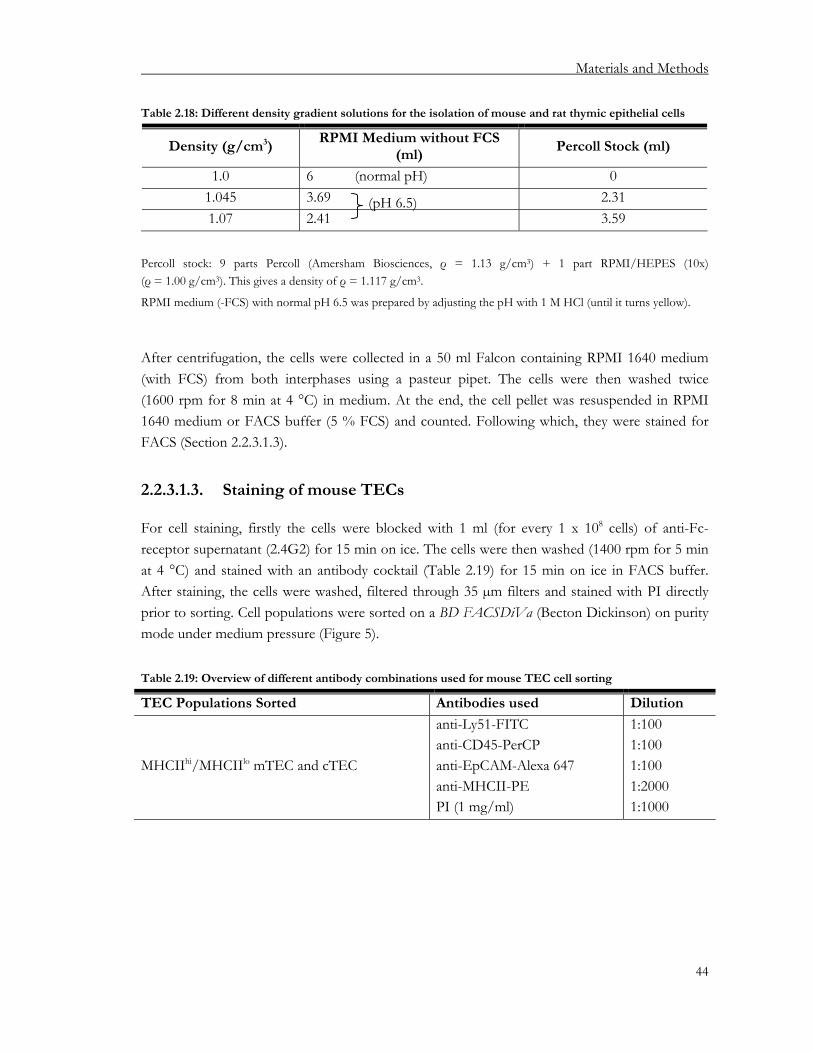
Materials and Methods
44
Table 2.18: Different density gradient solutions for the isolation of mouse and rat thymic epithelial cells
Density (g/cm3) RPMI Medium without FCS
(ml) Percoll Stock (ml)
1.0 6 (normal pH) 0 1.045 3.69 2.31 1.07 2.41 3.59
Percoll stock: 9 parts Percoll (Amersham Biosciences, ρ = 1.13 g/cm3) + 1 part RPMI/HEPES (10x) (ρ = 1.00 g/cm3). This gives a density of ρ = 1.117 g/cm3.
RPMI medium (-FCS) with normal pH 6.5 was prepared by adjusting the pH with 1 M HCl (until it turns yellow).
After centrifugation, the cells were collected in a 50 ml Falcon containing RPMI 1640 medium (with FCS) from both interphases using a pasteur pipet. The cells were then washed twice (1600 rpm for 8 min at 4 °C) in medium. At the end, the cell pellet was resuspended in RPMI 1640 medium or FACS buffer (5 % FCS) and counted. Following which, they were stained for FACS (Section 2.2.3.1.3).
2.2.3.1.3. Staining of mouse TECs
For cell staining, firstly the cells were blocked with 1 ml (for every 1 x 10⁸ cells) of anti-Fc-receptor supernatant (2.4G2) for 15 min on ice. The cells were then washed (1400 rpm for 5 min at 4 °C) and stained with an antibody cocktail (Table 2.19) for 15 min on ice in FACS buffer. After staining, the cells were washed, filtered through 35 µm filters and stained with PI directly prior to sorting. Cell populations were sorted on a BD FACSDiVa (Becton Dickinson) on purity mode under medium pressure (Figure 5).
Table 2.19: Overview of different antibody combinations used for mouse TEC cell sorting
TEC Populations Sorted Antibodies used Dilution
MHCIIhi/MHCIIlo mTEC and cTEC
anti-Ly51-FITC anti-CD45-PerCP anti-EpCAM-Alexa 647 anti-MHCII-PE PI (1 mg/ml)
1:100 1:100 1:100 1:2000 1:1000
(pH 6.5)

Materials and Methods
45
Figure 5
Sort gates for the isolation of mouse MHCIIhi and MHCIIlo mTECs
The mouse mTEC and cTEC cell populations were separated using anti-Ly51 and anti-EpCAM mAbs. The mTECs were further differentiated into mature and immature subsets using anti-MHCII mAbs.
2.2.3.2. Isolation of rat thymic epithelial cells
2.2.3.2.1. Enzymatic digestion of rat thymic tissue
Rats were killed with CO2 and the thymi were removed from the thorax into a Petri plate filled with RPMI 1640 medium (containing 5 % FCS) on ice. The digestion steps for the isolation of thymic epithelial cells from rat were the same as performed in mice (Section 2.2.3.1.1).
2.2.3.2.2. Enrichment of rat TECs using density gradients
For the enrichment of rat TECs, density gradients were used as those in mice (Section 2.2.3.1.2), only that separate gradients were performed for the collagenase/dispase and trypsin fractions. Depending on the cell number, either both or the upper interphase of the collagenase/dispase gradients were added to both interphases of the trypsin gradients.
2.2.3.2.3. Staining of rat TECs
The cell staining was performed as described in Table 2.20. Cells were washed, filtered through 35 µm filters and stained with PI directly prior to sorting. Cell populations were sorted on a BD FACSDiVa (Becton Dickinson) on purity mode under medium pressure (Figure 6).

Materials and Methods
46
Table 2.20: Overview of blocking/staining scheme and different antibody combinations used for rat
thymus cell sorting
Steps
1 2 3 Block Goat Serum
His38 Ascites 1:500 for 30 min
Goat anti-mouse IgM-PE (1:200) Block
Mouse Serum
anti-EpCAM-Alexa 488 (1:100) anti-CD45-CyChrome (1:100) anti-MHCII-Alexa 647 (1:1500) PI (1 mg/ml, 1:1000)
Figure 6
Sort gates for the isolation of rat MHCIIhi and MHCIIlo mTECs
The rat mTEC and cTEC cell populations were separated using anti-His38 ascites and anti-EpCAM mAbs. The mTECs were further differentiated into mature and immature subsets using anti-MHCII mAbs.
2.2.3.3. Isolation of human thymic epithelial cells
2.2.3.3.1. Enzymatic digestion of human thymic tissue
Human thymus samples for this study were obtained in the course of corrective cardiac surgery at the Department of Cardiac Surgery, Medical School, University of Heidelberg headed by Prof. Dr. med. Matthias Karck. This study has been approved by the Ethics Committee of the University of Heidelberg. The age of the children for this study ranges from 3 days to 3 year.
The thymus samples directly after removal were slit (to facilitate oxygenation) and transported in RPMI 1640 medium (containing 5 % FCS) on ice. The tissue was then cut into small pieces and stirred in a 250 ml conical flask containing ~50-60 ml RPMI 1640 medium at low speed on a magnetic stirrer for 10 min at 4 °C. This step was repeated twice, after each step the supernatant containing thymocytes was decanted. The remaining tissue was divided into two 100 ml conical
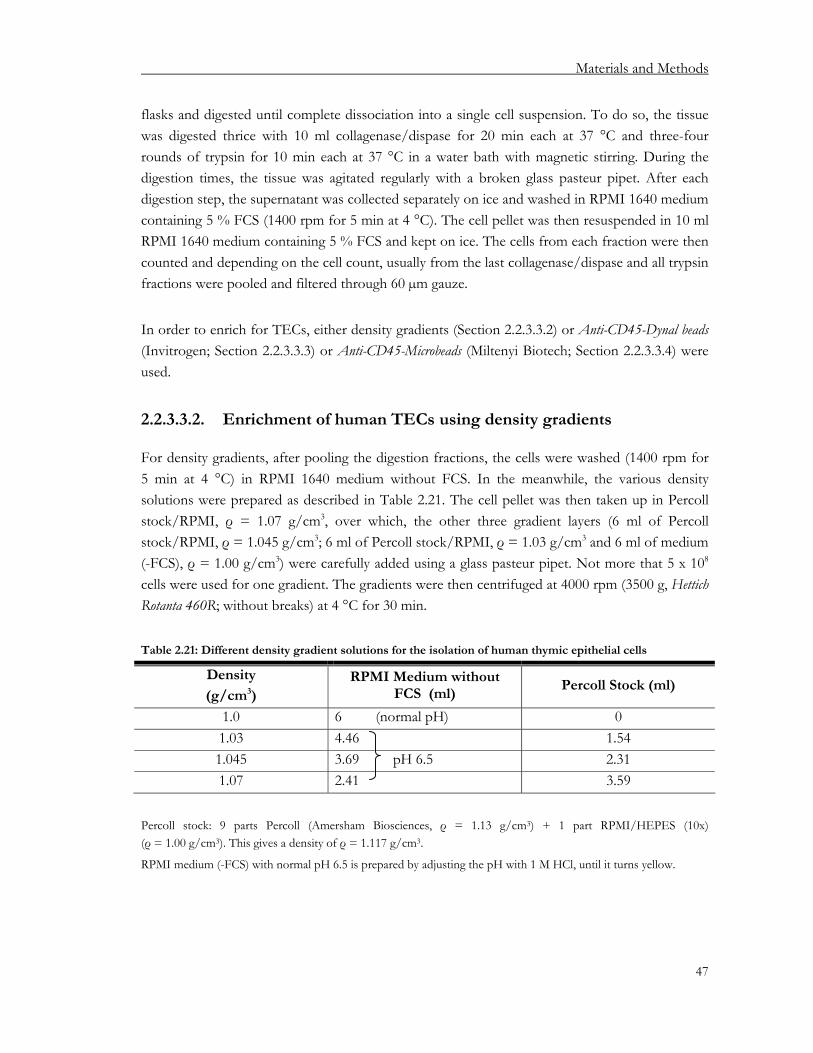
Materials and Methods
47
flasks and digested until complete dissociation into a single cell suspension. To do so, the tissue was digested thrice with 10 ml collagenase/dispase for 20 min each at 37 °C and three-four rounds of trypsin for 10 min each at 37 °C in a water bath with magnetic stirring. During the digestion times, the tissue was agitated regularly with a broken glass pasteur pipet. After each digestion step, the supernatant was collected separately on ice and washed in RPMI 1640 medium containing 5 % FCS (1400 rpm for 5 min at 4 °C). The cell pellet was then resuspended in 10 ml RPMI 1640 medium containing 5 % FCS and kept on ice. The cells from each fraction were then counted and depending on the cell count, usually from the last collagenase/dispase and all trypsin fractions were pooled and filtered through 60 µm gauze.
In order to enrich for TECs, either density gradients (Section 2.2.3.3.2) or Anti-CD45-Dynal beads (Invitrogen; Section 2.2.3.3.3) or Anti-CD45-Microbeads (Miltenyi Biotech; Section 2.2.3.3.4) were used.
2.2.3.3.2. Enrichment of human TECs using density gradients
For density gradients, after pooling the digestion fractions, the cells were washed (1400 rpm for 5 min at 4 °C) in RPMI 1640 medium without FCS. In the meanwhile, the various density solutions were prepared as described in Table 2.21. The cell pellet was then taken up in Percoll stock/RPMI, ρ = 1.07 g/cm3, over which, the other three gradient layers (6 ml of Percoll stock/RPMI, ρ = 1.045 g/cm3; 6 ml of Percoll stock/RPMI, ρ = 1.03 g/cm3 and 6 ml of medium (-FCS), ρ = 1.00 g/cm3) were carefully added using a glass pasteur pipet. Not more that 5 x 10⁸
cells were used for one gradient. The gradients were then centrifuged at 4000 rpm (3500 g, Hettich Rotanta 460R; without breaks) at 4 °C for 30 min.
Table 2.21: Different density gradient solutions for the isolation of human thymic epithelial cells
Density
(g/cm3) RPMI Medium without
FCS (ml) Percoll Stock (ml)
1.0 6 (normal pH) 0 1.03 4.46 1.54 1.045 3.69 pH 6.5 2.31 1.07 2.41 3.59
Percoll stock: 9 parts Percoll (Amersham Biosciences, ρ = 1.13 g/cm3) + 1 part RPMI/HEPES (10x) (ρ = 1.00 g/cm3). This gives a density of ρ = 1.117 g/cm3.
RPMI medium (-FCS) with normal pH 6.5 is prepared by adjusting the pH with 1 M HCl, until it turns yellow.

Materials and Methods
48
After centrifugation, the cells were collected in a 50 ml Falcon containing RPMI 1640 medium (with FCS) from the upper two interphases using a pasteur pipet. The cells were then washed twice (1600 rpm for 8 min at 4 °C) in medium. At the end, the cell pellet was resuspended in RPMI 1640 medium or FACS buffer (5 % FCS) and counted. Following which, the cells were stained for FACS (Section 2.2.3.3.5).
2.2.3.3.3. Enrichment of human TECs using Anti-CD45-Dynal beads
For TEC enrichment using Anti-CD45-Dynal beads (Invitrogen), the cells corresponding to ~ 2 x 10⁹ cells (from the pooled trypsin factions) were washed (1400 rpm for 5 min at 4 °C) in FACS buffer. The cell pellet was taken up in 10 ml FACS buffer and incubated with Anti-CD45-Dynal beads (4 x 10⁸ beads/ml) in a 1:1 ratio for 20 min at 4 °C. Prior to incubation, the beads (~ 3 ml) were washed thrice in 20 ml FACS buffer and incubated for 5-10 min on the magnet till the solution was clear. The solution was decanted.
After incubation, the cell-bead mix was placed on the magnet and the clear solution containing the CD45- cells was collected. The beads were washed (1400 rpm for 5 min at 4 °C) twice in 15 ml FACS buffer and placed on the magnet. After each wash, the clear solution containing the CD45- cells was collected and washed with FACS buffer (1400 rpm for 5 min at 4 °C). The cell pellet was resuspended in RPMI 1640 medium or FACS buffer (5 % FCS) and counted, following which, the cells were stained for FACS.
2.2.3.3.4. Enrichment of human TECs using Anti-CD45-Microbeads
For the use of Anti-CD45-Microbeads (Miltenyi Biotech) to enrich for TECs, the cells corresponding to ~ 2-3 x 10⁹ cells (from the pooled trypsin factions) were washed (1400 rpm for 5 min at 4 °C) in GM buffer and taken up in 20 ml FACS buffer. The cells were then incubated with a 1:35 dilution of Anti-CD45-Microbead for 20-30 min at 4 °C. After incubation, the cell-bead mix was washed with GM buffer (1400 rpm for 5 min at 4 °C). The cell pellet was resuspended in 10 ml GM buffer and filtered through 70 µm gauze. After which, they were aliquoted in ten 15 ml tubes each having ~2 x 10⁸ cells/ml. The CD45+ cells were then depleted using the autoMACSTM Pro Separator (Miltenyi Biotech), “Depletion program” as per the manufacturer’s recommendations. The collected CD45- cell fractions were pooled, washed, resuspended in FACS buffer (5 % FCS) and counted, following which, the cells were stained for FACS.
2.2.3.3.5. Staining of human TECs
For cell staining, firstly the cells were blocked with 5 % mouse serum in FACS buffer (1 ml for every 1 x 10⁸ cells) for 15 min on ice. For MUC1 antigen sorts, 5 % BSA solution was used for

Materials and Methods
49
blocking. The cells were then washed (1400 rpm for 5 min at 4 °C) and stained with an antibody cocktail (Table 2.22) for 15 min on ice in FACS buffer. After staining, the cells were washed (1400 rpm for 5 min at 4 °C), filtered through 35 µm filters and stained with PI directly prior to sorting. Cell populations were sorted on a BD FACSDiVa or BD FACSAriaTM (SOP) Cell Sorter (Becton Dickinson) on purity mode under medium pressure (Figures 7 and 8).
Table 2.22: Overview of different antibody combinations used for human TEC cell sorting
TEC Populations Sorted Antibodies used Dilution
MHCIIhi/MHCIIlo mTEC and cTEC
anti-CDR2-Alexa 488 anti-CD45-PerCP anti-EpCAM-Biotin Sav-PE anti-HLA-DR-Alexa 647 PI (1 mg/ml)
1:100 1:5 1:100 1:100 1:500 1:1000
MUC1+ and MUC1- mTEC
anti-CDR2-Alexa 488 anti-CD45-PerCP anti-EpCAM-Biotin Sav-PE anti-HLA-DR-Alexa 680 anti-MUC1-Alexa 647 PI (1 mg/ml)
1:100 1:5 1:100 1:100 1:100 1:100 1:5000
Figure 7
Sort gates for the isolation of human mTECs using Anti-CD45-Microbeads
The human mTEC and cTEC cell populations were separated using anti-CDR2 and anti-EpCAM mAbs. The mTECs were further differentiated into mature and immature subsets using anti-MHCII mAbs. The MHCII profile varied between the different human thymus samples.

Materials and Methods
50
Figure 8
Sort gates for the isolation of MUC1 antigen specific mTECs using Anti-CD45-Microbeads
The human MUC1 expressing mTECs were stained and sorted for their MUC1 expression versus that of the negative control, without MUC1 antibody.
2.2.4. Counting of live cells
Cells were mixed in various dilutions with trypan blue and counted in a Neubauer counting chamber using a tabletop light microscope. The dead cells take up the trypan blue dye due to their disrupted cell membrane and appear blue, thus being able to be distinguished from their translucent live counterparts.
2.2.5. RNA isolation
Total cellular RNA was isolated using the High Pure RNA Isolation Kit (Roche) according to the manufacturer’s instructions, from 2 x 10⁴-106 cells.
Negative Control
Materials and Methods
51
2.2.6. RNA precipitation and RT-PCR
2.2.6.1. RNA precipitation
Total RNA eluted in 50 µl Elution buffer was precipitated if need be, depending on the concentration as measured using the Nano Drop® 1000 photometer. The precipitation was performed over-night at -20 °C using 5 µg LPA and 2.5x sample volume of absolute ethanol (-20 °C), after which, the samples were centrifuged at 13,000 rpm for 30 min at 4 °C, then washed with 70 % ethanol (-20 °C) and re-centrifuged for 13 min. The pellet was then air-dried and re-suspended in 8-16 µl of RNase free water and either stored at -80 °C or directly used for RT-PCR.
2.2.6.2. RT-PCR
Genomic DNA was digested using 1 µl DNAse I (1 U/µl) for 30 min at 37 °C, followed by heat inactivation of the enzyme at 65 °C for 10 min. Subsequently, the RT-PCR was performed using the SuperScript II ™ RT (Invitrogen) as described in the manual.
For lower RNA amounts an alternative protocol was used, which is as follows:
To 4.5 µl RNA add 100 ng (200 ng/µl) (dT) - T7 primer, incubate at 70 °C for 10 min in a PCR block. To this add 4.5 µl ice-cold RT mix (2 µl 5x First Strand Buffer, 0.5 µl dNTP (10 mM), 0.5 µl T4gp32 (8 mg/ml, USB), 0.5 µl SuperaseIN, 1 µl H2O). Incubate the mixture at 50 °C for 2 min. After which, 0.5 µl SuperScript II ™ RT enzyme (Invitrogen) was added. The reaction was incubated for 60 min at 50 °C.
The resulting cDNA from either protocol was purified on gel chromatography columns (MicroSpin™ G50 columns) according to manufacturer’s specifications, in order to remove excess nucleotides and oligonucleotides.

Materials and Methods
52
2.2.7. Conventional PCR
For 25 µl reaction of a conventional PCR:
Reagents End Concentration Volume
Forward Primer 250 nM 2.5 µl Reverse Primer 250 nM 2.5 µl dNTPs 200 µM 2.5 µl 10x Reaction Buffer 1x 2.5 µl RedTaq® DNA-Polymerase 0.125 U 1 µl cDNA - 2 µl H2O - 12 µl Total Volume - 25 µl
The following PCR cycle parameters were used for the thermocycler:
Steps Time Temperature
Denaturation 3 min 94 °C Denaturation 1 min 94 °C Annealing 1 min 55 or 58 °C 40 cycles Elongation 2 min 72 °C Elongation 3 min 72 °C ∞ 4 °C
The conventional PCR was used to control the success of the cDNA synthesis using β-Actin as a house-keeping gene. Since the β-Actin primers were intron spanning, the cDNA template gave a shorter product of 348 bp for mouse and rat cDNA using agarose gel electrophoresis. For human cDNA, the primers gave a product of 208 bp and had an annealing temperature of 55 °C.
2.2.8. Quantitative PCR (qPCR)
For quantitative gene expression analysis, real-time PCR was performed using the GeneAmp® 7300 Sequence Detector. Each primer pair was titrated for the optimum concentration, as mentioned in Tables 2.7-2.9.
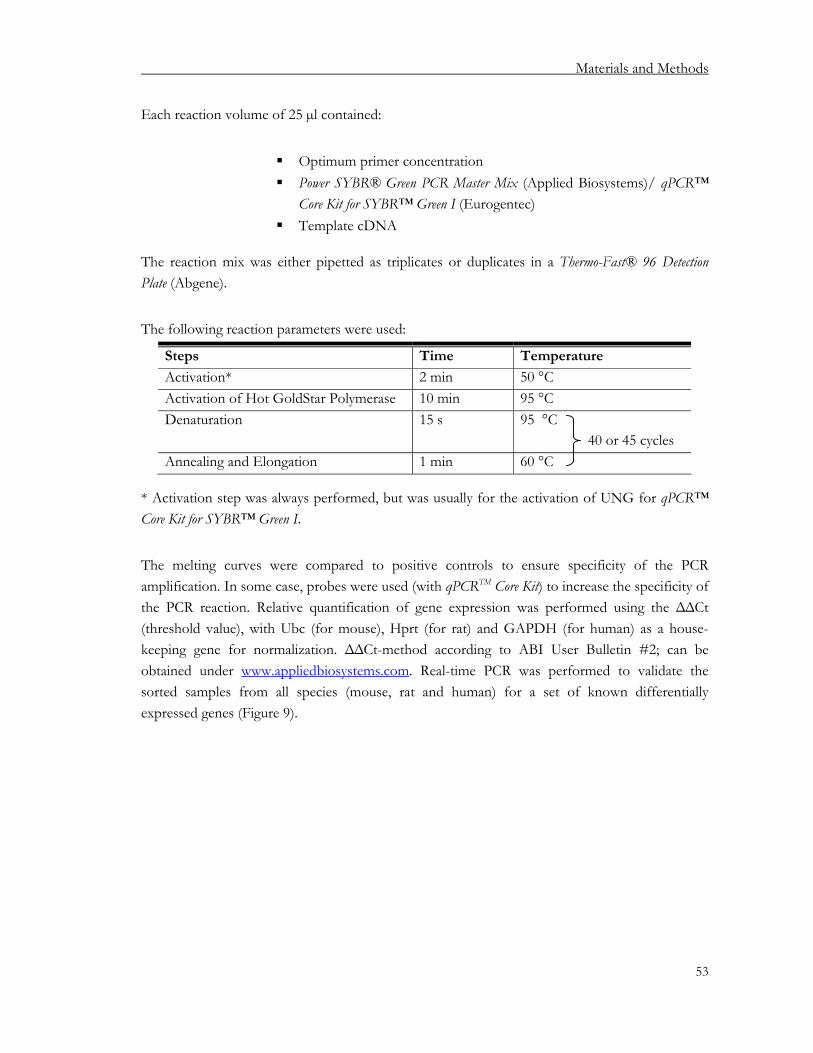
Materials and Methods
53
Each reaction volume of 25 µl contained:
Optimum primer concentration Power SYBR® Green PCR Master Mix (Applied Biosystems)/ qPCR™
Core Kit for SYBR™ Green I (Eurogentec) Template cDNA
The reaction mix was either pipetted as triplicates or duplicates in a Thermo-Fast® 96 Detection Plate (Abgene).
The following reaction parameters were used:
Steps Time Temperature
Activation* 2 min 50 °C Activation of Hot GoldStar Polymerase 10 min 95 °C Denaturation
15 s 95 °C 40 or 45 cycles
Annealing and Elongation 1 min 60 °C
* Activation step was always performed, but was usually for the activation of UNG for qPCR™ Core Kit for SYBR™ Green I.
The melting curves were compared to positive controls to ensure specificity of the PCR amplification. In some case, probes were used (with qPCRTM Core Kit) to increase the specificity of the PCR reaction. Relative quantification of gene expression was performed using the ΔΔCt (threshold value), with Ubc (for mouse), Hprt (for rat) and GAPDH (for human) as a house-keeping gene for normalization. ΔΔCt-method according to ABI User Bulletin #2; can be obtained under www.appliedbiosystems.com. Real-time PCR was performed to validate the sorted samples from all species (mouse, rat and human) for a set of known differentially expressed genes (Figure 9).

Materials and Methods
54
Mouse Gene Expression
0.0
0.5
1.0
1.5
MHCII lo MHCII hi
Relative
value
mRN
A expression level
AireIns2Csnb
Rat Gene Expression
0.0
0.5
1.0
1.5
MHCII lo MHCII hi
Relative
value
mRN
A expression level
AireIns2
Human Sample 32 Gene Expression
0.0
1.0
2.0
3.0
4.0
5.0
6.0
MHCII lo MHCII hi
Relative
value
mRN
A expression level
AIREINSGAD67
Figure 9
qPCR analysis of sorted samples from mouse, rat and human
Real-time PCR was performed to validate the sorted samples of all species (mouse, rat and human), prior to microarray hybridization for a set of known differentially expressed genes. One example from each sort for each of the species studies is shown. The MHCIIhi mTECs in all sepcies are enriched for pGE. The genes were normalized using a house-keeping gene (Ubc for mouse, Hprt for rat and GAPDH for human) and the expression was calculated using the ΔΔCt-method relative to the MHCIIhi mTECs. Genes tested: Aire-Autoimmune regulator; Ins-Insulin; Csnb-Casein beta; GAD67-glutamic acid decarboxylase 67.
Materials and Methods
55
2.2.9. Microarrays
Illumina expression profiling whole genome BeadArrays was used and the protocol followed was as described in the company manual (performed by the Genomics and Proteomics Core Facility of the DKFZ- Dr. B. Korn). For analysis of the array results, BeadStudio 3.1 (Illumina Inc.) was used to obtain the raw data which were further analyzed using R project and Perl software.
2.2.10. µMACS™ SuperAmp™ Technology for Illumina BeadArrays
The µMACS™ SuperAmp™ protocol (Miltenyi Biotec) is a recently established method for RNA amplification of small/rare cell populations. The amplified cDNA can be labelled and hybridized to microarrays for gene expression profiling. This technology was used and the samples were hybridized on Illumina’s expression profiling whole genome BeadArrays. Technical details were established and performed as described in a TechNote (Pinto et al., 2009).
2.2.11. Single-cell PCR (SC-PCR)
SC-PCR is a technique used to analyse the transcriptome of a single cell for up to 20 genes of interest and was essentially performed as described by Peixoto et al. (Peixoto et al., 2004).
The different steps of the SC-PCR were performed on separate benches with dedicated pipets, ice-boxes, etc. The benches and ice-boxes were cleaned with sodium hypochlorite and DNAaway prior to starting the experiment to prevent cross-contamination. All reactions were performed on ice. Throughout the experiment, the same machines (the same order of heating blocks) were used.
2.2.11.1. Primer design, dilution and storage
Primers for SC-PCR were designed with the Amplify 3 program to be 20mers with a preferable GC content of 50 %. All primers were spanning exon-intron boundaries. Generation of primer dimers and potential cross priming was tested in silico. The primers were routinely tested by BLAST search for specificity. Lyophilized primers were resuspended in 1x TE buffer at 1 mM final concentration. From these stock solutions 100 µM aliquots were prepared (in water) and both solutions were stored at -80 °C. Working solutions of 25 µM or 12.2 µM were prepared from the 100 µM solutions with water. The working solutions were stored at -20 °C. No solution used in SC-PCR had gone through more than three freeze/thaw cycles.

Materials and Methods
56
2.2.11.2. Efficiency and competition primer tests
Each primer pair (primer pairs A-C and B-C from all genes of interest) was tested with the same template and the qPCR efficiency was assessed using the LinRegPCR program (“Efficiency test”) (Figure 10A). In order to test the primer competition in the multiplex PCR, the first PCR was performed on the same template using: 1) a mix of all the A-C primer pairs (all genes); 2) an individual A-C primer pair (for each gene). The second PCR was a qPCR, using the first PCR as a template for each B-C primer pair (for each gene). Ct values and PCR efficiencies were compared between individual and multiplex PCRs to assess the degree of primer competition (“Competition test”) (Figure 10B).
2.2.11.3. Cell sorting and storage
Cell sorting was performed with a BD FACSDiVa (Becton Dickinson) at 16 psi in single cell mode using the automatic cell deposition unit. Cells were collected in 5 µl PBS-DEPC (0.1 %) in 0.2 ml PCR 8-well stripes arranged in 96 well format, frozen in liquid nitrogen and stored at -80 °C. Routinely, positive and empty wells were included in the plates to check the specificity of the reaction. Each experiment was independently tested for instrument precision by sorting fluorescent beads and visually inspecting their deposition in a target area corresponding to the surface area of the 5 µl cell collecting volume.

Materials and Methods
57
0
0.5
1
1.5
2
EpCAM A-C
EpCAM B
-C
MUC1 A-C
MUC1 B-C
MUC4 A-C
MUC4 B-C
CECAM3 A-C
CECAM3 B-C
CEACAM5 A-C
CEACAM5 B-C
CEACAM6 A-C
CEACAM6 B-C
Effic
ienc
y
0
10
20
30
40
EpCAM MUC1 MUC4 CEACAM3 CEACAM5 CEACAM6
Ct-V
alue
alonemix
Figure 10
Efficiency and competition test of SC-PCR primers
(A) Efficiencies between the individual primer pairs tested did not vary significantly, primer pairs A-C and B-C were tested in sequential PCR reactions.
(B) Primer competition in the multiplex PCR, the first PCR was performed on the same template using: 1) a mix of all the A-C primer pairs (all genes); 2) an individual A-C primer pair (for each gene). The second PCR was a qPCR, using the first PCR as a template for each B-C primer pair (for each gene). There was no significant competition between the primer pairs as both “alone” and “multiplex” reactions achieved the same Ct values in the second amplification round.
B
A

Materials and Methods
58
2.2.11.4. Lysis of cells, reverse transcription and PCRs
Cell Lysis, reverse transcription, first PCR amplification and real-time quantitative PCR were performed using DNA Engine Dyad (MJ Research) and 7300 Real Time PCR System (Applied Biosystems) instruments. The cycle number for the first PCR reaction was lowered from 15 to 14 and 50 cycles for the second round real-time quantitative PCR, since we observed an improved correlation between input cDNA and resulting threshold cycle (Ct) values.
The RT-PCR and the following gene expression studies of each sorted single cell were performed in the same tube. SC-PCR was highly sensitive and specific, as first a multiplex PCR was performed with outer primer pairs of all genes of interest (primers A and C) for 14 cycles and then a 50 cycle second round amplification-nested real-time PCRs were performed with the inner primer pairs (primers B and C) for each gene individually, using the first PCR as a template (Figure 11).
Figure 11
Schematic representation of the two amplification rounds performed in SC-PCR
14 cycles pre-amplification was performed in multiplex PCR with an outer primer pair, the second step amplification was performed as real-time PCR with a single inner primer pair.
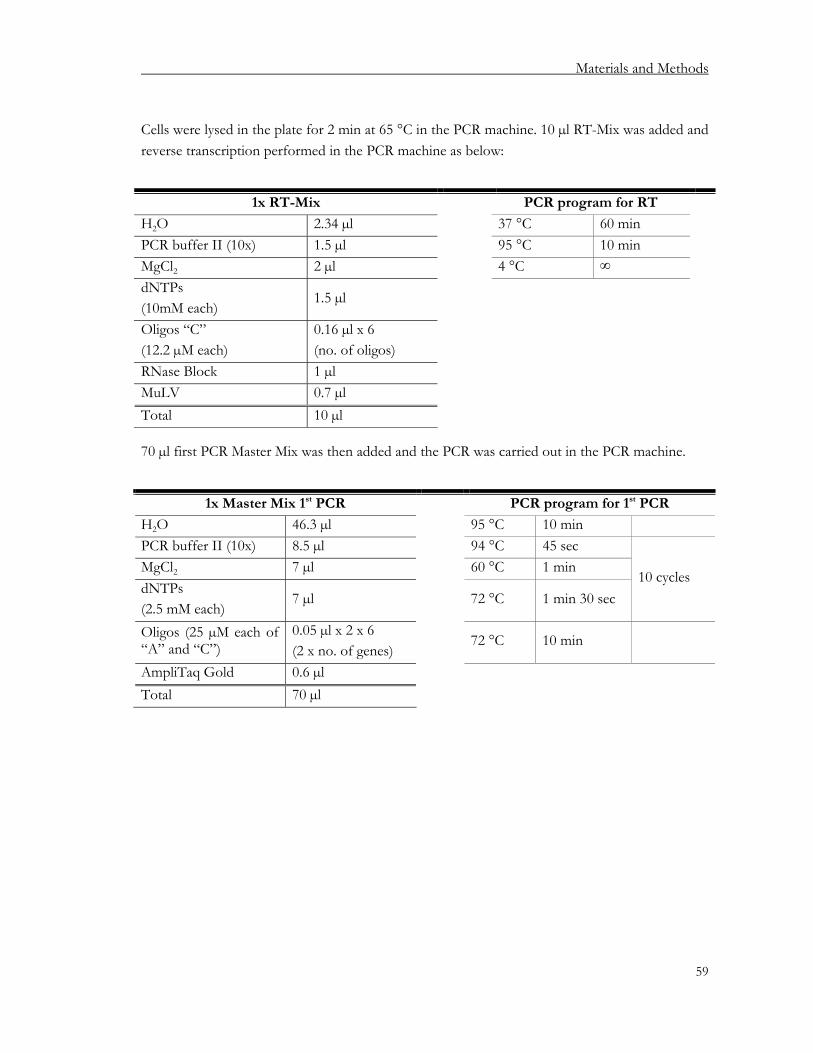
Materials and Methods
59
Cells were lysed in the plate for 2 min at 65 °C in the PCR machine. 10 µl RT-Mix was added and reverse transcription performed in the PCR machine as below:
1x RT-Mix PCR program for RT
H2O 2.34 µl 37 °C 60 min PCR buffer II (10x) 1.5 µl 95 °C 10 min MgCl2 2 µl 4 °C ∞ dNTPs (10mM each)
1.5 µl
Oligos “C” (12.2 µM each)
0.16 µl x 6 (no. of oligos)
RNase Block 1 µl MuLV 0.7 µl Total 10 µl
70 µl first PCR Master Mix was then added and the PCR was carried out in the PCR machine.
1x Master Mix 1st PCR PCR program for 1st PCR
H2O 46.3 µl 95 °C 10 min PCR buffer II (10x) 8.5 µl 94 °C 45 sec MgCl2 7 µl 60 °C 1 min dNTPs (2.5 mM each)
7 µl 72 °C 1 min 30 sec 10 cycles
Oligos (25 µM each of “A” and “C”)
0.05 µl x 2 x 6 (2 x no. of genes)
72 °C 10 min
AmpliTaq Gold 0.6 µl Total 70 µl
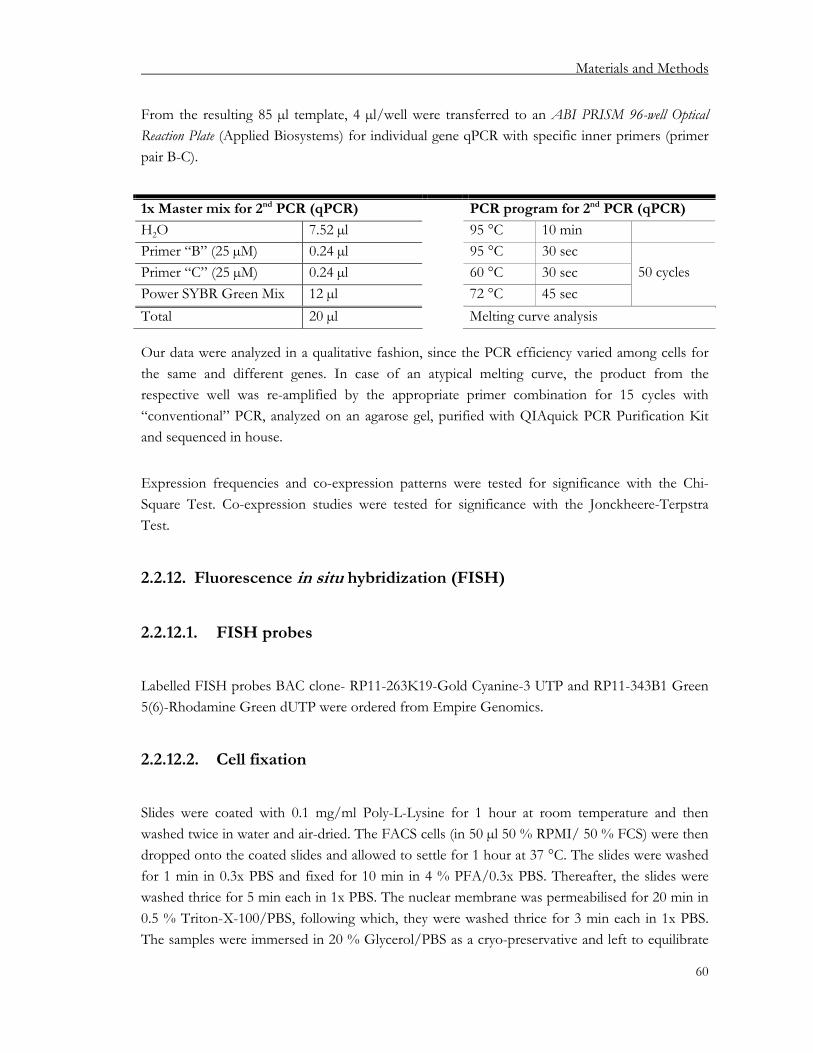
Materials and Methods
60
From the resulting 85 µl template, 4 µl/well were transferred to an ABI PRISM 96-well Optical Reaction Plate (Applied Biosystems) for individual gene qPCR with specific inner primers (primer pair B-C).
1x Master mix for 2nd PCR (qPCR) PCR program for 2nd PCR (qPCR)
H2O 7.52 µl 95 °C 10 min Primer “B” (25 µM) 0.24 µl 95 °C 30 sec Primer “C” (25 µM) 0.24 µl 60 °C 30 sec Power SYBR Green Mix 12 µl 72 °C 45 sec
50 cycles
Total 20 µl Melting curve analysis
Our data were analyzed in a qualitative fashion, since the PCR efficiency varied among cells for the same and different genes. In case of an atypical melting curve, the product from the respective well was re-amplified by the appropriate primer combination for 15 cycles with “conventional” PCR, analyzed on an agarose gel, purified with QIAquick PCR Purification Kit and sequenced in house.
Expression frequencies and co-expression patterns were tested for significance with the Chi-Square Test. Co-expression studies were tested for significance with the Jonckheere-Terpstra Test.
2.2.12. Fluorescence in situ hybridization (FISH)
2.2.12.1. FISH probes
Labelled FISH probes BAC clone- RP11-263K19-Gold Cyanine-3 UTP and RP11-343B1 Green 5(6)-Rhodamine Green dUTP were ordered from Empire Genomics.
2.2.12.2. Cell fixation
Slides were coated with 0.1 mg/ml Poly-L-Lysine for 1 hour at room temperature and then washed twice in water and air-dried. The FACS cells (in 50 µl 50 % RPMI/ 50 % FCS) were then dropped onto the coated slides and allowed to settle for 1 hour at 37 °C. The slides were washed for 1 min in 0.3x PBS and fixed for 10 min in 4 % PFA/0.3x PBS. Thereafter, the slides were washed thrice for 5 min each in 1x PBS. The nuclear membrane was permeabilised for 20 min in 0.5 % Triton-X-100/PBS, following which, they were washed thrice for 3 min each in 1x PBS. The samples were immersed in 20 % Glycerol/PBS as a cryo-preservative and left to equilibrate

Materials and Methods
61
for 1.5 h at room temperature or over-night at 4 °C. The samples were then subjected to 4 freeze/thaw cycles in liquid nitrogen, then washed thrice for 5 min each in 1x PBS and incubated for 7.5 min in 0.1 N HCl/H2O. After which the slides were washed three times for 5 min each in 2x SSC. They were then equilibrated in 50 % formamide/2x SSC over-night at 4 °C and stored in this solution at 4 °C for up to three months.
2.2.12.3. In situ hybridization (ISH)
For ISH, both the cellular DNA as well as the probe DNA were denatured, combined together and renatured allowing the single stranded probe DNA to bind to single strands of the genomic DNA. The probes (2 µl of each probe, 1 µl human COT-1, 1 µl Salmon Sperm, 6 µl probe buffer) were denatured at 78 °C for 7 min and partially renatured for 20 min at 37 °C. In the meanwhile, the PFA-fixed cells (cellular DNA) were denatured at 72 °C for 3 min, immediately thereafter the probes were dropped onto 18 x 18 mm cover slips and combined with the denatured cell nuclei on the slides. The coverslips-slides were then sealed with rubber cement (Fixogum) and left to renature over 2 nights in a moist chamber at 37 °C in the dark. During the entire preparation of PFA-fixed nuclei it was crucial to keep samples wet at all times as drying would lead to a collapse of the 3D architecture of the nucleus.
After renaturation, the cover slips were removed and excess probe was washed off thrice for 5 min each in 0.5 % Tween 20/4x SSC at 42 °C followed by three washes of 5 min each with 1x SSC at 60 °C. Then the slides were dipped in 0.5 % Tween 20/4x SSC, equilibrated in PBS for 5 min and stained with HOECHST 33342 (1:1000 of 1 mg/ml stock) for 3-4 min. Slides were washed twice for 3 min each in 1x PBS and embedded on to 22 x 22 mm coverslips in 15 µl ProLong Gold (Invitrogen). The ProLong Gold was left to harden over 1-2 nights before images were taken.
2.2.12.4. Image acquisition and analysis
Z-stack images were acquired at the Microscopy Core Facility, DKFZ, Heidelberg, with a Leica TCS SP5 Confocal Microscope using the 63x oil objective.
Image analysis was performed using a custom-made ImageJ plugin. In order to exclude false-positive spots, the position and the slices of appearance of the FISH probes were manually selected in the ImageJ software. FISH probes were confirmed to be sphere-shaped in 3D by determining the area of the (2D) spots of a FISH probe across confocal slices (Figure 12). In the ImageJ plugin the distance between FISH probes was then calculated as the 3D Euclidean

Materials and Methods
62
distance between the spot centres of the confocal slices with the largest area for each FISH probe, which was considered as the probe (sphere) centre (Figure 13). An output file consisting of the x, y and z co-ordinates of sphere centres of each FISH probe and distance measurements (four distances per cell) were generated for each image and the co-localization of the two chromosomes was studied.
Figure 12
Intensity measurements for the FISH probes
(A) Example of green FISH probe and a plot of it’s intensity. The arrow indicates the point of maximum intensity.
(B) A plot of the confocal slices versus intensity of a FISH probe. Each FISH probe appears and disappears over certain slices and there is always a slice where the probes intensity is maximum. This slice was considered as its z-position of the FISH probe. A sketch of a FISH probe was drawn, with the cross in the centre representing the slice of maximum intensity.
A
B

Materials and Methods
63
In order to set a threshold for the minimum distance between the FISH probes, which we would consider to be co-localized, we estimated the radius of the sphere described by a FISH probe in two different ways, which both yielded the same result. First, we determined the typical diameter of the (2D) spot with maximum area of a FISH probe (Figure 14A). This was found to be 1.3 µm, yielding a radius R of 0.65µm. In a second estimate of the sphere radius, we measured the average number of slices in which the probes appear as 6. With a distance of 0.21 µm between consecutive confocal slices, this yields a diameter of 6 x 0.21 = 1.26 µm and a radius of 0.63 µm (Figure 14B), which is similar to the first estimate.
If two FISH probes are adjacent or over-lapping then the 3D distance between probe centres should be less than or equal to the sum of the radii of both probes (Figure 14A). Taken together, we considered 1.2 µm to be the maximum distance for co-localization between any two FISH probes. Using the Matlab software the plots of distance measurements between the FISH probes for each human sample were generated.
Figure 13
3D Euclidean distance measurements between the FISH probes
(A) A sketch of the distance (d) between two FISH probes as calculated using the slice of maximum intensity for each probe in the z-plane.
(B) The 3D Euclidean measurements used to calculate the distance between the FISH probes.
A B

Materials and Methods
64
R1+ R2≤ D
R1 R2
D
R1 + R2≤ D
R1 R2
D
R1 R2
D
Figure 14
Estimations used to set the threshold for the minimum distance between the FISH probes
(A) First an estimation was used to set a threshold for the minimum distance between the FISH probes, which we would consider to be co-localized. The typical diameter (D) of the FISH probes was found to be 1.3 µm, yielding a radius (R) of 0.65µm. Hence, if two FISH probes are adjacent or over-lapping then the sum of the radius (R) for both probes should be less than or equal to the diameter (R1+R2 ≤ D).
(B) The second criterion we considered was the average number of slices in which the probes appear as 6 and 0.21 µm as the distance between consecutive confocal slices. This yields a diameter of 6 x 0.21 = 1.26 µm and a radius of 0.63 µm. Together; we considered 1.2 µm to be the maximum distance for co-localization between any two FISH probes.
A
B

Results
65
3. Results
3.1. Expression patterns and evolutionary conservation of promiscuous
gene expression (pGE)
The scope of promiscuous gene expression (pGE) largely determines the extent of central T-cell self-tolerance. Global gene expression patterns among thymic stromal cells clearly singled out mTECs as a cell type specialized in expressing TRAs (Derbinski et al., 2001; Anderson et al., 2002; Gotter et al., 2004; Derbinski et al., 2005). MTECs are a heterogeneous population with regards to their phenotype, expressing varying levels of co-stimulatory molecules like CD80, CD86 and MHCII, which denotes progressive maturation. The complete representation of pGE requires differentiation steps as shown previously in murine and human mTECs whereby the majority of promiscuously expressed genes is up-regulated in a subset, characterized by high level expression of MHCII, CD80/86 in addition to the expression of Aire (Nelson et al., 1993; Derbinski et al., 2005; Derbinski and Kyewski, 2005; Taubert et al., 2007). Hence, to affirm previous observations showing a correlation between promiscuous gene expression and induction of these differentiation markers we chose to separate mTECs according to their relative expression levels of MHCII (into immature, MHCIIlo and mature, MHCIIhi mTECs). More so, we sought to gain a comprehensive insight into: firstly to what extent is the genome represented in the thymus, secondly to decipher underlying mechanisms/parameters/rules governing pGE and thirdly to study the evolutionary conservation of pGE. This study focused on mTEC subsets in different species (i.e. mouse, rat and human) and the phenomenon of pGE at a global level.
We could have opted for the separation of complete mTECs from cTECs in order to get an insight into the above queries. But since they represent two distinct lineages, it would include the expression of lineage-specific genes. Hence, we decided to study gene expression within the mTEC cell-lineage focusing on its two different subsets of immature and mature mTECs. The MHCII molecule is well characterized in mice, rats and humans, thus in this study mTECs were separated into mature and immature subsets based on MHCII expression. The lower and upper 30 % of MHCIIlo and MHCIIhi expressing mTECs from each species were enriched by density gradients/magnetic beads and sorted by FACS (Section 2.2.3, Figures 5, 6 and 7). RNA was isolated and part of the RNA was used for cDNA synthesis to perform a control qPCR to validate the quality of the sorts using a set of known differentially expressed genes (Section 2.2.5 - 2.2.8 and Figure 9).
A RNA collection of 3 mouse sorts (20 female mice each, in the range of 6-8 weeks of age), 5 rat sorts (5-6 female rats each, in the range of 7-9 weeks of age) and 11 human sorts (ranging from 3 days to 3 years of age) were in vitro transcribed into labeled cRNA (Illumina® TotalPrep RNA

Results
66
Amplification Kit, Ambion) and hybridized onto Expression BeadChip, Whole Genome Gene Expression Arrays (Illumina). The data were then further processed using Bead Studio 3.1 (Illumina), R and Bioconductor packages.
3.1.1. Estimation of the number of differentially expressed genes between
MHCIIlo and MHCIIhi mTECs
The probes on the arrays were annotated based on Ensembl genes. After Quantile normalization of the microarray data, the differentially expressed genes between MHCIIlo and MHCIIhi mTECs of each species were estimated using the criteria of p ≤ 0.01 and Fc (fold-change) greater/lesser than or equal to 2 (Fc ≥ 2 or Fc ≤ 2).
Mouse Rat Human
Differentially expressed genes 1889 700 2000-3000 (2205) Up-regulated genes 1263 360 ~1226 Down-regulated genes 626 340 ~980
Table 3.1
Comparison of differentially expressed, up-regulated and down-regulated genes between MHCIIlo and
MHCIIhi mTECs from mouse, rat and human thymus
Data represent 3 mouse sorts, 5 rat sorts and 11 human sorts. Values for humans are an estimation owing to the large inter-individual differences.
The number of differentially expressed, up- and down-regulated genes between the three species was rather similar (Table 3.1), taking into consideration that the number of probes on the rat microarrays were half compared to mouse and human (22,000 probes for rat vs. 45,000 probes for mouse and 48,000 probes for human).
In addition, the autoimmune regulator (Aire) dependency was also studied in mouse where the KO strain was available. Microarrays of MHCIIlo and MHCIIhi mTECs from Aire-/- female mice (3 sorts, 6-7 female mice each), were performed. Aire has been shown to control pGE at least partially by regulating the expression of numerous genes in mTECs with a predilection for TRAs (Anderson et al., 2002; Derbinski et al., 2005). This issue is of particular importance in the pathophysiology of the human autoimmune polyglandular syndrome type 1 (APS-1). APS-1 is a rare recessive, autosomally inherited monogenic disease, which is caused by mutations in the AIRE gene (Pitkanen and Peterson, 2003). This disease is modeled in Aire-/- mice and offers valuable information to study tolerance mechanisms since thymi of APS-1 patients are not

Results
67
available for study (Anderson et al., 2002; Ramsey et al., 2002). From the microarray data the Aire-dependent genes were defined as those genes whose: 1) difference in average expression of MHCIIhi - MHCIIlo mTECs in WT mice was significantly different from the difference in average expression of MHCIIhi - MHCIIlo mTECs in KO mice; 2) fold change was greater/lesser than or equal to 2 between MHCIIhi and MHCIIlo mTECs in WT mice and greater than the fold change in KO mice.
Criteria for defining Aire-dependent genes:
1. [avg. exp. MHCIIhi mTECs - avg. exp. MHCIIlo mTECs] in WT mice - [avg. exp. MHCIIhi
mTECs - avg. exp. MHCIIlo mTECs] in KO mice
2. [Fc ≥ 2 or Fc ≤ 2 between MHCIIhi and MHCIIlo mTECs] in WT mice > [Fc ≥ 2 or Fc ≤ 2 between MHCIIhi and MHCIIlo mTECs] in KO mice
Using the above criteria, global analysis in Aire-/- female mice showed that a large number of genes were Aire-dependent in the up-regulated gene set. Yet, a large number of genes were also observed to be Aire-independent, thus confirming that Aire regulates only a part (~36 %) of genes that are differentially expressed in MHCIIhi vs. MHCIIlo mTECs (Table 3.2).
Up-regulated genes Down-regulated genes
Aire-dependent genes 455 32 Aire-independent genes 808 594
Table 3.2
Set of Aire-dependent and -independent up-regulated and down-regulated genes
Data is a compilation of 3 Aire-/- mouse sorts.
The human data showed large inter-individual variability, to such an extent that a common set of differentially expressed genes cannot be deduced. Table 3.5A shows the estimated number of up- and down-regulated genes within and between each patient.
Extrapolating from the gene array analysis, we estimate that ~10 % of all known genes are turned on in mature MHCIIhi mTECs in addition to differentiation-dependent genes. This however is an under-estimate due to a methodological limitation, as the currently available genome-wide screening microarray platform has low sensitivity. Use of most modern Deep Sequencing technology may ultimately precisely define the promiscuously expressed gene pool.

Results
68
3.1.2. Linking features of promiscuous gene expression
After having defined the pools of differentially expressed genes in the different species, further studies into the properties of these genes were carried out. Anderson et al. first showed that genes expressed in mTECs are enriched for TRAs (Anderson et al., 2002). Subsequently our working group (Gotter et al., 2004; Derbinski et al., 2005) as well as Johnnidis’ (Johnnidis et al., 2005) described the bulk of promiscuously expressed genes that are turned on in the mature mTEC subset to be: 1) enriched in TRAs and 2) tend to co-localize in clusters in the genome. A direct link between these two features i.e. enrichment for TRAs and clustering had not been formally shown (Figure 15). How are these two features linked? One possibility is that TRAs are clustered in the genome irrespective of functional or structural relatedness. PGE would project onto such TRA clusters to various extents in mTECs. In order to test this notion, TRAs were operationally defined, their genomic position deduced and genome-wide analysis of gene clusters was performed.
pGE
Enriched TRAs Gene clustering
?
pGE
Enriched TRAs Gene clustering
?
Figure 15
Linking features of pGE
PGE is known to enrich for TRAs and clustered genes. How do these features link?
3.1.2.1. Defining tissue-restricted antigens (TRAs)
Gene expression data from the public database at http://symatlas.gnf.org (Su et al., 2004) were taken for the identification of tissue-restricted genes. This database contains expression assignments for many different tissues and cell types derived by gene array analysis. A gene was defined as a TRA, if its expression was above 5X the median (the median expression over all tissues) in less than five tissues. From the database in mouse, 61 different tissues were listed. The gene expression data for 20,000 non-redundant annotated genes were analyzed over 61 tissues. By these criteria, 5000 genes in the mouse genome were defined as TRAs (Figure 16).

Results
69
Relative Expression median
5X median
Relative Expression median
5X median
median
5X median
4632404H12Rikgnf1m00036_a_at4632404H12Rik
gnf1m00036_a_at
Relative Expression
median4632404H12Rik
gnf1m00036_a_at4632404H12Rik
gnf1m00036_a_at
Relative Expression
medianmedian
Figure 16
Defining TRAs in mouse
The public database http://symatlas.gnf.org (Su et al., 2004) was used to identify tissue-restricted antigens (TRAs). Array expression data of each gene was plotted across the various tissues. The median expression was set across all tissues and a gene was defined as a TRA, if its expression was above 5X the median in less than five tissues.
(A) Example of a TRA, Casein beta (Csn2) exclusively expressed in the mammary gland. Note that Csn2 is not detected in the thymus, though it is known to be expressed as a TRA in the thymus. This is due to 3 reasons: 1) pGE tested by PCR is 10,000 or more fold lower in mTECs than in the respective tissue cell type (J. Derbinski unpublished data); 2) here the expression is tested in complete thymus and not purified mTECs; 3) the array data is of lower sensitivity than PCR, hence making Csn2 too low to score.
(B) Example of a non-TRA, 4632404H12Rik, which is widely expressed across all tissue.
A
B

Results
70
The same method was used to define TRAs in human over 57 tissues listed in the database. A total of 3294 TRAs are present in the human genome from 22,284 non-redundant annotated genes (Figure 17).
LDHA 200650_s_at
LDHA 200650_s_at
Relative Expression
median
5X median
LDHA 200650_s_at
LDHA 200650_s_at
Relative Expression
median
5X median
median
5X median
A
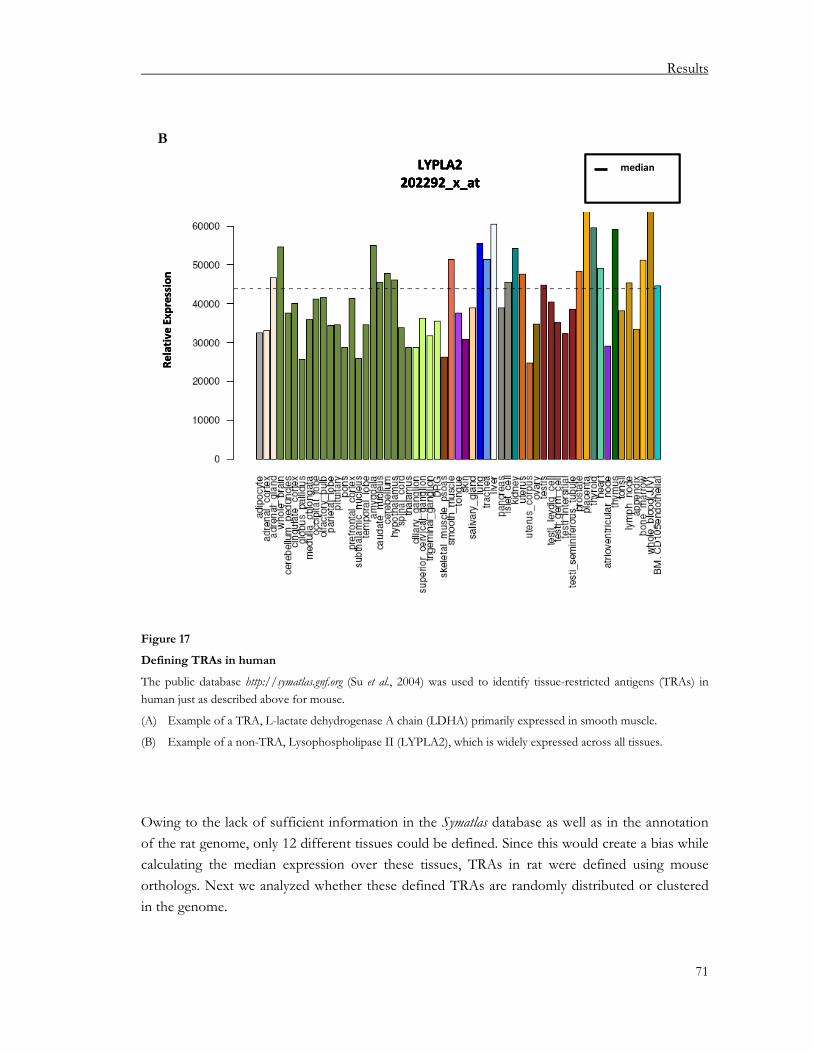
Results
71
LYPLA2202292_x_at
LYPLA2202292_x_at
Relative Expression
medianLYPLA2202292_x_at
LYPLA2202292_x_at
Relative Expression
medianmedian
Figure 17
Defining TRAs in human
The public database http://symatlas.gnf.org (Su et al., 2004) was used to identify tissue-restricted antigens (TRAs) in human just as described above for mouse.
(A) Example of a TRA, L-lactate dehydrogenase A chain (LDHA) primarily expressed in smooth muscle.
(B) Example of a non-TRA, Lysophospholipase II (LYPLA2), which is widely expressed across all tissues.
Owing to the lack of sufficient information in the Symatlas database as well as in the annotation of the rat genome, only 12 different tissues could be defined. Since this would create a bias while calculating the median expression over these tissues, TRAs in rat were defined using mouse orthologs. Next we analyzed whether these defined TRAs are randomly distributed or clustered in the genome.
B
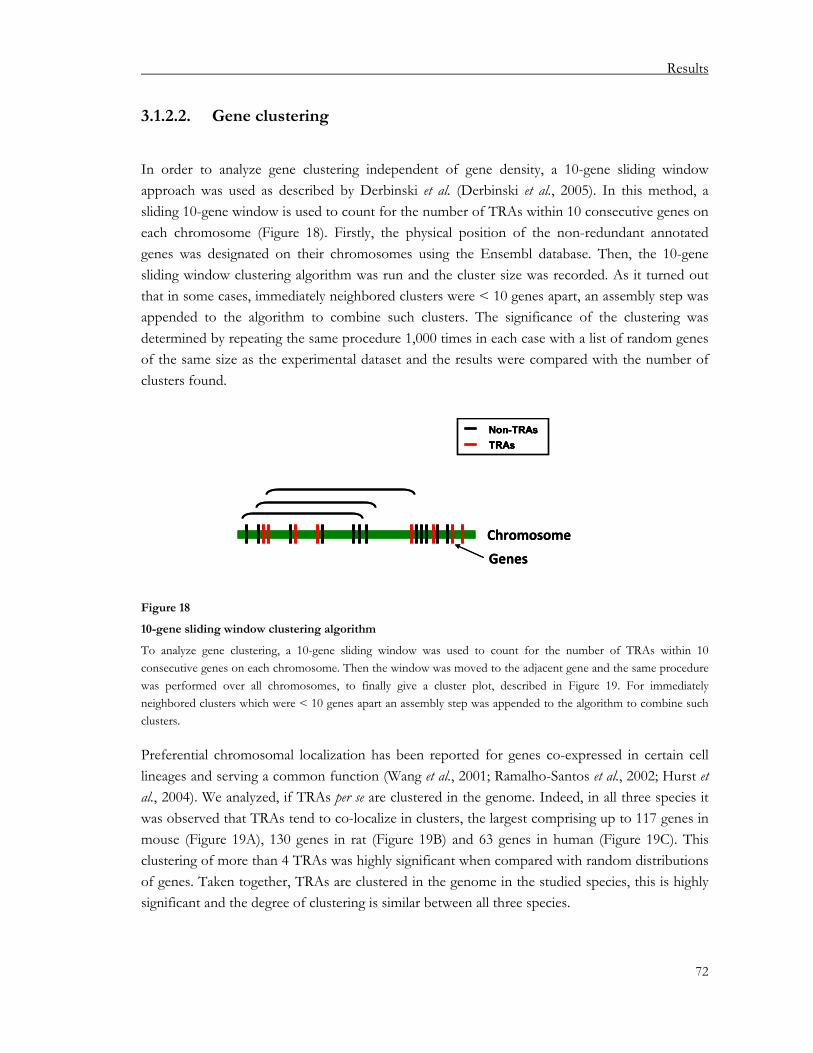
Results
72
3.1.2.2. Gene clustering
In order to analyze gene clustering independent of gene density, a 10-gene sliding window approach was used as described by Derbinski et al. (Derbinski et al., 2005). In this method, a sliding 10-gene window is used to count for the number of TRAs within 10 consecutive genes on each chromosome (Figure 18). Firstly, the physical position of the non-redundant annotated genes was designated on their chromosomes using the Ensembl database. Then, the 10-gene sliding window clustering algorithm was run and the cluster size was recorded. As it turned out that in some cases, immediately neighbored clusters were < 10 genes apart, an assembly step was appended to the algorithm to combine such clusters. The significance of the clustering was determined by repeating the same procedure 1,000 times in each case with a list of random genes of the same size as the experimental dataset and the results were compared with the number of clusters found.
Chromosome
Non-TRAsTRAs
Genes
Chromosome
Non-TRAsTRAsNon-TRAsTRAs
Genes
Figure 18
10-gene sliding window clustering algorithm
To analyze gene clustering, a 10-gene sliding window was used to count for the number of TRAs within 10 consecutive genes on each chromosome. Then the window was moved to the adjacent gene and the same procedure was performed over all chromosomes, to finally give a cluster plot, described in Figure 19. For immediately neighbored clusters which were < 10 genes apart an assembly step was appended to the algorithm to combine such clusters.
Preferential chromosomal localization has been reported for genes co-expressed in certain cell lineages and serving a common function (Wang et al., 2001; Ramalho-Santos et al., 2002; Hurst et al., 2004). We analyzed, if TRAs per se are clustered in the genome. Indeed, in all three species it was observed that TRAs tend to co-localize in clusters, the largest comprising up to 117 genes in mouse (Figure 19A), 130 genes in rat (Figure 19B) and 63 genes in human (Figure 19C). This clustering of more than 4 TRAs was highly significant when compared with random distributions of genes. Taken together, TRAs are clustered in the genome in the studied species, this is highly significant and the degree of clustering is similar between all three species.
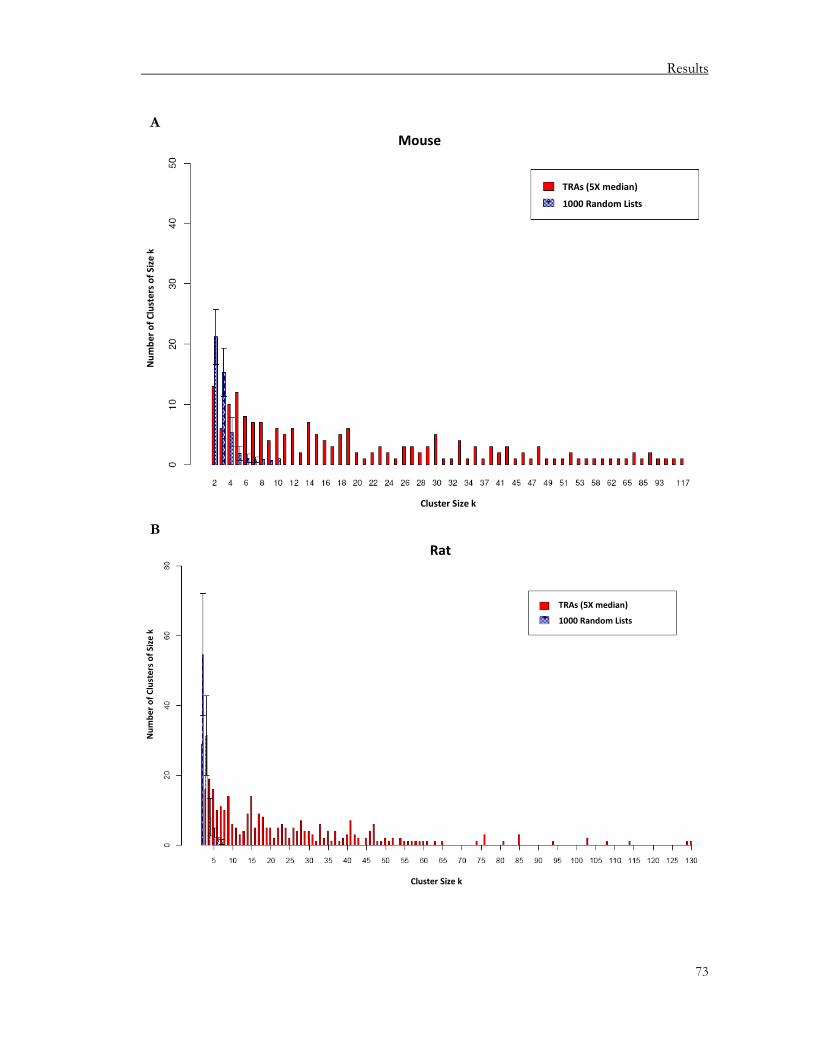
Results
73
Cluster Size k
Num
ber of Clusters of Size k
TRAs (5X median)
1000 Random Lists
Cluster Size k
Num
ber of Clusters of Size k
TRAs (5X median)
1000 Random Lists
Cluster Size k
Num
ber of Clusters of Size k
TRAs (5X median)
1000 Random Lists
Cluster Size k
Num
ber of Clusters of Size k
TRAs (5X median)
1000 Random Lists
A
B
Mouse
Rat

Results
74
Cluster Size k
Num
ber of Clusters of Size k
TRAs (5X median)
1000 Random Lists
Cluster Size k
Num
ber of Clusters of Size k
TRAs (5X median)
1000 Random Lists
Figure 19
Genome-wide TRA cluster maps in mouse, rat and human
After running the 10-gene sliding window clustering algorithm, the cluster size k (number of TRAs in a cluster, x-axis) is plotted versus the number of clusters of a particular size (k; y-axis). The significance of clustering was determined by repeating the same procedure 1,000 times in each case with a list of random genes of the same size as the experimental dataset (violet bars).
(A) Mouse genome-wide TRA clusters show that TRAs are significantly clustered in the genome, with the largest cluster comprising 117 TRAs.
(B) Rat genome-wide TRA clusters show that TRAs are significantly clustered in the genome, with the largest cluster comprising 130 TRAs.
(C) In human, the same was observed; TRAs are significantly clustered in the genome, with the largest cluster comprising 63 TRAs.
In all cases clusters >4 TRAs are significantly different from the random samples.
C
Human

Results
75
3.1.3. Gene clusters are present in syntenic regions across species
Since TRAs in all three species are clustered in the genome, it was of interest to know if they are localized within certain conserved regions i.e. syntenic regions on the same or on different chromosomes of the different species. Hence, matching of orthologous gene TRA clusters in the mouse and human genome was performed based on HomoloGene (NCBI).
It was observed that most of the clusters were localized in syntenic regions conserved between mouse and human (Figure 20). The gene order in these clusters in both species was mostly conserved, i.e. a co-linear relationship was observed (Figure 20A). In some cases, the gene order was inverted (Figure 20B). The gene density of TRAs in the clusters was generally higher in mouse than in human. This analysis was not performed in rat due to the poor annotation of the rat genome.

Results
76
A 8 ortholog
s
Non
-TR
As
TRA
sN
on-T
RA
sTR
As

Results
77
B
18 ortho
logs
Non
-TR
As
TRA
sN
on-T
RA
sTR
As

Results
78
Figure 20
TRA cluster maps of syntenic regions
(A) An example of a co-linear syntenic cluster on mouse chromosome 11 and human chromosome 7 shows 8 orthologs. Clusters in both species have different gene density (30 % in human and 59 % in mouse) and numbers of TRAs (49 TRAs in human versus 26 TRAs in mouse). The gene order in both species was conserved.
(B) An example of an inverted syntenic cluster on mouse chromosome 4 and human chromosome 1 shows an overlap of 18 orthologs. Clusters in both species have different gene densities (30 % in human and 40 % in mouse) and numbers of TRAs (62 TRAs in human versus 72 TRAs in mouse). The gene order in both species was inverted in this case.
3.1.4. Gene homology within TRA clusters in the mouse genome
In order to investigate, if TRA clusters in the genome arose from gene duplication or are the result of co-localization of structurally and functionally related genes, a homology match was performed on the TRAs within each cluster. To do so, the nucleotide sequence of each particular TRA within a cluster was compared to the sequence of every other TRA within the same cluster. A homology plot denoting the percent sequence identity (% Id) of each such comparison within every cluster was plotted (Figure 21A). The percent identity of majority of the TRAs within clusters is ~30 %. The threshold probability of four nucleotides (ATGC) is 25 %. A few outliers (circles) having a high percent identity ~60-99 % are likely to be gene families (Figure 21A). For a set of random genes, the percent identity was in the range of 25-30 % homology (Figure 21B). Thus, the bulk of the TRA clusters contain structurally unrelated genes that do not insinuate a common deviation by gene duplication or gene conversion, which would explain their co-localization in the murine genome.

Results
79
Clusters
% Id
200
4060
8010
0
Clusters
% Id
200
4060
8010
0
5 10 20 50 100 200
Clusters
% Id
200
4060
80
5 10 20 50 100 2005 10 20 50 100 200
Clusters
% Id
200
4060
80
A
B

Results
80
Figure 21
Homology plot of mouse TRA clusters
The nucleotide sequence of each particular TRA within a cluster was compared to the sequence of every other TRA within the same cluster. A homology plot denoting the percent sequence identity (% Id) of each such comparison within all clusters was plotted.
(A) In mouse clusters, the %Id of majority of the TRAs is ~30 %, while the threshold probability of four nucleotides (ATGC) is 25 %. The circles represent outliers having a high percent identity, ~60-99 % which are likely gene families.
(B) In comparison, a homology analysis with a set of random genes was performed. The percent identity is also in the range of 25-30 % and very few high %Id genes pairs were detected compared to the mouse TRA clusters. Thus, the bulk of the mouse TRA clusters contain non-homologous genes.
3.1.5. Analysis of gene expression between immature and mature mTECs
in the thymus
We defined TRAs, their genomic distribution and demonstrated that TRAs are clustered in the genome irrespective of structural relatedness or apparent immunological criteria. It was previously published that promiscuously expressed genes are enriched in TRAs (Anderson et al., 2002; Gotter et al., 2004; Derbinski et al., 2005; Johnnidis et al., 2005) and during progressive maturation, mTECs show an increased pGE, concomitant with Aire expression. Using a more complete second generation microarray platform, larger and better annotated genome database and robust computed TRA definition, we sort to reanalyze previous findings: 1) TRA enrichment and 2) Aire-dependency in mouse. Previous studies were performed on both (immature and mature) mTEC subsets in mouse and on complete mTECs in human; here our studies extend to these subsets in mouse, human and rat.
3.1.5.1. Analysis of the differentially expressed gene content in murine
mTECs: TRAs and Aire dependency
PGE has been tightly correlated with the differentiation stage in mTECs i.e. mature mTECs (Derbinski et al., 2005). In this study MHCII was chosen to separate mTECs into immature and mature stages of differentiation. Based on genome-wide TRA definition, the thymic differentially expressed genes (MHCIIlo vs. MHCIIhi mTECs) were designated as TRAs or non-TRAs. Due to the importance of Aire in regulating the expression of numerous genes in mTECs with a predilection for TRAs (Anderson et al., 2002; Derbinski et al., 2005; Johnnidis et al., 2005) and the availability of Aire-/- mice, the Aire dependency was studied. To delineate the size and diversity of Aire-dependent vs. Aire-independent gene pool, genome-wide microarrays were performed using Aire-/- mice.

Results
81
Up-regulated genes Down-regulated genes
Total gene number 1263 626 Aire-dependent genes 455 (240 TRAs, 53 %) 32 (17 TRAs, 50 %) Aire-independent genes 808 (391 TRAs, 48 %) 594 (234 TRAs, 39 %)
Table 3.3
Comparing the percentage of Aire-dependent and -independent differentially expressed genes in murine
thymus (between MHCIIlo and MHCIIhi mTECs)
The percentage of TRAs was calculated in each gene set.
0
100
200
300
400
500
600
700
800
900
WT up‐regulatedAire‐dependent
genes
WT up‐regulatedAire‐
independentgenes
WT down‐regulated Aire‐
dependent genes
WT down‐regulated Aire‐independent
genes
Num
ber o
f Differentially
Expressed
Gen
es
TRAs
Non‐TRAs
53%
50%
48%
39%
Figure 22
Representation of TRAs and Aire dependency in mouse thymic differentially expressed genes
The percentage of TRAs in up- or down-regulated Aire-dependent or -independent genes were plotted. It was observed that MHCIIhi mTECs have a large number of Aire-dependent and -independent genes. The down-regulated gene pool shows a small number of Aire-dependent genes, though 50 % are TRAs. Most of the down-regulated genes are Aire-independent. The plot corresponds to Table 3.3.

Results
82
In mice, 1263 genes were up-regulated versus 626 genes which were down-regulated from 27,000 well annotated mouse genes. It was observed that MHCIIhi mTECs express a large number of Aire-dependent and -independent genes, both of which appeared to be enriched in TRAs. The up-regulated Aire-dependent genes showed 5 % more TRAs as compared to the Aire-independent gene set (Table 3.3 and Figure 22). The down-regulated gene pool showed a small number of Aire-dependent genes, though 50 % were TRAs (Table 3.3). Most of the down-regulated genes were Aire-independent, consisting of 39 % TRAs (Table 3.3 and Figure 22). Nonetheless both up- and down-regulated genes appeared to have similar percentages of Aire-dependent TRAs while the up-regulated gene pool had 9 % more Aire-independent TRAs. Thus, it appears that the maturation stage i.e. MHCIIhi mTECs and not Aire per se has an effect on both number and fraction of TRAs.
3.1.5.2. How is pGE projected onto pre-existing genome-wide mouse TRA
clusters?
We affirmed previous observations that pGE in mTECs is enriched in TRAs and in part regulated by Aire while others are Aire-independent. The percentage of TRA content is far above the background of 10.8 % in the genome. Here we aimed at studying the projection of pGE onto pre-existing genome-wide TRA clusters that were defined in the previous chapter.
In the mouse genome, 364 gene clusters ranging from 4 - 117 TRAs were identified. The set of thymic differentially expressed genes (Aire-dependent and -independent genes) were plotted onto these clusters giving rise to cluster maps for each chromosome. It was observed that, promiscuously expressed TRAs tend to map to these clusters; within each cluster, TRAs were intermingled with non-TRAs. It was rather rare that a cluster comprised purely TRAs. Moreover Aire-dependent and -independent genes were interspersed among each other. Part of the genes within clusters was regulated during mTEC differentiation (Example Figure 23A).

Results
83
0.00
1
0.01
0
0.10
0
1.00
0
10.000
Aire
Irx2
Irx1
Irx4
Nduf
s6
Mrp
l36
Lpca
t1
Slc6a
3
Clptm
1l
Tert
Slc6a
18
Slc6a
19
5430
425J
12Ri
k
Slc12
a7
Nkd2
Trip1
3
Brd9
Zd
hhc1
1
Tppp
Cep7
2
Gen
es
Relative Value mRNA Expression Level
WT MHCII hi m
TEC
WT MHCII lo mTEC
A B
Aire‐de
pend
ent u
p‐regu
lated TR
AsAire‐de
pend
ent d
own‐
regu
lated TR
AsAire‐inde
pend
ent d
own‐
regu
lated TRA
sAire‐inde
pend
ent u
p‐regu
lated TR
AsUnregulated
TRA
s
Aire‐de
pend
ent u
p‐regu
lated no
n‐TR
As
Aire‐de
pend
ent d
own‐
regu
lated no
n‐TR
As
Aire‐inde
pend
ent d
own‐
regu
lated no
n‐TR
As
Aire‐inde
pend
ent u
p‐regu
lated no
n‐TR
As
Unregulated
non
‐TRA
s
Non
‐TRA
s
TRAs
Regu
lated
Regu
lated
Aire‐de
pend
ent u
p‐regu
lated TR
AsAire‐de
pend
ent d
own‐
regu
lated TR
AsAire‐inde
pend
ent d
own‐
regu
lated TRA
sAire‐inde
pend
ent u
p‐regu
lated TR
AsUnregulated
TRA
s
Aire‐de
pend
ent u
p‐regu
lated no
n‐TR
As
Aire‐de
pend
ent d
own‐
regu
lated no
n‐TR
As
Aire‐inde
pend
ent d
own‐
regu
lated no
n‐TR
As
Aire‐inde
pend
ent u
p‐regu
lated no
n‐TR
As
Unregulated
non
‐TRA
s
Non
‐TRA
s
TRAs
Regu
lated
Regu
lated

Results
84
Figure 23
Example of cluster 13 on mouse chromosome 13
(A) 364 clusters, ranging from 4 - 117 TRAs were identified. Here, an example of one such TRA cluster onto which the projection of mouse mTEC differentially regulated genes is depicted. Color code legend represents each type of gene set, Aire-dependent (red and blue boxes, filled colored boxes-TRAs; non-filled colored boxes-non-TRAs) and -independent (orange and green boxes; filled colored boxes-TRAs, unfilled colored boxes-non-TRAs) differentially regulated genes between MHCIIlo and MHCIIhi mTECs as well as remaining unregulated genes (cyan-TRAs and white-non-TRAs boxes). TRAs were intermingled with non-TRAs. No pure TRAs cluster was identified. Aire-dependent and-independent genes were interspersed among each other. The gray box depicts TRAs and the brown box represents the non-TRAs. While the red and maroon circles within these boxes represent the regulated TRAs or non-TRAs respectively. The orange arrow represents the region in which real-time PCR analysis was performed to confirm the gene regulation within a cluster.
(B) Real-time PCR analysis of a region (marked by orange arrow Figure 23A) of cluster 13 on chromosome 13 in WT MHCIIlo and MHCIIhi mTECs, normalized to Ubiquitin. It was observed that the genes detected by the microarray to be differentially expressed (either up- or down-regulated) between MHCIIlo and MHCIIhi mTECs reflect the same expression pattern using PCR. Dotted line represents the level of Aire expression in MHCIIlo mTECs, which was considered as a minimal expression threshold.
The set of differentially expressed genes projected onto the genome-wide clusters are deduced from bioinformatic processing of the microarrays which is likely to be incomplete. Even though chips contain all known well annotated genes, array analysis is less sensitive than real-time PCR and promiscuously expressed genes are expressed at low levels. Therefore, the total number of differentially expressed promiscuous genes will be underestimated by at least a factor of two. Hence, to gain a more complete, true picture of gene regulation within clusters and to study if neighboring genes are regulated as a unit or whether individual genes are subjected to differential regulation as observed with the array data, we performed real-time PCR. A core region of cluster 13 on chromosome 13 was selected and differential gene expression within this region was analyzed using real-time PCR in MHCIIlo/hi WT mTECs (Figure 23B; region marked orange arrow). It was observed that the genes depicted on the microarrays to be differentially expressed (either up- or down-regulated) between MHCIIlo and MHCIIhi mTECs reflect the same expression pattern using PCR (Figure 23B; Slc6a3, Lpcat1, Slc12a7 and Nkd2). Some, genes considered to be unregulated did not always follow the array expression and were differentially regulated (Figure 23B; e.g. Irx2, Tppp and Tert). Taking the level of Aire expression in MHCIIlo
mTECs as a minimal expression threshold, it was observed that several genes qualified as expressed and their expression was higher than that in microarrays. A three-log difference in expression was seen for certain genes (Figure 23B e.g. Slc6a3, Slc6a18). In addition, the Aire dependency of the genes within this cluster region was studied using Aire KO. Most of them had the same pattern of expression on both platforms i.e. array and PCR (data not shown).

Results
85
Overall, a heterogeneous contiguous expression pattern was observed in mTECs at the qualitative level using real-time PCR (with the exception of Slc6a19, which was detected in complete thymus but not purified WT mTECs). Extrapolating from the gene array analysis, we estimate ~10 % of all known genes are turned on in mature MHCIIhi mTECs in addition to differentiation-dependent genes. This however is an under-estimate due to a methodological limitation, as the currently available genome-wide screening microarray platform has low sensitivity. Use of most modern Deep Sequencing technology may eventually precisely define the promiscuously expressed gene pool.
3.1.5.3. Are TRAs regulated over non-TRAs within gene clusters in murine
mTECs?
Within each cluster, TRAs were intermingled with non-TRAs (Figure 23A). It was of interest to study, if the TRAs within clusters are preferentially regulated in mTECs over the non-TRAs. Hence, the proportion of regulated TRAs vs. regulated non-TRAs from each of the 364 clusters was statistically analyzed. Combined regulation within all 364 clusters showed that there was a higher tendency of the TRAs being regulated within the clusters versus that of the non-TRAs. 11.7 % TRAs versus 4.6 % non-TRAs were regulated (Figure 24). The preferential TRA regulation within clusters is highly significant (p ≤ 2.2 x 10⁻¹⁶). The percentage of regulation of TRAs within clusters ranged from 0 to 50 %.

Results
86
11.7%
4.6%
Percen
tage
11.7%
4.6%
Percen
tage
200
4060
Percen
tage
TRAs Regulated Non‐TRAs Regulated
11.7%
4.6%
11.7%
4.6%
Percen
tage
11.7%
4.6%
Percen
tage
200
4060
Percen
tage
TRAs Regulated Non‐TRAs Regulated
11.7%
4.6%
Figure 24
Preferential regulation of TRAs within clusters
Over the 364 clusters, the regulation of TRAs versus non-TRAs (e.g. red and maroon circles, Figure 23A) was plotted. The extent of the TRAs being regulated within the clusters was higher versus that of the non-TRAs. This difference is highly significant having a p ≤ 2.2 x 10⁻¹⁶.
3.1.5.4. Analysis of the differentially expressed gene content in rat mTECs
In rat, the mTECs were separated into immature and mature cells based on MHCII as in mouse and human. 700 genes were found to be differentially expressed from 22,000 annotated rat genes. From these, 360 were up-regulated and 340 were down-regulated.
An ortholog match between rat and mouse using HomoloGene (NCBI), showed 624 mouse orthologs (from 700 differentially expressed genes), 94.4 % of which were also differentially regulated in mouse (589 genes) (Table 3.4). 75.7 % up-regulated and 64.3 % down-regulated genes followed the same regulation pattern in rat and mouse. Thus, there exists a large over-lap of promiscuously expressed genes between these two species, further corroborating the notion of an evolutionary conservation of pGE.
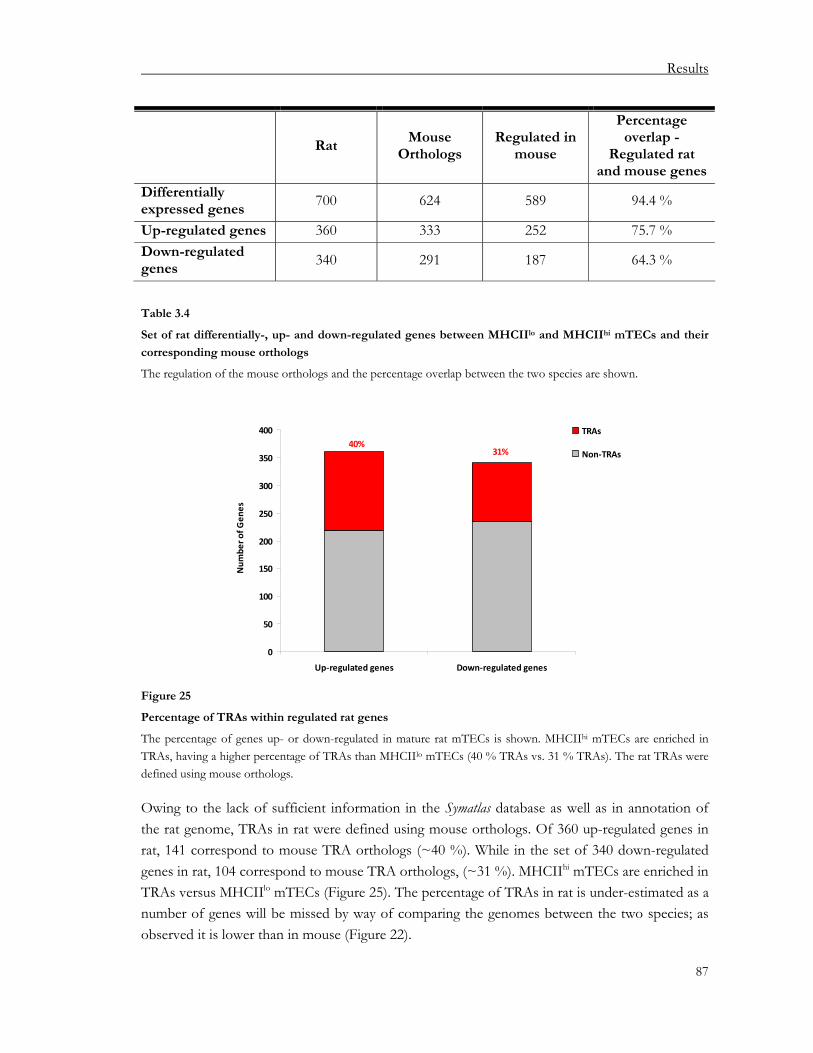
Results
87
Rat Mouse
Orthologs Regulated in
mouse
Percentage overlap -
Regulated rat and mouse genes
Differentially expressed genes
700 624 589 94.4 %
Up-regulated genes 360 333 252 75.7 % Down-regulated genes
340 291 187 64.3 %
Table 3.4
Set of rat differentially-, up- and down-regulated genes between MHCIIlo and MHCIIhi mTECs and their
corresponding mouse orthologs
The regulation of the mouse orthologs and the percentage overlap between the two species are shown.
0
50
100
150
200
250
300
350
400
Up‐regulated genes Down‐regulated genes
Num
ber o
f Gen
es
TRAs
Non‐TRAs40%
31%
Figure 25
Percentage of TRAs within regulated rat genes
The percentage of genes up- or down-regulated in mature rat mTECs is shown. MHCIIhi mTECs are enriched in TRAs, having a higher percentage of TRAs than MHCIIlo mTECs (40 % TRAs vs. 31 % TRAs). The rat TRAs were defined using mouse orthologs.
Owing to the lack of sufficient information in the Symatlas database as well as in annotation of the rat genome, TRAs in rat were defined using mouse orthologs. Of 360 up-regulated genes in rat, 141 correspond to mouse TRA orthologs (~40 %). While in the set of 340 down-regulated genes in rat, 104 correspond to mouse TRA orthologs, (~31 %). MHCIIhi mTECs are enriched in TRAs versus MHCIIlo mTECs (Figure 25). The percentage of TRAs in rat is under-estimated as a number of genes will be missed by way of comparing the genomes between the two species; as observed it is lower than in mouse (Figure 22).

Results
88
3.1.5.5. Analysis of the differentially expressed gene content in human
mTECs
The immature and mature mTECs (MHCIIlo and MHCIIhi respectively) from 11 different individuals ranging from 3 days to 3 years of age were isolated from their thymus. The mTECs were enriched using three different methods (Density gradients, depletion of CD45+ cells using either Dynal beads or Miltenyi beads) as described earlier (Section 2.2.3.3). Gene array results showed substantial variations in the number of differentially expressed gene between the different individuals. The number of differentially expressed genes ranged from ~700 to 6000 (Table 3.5A). Differences were observed irrespective of the different isolation methods used. Hence, it can be excluded that the variation arose due to the isolation methods used.
Seeking for a common set of differentially expressed genes between individuals we found a negative correlation between the number of individuals and the number of common/overlapping genes. The intersection interval which is the extreme point in the comparison containing genes that are differentially expressed in all 11 individuals showed only 24 common differentially expressed genes, 18 genes were up-regulated and 6 genes were down-regulated (Table 3.5B). AIRE can be considered as a measure for the degree of enrichment of MHCIIhi mTECs of the individual samples. Since, AIRE is the driving force for many of the promiscuously expressed genes in the mature mTEC population, the correlation between the number of differentially expressed genes and fold change in AIRE expression was determined. There does exist a correlation between the fold change in AIRE expression (between MHCIIlo and MHCIIhi
mTECs) and the number of differentially expressed genes, (correlation coefficient, r = 0.5), though two individual samples were outliers (Table 3.5C and Figure 26).
This is the first time that such striking inter-individual difference in pGE is found, though Taubert et al. also reported considerable variability in the expression of several target auto-antigens in mTECs (Taubert et al., 2007). These variations could result from differences in the genetic background, environmental factors, disease/health condition of the individuals and pre-medication. The observed variations in antigen expression are likely to influence T-cell repertoire selection and thus tolerance thresholds in human provided they reflect steady state values.
Taken together, the results in the three species show that promiscuously expressed genes are enriched in TRAs that are partitioned into clusters and this phenomenon is conserved between species. Clusters harbor both TRAs and non-TRAs that are interspersed between each other. TRAs are preferentially regulated during mTEC differentiation. Moreover, genes within a particular gene cluster are subject to partial co-regulation. The bulk of the TRA clusters contain structurally unrelated genes. Based on these data, we propose these clusters to be the “operational genomic unit” of pGE in the thymus.
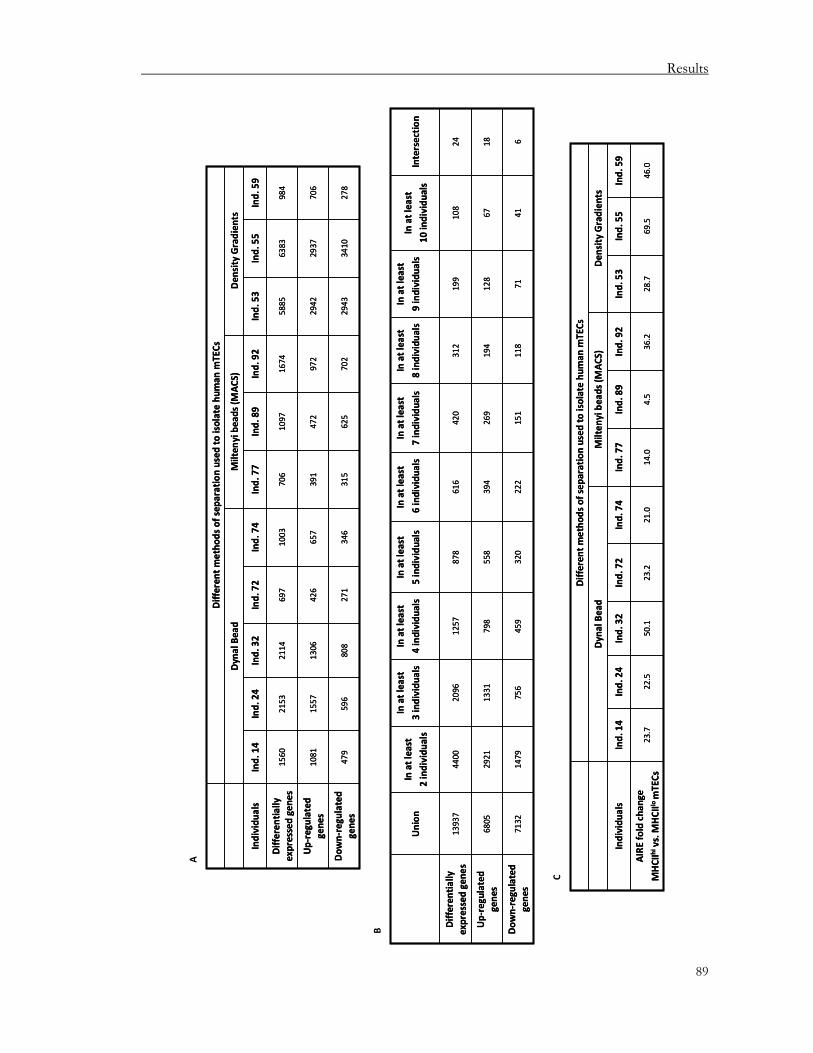
Results
89
Differen
t metho
ds of sep
aration used
to isolate hu
man
mTECs
Dynal Bead
Milten
yi beads (M
ACS)
Den
sity Gradien
ts
Individu
als
Ind. 14
Ind. 24
Ind. 32
Ind. 72
Ind. 74
Ind. 77
Ind. 89
Ind. 92
Ind. 53
Ind. 55
Ind. 59
Differen
tially
expressed gene
s15
6021
5321
1469
710
0370
610
9716
7458
8563
8398
4
Up‐regu
lated
gene
s10
8115
5713
0642
665
739
147
297
229
4229
3770
6
Dow
n‐regulated
gene
s47
959
680
827
134
631
562
570
229
4334
1027
8
Differen
t metho
ds of sep
aration used
to isolate hu
man
mTECs
Dynal Bead
Milten
yi beads (M
ACS)
Den
sity Gradien
ts
Individu
als
Ind. 14
Ind. 24
Ind. 32
Ind. 72
Ind. 74
Ind. 77
Ind. 89
Ind. 92
Ind. 53
Ind. 55
Ind. 59
Differen
tially
expressed gene
s15
6021
5321
1469
710
0370
610
9716
7458
8563
8398
4
Up‐regu
lated
gene
s10
8115
5713
0642
665
739
147
297
229
4229
3770
6
Dow
n‐regulated
gene
s47
959
680
827
134
631
562
570
229
4334
1027
8
Union
In at least
2 individu
als
In at least
3 individu
als
In at least
4 individu
als
In at least
5 individu
als
In at least
6 individu
als
In at least
7 individu
als
In at least
8 individu
als
In at least
9 individu
als
In at least
10 in
dividu
als
Intersectio
n
Differen
tially
expressed gene
s13
937
4400
2096
1257
878
616
420
312
199
108
24
Up‐regulated
gene
s68
0529
2113
3179
855
839
426
919
412
867
18
Dow
n‐regu
lated
gene
s71
3214
7975
645
932
022
215
111
871
416
Differen
t metho
ds of sep
aration used
to isolate hu
man
mTECs
Dynal Bead
Milten
yi beads (M
ACS)
Den
sity Gradien
ts
Individu
als
Ind. 14
Ind. 24
Ind. 32
Ind. 72
Ind. 74
Ind. 77
Ind. 89
Ind. 92
Ind. 53
Ind. 55
Ind. 59
AIRE fold cha
nge
MHCIIhi vs. M
HCIIlo
mTECs
23.7
22.5
50.1
23.2
21.0
14.0
4.5
36.2
28.7
69.5
46.0
A
B
C

Results
90
Table 3.5
Representation of gene expression data from different individual thymi
Human mTECs (MHCIIlo and MHCIIhi) were isolated from thymus samples for 11 different individuals ranging from 3 days to 3 years of age. The mTECs were enriched using three different methods (Density gradients, Dynal beads and Miltenyi beads) as described earlier (Section 2.2.3.3).
(A) Comparison of differentially-, up- and down-regulated genes between MHCIIlo and MHCIIhi mTECs from each individual thymus.
(B) Number of differentially-, up- and down-regulated genes expressed in at least “n” individuals, n = 2 to 10. Union and intersection intervals are the extreme points in the comparison: where union means all genes that are found to be differentially expressed in at least one individual; intersection contains genes that are differentially expressed in all 11 individuals.
(C) Fold change of AIRE expression between MHCIIlo and MHCIIhi mTECs from individual thymi.
Fold Change in AIRE (mature to immature mTECs)
Num
ber o
f Differen
tially Expressed
Gen
es
Fold Change in AIRE (mature to immature mTECs)
Num
ber o
f Differen
tially Expressed
Gen
es
Figure 26
Correlation between number of differentially expressed genes and fold change in AIRE expression in the
different individual thymi
Correlation plot of the number of differentially expressed genes and fold change in AIRE expression between MHCIIhi and MHCIIlo mTECs in the 11 individual samples, (correlation coefficient, r = 0.5). Two individual samples were outliers.

Results
91
3.2. “Holes” in the thymic antigen repertoire: implications for central
tolerance and autoimmunity
Genome-wide studies of pGE in mTECs showed a respectful representation of the genome in the thymic antigen repertoire, but this is not a complete representation. “Holes” or absence in expression of certain genes in the thymus, should lead to lack of central tolerance for particular antigens, therefore it would be a preferential target for autoimmune disease. An important question in organ-specific autoimmune diseases is: why the loss of self-tolerance is so selective that only certain tissues and auto-antigens are targeted?
Two prominent examples of target antigens in autoimmune diseases are: glutamic acid decarboxylase (GAD) involved in insulin-dependent diabetes (IDD) (Tisch, 1996; Yoon et al., 2000; Lernmark, 2002) and cardiac myosin heavy chain (MyHC) involved in myocarditis (Wolfgram et al., 1985; Neu et al., 1987; Rose, 2000). Both cases involve two isoforms in which the expression of either one of the two is lacking in the thymus. This lack of expression may represent a “pitfall” of pGE. It is possible that the non-expressed isoform is embedded in a silent chromosomal context i.e. “region of closed chromatin’’. We started to investigate this possibility by analyzing the thymic expression of the flaking regions of these gene loci.
3.2.1. Regulation of the GAD65/GAD67 loci in human thymus
Glutamic acid decarboxylase (GAD), a target of both auto-antibodies and autoreactive T-cells in insulin-dependent diabetes (IDD), exists as two homologous forms, GAD65 and GAD67. GAD65 is predominantly expressed in human islets (pancreas) and recognized by auto-antibodies in IDD, but which form primarily elicits GAD autoimmunity is unknown. Gotter and colleagues showed that GAD65 is apparently absent from mTECs of healthy humans and thus is likely to be absent from the human thymus while GAD67 is present in the thymus (in mTECs). Its absence in the thymus, i.e. lack of central tolerance could explain the occurrence of specific autoantibodies in the course of IDD, as an inverse expression pattern is observed between occurrence of GAD65 antibodies and thymic expression (Gotter et al., 2004). Why is GAD65 not expressed in the thymus? Are there certain molecular clues in terms of its genomic position? To answer the above questions the expression of the GAD65 locus spanning ~2 Mb was analyzed in the different mTEC subsets.
The GAD65 and GAD67 clusters are evolutionary conserved in human and mouse (Figures 27 and 28).

Results
92
Human Chromosome 2
Mouse Chromosome 2
50M
100M
150M
Human Chromosome 2
Mouse Chromosome 2
Human Chromosome 2
Mouse Chromosome 2
50M
100M
150M
A
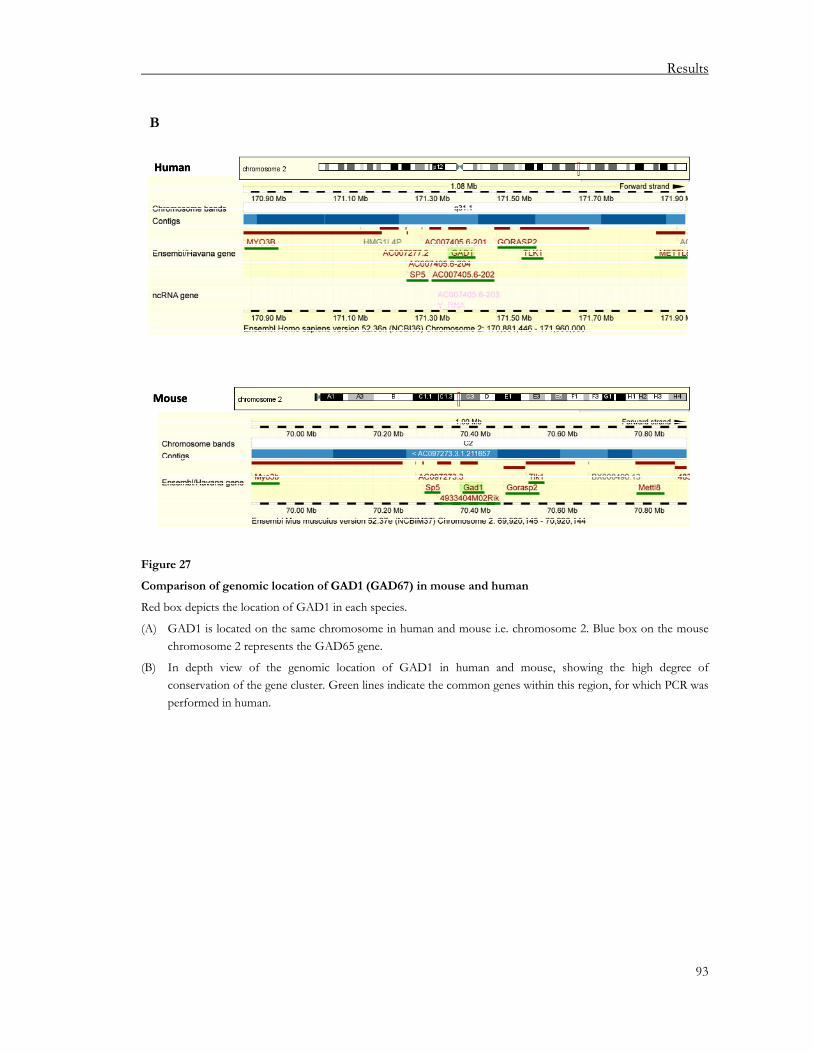
Results
93
Mouse
Human
Mouse
Human
Figure 27
Comparison of genomic location of GAD1 (GAD67) in mouse and human
Red box depicts the location of GAD1 in each species.
(A) GAD1 is located on the same chromosome in human and mouse i.e. chromosome 2. Blue box on the mouse chromosome 2 represents the GAD65 gene.
(B) In depth view of the genomic location of GAD1 in human and mouse, showing the high degree of conservation of the gene cluster. Green lines indicate the common genes within this region, for which PCR was performed in human.
B

Results
94
Human Chromosome 10
Mouse Chromosome 2
50M
100M
150M
Human Chromosome 10
Mouse Chromosome 2
Human Chromosome 10
Mouse Chromosome 2
50M
100M
150M
Mouse
Human
Mouse
Human
B
A

Results
95
Figure 28
Comparison of genomic location of GAD2 (GAD65) in mouse and human
Red box depicts the location of GAD2 in each species.
(A) GAD2 is located on a different chromosome in human and mouse i.e. chromosome 10 in human and chromosome 2 in mouse, 47 Mb down-stream of GAD1. Blue box on the mouse chromosome 2 represents the GAD1 gene.
(B) In depth view of the genomic location of GAD2 in human and mouse, showing the high degree of conservation of the gene cluster. Green lines indicate the common genes within this region, for which PCR was performed in human. Even though the region is located on different chromosomes it is highly conserved, though the regulation differs in both species, that being expressed in mouse, while absent in human.
Real-time PCR analysis of both loci in human, showed that all genes within the GAD67 cluster were expressed in the thymus, GORASP2 showed the lowest expression. Most genes were not differentially regulated between MHCIIhi and MHCIIlo mTECs, except for SP5 and GAD67. The entire gene locus had a rather regular expression with genes 5’ to GAD67 being more strongly expressed (Figure 29A; MYO3B, SP5, AC007405). Interestingly, in the GAD65 locus, most genes were expressed, though not differentially between the two mTEC subsets. Expression was however more variable than in the GAD67 locus, with low to almost absent levels of expression for GPR158 and GAD65 in the thymus or purified mTEC populations. Intriguingly, MYO3A that is located between these two genes was expressed at relatively high levels (Figure 29B). Moreover, genes immediately downstream 3’ to GAD65 showed a lower expression (Figure 29B; APBB1IP, PDSS1, SSH3BP). Thus, the lack of expression of GAD65 may be related to the low overall transcriptional activity 3’ to GAD65.
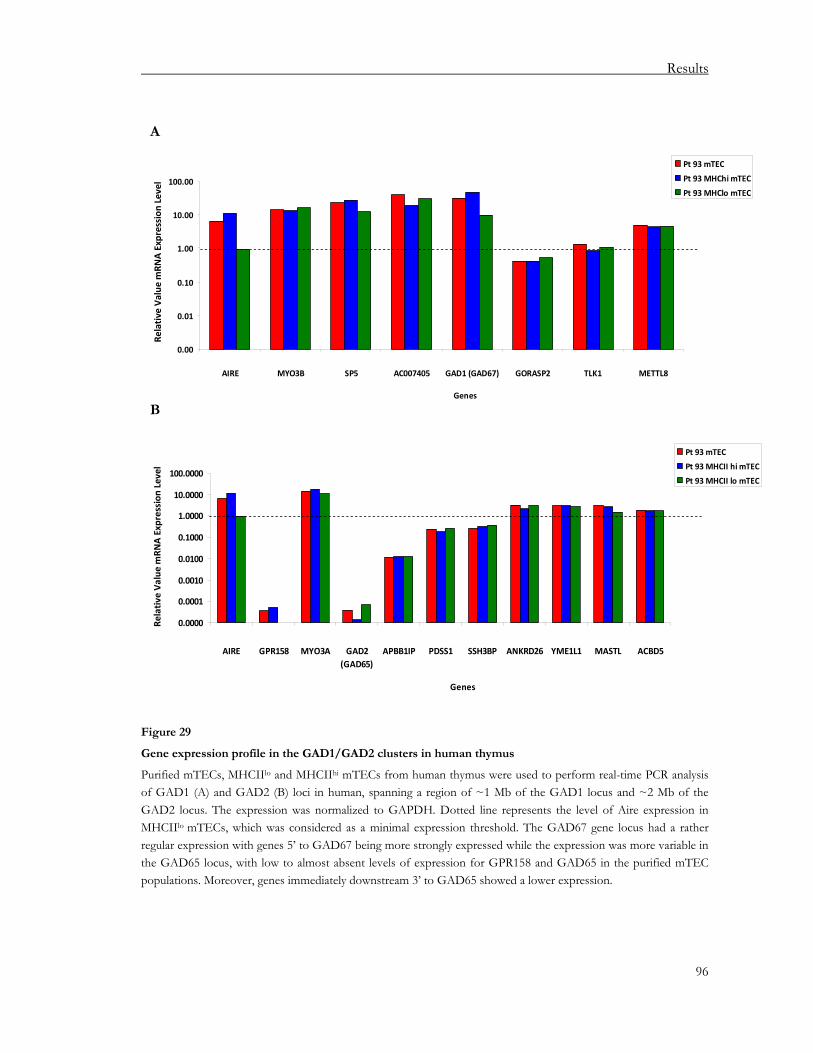
Results
96
0.00
0.01
0.10
1.00
10.00
100.00
AIRE MYO3B SP5 AC007405 GAD1 (GAD67) GORASP2 TLK1 METTL8
Genes
Relativ
e va
lue mRN
A exp
ression leve
lPt 93 mTEC
Pt 93 MHChi mTEC
Pt 93 MHClo mTEC
Relative Value
mRN
A Expression Level
0.00
0.01
0.10
1.00
10.00
100.00
AIRE MYO3B SP5 AC007405 GAD1 (GAD67) GORASP2 TLK1 METTL8
Genes
Relativ
e va
lue mRN
A exp
ression leve
lPt 93 mTEC
Pt 93 MHChi mTEC
Pt 93 MHClo mTEC
Relative Value
mRN
A Expression Level
0.0000
0.0001
0.0010
0.0100
0.1000
1.0000
10.0000
100.0000
AIRE GPR158 MYO3A GAD2(GAD65)
APBB1IP PDSS1 SSH3BP ANKRD26 YME1L1 MASTL ACBD5
Genes
Relative
value
mRN
A exp
ression leve
l
Pt 93 mTEC
Pt 93 MHCII hi mTEC
Pt 93 MHCII lo mTEC
Relative
Value
mRN
A Expression Level
0.0000
0.0001
0.0010
0.0100
0.1000
1.0000
10.0000
100.0000
AIRE GPR158 MYO3A GAD2(GAD65)
APBB1IP PDSS1 SSH3BP ANKRD26 YME1L1 MASTL ACBD5
Genes
Relative
value
mRN
A exp
ression leve
l
Pt 93 mTEC
Pt 93 MHCII hi mTEC
Pt 93 MHCII lo mTEC
Relative
Value
mRN
A Expression Level
Figure 29
Gene expression profile in the GAD1/GAD2 clusters in human thymus
Purified mTECs, MHCIIlo and MHCIIhi mTECs from human thymus were used to perform real-time PCR analysis of GAD1 (A) and GAD2 (B) loci in human, spanning a region of ~1 Mb of the GAD1 locus and ~2 Mb of the GAD2 locus. The expression was normalized to GAPDH. Dotted line represents the level of Aire expression in MHCIIlo mTECs, which was considered as a minimal expression threshold. The GAD67 gene locus had a rather regular expression with genes 5’ to GAD67 being more strongly expressed while the expression was more variable in the GAD65 locus, with low to almost absent levels of expression for GPR158 and GAD65 in the purified mTEC populations. Moreover, genes immediately downstream 3’ to GAD65 showed a lower expression.
B
A
Results
97
3.2.2. Regulation of the MYH6/MYH7 locus in human and murine thymus
The next target gene studied was the cardiac myosin heavy chain (MyHC), a primary contractile protein of the heart which is involved in the pathogenesis of myocarditis. Myocarditis is the most common cause of heart failure in young individuals (Towbin et al., 2006). Individuals after open-heart surgery and myocardial infarction show auto-antibody responses against cardiac tissue-specific antigens, the most prominent of which is MyHC (Wolfgram et al., 1985; Neu et al., 1987). The heart expresses two highly homologous isoforms of MyHC, that differ by 6.5 % in their amino acid sequence: α-MyHC (MYH6), is expressed exclusively in cardiac muscle and β-MyHC (MYH7), is expressed in both cardiac and slow (type I) skeletal muscle (Weiss and Leinwand, 1996). In humans, β-MyHC is the major isoform expressed in heart, though autoimmune myocarditis is initiated by Th1 CD4 T-cell immune responses against α-MyHC. It was shown that IgG auto-antibodies are initially directed against unique epitopes of α-MyHC, but these responses rapidly broaden to epitopes of α-MyHC that are shared with β-MyHC, followed by recognition of other cardiac proteins. The basis of the immunogenicity unique to the α-MyHC isoform had been unclear. It was plausible that the same reasoning could apply as in the case of GAD65 where its absence in the thymus, i.e. lack of central tolerance, could explain the frequent occurrence of specific autoantibodies. Thus, the thymic expression of MYH6 and MYH7 in different mTEC subsets was analyzed.
The MYH6 and MYH7 gene loci are evolutionary highly conserved in human and mouse and present within a syntenic region on chromosome 14 (Figure 30). These two genes are adjacent to each other in both mouse and human (Figure 30B).

Results
98
Human Chromosome 14Mouse Chromosome 14 Human Chromosome 14Mouse Chromosome 14 Human Chromosome 14Mouse Chromosome 14
A

Results
99
HumanHumanHuman
MouseMouse
Figure 30
Comparison of genomic location of MYH6 and MYH7 in mouse and human
Red box depicts the location of MYH6 and MYH7 in each species.
(A) MYH6 and MYH7 are located on chromosome 14 in human and mouse.
(B) In depth view of the genomic location shows a high degree of conservation of the MYH gene cluster. Green lines indicate human/mouse MYH6 and MYH7 orthologs, for which PCR was performed. In both species the genes are immediately adjacent to each other, ~ 28-30 kb apart. They differ by 6.5 % in their amino acid sequence.
B

Results
100
Real-time PCR of these two genes in mouse (Figure 31A) and human (Figure 31B) mTECs showed that the transcripts for α-MyHC (MYH6) were absent, while they were present for β-MyHC (MYH7). A similar situation was described above for GAD65 and GAD67. What is more striking is that MYH6 and MYH7 are not only present within the same gene cluster but are adjacent genes. Thus, the predominant autoimmune response to MYH6 in mouse and man is correlated with a lack of its expression in mTECs and thus is likely to be absent in the thymus.
A
0.0000001
0.0000010
0.0000100
0.0001000
0.0010000
0.0100000
0.1000000
1.0000000
10.0000000
Atria Ventricle Brain Thymus mTEC cTEC
Tissue/Cell types
Relative
Value
mRN
A Expression Level Myh6
Myh7
Gad67
0.0000001
0.0000010
0.0000100
0.0001000
0.0010000
0.0100000
0.1000000
1.0000000
10.0000000
Atria Ventricle Brain Thymus mTEC cTEC
Tissue/Cell types
Relative
Value
mRN
A Expression Level Myh6
Myh7
Gad67

Results
101
B
0.0000010.000010.00010.0010.010.11
10
Atria mTEC cTEC Ventricle mTEC cTEC
Brain mTEC cTEC0.0000010.000010.00010.0010.010.11
10
Brain mTEC cTEC
Pt 87Pt 88Pt 89
MyH6 MyH7
GAD67 GAD65
0.0000010.000010.00010.0010.010.11
10
Atria mTEC cTEC
Relative Value
mRNA Expression Level
Ventricle mTEC cTEC
Brain mTEC cTEC0.0000010.000010.00010.0010.010.11
10
Brain mTEC cTEC
Pt 87Pt 88Pt 89
Pt 87Pt 88Pt 89
MyH6 MyH7
GAD67 GAD65
0.0000010.000010.00010.0010.010.11
10
Atria mTEC cTEC Ventricle mTEC cTEC
Brain mTEC cTEC0.0000010.000010.00010.0010.010.11
10
Brain mTEC cTEC
Pt 87Pt 88Pt 89
Pt 87Pt 88Pt 89
MyH6 MyH7
GAD67 GAD65
0.0000010.000010.00010.0010.010.11
10
Atria mTEC cTEC
Relative Value
mRNA Expression Level
Ventricle mTEC cTEC
Brain mTEC cTEC0.0000010.000010.00010.0010.010.11
10
Brain mTEC cTEC
Pt 87Pt 88Pt 89
Pt 87Pt 88Pt 89
MyH6 MyH7
GAD67 GAD65
Figure 31
Expression patterns of MYH6 and MYH7 in mouse and human thymi
Purified mTECs and cTECs from mouse (A) and human (B) thymi were used to perform real-time PCR analysis of MYH6 and MYH7. The expression was normalized to beta-actin in mouse and GAPDH in human and relative to the respective positive organ (red bars), i.e. Atria for MYH6 expression, Ventricle for MYH7 expression and Brain for GAD67 or GAD65 expression. GAD67 was taken as the positive control, while GAD65 as the negative control for human mTECs. Real-time PCR in both mouse and human mTECs showed that the α-MyHC transcripts (MYH6) were absent, while present for β-MyHC (MYH7).

Results
102
3.3. Study of pGE in mTEC subsets expressing a particular antigen
The population studies done prior in mouse and rat shows a fair representation of the genome in the thymic antigen repertoire. PGE was conserved between the studied species, however in the case of human the promiscuously expressed gene pool varied considerably. Previous studies showed that an individual gene is expressed in only few (~1-3 %) mTECs (Derbinski et al., 2001; Cloosen et al., 2007; Taubert et al., 2007) and that genes within the casein locus were stochastically expressed in single cells (Derbinski et al., 2008). What decides which given gene/group of genes is expressed in a single mTEC? Do individual mTECs have a free choice of selecting any combination of genes or do restrictions for co-expression exist? Conceivably the expression of a given gene would co-induce the expression of a certain set of linked genes. To address these intricate questions, mTECs that express a particular antigen were studied. The feasibility of this approach had been demonstrated by J. Arnold using antibodies to surface expressed antigens, mucin-1 (MUC1) and carcinoembryonic antigen (CEA) (Arnold, 2006).
3.3.1. Co-expression studies of MUC1 expressing mTECs at the population
level
Previous studies at the population level indicated the existence of certain rules of co-expression; expression not does appear to be purely stochastic. Human MUC1+ mTECs co-express CEACAM5 and MUC4 (Arnold, 2006). The frequency of co-expression was far above that expected on a stochastic basis; this implied a co-expression at the single cell level as well.
The same methodology of isolating MUC1 expressing mTEC as described by J. Arnold was used and extended in this study. MUC1+ and MUC1- mTECs were sorted by flow cytometry (Sections 2.2.3.3.1, 2.2.3.3.4 and 2.2.3.3.5). From the sort profile (Figure 32) a clear population of MUC1+ mTECs could be distinguished. These cells were primarily MHCIIhi, while the MUC1- mTECs covered the entire range of MHCII levels. The top 2 % MUC1+ cells and the lower 4-5 % MUC1- cells were sorted (Arnold, 2006; Cloosen et al., 2007), yielding rather low cell numbers in the range of 10,000-50,000 sorted cells per thymus sample. Hence we were limited in studying these cell populations.

Results
103
Figure 32
Isolation of MUC1 antigen expressing mTECs from human thymus
The human MUC1 expressing mTECs were stained and sorted for their (A) MUC1 expression versus non-expression negative control without MUC1 antibody (B). From the sort profile a clear population of MUC1+ mTECs being primarily MHCIIhi could be distinguished (C). The top 2 % MUC1+ cells and the lower 4-5 % MUC1- cells were sorted.
Nonetheless, RNA was isolated, cDNA was prepared (Section 2.2.6) and qPCR was performed (Section 2.2.8). MUC1 mRNA was enriched in all samples in the MUC1+ mTECs versus the MUC1- mTECs. Co-expression of MUC1 with MUC4 (a family member) and CEACAM5 at the population level was confirmed and further extended to other members of the CEA gene family. Interestingly the CEA family on chromosome 19 was only partially represented. MUC1 was also co-expressed with CEACAM6, though the expression of genes flanking CEACAM5 and CEACAM6, (CEACAM4, CEACAM7 and CEACAM3) were not up-regulated (low to absent) in MUC1+ mTECs (Figures 33 and 34). Results were consistent for two individuals shown here as well as for an additional one (data not shown). Thus, inter-chromosomal co-expression patterns at the population level were confirmed as MUC1 is located on chromosome 1 while MUC4 is on chromosome 4 and CEACAM5 and CEACAM6 are on chromosome 19.
B A C

Results
104
B
A

Results
105
Figure 33
Genomic location of MUC1, MUC4 and CEA cluster in human
Location of MUC1 on chromosome 1 (A) MUC4 on chromosome 4 (B) and the CEA cluster on chromosome 19, consisting of CEACM4, CEACM7, CEACAM5, CEACAM6 and CEACM3 (C). All genes for inter-chromosomal co-expression in human MUC1+ mTECs studied by qPCR are underlined in green.
C

Results
106
0.0
10.0
20.0
30.0
40.0
50.0
60.0
Pt 94 MUC1+
Pt 94 MUC1‐
Pt 83 MUC1+
Pt 83 MUC1‐
Cell types
relative
value mRNA expression level MUC1
MUC4CEACAM4CEACAM7CEACAM5CEACAM6CEACAM3
Chr. 1
Chr. 3
Chr. 19
Relative Value
mRNA Expression Level
0.0
10.0
20.0
30.0
40.0
50.0
60.0
Pt 94 MUC1+
Pt 94 MUC1‐
Pt 83 MUC1+
Pt 83 MUC1‐
Cell types
relative
value mRNA expression level MUC1
MUC4CEACAM4CEACAM7CEACAM5CEACAM6CEACAM3
Chr. 1
Chr. 3
Chr. 19
Relative Value
mRNA Expression Level
Figure 34
Co-expression patterns in human MUC1+ and MUC1- mTECs
Purified MUC1+ and MUC1- sorted mTECs were isolated from human thymus of two individuals (83 and 94). The expression was normalized to GAPDH. MUC1 was enriched 7-19 fold in MUC1+ mTECs of both samples. Co-enrichment of MUC4 was observed in MUC1+ mTECs, however within the CEA cluster only CEACAM5 and CEACM6 were co-expressed with MUC1 in MUC1+ mTECs. CEACAM3 was modestly up-regulated and CEACAM4 and CEACAM7 were hardly different between both subsets. Though, CEACAM3 and CEACAM7 were barely detected in only one of the duplicates of both samples tested by PCR hence, it was considered low to absent.
To obtain a broader view of co-expression patterns, genome-wide microarrays were performed. Owing to the low cell number a modified protocol had to be established. We opted to use the µMACS™ SuperAmp™ Technology (Miltenyi Biotech), which can linearly amplify RNA of small/rare cell populations. We established this technology to hybridize the amplified labelled cDNA onto Illumina’s expression profiling whole genome BeadArrays (Section 2.2.10) (Pinto et al., 2009). For this method RNA from only 6000 cells was used.
Technical replicates of individual samples confirmed the reproducibility of the procedure of µMACS™ SuperAmp™ Technology for Illumina’s expression profiling whole genome BeadArrays hybridization microarray analysis. The array results showed high degrees (~46-54 %) of overlap between the 3 individuals (Figure 35). This was a striking result as prior analysis of
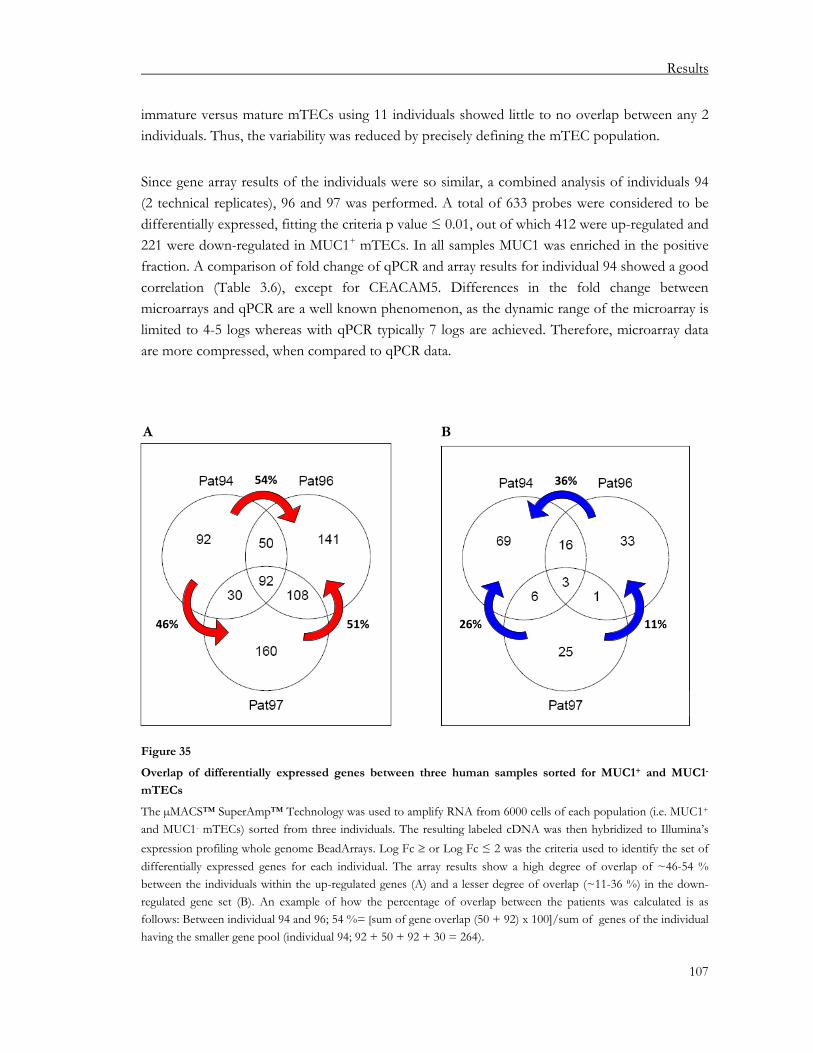
Results
107
51%46%
54%
11%26%
36%
51%46%
54%
11%26%
36%
immature versus mature mTECs using 11 individuals showed little to no overlap between any 2 individuals. Thus, the variability was reduced by precisely defining the mTEC population.
Since gene array results of the individuals were so similar, a combined analysis of individuals 94 (2 technical replicates), 96 and 97 was performed. A total of 633 probes were considered to be differentially expressed, fitting the criteria p value ≤ 0.01, out of which 412 were up-regulated and 221 were down-regulated in MUC1+ mTECs. In all samples MUC1 was enriched in the positive fraction. A comparison of fold change of qPCR and array results for individual 94 showed a good correlation (Table 3.6), except for CEACAM5. Differences in the fold change between microarrays and qPCR are a well known phenomenon, as the dynamic range of the microarray is limited to 4-5 logs whereas with qPCR typically 7 logs are achieved. Therefore, microarray data are more compressed, when compared to qPCR data.
Figure 35
Overlap of differentially expressed genes between three human samples sorted for MUC1+ and MUC1-
mTECs
The µMACS™ SuperAmp™ Technology was used to amplify RNA from 6000 cells of each population (i.e. MUC1+ and MUC1- mTECs) sorted from three individuals. The resulting labeled cDNA was then hybridized to Illumina’s expression profiling whole genome BeadArrays. Log Fc ≥ or Log Fc ≤ 2 was the criteria used to identify the set of differentially expressed genes for each individual. The array results show a high degree of overlap of ~46-54 % between the individuals within the up-regulated genes (A) and a lesser degree of overlap (~11-36 %) in the down-regulated gene set (B). An example of how the percentage of overlap between the patients was calculated is as follows: Between individual 94 and 96; 54 %= [sum of gene overlap (50 + 92) x 100]/sum of genes of the individual having the smaller gene pool (individual 94; 92 + 50 + 92 + 30 = 264).
B A

Results
108
Genes
Fold change between MUC1+
and MUC1- mTECs qPCR
(Ind. 94)
Fold change between MUC1+
and MUC1- mTECs Arrays
(Ind. 94)
Fold change between MUC1+
and MUC1- mTECs Arrays
(Ind. 94 (2x), 96, 97)
Adjusted
p value
MUC1 6.84476 2.59065 2.173945676 0.005385109
MUC4 14.1723 3.77751 4.023302348 0.018842202
CEACAM4 0.08021 0.31846 0.158109299 0.500033168 CEACAM7 6.16884 0.70515 0.477344922 0.09432146 CEACAM5 66.7178 2.40615 2.999483104 0.026334518
CEACAM6 11.3924 3.19566 3.45087004 0.004138704
CEACAM3 8.11168 1.64549 0.750290376 0.415159836
Table 3.6
Comparison of fold change between MUC1+ and MUC1- mTECs using qPCR and microarray data
There was a good correlation of the fold change using qPCR and array data for the genes studied. Single array data for individual 94 only gave very similar results as the combined analysis of individuals 94 (2 technical replicates), 96 and 97. The qPCR results for CEACAM7 and CEACAM3 are in italics as they were barely detected and their expression was considered low to negative.
MUC1+ mTECs were MHCIIhi and did not co-express AIRE at the protein level as shown by Arnold J. (Arnold, 2006). The corresponding mouse ortholog is also Aire-independent and up-regulated in mature MHCIIhi mTECs. This would classify MUC1 as an Aire-independent gene. Consistent with this, the top 50 up-regulated and down-regulated genes showed enrichment for TRAs, most of which fell into the same category of MUC1 as being “Aire-independent” (data not shown).
An enrichment test for entire chromosomes in the human genome showed that a large number of up-regulated genes tend to significantly localise to chromosome 19 (p= 0.0048 and Table 3.7). Thus, not only were CEACAM5 and CEACAM6 co-enriched but other genes of chromosome 19. The population studies were complemented by SC-PCR using the above defined set of genes.

Results
109
Table 3.7
Fisher test for the preferential localization of genes up- and down-regulated in MUC1+ mTECs on
particular chromosomes
A number of up-regulated genes tend to significantly localise to chromosome 19 (p = 0.0048), where the CEA gene family is located. This chromosome was the only one with a significance value.
Up-regulated genes Down-regulated genes
Chromosomes Fisher test score Chromosomes Fisher test score
19 0.00489853936955524 3 0.0887877646014651 0.0816691250640902 6 0.092421721283648
18 0.166085241762275 8 0.21014786017192222 0.18291302286992 14 0.22657128099545816 0.221558377398973 13 0.23847415501759315 0.259295911021636 20 0.2435075339236859 0.357044000184515 18 0.2859929355788913 0.364399857096554 7 0.3099069760569372 0.389452436158082 21 0.421170912248371
20 0.411148118189128 9 0.51307079580804512 0.550615928953208 5 0.5177574003424896 0.556374291646211 X 0.5333900336241225 0.563332106438259 16 0.541432217163013
11 0.620224867831966 17 0.5613305772294948 0.640779061541043 10 0.600634402512559
17 0.837596594112363 19 0.64030805309380221 0.846710840867452 12 0.6436631700542734 0.852563561987315 4 0.739819470812997
13 0.894241119691976 2 0.79638956778860314 0.94185061722219 11 0.86853587926921610 0.953747238622854 1 0.9050832252552937 0.973911213370496 22 0.942657592338499X 0.974752967184606 15 0.98771466552169Y 1 Y 1
Results
110
3.3.2. Co-expression studies of MUC1-expressing mTECs at the single cell
level
Population studies on co-expression patterns were complemented by single cell analysis. Multiplex reverse-transcription PCR for EpCAM, MUC1, MUC4, CEACAM3, CEACAM5 and CEACAM6 was applied. The method was performed as described by Derbinski et al. ((Derbinski et al., 2008) and Section 2.2.11).
Single-cell PCR analysis was performed on sorted MUC1+ and MUC1- mTECs purified from two human thymus samples (156-158 single cells per individual analyzed). The MUC1+ cells of both patients studied for SC-PCR gave highly consistent results. Surprisingly, EpCAM which was run as a marker gene for mTECs was barely present within either MUC1+ or MUC1- mTECs (0 % in MUC1- mTECs and 6-30 % MUC1+ mTECs). Approximately 90 % of all MUC1+ mTECs analyzed were positive for MUC1, hence a good correlation between mRNA and protein was observed. Only 8-11 % MUC1- mTECs (6-9 single cells) expressed MUC1. All the other genes analyzed were absent in MUC1- mTECs. In contrast, in MUC1+ mTECs, CECAM6 was expressed in a large number of cells, up to 67-68 % followed by MUC4 (55-67 %) and CEACAM5 (32-35 %). CEACAM3 was barely detectable in both individuals analyzed; hence it is present at low levels, which would fit the qPCR and array data (Figures 36 and 37). All together, the data shows that MUC1 is co-expressed with CEACAM6, MUC4 and CEACAM5 not only at a population level but also at the single cell level.
A correlation analysis of this dataset confirmed that co-expressed gene pairs MUC1- CEACAM6 and MUC1-MUC4 showed a high concordance index κ (Table 3.8). A weak concordance was observed for MUC1-CEACAM5, while MUC1-CEACAM3 showed no correlation at all.
In single mTECs analyzed from individual 105, the same was observed for EpCAM which was barely detected in ~10 % single cells. The basal expression frequency on random bases in single mTECs was in the range of 3-13 % (Figure 38). This was higher than comparable data published previously by Derbinski et al. in mice (Derbinski et al., 2008).
From the single cell data, it appears that there is a highly regulated rather than stochastic co-expression pattern in MUC1+ mTECs. The co-expression frequencies of the analyzed gene pool were much higher in MUC1+ mTECs than expected on a random base in single mTECs (~ 1 %).

Results
111
B A
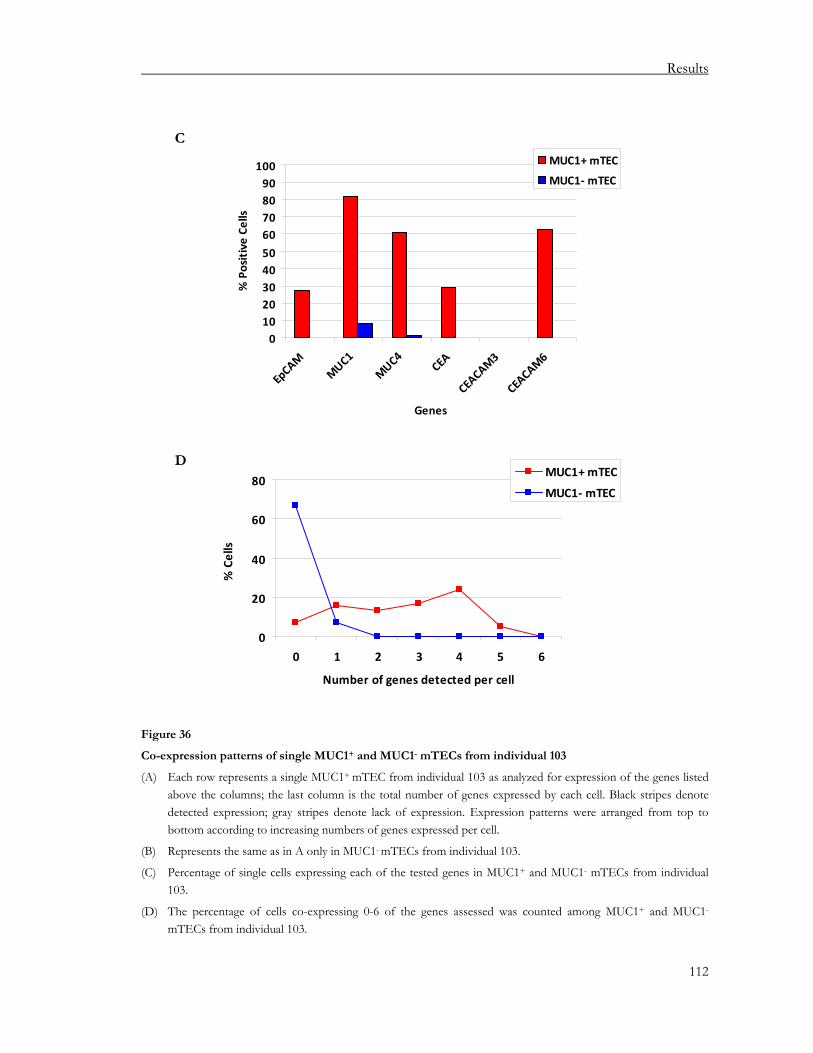
Results
112
01020304050
60708090
100
EpCAM
MUC1
MUC4
CEA
CEACAM
3
CEACAM
6
Genes
% Positive Ce
lls
MUC1+ mTEC
MUC1‐ mTEC
0
20
40
60
80
0 1 2 3 4 5 6
Number of genes detected per cell
% Cells
MUC1+ mTEC
MUC1‐ mTEC
Figure 36
Co-expression patterns of single MUC1+ and MUC1- mTECs from individual 103
(A) Each row represents a single MUC1+ mTEC from individual 103 as analyzed for expression of the genes listed above the columns; the last column is the total number of genes expressed by each cell. Black stripes denote detected expression; gray stripes denote lack of expression. Expression patterns were arranged from top to bottom according to increasing numbers of genes expressed per cell.
(B) Represents the same as in A only in MUC1- mTECs from individual 103.
(C) Percentage of single cells expressing each of the tested genes in MUC1+ and MUC1- mTECs from individual 103.
(D) The percentage of cells co-expressing 0-6 of the genes assessed was counted among MUC1+ and MUC1- mTECs from individual 103.
C
D

Results
113
B A

Results
114
0102030405060708090
100
EpCAM
MUC1
MUC4
CEA
CEACAM
3
CEACAM
6
Genes
% Positive Ce
lls
MUC1+ mTEC
MUC1‐ mTEC
0
20
40
60
80
0 1 2 3 4 5 6
Number of genes detected per cell
% Cells
MUC1+ mTEC
MUC1‐ mTEC
Figure 37
Co-expression patterns of single MUC1+ and MUC1- mTECs from individual 105
(A) Each row represents a single MUC1+ mTEC from individual 105 as analyzed for expression of the genes listed above the columns; the last column is the total number of genes expressed by each cell. Black stripes denote detected expression; gray stripes denote lack of expression. Expression patterns were arranged from top to bottom according to increasing numbers of genes expressed per cell.
(B) Represents the same as in A only in MUC1- mTECs from individual 105.
(C) Percentage of single cells expressing each of the tested genes in MUC1+ and MUC1- mTECs from individual 105.
(D) The percentage of cells co-expressing 0-6 of the genes assessed was counted among MUC1+ and MUC1- mTECs from individual 105.
C
D

Results
115
Kappa Index
Less than 0.1 No Concordance
0.10‐0.40 Weak Concordance
0.41‐0.60 Clear Concordance
0.61‐0.80 Strong Concordance
0.81‐1.00 Nearly complete Concordance
Kappa Index
Less than 0.1 No Concordance
0.10‐0.40 Weak Concordance
0.41‐0.60 Clear Concordance
0.61‐0.80 Strong Concordance
0.81‐1.00 Nearly complete Concordance
Co‐expression Analysis MUC 1+ & MUC1– mTECs (Kappa Index)
CEACAM6 CEACAM5 CEACAM3 MUC4 EPCAM
MUC1(Pt 103)
0.6067 0.3158 ‐ 0.6239 0.2071
MUC1(Pt 105)
0.5413 0.3399 ‐ 0.5069 0.0373
MUC1(Pt 103+105)
0.5753 0.3278 ‐ 0.5730 0.1298
Co‐expression Analysis MUC 1+ & MUC1– mTECs (Kappa Index)
CEACAM6 CEACAM5 CEACAM3 MUC4 EPCAM
MUC1(Pt 103)
0.6067 0.3158 ‐ 0.6239 0.2071
MUC1(Pt 105)
0.5413 0.3399 ‐ 0.5069 0.0373
MUC1(Pt 103+105)
0.5753 0.3278 ‐ 0.5730 0.1298
Table 3.8
Correlation analysis of gene expression in MUC1+ and MUC1- mTECs from individuals 103 and 105 as
detected by single-cell PCR
(A) Degree of concordance according to the kappa index.
(B) Kappa index of correlation, between MUC1 and the genes listed above each column.
A
B

Results
116
0
10
20
30
40
50
60
70
80
90
100
EpCAM MUC1 MUC4 CEA CEACAM3 CEACAM6
Genes
% Positive Ce
lls
0
20
40
60
80
0 1 2 3 4 5 6
Number of genes detected per cell
% Cells
Figure 38
Co-expression patterns of single mTECs from individual 105
(A) Percentage of single cells expressing each of the tested genes in mTECs from individual 105.
(B) The percentage of cells co-expressing 0-6 of the genes assessed was counted among mTECs from individual 105.
A
B
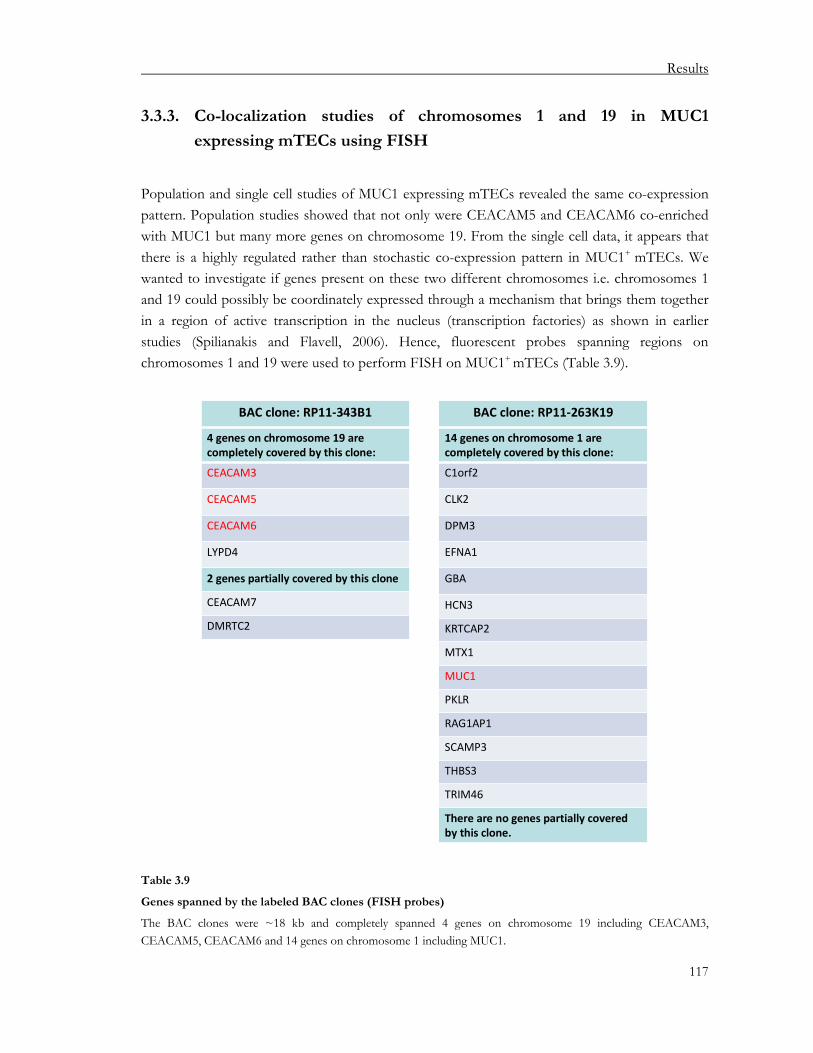
Results
117
3.3.3. Co-localization studies of chromosomes 1 and 19 in MUC1
expressing mTECs using FISH
Population and single cell studies of MUC1 expressing mTECs revealed the same co-expression pattern. Population studies showed that not only were CEACAM5 and CEACAM6 co-enriched with MUC1 but many more genes on chromosome 19. From the single cell data, it appears that there is a highly regulated rather than stochastic co-expression pattern in MUC1+ mTECs. We wanted to investigate if genes present on these two different chromosomes i.e. chromosomes 1 and 19 could possibly be coordinately expressed through a mechanism that brings them together in a region of active transcription in the nucleus (transcription factories) as shown in earlier studies (Spilianakis and Flavell, 2006). Hence, fluorescent probes spanning regions on chromosomes 1 and 19 were used to perform FISH on MUC1+ mTECs (Table 3.9).
TRIM46
THBS3
SCAMP3
RAG1AP1
PKLR
MUC1
MTX1
EFNA1
HCN3
KRTCAP2
BAC clone: RP11‐263K19
14 genes on chromosome 1 are completely covered by this clone:
C1orf2
CLK2
DPM3
GBA
There are no genes partially covered by this clone.
TRIM46
THBS3
SCAMP3
RAG1AP1
PKLR
MUC1
MTX1
EFNA1
HCN3
KRTCAP2
BAC clone: RP11‐263K19
14 genes on chromosome 1 are completely covered by this clone:
C1orf2
CLK2
DPM3
GBA
There are no genes partially covered by this clone.
2 genes partially covered by this clone
BAC clone: RP11‐343B1
CEACAM7
4 genes on chromosome 19 are completely covered by this clone:
CEACAM3
CEACAM5
CEACAM6
LYPD4
DMRTC2
2 genes partially covered by this clone
BAC clone: RP11‐343B1
CEACAM7
4 genes on chromosome 19 are completely covered by this clone:
CEACAM3
CEACAM5
CEACAM6
LYPD4
DMRTC2
Table 3.9
Genes spanned by the labeled BAC clones (FISH probes)
The BAC clones were ~18 kb and completely spanned 4 genes on chromosome 19 including CEACAM3, CEACAM5, CEACAM6 and 14 genes on chromosome 1 including MUC1.

Results
118
The method for hybridization, image analysis and co-localization was performed as described in Section 2.2.12. FISH studies for two human thymus samples (individuals 106 and 108) of MUC1+
and MUC1- mTECs gave highly consistent results. There existed a population of MUC1+ mTECs having distances ≤ 1.2 µm between either one or both allele pairs, which, as per our criteria are co-localized. This population was lacking or lower in MUC1- mTECs (Figure 39).
Figure 39
Distance measurements between alleles of chromosomes 1 and 19 in MUC1+ and MUC1- mTECs of
individuals 108 and 106
(A) Distance measurements (x-axis) versus fraction of cells (y-axis) of single MUC1+ and MUC1- mTECs of individual 108.
(B) Represents the same in individual 106.
A
B

Results
119
Three different scenarios exist for co-localization of two different chromosomes having each 2 alleles. Co-localization can be: mono-allelic- any one allele pair; bi-allelic- both allele pair; asymmetric mono- and bi-allelic- any one allele of one chromosome with both alleles the other chromosome (Figure 40).
As described earlier promiscuously expressed genes in mTECs could be mono- or bi-allelically transcribed (Villasenor et al., 2008; Sinemus, 2009). In MUC1+ mTECs of individual 108, 39 % showed mono-allelic and 3.5 % showed bi-allelic co-localization versus 16 % MUC1- mTECs showed mono-allelic co-localization (Figures 40 and 41). While for individual 106, MUC1+
mTECs showed: 18.5 % mono-allelic co-localization, 13 % bi-allelic co-localization and 9.3 % had asymmetric mono- and bi-allelic co-localization. The bi-allelic and asymmetric mono- and bi-allelic co-localization was significant when compared with the MUC1- mTECs of this individual (Figures 40 and 42). Taken together, it appears that these two chromosomes i.e. chromosomes 1 and 19 tend to either show all three co-localization patterns in MUC1+ mTECs to a significant extent when compared to the MUC1- mTECs. Most probably the alleles co-localize in a region of active transcription resulting in co-expression pattern seen at the population and single cell level.

Results
120
All alleles separate Mono‐allelic co‐localization Bi‐allelic co‐localization Asymmetric mono‐ and bi‐ allelicco‐localization
All alleles separate Mono‐allelic co‐localization Bi‐allelic co‐localization Asymmetric mono‐ and bi‐ allelicco‐localization
Pt 108 Number of cellsMono-allelic
co-localizationBi-allelic
co-localization
Asymmetric mono- and bi-allelic
co-localization
MUC1+ mTEC 56 22 (39 %) 2 (3.5 %) 0 MUC1- mTEC 49 8 (16.3 %) 0 0
Pt 106 Number of cellsMono-allelic
co-localizationBi-allelic
co-localization
Asymmetric mono- and bi-allelic
co-localization
MUC1+ mTEC 54 10 (18.5 %) 7 (13 %) 5 (9.3%) MUC1- mTEC 42 10 (23.8 %) 0 1 (2.3 %)
Figure 40
Co-localization between alleles of chromosomes 1 and 19 in MUC1+ and MUC1- mTECs of individuals 108
and 106
Co-localization studies of mono-allelic, bi-allelic and asymmetric mono- and bi-allelic co-localization in individual MUC1+ and MUC1- mTECs of individuals 108 and 106. For both individual samples, MUC1+ mTECs either show a significant co-localization of chromosomes 1 and 19 for all three scenarios.
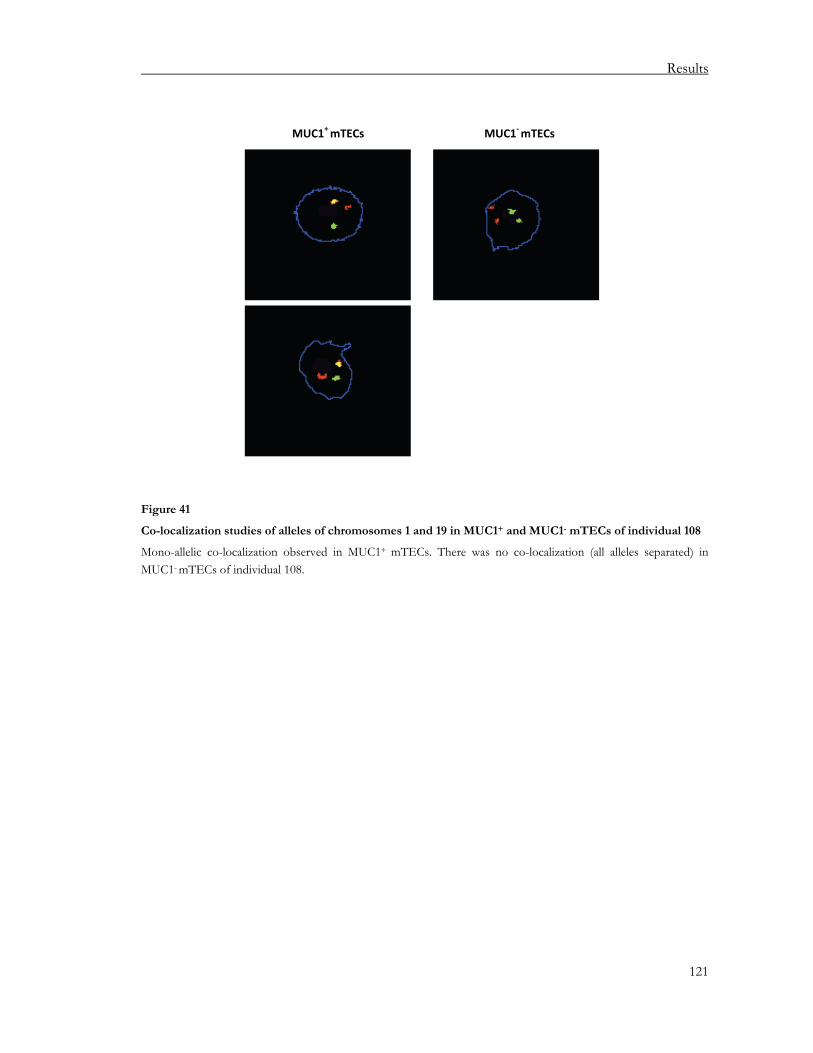
Results
121
Figure 41
Co-localization studies of alleles of chromosomes 1 and 19 in MUC1+ and MUC1- mTECs of individual 108
Mono-allelic co-localization observed in MUC1+ mTECs. There was no co-localization (all alleles separated) in MUC1- mTECs of individual 108.
MUC1+ mTECs MUC1‐mTECs
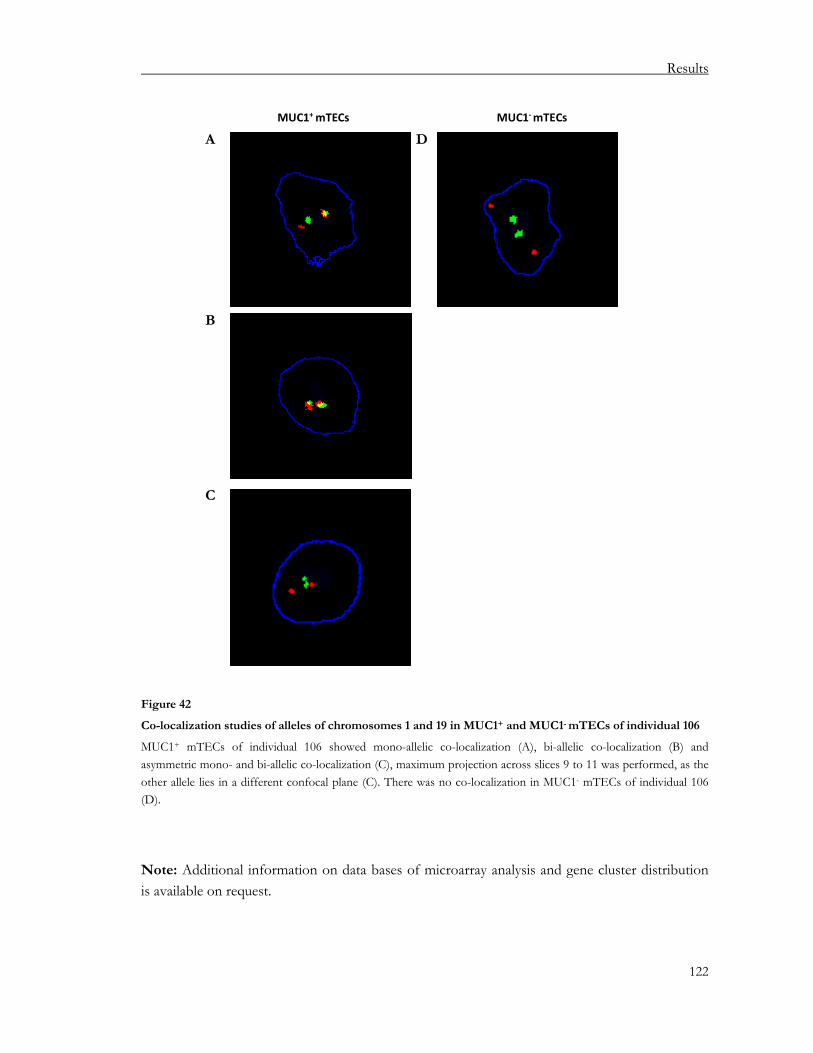
Results
122
MUC1+ mTECs MUC1‐mTECsMUC1+ mTECs MUC1‐mTECs
Figure 42
Co-localization studies of alleles of chromosomes 1 and 19 in MUC1+ and MUC1- mTECs of individual 106
MUC1+ mTECs of individual 106 showed mono-allelic co-localization (A), bi-allelic co-localization (B) and asymmetric mono- and bi-allelic co-localization (C), maximum projection across slices 9 to 11 was performed, as the other allele lies in a different confocal plane (C). There was no co-localization in MUC1- mTECs of individual 106 (D).
Note: Additional information on data bases of microarray analysis and gene cluster distribution is available on request.
A
B
D
C

Discussion
123
4. Discussion
In view of the essential role of pGE by mTEC in central tolerance induction, we addressed the issues of defining the scope, regulation and evolutionary conservation of pGE. The precise genomic organization of the promiscuously expressed gene pool in mouse, rat and human was defined at the population level. Since, the complete representation at the population level is an additive result of the expression pattern in single mTECs, expression and co-regulation was also addressed at the single-cell level. Here we show that pGE is highly conserved between species, clustered in the genome at the population level and is governed by certain co-expression rules at the single cell level.
4.1. Evolutionary conservation of pGE
In order to define the scope and extent of pGE we focused on genes which are up-regulated upon maturation of mTECs. A comparative global gene expression was performed on the different differentiation stages of mTECs (immature, MHCIIlo and mature, MHCIIhi mTECs), thus restricting our study to one cell-lineage. We could have opted for the separation of complete mTECs from cTECs in order to gain an insight into the above queries. Since they represent two distinct lineages, it would have been however difficult to delineate the gene pools of promiscuously expressed from lineage-specific genes. Hence, we decided to study gene expression within the mTEC cell-lineage. Our analysis further extended to a species comparison between mouse, rat and human in order to assess evolutionary conservation of pGE. The mTEC population was separated on the basis of EpCAM and further distinguished into its lineage-specific differentiation stages on the basis of MHCII levels. Moreover, although the cTEC markers stained exclusively TECs in the cortex in histology, it is unclear whether they represent the same molecule in the studied species (i.e. His38 for rat (Kampinga et al., 1987), CDR1 (Ly51) for mouse and CDR2 for human (Rouse et al., 1988)).
Keeping in mind the importance of pGE in tolerizing T-cells towards self-antigens, one would expect the phenomenon of pGE to be evolutionary conserved and to date back to early vertebrates, though this prediction has yet to be tested. An ortholog of Aire, serving as a molecular tracer of pGE has been identified in zebrafish. It shows a remarkable resemblance to AIRE in man and its predominant intra-thymic expression suggests that pGE dates back to 400 million years (Saltis et al., 2008). Here for the first time a side by side comparison of pGE between three species, mouse, rat and man was performed. A comparative analysis of gene expression at a global level between immature and mature mTECs in mouse, rat and human revealed a similar extent of pGE between the species, i.e., in terms of number of differentially expressed genes (Table 3.1). There is a methodological limitation to these results in that

Discussion
124
microarray data under-estimate the true expression level due to low sensitivity. The use of a more sensitive semi-qualitative PCR on a particular gene locus (cluster 13 on mouse chromosome 13, Figure 23) gave a more sensitive insight into the extent of pGE, as more genes scored as positive. The PCR data was in concordance with those obtained by Derbinski et al. on the casein gene locus, which showed contiguous expression without a well defined boundary (Derbinski et al., 2005). Extrapolating from this analysis, we estimate at least ~10 % of all known genes to be turned on in mTECs in addition to differentiation-dependent genes. The bulk of the promiscuously expressed genes is turned on only in the MHCIIhi mTECs, which strongly supports the “terminal differentiation model” and is in concordance with previous data in mice from our group (Derbinski et al., 2005). This estimation of the scope of pGE needs to be reassessed by Deep Sequencing technology. Nonetheless, in spite of these limitations which apply for all the species we studied, the data demonstrate a high degree of conservation of pGE.
While studying pGE in rats for the first time we observed that a fairly large proportion (~65-75 %) of regulated genes followed the same regulation pattern in rats and mice (Table 3.4). A slightly lower TRA enrichment of ~40 % was observed in mature rat mTECs than in mouse (~50 %, Figures 22 and 25). This highlights the fact that the percentage of TRA content in mTECs is highly significant and far above the background of 10.8 % in the genome. Additionally a similar degree of TRA clustering (highly significant) was observed in all three species (Figure 19). These findings corroborate the notion of an evolutionary conservation of pGE. The comparison of pGE could not be further extended to man, as the inter-individual differences of the promiscuously expressed gene pool were too large and could not consolidate into a common signature (Table 3.5).
4.2. TRAs cluster genome-wide and project onto the thymus
The TRAs that we defined using robust computational methods tend to co-localize in clusters in the genome. A highly significant similar degree of clustering was observed in all three species (Figure 19). For the first time we directly link two features of pGE, i.e. enrichment for TRAs and clustering (Figure 15). Preferential chromosomal clustering has been reported for genes co-expressed in certain cell lineages and serving a common function i.e. muscle or red blood cell development (Wang et al., 2001; Ramalho-Santos et al., 2002; Hurst et al., 2004). Clustering of co-regulated genes is frequent in eukaryotic genomes (Hurst et al., 2004). In the simplest of cases, gene clusters are formed by gene duplication (Lercher et al., 2003; Hurst et al., 2004). In other cases, clusters of genes exist that participate in the same pathways or encoding organelle-related proteins or operons i.e. functionally related genes (Lefai et al., 2000; Boutanaev et al., 2002; Spellman and Rubin, 2002; Teichmann and Veitia, 2004). Here, we observed that TRAs are clustered irrespective of their structurally relatedness, tissue-specific expression patterns or

Discussion
125
putative antigenic properties (Figure 21). Gene order in these clusters in mouse and man was mostly conserved and present in syntenic regions on the same or on different chromosomes (Figure 20). Previous reports show that clusters of both housekeeping genes and co-expressed genes are conserved in both mouse and human genomes by natural selection (Singer et al., 2005; Sémon and Duret, 2006). This lends support to the hypothesis that these clusters have regulatory advantages: the same enhancers or locus control regions are shared and ensure coordinated expression in single cells. These types of genes play a fundamental role in the operation of every eukaryotic cell, and thus, if there is any benefit to arranging co-expressed genes together in the genome, housekeeping genes will likely be subject to the strongest selection to form such clusters. However, the reason for having an evolutionary conservation of clusters of structurally unrelated TRAs in the genome still poses the question of its selective benefit. Knowing that the arrangement of genes in the mammalian genome is non-random, a somewhat far-fetched speculation could be that gene-order has been influenced by pGE, in order to facilitate the preferential expression of TRAs in one cell-type of the thymus. This would reflect the co-evolution of TRA clustering and pGE.
Genome‐wide TRA clusters
Thymus (mTECs)
Regulated TRAs
Unregulated TRAs
RegulatedNon‐TRAs
Unregulated Non‐TRAs
Figure 43
Projection of pGE in the thymus onto pre-existing genome-wide TRA clusters
TRAs are clustered in the genome. Within each cluster TRAs are intermingled with non-TRAs and it was rather rare that a cluster comprised purely TRAs.
In the thymus, the genomic TRA clusters are: 1) only partially represented (~10 %) in mTECs and enriched for TRAs in the projection onto the thymus
We propose the cluster to be the “operational genomic unit” of pGE in the thymus.

Discussion
126
Taken together, our results show that TRAs per se are clustered in the genome in all three species irrespective of structural relatedness or apparent antigenic properties. In the thymus, promiscuously expressed genes are enriched in TRAs that are partitioned into clusters, again conserved between species. TRA and non-TRAs are harbored within individual clusters, with TRAs being preferentially regulated during mTEC differentiation. Moreover, genes within a particular gene cluster are subject to partial co-regulation (for e.g. human CEA gene family on chromosome 19). Based on these data, we propose these clusters to be the “operational genomic unit” of pGE in the thymus (Figure 43).
4.3. Aire’s action: cluster-wide or gene-specific?
The transcriptional regulator Aire is known to regulate the expression of hundreds to thousands of promiscuously expressed genes, with a predilection for TRAs (Anderson et al., 2002; Derbinski et al., 2005; Johnnidis et al., 2005). We show in mouse that MHCIIhi mTECs express a large number of Aire-dependent and -independent genes, while in the MHCIIlo mTECs the genes are Aire-independent. The MHCIIhi are enriched for TRAs (53 % of Aire-dependent genes are TRAs; 48 % of Aire-independent genes are TRAs) and MHCIIlo mTECs have a much lower absolute number of Aire-dependent genes (32 genes) though they have similar percentages of TRAs (50 % of Aire-dependent genes are TRAs; 39 % Aire-independent genes are TRAs) (Table 3.3 and Figure 22). From our data, it appears that the maturation stage i.e. MHCIIhi mTECs and not Aire per se has an effect on both number and fraction of TRAs. The unabated expression of a sizable number of genes, especially TRAs (48 %) in the absence of Aire could explain the relatively mild autoimmune phenotype in Aire-/- mice. Within the clusters Aire-dependent and -independent genes were interspersed among each other and subjected to differential regulation. In several cases, such as the cluster 13 on chromosome 13 (Figure 23), an Aire-dependent TRA was directly adjacent to an Aire-independent TRA, as also observed in the casein cluster by others (Derbinski et al., 2005; Johnnidis et al., 2005). These results indicated that the impact of Aire was much more punctuate within the chromosomal stretches, often affecting only two or three genes while leaving neighboring and interspersed genes unaffected. Thus, it does not seem likely that this protein’s influence can only be explained by locus-wide epigenetic alterations. Instead it has been recently shown that more complex mechanisms involving chromatin binding/structure, transcription and pre-mRNA processing come into play (Abramson et al., 2010). By this model, Aire may still work in a gene-specific manner. The above data reflect the scenario at the population level. However, in single mTECs Derbinski et al. pointed out that although the expression of Aire-dependent genes was restricted to Aire+ mTECs, majority of the Aire-dependent genes were not preferentially co-expressed in a single mTEC. Thus, suggesting that Aire is necessary but not sufficient for expression of a particular Aire-dependent gene (Derbinski et al., 2008).

Discussion
127
4.4. Highly variable promiscuously expressed gene pool in human thymus
The study of pGE between immature and mature mTECs from 11 human thymi showed substantial variation in the number of differentially expressed genes (~700-6000 genes) irrespective of the isolation method used. The extent of variability was so profound, that only 24 genes were common between all patients (Table 3.5).
This is the first time that such a striking inter-individual difference in pGE was found, though Taubert et al. also reported considerable quantitative variability in the expression of several target auto-antigen in mTECs (Taubert et al., 2007). Possible parameters causing these variations could be: 1) (epi) genetic differences and non-genetic influences between the individuals; 2) short-term temporal fluctuations (e.g. circadian rhythms). Such variations in vivo at the single-cell level cannot be excluded. It is worth noting that clock genes steering circadian rhythms do not seem to be active in the thymus and testis (incidentally also displaying pGE) (Alvarez and Sehgal, 2005). All samples were collected around the same daily time, between 9 a.m.-11 a.m.; 3) one also cannot exclude that the particular anatomical region of the thymus removed during surgery could add to the variations. Gene expression and the proportion of Aire+ cells could vary with the region of the thymus (for instance, outer versus deeper medulla) and disease status; 4) moreover, the pre-medication history of these individuals could be a further influence. The administration of immunosuppressants or high dosages of other drugs can induce immunosuppressive stress responses (Dhabhar et al., 1994; Pruett et al., 1999; Pruett et al., 2000). Immunosuppressants have been shown in mice to cause extensive loss of tolerance-inducing Aire+ mature mTECs (Fletcher et al., 2009), which could also explain the high variability of mTEC subset composition observed in our human dataset.
The most likely reason for the highly variable promiscuous gene pool in human is the difference in mTEC subset composition. We used a four color sort to separate the lower and upper 30 % of MHCIIlo and MHCIIhi expressing mTEC stages and noticed a highly variable MHCII mTEC profile between individuals which was not the case in mouse and rat. Not only did it differ in the absolute fluorescence values, but also a shift in profile i.e. monophasic or biphasic was observed. These inter-individual profiles most likely relate to differences in the promiscuously expressed gene pool, which could not consolidate into a common set of differentially expressed genes (Table 3.5) in contrast to mouse and rat. Even though a standard criterion i.e. the upper and lower one-third MHCII was used to separate the immature and mature mTECs, it obviously did not result in a reproducible separation of comparable mTEC subsets in humans. AIRE is up-regulated along with mTEC differentiation and the ratio of AIRE in MHCIIhi vs. MHCIIlo
mTECs can be considered as a measure for the degree of enrichment of the individual samples. Since AIRE is the driving force for about half of the promiscuously expressed genes in the mature mTEC population, the correlation between the number of differentially expressed genes

Discussion
128
(between immature and mature mTECs) and fold change in AIRE expression was determined. We observed a correlation between the number of differentially expressed genes and fold change in AIRE expression (correlation coefficient, r = 0.5, Figure 26). Thus, AIRE could serve as a surrogate marker for the quality of cell separation. AIRE being a transcription factor requires fixing cells for intra-cellular staining after which it is not feasible to use these cells for down-stream applications. Hence, due to the lack of available markers, the distinction of immature and mature mTEC subsets in humans based on MHCII is the best that can be performed at present. Incidentally similar inter-individual differences were observed when genome-wide methylation patterns and miRNA level were assayed. Thus, immature and mature mTECs isolated from one patient were more closely related to each other than to the respective cell types isolated from a different patient. Thus, the signature in mTECs typifies the individual rather than the cell type (L. Tykocinski, unpublished). In contrast, thymocytes from the same individual were far less variable in the same assays. Thus, these variations appear to be a peculiarity of mTECs (L. Tykocinski, unpublished) and the differences observed when using different parameters to study various aspects of pGE in humans are biased by the heterogeneity of the samples. MTECs may be highly responsive to stress or other cytotoxic factors.
The observed variations in antigen expression are likely to influence T-cell repertoire selection and thus tolerance thresholds in human provided they reflect steady state values. Note that in genetic disorders like myasthenia gravis differences in the magnitude of 4-fold correlate with disease onset in the human population (Taubert et al., 2007). According to the “threshold model of central tolerance’’ the degree of central tolerance towards a TRA is surprisingly sensitive to minor shifts in thymic antigen expression levels (Liston et al., 2005; Taubert et al., 2007). This could result in a shift in the threshold of self-tolerance to an extent that translates into significant alterations of disease susceptibility. In transgenic mice with defined copy numbers of intra-thymically expressed autoantigens, subtle differences in expression levels (two- to four- fold) can be sufficient to significantly modulate susceptibility or be the cause of autoimmunity (Chentoufi and Polychronakos, 2002; Miyamoto et al., 2003). A similar threshold range seems to matter for self-antigens in humans as well.
No common signature was observed in human while separating immature and mature mTEC based on MHCII. However, when sorting for a defined mTEC population expressing a particular antigen i.e. MUC1, the inter-individual differences were greatly reduced. A high degree of over-lap ~46-54 % was observed (Figure 35). Narrowing down onto a more restricted mTEC subpopulation merges pGE signatures, thus emphasizing the heterogeneity of the human mTEC population (discussed in detail in later chapters).

Discussion
129
4.5. Lack of antigen expression in the thymus subverts central tolerance
The mature mTEC subset shows a broad representation of pGE, though the upper threshold of this expression still remains ill defined. There exist examples in which missing expression of certain antigens in the thymus correlates with the existence of auto-antibodies and a break-down of central tolerance for these particular antigens (Chentoufi and Polychronakos, 2002; Gotter et al., 2004). Some prominent examples are GAD65 and MYH6, both of which are involved in autoimmune diseases, i.e. insulin-dependent diabetes (IDD) (Tisch, 1996; Yoon et al., 2000; Lernmark, 2002) and myocarditis, respectively (Wolfgram et al., 1985; Neu et al., 1987; Rose, 2000). Their expression is absent in the thymus and is predominant in the respective peripheral tissue. In both cases their homologous counter-parts i.e. GAD67 and MYH7 show the inverse expression pattern i.e. are well expressed in mTECs and at low levels in peripheral tissue (Figures 29 and 31). It was noted that the two GAD isoforms are located in the same chromosomal context in human and mouse (Figures 27 and 28), GAD67 is expressed in mTECs in both species while GAD65 is absent in human and expressed at basal levels in mouse (Derbinski, J, unpublished). The MYH6 and MYH7 isoforms are immediately adjacent to each other and present in syntenic regions in mouse and human (Figure 30). This lack of expression obviously represents one “pitfall” of pGE. It is possible that the non-expressed isoform is embedded in a silent chromosomal context i.e. “regions of closed chromatin’’. We started to investigate this supposition by studying the thymic expression of the flaking regions of the GAD gene loci. The lack of expression of GAD65 may indeed be related to the low overall transcriptional activity 3’ of GAD65 (Figure 29). Similar studies have to be extended to the MYH gene locus.
Future work will probe into the plausible reasons for this differential expression of the different isoforms which could be: 1) structural constraints/restrictions exist that block pGE by affecting either the access or the DNA binding of transcription (co)factors? 2) the lack of expression in mTECs might safe-guard the mTECs, as expression of these antigens could be toxic? The two examples (GAD65 and MYH6) show that expression of the entire antigen can be lacking in the thymus. In the case of PLP this is only true for a particular exon. In the case of MBP, the fetal form of golli-MBP which is expressed in mTECs differs from the peripherally expressed adult classic-MBP in its transcriptional start site. Thus, non-censored T-cells specific for epitopes encoded only by the full-length form of PLP or classic MBP, respectively, can escape thymic selection, which again might predispose to autoimmunity (Klein et al., 2000; Kyewski and Klein, 2006).

Discussion
130
4.6. Co-regulated gene expression in single mTECs
Previous studies showed that a given individual gene is expressed in only few ~1-3 % mTECs (Derbinski et al., 2001; Cloosen et al., 2007; Taubert et al., 2007). Moreover, an apparent stochastic gene expression pattern of the casein gene cluster as well as other genes was observed at the single cell level (Derbinski et al., 2008; Villasenor et al., 2008). Yet, initial hints for the existence of co-regulated rather than stochastic gene expression patterns came from population studies by J. Arnold (Arnold, 2006; Cloosen et al., 2007), where two tumor-associated differentiation antigens, MUC1 and CEA were co-expressed far above the expected expression frequency based on each antigen alone in the same mTEC. Hence, we wanted to more precisely define these co-expression patterns and the underlying mechanisms.
The antigen pool expressed in mTECs, also includes tumor-associated antigens (i.e. cancer germ cell antigens) previously thought to be secluded from the immune system (Gotter et al., 2004; Cloosen et al., 2007). The feasibility of isolating mTECs expressing a particular antigen had been demonstrated by J. Arnold using antibodies to surface expressed antigens, mucin-1 (MUC1) (Arnold, 2006). We further extended this approach to our studies, isolating MUC1+ and MUC1- mTECs from human thymus. The initial observations by J. Arnold were confirmed not only at the population level using real-time PCR and genome-wide microarrays, but also by single cell studies of MUC1+ mTECs. The results obtained from all three methodological approaches were highly concordant revealing co-expression of MUC1 with MUC4, CEACAM5 and CEACAM6 (Figures 34, 36 and 37). MUC1 is located on Chromosome 1 while MUC4 is on Chromosome 4 and CEACAM5 and CEACAM6 are on Chromosome 19, thus co-expression groups in single cells not only defined intra-chromosomal but also inter-chromosomal gene co-regulation. The CEA family gene cluster however was not completely co-expressed (Figure 34 and Table 3.6). For the first time we show that neighboring genes within a particular gene cluster (i.e. CEACAM5 and CEACAM6) are consistently co-expressed in single mTECs which was not observed by Derbinski et al. when studying the casein gene cluster (Derbinski et al., 2008).
We showed that pGE is highly conserved between the species, however in human the promiscuously expressed gene pool varied considerably. Yet, sorting for a restricted mTEC subpopulation i.e. MUC1+ mTECs, a high degree of over-lap ~46-54 % was observed (Figure 35). Thus, narrowing down onto a restricted mTEC subpopulation merges the pGE signature again attesting to be the heterogeneity of the human mTEC population.
The single cell data reveal a deterministic component in the regulation of pGE. The co-expression frequencies of the analyzed gene pool were much higher in MUC1+ mTECs (30-82 %) than expected on a random base in total mTECs (3-13 %) or MUC1- mTECs (0-11 %)

Discussion
131
(Figures 36, 37 and 38), showing a high degree of concordance (Table 3.8). The observed co-expression patterns in MUC1+ mTECs are not mimicked in other normal peripheral epithelial derived cells (Zotter et al., 1998; Hammarstrom, 1999; Scholzel et al., 2000). The co-expression patterns appear to be due to pGE rather than due to progressive differentiation of mTECs. Note that MUC1 and CEA are epithelial antigens. Being tumor antigens one would expect the MUC and CEA families to be expressed in malignant tissues, though this extended co-expression pattern as observed in mTECs has never been reported. Only selected expression pairs like MUC1-MUC4, CEACAM5-CEACAM6 and MUC1-CEACAM5 have been described to be expressed in malignant tissues either as unaltered or post-translational modified forms (Kinugasa et al., 1998; Hammarstrom, 1999; Scholzel et al., 2000; Rakha et al., 2005). Hence, the co-expression pattern observed in mTECs does not appear to reflect that of peripheral counterpart tissues (Derbinski et al., 2008; Villasenor et al., 2008).
Gotter and co-workers showed that mTEC-over-expressed genes show no preference for any chromosome (Gotter et al., 2004). When selecting for MUC1+ mTECs, we found over-expressed genes to preferentially co-localize to chromosome 19 (Table 3.7). Strikingly, these co-expression patterns and chromosomal preferences correlated with in situ co-localization of the respective chromosomal domains (on chromosomes 1 and 19) upon mTEC maturation as analyzed by fluorescence in situ hybridization. For the first time, we document a direct interchromosomal interaction between two gene loci ex vivo in mTECs. The functional significance of the interchromosomal association is of great interest. MUC1+ mTECs either show a significant mono-allelic, bi-allelic and asymmetric mono- and bi-allelic co-localization (Figures 40, 41 and 42). This fits with previous observations that pGE is neither strictly mono- nor bi-allelic and thus is distinct from known patterns of strict allele-specific gene expression as observed in peripheral tissues (Derbinski et al., 2008; Villasenor et al., 2008; Sinemus, 2009). The interchromosomal associations described here may be a more general phenomenon of pGE occurring at multiple genetic loci where coordinate regulation occurs.
Although the functional significance of association of co-regulated gene loci is still unclear, direct physical interactions between chromosomes are known to have regulatory functions as described in the case of T-cell differentiation. This has recently been established by the analysis of the Ifnγ and TH2 cytokine loci in naive T cells (Spilianakis et al., 2005). After antigen stimulation, the naive TH cells develop into either TH1 cells, which produce one set of effector molecules (i.e. interferon (IFN)-γ), or TH2 cells, which produce a different set (i.e. interleukin (IL)-4, -5). In order to investigate what determines the fate of the naive TH cells, the authors explored the organization of two genomic regions: the gene encoding IFN-γ (called Ifng, chromosome 10) and a multi-gene complex encoding IL-4 and IL-5 (Il4 and Il5, chromosome 11). Using the chromosome conformation capture (3C) method and FISH, they found Ifng seems to be regulated by elements found near it on chromosome 10, whereas expression of Il4 and Il5 on chromosome 11 seems to

Discussion
132
be regulated by a ‘locus control region’ (LCR) on the same chromosome. They observed inter-chromosomal interactions between the promoter region of the IFN- γ gene and the LCR of the TH2 cytokine locus in naive bipotent TH cells which are poised for transcription. Upon receiving an appropriate stimulus, one gene locus is activated (for example Ifng after a TH1 stimulus), whereas the counterpart locus that is to remain silent (in this case the TH2 genes) moves apart, presumably to a region of the nucleus, which is not transcriptionally active. So, at the time point of the association of the two loci, the TH cells have the choice to select either signature. In contrast, in mTECs co-localization goes along with co-expression.
Similarly, in sensory neurons only a single olfactory receptor (OR) gene from a very large super-family (1300 genes in mouse), which is organized in multiple clusters, is selected for expression in individual olfactory neurons. Different choices are made in different neurons, such that the whole repertoire is deployed in the olfactory epithelium. It poses the question, how is the OR gene choice made? Lomvardas and colleagues showed that an odorant receptor gene on one chromosome is selected for expression by physical association of an odorant receptor- regulatory element (the H enhancer) on chromosome 14. Therefore, this work supports the hypothesis that a single element may drive the expression of all the OR genes in the genome by inter-chromosomal co-regulation (Lomvardas et al., 2006).
Another remarkable finding was the initiation of X-chromosome inactivation (XCI) that involves ‘counting’ of the X chromosomes to ensure that only one X remains active per autosome set, and a random ‘choice’ as to which chromosome to inactivate. The molecular mechanisms underlying this remained one of the most challenging enigmas. Two studies, from Bacher et al. and Xu et al.
showed that at the onset of XCI, and concomitant with the timing of counting and choice, the two X-chromosomes of female cells transiently come into close proximity with each other. The initial differential treatment of the two X chromosomes during X-chromosome inactivation is controlled by the X-inactivation centre (Xic). Critical control sequences in the Xic include the non-coding RNAs Xist and Tsix, and long-range chromatin elements (Bacher et al., 2006; Xu et al., 2006).
In each case the question still remains, what are the mechanisms that bring about the functional interactions between regulatory elements on the one hand and target genes on the other hand that are located on different chromosomes? Why do mTECs show co-regulation and co-localization of chromosomes? It is known that eukaryotic chromosomes occupy distinct territories in the cell nucleus. These territories intermingle little with each other. Contacts between different chromosomal loci, is called chromosome kissing. Chromosome kissing is not only restricted to vertebrate, but also found in Drosophila, plants and yeast, suggesting that this is a fundamental feature of nuclear organization that may contribute to either coordinate gene silencing or activation. Genes being actively expressed loop out from their condensed chromatin

Discussion
133
territory and localize to a region of transcriptional activity, associated with “transcription factories” that are enriched in RNA polymerase II - in order to be efficiently transcribed. Owing to the limited number of factories, many genes share the same factory (Branco and Pombo, 2006; Branco and Pombo, 2007; Cavalli, 2007; Lanctôt et al., 2007). The unentangled chromatin conformation along with nuclear actin and myosin provide molecular motors that drive gene mobility and direct movement towards a target region in the nucleus (Chuang et al., 2006; Dundr et al., 2007; Lieberman-Aiden et al., 2009). From the initial results, we hypothesis that these two chromosomes i.e. chromosomes 1 and 19 tend to co-localize in MUC1+ mTECs probably in a region of active transcription in the nucleus resulting in co-expression pattern seen at the population and single cell level (Figure 44). Obviously, many questions remain to be answered: Do other chromosome pairs also preferentially co-localize? What factors regulate these interactions? If we inversely sorted mTECs expressing an antigen on chromosome 19 would we select now for genes on chromosomes 1?
Chromosome territory
Chromatin
Chromatin
Chromosome loops at the transcription factory(e.g. interacting gene loci-MUC1 and CEACAM)
Figure 44
Schematic interpretation of FISH studies in MUC1+ mTECs
FISH studies show an inter-chromosomal association possibly at transcription factories (Chromosome 1-MUC1 and Chromosome 19-CEACAM) leading to the co-regulation and co-expression patterns observed at the population and single cell level in MUC1+ mTECs.

Discussion
134
4.7. Analysis of mTECs reveal partially overlapping co-expression groups
From our population and single cell studies we observed co-expression of CEACAM5, CEACAM6 and MUC4 along with MUC1 in MUC1+ mTECs (Figure 45A). J. Arnold, when selecting for CEACAM5+ mTECs observed co-expression not only of MUC1, CEACAM5, and CEACAM6 but also of CEACAM3 (Figure 45B) (Arnold, 2006). Thus, mTECs isolated for two different but largely co-expressed antigens display overlapping but not identical co-expression groups. It appears that there exists a sliding pattern, that when sorting for MUC1+ or CEACAM5+ mTECs an over-lapping gene set but also a “new” set i.e. CEACAM3 in CEACAM5+ mTECs is found. Selecting CEACAM3+ mTECs might enrich for yet another partially overlapping gene pool. Conceivably as one slides along these group one may ultimately end up with a complete distinct expression pattern compared to the initial one (Figure 45C and 45D). Hence, it appears that selecting for a given gene also selects a distinct co-expression group. The genealogy of each of these co-expression groups is unknown. Does for instance MUC1 expression drive the subsequent expression of its co-expression partners, or are all genes concomitantly expressed? (Figure 46)
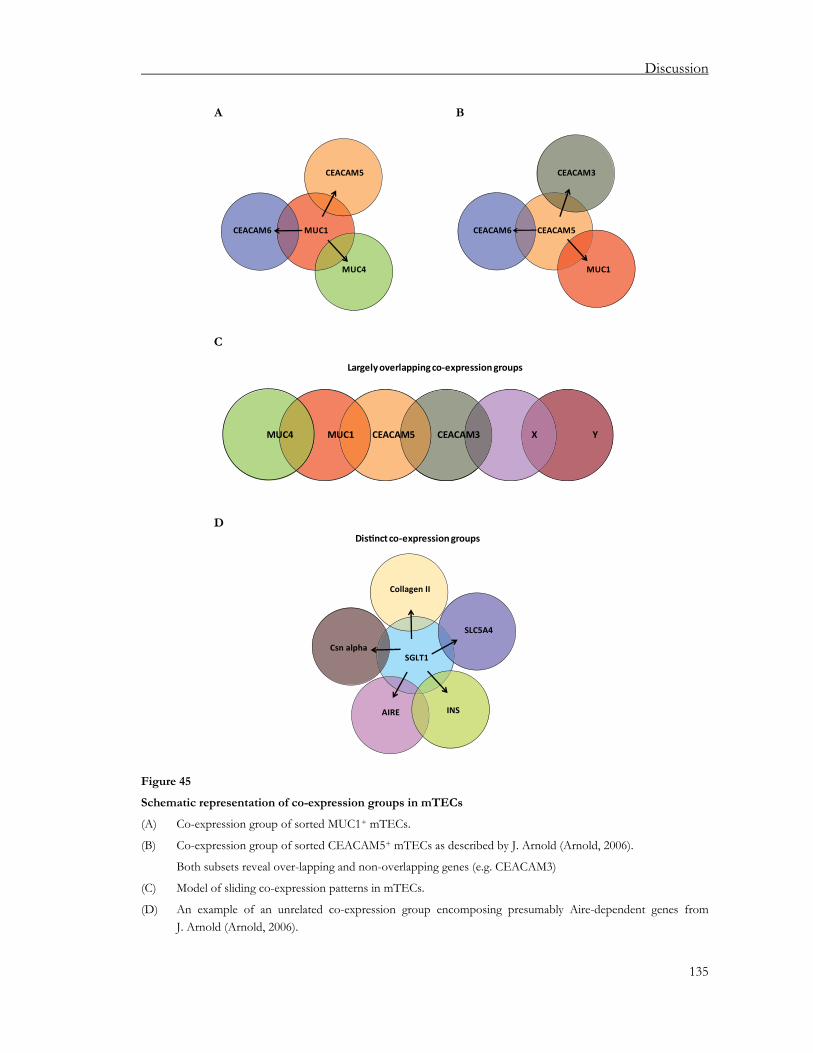
Discussion
135
MUC1CEACAM6
MUC4
CEACAM5
CEACAM5CEACAM6
CEACAM3
MUC1
A B
Largelyoverlappingco‐expressiongroups
Dis nctco‐expressiongroups
MUC1 CEACAM5 CEACAM3 X Y
C
MUC4
SGLT1
AIRE
Collagen II
INS
Csn alpha
SLC5A4
D
Figure 45
Schematic representation of co-expression groups in mTECs
(A) Co-expression group of sorted MUC1+ mTECs.
(B) Co-expression group of sorted CEACAM5+ mTECs as described by J. Arnold (Arnold, 2006).
Both subsets reveal over-lapping and non-overlapping genes (e.g. CEACAM3)
(C) Model of sliding co-expression patterns in mTECs.
(D) An example of an unrelated co-expression group encomposing presumably Aire-dependent genes from J. Arnold (Arnold, 2006).

Discussion
136
MUC1+mTEC
Driver?
Co‐expressionof CEACAM5,CEACAM6 Co‐expressionofMUC4
Figure 46
Possible genealogy of co-expression patterns
It is unknown what drives co-expression groups. Does initial MUC1 expression drive the subsequent expression of its co-expressed partners, or are all genes concomitantly expressed?
Previous work showed that an individual gene is expressed in only few ~1-3 % mTECs (Derbinski et al., 2001; Cloosen et al., 2007; Taubert et al., 2007). Moreover an apparent stochastic gene expression was observed at the single cell level (Derbinski et al., 2008; Villasenor et al., 2008). For the first time our results highlight a new aspect of pGE that is a regulated, non-random component. What is the selective advantage of a single mTEC having such co-regulated co-expression patterns? At face value it is not apparent why a single mTEC should co-express genes from particular chromosomes (for example chromosomes 1 and 19). Co-expression patterns may be an economical way of preventing the same genes being redundantly expressed by other mTECs as would be expected, if pGE was entirely random. Having partially over-lapping co-expression patterns however makes the mechanism of pGE full-proof, thus safeguarding the completeness of the antigen repertoire. Thus, the sets of promiscuously expressed genes in single mTECs ultimately add up to a complete representation of the entire gene pool at the population level. Interestingly, despite dynamic mTEC renewal, the spectrum of expressed self-antigens in the mTEC population remains unchanged at the population level. Thus, at any time incoming thymocytes entering the medulla will encounter the full spectrum of promiscuously expressed genes, despite continuous de novo generation and possibly in situ redistribution of antigen display by mTECs.
? ?

Discussion
137
4.8. Conclusions and future perspectives
The regulatory mechanisms governing pGE in mTECs still remain poorly understood. This study adds new perspectives to this issue.
1. The phenomenon of pGE is highly conserved between species and maps to gene clusters. We propose these clusters to be the “operational genomic unit” of pGE in the thymus.
2. PGE is characterized by certain intra- and inter-chromosomal co-expression patterns at the single cell level.
Future experiments need to:
1. More precisely delineate the complete extent of pGE in mouse, rat and human by new sequencing techniques.
2. Decipher the molecular explanation of “holes” in the thymic antigen repertoire. 3. Dissect the co-expression patterns, co-regulation rules and underlying mechanisms
governing pGE and explore the functional implications of this phenomenon.

References
138
5. References
Abramson, J., Giraud, M., Benoist, C., and Mathis, D. (2010). Aire's partners in the molecular control of immunological tolerance. Cell 140, 123-135.
Akiyama, T., Maeda, S., Yamane, S., Ogino, K., Kasai, M., Kajiura, F., Matsumoto, M., and Inoue, J. (2005). Dependence of self-tolerance on TRAF6-directed development of thymic stroma. Science 308, 248-251.
Akiyama, T., Shimo, Y., Yanai, H., Qin, J., Ohshima, D., Maruyama, Y., Asaumi, Y., Kitazawa, J., Takayanagi, H., Penninger, J. M., et al. (2008). The Tumor Necrosis Factor Family Receptors RANK and CD40 Cooperatively Establish the Thymic Medullary Microenvironment and Self-Tolerance. Immunity 29, 423-437.
Alitheen, N. B., McClure, S., and McCullagh, P. (2010). B-cell development: one problem, multiple solutions. Immunology and Cell Biology 1-6.
Alvarez, J. D., and Sehgal, A. (2005). The thymus is similar to the testis in its pattern of circadian clock gene expression. J Biol Rhythms 20, 111-121.
Anderson, G., and Jenkinson, E. (2001). Lymphostromal interactions in thymic development and function. Nat Rev Immunol 1, 31–40.
Anderson, G., Lane, P. J., and Jenkinson, E. J. (2007). Generating intrathymic microenvironments to establish T-cell tolerance. Nat Rev Immunol 7, 954-963.
Anderson, M. S., Venanzi, E. S., Klein, L., Chen, Z., Berzins, S. P., Turley, S. J., von Boehmer, H., Bronson, R., Dierich, A., Benoist, C., and Mathis, D. (2002). Projection of an immunological self shadow within the thymus by the aire protein. Science 298, 1395-1401.
Arnold, J. (2006). Regulation ektopischer genexpression im thymus-mikroenvironment: vom medulla kompartiment zur einzelzellebene. Doctoral Thesis.
Asano, M., Toda, M., Sakaguchi, N., and Sakaguchi, S. (1996). Autoimmune disease as a consequence of developmental abnormality of a T cell subpopulation. J Exp Med 184, 387-396.
Aschenbrenner, K., D'Cruz, L. M., Vollmann, E. H., Hinterberger, M., Emmerich, J., Swee, L. K., Rolink, A., and Klein, L. (2007). Selection of Foxp3+ regulatory T cells specific for self antigen expressed and presented by Aire+ medullary thymic epithelial cells. Nat Immunol 8, 351-358.
Avichezer, D., Grajewski, R. S., Chan, C. C., Mattapallil, M. J., Silver, P. B., Raber, J. A., Liou, G. I., Wiggert, B., Lewis, G. M., Donoso, L. A., and Caspi, R. R. (2003). An immunologically privileged retinal antigen elicits tolerance: major role for central selection mechanisms. J Exp Med 198, 1665-1676.
Bacher, C. P., Guggiari, M., Brors, B., Augui, S., Clerc, P., Avner, P., Eils, R., and Heard, E. (2006). Transient colocalization of X-inactivation centres accompanies the initiation of X inactivation. Nat Cell Biol 8, 293-299.

References
139
Baldwin, T. A., Hogquist, K. A., and Jameson, S. C. (2004). The fourth way? Harnessing aggressive tendencies in the thymus. J Immunol 173, 6515-6520.
Bennett, A. R., Farley, A., Blair, N. F., Gordon, J., Sharp, L., and Blackburn, C. C. (2002). Identification and characterization of thymic epithelial progenitor cells. Immunity 16, 803-814.
Bensinger, S. J., Bandeira, A., Jordan, M. S., Caton, A. J., and Laufer, T. M. (2001). Major histocompatibility complex class II-positive cortical epithelium mediates the selection of CD4(+)25(+) immunoregulatory T cells. J Exp Med 194, 427-438.
Benz, C., Heinzel, K., and Bleul, C. C. (2004). Homing of immature thymocytes to the subcapsular microenvironment within the thymus is not an absolute requirement for T cell development. Eur J Immunol 34, 3652–3663.
Benz, C., Martins, V. C., Radtke, F., and Bleul, C. C. (2008). The stream of precursors that colonizes the thymus proceeds selectively through the early T lineage precursor stage of T cell development. J Exp Med 205, 1187–1199.
Bleul, C. C., Corbeaux, T., Reuter, A., Fisch, P., Monting, J. S., and Boehm, T. (2006). Formation of a functional thymus initiated by a postnatal epithelial progenitor cell. Nature 441, 992-996.
Boehm, T., Scheu, S., Pfeffer, K., and Bleul, C. C. (2003). Thymic medullary epithelial cell differentiation, thymocyte emigration, and the control of autoimmunity require lympho-epithelial cross talk via LTbetaR. J Exp Med 198, 757-769.
Bouillet, P., Purton, J. F., Godfrey, D. I., Zhang, L. C., Coultas, L., Puthalakath, H., Pellegrini, M., Cory, S., Adams, J. M., and Strasser, A. (2002). BH3-only Bcl-2 family member Bim is required for apoptosis of autoreactive thymocytes. Nature 415, 922-926.
Bousso, P., Bhakta, N. R., Lewis, R. S., and Robey, E. (2002). Dynamics of thymocyte-stromal cell interactions visualized by two-photon microscopy. Science 296, 1876-1880.
Boutanaev, A. M., Kalmykova, A. I., Shevelyov, Y. Y., and Nurminsky, D. I. (2002). Large clusters of co-expressed genes in the Drosophila genome. Nature 420, 666-669.
Boyd, R. L., Tucek, C. L., Godfrey, D. I., Izon, D. J., Wilson, T. J., Davidson, N. J., Bean, A. G., Ladyman, H. M., Ritter, M. A., and Hugo, P. (1993). The thymic microenvironment. Immunol Today 14, 445-459.
Branco, M. R., and Pombo, A. (2006). Intermingling of chromosome territories in interphase suggests role in translocations and transcription-dependent associations. PLoS Biol 4, e138
Branco, M. R., and Pombo, A. (2007). Chromosome organization: new facts, new models. Trends Cell Biol 17, 127-134.
Bruno, R., Sabater, L., Sospedra, M., Ferrer-Francesch, X., Escudero, D., Martinez-Caceres, E., and Pujol-Borrell, R. (2002). Multiple sclerosis candidate autoantigens except myelin oligodendrocyte glycoprotein are transcribed in human thymus. Eur J Immunol 32, 2737-2747.

References
140
Burkly, L., Hession, C., Ogata, L., Reilly, C., Marconi, L. A., Olson, D., Tizard, R., Cate, R., and Lo, D. (1995). Expression of relB is required for the development of thymic medulla and dendritic cells. Nature 373, 531-536.
Cannon, J. P., Haire, R. N., Rast, J. P., and Litman, G. W. (2004). The phylogenetic origins of the antigen binding receptors and somatic diversification mechanisms. Immunol Rev 200, 12-22.
Cavalli, G. (2007). Chromosome kissing. Curr Opin Genet Dev 17, 443-450.
Chen, Z., Benoist, C., and Mathis, D. (2005). How defects in central tolerance impinge on a deficiency in regulatory T cells. PNAS 102, 14735-14740.
Chentoufi, A. A., Palumbo, M., and Polychronakos, C. (2004). Proinsulin expression by Hassall's corpuscles in the mouse thymus. Diabetes 53, 354-359.
Chentoufi, A. A., and Polychronakos, C. (2002). Insulin expression levels in the thymus modulate insulin-specific autoreactive T-cell tolerance: the mechanism by which the IDDM2 locus may predispose to diabetes. Diabetes 51, 1383-1390.
Chin, R. K., Lo, J. C., Kim, O., Blink, S. E., Christiansen, P. A., Peterson, P., Wang, Y., Ware, C., and Fu, Y. X. (2003). Lymphotoxin pathway directs thymic Aire expression. Nat Immunol 4, 1121-1127.
Chuang, C. H., Carpenter, A. E., Fuchsova, B., Johnson, T., de Lanerolle, P., and Belmont, A. S. (2006). Long-range directional movement of an interphase chromosome site. Curr Biol 16, 825-831.
Cloosen, S., Arnold, J., Thio, M., Bos, G. M., Kyewski, B., and Germeraad, W. T. (2007). Expression of tumor-associated differentiation antigens, MUC1 glycoforms and CEA, in human thymic epithelial cells: implications for self-tolerance and tumor therapy. Cancer Res 67, 3919-3926.
Cooper, M. D., and Alder, M. N. (2006). The evolution of adaptive immune systems. Cell 124, 815-822.
Cooper, M. D., Peterson, R. D., and Good, R. A. (1965). Delineation of the thymic and bursal lymphoid systems in the chicken. Nature 205, 143-146.
Daniels, M. A., Teixeiro, E., Gill, J., Hausmann, B., Roubaty, D., Holmberg, K., Werlen, G., Hollander, G. A., Gascoigne, N. R., and Palmer, E. (2006). Thymic selection threshold defined by compartmentalization of Ras/MAPK signalling. Nature 444, 724-729.
Derbinski, J., Gabler, J., Brors, B., Tierling, S., Jonnakuty, S., Hergenhahn, M., Peltonen, L., Walter, J., and Kyewski, B. (2005). Promiscuous gene expression in thymic epithelial cells is regulated at multiple levels. J Exp Med 202, 33-45.
Derbinski, J., and Kyewski, B. (2005). Linking signalling pathways, thymic stroma integrity and autoimmunity. Trends Immunol 26, 503-506.
References
141
Derbinski, J., Pinto, S., Rösch, S., Hexel, K., and Kyewski, B. (2008). Promiscuous gene expression patterns in single medullary thymic epithelial cells argue for a stochastic mechanism. Proc Natl Acad Sci U S A 105, 657-662
Derbinski, J., Schulte, A., Kyewski, B., and Klein, L. (2001). Promiscuous gene expression in medullary thymic epithelial cells mirrors the peripheral self. Nat Immunol 2, 1032-1039.
DeVoss, J., Hou, Y., Johannes, K., Lu, W., Liou, G. I., Rinn, J., Chang, H., Caspi, R. R., Fong, L., and Anderson, M. S. (2006). Spontaneous autoimmunity prevented by thymic expression of a single self-antigen. J Exp Med 203, 2727-2735.
Dhabhar, F. S., Miller, A. H., Stein, M., McEwen, B. S., and Spencer, R. L. (1994). Diurnal and acute stress-induced changes in distribution of peripheral blood leukocyte subpopulations. Brain Behav Immun 8, 66-79.
Diez, J., Park, Y., Zeller, M., Brown, D., Garza, D., Ricordi, C., Hutton, J., Eisenbarth, G. S., and Pugliese, A. (2001). Differential splicing of the IA-2 mRNA in pancreas and lymphoid organs as a permissive genetic mechanism for autoimmunity against the IA-2 type 1 diabetes autoantigen. Diabetes 50, 895-900.
Dooley, J., Erickson, M., and Farr, A. G. (2008). Alterations of the medullary epithelial compartment in the Aire-deficient thymus: implications for programs of thymic epithelial differentiation. J Immunol 181, 5225-5232.
Du Pasquier, L. (1993). Evolution of the immune system. In Fundamental Immunology, ed W Paul, 221-226.
Dundr, M., Ospina, J. K., Sung, M.-H., John, S., Upender, M., Ried, T., Hager, G. L., and Matera, A. G. (2007). Actin-dependent intranuclear repositioning of an active gene locus in vivo. J Cell Biol 179, 1095-1103.
Egerton, M., Scollay, R., and Shortman, K. (1990). Kinetics of mature T-cell development in the thymus. Proc Natl Acad Sci USA 87, 2579–2582.
Egwuagu, C. E., Charukamnoetkanok, P., and Gery, I. (1997). Thymic expression of autoantigens correlates with resistance to autoimmune disease. J Immunol 159, 3109-3112.
Ehrlich, L. I., Oh, D. Y., Weissman, I. L., and Lewis, R. S. (2009). Differential Contribution of Chemotaxis and Substrate Restriction to Segregation of Immature and Mature Thymocytes. Immunity 31, 986-998.
Fan, Y., Rudert, W. A., Grupillo, M., He, J., Sisino, G., and Trucco, M. (2009). Thymus-specific deletion of insulin induces autoimmune diabetes. EMBO J 28, 2812-2824.
Farr, A., Nelson, A., Truex, J., and Hosier, S. (1991). Epithelial heterogeneity in the murine thymus: a cell surface glycoprotein expressed by subcapsular and medullary epithelium. J Histochem Cytochem 39, 645-653.
Ferguson, B. J., Cooke, A., Peterson, P., and Rich, T. (2008). Death in the AIRE. Trends Immunol 29, 306-312.
References
142
Flajnik, M. F., and Du Pasquier, L. (2004). Evolution of innate and adaptive immunity: Can we draw a line? Trends Immunol 25, 640–644.
Fletcher, A. L., Lowen, T. E., Sakkal, S., Reiseger, J. J., Hammett, M. V., Seach, N., Scott, H. S., Boyd, R. L., and Chidgey, A. P. (2009). Ablation and regeneration of tolerance-inducing medullary thymic epithelial cells after cyclosporine, cyclophosphamide, and dexamethasone treatment. J Immunol 183, 823-831.
Fontenot, J. D., Rasmussen, J. P., Williams, L. M., Dooley, J. L., Farr, A. G., and Rudensky, A. Y. (2005). Regulatory T cell lineage specification by the forkhead transcription factor foxp3. Immunity 22, 329-341.
Fossa, D. L., Donskoya, E., and Goldschneider, I. (2001). The importation of hematogenous precursors by the thymus is a gated phenomenon in normal adult mice. J Exp Med 193, 365–374.
Gabler, J., Arnold, J., and Kyewski, B. (2007). Promiscuous gene expression and the developmental dynamics of medullary thymic epithelial cells. Eur J Immunol 37, 3363-3372.
Gallegos, A. M., and Bevan, M. J. (2004). Central tolerance to tissue-specific antigens mediated by direct and indirect antigen presentation. J Exp Med 200, 1039-1049.
Gardner, J. M., Devoss, J. J., Friedman, R. S., Wong, D. J., Tan, Y. X., Zhou, X., Johannes, K. P., Su, M. A., Chang, H. Y., Krummel, M. F., and Anderson, M. S. (2008). Deletional tolerance mediated by extrathymic Aire-expressing cells. Science 321, 843-847.
Gavanescu, I., Kessler, B., Ploegh, H., Benoist, C., and Mathis, D. (2007). Loss of Aire-dependent thymic expression of a peripheral tissue antigen renders it a target of autoimmunity. Proceedings of the National Academy of Sciences 104, 4583-4587.
Gavin, M. A., Rasmussen, J. P., Fontenot, J. D., Vasta, V., Manganiello, V. C., Beavo, J. A., and Rudensky, A. Y. (2007). Foxp3-dependent programme of regulatory T-cell differentiation. Nature 445, 771-775.
Gershon, R. K., and Kondo, K. (1970). Cell interactions in the induction of tolerance: the role of thymic lymphocytes. Immunology 18, 723-737.
Gillard, G. O., and Farr, A. G. (2005). Contrasting models of promiscuous gene expression by thymic epithelium. J Exp Med 202, 15-19.
Goldrath, A. W., and Bevan, M. J. (1999). Selecting and maintaining a diverse T-cell repertoire. Nature 402, 255–262.
Gommeaux, J., Grégoire, C., Nguessan, P., Richelme, M., Malissen, M., Guerder, S., Malissen, B., and Carrier, A. (2009). Thymus-specific serine protease regulates positive selection of a subset of CD4+ thymocytes. European Journal of Immunology 39, 956-964.
Gotter, J., Brors, B., Hergenhahn, M., and Kyewski, B. (2004). Medullary epithelial cells of the human thymus express a highly diverse selection of tissue-specific genes colocalized in chromosomal clusters. J Exp Med 199, 155-166.

References
143
Gray, D., Abramson, J., Benoist, C., and Mathis, D. (2007). Proliferative arrest and rapid turnover of thymic epithelial cells expressing Aire. J Exp Med 204, 2521-2528.
Guo, P., Hirano, M., Herrin, B. R., Li, J., Yu, C., Sadlonova, A., and Cooper, M. D. (2009). Dual nature of the adaptive immune system in lampreys. Nature 460, 784-786.
Hammarstrom, S. (1999). The carcinoembryonic antigen (CEA) family:structures, suggested functions and expression in normal and malignant tissues. Cancer Biology 9, 67-81.
Hanahan, D. (1998). Peripheral-antigen-expressing cells in thymic medulla: factors in self-tolerance and autoimmunity. Curr Opin Immunol 10, 656-662.
Hansen, J. D., and Zapata, A. G. (1998). Lymphocyte development in fish and amphibians. Immunol Rev 166, 199-220.
Havran, W. L., and Allison, J. P. (1988). Developmentally ordered appearance of thymocytes expressing different T-cell antigen receptors. Nature 335, 443–445.
Heath, V. L., Moore, N. C., Parnell, S. M., and Mason, D. W. (1998). Intrathymic expression of genes involved in organ specific autoimmune disease. J Autoimmun 11, 309-318.
Hikosaka, Y., Nitta, T., Ohigashi, I., Yano, K., Ishimaru, N., Hayashi, Y., Matsumoto, M., Matsuo, K., Penninger, J. M., Takayanagi, H., et al. (2008). The Cytokine RANKL Produced by Positively Selected Thymocytes Fosters Medullary Thymic Epithelial Cells that Express Autoimmune Regulator. Immunity 29, 438-450.
Hinterberger, M. (2009). Direct antigen presentation by medullary thymic epithelial cells is essential for CD4 T cell tolerance. Doctoral Thesis.
Hogquist, K. A., Baldwin, T. A., and Jameson, S. C. (2005). Central tolerance: learning self-control in the thymus. Nat Rev Immunol 5, 772-782.
Hogquist, K. A., Jameson, S. C., Heath, W. R., Howard, J. L., Bevan, M. J., and Carbone, F. R. (1994). T cell receptor antagonist peptides induce positive selection. Cell 76, 17-27.
Hogquist, K. A., and Moran, A. E. (2009). Treg cells meet their limit. Nat Immunol 10, 565-566.
Hurst, L. D., Pal, C., and Lercher, M. J. (2004). The evolutionary dynamics of eukaryotic gene order. Nat Rev Genet 5, 299-310.
Irla, M., Hugues, S., Gill, J., Nitta, T., Hikosaka, Y., Williams, I. R., Hubert, F.-X., Scott, H. S., Takahama, Y., Holländer, G. A., and Reith, W. (2008). Autoantigen-Specific Interactions with CD4+ Thymocytes Control Mature Medullary Thymic Epithelial Cell Cellularity. Immunity 29, 451-463.
Jameson, S. C., Hogquist, K. A., and Bevan, M. J. (1995). Positive selection of thymocytes. Annu Rev Immunol 13, 93–126.
Jenkinson, W. E., Jenkinson, E. J., and Anderson, G. (2003). Differential requirement for mesenchyme in the proliferation and maturation of thymic epithelial progenitors. J Exp Med 198, 325-332.
References
144
Jenkinson, W. E., Rossi, S. W., Jenkinson, E. J., and Anderson, G. (2005). Development of functional thymic epithelial cells occurs independently of lymphostromal interactions Mechanisms of Development 122, 1294-1299
Johnnidis, J. B., Venanzi, E. S., Taxman, D. J., Ting, J. P., Benoist, C. O., and Mathis, D. J. (2005). Chromosomal clustering of genes controlled by the aire transcription factor. Proc Natl Acad Sci U S A 102, 7233-7238.
Jolicoeur, C., Hanahan, D., and Smith, K. M. (1994). T-cell tolerance toward a transgenic beta-cell antigen and transcription of endogenous pancreatic genes in thymus. Proc Natl Acad Sci U S A 91, 6707-6711.
Kajiura, F., Sun, S., Nomura, T., Izumi, K., Ueno, T., Bando, Y., Kuroda, N., Han, H., Li, Y., Matsushima, A., et al. (2004). NF-kappa B-inducing kinase establishes self-tolerance in a thymic stroma-dependent manner. J Immunol 172, 2067-2075.
Kampinga, J., Kroese, F. G. M., Duijvestijn, A. M., Murawska, M. B., Pol, G. H., and Nieuwenhuis, P. (1987). The rat thymus microenvironment: subsets of thymic epithelial cells defined by monoclonal antibodies. Transplant Proc 19, 3171-3174.
Kappler, J. W., Roehm, N., and Marrack, P. (1987). T cell tolerance by clonal elimination in the thymus. Cell 49, 273-280.
Kinugasa, T., Kuroki, M., Takeo, H., Matsuo, Y., Ohshima, K., Yamashita, Y., Shirakusa, T., and Matsuoka, Y. (1998). Expression of four cea family antigens (CEA, NCA, BGP and CGM2) In normal and cancerous gastric epithelial cells: Up-regulation of BGP and CGM2 in carcinomas. Int J Cancer 76, 148–153.
Kishimoto, H., and Sprent, J. (1999). Several different cell surface molecules control negative selection of medullary thymocytes. J Exp Med 190, 65-73.
Klein, L., Hinterberger, M., Wirnsberger, G., and Kyewski, B. (2009). Antigen presentation in the thymus for positive selection and central tolerance induction. Nat Rev Immunol 9, 833-844.
Klein, L., Klein, T., Ruther, U., and Kyewski, B. (1998). CD4 T Cell Tolerance to Human C-reactive Protein, an Inducible Serum Protein, Is Mediated by Medullary Thymic Epithelium. J Exp Med 188, 5-16.
Klein, L., Klugmann, M., Nave, K. A., Tuohy, V. K., and Kyewski, B. (2000). Shaping of the autoreactive T-cell repertoire by a splice variant of self protein expressed in thymic epithelial cells. Nat Med 6, 56-61.
Klein, L., and Kyewski, B. (2000a). "Promiscuous" expression of tissue antigens in the thymus: a key to T-cell tolerance and autoimmunity? Journal of Molecular Medicine 78, 483-494.
Klein, L., and Kyewski, B. (2000b). Self-antigen presentation by thymic stromal cells: a subtle division of labor. Curr Opin Immunol 12, 179-186.
Klein, L., Roettinger, B., and Kyewski, B. (2001). Sampling of complementing self-antigen pools by thymic stromal cells maximizes the scope of central T cell tolerance. Eur J Immunol 31, 2476-2486.

References
145
Klug, D. B., Carter, C., Gimenez-Conti, I. B., and Richie, E. R. (2002). Cutting edge: thymocyte-independent and thymocyte-dependent phases of epithelial patterning in the fetal thymus. J Immunol 169, 2842-2845.
Koble, C., and Kyewski, B. (2009). The thymic medulla: a unique microenvironment for intercellular self-antigen transfer. J Exp Med 206, 1505-1513.
Kojima, K., Reindl, M., Lassmann, H., Wekerle, H., and Linington, C. (1997). The thymus and self-tolerance: co-existence of encephalitogenic S100 beta-specific T cells and their nominal autoantigen in the normal adult rat thymus. Int Immunol 9, 897-904.
Kuroda, N., Mitani, T., Takeda, N., Ishimaru, N., Arakaki, R., Hayashi, Y., Bando, Y., Izumi, K., Takahashi, T., Nomura, T., et al. (2005). Development of autoimmunity against transcriptionally unrepressed target antigen in the thymus of Aire-deficient mice. J Immunol 174, 1862-1870.
Kyewski, B., and Derbinski, J. (2004). Self-representation in the thymus: an extended view. Nat Rev Immunol 4, 688-698.
Kyewski, B., and Klein, L. (2006). A central role for central tolerance. Annu Rev Immunol 24, 571-606.
Kyewski, B., and Peterson, P. (2010). Aire, master of many trades. Cell 140, 24-26.
Kyewski, B. A., Fathman, C. G., and Kaplan, H. S. (1984). Intrathymic presentation of circulating non-major histocompatibility complex antigens. Nature 308, 196-199.
Lanctôt, C., Cheutin, T., Cremer, M., Cavalli, G., and Cremer, T. (2007). Dynamic genome architecture in the nuclear space: regulation of gene expression in three dimensions. Nature Reviews Genetics 8, 104-115.
Le Douarin, N., Corbel, C., Bandeira, A., Thomas-Vaslin, V., Modigliani, Y., Coutinho, A., and Salaun, J. (1996). Evidence for a thymus-dependent form of tolerance that is not based on elimination or anergy of reactive T cells. Immunol Rev 149, 35-53.
Le Douarin, N. M., and Jotereau, F. V. (1975). Tracing of cells of the avian thymus through embryonic life in interspecific chimeras. J Exp Med 142, 17-40.
Lee, J.-W., Epardaud, M., Sun, J., Becker, J. E., Cheng, A. C., Yonekura, A.-r., Heath, J. K., and Turley, S. J. (2007). Peripheral antigen display by lymph node stroma promotes T cell tolerance to intestinal self. Nat Immunol 8, 181-190.
Lefai, E., Fernandez-Moreno, M. A., Kaguni, L. S., and Garesse, R. (2000). The highly compact structure of the mitochondrial DNA polymerase genomic region of Drosophila melanogaster: functional and evolutionary implications. Insect Mol Biol 9, 315-322.
Lercher, M. J., Blumenthal, T., and Hurst, L. D. (2003). Coexpression of neighboring genes in Caenorhabditis elegans is mostly due to operons and duplicate genes. Genome Res 13, 238-243.
Lernmark, A. (2002). Controlling the controls: GAD65 autoreactive T cells in type 1 diabetes. J Clin Invest 109, 869-870.

References
146
Lieberman-Aiden, E., van Berkum, N. L., Williams, L., Imakaev, M., Ragoczy, T., Telling, A., Amit, I., Lajoie, B. R., Sabo, P. J., Dorschner, M. O., et al. (2009). Comprehensive mapping of long-range interactions reveals folding principles of the human genome. Science 326, 289-293.
Lind, E. F., Prockop, S. E., Porritt, H. E., and Petrie, H. T. (2001). Mapping precursor movement through the postnatal thymus reveals specific microenvironments supporting defined stages of early lymphoid development. J Exp Med 194, 127–134.
Linsk, R., Gottesman, M., and Pernis, B. (1989). Are tissues a patch quilt of ectopic gene expression? Science 246, 261.
Liston, A., Lesage, S., Gray, D. H., Boyd, R. L., and Goodnow, C. C. (2005). Genetic lesions in T-cell tolerance and thresholds for autoimmunity. Immunol Rev 204, 87-101.
Lo, D., and Sprent, J. (1986). Identity of cells that imprint H-2-restricted T-cell specificity in the thymus. Nature 319, 672-675.
Lomvardas, S., Barnea, G., Pisapia, D. J., Mendelsohn, M., Kirkland, J., and Axel, R. (2006). Interchromosomal interactions and olfactory receptor choice. Cell 126, 403-413.
Mallet, V., Blaschitz, A., Crisa, L., Schmitt, C., Fournel, S., King, A., Loke, Y. W., Dohr, G., and Le Bouteiller, P. (1999). HLA-G in the human thymus: a subpopulation of medullary epithelial but not CD83(+) dendritic cells expresses HLA-G as a membrane-bound and soluble protein. Int Immunol 11, 889-898.
Maloy, K. J., and Powrie, F. (2001). Regulatory T cells in the control of immune pathology. Nat Immunol 2, 816-822.
Marrack, P., Lo, D., Brinster, R., Palmiter, R., Burkly, L., Flavell, R. H., and Kappler, J. (1988). The effect of thymus environment on T cell development and tolerance. Cell 53, 627-634.
Martins, V. C., Boehm, T., and Bleul, C. C. (2008). Ltbetar signaling does not regulate Aire-dependent transcripts in medullary thymic epithelial cells. J Immunol 181, 400-407.
Mathis, D., and Benoist, C. (2009). Aire. Annu Rev Immunol 27, 287-312.
Mathis, D., and Benoist, C. (2010). Levees of immunological tolerance. Nat Immunol 11, 3-6.
Matzinger, P., and Guerder, S. (1989). Does T-cell tolerance require a dedicated antigen-presenting cell? Nature 338, 74-76.
McCaughtry, T. M., Wilken, M. S., and Hogquist, K. A. (2007). Thymic emigration revisited. J Exp Med 204, 2513-2520.
Miller, J. F. (1961). Immunological function of the thymus. Lancet 2, 748-749.
Misslitz, A., Pabst, O., Hintzen, G., Ohl, L., Kremmer, E., Petrie, H. T., and Förster, R. (2004). Thymic T cell development and progenitor localization depend on CCR7. J Exp Med 200, 481–491.
References
147
Miyamoto, K., Miyake, S., Schachner, M., and Yamamura, T. (2003). Heterozygous null mutation of myelin P0 protein enhances susceptibility to autoimmune neuritis targeting P0 peptide. Eur J Immunol 33, 656-665.
Mueller, D. L. (2010). Mechanisms maintaining peripheral tolerance. Nat Immunol 11, 21-27.
Murata, S., Sasaki, K., Kishimoto, T., Niwa, S.-i., Hayashi, H., Takahama, Y., and Tanaka, K. (2007). Regulation of CD8+ T Cell Development by Thymus-Specific Proteasomes. Science 316, 1349-1353.
Nakagawa, T., Roth, W., Wong, P., Nelson, A., Farr, A., Deussing, J., Villadangos, J. A., Ploegh, H., Peters, C., and Rudensky, A. Y. (1998). Cathepsin L: critical role in Ii degradation and CD4 T cell selection in the thymus. Science 280, 450-453.
Nedjic, J., Aichinger, M., Emmerich, J., Mizushima, N., and Klein, L. (2008). Autophagy in thymic epithelium shapes the T-cell repertoire and is essential for tolerance. Nature 455, 396-400.
Nehls, M., Kyewski, B., Messerle, M., Waldschutz, R., Schuddekopf, K., Smith, A. J., and Boehm, T. (1996). Two genetically separable steps in the differentiation of thymic epithelium. Science 272, 886-889.
Nelson, A. J., Hosier, S., Brady, W., Linsley, P. S., and Farr, A. G. (1993). Medullary thymic epithelium expresses a ligand for CTLA4 in situ and in vitro. J Immunol 151, 2453-2461.
Neu, N., Beisel, K. W., Traystman, M. D., Rose, N. R., and Craig, S. W. (1987). Autoantibodies specific for the cardiac myosin isoform are found in mice susceptible to Coxsackievirus B3-induced myocarditis. J Immunol 138, 2488-2492.
Nitta, T., Murata, S., Sasaki, K., Fujii, H., Ripen, A. M., Ishimaru, N., Koyasu, S., Tanaka, K., and Takahama, Y. (2010). Thymoproteasome Shapes Immunocompetent Repertoire of CD8(+) T Cells. Immunity 32, 29-40.
Ohki, H., Martin, C., Corbel, C., Coltey, M., and Le Douarin, N. M. (1987). Tolerance induced by thymic epithelial grafts in birds. Science 237, 1032-1035.
Pacholczyk, R., Ignatowicz, H., Kraj, P., and Ignatowicz, L. (2006). Origin and T cell receptor diversity of Foxp3+CD4+CD25+ T cells. Immunity 25, 249-259.
Pacholczyk, R., Kern, J., Singh, N., Iwashima, M., Kraj, P., and Ignatowicz, L. (2007). Nonself-antigens are the cognate specificities of Foxp3+ regulatory T cells. Immunity 27, 493-504.
Pearse, M., Wu, L., Egerton, M., Wilson, Shortman, K., and Scollay, R. (1989). A murine early thymocyte developmental sequence is marked by transient expression of the interleukin 2 receptor. Proc Natl Acad Sci 86, 1614–1618.
Peixoto, A., Monteiro, M., Rocha, B., and Veiga-Fernandes, H. (2004). Quantification of multiple gene expression in individual cells. Genome Res 14, 1938-1947.
Peterson, P., Org, T., and Rebane, A. (2008). Transcriptional regulation by AIRE: molecular mechanisms of central tolerance. Nat Rev Immunol 8, 948-957.

References
148
Petrie, H. T. (2003). Cell migration and the control of post-natal T-cell lymphopoiesis in the thymus. Nat Rev Immunol 3, 859-866.
Petrie, H. T., and Zuniga-Pflucker, J. C. (2007). Zoned out: functional mapping of stromal signaling microenvironments in the thymus. Annu Rev Immunol 25, 649-679.
Pinto, S., Wiencek, Y., Wild, S., Henze, S., Korn, B., Schmitt, S., and Kyewski, B. (2009). Increase sensitivity of Illumina® BeadArray™ with μMACS™ SuperAmp™ Technology. TechNote.
Pitkanen, J., and Peterson, P. (2003). Autoimmune regulator: from loss of function to autoimmunity. Genes Immun 4, 12-21.
Plotkin, J., Prockop, S. E., Lepique, A., and Petrie, H. T. (2003). Critical role for CXCR4 signaling in progenitor localization and T cell differentiation in the postnatal thymus. J Immunol 171, 4521–4527.
Porritt, H. E., Gordon, K., and Petrie, H. T. (2003). Kinetics of steady-state differentiation and mapping of intrathymic-signaling environments by stem cell transplantation in nonirradiated mice. J Exp Med 198, 957-962.
Pribyl, T. M., Campagnoni, C., Kampf, K., Handley, V. W., and Campagnoni, A. T. (1996). The major myelin protein genes are expressed in the human thymus. J Neurosci Res 45, 812-819.
Prockop, S. E., Palencia, S., Ryan, C. M., Gordon, K., Gray, D., and Petrie, H. T. (2002). Stromal cells provide the matrix for migration of early lymphoid progenitors through the thymic cortex. J Immunol 169, 4354–4361.
Pruett, S. B., Collier, S., Wu, W. J., and Fan, R. (1999). Quantitative relationships between the suppression of selected immunological parameters and the area under the corticosterone concentration vs. time curve in B6C3F1 mice subjected to exogenous corticosterone or to restraint stress. Toxicol Sci 49, 272-280.
Pruett, S. B., Fan, R., Myers, L. P., Wu, W.-J., and Collier, S. D. (2000). Quantitative analysis of the neuroendocrine-immune axis: Linear modeling of the effects of exogenous corticosterone and restraint stress on lymphocyte subpopulations in the spleen and thymus in female B6C3F1 mice. Brain Behav Immun 14, 270-287.
Pugliese, A., Zeller, M., Fernandez, A., Jr., Zalcberg, L. J., Bartlett, R. J., Ricordi, C., Pietropaolo, M., Eisenbarth, G. S., Bennett, S. T., and Patel, D. D. (1997). The insulin gene is transcribed in the human thymus and transcription levels correlated with allelic variation at the INS VNTR-IDDM2 susceptibility locus for type 1 diabetes. Nat Genet 15, 293-297.
Punt, J. A., Osborne, B. A., Takahama, Y., Sharrow, S. O., and Singer, A. (1994). Negative selection of CD4+CD8+ thymocytes by T cell receptor-induced apoptosis requires a costimulatory signal that can be provided by CD28. J Exp Med 179, 709-713.
Rakha, E. A., Boyce, R. W. G., El-Rehim, D. A., Kurien, T., Green, A. R., Paish, E. C., Robertson, J. F. R., and Ellis, I. O. (2005). Expression of mucins (MUC1, MUC2, MUC3,MUC4, MUC5AC and MUC6) and their prognostic significance in human breast cancer. Modern Pathology 18, 1295–1304.

References
149
Ramalho-Santos, M., Yoon, S., Matsuzaki, Y., Mulligan, R. C., and Melton, D. A. (2002). “Stemness”: transcriptional profiling of embryonic and adult stem cells. Science 298, 597-600.
Ramsdell, F., Lantz, T., and Fowlkes, B. J. (1989). A nondeletional mechanism of thymic self tolerance. Science 246, 1038-1041.
Ramsey, C., Winqvist, O., Puhakka, L., Halonen, M., Moro, A., Kampe, O., Eskelin, P., Pelto-Huikko, M., and Peltonen, L. (2002). Aire deficient mice develop multiple features of APECED phenotype and show altered immune response. Hum Mol Genet 11, 397-409.
Rathmell, J. C., Lindsten, T., Zong, W. X., Cinalli, R. M., and Thompson, C. B. (2002). Deficiency in Bak and Bax perturbs thymic selection and lymphoid homeostasis. Nat Immunol 3, 932-939.
Rodewald, H. R. (2008). Thymus organogenesis. Annu Rev Immunol 26, 355-388.
Rose, N. R. (2000). Viral damage or 'molecular mimicry'-placing the blame in myocarditis. Nat Med 6, 631-632.
Rossi, F. M., Corbel, S. Y., Merzaban, J. S., Carlow, D. A., Gossens, K., Duenas, J., So, L., Yi, L., and Ziltener, H. J. (2005). Recruitment of adult thymic progenitors is regulated by P-selectin and its ligand PSGL-1. Nat Immunol 6, 626-634.
Rossi, S. W., Jenkinson, W. E., Anderson, G., and Jenkinson, E. J. (2006). Clonal analysis reveals a common progenitor for thymic cortical and medullary epithelium. Nature 441, 988–991.
Rossi, S. W., Kim, M. Y., Leibbrandt, A., Parnell, S. M., Jenkinson, W. E., Glanville, S. H., McConnell, F. M., Scott, H. S., Penninger, J. M., Jenkinson, E. J., et al. (2007). RANK signals from CD4(+)3(-) inducer cells regulate development of Aire-expressing epithelial cells in the thymic medulla. J Exp Med 204, 1267-1272.
Rouse, R. V., Bolin, L. M., Bender, J. R., and Kyewski, B. A. (1988). Monoclonal antibodies reactive with subsets of mouse and human thymic epithelial cells. J Histochem Cytochem 36, 1511-1517.
Sakaguchi, S. (2005). Naturally arising Foxp3-expressing CD25+CD4+ regulatory T cells in immunological tolerance to self and non-self. Nat Immunol 6, 345-352.
Sakaguchi, S., Wing, K., and Miyara, M. (2007). Regulatory T cells – a brief history and perspective. Eur J Immunol 37, S116–S123.
Salaun, J., Bandeira, A., Khazaal, I., Calman, F., Coltey, M., Coutinho, A., and Le Douarin, N. M. (1990). Thymic epithelium tolerizes for histocompatibility antigens. Science 247, 1471-1474.
Salaun, J., Corbel, C., and Le-Douarin, N. M. (2005). Regulatory T cells in the establishment and maintenance of self-tolerance: role of the thymic epithelium. Int J Dev Biol 49, 137-142.
Saltis, M., Criscitiello, M. F., Ohta, Y., Keefe, M., Trede, N. S., Goitsuka, R., and Flajnik, M. F. (2008). Evolutionarily conserved and divergent regions of the autoimmune regulator (Aire) gene: a comparative analysis. Immunogenetics 60, 105-114.

References
150
Scholzel, S., Zimmermann, W., Schwarzkopf, G., Grunert, F., Rogaczewski, B., and Thompson, J. (2000). Carcinoembryonic antigen family members CEACAM6 and CEACAM7 are differentially expressed in normal tissues and oppositely deregulated in hyperplastic colorectal polyps and early adenomas. Am J Pathol 156, 595–605.
Scollay, R., Wilson, A., D’Amico, A., Kelly, K., Egerton, M., Pearse, M., Wu, L., and Shortman, K. (1988). Developmental status and reconstitution potential of subpopulations of murine thymocytes. Immunol Rev 104, 81–120.
Seach, N., Ueno, T., Fletcher, A. L., Lowen, T., Mattesich, M., Engwerda, C. R., Scott, H. S., Ware, C. F., Chidgey, A. P., Gray, D. H., and Boyd, R. L. (2008). The lymphotoxin pathway regulates Aire-independent expression of ectopic genes and chemokines in thymic stromal cells. J Immunol 180, 5384-5392.
Sebzda, E., Wallace, V. A., Mayer, J., Yeung, R. S., Mak, T. W., and Ohashi, P. S. (1994). Positive and negative thymocyte selection induced by different concentrations of a single peptide. Science 263, 1615-1618.
Sémon, M., and Duret, L. (2006). Evolutionary origin and maintenance of coexpressed gene clusters in mammals. Mol Biol Evol 23, 1715-1723.
Shinkai, Y., Rathbun, G., Lam, K. P., Oltz, E. M., Stewart, V., Mendelsohn, M., Charron, J., Datta, M., Young, F., Stall, A. M., and Alt, F. W. (1992). RAG-2-deficient mice lack mature lymphocytes owing to inability to initiate V(D)J rearrangement. Cell 68, 855-867.
Sinemus, A. (2009). Promiscuous gene expression in the thymic medulla - on regulation at the epigenetic and single cell level. Doctoral Thesis.
Singer, A., Adoro, S., and Park, J. H. (2008). Lineage fate and intense debate: myths, models and mechanisms of CD4- versus CD8-lineage choice. Nat Rev Immunol 8, 788-801.
Singer, G. A., Lloyd, A. T., Huminiecki, L. B., and Wolfe, K. H. (2005). Clusters of co-expressed genes in mammalian genomes are conserved by natural selection. Mol Biol Evol 22, 767-775.
Smith, K. M., Olson, D. C., Hirose, R., and Hanahan, D. (1997). Pancreatic gene expression in rare cells of thymic medulla: evidence for functional contribution to T cell tolerance. Int Immunol 9, 1355-1365.
Sospedra, M., Ferrer-Francesch, X., Dominguez, O., Juan, M., Foz-Sala, M., and Pujol-Borrell, R. (1998). Transcription of a broad range of self-antigens in human thymus suggests a role for central mechanisms in tolerance toward peripheral antigens. J Immunol 161, 5918-5929.
Spellman, P. T., and Rubin, G. M. (2002). Evidence for large domains of similarly expressed genes in the Drosophila genome. J Biol 1, 1-5.
Spilianakis, C. G., and Flavell, R. A. (2006). Molecular biology. Managing associations between different chromosomes. Science 312, 207-208.
Spilianakis, C. G., Lalioti, M. D., Town, T., Lee, G. R., and Flavell, R. A. (2005). Interchromosomal associations between alternatively expressed loci. Nature 435, 637-645.

References
151
Sprent, J. (2005). Proving negative selection in the thymus. J Immunol 174, 3841-3842.
Starr, T. K., Jameson, S. C., and Hogquist, K. A. (2003). Positive and negative selection of T cells. Annu Rev Immunol 21, 139-176.
Su, A. I., Wiltshire, T., Batalov, S., Lapp, H., Ching, K. A., Block, D., Zhang, J., Soden, R., Hayakawa, M., Kreiman, G., et al. (2004). A gene atlas of the mouse and human protein-encoding transcriptomes. Proc Natl Acad Sci USA 101, 6062-6067.
Takahama, Y. (2006). Journey through the thymus: stromal guides for T-cell development and selection. Nat Rev Immunol 6, 127-135.
Taubert, R., Schwendemann, J., and Kyewski, B. (2007). Highly variable expression of tissue-restricted self-antigens in human thymus: Implications for self-tolerance and autoimmunity. Eur J Immunol 37, 838-848.
Teichmann, S. A., and Veitia, R. A. (2004). Genes encoding subunits of stable complexes are clustered on the yeast chromosomes: an interpretation from a dosage balance perspective. Genetics 167, 2121-2125.
Tisch, R. a. M., H. (1996). Insulin-dependent diabetes mellitus. Cell 85, 291–297.
Tonegawa, S. (1983). Somatic generation of antibody diversity. Nature 302, 575-581.
Towbin, J. A., Lowe, A. M., Colan, S. D., Sleeper, L. A., Orav, E. J., Clunie, S., Messere, J., Cox, G. F., Lurie, P. R., Hsu, D., et al. (2006). Incidence, causes, and outcomes of dilated cardiomyopathy in children. JAMA 296, 1867-1876.
Tykocinski, L. O., Sinemus, A., and Kyewski, B. (2008). The thymus medulla slowly yields its secrets. Ann N Y Acad Sci 1143, 105-122.
Ueno, T., Saito, F., Gray, D. H., Kuse, S., Hieshima, K., Nakano, H., Kakiuchi, T., Lipp, M., Boyd, R. L., and Takahama, Y. (2004). CCR7 signals are essential for cortex-to-medulla migration of developing thymocytes. J Exp Med 200, 493–505.
van Ewijk, W., Hollander, G., Terhorst, C., and Wang, B. (2000). Stepwise development of thymic microenvironments in vivo is regulated by thymocyte subsets. Development 127, 1583-1591.
van Ewijk, W., Shores, E. W., and Singer, A. (1995). Crosstalk in the mouse thymus. Immunol Today 15, 214-217.
Villasenor, J., Benoist, C., and Mathis, D. (2005). AIRE and APECED: molecular insights into an autoimmune disease. Immunol Rev 204, 156-164.
Villasenor, J., Besse, W., Benoist, C., and Mathis, D. (2008). Ectopic expression of peripheral-tissue antigens in the thymic epithelium: probabilistic, monoallelic, misinitiated. Proc Natl Acad Sci U S A 105, 15854-15859.

References
152
Vogel, A., Strassburg, C. P., Obermayer-Straub, P., Brabant, G., and Manns, M. P. (2002). The genetic background of autoimmune polyendocrinopathy-candidiasis-ectodermal dystrophy and its autoimmune disease components. J Mol Med 80, 201-211.
von Boehmer, H., and Fehling, H. J. (1997). Structure and function of the pre-T cell receptor. Annu Rev Immunol 15, 433–452.
Wakkach, A., Guyon, T., Bruand, C., Tzartos, S., Cohen-Kaminsky, S., and Berrih-Aknin, S. (1996). Expression of acetylcholine receptor genes in human thymic epithelial cells: implications for myasthenia gravis. J Immunol 157, 3752-3760.
Wang, P. J., McCarrey, J. R., Yang, F., and Page, D. C. (2001). An abundance of X-linked genes expressed in spermatogonia. Nat Genet 27, 422-426.
Watanabe, N., Wang, Y. H., Lee, H. K., Ito, T., Wang, Y. H., Cao, W., and Liu, Y. J. (2005). Hassall's corpuscles instruct dendritic cells to induce CD4+CD25+ regulatory T cells in human thymus. Nature 436, 1181-1185.
Weiss, A., and Leinwand, L. A. (1996). The mammalian myosin heavy chain gene family. Annu Rev Cell Dev Biol 12, 417-439.
White, A. J., Withers, D. R., Parnell, S. M., Scott, H. S., Finke, D., Lane, P. J., Jenkinson, E. J., and Anderson, G. (2008). Sequential phases in the development of Aire-expressing medullary thymic epithelial cells involve distinct cellular input. Eur J Immunol 38, 942-947.
Williams, J. A., Sharrow, S. O., Adams, A. J., and Hodes, R. J. (2002). CD40 ligand functions non-cell autonomously to promote deletion of self-reactive thymocytes. J Immunol 168, 2759-2765.
Wirnsberger, G., Mair, F., and Klein, L. (2009). Regulatory T cell differentiation of thymocytes does not require a dedicated antigen-presenting cell but is under T cell-intrinsic developmental control. Proc Natl Acad Sci U S A 106, 10278-10283.
Witt, C. M., Raychaudhuri, S., Schaefer, B., Chakraborty, A. K., and Robey, E. A. (2005). Directed migration of positively selected thymocytes visualized in real time. PLoS Biol 3, e160.
Wolfgram, L. J., Beisel, K. W., and Rose, N. R. (1985). Heart-specific autoantibodies following murine coxsackievirus B3 myocarditis. J Exp Med 161, 1112-1121.
Xu, N., Tsai, C. L., and Lee, J. T. (2006). Transient homologous chromosome pairing marks the onset of X inactivation. Science 311, 1149-1152.
Yanagi, Y., Yoshikai, Y., Leggett, K., Clark, S. P., Aleksander, I., and Mak, T. W. (1984). A human T cell-specific cDNA clone encodes a protein having extensive homology to immunoglobulin chains. Nature 308, 145-149.
Yoon, J. W., Sherwin, R. S., Kwon, H., and Jun, H. S. (2000). Has GAD a central role in type 1 diabetes? J Autoimmun 15, 273–278.
Zotter, S., Hageman, P. C., Lossnitzer, A., Mooi, W. J., and Hilgers, J. (1998). Tissue and tumor distribution of human polymorphic epithelial mucin. Cancer Rev 11-12, 55–101.

References
153
Zuniga-Pflucker, J. C. (2004). T-cell development made simple. Nature Rev Immunol 4, 67–72.

Acknowledgements
154
Acknowledgements
I would like to express my sincere gratitude to the following persons for their role during my study, research work and stay in Germany, culminating in this thesis:-
Prof. Dr. Bruno Kyewski for giving me the opportunity to work on this fascinating topic and for his supervision, fruitful discussions and tremendous help during my thesis.
Prof. Dr. Günter Hämmerling for willingly accepting to be the first referee for this thesis.
Prof. Buselmaier and Dr. Ralf Bischoff for willingly accepting to be my examiners.
Dr. Benedikt Brors and Maria Dinkelacker (Computational Oncology Department) for the Bioinformatic analysis.
Dr. Steffen Schmitt and Klaus Hexel (Core Facility Flow Cytometery) for FACS sorting of thymic epithelial cells and their valuable guidance for staining schemes.
Dr. Bernhard Korn, Sabine Henze and Oliver Heil (Genomics and Proteomics Core Facility) for the Microarray studies.
Dr. Felix Bestvater (Microscopy Core Facility) for help and guidance into Confocal Microscopy.
Dr. Hannah Schmidt-Glenewinkel (Quantitative Modeling and Simulation) for FISH image analysis.
Stefanie Egle and Esmail Rezavandy for their excellent technical help and support.
The entire Developmental Immunology group (D090), the Schwartz-Albiez’ Lab and the lab of Prof. Petra Boukamp at the DKFZ for all their support and friendly working atmosphere.
Anil Demirata (Dr. m.s. Adobe) for helping me with the figures and final formatting of my thesis.
Dias family for making me feel at home and being like my family.
Chloé, Dorothee, Marissa, Martina, Monica, Sandra, Steffi, Willy and all my friends for all your support, encouragement, cheerful and stressful moments and bearing with me during the thesis and rest of the time!
This note of thanks will not be complete without a special mention of the unstinting support and encouragement from my family and parents in particular who have sacrificed much to help my dreams, like this thesis, turn to reality.