Embed Size (px)
Citation preview

Max-Planck-Institut für Molekulare Pflanzenphysiologie
Department of Willmitzer, AG Fiehn
Dissection of Phloem Transport in Cucurbitaceae by Metabolomic Analysis
Dissertation zur Erlangung des akademischen Grades
"doctor rerum naturalium" (Dr. rer. nat.)
in der Wissenschaftsdisziplin "Biology"
eingereicht an der Mathematisch-Naturwissenschaftlichen Fakultät
der Universität Potsdam
von Baichen Zhang
Potsdam, den 31 August 2005


Abstract
Phloem transportiert ein ausgedehntes Spektrum an Molekülen zwischen Pflanzenorganen, um
Wachstum und Entwicklung zu koordinieren. Folglich ist eine umfassende und unvoreingenommene
Metabolom-Analyse notwendig, um unser Verständnis über den Transport von Stoffwechselprodukten
sowie über Phloemtransport zu vertiefen. Phloemexsudate von Kürbispflanzen werden unter
Verwendung der Metabolom-Analyse analysiert. Bei diesen Pflanzen wird angenommen, dass sie
symplastische Beladungswege verwenden, um Photoassmilate als Ausgangsschritt des
Phloemtransportes zu konzentrieren. Zwei neue Familien Callose-verwandter Substanzen, 1,3-O-
verknüpfte Glycane, sowie eine Reihe anderer kleinerer Metabolite werden in den Phloemexsudaten
detektiert. Metabolom-Daten und physiologische Experimente widersprechen früher berichtetem
Verständnis des Phloemexsudationsprozesses in Kürbispflanzen. Folglich bestätigt sich der
Phloemexsudationsprozeß durch Kombination unterschiedlicher mikroskopischer Techniken.
Kürbispflanzen besitzen zwei Phloemsysteme mit eindeutigen anatomischen Eigenschaften. Es zeigt
sich, daß Phloemexsudate in Kürbissen hauptsächlich vom extrafaszikulären Phloem, nicht vom
zentralen Phloem, stammen. In den letzten Jahrzehnten wurde gewöhnlich mißverstanden, daß
Phloemexsudate vom zentralen Phloem stammen. Die eindeutigen metabolischen Profile der
unterschiedlichen Phloemsysteme, die durch Metabolom-Analysen in der räumlichen Auflösung
beobachtet werden, bestätigen die unterschiedlichen physiologischen Funktionen der zwei
unterschiedlichen Phloemsysteme: das zentrale Phloem transportiert hauptsächlich Zucker, während
das extrafaszikuläre Phloem ein ausgedehntes Spektrum von Metaboliten transportiert. Es kann auch
ein unterschiedliches metabolisches Profil kleiner Moleküle zwischen internem und externem
zentralem Phloem beobachtet werden. Von Strukturproteinen des zentralen Phloems wurden auch
Proben genommen und mittels Massenspektrometrie analysiert. Diese Proteine erweisen sich als
neuartige Proteine, die sich zu denen im extrafaszikulären Phloem unterscheiden. Dies bestätigt ferner
den Funktionsunterschied der unterschiedlichen Phloemsysteme in Kürbispflanzen. Basierend auf
diesen neuartigen Entdeckungen des Phloem-Metaboloms und dem vorhergehenden Wissen über den
Phloemtransport in Kürbispflanzen, wird ein neues Modell vorgeschlagen, um den Mechanismus des
Phloemtransports in der symplastischen Beladung zu verstehen.

Abstract Metabolomic analysis provides a novel and powerful tool for studying plant source and
sink relationships. In order to address the fundamental questions on phloem loading and
transport in metabolomic level, symplastic loader, Cucurbita maxima is used as an
experimental system. Structures of novel metabolites, two families of O-linked glycans have
been characterized. Stable isotopic labeling and grafting experiments combining metabolomic
analysis were used to address the possible physiological functions of metabolites in phloem
exudates. However, the analysis of metabolomic data revealed major problems with the
assumption that phloem system is a uniform transport system. Since there are two phloem
systems with different anatomical characteristics in cucurbits, phloem exudation processes
were re-confirmed combining different microscopic techniques. Surprisingly, results showed
that previous interpretations using cucurbits as model species in phloem transport are flawed:
phloem exudates in cucurbits are not from both extrafascicular phloem system and central
phloem system, instead, they are mainly from extrafascicular phloem system. This
necessitates spatial resolution in using metabolomic analysis to address phloem transport.
Tissue enriched samples by micro-dissecting lyophilized stem tissues were further studied by
metabolomic analysis. Results for the first time confirmed the spatial separation of phloem
transport functions of different phloem of cucurbits: central phloem mainly transport RFO
sugars and extrafascicular phloem transport mainly metabolites other than RFO sugars. This
suggests that the two operated phloem-loading modes in source leaves are also spatially
separated. Mass spectrometric analysis of micro-dissected central phloem proteins not only
pinpointed errors relating to cucurbit phloem protein studies in the past three decades, but also
confirmed that central phloem contains a new group of novel P-proteins. A new model to
interpret phloem loading and transport in symplastic loader, cucurbits is proposed.


Table of Content
Abstract Chapter 1 Introduction 1 1.1 Source sink relationships and phloem transport 1 1.1.1 Complex phloem architecture linking source and sink 1 1.2 Phloem transporting nutrients and signals 3 1.3 Mechanism of phloem transport: 4 1.3.1 Currently accepted form of phloem transport mechanisms 5 1.4 Collection phloem and phloem loading mechanisms 7 1.4.1 Apoplastic loading mode 8 1.4.2 Symplastic loading and the polymer trapping model 9 1.5 Major problems of our current understanding of symplastic phloem transport 11 1.5.1 Structure and function relationship of companion cells and sieve elements 11 1.5.2 Inherent problems with polymer trapping model in relation to the phloem metabolome 12 1.5.3 A neglected part of phloem architecture and its function in phloem transport mechanism 13 1.6 Cucurbits as model species for phloem physiology 14 1.6.1 Cucurbitaceous plants as a favourite model for phloem metabolomic analysis: 14 1.6.2 Fundamental questions on cucurbit phloem transport still remain to be resolved 15 1.7 Main objectives of this study: 17 1.8 Outline of result sections in following chapters: 19 Chapter 2 Materials, chemicals, instruments and methods 21 2. 1. Instruments and software: 21 2. 2. Chemicals 22 2. 3. Plant materials and growth conditions 22 2. 4. Metabolomic analysis 23 2.4.1. Procedures for metabolomic analysis by GCMS and LCMS 23 2.4.2. Structural elucidation of unknown carbohydrates 26 2.4.3. MALDI-TOF finger printing of phloem exudates 29 2. 5. Total carbohydrate analysis by phenol-sulfuric acid assay 30 2. 6. Grafting experiments 31 2. 7. Phloem transport studies by 13CO2 stable isotopic labeling 31 2.7.1. Labeling with 13CO2 31 2.7.2. Sampling phloem exudates and leaf discs in labeling experiments: 32 2. 8. Microscopy, imaging and phloem exudation study 32 2.8.1. General microcopy 32 2.8.2. Microscopic imaging and image analysis 33 2.8.3. Fluorescein phloem tracer application 34 2.8.4. Direct observation by phloem exudation 34 2. 9. Manual micro-tissue dissection of lyophilized stem vascular tissues 35 2.9.1. Sampling 35 2.9.2. Lyophilization and storage 35 2.9.3. Micro-tissue dissection 35 2. 10. Sampling exudates from central phloem region by glass capillary 36

2. 11. Phloem protein sampling and analysis 36 2.11.1. Micro-sampling phloem proteins manually by metal needles 36 2.11.2. Micro-sampling of central phloem proteins by needles 37 2.11.3. Dissection of central phloem tissues: 38 2.11.4. Proteins from phloem exudates 38 2.11.5. Extraction phloem proteins by phenol method 38 2. 12. Gel electrophoresis analysis of phloem proteins by SDS-PAGE 38 2.12.1. Electrophoresis 38 2.12.2. Protein gel staining 38 2.12.3. Imaging and image analysis 39 2. 13. Protein identification and sequencing by mass spectrometry 39 2.13.1. In gel digestion of gel separated proteins 39 2.13.2. De novo sequencing peptides in trypsin digest by QTOF 39 2.13.3. Protein identification by LCQ and MALDI-TOF 39 2. 14. Data analysis 40 Chapter 3 Phloem transport in cucurbits using metabolomic analysis of phloem exudates 41 3.1 Structural elucidation of glycans in phloem exudates 41 3.2 Comparative metabolomic analysis 43 3.3 Metabolomic analysis phloem transport using stable isotopic tracer 46 3.4 O-linked glycans in phloem exudates are transported uni-directionally in heterografts 50 Chapter 4 Re-investigation of Cucurbits Phloem Exudation by Microscopy 53 4.1 Re-examine main questions of research project: 53 4.2 Identification of Cucurbit phloem structure by epifluorescence microscopy 55 4.3 Identification of phloem system in planta 57 4.4 Direct observation of phloem exudation by stereo binoculars: 59 4.5 Methodology and rationale for confirmation of phloem exudation 62 4.6 Phloem exudation after CF5(6) applied to petiole and stem surface: 63 4.7 Phloem exudation after CF5(6) applied to adaxial leaf surface 65 4.8 Summary 67 Chapter 5 Spatially resolved metabolomic analysis of Cucurbit transport phloem systems 71 5.1 Introduction 71 5.2 Tissue dissection of C.maxima lyophilized stem segments 71 5.3 Metabolomic profiles of different dissected tissues 73 5.3.1 Distribution of glycans and RFO sugars 73 5.3.2 Comparative metabolome between central phloem tissues and phloem exduates 74 5.3.3 Distinguishing tissues by metabolomic analysis 77 Chapter 6 P-proteins in the Different Phloem Systems of Cucurbits 80 6.1 Introduction 80 6.2 Sampling and extraction of central phloem structural proteins 81 6.3 Strategy and procedure for analysing phloem proteins 83 6.4 SDS-PAGE analysis of phloem proteins from two phloem systems 84 6.5 Mass spectrometric analysis of proteins from the two phloem system 86 Chapter 7 Discussion 90

7.1 Past reports on phloem exudation in cucurbits 91 7.1.1 Re-examination of conclusions from Crafts AS’s studies 92 7.1.2 Independent study of Cucurbit phloem exudation in 1971 93 7.2 Major opinions and interpretation of the perplexing results obtained from analysing phloem exudates 97 7.3 Phloem should not be treated as an unified transport system for photoassimilates, nutrients and signals: 99 7.4 Phloem transport mechanism in cucurbits 100 7.4.1 Vascular architecture of cucurbits 100 7.4.2 Metabolic profiles of different phloem systems 101 7.4.3 Are the previous hypotheses well-founded? 102 7.4.4 Correlations between metabolite profiles and protein profiles 103 7.4.5 Driving force for different cucurbits transport phloem systems 104 7.4.6 Functions of the extrafascicular phloem system and compounds therein 106 7.4.7 Phloem metabolism and phloem loading in cucurbits 108 7.4.8 A model for phloem loading and transport mechanism in cucurbits 109 7.5 Novel cucurbit P-proteins from central phloem 111 Chapter 8 Suggestions for further research 112 Reference Acknowledgement List of Publications Curriculum Vitae

Chapter 1: Introduction
- 1 -
Chapter 1 Introduction
1.1 Source sink relationships and phloem transport
Higher plants are highly organized complex organisms in terms of their morphology,
internal structure, chemical composition, and developmental and dynamic progresses. One
way to simplify the system for the convenience of scientific investigation is to dissect the total
system according to net carbon import or export into two parts: the autotrophic photosynthate-
producing source (e.g. mature leaves), and heterotrophic sink (e.g. developing leaves, roots,
fruits, shoots) (Marson and Phillis, 1936; Sonnewald and Willmitzer, 1992). The integration
of various source and sink tissues and organs is achieved by transporting photoassimilates,
nutrient, signals and water via vasculature: phloem as the major conduit for delivering
photosynthate and xylem for water and mineral nutrients from roots.
Phloem transport is central to redistribution and allocation of photoassmilates and other
nutrients in source-sink relationships. It is also a prerequisite for partitioning of
photoassimilates and nutrients among sink organs. The understanding of the control of
allocation and partitioning of photoassimilates and nutrient allocation via phloem transport
will provide clues as to how this could be modified at genetic and molecular biological levels
to achieve improved plant properties (such as growth, nutrient quality) (Wardlaw, 1990).
However, fundamental questions still lie unanswered, such as what substances are
transported in phloem, and how they are transported.
1.1.1 Complex phloem architecture linking source and sink
The complex phloem architecture embedded in vasculature is the structural basis for
interconnecting distant organs and tissues for signal and nutrient delivery. Despite the
simplification of higher plant organisms into source and sink, one should be aware that the
genetically pre-programmed internal architecture of vasculature is highly diverse, considering
the diversity of higher plant taxa, and of large complexity, considering the internal
organization and developmental processes of a single organism. This is evident even from a
glimpse at general textbooks of plant anatomy and taxonomy (Metcalfe, 1960; Esau, 1965;
Metcalfe and Chalk, 1979). The primary factors causing the complexity and diversity of
vasculature are summarized in table 1.1.
Several features of higher plant vasculature add to the complexity for investigation.
Firstly, the multiple transporting tubes that run parallel to and within single vascular bundles
are typical for higher plant vascular transporting tissues, both sieve tubes of phloem and
tracheary elements of xylem. Secondly, phloem and xylem are always spatially associated
with each other; the dynamic association of both tissues at metabolic levels has been

Chapter 1: Introduction
- 2 -
demonstrated (Vanbel, 1990; Hibberd and Quick, 2002). Thirdly, phloem is a complex tissue,
including various cell types and the composition of phloem tissues varies not only among
species, but even within different organs and tissues of a single organism, and also at its
different developmental stages.
Table 1.1 Principle factors causing the complexity and diversity of higher plant vasculature . These factors are sorted by organs.
Organs
Principle factors causing vasculature
Complexity and diversity
Source leaves Venation
Configuration of minor veins
Stem, petioles
and roots
Spatial arrangement of (primary) vascular bundles (stele)
Bundle type
Anastomose between bundles or vascular tissues
Secondary growth
Branching of vascular tissues and connectivity
Fruits and seeds Distribution and connectivity of vascular tissues
Being aware of the complexity of the vascular system and time-consuming nature of
traditional plant anatomical methods for studying vasculature, it is not surprising that the
topology of connectivity of source and sink tissues and organs in whole organism level is not
well documented in literature. In previous anatomical research, considerable efforts have been
made for recording the regional complexities of vasculature of certain plant species, such as
that of nodes of certain species (Aloni and Sachs, 1973; Aloni et al., 1995; Behnke, 1998;
Altamura et al., 2001), but not at the whole organism level, nor at different developmental
levels of a whole organism. Lack of such data hinder the understanding of how source-sink
relationships are regulated developmentally by phloem or xylem transport.However, indirect
measurements of source sink relationships by combining radio tracers with anatomical
methods and source sink manipulation have indicated that, in some species such as soybean
(Glycine max) and sugar beat (Beta vulgaris), proximity between source and sink organs
dictates transport patterns at the whole organism level, i.e., the upper source leaves export
photoassimilates to upper sink organs (such as shoots), the lower source leaves support the
lower organs (such as roots), and the source leaves localized in the middle of stems transport
assimilates in both directions. (Fetene et al., 1997; Dunford, 1998) This evidence suggests that
phloem architecture provides the means for possible interactions between source and sink (Joy,
1964 ; Finazzo, 1990; Fetene et al., 1997).

Chapter 1: Introduction
- 3 -
1.2 Phloem transporting nutrients and signals
Phloem transport physiology has been, and still is, a puzzling issue due to these facts: A)
The complexity, diversity and dynamic properties of phloem architecture as described above;
B) Phloem tissues are embedded in other tissues. C) Phloem’s unique physiology: It possesses
a very sensitive wounding response system, which is generally not amenable to physical
manipulations. The wound response system includes callose synthesis (Engleman and Esau,
1964; Evert and Derr, 1964; McNairn and Currier, 1967; Webster and Currier, 1968), phloem
structural proteins (bodies)(Evert et al., 1973) and phloem organelles, such as plastids (van
Bel and Knoblauch, 2000). As claimed by van Bel (2003), it is virtually out of experimental
reach. D) The small size of sieve elements and the complex cellular composition of phloem
tissues. Ever since the initial discovery of sieve elements by Hartig in 1837 (Hartig, 1837), a
variety of different research methods have been used for understanding phloem physiology:
from anatomy to cell biology, physiological analysis, biochemical and molecular biological
analysis. However, fundamental questions remain about phloem structure, its function in
source-sink relationship and structure-function relationships.
Phloem sap has been used to refer to the actual solution transported by phloem in planta
as seen in earlier publications between 1950s—1980s, and phloem exudate refers to solutes
coming out of phloem tissues after physical manipulation. The difference between phloem sap
and phloem exudates lies in: 1. Phloem exudates in most cases contain possible contamination
from other cells. 2. Even where there is no contamination, not all components detected in
phloem exudates may be mobile in intact phloem. The mobility of components detected in
phloem exudates has to be confirmed experimentally, such as by radio tracers and grafting
experiments. One example is the proven phloem mobility of glucosinolates in Arabidopsis
(Chen et al., 2001).
The sampling and analysis of phloem sap is a priority for understanding source sink
interactions via phloem transport and the phloem transport mechanisms themselves. However,
sampling pure phloem sap has proven difficult in the presence of an instant wound response
system. Only a few plant species including cucurbitaceous plants, Yucca, Ricinus and some
dicotyledonous trees (Kennedy and Mittler, 1953; Milburn, 1970; King and Zeevaart, 1974)
allow direct sampling of relatively pure phloem exudates after simple physical incision. These
exudates have been used for studying phloem transport. Several other methods have been used
for obtaining phloem exudates, among which are aphid stylet method (Kennedy and Mittler,
1953) and chelator (EDTA)-assisted sampling(King and Zeevaart, 1974).
A broad spectrum of compounds is present in phloem exudates and the composition of
phloem exudates is very complex, as demonstrated in earlier chemical analysis (Ziegler, 1975;
Ziegler and Zimmermann, 1975). Besides the major components like non-reducing

Chapter 1: Introduction
- 4 -
carbohydrates (sucrose, galactose oligosaccharides, and sugar alcohols), other nutrient
components, including amino acids and inorganic compounds occur in relative large quantities
(especially potassium (Lauchli, 1972; Lohaus et al., 1994; Lalonde et al., 2003).
Some known signalling molecules are also present in phloem exudates. Among them are
several phytohormones (Baker, 2000a; Baker, 2000b) transported at low concentrations.
These compounds play a major role in the integration of functioning, growth and development
of the plant. The well-known known example of florigenic molecule(s) are deduced to be
transported via phloem, but their chemical nature is still enigmatic(Yu and Ma, 2001). Recent
development of novel grafting technique combining mutant analysis has revealed that in
addition to known classical hormones, additional novel signalling molecules are required to
orchestrate plant development (Turnbull et al, 2002; Beveridge et al, 2003). Secondary
metabolites are also found in phloem exudates of some plant species, which are likely to play
a role in defence against pests and predators (Murray and Christeller, 1995; Christeller et al.,
1998)
Phloem exudates also contain macromolecules including RNA and proteins (the latter
often called sieve tube exudate proteins – STEPs), some of which have been experimentally
shown to be phloem-mobile (Fisher et al., 1992; Thompson and Schulz, 1999). Non-
cell/organ-autonomous control over gene expression of these phloem mobile proteins or
ribonucleoprotein complexes may function both in defence signalling and in developmental
programming in plants (Oparka and Cruz, 2000; Ruiz-Medrano et al., 2001; Haywood et al.,
2002). STEPs include some metabolic enzymes (Eschrich, 1970), but biochemical and
physiological functions of many other STEPs remain to be elucidated (Hayashi et al., 2000).
In this respect, metabolomic and proteomic data have to be integrated further for studying
those suspected unknown metabolic pathways in SE-CCs, and to reveal their physiological
roles in source and sink interactions.
1.3 Mechanism of phloem transport:
How the broad spectrum of molecules is transported through sieve tubes has been a hot
debate in recent decades. Improved knowledge of phloem anatomy and cell biology has been
the basis for understanding phloem transport mechanisms. Phloem anatomical features have
been extensively reviewed in the past (Cronshaw, 1981; Schulz, 1998). Discussion of phloem
transport mechanisms mainly focus on photoassimilate transport, since it occupies the greatest
proportion of dry mass of relatively pure phloem exudates in higher plant species examined.
Several mechanisms have been proposed (Crafts and Crisp, 1971; Canny, 1973; Evert, 1982) .
The earliest concept on phloem transport was probably diffusion, followed by rotational
protoplasmic streaming(Curtis, 1929), mass flow (Munch, 1930), surface spreading (van den
Honert, 1932), accelerated diffusion by moving strands(Canny, 1962), cytoplasmic pumping

Chapter 1: Introduction
- 5 -
by contractible transcellular strands (Thaine, 1961, 1964, 1969) and electro-osmotic flow
(Spanner, 1958).
As described in plant physiological textbooks, mass flow mechanism is also known as
osmotically generated pressure flow, abbreviated as OGRF. Mass flow in the classical Munch
model is inherently simple: it can be treated in simplified form as a laminar flow in a
capillary, and consequently Poisuelle equation has been used for estimation of phloem
transport. The basic requirements of the mass flow mechanism are: high osmotic pressure in
source phloem region, open sieve pores allowing low resistance to mass flow, sustainable
osmotic pressure gradient along the phloem transport path and the recycling of water in and
out of sieve tubes along the transport paths. Currently, only the mass flow model has received
general acceptance for explaining the driving force of phloem transport in angiosperms. In
particular, observation of mass flow in vivo in sieve tubes by confocal microscopy has added
direct experimental proof (Knoblauch and van Bel, 1998).
There is still debate about details of mass flow mechanisms for phloem transport. One
contentious issue is the possible contribution of companion cells for generating the mass flow
and sustaining the concentration gradient (Turkina et al., 1999). Further acceptance of the
mass flow mechanism requires a more detailed cell biological, biochemical and biophysical
knowledge of sieve elements and companion cells. For example, the functions of three major
components of enucleate mature sieve elements: plastids, p-proteins and ER membranes, in
phloem loading and transport still remain to be resolved (Schulz, 1998; van Bel, 2003).
Although in general the mass flow process has been shown to operate in experimentally
examined species, its universality in angiosperms requires further confirmation, especially
considering the diversity and complexity of phloem systems. The applicability of mass flow
mechanisms to gymnosperms is still under debate. An alternative proposal has been made that
gymnosperm sieve cell system seems to act as a super relay system consisting of a chain of
“micro-Münch”-systems based on anatomy and physiological studies (for a review, refer to
(Willenbrink, 2002)).
1.3.1 Currently accepted form of phloem transport mechanisms
According to current knowledge and understanding of phloem anatomy and physiology,
three major steps determine photoassimilate transport from source to sink: phloem loading,
phloem transport and phloem unloading (see Fig 1.1, adapted from van Bel, 1996)

Chapter 1: Introduction
- 6 -
Figure1.1 - Current frame work for understanding phloem transport in source sink
photoassimilates distribution, adapted from van Bel (van Bel, 1996). Current frame work for understanding phloem transport in source sink photoassimilates distribution, adapted from van Bel (van Bel, 1996). Therefore, the dynamic version of the Münch mass flow model is adopted. The transport phloem is essentially leaky for photoassimilates and not hermetically sealed, unlike Münch initially envisioned. The solute content that building up osmotic pressure inside sieve tubes is controlled by release/retrieval systems in the sieve element/companion cell complexes (SE/CC complexes). Differential release/retrieval balances control the influx/efflux of sugars and water in the various phloem zones. In the collection phloem (phloem loading) the influx will dominate, while in the release phloem (phloem unloading) the efflux. Since the transport phloem has a dual task (nourishment of axial and terminal sinks), the balance between influx and efflux varies with the requirements of the plant. The gradual loss of solute and commensurate amounts of water toward the sink, has been ascribed to a proton-motive force gradient in the SE/CC complexes from source to sink. Both phloem loading and unloading may be operated in symplastic pathway or apoplastic pathway or in even possible a mixture of both modes.
The total phloem system in one plant organism thus is divided into three functional
zones: collection phloem, transport phloem and release phloem (van Bel, 1993).
The function of each phloem zone has distinct structural features. The volume ratio of
companion cell to sieve element decreases along source to sink distribution, indicating the
importance of companion cell in sieve tube functioning: in collection phloem companion cells
are larger than sieve elements (van Bel and Knoblauch, 2000). Along the transport way
towards the sink, the volume ratio of companion cell to sieve element is gradually reduced,
mainly due to reduction of absolute companion cell size. This indicates the increasing release
of photoassimilates along the phloem path from source and sink. Although companion cells
are not required according to the original mass flow hypothesis, in the currently accepted
model, companion cells are assigned functions in release and retrieval of nutrients to maintain

Chapter 1: Introduction
- 7 -
osmotic pressure gradient along source and sink.
The functioning and physiology of unloading phloem is beyond the scope of this
dissertation, although it is one of the decisive parts for understanding the function of phloem
in integrating source and sink (Patrick, 1997). In the following discussion, mechanisms on
collection phloem and transport phloem will be examined in terms of their structure, functions
and mechanisms.
1.4 Collection phloem and phloem loading mechanisms
Collection phloem refers to the phloem in minor veins that functions in photoassimilate
loading from mesophyll cell to the SE/CC-complex In anatomical terms, minor veins are
defined as those without ribs of parenchyma tissue projecting beneath the lower leaf surface
(Esau, 1965; Haritatos et al., 2000). These veins are in close contact with mesophyll cells, and
are typically composed of four cell types: vascular parenchyma, companion cells, sieve
element members and xylem elements.
In collection phloem, organic and inorganic biomolecules from mesophyll cells have to
go through several layers of biomembrane before finally reaching sieve elements in minor
veins for further long-distance transport. In some species bundle sheath cells exist between
mesophyll cells and the companion cell/sieve element complex.
One of the main foci in understanding of phloem loading mechanisms are the companion
cells in minor veins since they are localized between sieve elements and mesophyll cells and
they are the major determinant of symplastic continuity between mesophyll cells and sieve
elements. Ultrastructural studies show that the symplastic continuity via plasmodesmata
between sieve elements and mesophyll cells differed between the types of companion cells in
minor veins in a species-dependent manner. Three major companion cell types in collection
phloem have been identified from comparative ultrastructural studies (Gunning and Pate,
1969; Turgeon et al., 1975; Gamalei, 1989, 1991): ordinary companion cells (OC), transfer
cells (TC) and intermediate cell (IC). Their anatomical features are summarised in Table1.2.
1) The unique ultrastructural feature of transfer cells is the presence of numerous cell
wall ingrowths consisting of hemicellulose, which are formed just when intensive transport
starts. They normally have few or no plasmodesmal connections with surrounding mesophyll
cells.
2) Ordinary companion cells are less specialized ultrastructurally than the other two
types of companion cells described here, i.e. there are neither plasmodesmal fields nor cell
wall ingrowths, although single plasmodesmal connections with mesophyll cells are always
present. They are present not only in minor veins but also in veins of higher orders. In some
group of plants they are the only companion cell type found in the phloem of minor veins.

Chapter 1: Introduction
- 8 -
3) Intermediate cells (IC) were first discovered and examined in detail in abaxial phloem
of minor veins in cucurbits (Turgeon et al., 1975). Their unique features include the presence
of a highly developed smooth ER and the abundance of branched plasmodesmata (abbreviated
as PD hereafter) organized in plasmodesmal fields, by which they are intensively
symplastically linked both to bundle sheath and sieve elements. These branched PD are
secondary. Unlike primary PD formed during cytokinesis at the cell plate of division walls,
these secondary PDs form during post-cytokinesis and can form along any wall of the cell,
allowing cells to increase their traffic potential or create connections between cells
(Zambryski and Crawford, 2000). The formation of secondary PD in IC is correlated to the
maturation of source leaf for exporting sugars (Turgeon and Webb, 1976).
1.4.1 Apoplastic loading mode
"Loading" has been used to denote an active, i.e. energy-requiring step that concentrates
photoassimilate in the phloem (Geiger et al., 1973). By active phloem loading of metabolites,
mainly photoassimilates or sucrose in apoplastic loaders, higher osmotic pressure gradient
along sieve tubes between source and sink is built up for driving mass flow (Oparka, 1992;
van Bel, 1993). Currently, two modes of phloem loading has been identified: apoplastic
Table 1.2 Different types of companion cells found in minor veins (adopted from (Gamalei, 1991; Turgeon, 1996; Gamalei, 1999; Voitsekhovskaja, 2001))
Intermediate cell Transfer cell Ordinary companion cell
Cytoplasm dense dense dense
Mitochondria abundant abundant abundant characteristics of endomembrane system
highly developed smooth ER with many small cisternae
a single large vacuole a single large vacuole
plastids leucoplasts, no starch accumulation
chloroplasts, able to accumulate starch
leucoplasts or chloroplasts
interface with mesophyll
highly developed branched plasmodesmata in plasmodesmal fields
highly developed cell wall ingrowths with no or very few plasmodesmata
single plasmodesmata
Phloem Transported sugars
Mainly RFO sugars Mainly Sucrose
Associated possible loading mode Symplastic loading Apoplastic loading Apoplastic
loading
Taxon specificity (examples)
Buddlejaceae Cucurbitaceae Lamiaceae Oleaceae Scrophulariaceae
Asteraceae Boraginaceae Campanulaceae Fabaceae Scrophulariaceae
Betulaceae Brassicaceae Chenopodiaceae Solanaceae Scrophulariaceae

Chapter 1: Introduction
- 9 -
loading and symplastic loading (Grusak, 1996). The uphill solute concentration gradient
between mesophyll cells and SE/CC-complex is one accepted experimental prerequisite for
judgment of possible existence of phloem loading.
In collection phloem of apoplastic loaders, companion cells can be either transfer cells or
ordinary companion cells. Sucrose is the main transported sugar in most examined species so
far. Apoplastic loading is the first mechanism proposed as seen in earlier literature (Geiger et
al., 1973; Geiger, 1975).
According to current understanding of apoplastic loading mechanisms, photoassimilates
are exported into the apoplastic space of meosphyll cells by an efflux sucrose transporter (a
H+/sucrose symporter), then taken up again into sieve elements of source phloem by an influx
sucrose transporter (also H+/sucrose symporter) in the SE-CC complex. This builds up high
osmotic potential in loading phloem for driving mass flow (Lalonde et al., 2003).
Compared with symplastic loading, apoplastic loading (Lalonde et al., 2003) is well
established through molecular cloning (Riesmeier et al., 1992) and expression (Riesmeier et
al., 1994) of genes encoding membrane proteins of influx sucrose transporters.
1.4.2 Symplastic loading and the polymer trapping model
The symplastic loading mode is proposed mainly based on the following experimental data: 1)
Ultrastructural studies of minor veins configurations show there is a high degree of symplastic
continuity from mesophyll cells to sieve elements in species with intermediate cells. 2)
Species with IC transport RFO sugars in phloem as dominant sugars in their phloem (Fig.1.2).
Species with OC or TC in minor veins transport main sucrose in their phloem. Species with
intermediate type of companion cells between OC/TC and IC transport minor amount of RFO
sugars. Types of phloem transported sugars are correlated to the types of companion cells in
minor veins (i.e. the symplastic continuity between mesophyll cells and sieve element in
minor veins). (Gamalei and Sjutkina, 1984; Gamalei, 1991) 3) Physiological studies failed to
demonstrate energy-dependent processes in phloem loading, by use of p-
chloromercuribenzenesulfonic acid (PCMBS), which inhibits apoplastic loading in apoplastic
loaders with transfer cells or ordinary cells (van Bel, 1993; van Bel et al., 1994; Turgeon,
1996). However, solute concentration in minor veins is estimated to be as high as that of
apoplastic loaders, indicating that a concentrating step exists in minor vein phloem of
symplastic loaders (Pristupa, 1983; Lackney and Sjolund, 1991; Haritatos et al., 1996)

Chapter 1: Introduction
- 10 -
Figure 1.2. RFO sugars and metabolic pathways: Raffinose family oligosaccharides are α-galactosylated derivatives of sucrose which differ in the number of galactosyl moieties (n). The major phloem transported forms of RFO sugars includes raffinose (n=1), stachyose (n=2) and verboscose (n=3, not shown here). Biosynthesis of RFO galactinol (1L-1-O-(α-D-galactosyl)-myo-Inositol) is the donor of galactosyl moiety for f RFO sugar galactosyl chain elongation. Raffinose is synthesized via galactosylation of sucrose by raffinose synthase (galactinol:sucrose 6-α-D-galactosyltransferase, EC 2.4.1.82; RS). Stachyose is formed via galactosylation of raffinose by stachyose synthase (galactinol:raffinose 6-α-D-galactosyltransferase, 2.4.1.67; SS). Further extensions of the chain of galactosyls lead to formation of other members of RFO (not shown). Galactinol is synthesized by galactinol synthase (UDP-galactose:myo-Inositol galactosyltransferase, EC 2.4.1.123) from UDP-galactose and myo-inositol. The later two are all derived from glycolysis pathway.
In order to interpret the correlated phenomenon in symplastic connectivity of companion
cells with other cells in minor veins, IC type of companion cells and the presence of phloem-
transported RFO sugars, a polymer trapping model has been proposed by (Turgeon, 1991)
(Fig 1.3). This model is based on spatial intercellular distribution of biochemical synthetic
pathways of RFO sugars.

Chapter 1: Introduction
- 11 -
Fig 1.3. Diagram of polymer trapping model for explaining symplastic loading
mechanism. Sucrose, a disaccharide from adjoining mesophyll cells is diffused via plasmodesmata through bundle sheath cell, “trapped” inside IC by RFO sugar metabolism, and then diffused into sieve element for phloem long distance transport. (This figure is taken directly from (Fisher, 2002)).
According to this model, sucrose from mesophyll diffuses via plasmodesmata through
the bundle sheath cells into intermediate cells, following the corresponding concentration
gradient. In IC, it is further synthesized into RFO sugars where the galactosyl moiety is
provided by galactinol (Fig 1.2). The most abundant RFO sugar, stachyose, has a molecular
size about 0.6 kDa. As suggested in the polymer trapping model, it cannot freely diffuse back
from intermediate cell back to adjoining bundle sheath or mesophyll cells since the size
exclusion limit (SEL) of PD between bundle sheath cells and intermediate cells is about 0.7-
0.8 KDa (Robards and Lucas, 1990). Therefore it is proposed to be “trapped” in the IC and to
be only able to diffuse into the sieve elements because the SEL of plasmodesmata of CC-SE
complexes is estimated as above 3 kDa (Robards and Lucas, 1990). By this energy-
independent concentrating step, high osmotic pressure is built up in SE/CCC in minor veins of
symplastic loaders.
This model is supported by many different experimental data, mostly obtained using
cucurbitaceous plants. The most persuasive evidence is the intercellular distribution of RFO
sugar metabolic enzymes and expression of galactinol synthesis genes.
1.5 Major problems of our current understanding of symplastic phloem transport
1.5.1 Structure and function relationship of companion cells and sieve
elements
Our understanding of phloem transport initially is based on structural observations on
phloem tissues and physiological experiments. Understanding the relationship between

Chapter 1: Introduction
- 12 -
structure and function of companion cells and sieve elements is therefore a key issue.
Companion cells are deeply embedded inside other tissues and difficult to study by current
experimental approaches. Enigmatic questions remain such as: what metabolic enzymes are
present inside a companion cell and what are the biochemical and physiological roles of its
special subcellular structural components (such as ER, vacuoles, plasmodesmata) . Our
current knowledge is mainly limited to ultrastructural observations.
Both symplastic loading and apoplastic loading are based on the symplastic
configurations of minor veins (van Bel et al., 1992). Understanding the function and control of
PD in solute exchange between cells is frustrated by the small size of metabolites. That is,
unlike macromolecular transport which can be experimentally traced, there is no method
available for tracing metabolite movement through PD (Turgeon 1991). Current knowledge
on PD suggests that PD may not simply be an open channel for molecule transport (Oparka
and Roberts, 2001; Heinlein, 2002). Proteins with much larger molecular size have been
experimentally shown to move through PD and the movement is shown to be physiologically
selective and controlled (Kempers et al., 1993). How the symplastic loading mechanism could
be interpreted to incorporate these novel findings on PD needs further investigation.
1.5.2 Inherent problems with polymer trapping model in relation to the
phloem metabolome
Although sugars represent the major dry mass in phloem sap, phloem also transports
other nutrients such as amino acids. The discussion and physiological studies of phloem
loading and transport have been mainly limited to phloem transported sugars. In apoplastic
loaders, the estimation of concentration difference of amino acids in mesophyll cytosol and
that in phloem exudates obtained by aphid stylet (Lohaus et al., 1995), suggests that the
transport of amino acids from mesophyll cells to sieve elements also requires an anti-
concentration loading step via the apoplastic pathway. This may not be a serious problem for
apoplastic loaders due to the presence of possible amino acid transporters.
Considering the metabolome of phloem sap content, it may be a particular problem for
metabolites other than RFO sugars in phloem of symplastic loaders. Provided the symplastic
loading mechanism is correct, how could these symplastic loaders meet the high sink demand
for metabolites that have smaller size than stachyose? Even if they are actively loaded into IC,
they may diffuse back to mesophyll cells and a concentrating step may therefore not be
possible. This indicates a loss of possible regulation steps for these smaller metabolites.
Earlier experimental data using Cucumis melo phloem exudates, taken as representative
of true phloem sap, show that amino acid composition in leaf discs is relatively constant in
diurnal cycles, while that of cucurbit “true” phloem sap is not constant (Patterns et al., 1992).
This indicates regulatory steps for those amino acids from source leaf to transport phloem.

Chapter 1: Introduction
- 13 -
Further physiological experiments such as using cold treatment, also strengthen the idea of
regulation of composition of amino acids in phloem exudates (Mitchell and Madore, 1992).
These lines of evidence contrast with the known symplastic loading mechanism.
1.5.3 A neglected part of phloem architecture and its function in phloem
transport mechanism
In the extremely simplified phloem transport model (Fig 1.1), the whole phloem system
is regarded as a single tube and collection phloem as one sieve element and one companion
cell. If we consider the actual phloem architecture, in symplastic loaders, the actual case of
metabolite movement from mesophyll cells to transport phloem and further distribution
throughout sink tissues is more complex than the highly simplified polymer trapping model.
1.5.3.1 Coexistence of different companion cells in minor veins
In mature minor veins of symplastic loaders, there may co-exist an additional type of
companion cell as reported in species used as physiological studies of phloem loading and
transport. In minor veins of Asarina scandens (Turgeon et al., 1993) and Asarina barclaiana
(Knop et al., 2001), two symplastic loading species of Scrophulariaceae, judging from
anatomy and types of phloem-transported sugars, both intermediate cells and transfer cells
coexist within one minor vein. In cucurbits, even in earlier studies two different types of
companion cells were clearly identified: the adaxial one is an ordinary companion cell and the
abaxial is IC (Turgeon et al., 1975). Coexisting CC and IC in Coleus blumei , a species in
Lamiaceae (Fisher, 1986) is also reported. To my knowledge, these are the major plant species
used for physiological experiments on symplastic loading. How generalized these phenomena
are in other dicotyledonous species needs further investigation.
How these different companion cells interact with each other for controlling phloem
loading also remains unknown (Knop et al., 2001). The apoplastic isolation between these
additional sieve elements and adjoining cells may suggest an apoplastic loading step. Previous
experiments focussed only on sugar export from source leaf and physiological experiments
using apoplastic loading inhibitors. These results do not support the role of these additional
companion cells in sugar loading. However, this would also exclude the possibility of
potential roles in loading processes of metabolites other than sugars. To date, experimental
data on this aspect has been too difficult to obtain.
It remains unknown how the complex phloem configurations in minor veins determine
the transport phloem content. This is in part due to the difficulty in obtaining relatively pure
phloem sap from minor veins and different transport phloem strands. The anatomical
identification of spatial connections between source minor veins and transport phloem strands
is also not an easy task.

Chapter 1: Introduction
- 14 -
In summary, in view of current knowledge on phloem transport mechanisms, the
combination of study of phloem cell biology, physiological studies and phloem metabolomic
studies is still necessary for advancing our understanding of phloem physiology. This is
especially true for symplastic loaders.
1.6 Cucurbits as model species for phloem physiology
1.6.1 Cucurbitaceous plants as a favourite model for phloem metabolomic
analysis:
Despite the availability of full genome sequence, molecular biological analysis and
metabolomic analysis tools for Arabidopsis, the analysis of phloem transport is still
problematic due to difficulties in sampling its phloem sap. Easily obtaining large amount of
relatively pure phloem exudates (Crafts, 1932, 1936, 1944a, b; Richardson et al., 1982, 1984)
and relative large sieve tubes for microscopic observation render cucurbits with experimental
advantages for phloem research. Moreover, the transport rate of dry mass through phloem is
readily estimated from the fast growth of its fruits.
Cucurbitaceous plants have been extensively used for phloem research ever since the
earlier days when sieve elements were discovered to be associated with nutrient transport
(before 1950s, the word “food transport” is used for nutrient transport (Hartig, 1854)). In the
last century, research using cucurbits for phloem spans from almost all aspects of phloem
research: phloem anatomy (Esau, 1969; Turgeon et al., 1975), phloem physiology (Schaffer et
al., 1996), phloem metabolism (Lehmann, 1981), cytology, chemistry, molecular biology and
physiology of P-proteins (H.D.Behnke and Sjolund, 1990; Golecki et al., 1999),
macromolecule long-distance signalling via phloem transport (Xoconostle-Cazares et al.,
1999) and proteomic study of sieve tube exudate proteins(Haebel and Kehr, 2001; Walz et al.,
2002).
Cucurbits are the first species in which the possibility of symplastic loading was
seriously entertained, starting initially from the ultrastructural evidence that there is extensive
symplastic interconnection between the intermediate cells and the photosynthetic tissues
(Esau, 1966; Turgeon et al., 1975). Up to now, it is the only species that provides the
strongest experimental proof of the existence of symplastic loading and polymer trapping
mechanisms (Grusak, 1996; Turgeon, 2000; Volk et al., 2003):
1. RFO sugars are the direct photosynthesis products in cucurbits (Turgeon and Webb,
1975; Hendrix, 1977).
2. The estimated size exclusion limit of plasmodesmata allows dye molecules
approximately the size of sucrose pass through them (Turgeon and Hepler, 1989), although,
currently no data exist on the exact size exclusion limit of plasmodesmata in mesophyll cells

Chapter 1: Introduction
- 15 -
and other cell types within minor veins.
3. Minor veins’ configurations: the extensive symplastic connections of intermediate
cells (abaxial) with sieve elements and bundle sheath cells in minor veins (Turgeon et al.,
1975; Turgeon and Webb, 1976; Turgeon and Hepler, 1989). The plasmodesmal frequencies
between IC and adjoining mesophyll in C.maxima minor veins of the collection phloem is
reportedly as high as 48.16 plasmodesmata µm-2 (Gamalei, 1991).
4. Secondary PD formation in minor veins is correlated to the maturation of cucurbit
source leaves for sugar export (Turgeon and Webb, 1975; Volk et al., 1996).
5. Free space analysis (Madore and Webb, 1981) failed to demonstrate enough efflux of
RFO sugars to apoplast.
6. Immunolocalization of RFO key metabolic enzymes in intermediate cells: stachyose
synthase in Cucumis melo (Holthaus and Schmitz, 1991) and galactinol synthase (EC
2.4.1.123) (Beebe and Turgeon, 1992), the first committed enzymes in the RFO metabolic
pathway, is mainly distributed in intermediate cells according to electron microscopy
immunolocalization.
7. Solute concentration estimated in sieve elements in Cucurbita pepo callus by
plasmolysis (Lackney and Sjolund, 1991) is as high as 3 Molar, and RFO sugars concentration
also is higher in sieve elements than in the surrounding cells of minor veins estimated by
micro-dissection of Cucumis melo (Haritatos et al., 1996). These results confirm previous
estimates of solute concentration using histochemical methods (Pristupa, 1983).
1.6.2 Fundamental questions on cucurbit phloem transport still remain to
be resolved
However, fundamental questions remain on phloem loading and transport mechanisms
especially in cucurbits, and these questions are particularly suited to metabolomic analysis: 1)
the feasibility of the mass flow mechanism 2) the concentration gradient of photoassimilates
between mesophyll cells and sieve elements in minor veins 3) the fate of nutrient metabolites
smaller than sucrose during phloem loading and phloem transport 4) the potential co-existence
of both symplastic loading and apoplastic loading instead of solely symplastic loading
The feasibility of a mass flow mechanism for driving force in cucurbit phloem transport
has been questioned and challenged from conflicting published results of estimated phloem
sap concentration.
In most plant species examined so far, the relatively pure phloem exudates typically
contain high concentrations of sugars forming the main driving force for mass flow. Other
small metabolites such as amino acids and inorganic ions, especially potassium may also
contribute to the osmotic pressure inside sieve elements (Taiz and Zeiger, 1998). Phloem
exudates obtained via aphid stylet from another possible symplastic loader and RFO sugar

Chapter 1: Introduction
- 16 -
transporting species, Alonsoa meridionalis, contain enough RFO sugars (sum concentration of
sugars is around 1 to 2 M) (Knop et al., 2001). The estimated RFO sugars concentration in
SE-ICCs in minor veins by micro-dissection is about 600 mM (Haritatos et al., 1996),
consistent with those measured by plasmolysis experiments using phloem in callus(Lackney
and Sjolund, 1991). However, in phloem exudates of cucurbits, the concentration of RFO
sugars is below several milli-Molar, and measured osmotic pressure of phloem exudates is
also low (Richardson et al., 1982, 1984).
How can these conflicting results be interpreted? One suggested explanation about the
low concentration of sugars in cucurbits is that it is due to dilution from surrounding cells
especially by xylem sap (Patterns et al., 1992), (Crafts, 1936). However, improved sampling
by trying to avoid possible dilution from xylem by a shallow cut in stem (Patterns et al., 1992)
also did not give higher sugar concentration. Phloem exudates from cucurbits have been
shown to be relatively pure by direct microscopic observation (Crafts, 1936) and have been
extensively used for phloem protein analysis in the past three decades. From published
immunolocalization results, the abundant proteins of phloem exudates including the cucurbit
p-proteins (PP1 and PP2), are always found restricted to sieve element and companion cells,
indicating the relative purity of phloem exudates (Thompson and Schulz, 1999). The amino
acid concentration of phloem exudates of cucurbits falls within the range of other plant
species, which also adds to evidence of being relative pure. Therefore, more than ten-fold
dilution from surrounding cells seems unlikely (Fiehn 2003)
If the phloem exudates are relatively pure and if we accept the data showing low sugar
concentration of phloem sap, the results from micro-tissue dissection must be suspected of
being erroneous, since estimation of contamination is not always accurate. If phloem sap
contains so little sugar or total osmolytes, then is mass flow phloem transport in cucurbits still
feasible? What could contribute to the osmotic pressure for mass flow?
Following the previous argument, the questions of concentration gradients between
mesophyll cells and SE-CCCs have been challenged frequently either in standard textbooks of
plant biology (Fisher, 2002) or related reviews (van Bel, 1993) because it concerns the
feasibility and necessity of phloem loading steps in cucurbits, especially under the high degree
of symplastic connections between intermediate cells and surrounding cells.
Furthermore, a possible co-existence of apoplastic and symplastic loading in cucurbits is
likely. Spatial distribution of RFO sugar metabolic enzymes strongly supports the polymer-
trapping model. However, if we consider the fate of small molecules transported into
companion cell and sieve element complexes solely via a symplastic pathway, then there is a
fundamental question on how symplastic loaders cope with nutrient balance. Therefore,
apoplastic loading of these smaller metabolites may be necessary, in addition to symplastic
loading of RFO sugars. A spatial isolation of these two loading pathways could then be

Chapter 1: Introduction
- 17 -
required.
1.2 Main objectives of this study:
The major tasks of this thesis were functional characterization of long-distance transport
of metabolites in Cucurbita maxima , a symplastic loader, by metabolomic analysis combined
with cell biological techniques, based on the research strategy set up in our group.
Metabolomic analysis employs mass spectrometric methods to profile metabolites in
biological solutes (Fiehn, 2002). It provides one important basis for a non-biased view of the
whole biological system. Since two major function of phloem are transporting nutrients and
signals, and in both cases metabolites are of central importance, metabolomic analysis
therefore will enable us to take a rapid snapshot of phloem loading and transport status.
Further the comparative analysis of metabolite profiles will be particularly useful for
generating further hypotheses on phloem transport.
Previously, relatively pure phloem exduates from cucurbits were obtained by either
punching a small hole in petioles or glass capillary sampling. Small metabolites in phloem
exudates were profiled by GC/MS and RFO sugars by LC/LMS. Comparing metabolomic
data (Fiehn, 2003) with published results (Richardson et al., 1982), it was found that for
amino acids and sugar content in phloem exudates our data were consistent with the published
results, and in particular that sugar content was in a few millimolar (table 1.3).
In addition to finding newly identified amino acids including 2-methyl-serine and S-
methylcysteine, metabolomic profiling of phloem exudates by GC/MS revealed a vast number
of unknown small metabolites, many of which show strong GC/MS responses indicating they
are relatively highly abundant in phloem exudates. A comparative study using metabolite
profiling of C. maxima phloem exudates and leaf discs showed that many of these novel
compounds are much more abundant in phloem exudates than in leaf tissue (Table 1.4).
By LC/MS profiling , novel metabolites were also readily identified (Tolstikov and Fiehn,
2002; Fiehn, 2003). As discussed earlier, the low RFO sugar content in phloem exudates is
similar to previous data on cucurbits phloem exudates (Schaffer et al., 1996). However, two
families of O-linked and hexose-containing glycans with DP from 1 up to 11 (DP, degree of
polymerization) were detected. In contrast to the lower concentration and lower detection
response of RFO sugars by LC/MS, these two families of glycans show higher detection
response.

Chapter 1: Introduction
- 18 -
Table 1.3. Comparison of metabolite levels (mM) in petiole vascular exudates of C. maxima plants: In this study (n=100, 25 plants, in column labeled named as “This study”) by GC/MS and stem cut exudates in a previous study (n=10). Stachyose contents in this study were determined by LC/MS by a pool of 12 plants. Column labelled named “R.1982” is data from Richarson et al 1982. Compounds with empty cells were not included in quantification in one of the studies. Three-letter codes for amino acids are used. (Table is taken directly from Fiehn, 2003).
Table 1.4. Comparison of metabolite ratios between petiole vascular exudates of C. maxima plants (n=6) and tissue disks (P/L ratio) from the same leaf (n=6). Unknown compounds are marked with a Y, a number and chemical classification guided by mass spectral interpretation. Small additions ‘m’ marks peaks that were appearing as major peaks in phloem GC/MS profiles. aa=amino acid, 6-P.hexonate=6-phosphohexonic.acid, hexP=hexose phosphate, 2-O-glyl-a-gal = 2-O-glyerol-a-galactoside. (Table is directly taken from Fiehn 2003) .
The question for this study now is: how can these novel metabolomic data be
interpreted? What are the functions of these novel metabolites in terms of phloem loading and
transport, especially considering they are detected in phloem exudates of a symplastic loader?

Chapter 1: Introduction
- 19 -
There is no strong evidence that these phloem exudates are severely contaminated (Fiehn,
2003). If we consider phloem exudates as being relatively pure and phloem metabolites as a
major transport form from surrounding cells, such as leaf mesophyll cells, there must be a
loading step to accumulate those metabolites in an anti-concentration gradient manner.
Because most of these metabolites are smaller than RFO sugars, then how can these
metabolites be accumulated under symplastic settings of minor veins without diffusing back to
mesophyll cells or bundle sheath cells?
These questions are under these two essential premises: 1) OGPF driving phloem
transport. If most metabolites present in phloem exuadates are also transported in planta, they
should explain the osmotic pressure gradient for the driving force of mass flow mechanism. 2)
Phloem system is uniform, i.e. the architecture of phloem system is a negligible factor when
studying phloem transport. This is supported by several previous reports on cucurbit phloem
exudation. It was concluded that the phloem exudates are from both central phloem and
extrafascicular phloem. Most studies using cucurbits therefore neglect the difference between
the two phloem systems in cucurbitaceous plants. In the view of the metabolomic profiling
data generated in this work, the issue of the two phloem systems becomes a central theme.
1.3 Outline of result sections in following chapters:
The results are described in Chapter 3 to Chapter 6 according to the actual project
development. To allow readers a better understanding of the logical development of the
project and its findings, I briefly outline the arrangement of chapters of result and discussion
here:
In Chapter 3: I first describe the results obtained using metabolomic analysis of cucurbit
phloem exuadates for studying phloem transport physiology under the assumption that phloem
exudates could represent the transported solute in sieve tubes in planta and there is no
discrimination on phloem transport functions in different phloem systems of cucurbits. The
conflicts between these metabolomic data and the existing phloem transport mechanism point
to the origin of phloem exudates in cucurbits, although phloem exudation process in cucurbits
has been experimentally confirmed by previous researchers.
In Chapter 4: direct observations of phloem exudation and discovery of the true origin of
phloem exudates is described. These results reveal that phloem exudates in cucurbits in fact
do not originate from central phloem or from a combination of both phloem systems as
previously reported. Instead, they originate mainly from extrafascicular phloem.
Chapter 5 describes the methods to sample central phloem tissues and other tissues, and
the metabolomic data to study the very first question centres on the metabolomic profiles of
the two different phloem systems. It turns out that central phloem almost exclusively
transports RFO sugars, and therefore it can be concluded that extrafascicular phloem and

Chapter 1: Introduction
- 20 -
central phloem exhibit highly divergent transport functions.
Chapter 6 describes the difference of macromolecule content in two phloem systems,
especially phloem structural proteins (P-proteins) in the different phloem systems in cucurbits.
The difference phloem protein contents in both extrafascicular and central phloem became the
second central question we asked after discovering true origin of cucurbits phloem exudation.
Sampling methods are described and protein contents from the two different phloem systems
are analysed by SDS-PAGE and mass spectrometric based methods. Previously, it was
generally believed that PP1 and PP2 are the two major constituents of structural proteins for
central phloem. However, it is shown here that these two proteins are not detectable from
central phloem, and instead, structural proteins in central phloem contains several novel
proteins with amino-acid sequences showing little or no homology to published data from
cucurbits or other plants.
To make discussion section (Chapter 7) more focused, some discussions of results are
introduced throughout result chapters (3-6). Therefore, the discussion section focuses on these
important issues on the thesis research results: 1) Previous published research results on
experimental confirmation of phloem exudation in cucurbits; 2) The contribution of our
results to the understanding of basic concept in phloem transport physiology; 3). Phloem
transport mechanism in cucurbits; 4). Novel phloem protein from central phloem.

Chapter 2: Methods
Chapter 2 : Materials, chemicals, instruments and methods
- 21 -
2. 1. Instruments and software:
GC-TOF Pegasus II MS System (Leco, St. Joseph, MI, USA), operating software:
ChromaTOF™ ( version 1.60)--for metabolomic analysis
LCQ deka mass spectrometer (Thermo-Finigan, CA, USA) ), a Rheos 2000 pump (Flux
Instruments AB, Karlskoga, Sweden), and an HTS PAL autosampler (CTC Analytics, Zwingen,
Switzerland). The system was operated under the Xcalibur software (version 1.2
SP1,ThermoFinnigan)---for metabolomic analysis
Applied Biosiystem (CA, USA) Voyager-DE™ PRO Biospectrometry Workstation (with
Data explorer software, version 4.0.0.0, for data analysis)—mainly for profiling phloem exudates
QTOF (quadrupole time-of-fight hybrid mass spectrometer, Micromass, Altrincham, UK),
equipped with a z-spray source)—for protein sequencing
GC 8000/Voyager mass spectrometer system (ThermoQuest, Manchester, UK) with AS 2000
autosampler—for stable isotope labeling experiments
GC/MS (Aligent, GC/MSD controlled by software Chemstation) –for analyzing PMAA
Eppendorf® Centrifuge 5417C with Fixed-angle rotor FA-45-30-11 (Eppendorf AG,
Hamburg, Germany)
Freeze dryer (Model: Christ Alpha Loc-1m. Osterode, Germany)
Speed-vac concentrator (Maxi-Dry Lyo, Heto-Holten A/s, Jouan GmbH, Germany)
Retch Mill: (Model: Mm200; F. Kurt Retsch GmbH & Co.KG 42781, Haan, Germany)
Thermomixer (Model: HLC TM 130-6, HLC-Haep Labor Consult, Ritterstieg 1a, D-37120,
Bovenden, Germany)
Kälte-Umwälzthermostat (Model: F10, Julabo Labortechnik GmbH, D-77960, Seelbach,
Germany)
Vortexer Vortex Genie 2 ( MAGV, Rabenau, Londorf)
Binocular (MZFLIII, Leica, Germany) with fluorescein microscopic accessories
Metal stand for binocular (SMS6B, Diagnostic Instrument Inc., CA, USA)

Chapter 2: Methods
Leica MZFLIII microscope equipped with fluorescein microscopic accessories
Spot camera controlled by Metavue software (Diagnostic Instrument Inc., CA, USA)
Bio-Rad gel doc system (Model: Gel doc 2000, Bio-rad, Germany)
Bio-rad electrophoresis system: (Cat. 165-3316 Mini-PROTEAN 3 Electrophoresis
Cell/PowerPac 2000 Junior System, Bio-rad Laboratories GmbH D-80901, Muenchen, Germany)
Biometra protein slab gel system (Model: Maxgel, Biometra GmbH i.L., Goettingen,
Germany)
Biobox plant growth chamber (Model: BIOBOX 40, with tight temperature, humidity, light
control and of gas composition of atmosphere control. GMS Gaswechsel-Messsysteme GmbH,
Luckenwalde, Germany,) for stable isotope labelling experiment
2. 2. Chemicals
Most chemicals were purchased from Sigma-Aldrich, Merck, Carl Roth and Supercol.
Enzymes used for biochemical analyses were obtained from Sigma or Roche Molecular
Biochemicals. Chemicals regarded as crucial for individual experimental procedure will be
mentioned in method description.
2. 3. Plant materials and growth conditions
Seeds from Cucurbita maxima Duch. cv. Gelber Zentner (pumpkin), Cucumis sativus L. cv.
Hoffmanns Giganta (cucumber) and Cucurbita pepo L. cv. Cocozelle v. Tripolis (zucchini)
(Treppens, Berlin, Germany) and Citrullus lanatus (Thunb.) Matsum. & Nakai (watermelon,
Julius Wagner GmbH, Heidelberg, Germany) were grown in commercially available pot soil under
controlled conditions in either phytotron or greenhouse in Golm throughout the year 2000-2003
described as below.
- 22 -

Chapter 2: Methods
Growth Chamber Day/night Day Temp. Night Temp Relative
Humidity
Greenhouse1 6AM-23PM 24 oC 20 oC 65%
Phytotron Nr.9 6AM-23PM 22 oC 18 oC
70% day
50% night
ave.62%
Phytotron Nr.10 All day 22oC constant 22 oC 70%
Cucurbita maxima was used throughout the majority of experiments. For interspecies
comparison by metabolomic profiling, cucumber, watermelon, zucchini were also used. For
grafting experiments, pumpkin and cucumber were used.
2. 4. Metabolomic analysis
2.4.1. Procedures for metabolomic analysis by GCMS and LCMS
2.4.1.1. Sampling of phloem exudates and leaf discs
Plant stem or petiole were punched one hole by clean stainless needle or completely removed
by clean and shape blade. Exudates were collected using plastic micropipette. Immediately,
phloem exudates were mixed with water and chloroform (400 ul/300 ul), and were vortexed briefly.
After centrifugation by 14000 rpm (eqv. to 15,777 g for this centrifuge and rotor) for 2 minutes,
polar phase was aliquoted into two parts, one was for GCMS measurements, and the other was for
LCMS measurements. Aliquots for GCMS measurement were lyophilized and processed as
described below.
Leaf discs were harvested by 1 cm diameter stiletto, immediately put into 2 ml plastic
eppendorf tube, followed immediate freezing in liquid nitrogen. If not processed immediately, they
were stored in a –80 oC fridge.
2.4.1.2. Homogenization and extraction
Retsch ball-mill tube holders were pre-chilled in liquid N2. Three to four samples were
- 23 -

Chapter 2: Methods
placed into each of the ball-mill tube holders. Homogenization of the tissue took 30 s at 60% speed.
Immediately the tube holders and the samples were returned back into liquid N2 after
homogenization. 1 mL pre-chilled mixture (-16 to -20°C) of H2O:methanol:chloroform (1 : 2.5 : 1,
v/v/v) was immediately added into each homogenized samples. Vortexed thorough for 10 s. Care
was taken to ensure that powder located in the cap of the Eppendorf tube was also mixed into the
suspension. Eppendorf tubes were shaken at 4°C for 5 min, centrifuged at 15,777g for 2 min
(Wechwerth et al 2004).
2.4.1.3. Fractionation and aliquotation:
Give supernatant into a 1.5 mL Eppendorf tube. Add 0.4 mL pure water conductivity < 0.05
µS), vortex, and centrifuge at 15,777 g for 2 min. Transfer the supernatant into another Eppendorf
tube ('polar phase'), taking care not to carryover anything from the lipophilic phase. Lipophilic
phase was discarded.
2.4.1.4. Aliquotation:
For leaf disc, phloem sap samples, the polar phase was divided into two aliquots for GC/MS
and LC/MS analysis. For samples from tissue dissection, 50 µl of polar phase was used for GC/MS
analysis, the rest was for LC/MS analysis.
2.4.1.5. Lyophilization
Dry down the polar phase aliquote for GC/MS analysis to complete dryness (overnight). The
aliquot for LCMS analysis was stored in fridge for further LCMS analysis.
2.4.1.6. Derivatization (Karl, 1993):
1. Methoximation of lyophized samples (Methoximation protects carbonyl moieties and
inhibits cyclization of monosaccharides):
On a daily basis, prepare a fresh solution of 20 mg/mL methoxyamine hydrochloride (Sigma)
in dry pyridine (Sigma). Add 30 uL of this mixture to the dried sample (for phloem exudates
- 24 -

Chapter 2: Methods
/micro-dissection samples 10 µL). Incubate for 90 min at 30°C with continuous shaking. Samples
with 10 uL derivatization reagant was centrifuged at 15,777 g for 30 s prior to adding silylation
agents.
2. Silylation
For TMS derivatization, add 30uL (10 uL for phloem exudates and micro-dissected samples)
of N-methyl-N-trimethylsilyltrifluoroacetamide (MSTFA, Macherey-Nagel) to the sample.
For TBS derivatization, use Fluka reagents (N-tert.butyldimethylsilyltrifluoroacetamide,
MTBSTFA), 10 uL each sample.
Incubate for 30 min at 37°C (TMS) or 70°C (TBS) and wait 120 min prior to the first
injection.
After derivatization, for phloem exudates samples and micro-dissected tissues samples,
eppendorf tubes were centrifuge briefly centrifuged before removing the reaction product to
GCMS glass vials.
2.4.1.7. GC/MS analysis
Inject 0.5-1 µL in splitless mode, purge 90 s (Agilent standard s/sl injector). Do not use split
mode, as this injector shows severe aging effects inhibiting detection of amines and amino acids in
split mode.
2.4.1.8. LCMS analysis
HILIC-ion trap profiling of polar-phase metabolite extract was performed as described
(Tolstikov and Fiehn, 2002). Sucrose, raffinose and stachyose mixture were used for external
calibration.
2.4.1.9. Metabolite identification in GC/MS
Metabolite identification, mass spectra analysis of GC/MS (quadruple) was according to
(Fiehn, 2003). Mass spectra and chromatograph of GC-TOF was analysed by Leco software.
Quantification was done using quality control mixture of standard compounds as external standard.
- 25 -
Chapter 2: Methods
2.4.1.10. Metabolite identification in LCMS
Molecular masses of adduct ions relative retention time and their MS^2 fragmentation
patterns were used for metabolite identification. Xcalibar software package was used for data
analysis of LC-ion trap data. Quantification of sugars was done by external calibration method.
Peaks were integrated without further subtraction.
2.4.2. Structural elucidation of unknown carbohydrates
2.4.2.1. Monosaccharide composition analysis:
The sugar composition analysis of HILIC separated glycan samples in glass vials were first
identified by ESI-MS^n for checking purity of fractions. The relatively pure fractions were
lyophilized. The composition of the glycans were determined by preparing alditol acetate
derivatives of monosaccharides released by acid hydrolysis (as was done by Markus Pauly’s group)
(Markus, 1999). The lyophilized samples were first hydrolyzed into monosaccharides using
trifluoroacetic acid (TFA, Sigma) before reduction and O-acetylation (York, 1985). A standard
sample containing a mixture of 100 ug each of the following sugars: rhamnose, fucose, arabiose,
xylose, mannose, galactose and glucose was preparaed and reifeatized in parallel with the samples.
2.4.2.2. TFA hydrolysis:
Visable amount (100 ug samples) glycan samples were mixed with 25 ug of myo-inositol and
transferred to a screwed-capped borosilicatetest tube. Any solvent was evaporated. TFA (2M, 250
uL) was added, and the tube was sealed and incubated f or 1hr at 121 oC in a heating block.
Isopropyl alcohol was added (300 uL) and evaporated the same way. This isopropanol treatment
was repeated twice.
2.4.2.3. Alditol formation:
Ammonium hydroxide (NH4OH, 1M, 250 uL) containing 10 mg/mL sodium borahydride
was added to the dried monosacdchride samples and incubated at RT for 1hr. Glacial acetic acid (2
- 26 -
Chapter 2: Methods
to 3 droplets) was then added using a glass pipette to quench the reducing agent, and the solvent
was evaporated under a gentle stream of dry nitrogen gas. To remove the resulting borate as its
volatile trimethylester residue, these samples were dissolved in 250 uL of a 9:1 mixture of
methanol: glacial acetic acid, which was evaporated under dry air. The addition and evaporation of
methanol/acetic acd was repeated 3 more times. Neat methanol (250 uL) was then added and
evaporated under dry air. The methanol treatment was repeated twice.
2.4.2.4. Acetylation of the alditols:
Acetic anhydride (5 droplets from a glass pipette) and pyridine (also 5 drops from a glass
pipette) were added to the dried samples. The test tube was sealed and heated for 20 min at 121 oC.
The solvent was then evaporated under a stream of dry air. Toluene (250 uL) was added to remove
residual pyridine and evaporated. The toluene treatment was repeated twice. The resulting alditol
acetates were dissolved in methylene chloride (0.5 mL), and water (0.5 mL) was then added. The
resulting emulsion was vortexed and centrifuged for 5 min at 2000 g in a table-top centrifuge to
separate the aqueous and organic phase. The methylen chloride phase (bottom phase) containing
the alditol acetates was gently removed with a Pasteur pipette and transferred into a new
screw-capped borosilicate test tube. The methylene chloride was slowly evaporated under a stream
of dry air, and the residual alditol acetates were dissolved in 100 uL acetone. The solution was
stored in the freezer (-20 oC) until gas chromatography and mass spectrometric (GC/MS) analysis.
2.4.2.5. GC/MS analysis of alditol acetates:
PMAA or monosaccharide alditol acetates was analysed by GC/MS (Column: SP2380,
Supelco Belleforte, PA, USA, 30mx0.2mmX0.2um; Agilent 6890N GC system coupled to 5973
netework mass selective detector controlled by Chemstation software). 2 ul sample was injected in
splitless mode. The alditol acetates in acetone (2 µL) were injected in splitless mode. MS source
temporature was maintained at 230 oC and MS quad temporature 150 oC. The initial oven
temperature was 160oC, Programmed oven temporature: starting temporature was 160 oC, ncreased
in 20 oC/min to 200 OC, held for 5min, then increased to 245 OC in 20 oC/min, held for 12 min then
- 27 -

Chapter 2: Methods
stepped now to 160 oC in 20 oC/min. After 4-minute’s solvent delay, spectra of eluted O-acetylated
alditol were recorded within mass range of 50-300 amu. The response factors, relative to the
internal standards myo-inositol, were determined by injection the standard sample mixture and
integrating the peak areas for each sugar derivative.
2.4.2.6. Linkage analysis of glycans from HILIC fraction
2.4.2.7. Per-O-Methylation
Permethylation of laminarin (as control), HILIC glycan fractions and non-fractioned polar
phase of total phloem exudates was performed according to Ciucanu and Hakomori (Hakomori,
1964; Ciucanu and Kerek, 1984) method. Briefly, smaller than 1 mg vaccum-dried samples were
redissolved in 200 ul water-free dimethyl sulfoxide (DMSO) by 1 minute's sonification, then 200ul
fine-powered NaOH in water free DMSO suspension and 70ul methyl iodide (MeI) were added in
turn, followed 5 minutes' sonification. The methylation procedure was stopped by addition of 2 ml
deionized water, and the rest of MeI was removed by bubbling through N2 gas. The methylation
product was extracted by 1 ml chloroform and back extracted by 25% acetic acid. The
permethylated product was aliquoted for further permethylated alditol acetates (PMAA) formation
step and direct infusion ion trap MS^2 analysis. Both aliquots were dried by gentle nitrogen gas.
The aliquot for ion trap measurement was re-dissolved in an appropriate volume of 1mM sodium
acetate in 70% methanol for direct infusion injection in tandem mass spectrometric experiment.
The fine powdered NaOH in water free DMSO was prepared as follow:
Mix 100 ul 50% NaOH and 200 uL methonal in 13X100 mm screw-top tube (HPLC grade,
Sigma), and then add 6.0 mL of DMSO (stored by molecular sieve, argon filled, tightened capped),
following vortex and sonificate (~5min.). After centrifuge at low speed, the supernatant was
discarded. Respend pellet in 6.0 mL of DMSO, vortex thoroughly. Repeat the the above-described
procedure four times in total. Suspend final pellet in 2 mL of DMSO and fill in Argon gas. The
suspension of fine powered sodium hydroxide in water-free DMSO was ready for use.
- 28 -

Chapter 2: Methods
2.4.2.8. PMAA formation for linkage analysis
For linkage analysis, permethylated glycans were converted into permethylated alditol
acetates (PMAA) by aboved mentioned three steps in composition analysis of carbohydrates:
hydrolysis of permethylated glycans by TFA, alditol formation, acetylation of the alditols. The
only different step was in Alditol formation step where NaBH4 and NaBD4 reduce the aliquots
respectively.
2.4.2.9. Data analysis of PMAA:
Spectra of PMAA were compared to published spectra with free available web-based
database published by complex carbohydrate research center (University of Goergia,
http://www.ccrc.uga.edu/web/specdb/ms/pmaa/pframe.html). PMAA of laminarin (a mixture of
beta-1,3 and 1,6 glucose polymer) was used for relative retention time control.
2.4.3. MALDI-TOF finger printing of phloem exudates
1uL of polar phase of phloem exudates was mixed 1:1 (v/v) with 0.1% TFA saturated DHB
(2,5-Dihydroxybenzoic acid) matrix. The concentration of polar extract of phloem exudates was
tested to maximize sensitivity of detection. Mixture of oligo-maltose with different degree of
polymerization was used for calibration standards, internally or externally. 0.5-1 uL was spotted
on 96-well stainless MALDI-plate (PerSeptive Biosystems, Framingham,MA, USA). After
spotting samples onto MALDI-plate, sample spots were immediately vacuum-dried (Lerouxel et
al., 2002).
For protein digest, thin-layer sample preparation method was used, adopted from (Gobom et
al., 2001). Matrix was prepared by dissolving an excess of -cyano-4-hydroxycinnamic acid
(CHCA) in 99% acetone, 0.1% TFA. Dilute the solution 1:4 in the same solvent. 0.5-1 ul of the
matrix solution was deposited over the surface of MALDI sample plate. Aliquots of crude
proteolytic digests were acidified to a final concentration of 0.2% TFA, and subsequently
transferred to the MALDI sample support. After 3 minutes’ incubation, remove the sample
solution from the matrix spots by adsorption onto a paper tissue. Wash the samples by immersing
- 29 -

Chapter 2: Methods
the sample plate in a solution of 0.1% TFA for 5-10s. Remove the remaining liquid by gentle
nitrogen gas. The 96-well stainless metal sample plate was inserted into MALDI-TOF for
measurement. Matrix solution itself was used for blank control. For protein digest analysis, trypsin
autolysis without addition of protein substrate was also used for blank control.
Acquisition conditions of MALDI-TOF machine were as follow:
Acquistion parameters of MALDI-TOF (DE Pro, Applied Biosystems, USA) were tuned
using samples of standard to high resolution (at least 6000 to 7000 FWHM, full width at half
maximum, more parameter settings see table below). For analysis of glycans in phloem exudates,
oligo-maltose mixture was used first for generating external calibration files. For analysis of
protein digest, standard protein mixture 1 (Applied biosystem, USA) was used for generating
external calibration files. The four masses of standard protein mixture are:
Components of protein standard mixture 1 Mono-isotopic mass
Cal-mDes-Arg-Bradyykinin 904.4681 Da
Angiotensin1 1296.6853 Da
Glu-FibrinopeptideB 1570.6774 Da
Neurotensin 1672.9175 Da
- 30 -

Chapter 2: Methods
Instrument parameters Protein digest phloem exudatesExtraction mode: Delayed Delayed
Polarity: Positive PositiveAcquisition control: Manual Manual
Accelerating voltage: 25000 V 25000 VGrid voltage: 77% 87%
Mirror voltage ratio: 1.12 1.12Guide wire 0: 0.002% 0.002%
Extraction delay time: 120 nsec 350 nsec
Acquisition mass range: 600 -- 3000 Da 500-2000 DaNumber of laser shots: 150/spectrum 150/spectrum
Laser intensity: 2077 2800Calibration type: External external
Calibration matrix: a-Cyano-4-hydroxycinnamic acid DHBLow mass gate: 500 Da 500 Da
Timed ion selector: Off Off
Bin size: 0.5 nsec 0.5 nsecVertical scale 0: 1000 mV 1000 mVVertical offset: -1% -1%
Multiple channel plate detector settings
2. 5. Total carbohydrate analysis by phenol-sulfuric acid assay
The estimation of total carbohydrate (hexose) content in polar phase of phloem exudates
using phenol-sulfuric acid color assay was according to (Dubois, 1956), using glucose as
standards.
2. 6. Grafting experiments
Heterograft between Cucumis sativas and Cucurbita maxima were performed as described as
(Ruiz-Medrano et al., 1999) and (Tiedemann, 1989), with either cucumber or pumpkin as scions.
Grafting was performed using two-week old plants. After removal of plastic bags that was used for
keeping in high degree of humidity (three days), successful grafted plants were subjected to
adapting growth for further one week before sampling. The sampled plants were 25 days old after
sowing. Plants were taken into lab for sampling. For collecting
- 31 -

Chapter 2: Methods
Upper picture: shows the graft
junctions after incision of stems
simultaneously and rapidly both sides of
one centimeter away from grafting sites Successful heterograft between cucumber (stock)
and pumpkin (scion) for sampling in 3.5 weeks old plants
- 32 -
Pumpkin
Graft union Cucumber
Pumpkin scion
Cucumber stock
phloem exudates from both scion and stock phloem avioding artifacts induced by surging
release of phloem content between scions and stocks during sampling, both sites about 1 cm away
from the graft junctions were immediately and simultaneously incised by clean blades. Phloem
exudates were collected from scion and stock. Storage, extraction of samples and subsequent
metabolomic analysis were performed as described above.
2. 7. Phloem transport studies by 13CO2 stable isotopic labeling
2.7.1. Labeling with 13CO2
One two-and-half weeks old Cucurbita maxima plant gown in Biobox chamber under highly
controlled conditions was used for 13CO2 labeling.
Length Light Temperature Relative
Humidity
Concentration
of O2
Concentration
of CO2
Day 16 hrs 100%
on
22 oC 70% 20% 700 ppm
Night 8 hrs Off 18 oC 70% 20% 700 ppm
First, air with 700 ppm CO2 in the biobox chamber was flushed out by technical gas
(Nitrogen without CO2 and O2) until the concentration of CO2 inside the biobox chamber below 20
ppm. Then Biobox chamber was filled with synthetic air (20% oxygen and 700 ppm 13CO2).

Chapter 2: Methods
Because of the photo-respiration, plants will release CO2 whose carbon was fixed before stable
istopic labelling experiments, therefore, the chamber was not possible to be constant in 700 ppm
for 13CO2 without altering the total CO2 concentration of air inside chamber, therefore, the
chamber was controlled in the way that total CO2 concentration (mixture of 13CO2 and 12CO2)
was maintained at 700 ppm. Other parameters were the same as that before labelling experiments.
2.7.2. Sampling phloem exudates and leaf discs in labeling experiments:
Before labeling experiments, one 1 ul phloem exudates was collected. During experiment,
phloem exudates and leaf discs were collected in different time intervals with a special glass
window equipped a pair of gas-tight plastic gloves and small window for transfering sampling
needed staffs.
2. 8. Microscopy, imaging and phloem exudation study
2.8.1. General microcopy
2.8.1.1. Alkaline aniline blue staining (Evert and Derr, 1964)
0.01-0.5% alkaline aniline blue was prepared by dissolving aniline blue (ammonium salt,
Sigma) in 1/15 Na2HPO4, adjust PH to 8.5 by 1N NaOH. The solution was kept overnight before
use.
2.8.1.2. Epifluorescein microscopy
Both epifluorescein microscope (Olympus BX41, Japan) and fluorescence binoculars (Leica,
MZFLIII, Germany) were used. Both of them were equipped with fluorescence microscope
accessories. One to two droplets of 0.01-0.5% decoloured aniline blue solution was applied to
fresh tissues or sections. Immediately after application, callose can be visualized by fluorescein
microscopy. For BX41 using cube filter block U-MWU2 (dichroic mirror: 400nm, excitation
filter: 330-385 nm, barrier filter: 420 nm) with or without cover slides, for MZFLIII using UV
filter set (excitation filter: 360+/-20 nm, barrier filter: 420 nm).
CF5(6) was visualized using cube filter block U-M41012, excitation 455-495 nm, dichroic
- 33 -

Chapter 2: Methods
mirror 505 nm, barrier filter >510 nm in BX41 microscope, this filter block was taken from
Olympus AX70 microscopy system). In binoculars, GFP Plus fluorescence filter set (excitation
filter 480+/-20 nm, transmission filter >510 nm) was used for visualizing phloem tracers.
Sections not stained with alkaline aniline blue or without CF(5) tracer application were used
for negative control respectively.
2.8.1.3. Protein staining by amido black 10 R:
0.1% Amido black 10R (Bio-Rad) was used for tissue staining of proteins. 1% stock solution
was prepared by dissolving amido black 10R in 7% acetic acid, and filtered to remove insoluble
materials. When distaining was necessary, 7% acetic acid was used for distaining solution. Stained
tissues were observed by light microscopy.
For stem protein dissection, staining solution includes 0.1% amido black, 10mM EDTA,
0.1%
2.8.2. Microscopic imaging and image analysis
Microscopic images from both BX41 micrscope and MZFLIII binoculars were taken by spot
camera (Model: 2.2.1, Visitron systems GmbH, Germany Model: 2.2.1.) controlled by Metavue™
software (version 5.0r4, Universal Imaging Corp., PA, USA). For fluorescein microscopy, system
default settings of white balance for spot camera were used. For light microscopy, white balancing
was done using blank slides. Dynamic process of phloem exudation was photographed as frames
in stacks. Stacks were further exported as individual frames and re-assembled into AVI format
movie using Adobe Premier (version 4.2).
MetaMorph® offline (version 4.6r9, Universial Imaging Corp., PA, USA) was used for image
analysis including calculation of distance, area, and image notation. Rulers for calibration of
microscopic images were generated from images of grids from haemocytometer. (0.0025 mm2,
Neubauer). Calibration application embedded in Metamorph offline software was used for
calibration of acquired images using self-recorded journals.
- 34 -

Chapter 2: Methods
2.8.3. Fluorescein phloem tracer application
1 mM 5(6)-carboxyfluoresein (abbr. CF5(6), Fluka 21877, Mr=376.33) solution (PH6.3) was
used for fluorescein phloem tracer (Grignon et al., 1989). About 1cm abaxial leaf surface were
gently braded by sandpaper (Grain size 120, Holz and Farbe, Germany), and gently washed with
water and a thin layer of cotton was placed onto the braded leaf surface, following about 20 ul
tracer solution dropped onto cotton layer. Tracer applied leaf surface was covered by foil to reduce
evaporation of tracer solution. About two to three hours later the whole plant was taken into
microscopic room for observation. To introduce the tracer into parenchyma cells of cortex, the
epidermis of petioles and the slerenchyma layers of stems were erased carefully by sandpaper
(grain size 80, Holz and Farb, Germany). The thin layer of cotton covers the epidermis-erased
petiole or stem, and then 40-60 uL tracer solution was applied to the cotton layer, covered with
parafilm to reduce the evaporation. Outside the parafilm, a layer of foil was used to keep the
application sites dark overnight before plants were taken into lab for microscopic observation.
O
O
O
OHOH
5 /6OH
O
Formula Weight = 376.316
Molecular Formula = C21 H12 O7
Monoisotopic Mass = 377.06613 Da
5-(and-6)-carboxyfluorescein mixture Abbreviation: CF5(6)
2.8.4. Direct observation by phloem exudation
Observation of phloem exudation: because the limitation of short working distance
between stage and objectives, binoculars (MZFLIII, Leica, Germany) were mounted on metal
stand (SMS6B light duty ball bearing zoom stand, Diagnostic Instrument Inc., CA, USA).
Microscopic focus was pre-adjusted before stem or petioles were incised for exudation observation.
Cucurbits petioles, or stems leaves were cut off with clean blade and immediate observed by
binoculars. For some experiments, leaves with a fragment of petiole attached were also used for
exudation observation. Stem exudation was done after petiole exudation or before petiole
exudation in the similar way of petiole exudation observation. The tip part of the stem was
removed, and then the rest plants were used for observation of exudation. The tip part of the stem,
- 35 -

Chapter 2: Methods
in some experiments, was also used for exudation observation. For continuous phloem exudation
observation, it was necessary to remove about 1 to 10 mm petiole or stem fragment, when the
exudation becomes slow or stopped, as was a normally used procedure for phloem exudation
observation. Light source for illumination in imaging of phloem exudation was enhanced by place
double light sources (KL1500, Leica, Germany). The light was adjusted such a way that the
maximum of contrast was achieved for easy identification of phloem tissues.
For analysing possible factors that could influence phloem exudation under direct
observation by binoculars, 10 mM EDTA (di-sodium salt PH6.3) used by direct application to
stem cut surface.
2. 9. Manual micro-tissue dissection of lyophilized stem vascular tissues
2.9.1. Sampling
Stem internodes of 2 months old Cucurbita maxima plants were immediately cut off and
put into liquid nitrogen. Phloem exudates, leaf disc of largest mature leavesweresampled as
described above.
2.9.2. Lyophilization and storage
Liquid nitrogen frozen stem internodes were lyophilized for 3 days. Dried stem
internodes were stored in –20 oC fridge in plastic bags with Astrau blau filled with nitrogen gas
for further use.
2.9.3. Micro-tissue dissection
Lyophlized stem internodes were taken out of –20 oC fridge and immediately put into
desiccator filled with nitrogen gas, wait for 1 hour for materials warmed up to room temperature
before use. Tissue dissection was operated in room temperature in microscopy lab, with dirt free
environments and clean operation tools (blades, needles, forcepts and parafilm) to avoid possible
contamination. About 0.5 cm thin crosse-sections were taken from lyophilized stem internodes.
Epidermis region outside cortex was removed and discarded. Further the cross section was
divided into pieces under binoculars according to individual vascular bundle. One piece containing
- 36 -

Chapter 2: Methods
one vascular bundle was further divided into xylem, internal central phloem, external central
phloem, cortex, pith and extrafascicular phloem containing tissues. All samples were
photographed using spot camera for further volume estimation. Purity of central phloem regions
was confirmed by alkaline aniline blue staining both ends of dissected central phloem tissues. The
percentage of sieve element in central phloem region was estimated by cross-sectioned vascular
bundles stained by alkaline aniline blue observed under fluorescein microscope.
Dissected tissues were transferred into Eppendorf tube by needle and stored in –80 oC
fridge for further metabolomic analysis.
2. 10. Sampling exudates from central phloem region by glass capillary
Micro-sampling central phloem exudates using glass capillary made according to (Brandt et
al., 1999). About 1-2 centimeters’ thick stem internodes were cut off from plants with CF5(6)
applied in leaves. Extrafascicular phloem exudates were continuously removed by clean tissue
paper untill exudation stops, as monitored under binoculars by light microscopy and fluorescein
microscopy. Samples in glass capillary were photographed for further volume estimation, and then
transferred to Eppendorf tubes for further metabolomic analysis.
2. 11. Phloem protein sampling and analysis
2.11.1. Micro-sampling phloem proteins manually by metal needles
Experimental tests confirm that the thawn stem internodes kept in cold room can efficiently
prevent exudation(Weber et al., 1974) from extrafascicular phloem system. Two to three months’
old Cucurbita maxima plants were used for sampling, when the central phloem sieve elements
were mature and larger, easy for manual operation. Stem internodes in the middle of the plants
were immediately cut off and put into liquid nitrogen to freeze. The rest parts of stems were used
for phloem exudates collection using plastic micropipettes as described previously (Kehr et al.,
1999). Sampled stem internodes in plastic bags and phloem exudates in 1.5 ml plastic Eppendorf
(Eppendorf®, Hamburg, Germany) tubes were transferred into –80 C fridges for further use.
- 37 -

Chapter 2: Methods
2.11.2. Micro-sampling of central phloem proteins by needles
2.11.2.1. Sectioning and staining:
The frozen stem internodes were longitudinally or crossly sectioned into thin pieces in cold
room. Thin sections in 20 ml beaker were briefly stained by amido black solution with proteases
inhibitors for 1 to 2 minutes, and then washed gently with washing solution several times and
poured out.
Staining solution: (PH6.3, adjusted with HCl): 0.1% amido black 10R (Bio-Rad ®,
Germany), 10 mM EDTANa and 10 mM PMBS (1% stock amido black 10R solution in water was
filtered before use).
Washing solution: (PH6.3, adjust with HCl) 10 mM EDTANa and 10 mM PMBS
2.11.2.2. Sampling
Beaker containing stained sections was placed on ice, taken into microscope room and
immediately sampled. Sections were placed on clean parafilm supported by ice under binoculars to
keep low temperature. Clean (sterilized by methanol and aired dried) blades was used for petiole
sectioning and clean needles (Sterican®, B. Braun AG, Germany, 0.45X25 mm) were used for
phloem protein isolation from central phloem of stem tissues. The needle tips were fine enough for
picking up the sticky phloem protein plugs in sieve tubes of central phloem and possible
contamination from extrafascicular sieve elements were avoided by careful operation. Sampled
central phloem protein on needle tip was transferred into plastic Eppendorf tubes containing 20-50
ul Tris-buffered phenol (Invitrogen, USA). Eppendorf tube containing sample was kept on ice
during sampling and and transferred to –80 oC until enough amount of phloem proteins were
sampled, judging by color of phenol (changes to deeper blue).
2.11.3. Dissection of central phloem tissues:
Liquid N2 frozen stems were taken out and partially thawn at room temperature, before it was
completely thawn and still under frozen, several centimetres’ internal and external central phloem
tissues were carefully stripped out manually by forceps. The dissected central phloem tissues were
- 38 -

Chapter 2: Methods
a mixture of cells: sieve elements, companion cells and phloem parenchyma cells and small mount
of extrafascicular phloem region and cambium tissue, as confirmed by microscopy. Sampled
internal and external central phloem tissues were frozen in liquid nitrogen, homogenised.
2.11.4. Proteins from phloem exudates
Sampling, extraction and one dimensional SDS-PAGE analysis of phloem exudates proteins
was done according to (Walz et al., 2002).
2.11.5. Extraction phloem proteins by phenol method
Homoginized central phloem tissues, phloem exudates and phloem proteins dissected by
needle were processed by phenol extraction followed methanolic ammonium acetate precipitation
method as described in (Hurkman and Tanaka, 1986). 6M Urea was added into sample buffer
(Walz et al., 2002) for resolubilization of protein pellet.
2. 12. Gel electrophoresis analysis of phloem proteins by SDS-PAGE
2.12.1. Electrophoresis
0.75-1cm thick 10-20% ready gel (Bio-Rad) or homemade 10% or 15% SDS-PAGE gels were
used for protein electrophoresis in reduced condition. Precision standard protein molecular weight
markers were from (Bio-Rad).
2.12.2. Protein gel staining
After electrophoresis, gel was stained by colloidal coomassie stain (161-0786, Bio-Safe
Coomassie Stain, Bio-Rad laboratories Inc., Muench, Germany) according to the instructions
provided by manufacturer.
2.12.3. Imaging and image analysis
Protein gels were stored in –4 oC in Millipore water and gel images were recorded by
Bio-rad® Chemi Doc system controlled by Qunatity one 4.2.1 version software. Images were
exported as TIF format and further analysed by 1-D gel analysis application in image analysis
- 39 -

Chapter 2: Methods
software MetaMorph Offline (version 4.6r9, Universial Imaging Corp. 2002).
2. 13. Protein identification and sequencing by mass spectrometry
2.13.1. In gel digestion of gel separated proteins
Protein bands of SDS-PAGE gels were cut off and in gel digested by modified porcine
trypsin (Promega, Madison, WI, USA) as described in (Walz et al., 2002).
2.13.2. De novo sequencing peptides in trypsin digest by QTOF
After peptides digestion mixture were desalted by C18 ZipTip™( Millipore Corporation,
Bedford, Massachusetts, USA), de novo sequencing of peptides in protein digest mixture by
nano-spray QTOF, interpretation of peptides’ spetra from MS^2 fragmentation and database
searching for protein identification was according to (Walz et al., 2002).
2.13.3. Protein identification by LCQ and MALDI-TOF
Phenol extracted protein mixture was directly subjected to LC-ion trap measurement after
trypsin digestion, as done by AG Weckwerth. Spectra of MS^2 fragmentation of individual
peptide were recorded using data-depended acquisition of LC-ion trap (LCQ Deka XP,
thermo-finnigan, USA). Data were submitted to web-based Mascot
(http://www.matrix-science.com/cgi/index.pl?page=/) software (Perkins et al., 1999) protein
identification.
MALDI-TOF measurement of protein mixture was performed as above described. Masses
were externally calibrated by external calibration files during spectra acquisition. The trypsin
autolysis ions were used for internal calibration (Haebel and Kehr, 2001).
2. 14. Data analysis
Most data were processed using Microsoft Excel 2000. Procedure of multivariate analysis
was according to (Fiehn, 2003). Empty cells in data set of the same replications were filled by
group means. If no value is present for all replicated samples with the same group, cells are filled
by half of detection limit.
- 40 -

Chapter 3: Metabolomic analysis of phloem exudates
Chapter 3 Phloem transport in cucurbits using metabolomic analysis of phloem exudates
3.1 Structural elucidation of glycans in phloem exudates
Metabolite identification is one initial and important step in metabolomic analysis. Small
metabolites of phloem exudates were analysed by GC/MS and identified according to their
retention times and spectra in mass spectral databases. By GC/MS profiling of C. maxima
phloem exudates, about 400 chemical components could be identified and about 80
metabolites were unambiguously characterized by their retention time and mass spectra (Fiehn
2003). However, the derivatization procedures, generally essential to increase the volatility of
metabolites for GC/MS analysis, and the mass range limit of GCMS both restrict its use in
identification of novel metabolites and larger molecular weight metabolites.
For structural identification of novel metabolites and analyzing RFO sugars in phloem
exudates, HILIC-Ion trap mass spectrometry (HILIC-IT-MS) is used. In addition to detection
of common amino acids, uncommon amino acids, RFO sugars, and glycosides, HILIC-ITMS
surprisingly revealed two families of glycans in C. maxima phloem exudates (Tolstikov and
Fiehn, 2002). They eluted after RFO sugars in HILIC chromatographic separation. Their
monomers were identified both by mass spectrometry and NMR spectrometry (Fig 3.2) with
mass differences of ca. 28 Da: the monomer for the first family is 1,4-Dideoxy-1,4-imino-(2-
O-β-D-glucopyranosyl)-D-arabanitol with monoisotopic mass 295.127, the monomer for the
second family was the newly identified: 3-amino-4-O-β-D-glucopyranosyl-butan-1-ol with a
monoisotopic mass 267.132 Da. However, direct analysis of native glycans in phloem
exudates by HILIC-ion trap tandem mass spectrometry does not provide information on their
monosaccharide composition or interglycosidic linkages (Jackson 1997).
To identify the monosaccharide composition of the glycans, one glycan fraction (family
2, DP8 calculated monoisotopic mass Mi=1401.5016) was hydrolyzed into monosaccharides,
further converted to alditol acetate derivatives and then analyzed by GC/MS. Comparing the
retention time with external monosaccharide standards, glucose is identified as the only
monosaccharide (retention time: 16.47 minute) of this glycan (DP8, Mi=1401.5016). In order
to identify the interglycosidic linkage of the glucosyl residue, partially methylated aldital
acetate (PMAA) derivative of lyophilized powder of glycan (DP8, family2 MI=1401.5016)
from HILIC fractionation was analysed by GCMS. Comparing to both GC/MS spectra of
PMAA database entries and external standard using PMAA of laminarin (mainly composed of
beta 1,3-linked glucosyl residues), the main derivative obtained by methylation analysis of the
glycan (DP8, MI=1401.5016) was identified as 1,3,5-Tri-O-acetyl-1-deuterio-2,4,6-tri-O-
methyl-D-glucitol. This proved that the hexose subunits are 1-3 linked glucosyl units. The
-41-

Chapter 3: Metabolomic analysis of phloem exudates
A
B
A
B
A
B
A
B
Fig 3.1. Methylation analysis of LC separated glycan (DP8 Mi=1401.5). The top panel shows TIC chromatograph of its partial per-O-methylated alditol acetates in
GC/MS analysis. The middle panel shows the mass spectrum of major peak B that is identified by
electron-impact MS as 1,3,5-Tri-O-acetyl-1-deuterio-2,4,6-tri-O-methyl-D-glucitol; the minor peaks
were identified as the terminal residue of glycan: 1,5-Di-O-acetyl-deuterio-2,3,4,6-tetra-O-methyl-D-
glucitol. Interpretation of fragmentation is shown inside their spectra. Ratio of integrated peak B to A
is 6.3:1, near to the calculated ratio: 7:1. Other peaks are not matched to database entry, maybe due to
incomplete methylation or contamination during methylation reaction. Therefore, the internal glycosyl
linkage of glycan is 1, 3-linked.
terminal residue of glycan (DP8, MI=1401.5016) is also identified as 1,5-Di-O-acetyl-
deuterio-2,3,4,6-tetra-O-methyl-D-glucitol (Fig 3.1 A). This proved that the terminal hexose
unit of glycan uses the first carbon position to link the middle hexose unit.
The monomers of these two families of O-glycans are beta-linked, identified using mass
spectrometric and NMR studies by our group. Therefore the structure of both families of
-42-

Chapter 3: Metabolomic analysis of phloem exudates
glycans is proposed (Fig 3.2). They are glycosides with beta-1,3-linked glucose residue. This
structural feature is typical for callose which is a 1,3-linked glucan (Clarke and Stone, 1963).
Phloem metabolites with molecular mass 500-2000 Daltons were also routinely analysed
by MALDI-TOF by external calibration (oligo-mannose mixture). The monoisotopic masses
of glycans are obtained using internal standard (oligo-mannose mixture) with high-resolution
settings of the instrument to provide unique identifiers for each metabolite. The metabolite
profiles of phloem exudates are similar to those obtained by HILIC-ion trap method (Fig 3.3).
Fig 3.3. Metabolite profiles of C. maxima phloem exudates by MALDI-TOF in positive mode with external calibration. Since spectra are deisotoped, no isotopic peak is shown. Each glycan produces two dominant adduct ions (potassium and sodium adduct ions) with 16- Dalton’s difference. For example, 1424.4 and 1440.4 m/z correspond to sodium and potassium adduct ions of glycan (DP=8) in the first family respectively. Correspondingly, the highest adduct ions of RFO sugars are from stachyose ( 689.4 and 705.4 m/z respectively). Intensity of signals from glycans in the second family of C. maxima phloem exudates is usually higher than that of first family (for example, potassium adduct ion for glycan DP=8 is 1468.3 m/z).
3.2 Comparative metabolomic analysis
The presence of two families of glycans raised the question if they are transported into
phloem or produced inside phloem. To address this issue, polar-phase extracts from C.
maxima leaf discs and phloem sap were compared by HILIC-IT-MS to assess their
metabolomic differences. In leaf discs, the major sugars are RFO sugars and there are no
detectable O-glycans. Therefore, it is unlikely that these O-linked glycans are generated by
leaf mesophyll cells and then actively loaded into phloem. Instead they are more likely
produced inside phloem, either by hydrolyzing callose by callose hydrolase (callase, a beta-
-43-

Chapter 3: Metabolomic analysis of phloem exudates
1,3-glucanase (Eschrich, 1965)) or de novo synthesized inside phloem by callose synthase
(Verma and Hong, 2001).
Fig 3.2. Metabolomic profiles of phloem exudates and leaf discs by HILIC-IT-MS analysis. A. Glycans in C. maxima phloem exudates and their proposed chemical structure. (1) refers to the monomer of family 1 O-glycans and (2) that of family 2. B. Metabolomic profiles of leaf discs, showing there is no detectable O-linked glycans in phloem exudates. The major detectable metabolites in leaf discs are RFO sugars. The chromatograph of leaf disc has been manually shifted to align it with that of phloem exudates, therefore, the scale label in Y-axis is changed. This does not change the relative abundance of individual component in each chromatograph, which is expressed as percentage to the most abundant peak.
The major sugars in leaf discs are RFO sugars, sucrose and monosaccharides (glucose
and fructose). Many small molecules giving intense signals in LC/MS analysis – and
structurally characterized – are also virtually absent in leaf discs (Fig 3.2). If it is supposed
that there is a complete symplastic pathway from mesophyll cells to sieve elements, as
required by the polymer trapping model, then it is difficult to explain such a big metabolomic
difference. Instead, it can be deduced that there must be symplastic isolation between
mesophyll cells and sieve elements in minor veins as suggested by a previous study (Fiehn,
2003). The large metabolomic difference between leaf tissues and phloem exudates also
-44-

Chapter 3: Metabolomic analysis of phloem exudates
suggest that phloem metabolism is more than complex than the simple RFO sugar metabolism
described in the polymer trapping model.
The intense LC/MS signals do not necessarily indicate higher concentrations of those
glycans, because ionization efficiency of individual metabolites in electrospray ion source
varies substantially. At this stage, these glycans cannot be absolutely quantified. In order to
roughly estimate the sugar content in phloem exudates, phenol-sulfuric assay was used,
calibrated against glucose. The estimated total sugar content in three assays of phloem
exudates was about 6.28 mM of glucose equivalent. For rough estimation, this value is
divided by 4, the degree of polymerization of stachyose (DP4), the average concentration of
individual glycans will be below 1 to 2 mM. Therefore, RFO sugars together with glycans in
phloem exudates cannot account for the main osmotic pressure in phloem.
In order to know if low concentrations of RFO sugars and presence of glycans in exudates are
common across cucurbitaceous species, polar phase phloem exudates from C. maxima, C.
pepo, Cucumis sativus and Citrullus lanatus were analysed by HILIC-IT-MS (Fig 3.4). Small
amounts of RFO sugars, mainly stachyose, were present in phloem exudates from all four
species. Only phloem exudates of C. maxima and C. pepo share the same two families of O-
linked glycans shown above. Phloem exudates from C. sativus and C. lanatus contains many
new metabolites, including novel glycans.
Based on neutral losses of 132 Da and 162 Da typical for hexose and pentose,
respectively, in their MS^2 spectra, a new family of glycosides (glycans) was detected in
phloem exudates of Cucumis sativus, The monomers of this family of glycans are identical to
that of the first family found in C. maxima. The molecular mass of the most abundant one in
cucumber is 985.5 Da measured by LCQ Deka, with four pentose units and two hexose units.
No larger glycans were detectable in phloem exudates of watermelon Citrullus lanatus,
although one glycoside (containing one glucose and one pentose, M-H=426.4) is found to be
same as in the family of cucumber glycans. However, detailed structural characterization of
those novel metabolites from phloem exudates of species other than C.maxima is beyond the
scope of this thesis.
-45-

Chapter 3: Metabolomic analysis of phloem exudates
Fig 3.4 Comparative metabolomic analysis of phloem exudates from four Cucurbitaceous species. A: LC/MS Base-peak chromatographs of phloem exudates. Arrow indicates the new glycan (M-H=984.5) in cucumber phloem exudates and its MS^2 spectrum is shown in Fig B. B: MS^2 spectrum of the highest abundant new glycan in C.sativus phloem exduates shows it contains pentose and hexose residue. Its reducing end is the same as that of the first family glycan in C. maxima, as indicated by 294.1 m/z in its MS^2 spectrum.
3.3 Metabolomic analysis phloem transport using stable isotopic tracer
The large differences in metabolite profiles between leaf tissues and phloem exudates
suggest that instead of symplastic loading, apoplastic loading is operating in cucurbits. If a
mass flow mechanism is applicable to phloem transport in cucurbits, osmotic potential in
phloem exudates should be from the sum of all small metabolites, instead of mainly RFO
sugars. Phloem-specific metabolites such as O-linked glycans indicate phloem metabolism
also plays an important role in concentrating metabolites in SE/CCs. Now, we need the
pattern of carbon incorporation into different phloem transported metabolites for further
judgement of phloem transport in cucurbits.
Stable isotopic labelling experiments were performed. 700 ppm pure 13CO2 gas was
supplied to C. maxima plants tightly sealed in a growth chamber. Successive phloem exudates
samples from same petiole position were collected by the needle method (total 96 hours from
start of experiments) and leaf discs (total 18 hours from start of experiments) from the largest
leaf were continuously sampled at 4.4 (average) hour intervals. The incorporation of 13C
carbon into individual metabolites was indicated by the increase of ratio of their isotopic
masses in their quasi-molecular ions (McLafferty, 1993; Wittmann and Heinzle, 1999): M-57
-46-

Chapter 3: Metabolomic analysis of phloem exudates
for small metabolites measured by quadrupole GC/MS (Fiehn, 2000) and the most abundant
quasi-molecular ions for metabolites measured by LC/MS (Tolstikov and Fiehn, 2002).
As expected and in agreement with radio-tracer studies (Turgeon and Beebe, 1991), RFO
sugars both in phloem and leaf tissues were rapidly labelled by 13CO2 as they are direct
products of photosynthesis. Signals for sucrose and raffinose were always low in the samples
measured by LC/MS; therefore only stachyose is shown here (Fig3.5). UDP-glucose in
phloem exudates was also rapidly labelled. The rapid labelling of six carbons
Fig 3.5. Pattern of carbon incorporation into stachyose in 13CO2 labeling experiments for 18 hours. Stachyose is composed by 24 carbons from its 4 hexose units. The increase of intensity of isotopic ions clearly can be grouped into 4 groups of 6 adjoined carbons. Here is represented by different colors. Non-isotopic ion M0 and the first 6 isotopic ion (M1 to M6) is represented by the same red bar, other three groups of 6 isotopic ions are represented by pink, green and blue bars, respectively. This presumably reflects the biosynthesis pathway of stachyose whichis regularly adds successiveing labelled 6-carbon hexose units. Stachyose in phloem exudates is clearly rapidly labelled although it is slower than that of leaf discs. The variation of thickness of lines is only due to the chart display problem of Microsoft Excel software and means nothing else.
-47-

Chapter 3: Metabolomic analysis of phloem exudates
Fig 3.6. 13C-carbon enrichment of UDP-glucose (composed of 15 Carbon atom) in 13CO2 labeling experiments. Clearly the first six isotopic peaks are more rapidly labelled than the rest of the isotopic peaks, indicating active phloem metabolism. The Non-isotopic peak and first 6 isotopic peaks are represented by red bars.
within its 15 isotopic peak cluster indicates rapid turnover of the glucose residue in UDP-
glucose and therefore, phloem metabolism is probably very active (Fig 3.6). This is in
accordance with the published results that at least part of central metabolic pathways are
operative in phloem (Lehmann, 1981; Geigenberger et al., 1993).
The speed of incorporation of newly fixed carbon into small metabolites in phloem
exudates was estimated from the isotopic cluster at M-57 in TBS-derivatives measured by
GC/MS. Results show that there is massive distribution of photosynthetically fixed 13C
carbon into different small metabolites in phloem exudates, although the speed of
incorporation varies among different metabolites. Some are labelled relatively slowly and
some relatively rapidly, compared with those of leaf discs (here only two cases, glutamate and
aspartate are shown, Fig3.7). For both cases, there is no obvious diurnal pattern of carbon
incorporation detected in phloem exudates. This indicates from mesophyll cells to sieve
elements there may be a special buffering mechanism to maintain the constant supply of
nutrients to sinks.
-48-

Chapter 3: Metabolomic analysis of phloem exudates
Fig 3.7. Time course of labeling metabolites in phloem exudates (sampled from petiole) and leaf discs. Compared to the labeling pattern of metabolites in leaf dics, some metabolites such as glutamate are comparatively rapidly labelled, some metabolites such as aspartate are slowly labelled. Here only the ratio of totally labelled metabolite to its total isotopomer pool is used to represent the speed of carbon incorporation. Furthermore no obvious diurnal pattern is found in the speed of carbon incorporation into metabolites in phloem exudates. This indicates the flux of carbon into metabolites other than RFO sugars are strictly controlled and buffered through complex metabolic network.
Metabolites in phloem exudates exhibiting faster patterns of 13-Carbon incorporation
include malate, serine, alanine, glycine, GABA, citrate, 2-oxo-glutamate, succinate acid,
leucine, valine than other small metabolites detected by GC/MS. Those exhibiting slower 13-
Carbon incorpration pattern include 2-methy-serine, aspartate, 2-hydroxy-aspartate, 2-oxo-
proline, glycerol, isoleucine and homoserine.
The labelling of all members of the two families of O-glycans in phloem exudates is
extremely slow compared to other metabolites, especially RFO sugars (only the most
abundant glycans, the O-glycan (DP=8) in the second family is shown, Fig 3.8). Labelling of
O-linked glycans of the first family is even lower than the second family (data not shown
here). This indicates that these glycans are not linked directly to photosynthate loading and
even may not be used for long-distance transport; instead they may be a result of phloem
wounding.
-49-

Chapter 3: Metabolomic analysis of phloem exudates
Fig3.8. Time course of labelling O-glycan DP8 in the second family of glycan (C52H91NO42, composed by 52 carbon atoms). From non-isotopic abundance of M0 ((M+H)+
=1402m/z in LC/MS measurement) here is 1402 measured by its adducts in LC/MS. in phloem exduates of C.maxima.
3.4 O-linked glycans in phloem exudates are transported uni-directionally in heterografts
The relatively slower incorporation of carbon fixed by photosynthesis into O-linked
glycans raises the question of whether they are a bona fide component of the phloem transport
stream or an artefact generated as part of the phloem wounding response, such as by rapid
callose synthesis or hydrolysis. This is especially plausible considering the low sugar profiles
of cucurbit phloem exudates. The distinctly different species of O-linked glycans in phloem
exudates of cucumber and pumpkin provided an opportunity to address this issue using
heterografting experiments. Two-week-old stocks (either pumpkin or cucumber) were
decapitated and shoots of scion (either pumpkin or cucumber) inserted to form heterografts.
Two weeks after grafting, phloem exudates from successful heterografts of both scions and
stocks were collected and analysed by HILIC-IT-MS. To prevent cross-contamination by
phloem exudate surging during sampling, stems on both the scion and stock were immediately
cut off with a sharp blade 1-2 cm away from either side of the graft union.
Phloem exudates were collected from four successful hereterografts using pumpkin as
stock and cucumber as scion and one using cucumber as scion and pumpkin as stock .
Metabolomic profiling of phloem exudates demonstrated that O-linked glycans from scions
-50-

Chapter 3: Metabolomic analysis of phloem exudates
can only be detected in phloem exudates of stem towards roots of stocks, but not detectable in
phloem exudates from stems of lateral shoots formed on the stock (Fig 3.9). O-linked glycans
Fig 3.9 Species-specific O-glycan is uni-directionally transported in heterograft from pumpkin (scion) to stock (cucumber). There is no transport of glycans between shoots of stock and scions, nor transport from roots of stock to scion. Only scion to stock transport of glycans are detected as a mixture of two families of glycans shown in the lower chromatograph.To simply the diagram, only graft union after cutting for phloem sampling is shown here. Both glycan structures and their LC/MS chromatographs are shown.
from stocks cannot be detected in phloem exudates from scion. This first excludes the
possibility of cross-contamination due to phloem sap surging during phloem exudates
collection, since surging will cause bidirectional movement of O-linked glycans between
scion and stocks. It is also unlikely that O-linked glycans detected in stock are the remnant of
phloem exudates contaminating scion or stocks during experimental operation of grafting
experiments. Such cross-contamination would be reciprocal to both scion and stock and
should result in the detection of O-linked glycans in phloem exudates from both stocks and
scions. Therefore, the detection of O-linked glycans specific for scion phloem exudates in
stem phloem exudates of stock can only be interpreted as the results of uni-directional
-51-

Chapter 3: Metabolomic analysis of phloem exudates
transport in planta. It can be concluded that the O-linked glycans present in phloem exudates
are not the result of phloem wounding response.
The amounts of O-glycans in phloem exudates from stem of stocks where O-linked
glycans from scion are detected are greatly reduced as shown in LC/MS chromatograph. The
amount of glycans from other sites of heterografts was not significantly reduced. This may be
because the number of newly formed phloem strands connecting scion and stocks are limited.
In summary, all current available results support the hypothesis that operational
apoplastic pathways exist in cucurbits for active loading of small metabolites, instead of solely
a complete symplastic pathway as suggested by the polymer trapping model. Further phloem
specialized metabolism other than RFO sugar metabolism is clearly active and may play an
important role in phloem loading and transport in cucurbits as shown in stable isotopic
labelling experiments. The question then is: how can these two possible transport pathways
from mesophyll cells to sieve elements co-exist?
-52-

Chapter 4—Re-investigation of Phloem Exudation
Chapter 4 Re-investigation of Cucurbits Phloem Exudation by Microscopy
4.1 Re-examine main questions of research project:
So far, detailed examination of metabolomic data and physiological experiments, and
comparison with published results on phloem loading and transport using cucurbits as model
species, together present a clear dilemma. On one hand, the experimental approach followed
the popularly accepted OGPF mechanism to explain the driving force for phloem transport in
cucurbits. Consequently, from the metabolomic analysis, it is necessary to accept the
hypothesis that the sum concentration of the metabolites in phloem exudates should account
for the driving force for osmotically generated pressure flow in sieve tubes of cucurbits. The
low concentration of sugar in phloem exudates indicates that, in this species, other metabolites
including amino acids, glycans and other structurally unidentified metabolites are the major
contributing factors to possible high osmotic pressure inside sieve elements. Furthermore, the
published results of metabolomic analysis for cucurbit phloem transport (Fiehn, 2003) also
challenge the traditional polymer trapping model, which assumes a completely symplastic
route from mesophyll cells to sieve elements.
The reasons to challenge symplastic loading are simple and persuasive: 1) if the
symplastic loading mechanism is true, then how do symplastic loaders cope with nutrient
demands from sinks, since nutrients other than sugars are always transported as small
molecules, such as the amino acids and other metabolites already profiled by mass
spectrometry. 2) Do cucurbits need phloem loading of sugars, because there is only a trace
amount of sugars in phloem exudates, which have been proved essentially pure phloem sap?
On the other hand, the experimental data here conflict with published results on sieve
tube content in cucurbits. In order to avoid the ambiguous and perplexing results obtained
from phloem exudates, Haritaos E. et al (Haritatos et al., 1996) employed a rather complex
technique: combining microdissection of separate blind endings from lyophilized Cucumis
melo leaf, microscopy and HPLC separation and quantitation to estimate the sieve tube sugar
content. Surprisingly, they found that, assuming no subcellular compartmentalization, the
additive concentration of sugars in SE-ICCs of minor veins is about 600 mM, while stachyose
and raffinose concentrations are about 330 mM and 70 mM, respectively, concentrations of
these sugars are much lower in mesophyll (0.2 and 0.1 mM). Such estimation is consistent
with estimates of osmotic pressure in SE/CC complex from plasmolysis experiments in
SE/CC complex in C. pepo callus (mature sieve elements and companion cells, an osmotic
potential of -1.5--2.4 MPa by mannitol solution) (Lackney, 1991; Lackney and Sjolund,
1991).
-53 -

Chapter 4—Re-investigation of Phloem Exudation
Earlier histological studies also suggest the higher sugar concentration in cucurbits
phloem (Pristupa, 1983) These results both support the traditional view that sugars are the
major contributor to OGPF and the polymer trapping model for phloem loading in symplastic
loaders. In their report, they considered that cucurbit phloem content estimated from
microdissection is more reliable, and their explanation for low sugar content in phloem
exudates is that phloem exudates from cucurbits are contaminated during sampling by
surrounding cells, such as xylem exudates. However, since xylem sap is under negative
pressure, it seems highly unlikely that xylem sap could significantly contaminate phloem sap
during sampling (Fiehn, 2003).
Two essential assumptions in the analysis should be mentioned here: 1) phloem exudates
in cucurbits are essentially pure enough for representation of real phloem sap transported in
planta. 2) Differences in phloem sap content from different sieve tubes, especially from
cucurbits’ different phloem systems can be considered negligible. These two assumptions are
supported by three lines of evidence: 1) Similar metabolite profiles between samples from
direct sampling of CF5(6) labelled phloem content by glass capillary, and phloem exudates
obtained either with needle or stem (or petiole cuttings). 2) Phloem exudation in cucurbits has
been proved repeatedly by binocular observation(Crafts, 1936) and electron microscopic
observation (Eschrich et al., 1971): both extrafascicular and central phloem produce exudates
during sampling, and there is little contamination observed in these reports. 3) Cucurbits have
been extensively used in the past three decades as a model species for studying phloem
proteins. Also there is no evidence that severe contamination happened, since the major
components of cucurbit phloem exudates are phloem structural proteins - P-proteins (Read
and Northcote, 1983). However, the argument from Haritaos E. et al (Haritatos et al., 1996)
distinctly contrasts with the conclusion made here: phloem exudates could be indeed
contaminated.
There must be an explanation for such controversial and contradictory evidence.
Revealing the cause is now critical for further meaningful design of experiments using
metabolomic approaches to study phloem transport and for further identifying functions of
these phloem novel metabolites. At this stage, the key point is which of the above two
interpretations of phloem exudation — pure or contaminated – is correct, or is neither correct?
Alternatively, in an even more perplexing situation, are both correct? If the exudate is
contaminated, what source can explain hundred-fold contamination levels, a question posed
previously (Fiehn, 2003).
It is no doubt a big challenge to observe phloem exudation in vivo and in planta. The
complexity of cellular composition in vascular tissues and their spatial arrangement requires
specific techniques to identify phloem by non-traditional microscopy: that is, identifying
phloem without fixation, a sectioning procedure routinely performed in plant anatomy labs.
-54 -

Chapter 4—Re-investigation of Phloem Exudation
Cells and tissues are killed during fixation procedures so dynamic phloem exudation processes
cannot be observed using these traditional cytological methods. Below are described the
strategies employed to study phloem exudation processes in planta and in vivo from cucurbit
phloem systems by different microscopic techniques.
4.2 Identification of Cucurbit phloem structure by epifluorescence microscopy
There are two different types of symplastically isolated transport networks in cucurbits:
central phloem system and extrafascicular phloem system. In the literature, different
nomenclature exists for the phloem systems in vascular bundles of cucurbits: central phloem
(Kempers et al., 1993), fascicular phloem (Smith et al., 1987), bundle phloem (Eschrich et al.,
1971). To avoid confusion, the nomenclature summarized in ((Kempers et al., 1993) and
literature therein) is adopted here (Fig4.1).
Picture 4.1. Schematic diagram of a transverse section of a C.maxima stem showing its complex vascular system with bicollateral type of vascular bundles It is taken and modified from (Kempers et al., 1993) which is modified after Crafts AS 1932. Each vascular bundle consists of xylem, internal and external cambium with internal cambium developed incompletely (Fahn 1990), and fascicular phloem. Fascicular phloem consists of internal central phloem and external central phloem, both surrounded by isolated strands of extrafascicular phloem in the periphery. In addition, there are endocyclic and ectocyclic extrafascicular phloem strands surrounding the sclerenchyma ring in stem, and extrafascicular phloem strands scattered amongst cortex parenchyma cells. In the petiole, there is no sclerenchyma ring, and therefore no endocyclic extrafascicular sieve tubes. Extrafascicular commiussural sieve tubes form lateral connections between the longitudinal strands. Abbreviations: ExtPh: external central phloem; IntCPh, internal central phloem; X, xylem, CS, commissural sieve tube; Sc, sclerenchyma ring; Ect.S, ectocyclic tube; Ent.S, entocyclic sieve tube
-55 -

Chapter 4—Re-investigation of Phloem Exudation
Although the term “central phloem” or “central sieve elements” or “central sieve tubes”
was only tentatively proposed previously (Smith et al., 1987), here this term is fully adopted
to refer the larger secondary phloem with some degenerated primary phloem in mature
cucurbits surrounded by peripheral extrafascicular phloem strands. Therefore, internal central
phloem (pith side) and external central phloem (cortex side) are used here to refer their
position within the bicollateral vascular bundles. Extrafascicular phloem refers to all sieve
tubes other than central phloem and is described according to their location and distribution.
One universal feature of phloem tissues in higher plants is the presence of sieve elements,
jointed together by sieve plates where callose is present (Schulz, 1998). Callose is also present
in PPUs (pore-plasmodesma unit) of longitudinal sieve element walls, which provides the
second criterion used here. For unambiguously identifying complex cucurbit phloem tissues,
alkaline decolorised aniline blue (pH8.0-9.0) is used for staining callose in fresh hand
sections, which enables visualization of sieve plates and the presence of PPUs on sieve tube
lateral walls. Under epifluorescence microscope, with UV excitation, phloem tissues of
cucurbits are easily identified. Callose in sieve plates and PPUs shows yellowish to white
fluorescence. However, longer irradiation by UV light during photography causes fading, but
this does not affect identification of sieve elements (Figure 4.2.).
To distinguish extrafascicular phloem strands and central phloem, criteria are used
according to Crafts AS (Crafts, 1932) and (Cronshaw and Esau, 1968): 1) sieve elements are
identified as the cells with presence of sieve plates and PPUs by callose staining. 2) Positional
distribution: central phloem is localized on both sides of xylem within vascular bundle, while
extrafascicular sieve elements are in three positions: in periphery of central phloem, in cortex,
and around sclerenchyma ring of stem and nearby epidermis of petioles. 3) Transverse
diameter of sieve elements: central sieve elements are comparatively larger than extrafasicular
sieve elements in all positions (either in cortex, within vascular bundles or in entocyclic or
ectocyclic position). 4) Longitudinal dimensions of sieve elements: central sieve elements are
shorter than extrafascicular sieve elements surrounding them.
When decolourised aniline blue stained fresh tissue slides from stem or petioles are
examined under epifluorescence microscopy, the most distinguishing characteristics is that
central sieve elements are not heavily callosed, sieve pores are essentially open in most cases,
and there is also less callose deposit in PPU positions of central sieve elements. In most cases,
this is in contrast to extrafascicular sieve elements where there is heavy callose deposit on
sieve plates, and usually this collapse during hand sectioning. Inside these sieve elements, the
lateral sieve element walls are also heavily callosed in some cases. (Fig. 4.2.).
-56 -

Chapter 4—Re-investigation of Phloem Exudation
Fig 4.2. Phloem systems in C. maxima stem cross section visualized by epifluorescence microscopy after decolorized aniline blue staining. Upper left: part of the total stem section under 0.8X dissection microscope; right: assembled image of one vascular bundle from two frames taken under 40X microscope. Lower left: extrafascicular phloem strands surrounding both sides of schlerenchyma ring under epidermis under 40X microscope. Abbreviations: intCA internal cambium, ExtCA external cambium. ExtFSE extrafascicular sieve tubes Refer to Fig4.1 for other abbreviations. Note that this is the tissue shown here is fresh tissue manually sectioned and stained by decolorized aniline blue without fixation. Yellow arrows cross panels indicates the rough position observed with higher manfication objectives.
The callose deposition observed here is obviously differ from previous reports (Crafts,
1932; Cronshaw and Esau, 1968). For their observations, they used a rapid fixation procedure
as traditional cytological protocol adopted. I used manually sectioned fresh tissues and stained
them directly with decolorized anline blue solution without fixation. Possibly callose
synthesis in the extrafascicular and central phloem systems behaves differently.
4.3 Identification of phloem system in planta
The above mentioned method is not suitable for in planta and in vivo observation of
phloem tissues, since the alkaline aniline blue staining requires a finite staining time before
observation by epifluorescence microscopy. During experiments, it was found that the
presence of chloroplast-containing cells around central phloem provides an opportunity to
distinguish central sieve element positions.
-57 -

Chapter 4—Re-investigation of Phloem Exudation
When 1-2 cm thick fresh sections or stems (petiole) still attached to plants were observed
under binoculars with reflected light, central phloem tissues (both internal and external) could
be judged by their darker green colour. In order to confirm the presence of chloroplasts in
these central phloem tissues, lyophilized stem sections were observed under normal reflective
light illumination. However, the deeper green color present in central phloem in fresh tissues
observed by binoculars with reflective illumination is not because of greater numbers of
chloroplasts in central phloem tissues. Instead, in these dry sections, only peripheral cells
surrounding central sieve elements contain more chloroplasts. The darker green color in the
central phloem region observed in fresh tissue can instead be interpreted as the result of
reflection of green color from its surrounding cells (Fig 4.3). Therefore, during
Fig 4.3. Identifying phloem system in C. maxima stem without staining under binoculars. Uper left: fresh stem are sectioned and immeciately observed under binoculars illuminated by reflective normal light. Glinting exudates spreading on the cut stem surface and central phloem region is characterized by its darker green color. However, the darker blue in central phloem region is proved to be reflected colour mainly from extrafascicular phloem region, as shown in dried stem sections (uper right picture and lower picture). Uper right: longitudual sections of lyophized C. maxima stem crossing its external central phloem and there are more chloroplasts in extrafascicular phloem region. Lower picture shows the cross-section of one lyophilized stem.. Abbreviations are the same as former pictures.
-58 -

Chapter 4—Re-investigation of Phloem Exudation
illumination, the angle of light source for binocular was adjusted to make the green central
phloem dark enough for better discrimination of tissue types.
Despite the usefulness of the above-mentioned criterion, for accurate determination of
exudation sites, and for confirming whether continuous exudation occurs in central phloem
during sampling, it was necessary to employ other methods described in the following
sections.
4.4 Direct observation of phloem exudation by stereo binoculars:
When a mature C. maxima plant is placed under binoculars for observation, immediately
after first cutting from stem or petiole, the initial exudation process is too fast and in most
cases it was not possible to distinguish where exactly these exudates are from. Phloem
exudates immediately surge out and spread across the cut stem surface of stem, petiole or
main veins. There are almost no droplets visible in most cases (Fig 4.4, plate A). However,
immediately after cutting, using tissue paper to absorb these exudates , the exudates are briefly
visible as droplets surging rapidly out of a range of scattered positions: (a) some cells
surrounding central phloem tissues, (b) from cortex and (c) from positions surrounding
sclerenchyma ring in stem. The exudation pattern resembles the extrafascicular phloem
distributions (Fig 4.4, plate B).
With continuous removal of droplets surging out of the cutting surface, the speed of
exudation slows down which allows taking photos (about 20-30 seconds after observation)
using a digital camera which at its fastest speed takes about 2 seconds for making one full
color picture. This process is shown in Fig 4.4. For better understanding such a rapid process,
a movie assembled from time series photos is provided here in CD-ROM
(Cmaxima_exudation_movie.avi, in CD-ROM). Some exudation sites stop exudation after
continuous removal of droplets during observation. This may indicate that sieve element
contents are emptied or sieve tubes are blocked after a period of exudation. No exudates at all
are observed coming from xylem tissues, and this is even evident without removal of exudates
immediately after cutting. Therefore there is no evidence to support the notion that xylem and
larger parenchyma cells in cortex may contaminate phloem exudates (Haritatos et al., 1996).
With continuous removal of droplets surging out of the cutting surface, the speed of
exudation slows down which allows taking photos (about 20-30 seconds after observation)
using a digital camera which at its fastest speed takes about 2 seconds for making one full
color picture. This process is shown in Fig 4.4. For better understanding such a rapid process,
a movie assembled from time series photos is provided here in CD-ROM
(Cmaxima_exudation_movie.avi, in CD-ROM). Some exudation sites stop exudation after
continuous removal of droplets during observation. This may indicate that sieve element
-59 -
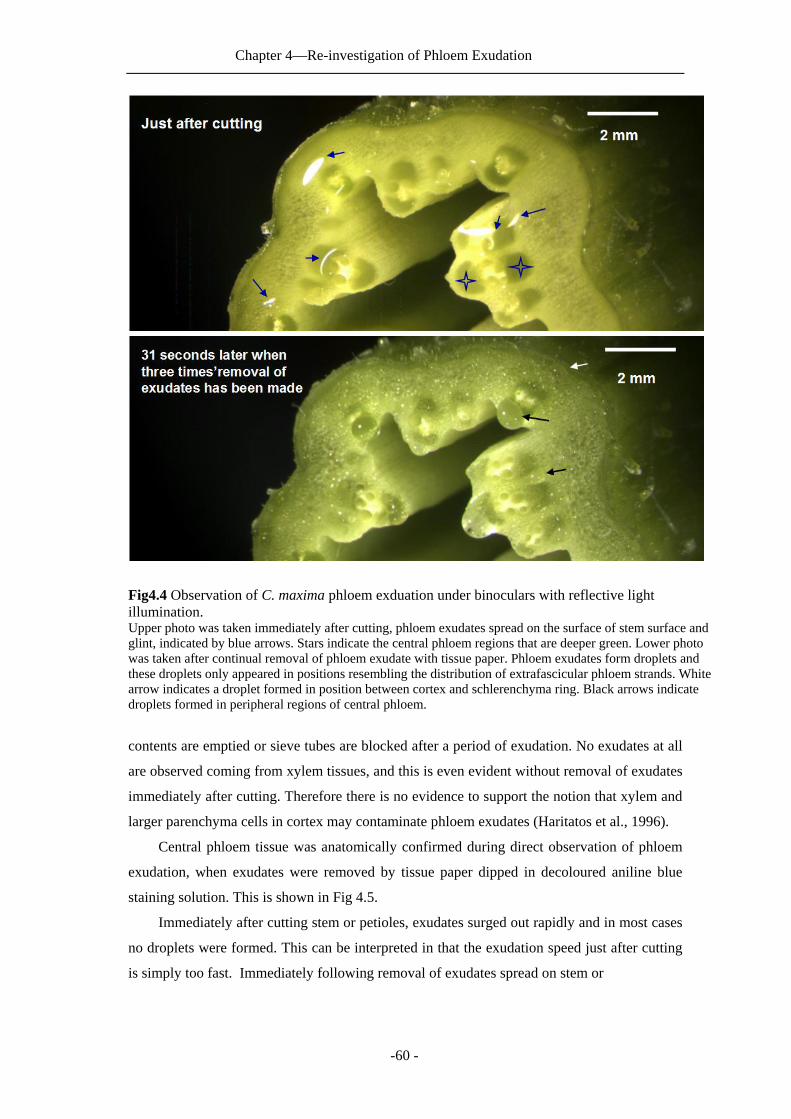
Chapter 4—Re-investigation of Phloem Exudation
Fig4.4 Observation of C. maxima phloem exduation under binoculars with reflective light illumination. Upper photo was taken immediately after cutting, phloem exudates spread on the surface of stem surface and glint, indicated by blue arrows. Stars indicate the central phloem regions that are deeper green. Lower photo was taken after continual removal of phloem exudate with tissue paper. Phloem exudates form droplets and these droplets only appeared in positions resembling the distribution of extrafascicular phloem strands. White arrow indicates a droplet formed in position between cortex and schlerenchyma ring. Black arrows indicate droplets formed in peripheral regions of central phloem.
contents are emptied or sieve tubes are blocked after a period of exudation. No exudates at all
are observed coming from xylem tissues, and this is even evident without removal of exudates
immediately after cutting. Therefore there is no evidence to support the notion that xylem and
larger parenchyma cells in cortex may contaminate phloem exudates (Haritatos et al., 1996).
Central phloem tissue was anatomically confirmed during direct observation of phloem
exudation, when exudates were removed by tissue paper dipped in decoloured aniline blue
staining solution. This is shown in Fig 4.5.
Immediately after cutting stem or petioles, exudates surged out rapidly and in most cases
no droplets were formed. This can be interpreted in that the exudation speed just after cutting
is simply too fast. Immediately following removal of exudates spread on stem or
-60 -

Chapter 4—Re-investigation of Phloem Exudation
Fig 4.5 Phloem exudates surges out of extrafascicular phloem region, and not from central phloem. During direct observation of phloem exudation, exudates are removed by tissue paper previously dipped in 0.1% decoloured aniline blue solution. Following observation is under epifluorescence epifluorescein microscopy with UV filter set. Droplets can be seen from extrafascicular region. Central phloem is characterized here as cells with the largest diameter in central phloem region. White stars indicate two of central sieve elements, white arrow phloem exudates.
petiole surface by tissue papers, further droplets of exudates from peripheral central phloem
region could be observed forming rapidly, within 1 to 2 seconds. After removal of exudates
once or twice with tissue paper, droplets of exudates rapidly fell on the central phloem surface
and spread out with a continuous and rapid increase of volume. By casual observation and
without further removal of exudates, the continuous expansion of exudates across the central
phloem surface produces a gloss, from which it could be concluded that exudates are from
central phloem region. For convenience of observation, once droplets were observed falling
on the central phloem region, they were removed by tissue paper to allow further observation
and photography. The exudation speed gradually slowed down and the volume of exudates
reduced after several successive removals of exudates.
After 2-3 minutes, exudation from most sites essentially stopped. When a further fresh
cut (with 1 to 2 cm stem or petiole fragments are removed by razor blades) was made,
exudation started again and repeated observations were possible this way. 10 mM EDTA
solution applied to cut surface somewhat enhanced the exudation from extrafascicular region,
-61 -
Chapter 4—Re-investigation of Phloem Exudation
but still no central phloem exudation was observed. It was also found that in most cases,
exudation from sites near internal central phloem and both sides of external central phloem
was more rapid and lasted longer. This may be because there are more extrafascicular phloem
strands at these sites.
Petioles, stems and leaf main veins of the four cucurbitaceous species used formerly
(pumpkin, melon, zucchini, and cucumber) were observed this way, likewise large cucumber
fruits. The basic exudation pattern was the same judging by eye: phloem exudates were not
from central phloem region after the removal of exudates immediately after cutting. Photos
are not shown here.
The central questions now are: 1) Are these phloem exudates actually from
extrafascicular phloem system, or from other types of cells, such as parenchyma cells? 2) does
central phloem release exudates immediately after cutting, as claimed repeatedly by (Crafts,
1936) and (Eschrich et al., 1971). In the past, in order to avoid possible contamination when
sampling cucurbit phloem exudates for analysis, the exudates that surged out within the first
few seconds after cutting were generally removed. Exudates were subsequently collected and
used for analysis (Xoconostle-Cazares et al., 1999; Shalitin and Wolf, 2000; Walz et al.,
2002). From this section of work, it seems unlikely that past studies on cucurbit phloem
exudates were genuinely related to the central phloem. Instead, exudation from central phloem
seems to be stopped immediately after physical disruption. However, since Crafts AS and
Eschrich W have repeatedly claimed central phloem exudation, and in order to obtain a
definitive conclusion, it was necessary to confirm whether any central phloem exudation
occurred immediately after cutting the petiole or stem .
4.5 Methodology and rationale for confirmation of phloem exudation
Unlike their developmental precursors, plasmodesmata, that exert size exclusion limits
for selectively transporting molecules according to molecular size, sieve pores allow free
passage of any molecules dissolved in phloem sap during mass flow. Thus sieve tubes can be
regarded as a super-symplastic pathway for molecular transport among organs. Once it enters
the transport stream, some fluorescent phloem tracers such as 5(6) carboxyfluorescein CF5(6)
(Grignon et al., 1989) are retained within sieve tube and companion cell complexes
throughout the transport phloem system before entering sink cells. The extrafascicular phloem
system can be regarded as non-super symplastic in relation to the central phloem since they
are isolated from each other by one to several layers of parenchyma cells. However,
anatomical studies show that extrafascicular sieve tubes in different tissues are connected by
commissural sieve tubes thus forming a separate complex “super-symplastic pathway” for
molecular transport (Kempers et al., 1993).
-62 -

Chapter 4—Re-investigation of Phloem Exudation
If CF 5(6) is applied to petiole and stem, it will enter parenchyma cells of cortex and
eventually be taken up by extrafascicular sieve tubes CF5(6) will be distributed further
throughout the extrafascicular phloem system, if all extrafascicular sieve tubes are connected
forming a super-symplastic path (Fig 4.6).. In this way, it is possible not only to examine
Fig4.6. Schematic illumination representation of methodology employed here to differentiate and confirm the origin of exudates in cucurbits. Applying phloem tracers to leaf and petiole (or stem) surface individually to different plants makes it possiblewill enable us to distinguish the origin of exudates, according to the “super-symplastic” restrictions between different phloem systems. CPh central phloem.
whether the identity of phloem exudates, but also to examine whether all of these
extrafascicular sieve tubes are completely interconnected, something which until now has
been unknown. Further, if CF5(6) in extrafascicular phloem cannot be freely absorbed into
central sieve tubes, we can also estimate whether central sieve tube contents contaminate
extrafascicular phloem exudates. The experiments using CF labelling follow the subsequent
considerations: when CF5(6) is applied to a leaf surface, it will enter the central phloem
system, and perhaps the extrafascicular phloem system. If it were only to enter the central
phloem, it should be possible to easily identify if central phloem exudation happens
immediately after cutting. If both central phloem and extrafascicular phloem are labelled with
CF5(6), the application of CF5(6) is still useful in that it will allow visualization of central
phloem sieve elements for identification during observation
4.6 Phloem exudation after CF5(6) applied to petiole and stem surface:
The attempt to make movies under epifluorescein microscopy was not successful,
because of limitations of sensitivity, and speed of the spot camera used here did not allow
photography in higher resolution mode when no binning is used. Under “no binning” mode,
normally more than 10 seconds and up to several minutes were required to take one frame.
Although higher binning shortened the time required for photographing, resolution was so low
-63 -

Chapter 4—Re-investigation of Phloem Exudation
that photos were useless for structural identification of tissues (movie data not shown here).
Therefore, still images are shown here to illustrate the results obtained in these experiments.
Two further points need to be stated here: 1) during these experiments, plants without CF
5(6) phloem tracers applied were used as negative control (Fig 4.7). 2) All experiments
described below were performed using C. maxima (pumpkin) and C. sativus (cucumber),
mainly the former.
Fig 4.7. Phloem exudation observed in petiole (C.maxima) under epifluorescence microscopy using GFP filter set after CF5(6) has been applied to petiole surface for overnight. Droplets of phloem exudates are labelled by CF5(6) and shows green fluorescence (without removal of any exudates before and during photographing. Other tissues, such as central phloem, xylem and parenchyma cells in petioles are not labelled by CF5(6). Small picture inside is taken from petiole of control plant without CF5(6) application with same microscopic settings.
CF5(6) was applied overnight to petiole or stem after its surface was abraded by
sandpaper, then plants were placed under binoculars equipped for observation. Two reasons
necessitated making two different sets of photographs. The first was the bleaching effect of
CF5(6) labelled phloem exudates under continuous UV light excitation. The second was that
after repeated removal of exudates, less and less (eventually disappeared) CF 5(6)
fluorescence appeared in phloem exudates. This indicated unlabelled phloem content that
comes from above or below the petiole where CF 5(6) is applied must have travelled a long
distance to arrive at the petiole cut surface.
-64 -

Chapter 4—Re-investigation of Phloem Exudation
In one set of experiments for photographing, there was no removal of any exudates after
cutting; a photograph was taken under GFP filter set immediately after cutting to visualize CF
5(6) labelled exudates (Fig4.7). Despite the spread of phloem exudates during photography, it
was still evident that there is no green fluorescence in the central phloem region or in
parenchyma cells within the cortex. In another set of experiments, the first droplets were
removed by tissue paper (soaked in decoloured aniline blue), and immediately afterwards, a
photograph was taken using the GFP filter set to visualize carboxylflureoscein in phloem
exudates. Subsequently, another photograph was taken using UV filter set to visualize callose
and phloem (Fig4.8). The two photos are overlaid together to confirm the site of phloem
exudation. However, by this approach alone, it is not possible to confirm the site of because
the exudation process is fast and extrafascicular phloem is small. Nevertheless, it provides
further confirmation that phloem exudates were not from central phloem but were labelled
with carboxyfluorescein. This suggests that there are extensive interconnections among
different extrafascicular phloem strands and that central phloem is symplastically isolated
from extrafascicular phloem.
Examination of free-hand sections showed that CF5(6) green fluorescence was restricted
to within extrafascicular phloem (extrafascicular SE/CC complex), the same pattern as that of
normal SE/CC complex (Grignon et al., 1989). The identity of phloem tissues was confirmed
by subsequent aniline blue staining. Fluorescence of CF5(6) was stronger in companion cells
than in sieve elements, indicating that sieve element contents are emptied or bleaching rapidly
during photography under UVexcitation (Fig4.8).
Observations using stems (Cmaxima and C.sativus) with CF5(6) applied to its surface
were consistent with that of petioles. Photos are shown in Fig (4.9).
Therefore, these observations using plants with CF5(6) applied to petiole to label
extrafascicular phloem confirmed that phloem exudates in cucurbits indeed originate from
extrafascicular phloem, and that these extrafascicular phloem strands are extensively
interconnected.
4.7 Phloem exudation after CF5(6) applied to adaxial leaf surface
The observation of phloem exudation after CF5(6) to leaf surface application provides
further evidence that there is no continuous exudation from central phloem, while continuous
exudation after incision and following removal of exudates was found to be characteristic of
extrafascicular phloem.
The transport of CF5(6) in central phloem when applied to abraded adaxial leaf surface
was faster compared with that of CF5(6) applied to abraded petiole surface. 2-3 hours later,
-65 -

Chapter 4—Re-investigation of Phloem Exudation
Fig 4.8: Plate A and B shows sequentially photographed C.maxima petiole exudation images under binoculars with different filter sets. After CF5(6) applied to petiole, plants are taken into lab and mounted under binoculars for observation. Since immediately after cutting petioles, rapid exudation does not allow us to make photography without exudates spreading across the on petiole surface, exudates are removed for once to several times with tissue paper dipped with 0.1% decolored aniline blue solution until it is slower enough for microscopic photographying. Therefore, the central sieve phloem region shows slightly yellowish green fluorescene from contamination during droplet removal. After photographed with GFP filter set (shown in Plate A) for visualization of existence of CF5(6) in exudates, same petiole region is photographed with UV filter to visualize callose which is stained by decolored aniline blue during droplet removal. For clarityearance, Plate C is a shown here, as a aligned and merged image using 50% transparency of same region of A anShowing that phloem exudates are not from central phloem. Because of alkaline aniline blue is acidified by parenchyma cells in cortex, these cells are stained dark blue. Scl, sclerenchyma
d B.
intense CF5(6) fluorescence was observed in central phloem of petioles and stem. The
fluorescence signal of CF5(6) was also present in phloem exudates, but was comparatively
weaker. However, after overnight application, the CF5(6) fluorescence signal in both phloem
exudates from extrafascicular phloem of petiole and in central phloem tissues of petioles were
almost identical(Fig4.10, Fig4.11, Fig4.12).
The faster movement of CF5(6) in central phloem is an advantage for discriminating
phloem exudation. Stem sites far way from leaves treated with CF5(6) were cut and observed
under binoculars using GFP filter set . Only central phloem clearly showed CF5(6)
fluorescence, but not phloem exudates. Depending on the site of cutting, a small amount of
yellowish green fluorescence released from broken central sieve tubes can diffuse into phloem
exudates. However, no continuous release of CF5(6) fluorescence from central
-66 -

Chapter 4—Re-investigation of Phloem Exudation
Fig4.9. CF5(6) is confined within SE/CCC of extrafascicular phloem in peripheral of central phloem after applied to petiole surface. Freehand section is first photographed using GFP filter set to visualize CF5(6) fluorescent signal, then section is immediately stained with decoloured aniline blue and photographed with UV filter set for callose fluorescent signal.Two photographs are overlaid together: intense red signal represent callose signal and pink for CF5(6) signal. Note that sieve elements are devoid of CF5(6) because of exudation, only its companion cells are labelled with CF5(6). SP: sieve plates of extrfascicular sieve element; ExtFCC: extrafascicular phloem companion cells.
phloem was found. This is the strongest proof that central phloem does not form continuous
exudation, in contrast to extrafascicular phloem strands (Fig4.10, Fig4.11, Fig4.12).
4.8 In summary:
The main results above on observation of cucurbit phloem exudation processes and
confirmation of exudation sites are summarized below:
1. Immediately after cutting stems and petioles, exudates spread on petiole or stem
surface. After removal of exudates once or twice, direct observation under binoculars shows
that discrete exudate droplets are formed. These droplets are from regions outside central
phloem, scattered sites of cortex and nearby sclerenchyma ring of stem or epidermis region of
petiole. These exudation sites closely resemble the distribution of extrafascicular phloem
strands shown in cucurbit standard anatomy. Continuous exudation from extrafascicular
phloem can last up to several minutes, although the exudation speed and the volume of
droplets reduce gradually. By direct observation, no contamination is found from either cortex
or xylem.
2. By applying CF5(6) to petiole surface or stem surface after abrading their surface,
immediately after cutting stem or petioles, all exudates are labelled with CF5(6)
-67 -

Chapter 4—Re-investigation of Phloem Exudation
Fig4.10. Phloem exduation in from C.maxima petiole after overnight application of CF5(6) to adaxial surface. Photograph is taken without removal of exudates after cutting the petiole. CF5(6) exudates spread out on petiole surface. Central phloem is more intensively labelled and there is no exudation occur, although long UV illumination during photographing causes diffusion of central phloem content out of cut surface .Arrow indicates the clear extrafascicular exudation.
fluorescence. After removal of initial exudates that spread out across the cut surface, the
subsequent exudates are also completely labelled with CF5(6) fluorescence. However, central
phloem is not labelled with CF5(6). This not only indicates that all phloem exudates are from
the extrafascicular phloem system, but also indicates that these three types of extrafascicular
phloem strands (endocyclic phloem, extrafasicular phloem in cortex (commissural phloem)
and extrafascicular phloem surrounding central phloem) form a continuous super-symplastic
path. This is confirmed by the observation that CF5(6) is only confined within SE/CC
complex of extrafascicular phloem, and no fluorescence can be found in parenchyma cells in
cortex.
3. The lack of continuous exudation from central phloem is confirmed by applying
CF5(6) to leaf surface. Although a small amount of diffusion of exudates from central phloem
sometimes occurs, compared with the large amount of extrafascicular phloem exudates, it is
negligible and does not cause severe contamination to extrafascicular phloem exudates.
Therefore, cucurbit phloem exudates should be regarded as relatively pure phloem exudates
from extrafascicular phloem system.
-68 -

Chapter 4—Re-investigation of Phloem Exudation
4. Notably, two further points need to be addressed for exudation observation when
CF5(6) is applied to the leaf surface: 1) exudates from extrafascicular phloem surrounding
central phloem can be labelled. Judging from the degree of CF5(6) fluorescence in phloem
exudates, the intensity varies from plant to plant. Despite the variation, it is still a useful line
of evidence that indicates active transport by the extrafascicular phloem surrounding central
phloem from source to other sites. 2) In petiole and stem, the CF 5(6) fluorescence from
internal central phloem in most cases is less intense than that of external central phloem.
-69 -

Chapter 4—Re-investigation of Phloem Exudation
Fig4.11: Both extrafascicular phloem and central phloem are labeled with CF5(6) in petiole, after application of CF5(6) to leaf surface. Photograph is taken after phloem exudation stopped and exudates removed with GFP filter set by epifluorescence microscopy. CS, commissural sieve tubes between vascular bundles.
Fig4.12. No continuous exudation observed from central phloem. CF5(6) isapplied to leaf surface (adaxial).
Stem internode distant to leaves that CF5(6) applied was cut and directly observed without removal of phloem exudates under binoculars with GFP filter set. Extrafascicular phloem is not labelled. Arrow indicates small amount of fluorescence diffuses out of broken central phloem sieve elements and floats over exudates spread on stem surface. There is no continuous exudation from central phloem observed.
-70 -

Chapter 5: Spatially resolved metabolomics
Chapter 5 Spatially resolved metabolomic analysis of Cucurbit transport phloem systems
5.1 Introduction
For decades, possible differences between central phloem and extrafascicular phloem
have been ignored in the analysis of phloem transport using cucurbit phloem exudates. As a
result, a large body of previous experimental data may need to be reinterpreted. To analyze
phloem transport in cucurbits, spatial resolution is necessary since there are two different
phloem systems with different cytological characteristics and wound responses upon
sampling: central phloem immediately stops transport whereas extrafasicular phloem releases
its sap content as exudates.
Aphid sampling of phloem exudates is currently the most reliable method to obtain
highly pure phloem sap for analysis. However, it was not available in the current study. It is
also surprising that there are no published reports regarding use of aphids for phloem
sampling and phloem transport analysis in cucurbits. One possible explanation is that
extrafascicular phloem in cucurbit leaf veins surrounding central phloem provide an effective
barrier preventing penetration of aphid stylets
The most difficult part for now is the sampling of central phloem content due to its being
rapidly blocked and the rapid exudation from the surrounding extrafascicular phloem. The
knowledge acquired during observation of phloem exudation in this study now provides an
alternative approach: namely, using tissue dissection of transport phloem systems of cucurbit
stem for estimation of central phloem content. Results described below are obtained from
dissection of lyophilized C. maxima tissues.
5.2 Tissue dissection of C.maxima lyophilized stem segments
Immediately after cutting, stem segments of mature pumpkin were frozen in liquid
nitrogen then lyophilized. About half a centimeter of lyophilized stem segments was divided
into small pieces according to their vascular bundles using double-sided clean razor blades
operated under binoculars. All samples were photographed for further volume estimation.
Great care was taken to avoid any possible contamination such as from operating bench or
microscopes. Moisture coming from breath during operation was problematic for tissue
dissection but avoided by wearing a thick face-mask.
External central phloem system in pumpkin stem is more developed compared with the
internal central phloem system, especially that their sieve tubes occupy larger portion of
central phloem area. Therefore more external central phloem tissues were dissected. The
dissected central phloem tissues (containing sieve elements, small companion cells and
-71-

Chapter 5: Spatially resolved metabolomics
phloem parenchyma cells) were further checked for purity by cutting off both its ends, and
then visualized by epifluorescien microscopy after staining with DAB especially to check the
purity of central phloem (Fig.5.1). If both ends were pure central phloem tissues, then the
sample was considered free of any other types of cells that do not belong to central phloem.
Since during dissection, the action is fast and blade is sharp, it can safely be assumed that if
both ends show pure dissected central phloem tissues, all the remaining tissues should be also
pure and free of contamination from surrounding cells and tissues.
Table5.1. List of tissues dissected from lyophilized stem segments and cell types included in dissected individual tissue.
For extrafascicular phloem strands, due to its extremely small diameter and scattered
distribution, only very tiny amounts of extrafascicular phloem-containing tissues could be
dissected, inside which there were only one to two extrafascicular phloem strands, mixed with
central phloem and cortex parenchyma cells. Therefore, phloem exudates were used for
estimation of extrafascicular phloem content.
Tissues dissected Included cell types Identification method Notes
External central phloemphloem parenchyma, sieve element, companion cell
alkiline aniline blue staining and UV epifluorescein microscopy
sieve elements accupies a major portion
Internal central phloemphloem parenchyma, sieve element, companion cell
alkiline aniline blue staining and UV epifluorescein microscopy
sieve elements accupies a major portion
Xylem tracheary elements, xylem parenchyma cells
direct microscopic observation
pith parenchyma cells direct microscopic observation
cortex parenchyma cells, extrafascicular phloem
direct microscopic observation
Extrafascicular phloem containing tissues
extrafscicular phloem, small parenchyma cells surrounding extrafascicular phloem containing chloroplasts, central phloem, cortex parenchyma cells
alkiline aniline blue staining and UV epifluorescein microscopy
few extrafascicular sieve elements inside
In the course of tissue dissection, cambium tissue was not successfully dissected
because of its fragility and smaller size. For comparison, segments of dissected total vascular
bundles (containing vascular tissues, pith and cortex) were sampled. Tissues dissected are list
in Table 5.1 and examples of dissected external central phloem tissues are shown in Fig5.1.
-72-

Chapter 5: Spatially resolved metabolomics
Fig5.1. Tissue dissection and dissected pure external central phloem tissue. Fig A shows one vascular bundle just after first cut during dissection, with and tissue types labelled. Fig B: shows external central phloem dissected out. Fig C: shows both ends of dissected external central phloem are composed of central phloem sieve elements, observed under epifluorescein microscope with UV excitation, stained by aniline blue. Fig D, E, F show dissected cortex, xylem and pith respectively.
5.3 Metabolomic profiles of different dissected tissues
5.3.1 Distribution of glycans and RFO sugars Polar phase of extracts from different dissected tissues were analyzed by GCMS for
small metabolites and LCMS for sugars and glycans. Among all of these samples, including
cortex, phloem exudates, central phloem tissues, xylem tissues, pith and whole vascular
bundles, glycans were only present in phloem exudates. Highest concentrations of RFO sugars
were found in both internal central phloem (2 successful measurements) and external central
phloem (see below). Although in xylem tissues there were small amount of RFO sugars
detectable, the concentration is considerably lower. In cortex, only trace amounts of RFO
sugars were detectable.
-73-

Chapter 5: Spatially resolved metabolomics
5.3.2 Comparative metabolome between central phloem tissues and phloem exduates
In dissected central phloem tissues (both external and internal central phloem), except for
sucrose, raffinose and galactinol, only a few metabolites, including glutatmate, serine,
aspartate and malate, were detectable in GC/MS analysis. Most small metabolites in phloem
exudates (Fiehn, 2003) are virtually absent in central phloem tissues (Fig5.2).
Fig 5.2. Comparative analysis of extrafascicular phloem exudates and dissected external central phloem tissues by GC/TOF. Fig A: TIC of GC/MS chromatograph for stem phloem exudates. Fig B: TIC of GC/MS chromatograph of dissected central phloem tissue. Fig C: extracted ion chromatogram of chromatograph B, showing the relative abundant peaks and identified metabolites comparing to mass spectra database. In GC/MS, no compounds larger than trisaccharides are detected.
RFO sugars, including sucrose, raffinose, stachyose and verbascose were all present in
dissected external central phloem measured by LC/MS. The major RFO sugar is stachyose
and only a small amount of verbascose was detectable (Fig5.3). External standards of RFO
sugars (sucrose, raffinose, stachyose) were used for calibration. Since only a small amount of
-74-

Chapter 5: Spatially resolved metabolomics
verbascose was detectable, for calibration, the standard curve of stachyose was used for rough
estimation verbascose.
Fig5.3. HILIC-IT-MS measurement of polar extract of phloem exudates and dissected central
phloem tissues.
Fig A: base-peak chromatograph of stem phloem exudates, only trace amount of RFO sugars
detectable. Fig B: base-peak chromatograph of dissected central phloem tissues. FigC: spectra
of Fig A from retention time 56.15min to 63.12 min, showing the two families of glycans are
both detected in phloem exudates.
To estimate RFO sugar concentrations in sieve elements of central phloem, it was first
assumed that sugars in dissected central phloem tissues are mainly in sieve elements and most
central phloem sieve elements are active in transport. Based on these assumptions, the
-75-

Chapter 5: Spatially resolved metabolomics
concentration of RFO sugars in sieve elements was estimated using this formula: (the
percentage of volume of central sieve elements in the total volume of dissected central phloem
tissues)×(concentration of RFO sugars in dissected central phloem tissues)/shrinking factor.
Volumes of dissected tissues and leaf discs were estimated by photomicroscopy. The
percentage of volume of sieve elements in total dissected central phloem tissues may vary
from plant to plant. It could not be estimated directly using dissected central phloem tissues
which are too fragile and broken into parts in staining solution (Fig5.1.C). Therefore, the
intact lyophilized whole vascular bundles stained by decoloured aniline blue solution were
used. The percentage of volume of sieve element to that of total external central phloem is
about 50% (two measurements). Here 45% was used for estimation, since not all sieve
elements are necessarily active for transport. The shrinking of tissues during lyophilization is
not very significant (Haritatos et al., 1996), especially with stem tissues, and for estimation a
factor of 0.8 was used.
Sucrose Raffinose Stachyose Verboscose Sum NExtneral central phloem 106.8+/-60.7 25+/-15 927.5+/-777.4 99.6+/-89.2 1158.8+/-878.2 13Leaf disc 3.1+/-1.6 3.8+/-1.5 9.0+/-3.8 0.5+/-0.3 16.5+/-5.7 6Phloem exduates 0.4+/-0.6 17.5+/-18.8 9.5+/-12.1 1.7+/-2.9 29.4+/-34.3 3Xylem 0.7+/-0.7 0.1+/-0.1 5.2+/-5.2 1.5+/-1.8 7.4+/-5.6 4Internal central phloem 76.9 0.0 758.0 141.8 976.7 2
Table 5.2. Estimated concentration RFO sugars in different tissues (unit: millimolar). N stands for the number of measurements. The first number in the value, such as in 106.8+/-60.7,
represents for the mean, and the second is the standard deviation. Concentrations of both dissected
tissues, leaf discs and phloem exudates are all calculated based on volume measured.
Using these parameters and external calibration by RFO sugar standards, the sugar
concentration in sieve elements of both internal and external central phloem was obtained
(Table5.2). No further successful dissections of tissues of internal central phloem were
achieved for LC/MS, hence there are only two measurements. From these two measurements,
it is clear that there was also a high concentration of RFO sugars inside this less-developed
internal central phloem (Table5.2).RFO sugar concentration in leaf discs, xylem and phloem
exudates were also calculated and listed in Table 5.2 for comparison.
RFO sugars both in xylem tissues and phloem exudates were very low. This is in distinct
contrast to that of central phloem. The overall concentration of RFO sugars estimated in
central phloem using this method is up to 1158.8 millimolar (average), which satisfies the
requirement of mass flow mechanism. The majority of this is contributed by stachyose, in
agreement with a former report using another cucurbitaceous species (C. melo) (Haritatos et
-76-

Chapter 5: Spatially resolved metabolomics
al., 1996). . There is great variation in these measurements, possibly due to several factors
such as the actual portion of active sieve elements and source-sink status. Even assuming
there is no contribution of RFO sugars from minor veins in leaf disc tissues and that RFO
sugars are 10 times higher in cytosol of mesophyll cells in leaf discs (Fiehn, 2003), there still
exists a large concentration gradient between sieve elements of central phloem and cytosol of
mesophyll cells. Such a large concentration gradient indicates that a loading step between
mesophyll cells and sieve elements is required
5.3.3 Distinguishing tissues by metabolomic analysis Tissues are defined as one physiological functional unit (Esau, 1965), therefore, the
study of metabolic interactions among different tissues is a very important issue for
understanding of source and sink relationships. Metabolomic analysis revealed a vast
metabolomic difference between different dissected tissues. Except for those of external
central phloem and phloem exudates, metabolic profiles of other dissected tissues of stem are
listed in Fig5.4.
Fig 5.4. Comparison of metabolomic profiles of dissected xylem, cortex and pith tissues in GC/TOF measurements. A: pith; B: cortex; C: xylem
In the phloem transport system of cucurbits, because of the spatial distribution of
extrafascicular phloem, there are potentially complex interactions among different types of
tissues. Furthermore, metabolic status of leaf tissues will affect metabolomic status of
-77-

Chapter 5: Spatially resolved metabolomics
transport phloem. However, the network of source and sink interactions and the metabolomic
interactions between different tissues has to be robust to cope with many different
environmental and physiological variations. This is reflected by PCA analysis of metabolomic
data of different tissues (including dissected tissues in stem, leaf discs and phloem exudates).
Principle component analysis (PCA) uses linear combinations of all metabolite data to
generate new vectors that best explain overall variance in the data set, without prior
assumptions as to how and whether these data might cluster (Fiehn, 2003). Each type of tissue
is statistically regarded here as one metabolic phenotype. Metabolic phenotypes from
metabolomic snapshots of individual tissues were computed by PCA.
Plotting these overall metabolic snapshots, it was immediately clear that each tissue (Fig.
5.5) has a clearly distinct metabolic phenotype. This indicates the relative independence of
individual tissues as judged from a metabolic profiling perspective. Metabolic variation of leaf
discs and whole vascular bundles is larger than that of phloem tissue, for example, where both
internal and external phloem show a clearly greater level of homogeneity than other tissues
studied, although the metabolic composition of central phloem is demonstrably different from
that of phloem exudates. Further investigation is needed to make further use of these data in
the interpretation of source and sink interactions.
-78-

Chapter 5: Spatially resolved metabolomics
Fig. 5.5. Principle component analysis using vectors 1, 2 and 4 for clustering metabolomic snapshots from different tissues according to their metabolic variance. Coloration is according to tissue types. Vascular exudates (i.e extrafascicular phloem exduates) are distinctly different from others, either cortex or central phloem. Each dot represents one sample.
-79-

Chapter 6: Phloem proteins
-80-
Chapter 6 P-proteins in the Different Phloem Systems of Cucurbits 6.1 Introduction
In both central phloem and external central phloem of cucurbits, each mature sieve
element contains numerous proteinaceous structural components called P-proteins. By routine
cytological observation, these P-proteins are easily observed as plugs and transcellular strands
cross sieve plates. Currently, it has been generally accepted that they are one part of phloem
sealing systems after wounding (Evert et al., 1973). However, the characteristics of phloem
exudation of cucurbits shown above reveal a functional difference upon wounding and
exudation between phloem structural proteins from central and extrafascicular phloem in
central phloem, P-proteins block sieve pores upon wounding and prevent the loss of phloem
sap, while in extrafascicular phloem; proteins are released upon wounding which makes
sampling central phloem content difficult.
There are some controversies on the definitions on P-proteins. However, I use here the
term “P-proteins” to refer those structural proteins in the sieve elements (both external central
phloem and extrafascicular phloem). These structural phloem proteins originally named as
slime bodies have a long history in phloem physiological studies (for earlier review (Esau et
al., 1967; Kollmann, 1980; Sabnis and Sabnis, 1995), for a recent review and literature
(Thompson, 1999; Dinant et al., 2003b)). Their major functions have been proposed to
include simply serving as a sealing mechanism in the event of damage to the sieve tubes
(Eschrich, 1975). Elegant microscopic studies on Vica faba crystalline P-proteins have shown
that P-proteins react instantly to wounding ((van Bel, 2003) for a review) to block sieve pores
and stop mass flow in sieve tubes. However, other biochemical and physiological functions of
these proteins are still unknown.
Cucurbits have been the major species in the past century for studying the cell biology,
biochemistry and molecular biology of p-proteins because their exudates are easily obtained,
there are large sieve tubes for observation, and they contain abundant P-proteins (mainly PP1
and PP2) (Sabnis and Sabnis, 1995). Especially since the report (Eschrich et al., 1971) that
phloem exudates in cucurbits were ‘confirmed’ by electron microscopy as being released from
“bundle phloem”, most efforts on p-proteins have been performed using cucurbits as model
species over the past three decades (Clark et al., 1997; Dannenhoffer et al., 1997; Golecki et
al., 1999; Thompson, 1999; Dinant et al., 2003b).
In addition to P-proteins, phloem exudates in cucurbits also contain numerous other
proteins which have also been intensively used for biochemical, molecular biological and
physiological studies. These proteins from phloem exudates have been collectively termed
STEPs (sieve tube exudate proteins) (Balachandran et al., 1997; Schobert et al., 1998; Ruiz-
Medrano et al., 1999; Xoconostle-Cazares et al., 1999; Ruiz-Medrano et al., 2001; Yoo et al.,
Chapter 6: Phloem proteins
-81-
2002). Earlier studies show that apart from structural proteins PP1 and PP2, there are
numerous enzymes in sieve tube exudates, (Lehmann, 1973) including some enzymes for
glycolysis and citric acid cycle (for a literature review, (Eschrich, 1970; Cronshaw, 1981;
Kehr et al., 1999a; Haebel and Kehr, 2001). Proteomic analysis has been used for studying
cucurbit phloem exudate proteins (Kehr et al., 1999a; Haebel and Kehr, 2001), and a complete
antioxidant biochemical defence system has been characterized (Walz et al., 2002).
With such intensive study in the past on phloem exudate proteins using cucurbits as
model species, now a very interesting question is raised: since the discovery in the present
work that cucurbit phloem exudates are in fact from extrafascicular and not central phloem,
then what is the biochemical nature of the central phloem P-proteins? A fundamental
assumption in previous reports is that central phloem and extrafascicular phloem contain the
same P-proteins. Do those non-structural proteins in extrafascicular phloem exudates also
exist in central phloem? The biochemical and molecular biological identification of these
proteins will greatly benefit our understanding of phloem development and function (Dinant et
al., 2003a), and may provide an opportunity to manipulate these proteins for easier phloem
sap sampling.
In this study, the method for sampling and analysis central phloem P-proteins, and results
of analysis are reported, using Cucurbita maxima (pumpkin) as the model speices, including a
comparative study of phloem exudate proteins and protein from central phloem.
6.2 Sampling and extraction of central phloem structural proteins Central phloem P-proteins were readily observed under microscope as intense
transcellular strands between central phloem sieve elements when manual sections of frozen
stem or petiole were stained with acidified amido black (0.1% amido black in 10% acetic acid)
to visualize phloem protein content. Weakly stained extrafascicular sieve element proteins,
which did not appear to be transcellular strands, could also be observed alongside the central
phloem. (Fig. 6.1). During experiments, the transcellular stands (stretched P-protein bodies)
were found to be stiffened by acid conditions and lose their stickiness, presumably due to
acetic acid in staining solution. Therefore, 0.1% amido black in pH 8.0 solution was used in
further experiments, which maintains the elasticity of these transcellular strands. The elasticity
and stickiness are critical for sampling and can easily be tested using a metal needle tip. (Fig.
6.1 A and B). In these two figures, the P-proteins were stretched by needle tip to demonstrate
their elasticity and are indicated by yellow arrows. They can be stretched rather long by
needle tip and shrink back again after removing needle tip. It was also found that placing stem
tissue slides on ice during sampling could prevent exudation from extrafascicular phloem.
This was also observed in one previous report (Weber et al., 1974).

Chapter 6: Phloem proteins
-82-
Fig 6.1. Sampling of central phloem slime bodies by needle tips. Fig A: Longitudual section crossing external central phloem. Fig B: cross section of whole vascular bundles. Fig C: phloem protein bodies are stuicked on needle tips. Fig D and E: microscopic checking the sampled phloem bodies under normal transmisive light microscopy (D). Fig. E shows identification samples by epifluorescence microscopy after decoloured aniline blue staining. Fig. E shows that sometimes sieve plates, indicated by yellow arrow, were also picked up, but without the walls of sieve elements. (E). Yellow arrows in Fig A and B indicate the elasticity of stretched P-proteins after being picked by needle tip. Red arrow in Fig A indicates extrafascicular phloem strands. Sections in Fig A and B are stained by amido black 10R in pH8.0 solution.
By maintaining the elasticity of these transcellular strands, they can be easily picked up
by a clean metal needle (Fig. 6.1. C). After rotating the needle holder gently they were
convoluted around the metal needle tip. Then they were transferred to clean Eppendorf® tubes
and kept for further analysis. These sampled transcellular strands are visualized by light and
epifluorescein microscopy (Fig 6.1. D and E).
Sieve tubes can be regarded as an aqueous environment for structrural P-proteins. Under
normal physiological conditions, globular cucurbit P-protein bodies remain along the sides of
sieve tube walls to avoid the hindering of mass flow (Evert and Eichhorn, 1973). At least
under these physiological conditions, they should be resistant to being dissolved by the highly
polar sugar phloem sap, otherwise they would be flushed away during mass flow, and sieve

Chapter 6: Phloem proteins
-83-
elements would lose their capacity to block sieve pores upon wounding, the mechanism of
which still remains unknown. However, since they will appear as the major components of
transcellular strands, the sampled transcellular strands should contain the major components
of P-protens.
Therefore, it is necessary to test their solubility by protein extraction buffers. Unlike
extrafascicular phloem exuadates , which contains PP1 and PP2, proteins that can be
redissolved by a reducing environment such as DTT-containing extraction buffer even after
oxidation (Read and Northcote, 1983a, b), these microscopically observed transcellular
strands in central phloem could not be dissolved by DTT-containing extraction buffer. Only
phenol was effective in extracting those transcellular protein strands. (Fig 6.2).
Fig 6.2. Testing solubility of stretched phloem protein bodies. Left: showing stretched P-protein bodies are still present (black) visualized by both transmitted light for P-proteins and epifluorescein microscopy with UV filter set for callose (white dots). Stripped phloem bundles (mainly central phloem tissues) are homogenized and then extracted by 0.1 M DTT solutions for one hour and then stained by amido-black 10R solution and decoloured aniline blue solution (PH for both solution is 8). Right: showing stretched P-protein bodies have disappeared after being extracted by phenol. Phenol is removed by centrifuging and then tissues are stained and visualized by the same method.
6.3 Strategy and procedure for analysing phloem proteins The sampling of stretched p-proteins from central sieve elements by metal needle tips
cannot exclude the possibility that what has been visualized under the microscope by amido
black staining is actually the remnants after central phloem proteins exude out of sieve tubes
during sampling and fresh sectioning. Therefore, strict controls are necessary. According to
microscopic observation that cold conditions effectively prevent phloem exudation, C.
maxima stem was frozen with liquid nitrogen in planta then broken off by hand and stored at -
80 oC. After this, phloem exudates were taken from other parts of the plants to serve as
extrafascicular phloem exudate controls. Frozen stem was taken into a cold room and placed

Chapter 6: Phloem proteins
-84-
on ice to allow it to slowly thaw to half frozen state, when phloem bundles are stripped out of
vascular bundles. Stripped out phloem bundles (either internal or external) proved to be
mainly central phloem tissues mixed with small amounts of extrafascicular sieve tubes and
surrounding parenchyma cells.
Thus, three different phloem P-proteins samples were obtained: stretched central phloem
P-proteins sampled by needle tips which is relative pure (Fig6.1), phloem bundles (either
internal or external phloem (which should contain central phloem P-protens as major
components) and phloem exudates from extrafascicular phloem. These three different samples
were extracted and analyzed by protein gel electrophoresis and various mass spectrometric
techniques.
6.4 SDS-PAGE analysis of phloem proteins from two phloem systems Redissolved extracted samples of different phloem protein were analysed by 1D SDS-
PAGE under reducing conditions and stained by colloidal Coomassie blue shown in Fig6.3.
For extrafascicular phloem protein, the pattern of commassie blue visualized proteins bands
were similar to previous reports ((Read and Northcote, 1983b, c; Walz et al., 2002). For
example, previously identified and well-characterized proteins, PP1 and PP2 were readily
identified as they were the most intense bands and according to their relative molecular
masses (around 90-100 KDa for PP1 and 25 KDa for PP2). Surprisingly, the patterns of
protein bands from both needle-tip sampled central phloem P-protein sample and phloem
vascular bundles were distinctly different from that of extrafascicular phloem samples.
The most intense proteins bands PP1 and PP2 only appear as weak bands in the SDS-
PAGE lane of phloem bundle extracts samples. The patterns of gel bands of samples obtained
both from external central phloem bundles and internal phloem bundles were similar. A minor
difference is the intensity of possible protein bands PP1 and PP2. This can be interpreted as
being due to a larger proportion of extrafascicular sieve tubes being contained in internal
central phloem samples, because during phloem bundle sampling, all internal phloem bundles
are sampled together with pith, while external phloem bundles sampling contained only a
fraction of the extrafascicular sieve elements. More intensely stained new proteins bands
appeared in SDS-PAGE lane of needle sampled central phloem proteins. Estimated by their
distance of movement on protein bands, their molecular masses were also distinctly different

Chapter 6: Phloem proteins
-85-
Fig 6.3. SDS-PAGE (10%) analysis of central phloem protiens. For comparison, proteins from phloem exudates and stripped vascular bundles are also shown here. Lane A: proteins from phloem exudates; Lane B: proteins from external phloem bundles; Lane C: proteins from internal phloem bundles, Lane E: proteins from external central phloem sampled by needle-tip; Lane D: molecular markers: bars from upper to lower position represents molecular weight: 250, 150, 100, 75, 50, 37, 25, 15, 10 K Da respectively.
from PP1 and PP2. These comparative results show that central phloem contains a very
different suite of proteins. This conclusion is further strengthened by microscopic observation
of phloem sections stained by amido black 10R solution--a protein stain that shows better
linearity on tissue (Dieckmann-Schuppert and Schnittler, 1997). Since central phloem
proteins were most intensely stained, compared with extrafascicular phloem strands, central
phloem comprises the greater proportion of forceps-stripped phloem strands. Therefore, PP1
or PP2 should show as intense bands in the phloem bundle sample if central phloem did
indeed contain the same PP1 and PP2. However, the gel in Fig. 6.3 shows minimal PP1 and
PP2.

Chapter 6: Phloem proteins
-86-
Traditionally, phloem proteins are denominated in two ways: the most intense two
proteins in exudates of Cucurbita maxima are named as PP1 and PP2 according to their
masses (Read and Northcote, 1983b); other proteins have been named by abbreviation of their
molecular masses and species names (Xoconostle-Cazares et al., 2000). For example, in the
protein name CmPP36, “Cm” is the abbreviation of species name “Cucurbita maxima”, “PP”
stands for “phloem proteins (sometimes only one letter P is used, as in the case of CmPS-1,
which stands for Cucurbita maxima phloem serpin-1 (Yoo et al., 2000)), while 36 stands for
their molecular mass “36 KDa”. Here, in order to avoid confusion, a new nomenclature for
those proteins identified in central phloem is developed: the name is composed by three parts:
“CmCPPN”, where Cm stands for species name “Cucurbita maxima ”, CPP indicates their
tissue origin “central phloem proteins”, N for “the sequential number of bands visible from
top of gel. Naming proteins according to their molecular masses is not adopted here, since
estimation of molecular mass by SDS-PAGE is not accurate enough. In this analysis, only the
10 most dominant protein bands in needle tip sampled central phloem protein are denominated
by this nomenclature.
6.5 Mass spectrometric analysis of proteins from the two phloem system The differences between extrafascicular phloem proteins and central phloem proteins
judged from SDS-PAGE needed to be further confirmed by analysing differences in primary
structure between these novel central phloem proteins and extrafascicular phloem proteins,
especially PP1 and PP2. Different mass spectrometric techniques that have been well-
established in our institute were employed. The first, simplest method is using MALDI-TOF
for mass finger-printing (Kehr et al., 1999b). The most intense band, CmCPP5 in needle-tip
sampled central phloem protein samples was excised and digested by trypsin. The MALDI-
TOF spectrum is shown in Fig 6.4. Higher intensity confirmed peptide masses were submitted
to Mascot (www.mascot.com) database for searching possible matches to known cucurbit
phloem proteins. However, no hits were returned, which indicated that the most intense band
CmCPP5 is completely different from the fully sequenced PP1 and PP2.

Chapter 6: Phloem proteins
-87-
Because there may be possible protein losses during gel separation, direct digestion of
needle-tip sampled central phloem proteins by trypsin was tested followed by capillary LC
coupled to ion trap MS (LCQ deka XP) for comprehensive analysis of peptide sequence.
Within one run, 178 mass spectra of interpretable peptides were returned, which were
submitted to Mascot database searching for homologous protein sequences (data not shown
here). Again, no significant hits were returned for those proteins. These indicate that these
needle-tip sampled central phloem proteins are totally novel comparing to reported sequenced
(or partially sequenced) cucurbit phloem proteins. However, ion trap mass spectrometer can
only offer lower resolution and relatively low mass accuracy, which makes de novo
sequencing of peptides ambiguous and difficult.
Since QTOF offers higher resolution and mass accuracy that is enough for partially de
novo sequencing of unknown proteins from organisms with un-sequenced genomes (Walz et
al., 2002), protein bands of needle-tip separated central phloem proteins were also digested by
trypsin and sequenced by QTOF with nano-flow infusion. One example of a peptide sequence
is shown in Fig 6.5.
In my experiments, partial protein sequences were successfully obtained only from three
protein bands: CmCPP5, CmCPP6, CmCPP7 using QTOF (shown in Fig 6.3) with sequence
coverage of about 8-18% of their full sequence (Table6.1). Noticeably, there are two partially
identical peptides sequence ETTED(L/I)(L/I)R from peptides (Mw 1804 Da and 1348 Da
respectively) obtained from typsin digest of protein band CmCPP5. At present, it is not
possible to exclude the idea that there are two highly similar proteins within CmCPP5 bands,
as is the case for extrafascicular p-protein PP2. This needs further confirmation by better
separation or higher resolution gel electrophoresis and obtaining full sequence of CmCPP5.
600.0 1080.2 1560.4 2040.6 2520.8 3001.0Mass (m/z)
0
2074.2
0
10
20
30
40
50
60
70
80
90
100 659.3837
644.0371
855.0482 2274.1360606.0665
2613.1497906.4938
685.4399 1153.5661618.2767 1060.0654
2616.19042290.1156833.07031493.60341020.4987697.3029 2551.2255 2727.18302296.08051191.5344861.0651 1793.89781017.1772 1476.0619647.1914 2081.1534 2554.2225 2731.41142368.1262
Fig 6.4. MALDI-TOF spectra of trypsin digest of protein band CmCPP5.
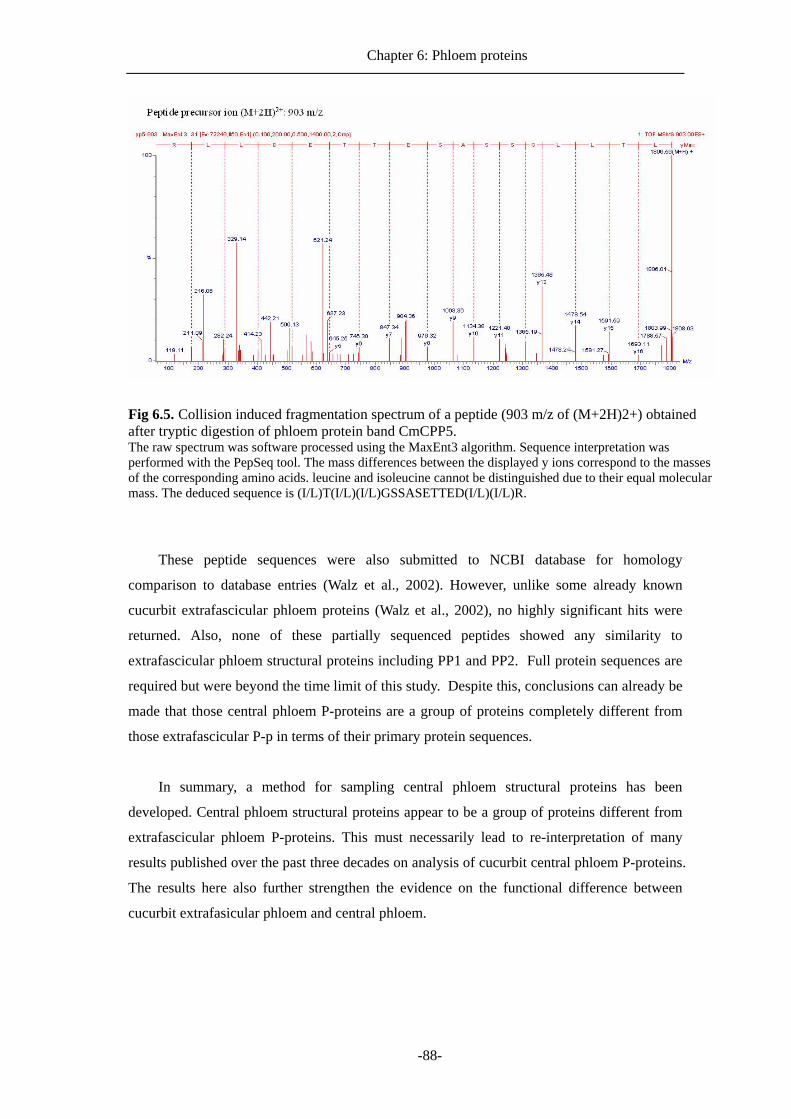
Chapter 6: Phloem proteins
-88-
Fig 6.5. Collision induced fragmentation spectrum of a peptide (903 m/z of (M+2H)2+) obtained after tryptic digestion of phloem protein band CmCPP5. The raw spectrum was software processed using the MaxEnt3 algorithm. Sequence interpretation was performed with the PepSeq tool. The mass differences between the displayed y ions correspond to the masses of the corresponding amino acids. leucine and isoleucine cannot be distinguished due to their equal molecular mass. The deduced sequence is (I/L)T(I/L)(I/L)GSSASETTED(I/L)(I/L)R.
These peptide sequences were also submitted to NCBI database for homology
comparison to database entries (Walz et al., 2002). However, unlike some already known
cucurbit extrafascicular phloem proteins (Walz et al., 2002), no highly significant hits were
returned. Also, none of these partially sequenced peptides showed any similarity to
extrafascicular phloem structural proteins including PP1 and PP2. Full protein sequences are
required but were beyond the time limit of this study. Despite this, conclusions can already be
made that those central phloem P-proteins are a group of proteins completely different from
those extrafascicular P-p in terms of their primary protein sequences.
In summary, a method for sampling central phloem structural proteins has been
developed. Central phloem structural proteins appear to be a group of proteins different from
extrafascicular phloem P-proteins. This must necessarily lead to re-interpretation of many
results published over the past three decades on analysis of cucurbit central phloem P-proteins.
The results here also further strengthen the evidence on the functional difference between
cucurbit extrafasicular phloem and central phloem.

Chapter 6: Phloem proteins
-89-
Table 6.1. Three protein bands are partially de novo sequenced by QTOF after trypsin digest: CmCPP5, CmCPP6, CmCPP7. No significant similarity of these proteins with known NCBI database entries . CmCPP6 is from two adjoining protein bands shown in Fig6.4.
Protein band ID
m/z of precursor
ion (M+2H)2+ Sequence
Number of Aa
Sequence coverage of the whole protein
922 (L/I)(L/I)V(L/I)SG(L/I)N(L/I)SECCHK 15 903 (L/I)T(L/I)(L/I)GSSASETTED(L/I)(L/I)R 16 868 NDPF(L/I)(L/I)DGNSFE(L/I)VR 15 675 QCAAETTED(L/I)(L/I)R 12 660 TQAQPF(L/I)D(L/I)GCK 12 571 EVRHES(L/I)SGK 10 877 Q(L/I)SVPNNP(L/I)RDHHPK 15 641 VVFTNA(L/I)H(L/I)(L/I)R 11
CmCPP5
608 V(L/I)TSPH(L/I)FR 9
18%
761 F (L/I)N(L/I)VDSKKFA(L/I)K 14 704 FADAADGDQAVDGR 14 690 QTQS 4 675 PQP(L/I) 4
CmCPP6
4%
556 NPG(L/I)H(L/I)CTTR 10 499 PG(L/I)H(L/I)CDSR 9
CmCPP7
433 FT(L/I)QDDK 7 12%

Chapter 7: Discussion
-90-
Chapter 7 Discussion Traditionally, phloem physiology studies have mostly used targeted analysis of
metabolites under the assumption that phloem is a uniform transporting channel, as indicated by
the shared structural features of sieve element and companion cells. Research on source and
sink interactions mainly focuses on analysing sugar and amino acid transport. However, source
and sink interactions are far more than simply transporting photoassimilates and other nutrient
metabolites through pipe-like sieve tubes. Considering the complex anatomical features of
source and sink tissues and the broad spectrum of small molecules transported in phloem, it is
necessary to use a non-targeted metabolomic analysis approach for studying phloem
physiology.
This thesis research aimed at using metabolomic analysis to investigate phloem transport
mechanism in putative symplastic loader, cucurbits. At the starting project, we assumed that
phloem exudates in cucurbits is pure and there is no functional discrimination among different
phloem systems of cucurbits. Glycans in cucurbits phloem exudates revealed by metabolite
profiling was chemically confirmed (More information on the structure of these metabolites
was obtained by Dr. Vladimir Tolstikov in our group). Metabolomic studies failed to provide
direct evidence for the initial hypothesis, which has forced a re-thinking of the phloem
exudation phenomena in cucurbits. We re-observed phloem exudation process by microscopy
and experimentally confirmed that the exudates in cucurbits is not from central phloem at all,
instead, from extrafacicular phloem.This discovery was not predicted at the outset of this PhD
project.
The new discovery in origin of phloem exudates triggered many new interesting questions
to be investigated. In the remaining part of the research project, we focused on two main
questions: the first is the difference on metabolic profile between different cucurbits transport
phloem systems (central phloem and extrafascicular system), and other tissues along transport
phloem including xylem, cortex. We found the completely different metabolic profile among
central phloem and extrafasicular phloem. The second is phloem protein content in two
different phloem systems. We found that central phloem does not contain previous claimed
structural P-proteins (PP1 and PP2). Instead, they contain completely novel phloem structural
proteins. To make the scheme of this discussion more focused, some discussions interpreting
results themselves have been introduced in previous result chapters. Thus, the following part of
this discussion focused on these issues:
1) Previous published research results on experimental confirmation of phloem exudation
in cucurbits are examined and discussed, because the initial design of this thesis project and
current researchers in phloem physiology using cucurbits phloem exudates relied on their
conclusions.

Chapter 7: Discussion
-91-
2) The contribution of our results to the understanding of basic concept in phloem
transport physiology;
3) Phloem transport mechanism in cucurbits;
4) Novel phloem protein from central phloem.
To apply metabolomic analysis for studying source and sink relationships, two major
problems are encountered. The first is the notorious issue of phloem sap sampling. Among
currently available sampling methods for phloem exudates, aphid stylet is more reliable than
any other. However, it is not only time-consuming and difficult to control, but also it is limited
to a few species of phloem aphids that are available. The second is the complex and variable
architecture of the phloem system in three different functional phloem zones: loading
(source), transport (transport phloem), and unloading (sink) zones. The concplexity of
vasculature and its relationship with phloem transportis almost? always neglected in older
phloem physiological studies. Any hypothesis or conclusions that are generated under the
assumption that all phloem strands behave the same therefore must be viewed with caution.
Phloem exudates can provide an opportunity for phloem physiological studies by
Metabolomic analysis, provided sampled phloem saps are relatively pure. The phloem exudates
from cucurbits used here have been experimentally proved to be less contaminated from
surrounding cells of phloem by earlier studies (Crafts, 1936; Eschrich et al., 1971b). The purity
of phloem exudates were also indicated by studies of cucurbit phloem macromolecules,
especially proteins. Since the most abundant proteins in cucurbit phloem exudates are found
only within phloem tissues, there seems no reason to doubt the purity of such phloem exudates.
Although we may consider the differences between the two phloem systems of cucurbits,
it has repeatedly been claimed that both phloem systems exude upon cutting (Crafts, 1936;
Eschrich et al., 1971b). Metabolomic studies failed to provide direct evidence for the initial
hypothesis, which has forced a re-thinking of the phloem exudation phenomena in cucurbits.
The discovery that phloem exudation is not from central phloem was not predicted at the outset
of this PhD project.
7.1 Past reports on phloem exudation in cucurbits
The utilization of cucurbit phloem exudates to study phloem transport has a long history,
either for phloem transport of photoassimilates, nutrients, signals (either hormones or possible
signalling macromolecules) (Schaffer et al., 1996; Lucas and Wolf, 1999).
According to (Crafts, 1932), phloem exudation from cut cucurbit stems was first described
by Naegeli (Naegeli, 1861). Exudates from Cucurbit stems and fruits were analysed by
(Zacharias, 1884) and (Kraus, 1885). Crafts used cucurbit phloem exudation to study the
feasibility of a mass flow mechanism and to reject the “activated diffusion” theory for

Chapter 7: Discussion
-92-
explanation of phloem transport mechanism at that time(Crafts, 1931). His effort in using
cucurbit phloem exudation to prove mass flow mechanism was not successful because he did
not realize the functional difference between its two different phloem systems (Crafts, 1944b).
He proposed at the time that phloem of cucurbits should not be regarded as typical of other plant
species and they should be removed from textbook for model species.
However, the use of cucurbitaceous plants as experimental materials for phloem
physiological studies did not stop during the flourishing of anatomical studies under the
framework of structure and function relationships spanning from 1950s and 1980s (Esau, 1969;
Cronshaw, 1981). The famous controversy on feasibility of mass flow mechanism for phloem
transport between 1960s to 1970s (Thaine et al., 1967; Thaine and Demaria, 1973) also used
cucurbits as model species. There are special advantages of using cucurbitaceous plants
cucurbits for phloem research 1) the large diameter of sieve elements for microscopic
observations, 2) their special source and sink relationships, i.e. especially producing large fruits
(sink). 2) Phloem transporting RFO sugars 3) ease of obtaining of large amount of phloem
exudates for analysis, and abundant protein content of phloem exudates. Especially with the
hypothesis of symplastic loading (Turgeon, 1996), biochemical and physiological studies of
functions of phloem proteins (including P-proteins) (H.D.Behnke and Sjolund, 1990) (Sabnis
and Sabnis, 1995) and phloem macromolecule transport and function (Thompson, 1999;
Thompson and Schulz, 1999; Walz et al., 2002), cucurbits have again become advantageous
experimental species.
The two experimental reports on confirming phloem exudation in cucurbits from Crafts
AS(Crafts, 1936) and Eschrich W (Eschrich et al., 1971a) respectively form the basis for later
use of cucurbits for research on phloem structure and physiology. Despite controversial results
in the past decades, mistaken conclusions about the source of exudates was never reportedly
considered as the reason for the controversies. The difficulties found here in properly
interpreting metabolomic data and generating valid models for phloem transport based on
metabolomic analysis, triggered suspicions about the validity of previous experimental results
and conclusions.
7.1.1 Re-examination of conclusions from Crafts AS’s studies To our knowledge, Crafts AS was the first to detail the phloem exudation process in
cucurbits by direct microscopic observation. The main results and opinions from his report
(Crafts, 1936, 1944a, b) are summarised and analysed as below:
1). Crafts AS found that exudation of cucurbits after cutting the stem was not from xylem,
and that sub-atmospheric pressure inside xylem (visualized by eosin staining and observed by
binoculars) (Crafts, 1936) prevented the contamination of phloem exudates by xylem.

Chapter 7: Discussion
-93-
2) Crafts AS observed continuous exudation from non-central sieve tubes, including
ectocyclic, entocyclic, and commussural and peripheral sieve tubes (surrounding central sieve
tubes) even after continuous removal of exudates during observation. He observed differences
in exudation behaviour between central sieve elements and extrafascicular phloem surrounding
it, as he states that exudation is not observed from central sieve elements after continuous
removal of exudates during observation. However, his explanation is that central sieve tubes
stop exudation after continuous removal of exudates during observation. This point was
neglected by later researchers using phloem exudates of cucurbits at the beginning of this study.
3) Phloem exudation from cucurbits could no longer be considered a manifestation of
normal phloem transport by mass flow (Crafts, 1944b) from calculating phloem exudation rates
and comparing to that predicted from mass flow mechanism using Poisuelle equation
At the time, Crafts AS did not distinguish the extrafascicular phloem that surrounds the
central phloem as being a different type of phloem with distinct transport and physiological
functions. Apparently he assumed these extrafascicular phloem strands surrounding central
phloem are components of the vascular bundles. However, ontogenetic studies have
demonstrated that they are in fact members of extrafascicular phloem system, as stated by
Crowshaw and Esau (Blyth, 1958; Cronshaw and Esau, 1968).
7.1.2 Independent study of Cucurbit phloem exudation in 1971 The report from Eschrich W on confirmation of phloem exudation in Cucurbita maxima
(Eschrich et al., 1971a) should be regarded as an independent one, since none of Craft AS’s
publications appears on the reference list. This report became the major research basis for later
research on phloem p-proteins and STEPs using cucurbitaceous plants as model species, as
acknowledged in later research reviews on phloem proteins (Sabnis and Sabnis, 1995;
Thompson, 1999).
The words by Thompson (Thompson, 1999) are probably more representative of the
underlying thinking of researchers studying phloem proteins or transport of cucurbits over the
past three decades: “The phloem of many species within the family Cucurbitaceae is composed
of large-diameter SEs from which protein-rich vascular exudates can easily be collected. The
exudates from cut stems emerge specifically from the mature sieve tubes of both the external
and internal bundle phloem and extrafascicular phloem (Eschrich et al., 1971a)". Therefore, the
large-diameter of sieve tubes of cucurbit central phloem is the acknowledged underlying
explanation of cucurbit phloem exudation.
Many later researchers studying phloem proteins in cucurbit exudations also cite this
report, e.g.: (Read and Northcote, 1983a, b; Dussourd, 1999; Kehr et al., 1999)). However,
reports from Richardson (Richardson et al., 1982, 1984) and the thorough review of cucurbit
source sink relationships (Schaffer et al., 1996) cite Crafts instead of this one. The reference
Chapter 7: Discussion
-94-
from Crafts AS is mostly cited for referring to the anatomy of cucurbit phloem (Kempers et al.,
1993; Golecki et al., 1999) .
The experimental procedure for confirmation of phloem exudation of cucurbits in
Eschrich W’s report is relatively simple1. “Hypocotyls of seedlings were cut transversely with a
sharp, defatted razor blade. The cut surface of the upper part of the plant was carefully dried
with filter paper and then quickly immersed in cold 6% glutaraldehyde.” (Eschrich et al.,
1971a). After subsequent procedures including fixation, sectioning, post-fixation, dehydration,
embedding and staining, sections are examined by electron microscopy. The description of
results goes this way: “Examination at low magnification showed that the droplets of exudates
emerged from both the external and the internal phloem of a cut Cucurbita stem. In addition,
small droplets in the cortical region exuded from cortical sieve tubes. No difference in
distribution of droplets was observed after the first, second or third cuts. In a previous paper,
electron micrographs of sieve elements and exudate droplets, both fixed with OsO4, were
compared (Eschrich, 1963). It was concluded that the exudates emerge only from mature sieve
elements containing filaments. No mitochondria or fragments of the endoplasmic reticulum
were found in the exudates.” In the following second paragraph, statement of confirmation of
phloem exudation of cucurbits continues: “These observations were confirmed in the present
study. In Fig.1 a mature sieve element with its attached exudate droplet is shown in longitudinal
section. The parietal layer of cytoplasm, with its mitochondria (m), and vesicles of endoplasmic
reticulum (er), remained in its original position whereas the bulk of sieve-tube slime or
P-protein, including the amicroscopic liquid matter, moved out to form the droplet. Careful
examination of serial sections of exudate droplets of different sizes showed no presence of
cytoplasmic structures, except particles or strands of P-proteins. Drop-like exudation occurred
only from sieve tubes with sieve plates far enough from the cut surface so as to not to hinder the
outflow. The exudates, although extending over a considerable cross-sectional area of the
phloem, did not mix with material of cut parenchyma cells. One to several layers of membrane
like structures, apparently coagulated P-proteins, covered the surface of the droplet (Fig 5.) On
the other hand, exudates of many sieve tubes often coalesced to form a single drop arising from
one phloem bundle, Density zonations occurred inside the droplet, pointing to a rhythmic flow
and subsequent coagulation of the exudates.” There is no further interpretation on confirming
phloem exudation in other parts of the paper.
It needs to be said that several of his statements are still valid: first, the same as that of
Crafts’ experiments, he also observed exudates from extrafascicular sieve tubes in cortex,
1 The texts within citation marks are the original words directly related to the method, results and
discussion of confirming phloem exudation, taken from ( Eschrich, W., Evert, R.F., and Heyser, W.
(1971a). Proteins of Sieve-Tube Exudate of Cucurbita-Maxima. Planta 100, 208-&. )

Chapter 7: Discussion
-95-
although no image is shown. Second, he observes that droplets from phloem exudates on cut
surface do not mix with other cells, such as parenchyma cells, and inside exudate droplets there
are no organelles.
The two microscopic images he shows in this paper need to be re-interpreted: in first
image (Fig1, P213), the claimed droplet does not seem to be a droplet, but rather stained
stretched p-protein bodies from central phloem, provided that the sieve elements he identified is
indeed central phloem sieve elements, as shown in Figure 7.1 and Fig 7.2. This is further
evident from this statement “Drop-like exudation occurred only from sieve tubes with sieve
plates far enough from the cut surface so as to not to hinder the outflow”. If phloem exudation is
a continuous outflow from sieve tubes, why and how could sieve plates resist the flow, as the
large volume of phloem exudates we routinely sampled from cucurbits requires continuous
exudation? This requires phloem exudates to continuously move or force through sieve pores of
many joined sieve elements within the same sieve tubes to reach the cut surface. Therefore his
deduction is not feasible. The explanation is reasonable that the observed droplet-like materials
are extensions of stretched filamentous phloem protein bodies, or small amounts of central
phloem exudates within one sieve element. In my experience, stretched central phloem
p-proteins after phloem being cut will be dragged out of the cut surface of sieve elements. The
first figure (Fig 7.1) possibility is more likely as shown by our result (Figure 6.1B in result
section) since fixative solution during section fixation will dissolve polar components such as
sugars in phloem exudates.

Chapter 7: Discussion
-96-
In this report, central phloem and extrafascicular phloem strands surrounding central
phloem are not distinguished either, as only “bundle phloem” is used therein. However, these
extrafascicular phloem strands do exist in cucurbits seedlings (for references to those
microscopic images, refer to (Thompson, 1999).

Chapter 7: Discussion
-97-
7.2 Major opinions and interpretation of the perplexing results obtained from analysing phloem exudates
The low sugar content in cucurbit phloem exudates and the belief that phloem exudates
come from both phloem systems equally, or there is no essential functional difference between
the two phloem systems, has produced much confusion and contradictory conclusions since the
beginning of last century when cucurbits were used for phloem physiological studies. These
perplexing interpretations can now be better understood following confirmation of phloem
exudations in this study.
Some researchers studying cucurbit phloem transport simply leave their results as puzzles
without attempting further interpretation (Richardson et al., 1982, 1984; Shalitin and Wolf,
2000). However, many have suggested that phloem exudates are contaminated either by
surrounding cells or xylem (Mitchell et al., 1992; Mitchell and Madore, 1992; Haritatos et al.,
1996). Despite their claims to try to avoid contamination, such as by shallow cutting to avoid
xylem contamination, no data on improved quality of phloem exudates are found in their
publications. For example, RFO sugars in phloem exudates are always still within low
millimolar range (Mitchell et al., 1992; Mitchell and Madore, 1992; Haritatos et al., 1996).
In the past three decades, most research on phloem proteins has used cucurbitaceous plants
as model species because of the high abundance of protein content in phloem exudates. Of the
most two abundant phloem proteins in C. maxima, PP1 and PP2, PP2, which is in fact two
proteins with similar mass, has been better characterized biochemically and at molecular
biological level (Dinant et al., 2003). In histological localization of phloem lectin PP2 from
phloem exudates using anti-lectin antibodies, it has already been found by strictly controlled
experimental design that both PP2s are confined only within extrafascicular phloem strands
(Smith et al., 1987). There is no detectable PP2 protein in central phloem and other tissues (Fig
7.3). However, the authors argued that the absence of staining by antibodies in central phloem is
because p-proteins from central phloem surged out during..sampling. Later repeat
immunolicalization experiments also confirm this observation (Bostwick et al., 1992; Bostwick
et al., 1994). These experiments are in agreement with results in this study.

Chapter 7: Discussion
-98-
Fig 7.3. Vascular bundles (external phloem) of Cucurbita maxima treated with anti-lectin antibodies and stained with peroxidase-conjugated second antibody and diaminobenzidine-tetrachloride substrate. (fp=central phloem, cp cortical parenchyma ) Only extrafascicular phloem is intensively stained, while central SE/CCs are devoid of stain. . From Smith LM et al 1987 (Fig4 B in P465).
Cucurbit phloem exudates have been extensively used to study phloem transport of
nutrients and macromolecules in recent decades under the assumption that either phloem
exudates are from central phloem or there is no difference between the different phloem
systems. These results and their interpretation therefore need further critical evaluation. Here,
only a few important papers’ results are commented on; for more comprehensive literature on
these efforts, refer to these reviews and publications, and literature therein. (Lucas et al., 1993;
Grusak, 1996; Haritatos et al., 1996; Balachandran et al., 1997; Schobert et al., 1997; Golecki et
al., 1999; Kehr et al., 1999; Lucas and Wolf, 1999; Ruiz-Medrano et al., 1999; Thompson,
1999; Thompson and Schulz, 1999; Xoconostle-Cazares et al., 1999; Leineweber et al., 2000;
Turgeon, 2000; Xoconostle-Cazares et al., 2000; Yoo et al., 2000; Haebel and Kehr, 2001;
Ruiz-Medrano et al., 2001; Walz et al., 2002; Yoo et al., 2002)

Chapter 7: Discussion
-99-
7.3 Phloem should not be treated as an unified transport system for photoassimilates, nutrients and signals:
One significant element of discoveries made here is to draw attention to the spatial
isolation of phloem loading and transport in complex vasculature. Co-transport of various
metabolites, including sugars and amino acids, within single sieve tubes may be a common
phenomenon in many species examined so far by aphid stylet sampling. From the two of the
results presented in this thesis—the difference on metabolic profiles and phloem protein content
between extrafascicular phloem and central phloem, phloem, it can be concluded that phloem
transport functions in these two systems are distinctly different. Following discussions on
cucurbits phloem loading and transport will give more detailed description.
To what extent such spatial isolation of metabolite transport occurs in different phloem
systems, or different sieve tubes, needs further investigation. However, it is known that phloem
architecture in angiosperms is very complex. For example, the physiological functions and
significance of co-existence of two different companion cells in minor veins is still less
understood, despite it has been discussed more then 10 years (Van Bel AJE 1992). It is
suggested that the two different companion cells in minor veins engaged in different loading
mode. Whether they load different metabolites into different sieve tubes now becomes an
interesting question.
The use of phloem exudates in other species and their results now should also be taken
cautiously, realizing the spatial assignment of phloem transport to different phloem system (i.e.
different sieve tubes).. However, it is only in cucurbitaceous plants that phloem exudation
process has been rigorously tested by experiment reported here. Phloem exudation in all other
species used for phloem physiological studies has not been rigorously confirmed (Tammes et
al., 1967; Milburn, 1971; King and Zeevaart, 1974; Zeevaart, 1975; Dunford and Zimmermann,
1976; Costello et al., 1982; Vreugdenhil and Kootgronsveld, 1988; Glad et al., 1992; Atkins,
1999). Rigorous confirmation of phloem exudation requires to answer the phloem sealing
systems (phloem callose formation and phloem p-proteins), and phloem architecture (for
example, if all sieve tubes release exudates or only some sieve tubes). Therefore, it will be
intriguing to know if in these species the phloem exudates that can be obtained by various
methods are from particular phloem strands, instead of from all phloem strands equally.
With current knowledge, the assumption that phloem represents a uniform transport
channel transporting nutrient and signals between source and sink should not be treated as a
generalized rule. This should be considered when we discuss and study phloem loading and
transport of nutrients and signals.

Chapter 7: Discussion
-100-
7.4 Phloem transport mechanism in cucurbits
7.4.1 Vascular architecture of cucurbits Phloem long-distance transport by mass flow structurally depends on the super-symplastic
interconnection between different sieve tubes. For the convenience of discussing phloem
transport mechanism in symplastic loader cucurbitaceous plants and interpreting metabolomic
data in order to formulate mechanisms of phloem transport in cucurbits, it is necessary to
summarize current knowledge on spatial arrangement of their vascular architecture:
According to current understanding of phloem loading and transport mechanisms (vanBel,
1996), photoassimilate loading mainly occurs in minor veins. The smallest minor veins of
cucurbits are bicollateral resembling bicollateral configurations in transport central phloem
system, and they do not possess extrafascicular sieve elements (Turgeon et al., 1975).
Extrafascicular sieve tubes have been described distributed in petioles and stems (Kempers et
al., 1993), which is confusing: because according to a recent publication (Fig 7.4 (Chen et al.,
2000)), extrafascicular sieve elements are also distributed in larger veins of cucurbit leaves
surrounding their bicollatral central sieve elements.
When glass capillaries are inserted into these larger veins to obtain relatively pure
exudates, they will first reach these extrafascicular sieve elements. Even though glass
capillaries reach the central sieve elements, due to the rapid and efficient wounding response of
central sieve elements, there is almost no opportunity to obtain central phloem exudates. This is
the case for central sieve elements, which did not produce a surge of exudate when glass
capillaries are inserted into them during any of my attempts to sample central sieve element
content. Therefore, although the sampling of phloem exudates by glass capillaries can avoid
contamination from cells surrounding the sieve tubes, phloem exudates obtained this way
should now be regarded as coming only from extrafasicular sieve tubes. This explains one of the
initial observations in this work, that there is essentially no difference in metabolic profiles of
exudates obtained directly by glass capillaries, after needle-tip punching a hole in veins,
petioles or stems, and after cutting petioles and stems.
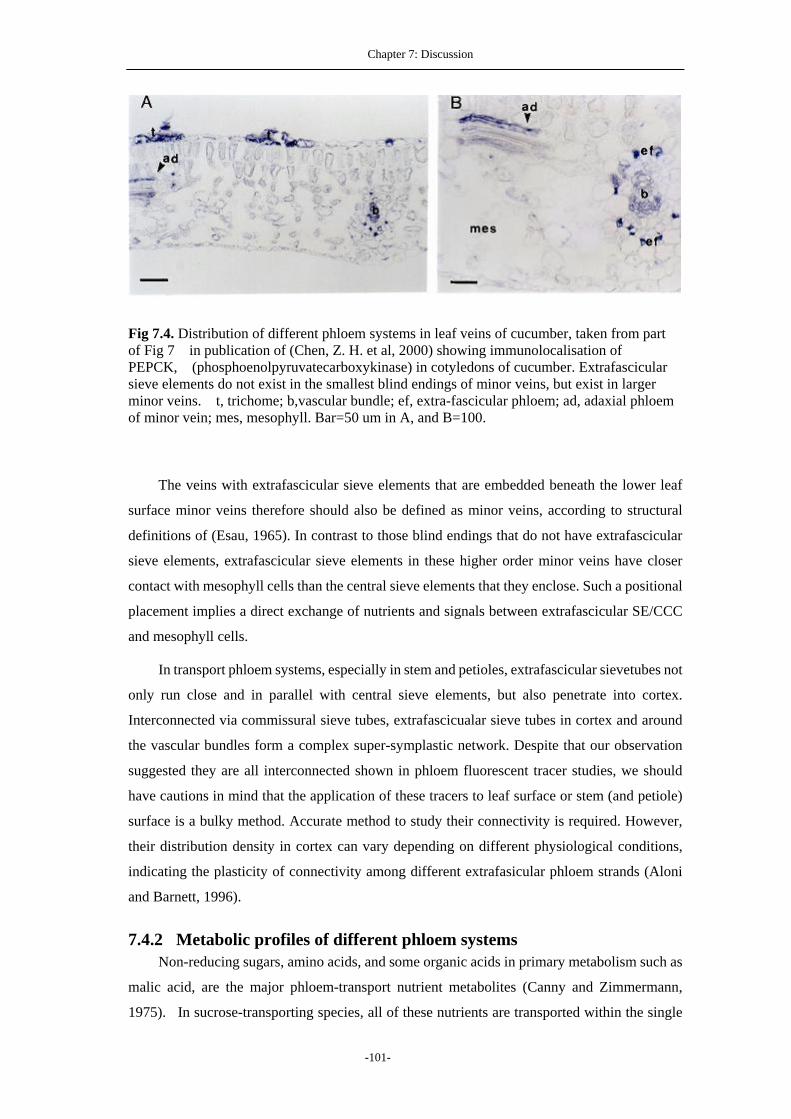
Chapter 7: Discussion
-101-
Fig 7.4. Distribution of different phloem systems in leaf veins of cucumber, taken from part of Fig 7 in publication of (Chen, Z. H. et al, 2000) showing immunolocalisation of PEPCK, (phosphoenolpyruvatecarboxykinase) in cotyledons of cucumber. Extrafascicular sieve elements do not exist in the smallest blind endings of minor veins, but exist in larger minor veins. t, trichome; b,vascular bundle; ef, extra-fascicular phloem; ad, adaxial phloem of minor vein; mes, mesophyll. Bar=50 um in A, and B=100.
The veins with extrafascicular sieve elements that are embedded beneath the lower leaf
surface minor veins therefore should also be defined as minor veins, according to structural
definitions of (Esau, 1965). In contrast to those blind endings that do not have extrafascicular
sieve elements, extrafascicular sieve elements in these higher order minor veins have closer
contact with mesophyll cells than the central sieve elements that they enclose. Such a positional
placement implies a direct exchange of nutrients and signals between extrafascicular SE/CCC
and mesophyll cells.
In transport phloem systems, especially in stem and petioles, extrafascicular sievetubes not
only run close and in parallel with central sieve elements, but also penetrate into cortex.
Interconnected via commissural sieve tubes, extrafascicualar sieve tubes in cortex and around
the vascular bundles form a complex super-symplastic network. Despite that our observation
suggested they are all interconnected shown in phloem fluorescent tracer studies, we should
have cautions in mind that the application of these tracers to leaf surface or stem (and petiole)
surface is a bulky method. Accurate method to study their connectivity is required. However,
their distribution density in cortex can vary depending on different physiological conditions,
indicating the plasticity of connectivity among different extrafasicular phloem strands (Aloni
and Barnett, 1996).
7.4.2 Metabolic profiles of different phloem systems Non-reducing sugars, amino acids, and some organic acids in primary metabolism such as
malic acid, are the major phloem-transport nutrient metabolites (Canny and Zimmermann,
1975). In sucrose-transporting species, all of these nutrients are transported within the single

Chapter 7: Discussion
-102-
class of sieve tubes and contribute to phloem osmotic pressure for mass flow (Winter et al.,
1992; Lohaus and Moellers, 2000). For example, in the relatively pure phloem sap (barley,
Hordeum vulgare L.) obtained via aphid stylet, the sum concentration of amino acids is up to
186 mM to 244 mM depending on experimental conditions, and the concentration of sucrose is
1.03 to 0.93 M. The concentration ratio of amino acids to sucrose in phloem is 0.18 to 0.26
(Winter et al., 1992).
Despite the low concentration of sugars in extrafascicular phloem sap of cucurbits, the
concentration of structurally characterized amino acids and organic acids falls within the range
of other species(Richardson et al., 1982, 1984). According to (Fiehn, 2003), sum concentration
of identified amino acids and organic acids is about 34 mM. However, there is a larger number
of novel nitrogen compounds with higher concentrations as indicated by their higher response
in GC/MS and LC/MS detection (Tolstikov and Fiehn, 2002; Fiehn, 2003). The sum
concentration of total metabolites remains unknown. In contrast to extrafascicular phloem
exudates, in central phloem there is only a trace amount of amino acid-containing compounds
detectable and the major components are RFO sugars.
These data suggest that in transport phloem of symplastic loader cucurbits, the task of
long-distance transport of nutritional metabolites is assigned to different phloem systems:
extrafascicualar sieve tubes mainly transport non-sugar metabolites including
nitrogen-containing metabolites and organic acids, and central sieve tubes mainly RFO sugars.
This contrasts to the situation in species that use sucrose as major phloem transported sugar,
where all metabolites are transported within single type of sieve tubes. Therefore, the
generalized concept that phloem mainly transports photosynthate, as described in general plant
biology textbooks should not be regarded as universally applicable to all species in the plant
kingdom.
7.4.3 Are the previous hypotheses well-founded? The idea that extrafascicular phloem may be specialized in transporting amino acids has
been proposed before (Leegood et al., 1997) However, their efforts using immunolocalization
techniques to study the possible specialization of amino acids in extrafascicular phloem neither
gave a direct answer on the metabolomic difference between different transport phloem
systems, nor pinpointed answers to the confusion about phloem exudation in cucurbits.
Phosphoenolpyruvate carboxykinase (PEPCK) is an enzyme that catalyses the reversible
decarboxylation of oxaloacetate to yield phosphoenolpyruvate and CO2. It is proposed that
PEPCK may play a key role in amino acid metabolism: involved in the conversion of the carbon
skeleton of asparagine/aspartate (oxaloacetate) to that of glutamate/glutamine (2-oxoglutarate)
(Walker et al., 2001). The localization of this enzyme in extrafascicular phloem supports the

Chapter 7: Discussion
-103-
hypothesis that extrafascicular phloem may be specialized in amino acids transport (Chen et al.,
2000; Lea et al., 2001). However, this deduction may well be groundless. As stated in our
results, extrafascicular phloem especially those peripheral to central phloem is always
associated with photosynthetic cells along the transport path. These photosynthetic parenchyma
cells are embedded inside other tissues, such as mesophyll cells in minor veins and large
cortical parenchyma cells, and also located far away from xylem tissues. Therefore, it is a
natural question as to how these special photosynthetic cells gain CO2 for photosynthesis. As
pointed out in the elegant work by (Hibberd and Quick, 2002), these photosynthetic cells in
stems and petioles gain CO2 by decarboxylation of organic acids, such as malic acids coming
from xylem, preferentially by NADP-malic, NAD-malic enzymes and PEPCK. The activity of
PEPCK in these vascular tissues can be 9 times higher than that in leaves in tobacco. In
C.maxima phloem exudates, the concentration of malic acid ranges from 1.6 mM to 42.1mM
(Richardson et al., 1982; Fiehn, 2003). Thus it is very likely in cucurbits that it is extrafascicular
phloem, instead of xylem that supplies CO2 by a decarboxylation process. This is further
strengthened by the detection of PEP in phloem exudates (Fiehn, 2003). Therefore, their
hypothesis based on immunolocalization of PEPCK (Walker et al., 2001) should be challenged
as there is little direct evidence to indicate that extrafascicular phloem is specialized in transport
of amino acids (Fiehn, 2003).
7.4.4 Correlations between metabolite profiles and protein profiles The metabolic profiles of the different phloem systems in cucurbits are correlated with
their phloem protein composition. The major two proteins, PP1 and PP2 in cucurbits (including
C.maxima and C.pepo) plants should not be regarded as the structural proteins for central
phloem. Central phloem structural proteins are totally different proteins, as shown from the
partial protein sequence of micro-dissected stretched p-protein bodies in this study. Central
phloem proteins sampled by our method may contain proteins other than phloem structural
proteins, but phloem structural proteins should be the major components judged from published
cytological images on P-proteins( please refer to (Evert and Eichhorn, 1973) and (Thaine, 1969)
). Many other abundant proteins in extrafascicular phloem exudates also are not present in
central phloem, as shown both by the present studies and the previous immunolocalization
studies discussed above.
The different metabolic profiles of extrafascicular phloem exudates from different
cucurbitaceous plants also correlate to their protein profiles. There are the same two families of
glycans C.maxima and C.pepo. They also share highly homologous p-proteins PP1 and PP2 in
phloem exudates (Dinant et al., 2003). The phloem protein composition of Cucumis sativus is
distinctly different from C.maxima and C.pepo, and the glycans in their phloem exudates are

Chapter 7: Discussion
-104-
also different. Further investigations are necessary to address possible relationships between
metabolite transport and functions of phloem proteins in metabolite transport.
7.4.5 Driving force for different cucurbits transport phloem systems The osmotic generated pressure flow (OGPF) is currently accepted interpretation for
phloem transport. The driving force for phloem transport originates from osmotic pressure
gradient along transport path. Two requirements for mass flow to drive phloem transport in
sieve tubes are open sieve pores and an osmotic pressure gradient. The third requirement of the
mass flow mechanism, which needs to be further experimentally proved, is that there is no
additional contribution to driving force other than osmotic pressure gradient from other sources,
for example by continuously contractile companion cells or phloem-protein complexes
(Kulikova and Puryaseva, 2002). One important prediction from the mass flow mechanism is
the uni-directional transport of phloem sap.
7.4.5.1 OGPF for central sieve tubes The higher osmotic pressure in SE/CC of source leaf and the open pores of sieve plates
along transport phloem are required. Sieve pores in both phloem systems of cucurbits have been
confirmed open by microscopy using C. maxima as experimental material (Evert et al., 1973).
However, the two phloem systems are fundamentally different in osmotic pressure inside sieve
elements. High osmotic pressure in mature central sieve elements has been indicated by
plasmolysis experiments using callus phloem in C pepo. (Lackney and Sjolund, 1991). RFO
sugar concentration in central SE/CCs in minor veins estimated by tissue dissection (Haritatos
et al., 1996) provides further support for this observation. Higher concentration of RFO sugars
in both internal and external central phloem of stem in this study confirms their experimental
results. These observations indicate that central phloem transport is likely to obey the mass flow
mechanism.
7.4.5.2 Driving force for extrafascicular phloem exudation However, direct measurement of the osmotic potential in phloem exudates, i.e
extrafascicular phloem exudates is about -0.8 MPa, significantly lower than that of central
phloem (Richardson et al., 1984; Turgeon and Hepler, 1989). Therefore, the osmotic pressure in
extrafascicular phloem provided by small molecules is not able to drive phloem sap transport at
the same high speed as that of central phloem.
A slower speed of transport of extrafascicular phloem is observed in our experiments.
When phloem-mobile tracer CF5(6) is applied to leaf surface, it enters both extrafascicular
phloem and central phloem. However, tracer intensity under epifluorescent microscopy is lower
in the former, indicating relative symplastic isolation between extrafascicular phloem and
mesophyll cells in source leaf. The transport speed of CF5(6) in extrafascicular phloem is much

Chapter 7: Discussion
-105-
slower than that in central phloem. For example, within 3 hours of CF5(6) application, central
phloem in stem far from the leaf to which CF5(6) is applied can be seen intensely labelled by
this tracer. At this time, there is almost no CF5(6) fluorescence visible in extrafascicular phloem
exudates at the same stem position.
It is too early to make a judgement that the mass flow mechanism is not obeyed in
extrafascicular phloem transport. If mass flow does operate, then it is the small molecules
discovered here by metabolomic analysis that account for the osmotic potential in
extrafascicular phloem sap, rather than sugars, as envisioned in the initial hypothesis.
However, the exudation phenomenon from extrafascicular phloem does provide further
suspicion that there may be an additional driving force for phloem transport in extrafascicular
phloem. In Crafts estimation of phloem exudation speed, he assumes that exudates emanate
from all phloem tissues in and around the vascular bundles. However, it is now known not to be
the case: the area of extrafascicular phloem is estimated to occupy much less than half of the
total phloem area. Even allowing for this, according to his calculations (Crafts, 1932, 1936), the
force required to drive the high speed of phloem exudation is far higher than possible osmotic
pressure could generate. Therefore, there must be an additional force other than that generated
by osmotic pressure gradient in extrafascicular phloem. Then, what can account for such
additional forces?
One candidate is P-proteins in extrafascicular phloem. If previous experimental results on
PP1 and PP2 are reliable, they are the major constituents of P-protein bodies in extrafascicular
sieve elements. During phloem exudation, P-proteins in extrafascicular phloem rapidly change
their conformation and surge out of sieve tubes. Such a rapid change of confirmation may
provide a force to cause surging of solutes in extrafascicular phloem out of sieve tubes. The
second candidate is the other phloem proteins in extrafascicular phloem. Although earlier
studies rejected the idea that phloem structural proteins are not actin-like and excludes the
possibilities that they are one of driving force for phloem transport (Palevitz and Hepler, 1975),
actins are detected in phloem exudates from various plant species (Schobert et al., 1998;
Kulikova and Puryaseva, 2002). It is not yet known if there is any interaction between phloem
structural proteins (PP1 and PP2) with actins and/or other phloem proteins (to form possible
macro-molecule machines) to provide the additional force for exudation. The third possibility is
companion cells. It is known that companion cells of extrafascicular CCs are considerably
larger than their SEs. It is also reported that after phloem exudation, volume of companion
cells is reduced 1/3 (Lehmann, 1973, 1981). However, in their reports, there is no indication as
to which types of companion cells they referred to. It is observed that phloem fluorescein tracers
only move along walls of extrafascicular sieve tubes when they are placed on surface of stem
segments (Kempers et al., 1993).

Chapter 7: Discussion
-106-
If additional forces account for the high speed of phloem exudation in cucurbits after
physical incision (which abruptly disrupts their phloem transport), then it is too early to exclude
the possibility that the same additional force(s) contribute to driving extrafascicular phloem
transport in intact plants. If this is the case, then the driving forces of long-distance transport in
extrafascicuar phloem will be from a mixture of different origins. If this is so, then OGPF would
not be a general mechanism accounting for phloem transport in all angiosperm species.
7.4.6 Functions of the extrafascicular phloem system and compounds therein
Extrafascicular phloem in cucurbits first should be taken as a nutrient transport channel
between source and sink. This is evident from these facts: 1) the large number and amount of
non-sugar compounds detected in relatively pure phloem exudates from extrafascicular sieve
tubes, including amino acids and organic acids 2) they are actively engaged in long-distance
transport. The first proof for this is these sieve tubes are also labelled in the earlier 14CO2
radiotracer labelling experiments (Webb and Gorham, 1964; Richardson et al., 1984). Their
active transport is also indicated by the stable isotopic labelling experiments (13CO2), phloem
mobile fluorescein tracer CF5(6), and grafting experiments reported here.
The rapid exudation and the presence of large numbers of secondary metabolites, such as
glycosides revealed by metablomic analysis using LC/MS, indicate that extrafascicular phloem
is responsible for cucurbits’ self-protection, such as against herbivores and phloem-feeding
insects. Several proteinase inhibitors which are proposed to function as aphid anti-feedants,
have been found in extrafascicular phloem exudates of C.maxima (for earlier reviews refer to
(Dannenhoffer et al., 2001)). This includes CmPS-1, a novel 42-KDa serine proteinase inhibitor
(Yoo et al., 2000), and a group of a highly conserved pumpkin furit trypsin inhibitors (PFTIs)
that prevent proteolytic activity of trypsin or chymotrypsin. PFTIs have been confirmed to be
restricted in extrafascicular phloem and absent from of central phloem of C.maxima. Aphids
have been found preferentially feeding from abaxial central phloem (Botha and Evert, 1978).
Interestingly, there are no reports on use of aphids for cucurbit phloem sap sampling, which
may be due to anti-aphid functions of extrafascicular phloem. When an aphid stylet is inserted,
the rapid exudation and large number and amount of secondary metabolites that enter stylet may
be lethal to aphids.
Although the possibility cannot be excluded that signalling molecules are transported via
central transport phloem, more and more evidence has accumulated to date suggesting that
extrafasicular phloem in cucurbits is a specialized signalling channel regulating source and sink
relationships in normal physiological conditions. Five protein kinases have been detected in
extrafascicular phloem exudates (Yoo et al., 2002). About 500 specific transcripts can be
detected in extrafascicular phloem exudates, some of which have been proved to be phloem

Chapter 7: Discussion
-107-
specific, i.e. not a result of contamination from other tissues and cells. Grafting experiments
established that some of the proteins and mRNAs can move to sink tissue (Ruiz-Medrano et al.,
1999; Foster et al., 2002).
Corresponding to the speculation that macromolecules or macromolecule complexes may
coordinate development of source and sink tissues, phloem mobile O-linked glycans and other
novel metabolites including N-acetyl-gamma-aminobutyric acid, and ascorbigen that were
discovered in C.maxima phloem may serve as signals to regulate source and sink relationships.
A variety of oligosaccharide signals has been identified that function in the regulation of plant
development and defense (Ryan, 1987; Farmer et al., 1991; Leconte et al., 1992; Denarie and
Cullimore, 1993; Etzler et al., 1997; Pierce et al., 1997; Etzler, 1998; Etzler et al., 1998;
Shibuya and Minami, 2001). Phloem-transported oligosaccharide related signals have long
been speculated to function as signals (Rigby et al., 1994). Although their presence in phloem
exudates may be suspected to be the result of wound responses during sampling of phloem
exduates, the uni-directional transport of those novel glycans between scions and stocks in
heterografts between C. maxima and C. sativus indicates they not only exist in intact plants, but
also their functions are far more than just signalling in wound responses. However, in this
regard, more physiological experiments are necessary and better than further speculation.
Extrafascicular phloem runs in parallel and peripheral to central sieve elements. It has
been speculated that these strands may be responsible for retrieval of metabolites leaking out of
central phloem along the transport path (Kempers et al., 1993). However, structural features of
anastomosing extrafascicular phloem elements in transport phloem of cucurbits suggest that
they may have functions far more than as a release/retrieval device in photoassimilate and
nutrient transport. The trans-cortex distribution of commissural sieve tubes indicates that they
may be also responsible for nursing cortex, or loading of nutrients that are stored in cortex
parenchyma cells. Chloroplasts are distributed more intensely within extrafascicular phloem,
indicating there is specialized metabolism in these extrafascicular phloem strands with
associated parenchyma cells.
Summarising all these speculations and deductions, it is suggested here that cucurbit
extrafascicular phloem may have multiple functions in regulation of source and sink
relationships. Although discerning the functions of individual metabolites transported in
extrafascicular phloem is not possible currently, it can be proposed that, in addition to serving
as nutrients for sink tissues, some of them should serve as novel functions other than nutrients,
including defence responses and signalling.

Chapter 7: Discussion
-108-
7.4.7 Phloem metabolism and phloem loading in cucurbits The polymer trapping model explains the symplastic loading mode at cell biological and
biochemical levels. The core of this model is the spatial arrangement of RFO sugar metabolic
pathways. Instead of using active sucrose symporters deployed in membranes to maintain a
thermodynamically steep concentration gradient between photosynthetic cells and SE/CCs,
symplastic loaders employ a novel strategy—the active polymerization of RFO sugars carried
out inside intermediate cells in minor veins by RFO metabolic enzymes, to sustain such a steep
concentration gradient (Turgeon, 2000). Now with the discovery of the authentic origin of
phloem exudates, the high concentration of RFO sugars in transport central phloem and lower
sugar profiles in leaf discs, there is now no reason to reject the polymer trapping concept. The
present study proves that the path for symplastic transport is from photosynthetic cells to central
phloem. The suspicion that symplastic loaders may be not effective in terms of loading
efficiency also becomes groundless.
Besides, the spatially resolved metabolomic analysis of phloem transport allows further
interpretation of the puzzle in cucurbit symplastic loading—the loading and the transport of
small molecules. The spatial allocation of tasks in transporting RFO sugars and metabolites
other than RFO sguars by extrafascicular phloem and central phloem repectively appears to be
the strategy that cucurbits employ to avoid the symplastic and apoplastic dilemma.
To make a prudent deduction from the present studies and combining all current
knowledge, it is necessary first to consider the vascular architecture in the source leaf, where
loading occurs. First consider the basic facts:1) the uni-directional transport of extrafascicular
phloem as indicated by grafting experiments reported here and earlier radio-tracer
experiments(Eschrich et al., 1964; Eschrich and Kating, 1964; Kating and Eschrich, 1964;
Schmitz, 1970; Turgeon and Webb, 1975) between source and sink 2) Configuration of minor
veins in source leaves (Chen et al., 2000): that extrafascicular sieve elements do exist in minor
veins defined in anatomical terms, although they are not present in smallest blind endings of
minor veins, where they are isolated from xylem, the nitrogen source. However, they do have a
close contact with photosynthetic cells including mesophyll cells. These two facts indicate that
metabolites in mesophyll cells can be loaded directly into SE/CC without first loading into
central phloem sieve elements. Further the symplastic isolation between extrafascicular SE/CCs
in minor veins is obvious as their companion cells are not intermediate cells. This indicates that
the loading mode operated in extrafascicular SE/CC is likely to be mainly apoplastic. Previous
Metabolomic analysis directly supports this hypothesis (Fiehn, 2003).
Although the loading mode for extrafascicular phloem is proposed as apoplastic here, it is
important not to underestimate the role of phloem metabolism in regulation of apoplastic
loading processes. For example, many metabolites in extrafascicular phloem exudates

Chapter 7: Discussion
-109-
including O-linked glycans are virtually absent from samples of leaf discs. The possible
relationship between phloem O-linked glycans and glycans discovered in leaf discs remains to
be further elucidated. Many but not all metabolites involved in central metabolism have been
discovered in extrafascficcular phloem exudates, indicating that novel metabolic pathways may
exist, other than central metabolic pathways. Further, the higher ratio of diameter between
extrafascicular CC/SEs (Kempers et al., 1993) along the transport path indicates active phloem
metabolism is continued throughout the transport phloem. This may be interpreted as indicating
robustness and flexibility of the phloem metabolic network (Fiehn, 2003).
7.4.8 A model for phloem loading and transport mechanism in cucurbits Many questions remain to be answered on mechanisms of cucurbit phloem transport
and functions of the novel metabolites transported in extrafascicular phloem revealed by
metabolomic analysis. The distinct metabolic profiles among different dissected tissues also
indicate that vascular tissues are far more than a translocation channel between source and sink.
Therefore, metabolomic analysis in the framework of source sink interactions is a new and
exciting field worthy of further exploration. Nevertheless, summarizing experimental
discoveries from this work and previous knowledge of cucurbit phloem loading and transport, a
generalized model is proposed here. (Fig 7.5).
This model is based on the functional difference in phloem loading and transport between
the two different phloem systems in cucurbits: extrafascicular phloem and central phloem.
Extrafascicular phloem is specialized in transporting of metabolites other than RFO sugars by
apoplastic loading. The sum concentration of metabolites in extrafascicular phloem at least
partially accounts for the driving force for its long-distance transport, although the existence of
forces originating from sources other than OGPF may exist. Central phloem is specialized in
transporting RFO sugars by symplastic loading mode , which is explained by polymer trapping
mechanism. Intermediate cells, instead of co-existed companion cells in minor veins, are
responsible for this loading step (Schmitz et al., 1987). The concentration gradient generated by
loading RFO sugars is enough to account for rapid mass flow of phloem sap in central phloem.
The active metabolism in extrafascicular phloem is indicated by its relatively large companion
cells along the whole transport path, which is in distinct contrast to that of central phloem.

Chapter 7: Discussion
-110-
Figure 7.5: Proposed mechanism of phloem loading and transport in symplastic loader, cucurbits. Red arrows indicate symplastic pathways for RFO sugars and blue arrows indicating apoplastic pathways for non-RFO sugar metabolites in extrafascicular phloem. Dotted lines: pathways needed to be further experimentally proved. MC, mesophyll cells; BS: bundle sheath cells; IC intermediate cells, CC: companion cells in extrafascicular sieve elements.
Two issues need to be pointed out here for this model. Firstly, although RFO sugars are the
major components of dissected bicollateral internal and external central phloem, the profiles of
small metabolites are distinctly different. This indicates that the physiological functional
significance of spatial separation of internal and external phloem still needs to be further
addressed. Secondly, in the model, it is also assumed that all extrafascicular phloem strands are
the same, as separate collection of different phloem exudates are very difficult due to their rapid
exudation. As shown in earlier reports, the extent of? connection between extrafascicular
phloem strands is plastic and can be regulated by physiological conditions. The consideration of
all extrafascicular phloem as one single transport channel may risk oversimplifying the real
situation of their loading and transport processes. However, according to previous studies and
those presented here, there is no essential difference between metabolic profiles of
extrafascicular phloem exudates obtained by glass capillaries inserted into main veins (where
the only extrafascicular phloem is peripheral to central phloem) and phloem exudates obtained
by cutting petioles (where there is a mixture of extrafascicular phloem localized in different

Chapter 7: Discussion
-111-
positions. Therefore, this exudate should be a mixture of extrafascicular phloem exudates from
different positions). This indicates there is unlikely to be a fundamental difference in terms of
their physiological functions.
7.5 Novel cucurbit P-proteins from central phloem
Another interesting discovery of this PhD project is the difference of phloem protein
content from extrafascicular phloem and central phloem. Despite our experimental methods for
central phloem protein analysis cannot determine exactly the composition of central phloem
P-proteins or the exact composition of central phloem proteins, one conclusion can be made that
PP1 and PP2 from phloem exudates cannot be regarded as central phloem structural proteins (in
Cucurbita genera) any more. This has been a critical mistake in phloem protein research for the
past three decades, ever since the first biochemical and cell biological studies of p-proteins in
cucurbits (Eschrich et al., 1971b). Due to the amount of literature on this is too much and
limitation of the space of this thesis, the detailed discussions on the previous results are not
presented here.
Although there is currently a lack of full-length sequences of these novel central proteins
reported here, the partial sequence is enough for further molecular biological work, such as
cloning the genes for these proteins. Once their full sequences are obtained, they will no doubt
be helpful for identifying structural proteins and genes in other plant species, and for generating
insights on how to manipulate central phloem proteins for other uses. For example, it may be
possible to stop rapid wounding responses in the phloem system and hence greatly facilitate
sampling of pure phloem sap (for phloem physiological studies).

Chapter 8: Discussion
-112-
Chapter 8 Suggestions for further research
There are many questions on the phloem transport mechanism in cucurbits that need to be
addressed further. In this study, for example, it was supposed that there is no essential
difference among different extrafascicular phloem strands or different central sieve tubes. The
anastomosing extrafascicular phloem system in cucurbits may be far complex than previously
imagined. Nevertheless, after the discovery of the true sites of phloem exudation in cucurbits,
it has been possible to correct a mistake that has been perpetuated in plant physiology for many
years. The metabolomic studies on phloem transport in cucurbitaceous plants now provide an
exciting and very good experimental model to study source sink relationships, including
phloem loading, transport and unloading. The important factors for further consideration are
listed as below:
1) Further physiological studies for small metabolites to confirm apoplastic loading
pathways in source leaves of cucurbits
2) The driving force for phloem transport in cucurbit extrafascicular phloem
3) The metabolic interactions between different phloem systems and their surrounding
cells along transport path.
4) How two such spatially separated loading pathways are coordinated to regulate source
and sink relationships
5) What are metabolic fates and physiological functions of metabolites in extrafascicular
phloem? How are they distributed among different organs and tissues? What are their metabolic
pathways? Which of them are specialized and/or synthesized in extrafascicular phloem?
6) What are the relationships between phloem proteins and metabolites transported,
especially in extrafascicular phloem?
7) What are the complete protein sequences of those novel central phloem structural
proteins? How much homology do they share with other plant speices? How is it possible to
stop sealing of sieve pores during phloem sap sampling?
Metabolomic analysis will be an indispensable tool to explore those questions.

Reference
-113-
Reference
Aloni, R., and Sachs, T. (1973). Occurrence and Development of Phloem Anastomoses in Stem Internodes. Israel Journal of Botany 22, 201-201.
Aloni, R., and Barnett, J.R. (1996). The development of phloem anastomoses between vascular bundles and their role in xylem regeneration after wounding in Cucurbita and Dahlia. Planta 198, 595-603.
Aloni, R., Pradel, K.S., and Ullrich, C.I. (1995). The 3-Dimensional Structure of Vascular Tissues in Agrobacterium Tumefaciens-Induced Crown Galls and in the Host Stems of Ricinus-Communis L. Planta 196, 597-605.
Altamura, M.M., Possenti, M., Matteucci, A., Baima, S., Ruberti, I., and Morelli, G. (2001). Development of the vascular system in the inflorescence stem of Arabidopsis. New Phytol. 151, 381-389.
Atkins, C.A. (1999). Spontaneous phloem exudation accompanying abscission in Lupinus mutabilis (Sweet). J Exp Bot 50, 805-812.
Baker, D. (2000a). Vascular transport of auxins and cytokinins in Ricinus. Plant Growth Regul 32, 157-160.
Baker, D.A. (2000b). Long-distance vascular transport of endogenous hormones in plants and their role in source : sink regulation. Israel J Plant Sci 48, 199-203.
Balachandran, S., Xiang, Y., Schobert, C., Thompson, G.A., and Lucas, W.J. (1997). Phloem sap proteins from cucurbita maxima and ricinus communis have the capacity to traffic cell to cell through plasmodesmata. Proc Natl Acad Sci U S A 94, 14150-14155.
Beebe, D.U., and Turgeon, R. (1992). Localization of Galactinol, Raffinose, and Stachyose Synthesis in Cucurbita-Pepo Leaves. Planta 188, 354-361.
Behnke, H.D. (1998). Proliferating sieve elements present in bud phloem anastomoses connect sieve tubes of axillary bud traces to stelar vascular bundles in the aquatic monocotyledon Potamogeton natans L. (Potamogetonaceae). Protoplasma 201, 17-29.
Blyth, A. (1958). Origin of primary extraxlary stem fibers in dicotyledons. Univ. Calif. Berkeley Publ. Botany 30, 145.
Bostwick, D.E., Skaggs, M.I., and Thompson, G.A. (1994). Organization and Characterization of Cucurbita Phloem Lectin Genes. Plant Mol Biol 26, 887-897.
Bostwick, D.E., Dannenhoffer, J.M., Skaggs, M.I., Lister, R.M., Larkins, B.A., and Thompson, G.A. (1992). Pumpkin phloem lectin genes are specifically expressed in companion cells. Plant Cell 4, 1539-1548.
Botha, C.E.J., and Evert, R.F. (1978). Observations of Preferential Feeding by Aphid, Rhopalosiphum- Maidis on Abaxial Phloem of Cucurbita-Maxima. Protoplasma 96, 75-80.
Brandt, S., Kehr, J., Walz, C., Imlau, A., Willmitzer, L., and Fisahn, J. (1999). A rapid method for detection of plant gene transcripts from single epidermal, mesophyll and companion cells of intact leaves. Plant J. 20, 245-250.
Canny, M.J. (1962). Mechanism of Translocation. Ann. Bot. 26, 603-&. Canny, M.J., and Zimmermann, M.H. (1975). Transport in plants. (Berlin ; New York:
Springer-Verlag). Canny, M.J.P. (1973). Phloem translocation. (Cambridge Eng.: University Press). Chen, S., Petersen, B.L., Olsen, C.E., Schulz, A., and Halkier, B.A. (2001). Long-distance
phloem transport of glucosinolates in Arabidopsis. Plant Physiol 127, 194-201. Chen, Z.H., Walker, R.P., Acheson, R.M., Tecsi, L.I., Wingler, A., Lea, P.J., and Leegood,
R.C. (2000). Are isocitrate lyase and phosphoenolpyruvate carboxykinase involved in gluconeogenesis during senescence of barley leaves and cucumber cotyledons? Plant Cell Physiol 41, 960-967.
Christeller, J.T., Farley, P.C., Ramsay, R.J., Sullivan, P.A., and Laing, W.A. (1998). Purification, characterization and cloning of an aspartic proteinase inhibitor from squash phloem exudate. Eur J Biochem 254, 160-167.
Ciucanu, I., and Kerek, F. (1984). A simple and rapid method for the permethylation of carbohydrates. Carbohydrate Research 131, 209-217.
Clark, A.M., Jacobsen, K.R., Bostwick, D.E., Dannenhoffer, J.M., Skaggs, M.I., and Thompson, G.A. (1997). Molecular characterization of a phloem-specific gene encoding the filament protein, phloem protein 1 (PP1), from Cucurbita maxima. Plant J. 12, 49-61.
Clarke, A.E., and Stone, B.A. (1963). Chemistry and Biochemistry of Beta-1,3-Glucans. Reviews of Pure and Applied Chemistry 13, 134-&.

Reference
-114-
Costello, L.R., Bassham, J.A., and Calvin, M. (1982). Enhancement of Phloem Exudation from Fraxinus-Uhdei Wenz (Evergreen Ash) Using Ethylenediaminetetraacetic Acid. Plant Physiol 69, 77-82.
Crafts, A.S. (1931). Movement of organic materials in plants. Plant Physiol 6, 1-42. Crafts, A.S. (1932). Phloem anatomy, exudation and transport of organic nutrients in cucurbits.
Plant Physiol. 7, 183--225. Crafts, A.S. (1936). Further studies on exudation in cucurbits. Plant Physiol. 11, 63--79. Crafts, A.S., and Crisp, C.E. (1971). Phloem transport in plants. (San Francisco,: W.H.
Freeman). Crafts, A.S., Lorenz, O. A. (1944a). Fruit growth and food transport in cucurbits. Plant Physiol.
19, 131--138. Crafts, A.S., Lorenz, O. A. (1944b). Composition of fruits and phloem exudate of cucurbits.
Plant Physiol. 19, 326--337. Cronshaw, J. (1981). Phloem Structure and Function. Annu. Rev. Plant Physiol. Plant Molec.
Biol. 32, 465-484. Cronshaw, J., and Esau, K. (1968). P protein in the phloem of Cucurbita. II. The P protein of
mature sieve elements. J Cell Biol 38, 292-303. Curtis, O.F. (1929). Studies of solute translocation in plants: experiments indicating that
translocation is dependent on the activity of living cells. Am J Bot 16, 154-168. Dannenhoffer, J.M., Suhr, R.C., and Thompson, G.A. (2001). Phloem-specific expression of
the Pumpkin Fruit Trypsin Inhibitor. Planta 212, 155-162. Dannenhoffer, J.M., Schulz, A., Skaggs, M.I., Bostwick, D.E., and Thompson, G.A. (1997).
Expression of the phloem lectin is developmentally linked to vascular differentiation in cucurbits. Planta 201, 405-414.
Denarie, J., and Cullimore, J. (1993). Lipo-Oligosaccharide Nodulation Factors - a Minireview New Class of Signaling Molecules Mediating Recognition and Morphogenesis. Cell 74, 951-954.
Dieckmann-Schuppert, A., and Schnittler, H.-J. (1997). A simple assay for quantification of protein in tissue sections, cell cultures, and cell homogenates, and of protein immobilized on solid surfaces. Cell and Tissue Research 288, 119 - 126.
Dinant, S., Clark, A.M., Zhu, Y.M., Vilaine, F., Palauqui, J.C., Kusiak, C., and Thompson, G.A. (2003a). Diversity of the superfamily of phloem lectins (Phloem protein 2) in angiosperms. Plant Physiol 131, 114-128.
Dinant, S., Clark, A.M., Zhu, Y., Vilaine, F., Palauqui, J.C., Kusiak, C., and Thompson, G.A. (2003b). Diversity of the superfamily of Phloem lectins (Phloem protein 2) in angiosperms. Plant Physiol 131, 114-128.
Dubois, M., Gilles, K. A., Hamilton, J. K., Rebers, P. A., and Smith, F. (1956). Colorimetric method for determination of sugars and relatedsubstances. Anal. Chem 28:350-356.
Dunford, S. (1998). Translocation in phloem. In Plant Physiology (2nd Ed.), E. Zeiger, ed (Sunderland, Massachusetts: Sinauer Associates Inc. Publishers), pp. 251-287.
Dunford, S.S., and Zimmermann, M.H. (1976). Factors Affecting Phloem Exudation in White Ash (Fraxinus-Americana L). Plant Physiol 57, 77-77.
Dussourd, D.E. (1999). Behavioral sabotage of plant defense: Do vein cuts and trenches reduce insect exposure to exudate? J Insect Behav 12, 501-515.
Engleman, E.M., and Esau, K. (1964). Problem of Callose Deposition in Phloem. Science 144, 562-&.
Esau, K. (1965). Plant anatomy. (New York,: Wiley). Esau, K. (1966). Phloem at Source of Photosynthates - in Minor Veins of Leaves. Science 152,
673-&. Esau, K. (1969). The phloem. (Berlin ; Stuttgart: Gebreuder Borntraeger). Esau, K., Cronshaw, J., and Hoefert, L.L. (1967). Relation of beet yellows virus to the phloem
and to movement in the sieve tube. J Cell Biol 32, 71-87. Eschrich, W. (1963). Der Phloemsaft Von Cucurbita-Ficifolia. Planta 60, 216-224. Eschrich, W. (1965). Physiologie Der Siebrohrencallose. Planta 65, 280-&. Eschrich, W. (1970). Biochemistry and Fine Structure of Phloem in Relation to Transport. Ann
Rev Plant Physio 21, 193-&. Eschrich, W. (1975). Sealing systems in phloem. In Transport in Plants. I. Phloem transport-
Encyclopeida of Plant Physiology 1, Z.M. H. and M.J. A., eds,pp. 101-136. Eschrich, W., and Kating, H. (1964). Aufnahme, Einbau Und Transport Von C-14 in Cucurbita-
Ficifolia .1. Applikation Von Bicarbonat-C-14 an Oberirdische Pflanzenorgane. Planta 60, 523-539.
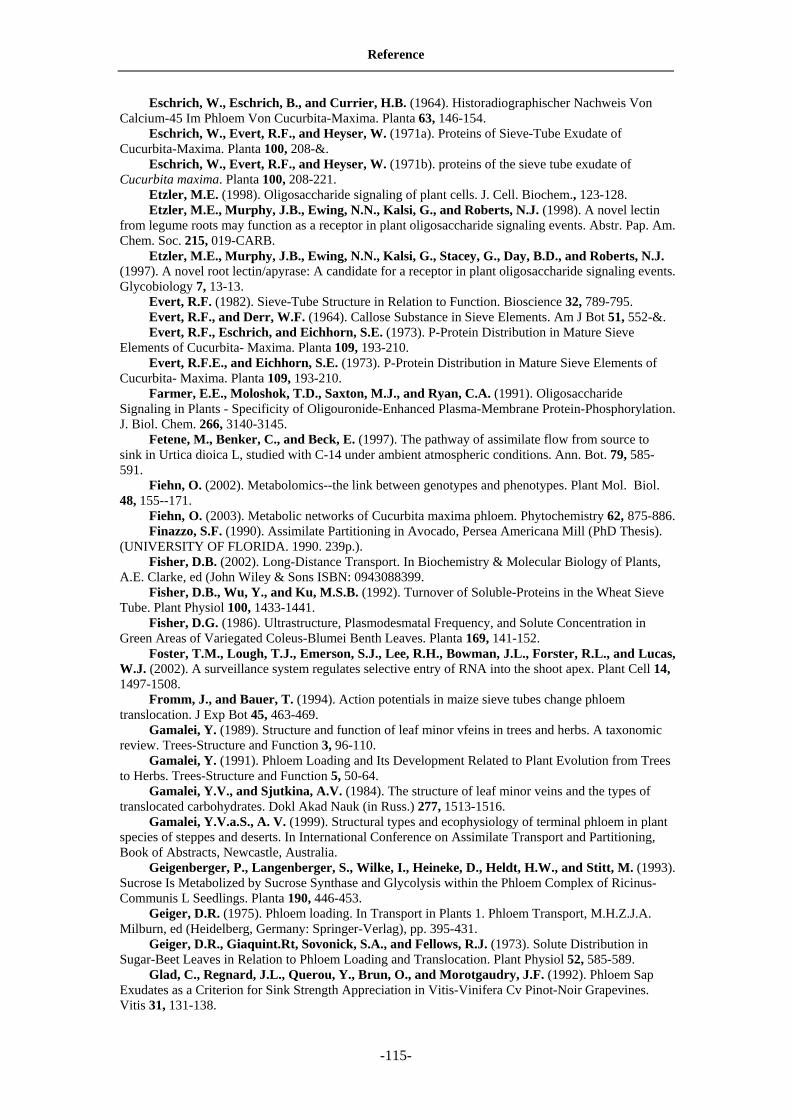
Reference
-115-
Eschrich, W., Eschrich, B., and Currier, H.B. (1964). Historadiographischer Nachweis Von Calcium-45 Im Phloem Von Cucurbita-Maxima. Planta 63, 146-154.
Eschrich, W., Evert, R.F., and Heyser, W. (1971a). Proteins of Sieve-Tube Exudate of Cucurbita-Maxima. Planta 100, 208-&.
Eschrich, W., Evert, R.F., and Heyser, W. (1971b). proteins of the sieve tube exudate of Cucurbita maxima. Planta 100, 208-221.
Etzler, M.E. (1998). Oligosaccharide signaling of plant cells. J. Cell. Biochem., 123-128. Etzler, M.E., Murphy, J.B., Ewing, N.N., Kalsi, G., and Roberts, N.J. (1998). A novel lectin
from legume roots may function as a receptor in plant oligosaccharide signaling events. Abstr. Pap. Am. Chem. Soc. 215, 019-CARB.
Etzler, M.E., Murphy, J.B., Ewing, N.N., Kalsi, G., Stacey, G., Day, B.D., and Roberts, N.J. (1997). A novel root lectin/apyrase: A candidate for a receptor in plant oligosaccharide signaling events. Glycobiology 7, 13-13.
Evert, R.F. (1982). Sieve-Tube Structure in Relation to Function. Bioscience 32, 789-795. Evert, R.F., and Derr, W.F. (1964). Callose Substance in Sieve Elements. Am J Bot 51, 552-&. Evert, R.F., Eschrich, and Eichhorn, S.E. (1973). P-Protein Distribution in Mature Sieve
Elements of Cucurbita- Maxima. Planta 109, 193-210. Evert, R.F.E., and Eichhorn, S.E. (1973). P-Protein Distribution in Mature Sieve Elements of
Cucurbita- Maxima. Planta 109, 193-210. Farmer, E.E., Moloshok, T.D., Saxton, M.J., and Ryan, C.A. (1991). Oligosaccharide
Signaling in Plants - Specificity of Oligouronide-Enhanced Plasma-Membrane Protein-Phosphorylation. J. Biol. Chem. 266, 3140-3145.
Fetene, M., Benker, C., and Beck, E. (1997). The pathway of assimilate flow from source to sink in Urtica dioica L, studied with C-14 under ambient atmospheric conditions. Ann. Bot. 79, 585-591.
Fiehn, O. (2002). Metabolomics--the link between genotypes and phenotypes. Plant Mol. Biol. 48, 155--171.
Fiehn, O. (2003). Metabolic networks of Cucurbita maxima phloem. Phytochemistry 62, 875-886. Finazzo, S.F. (1990). Assimilate Partitioning in Avocado, Persea Americana Mill (PhD Thesis).
(UNIVERSITY OF FLORIDA. 1990. 239p.). Fisher, D.B. (2002). Long-Distance Transport. In Biochemistry & Molecular Biology of Plants,
A.E. Clarke, ed (John Wiley & Sons ISBN: 0943088399. Fisher, D.B., Wu, Y., and Ku, M.S.B. (1992). Turnover of Soluble-Proteins in the Wheat Sieve
Tube. Plant Physiol 100, 1433-1441. Fisher, D.G. (1986). Ultrastructure, Plasmodesmatal Frequency, and Solute Concentration in
Green Areas of Variegated Coleus-Blumei Benth Leaves. Planta 169, 141-152. Foster, T.M., Lough, T.J., Emerson, S.J., Lee, R.H., Bowman, J.L., Forster, R.L., and Lucas,
W.J. (2002). A surveillance system regulates selective entry of RNA into the shoot apex. Plant Cell 14, 1497-1508.
Fromm, J., and Bauer, T. (1994). Action potentials in maize sieve tubes change phloem translocation. J Exp Bot 45, 463-469.
Gamalei, Y. (1989). Structure and function of leaf minor vfeins in trees and herbs. A taxonomic review. Trees-Structure and Function 3, 96-110.
Gamalei, Y. (1991). Phloem Loading and Its Development Related to Plant Evolution from Trees to Herbs. Trees-Structure and Function 5, 50-64.
Gamalei, Y.V., and Sjutkina, A.V. (1984). The structure of leaf minor veins and the types of translocated carbohydrates. Dokl Akad Nauk (in Russ.) 277, 1513-1516.
Gamalei, Y.V.a.S., A. V. (1999). Structural types and ecophysiology of terminal phloem in plant species of steppes and deserts. In International Conference on Assimilate Transport and Partitioning, Book of Abstracts, Newcastle, Australia.
Geigenberger, P., Langenberger, S., Wilke, I., Heineke, D., Heldt, H.W., and Stitt, M. (1993). Sucrose Is Metabolized by Sucrose Synthase and Glycolysis within the Phloem Complex of Ricinus-Communis L Seedlings. Planta 190, 446-453.
Geiger, D.R. (1975). Phloem loading. In Transport in Plants 1. Phloem Transport, M.H.Z.J.A. Milburn, ed (Heidelberg, Germany: Springer-Verlag), pp. 395-431.
Geiger, D.R., Giaquint.Rt, Sovonick, S.A., and Fellows, R.J. (1973). Solute Distribution in Sugar-Beet Leaves in Relation to Phloem Loading and Translocation. Plant Physiol 52, 585-589.
Glad, C., Regnard, J.L., Querou, Y., Brun, O., and Morotgaudry, J.F. (1992). Phloem Sap Exudates as a Criterion for Sink Strength Appreciation in Vitis-Vinifera Cv Pinot-Noir Grapevines. Vitis 31, 131-138.

Reference
-116-
Gobom, J., Schuerenberg, M., Mueller, M., Theiss, D., Lehrach, H., and Nordhoff, E. (2001). alpha-cyano-4-hydroxycinnamic acid affinity sample preparation. A protocol for MALDI-MS peptide analysis in proteomics. Anal Chem 73, 434-438.
Golecki, B., Schulz, A., and Thompson, G.A. (1999). Translocation of structural P proteins in the phloem. Plant Cell 11, 127-140.
Grignon, N., Touraine, B., and Durand, M. (1989). 6(5)Carboxyfluorescein as a Tracer of Phloem Sap Translocation. Am J Bot 76, 871-877.
Grusak, M.A., Beebe, D.U. and Turgeon, R. (1996). Phloem loading. In Photoassimilate Distribution in Plants and Crops: Source-Sink Relationships, E.a.S. Zamski, A.A., ed (Marcel Dekker), pp. 200-227.
Gunning, B.E.S., and Pate, J.S. (1969). "Transfer cells". Plant cells with wall ingrowths, specialized in relation to short distance transport of solutes - their occurrence, structure, and development. Protoplasma 68, 107-133.
H.D.Behnke, and Sjolund, R.D. (1990). Sieve element--comparative structure, induction and development. (Springer-Verlag).
Haebel, S., and Kehr, J. (2001a). Matrix-assisted laser desorption/ionization time of flight mass spectrometry peptide mass fingerprints and post source decay: a tool for the identification and analysis of phloem proteins from Cucurbita maxima Duch. separated by two-dimensional polyacrylamide gel electrophoresis (vol 213, pg 586, 2001). Planta 214, 332-332.
Haebel, S., and Kehr, J. (2001b). Matrix-assisted laser desorption/ionization time of flight mass spectrometry peptide mass fingerprints and post source decay: a tool for the identification and analysis of phloem proteins from Cucurbita maxima Duch. separated by two-dimensional polyacrylamide gel electrophoresis. Planta 213, 586-593.
Haebel, S., and Kehr, J. (2001c). Matrix-assisted laser desorption/ionization time of flight mass spectrometry peptide mass fingerprints and post source decay: a tool for the identification and analysis of phloem proteins from Cacurbita maxima Duch. separated by two-dimensional polyacrylamide gel electrophoresis. Planta 213, 586-593.
Hakomori, S. (1964). A rapid permethylation of glycolipid and polysaccharide catalyzed by methylsulfinyl carbanion in dimethyl sulfoxideJournal of Biochemistry. Journal of Biochemistry 55, 205-208.
Haritatos, E., Keller, F., and Turgeon, R. (1996). Raffinose oligosaccharide concentrations measured in individual cell and tissue types in Cucumis melo L leaves: Implications for phloem loading. Planta 198, 614-622.
Haritatos, E., Ayre, B.G., and Turgeon, R. (2000). Identification of phloem involved in assimilate loading in leaves by the activity of the galactinol synthase promoter. Plant Physiol 123, 929-937.
Hartig, T. (1837). Vergleichende Untersuchungen ueber die Organisation des Stammes der einheimischen Waldbaeume. Jahresber. Fortschr. Forstwiss. Forstl. Naturkd 1, 125-168.
Hartig, T. (1854). Ueber die Querscheidewaende zwischen den einzelnen Gliedern der Siebroehren in Cucurbita pepo.. Bot. Zeit. 12, 51-54.
Hayashi, H., Fukuda, A., Suzui, N., and Fujimaki, S. (2000). Proteins in the sieve element-companion cell complexes: their detection, localization and possible functions. Aust J Plant Physiol 27, 489-496.
Haywood, V., Kragler, F., and Lucas, W.J. (2002). Plasmodesmata: Pathways for protein and ribonucleoprotein signaling. Plant Cell 14, S303-S325.
Heinlein, M. (2002). Plasmodesmata: dynamic regulation and role in macromolecular cell-to-cell signaling. Curr. Opin. Plant Biol. 5, 543-552.
Hendrix, J.E. (1977). Phloem Loading in Squash. Plant Physiol 60, 567-569. Hibberd, J.M., and Quick, W.P. (2002a). Characteristics of C-4 photosynthesis in stems and
petioles of C-3 flowering plants. Nature 415, 451-454. Hibberd, J.M., and Quick, W.P. (2002b). Characteristics of C4 photosynthesis in stems and
petioles of C3 flowering plants. Nature 415, 451-454. Holthaus, U., and Schmitz, K. (1991). Distribution and Immunolocalization of Stachyose
Synthase in Cucumis-Melo L. Planta 185, 479-486. Hurkman, W.J., and Tanaka, C.K. (1986). Solubilization of Plant Membrane-Proteins for
Analysis by Two-Dimensional Gel-Electrophoresis. Plant Physiol 81, 802-806. Jackson , P. (1997). A laboratory guide to glycoconjugate analysis / ed. by Peter Jackson... Joy, K.W. (1964). Translocation in Sugar-Beet .I. Assimilation of 14co2 + Distribution of
Materials from Leaves. J Exp Bot 15, 485-&. Karl, B. (1993). Handbook of derivatives for chromatography. (Chichester [u.a.] : Wiley).

Reference
-117-
Kating, H., and Eschrich, W. (1964). Aufnahme, Einbau Und Transport Von C-14 in Cucurbita-Ficifolia .2. Application Von Bicarbonat-C-14 Uber Die Wurzel. Planta 60, 598-611.
Kehr, J. (2001). High resolution spatial analysis of plant systems. Curr. Opin. Plant Biol. 4, 197-201.
Kehr, J., Haebel, S., Blechschmidt-Schneider, S., Willmitzer, L., Steup, M., and Fisahn, J. (1999a). Analysis of phloem protein patterns from different organs of Cucurbita maxima Duch. by matrix-assisted laser desorption/ionization time of flight mass spectroscopy combined with sodium dodecyl sulfate-polyacrylamide gel electrophoresis. Planta 207, 612-619.
Kehr, J., Haebel, S., Blechschmidt-Schneider, S., Willmitzer, L., Steup, M., and Fisahn, J. (1999b). Analysis of phloem protein patterns from different organs of Cucurbita maxima Duch. by matrix-assisted laser desorption/ionization time of flight mass spectroscopy combined with sodium dodecyl sulfate polyacrylamide gel electrophoresis. Planta 207, 612-619.
Kempers, R., Prior, D.A.M., Vanbel, A.J.E., and Oparka, K.J. (1993). Plasmodesmata between Sieve Element and Companion Cell of Extrafascicular Stem Phloem of Cucurbita-Maxima Permit Passage of 3-Kda Fluorescent-Probes. Plant J. 4, 567-575.
Kennedy, J.S., and Mittler, T.E. (1953). A Method of Obtaining Phloem Sap Via the Mouth-Parts of Aphids. Nature 171, 528-528.
King, R.W., and Zeevaart, J.A. (1974). Enhancement of Phloem Exudation from Cut Petioles by Chelating- Agents. Plant Physiol 53, 96-103.
Knoblauch, M., and van Bel, A.J.E. (1998). Sieve tubes in action. Plant Cell 10, 35-50. Knop, C., Voitsekhovskaja, O., and Lohaus, G. (2001). Sucrose transporters in two members
of the Scrophulariaceae with different types of transport sugar. Planta 213, 80-91. Kollmann, R. (1980). Fine-Structural and Biochemical-Characterization of Phloem Proteins. Can.
J. Bot.-Rev. Can. Bot. 58, 802-806. Kraus, G. (1885). Uber die Zussammensetzung des Siebroehrensaftes der kuerbise und alkalish
reagirende Zellsaefte. Abh. natur. Ges. Halle 16, 376-387. Kulikova, A.L., and Puryaseva, A.P. (2002). Actin in pumpkin phloem exudate. Russ. J. Plant
Physiol. 49, 54-60. Lackney, V.K. (1991). Ultrastructure and Formation of Phloem in Cucurbita-Pepo Callus. J.
Struct. Biol. 106, 135-144. Lackney, V.K., and Sjolund, R.D. (1991). Solute Concentrations of the Phloem and
Parenchyma Cells Present in Squash Callus. Plant Cell Environ. 14, 213-219. Lalonde, S., Tegeder, M., Throne-Holst, M., Frommer, W.B., and Patrick, J.W. (2003).
Phloem loading and unloading of sugars and amino acids. Plant Cell Environ. 26, 37-56. Lauchli, A. (1972). Translocation of Inorganic Solutes. Ann Rev Plant Physio 23, 197-&. Lea, P.J., Chen, Z.H., Leegood, R.C., and Walker, R.P. (2001). Does phosphoenolpyruvate
carboxykinase have a role in both amino acid and carbohydrate metabolism? Amino Acids 20, 225-241. Leconte, I., Auzan, C., Debant, A., Rossi, B., and Clauser, E. (1992). N-Linked
Oligosaccharide Chains of the Insulin Receptor-Beta Subunit Are Essential for Transmembrane Signaling. J. Biol. Chem. 267, 17415-17423.
Leegood, R.C., Walker, R.P., and Tecsi, L.I. (1997). Do cucurbits have a phloem specialised for the transport of amino acids? Plant Physiol 114, 292-292.
Lehmann, J. (1973a). Studies on Phloem Exudate of Cucurbita-Pepo L .2. Enzyme- Activities of Gluconeogenesis and of Synthesis and Degradation of Disaccharides and Polysaccharides. Planta 114, 51-61.
Lehmann, J. (1973b). Studies on Phloem Exudate of Cucurbita-Pepo L .1. Enzyme- Activities of Aerobic and Anaerobic Glycolysis and of Citric- Acid Cycle. Planta 114, 41-50.
Lehmann, J. (1981). Attempt to Determine the Distribution of Enzyme-Activities in Companion Cells and Phloem Parenchyma Cells of Cucurbita-Pepo. Zeitschrift Fur Pflanzenphysiologie 103, 323-333.
Leineweber, K., Schulz, A., and Thompson, G.A. (2000). Dynamic transitions in the translocated phloem filament protein. Aust J Plant Physiol 27, 733-741.
Lerouxel, O., Choo, T.S., Seveno, M., Usadel, B., Faye, L., Lerouge, P., and Pauly, M. (2002). Rapid structural phenotyping of plant cell wall mutants by enzymatic oligosaccharide fingerprinting. Plant Physiol 130, 1754-1763.
Lohaus, G., and Moellers, C. (2000). Phloem transport of amino acids in two Brassica napus L. genotypes and one B. carinata genotype in relation to their seed protein content. Planta 211, 833-840.
Lohaus, G., Burba, M., and Heldt, H.W. (1994). Comparison of the Contents of Sucrose and Amino-Acids in the Leaves, Phloem Sap and Taproots of High and Low Sugar-Producing Hybrids of Sugar-Beet (Beta-Vulgaris L). J Exp Bot 45, 1097-1101.

Reference
-118-
Lohaus, G., Winter, H., Riens, B., and Heldt, H.W. (1995). Further-Studies of the Phloem Loading Process in Leaves of Barley and Spinach - the Comparison of Metabolite Concentrations in the Apoplastic Compartment with Those in the Cytosolic Compartment and in the Sieve Tubes. Bot Acta 108, 270-275.
Lucas, W.J., and Wolf, S. (1999). Connections between virus movement, macromolecular signaling and assimilate allocation. Curr. Opin. Plant Biol. 2, 192-197.
Lucas, W.J., Ding, B., and Vanderschoot, C. (1993). Tansley Review No. 58 Plasmodesmata and the Supracellular Nature of Plants. New Phytol. 125, 435-476.
Madore, M., and Webb, J.A. (1981). Leaf Free Space Analysis and Vein Loading in Cucurbita-Pepo. Can. J. Bot.-Rev. Can. Bot. 59, 2550-2557.
Markus, P. (1999). Development of Analytical Tools to study plant cell wall xyloglucan. (Aachen Technical University: Shaker Verlag 1999).
Marson, T., and Phillis, E. (1936). Further studies on transport in cotton plant. Ann. Bot. 50, 455-499.
McLafferty, F.W.T., F. (1993). Interpretation of Mass Spectra (Fourth ed). (University Science Books).
McNairn, R.B., and Currier, H.B. (1967). Sieve plate callose. A factor in blockage of axial phloem transport. In Naturwissenschaften, pp. 591.
Metcalfe, C.R. (1960). Anatomy of the monocotyledons. (Oxford,: Clarendon Press). Metcalfe, C.R., and Chalk, L. (1979). Anatomy of the dicotyledons. (Oxford: Clarendon Press). Milburn, J.A. (1970). Phloem Exudation from Castor Bean - Induction by Massage. Planta 95,
272-&. Milburn, J.A. (1971). Analysis of Response in Phloem Exudation on Application of Massage to
Ricinus. Planta 100, 143-&. Mitchell, D.E., and Madore, M.A. (1992). Patterns of Assimilate Production and Translocation
in Muskmelon (Cucumis-Melo L) .2. Low-Temperature Effects. Plant Physiol 99, 966-971. Mitchell, D.E., Gadus, M.V., and Madore, M.A. (1992). Patterns of Assimilate Production and
Translocation in Muskmelon Cucumis-Melo L. I. Diurnal Patterns. Plant Physiology, 959-965. Muench, E. (1930). Die Stoffbewegungen in der Pflanze. (Gustav Fischer, Jena, Germany). Murray, C., and Christeller, J.T. (1995). Purification of a trypsin inhibitor (PFTI) from
pumpkin fruit phloem exudate and isolation of putative trypsin and chymotrypsin inhibitor cDNA clones. Biol Chem Hoppe Seyler 376, 281-287.
Naegeli, C. (1861). Ueber die Siebroehren von Cucurbita. Sitzber. koenigl. bayer. Akad. Wiss. Muechen 1.
Oparka, K.J., and Cruz, S.S. (2000). The great escape: Phloem transport and unloading of macromolecules. Annu. Rev. Plant Physiol. Plant Molec. Biol. 51, 323-347.
Oparka, K.J., and Roberts, A.G. (2001). Plasmodesmata. A not so open-and-shut case. Plant Physiol 125, 123-126.
Oparka, K.J., Van Bel, A. J. E. (1992). Path-ways of phloem loading: a plea for a uniform terminology. In Carbon Partitioning Within and Between Organisms, J.F. Farrar, Gordon, A. J., Pollock, C. J., ed ( Oxford: BIOS), pp. 249-254.
Palevitz, B.A., and Hepler, P.K. (1975). Is P-Protein Actin-Like - Not Yet. Planta 125, 261-271. Patrick, J.W. (1997). Phloem unloading: Sieve element unloading and post-sieve element
transport. Annu. Rev. Plant Physiol. Plant Molec. Biol. 48, 191-222. Patterns, D., Gadus, M.V., and Madore, M.A. (1992). Patterns of Assimilate Production and
Translocation in Muskmelon (Cucumis-Melo L) .1. Diurnal Patterns. Plant Physiol 99, 959-965. Perkins, D.N., Pappin, D.J., Creasy, D.M., and Cottrell, J.S. (1999). Probability-based protein
identification by searching sequence databases using mass spectrometry data. Electrophoresis 20, 3551-3567.
Pierce, M., Buckhaults, P., Chen, L., and Fregien, N. (1997). Regulation of N-acetylglucosaminyltransferase V and Asn-linked oligosaccharide beta(1,6) branching by a growth factor signaling pathway and effects on cell adhesion and metastatic potential. Glycoconjugate J. 14, 623-630.
Pristupa, N.A. (1983). Distribution of Ketosugars among Cells of Conducting Bundles of the Cucurbita-Pepo Leaf. Soviet Plant Physiology 30, 372-378.
Read, S.M., and Northcote, D.H. (1983a). Subunit Structure and Interactions of the Phloem Proteins of Cucurbita-Maxima (Pumpkin). Eur. J. Biochem. 134, 561-569.
Read, S.M., and Northcote, D.H. (1983b). Chemical and Immunological Similarities between the Phloem Proteins of 3 Genera of the Cucurbitaceae. Planta 158, 119-127.

Reference
-119-
Read, S.M., and Northcote, D.H. (1983c). Subunit structure and interactions of the phloem proteins of Cucurbita maxima (pumpkin). Eur J Biochem 134, 561-569.
Richardson, P.T., Baker, D.A., and Ho, L.C. (1982). The Chemical-Composition of Cucurbit Vascular Exudates. J Exp Bot 33, 1239-1247.
Richardson, P.T., Baker, D.A., and Ho, L.C. (1984). Assimilate Transport in Cucurbits. J Exp Bot 35, 1575-1581.
Riesmeier, J.W., Willmitzer, L., and Frommer, W.B. (1992). Isolation and Characterization of a Sucrose Carrier Cdna from Spinach by Functional Expression in Yeast. Embo J 11, 4705-4713.
Riesmeier, J.W., Willmitzer, L., and Frommer, W.B. (1994). Evidence for an Essential Role of the Sucrose Transporter in Phloem Loading and Assimilate Partitioning. Embo J 13, 1-7.
Rigby, N.M., MacDougall, A.J., Needs, P.W., and Selvendran, R.R. (1994). Phloem translocation of a reduced oligogalacturonide in <i>Ricinus communis</i> L. Planta 193, 536-541.
Robards, A.W., and Lucas, W.J. (1990). Plasmodesmata. Annu. Rev. Plant Physiol. Plant Molec. Biol. 41, 369-419.
Ruiz-Medrano, R., Xoconostle-Cazares, B., and Lucas, W.J. (1999). Phloem long-distance transport of CmNACP mRNA: implications for supracellular regulation in plants. Development 126, 4405-4419.
Ruiz-Medrano, R., Xoconostle-Cazares, B., and Lucas, W.J. (2001). The phloem as a conduit for inter-organ communication. Curr. Opin. Plant Biol. 4, 202-209.
Ryan, C.A. (1987). Oligosaccharide Signaling in Plants. Annu. Rev. Cell Biol. 3, 295-317. Sabnis, D.D., and Sabnis, H.M. (1995). Phloem proteins: structure, biochemistry and function.
In The cambial derivatives, M. Iqbal, ed (Berlin: G. Borntraeger), pp. 271-287. Schaffer, A.A., Pharr, D.M., and Madore, M.A. (1996). Cucurbits. In Photoassimilate
distribution in plants and crops : source--sink relationships, A.A. Schaffer, ed (New York: Marcel Dekker), pp. 729--753.
Schmitz, K. (1970). Autoradiographic Identification of Tritiated Water-Soluble Material in Sieve Tubes of Cucurbita and Cucumis. Planta 91, 96-&.
Schmitz, K., Cuypers, B., and Moll, M. (1987). Pathway of assimilate transfer between mesophyll cells and minor veins in leaves of Cucumis melo L. Planta 171, 19-29.
Schobert, C., Komor, E., Baker, L., Lucas, W.J., Hayashi, H., and Chino, M. (1997). Analysis of phloem sap proteins from Ricinus communis, Cucurbita maxima, Robinia pseudoacacia, Yucca filamentosa and Oryza sativa. Plant Physiol 114, 26-26.
Schobert, C., Baker, L., Szederkenyi, J., Grossmann, P., Komor, E., Hayashi, H., Chino, M., and Lucas, W.J. (1998). Identification of immunologically related proteins in sieve- tube exudate collected from monocotyledonous and dicotyledonous plants. Planta 206, 245-252.
Schulz, A. (1998). The Phloem: Structure related to function. Progress in Botany 59, 429-475. Shalitin, D., and Wolf, S. (2000). Cucumber mosaic virus infection affects sugar transport in
melon plants. Plant Physiol 123, 597-604. Shibuya, N., and Minami, E. (2001). Oligosaccharide signalling for defence responses in plant.
Physiological and Molecular Plant Pathology 59, 223-233. Smith, L.M., Sabnis, D.D., and Johnson, R.P.C. (1987). Immunocytochemical Localization of
Phloem Lectin from Cucurbita-Maxima Using Peroxidase and Colloidal-Gold Labels. Planta 170, 461-470.
Sonnewald, U., and Willmitzer, L. (1992). Molecular Approaches to Sink-Source Interactions. Plant Physiol 99, 1267-1270.
Spanner, D.C. (1958). The Translocation of Sugar in Sieve Tubes. J Exp Bot 9, 332-342. Taiz, L., and Zeiger, E. (1998). Plant physiology. (Sunderland, Mass.: Sinauer Associates). Tammes, P.M.L., Vonk, C.R., and Vandie, J. (1967). Studies on Phloem Exudation from
Yucca Flaccida Haw .6. Formation of Exudate-Sucrose from Supplied Hexoses in Excised Inflorescence Parts. Acta Bot Neerl 16, 244-&.
Thaine, R. (1961). Transcellular Strands and Particle Movement in Mature Sieve Tubes. Nature 192, 772-&.
Thaine, R. (1964). Protoplasmic-Streaming Theory of Phloem Transport. J Exp Bot 15, 470-&. Thaine, R. (1969). Movement of Sugars through Plants by Cytoplasmic Pumping. Nature 222,
873-&. Thaine, R., and Demaria, M.E. (1973). Transcellular Strands of Cytoplasm in Sieve Tubes of
Squash. Nature 245, 161-163. Thaine, R., Probine, M.C., and Dyer, P.Y. (1967). Existence of Transcellular Strands in Mature
Sieve Elements. J Exp Bot 18, 110-&.

Reference
-120-
Thompson, G.A. (1999). P-Protein Trafficking Through Plasmodesmata. In Plasmodesmata: Structure, Function, Role in Cell Communication, W.J.P.V.K. Aart Jan Eeuwe Van Bel, Art J. Van Bel, ed (Springer Verlag), pp. 295-314.
Thompson, G.A., and Schulz, A. (1999). Macromolecular trafficking in the phloem. Trends Plant Sci. 4, 354-360.
Tiedemann, R. (1989). Graft Union Development and Symplastic Phloem Contact in the Heterograft Cucumis-Sativus on Cucurbita-Ficifolia. J Plant Physiol 134, 427-440.
Tolstikov, V.V., and Fiehn, O. (2002). Analysis of highly polar compounds of plant origin: Combination of hydrophilic interaction chromatography and electrospray ion trap mass spectrometry. Anal Biochem 301, 298-307.
Turgeon, R. (1991). Symplastic phloem loading and the source-sink transition in leaves: a model. In Recent advances in phloem transport and assimilate compartmentation, S.D. J-L Bonnemain, WJ Lucas and J Dainty, ed (Ouest: Nantes, France), pp. 18-22.
Turgeon, R. (1996). Phloem loading and plasmodesmata. Trends Plant Sci. 1, 418-423. Turgeon, R. (2000). Plasmodesmata and solute exchange in the phloem. Aust J Plant Physiol 27,
521-529. Turgeon, R., and Webb, J.A. (1975). Leaf Development and Phloem Transport in Cucurbita-
Pepo - Carbon Economy. Planta 123, 53-62. Turgeon, R., and Webb, J.A. (1976). Leaf Development and Phloem Transport in Cucurbita-
Pepo - Maturation of Minor Veins. Planta 129, 265-269. Turgeon, R., and Hepler, P.K. (1989). Symplastic Continuity between Mesophyll and
Companion Cells in Minor Veins of Mature Cucurbita-Pepo L Leaves. Planta 179, 24-31. Turgeon, R., and Beebe, D.U. (1991). The Evidence for Symplastic Phloem Loading. Plant
Physiol 96, 349-354. Turgeon, R., Webb, J.A., and Evert, R.F. (1975). Ultrastructure of Minor Veins in Cucurbita-
Pepo Leaves. Protoplasma 83, 217-232. Turgeon, R., Beebe, D.U., and Gowan, E. (1993). The Intermediary Cell - Minor-Vein
Anatomy and Raffinose Oligosaccharide Synthesis in the Scrophulariaceae. Planta 191, 446-456. Turkina, M.V., Pavlinova, O.A., and Kursanov, A.L. (1999). Advances in the study of the
nature of phloem transport: The activity of conducting elements. Russ. J. Plant Physiol. 46, 709-720. van Bel, A.J.E. (1993). The transport phloem: specifies of its functioning. Progress in Botany 54,
134-150. van Bel, A.J.E., and Knoblauch, M. (2000). Sieve element and companion cell: the story of the
comatose patient and the hyperactive nurse. Aust J Plant Physiol 27, 477-487. van den Honert, T.H. (1932). On the mechanism of transport of organic materials in plants. Proc.
Sect. Sci. K. ned. Acad. Wet. 35, 1104-1111. Vanbel, A.J.E. (1990). Xylem-Phloem Exchange Via the Rays - the Undervalued Route of
Transport. J Exp Bot 41, 631-644. Vanbel, A.J.E. (1993). Strategies of Phloem Loading. Annu. Rev. Plant Physiol. Plant Molec.
Biol. 44, 253-281. vanBel, A.J.E. (1996). Interaction between sieve element and companion cell and the
consequences for photoassimilate distribution. Two structural hardware frames with associated physiological software packages in dicotyledons. J Exp Bot 47, 1129-1140.
Vanbel, A.J.E. (2003). The phloem, a miracle of ingenuity. Plant, Cell & Environment 26, 125-149.
Vanbel, A.J.E., Ammerlaan, A., and Vandijk, A.A. (1994). A 3-Step Screening-Procedure to Identify the Mode of Phloem Loading in Intact Leaves - Evidence for Symplasmic and Apoplasmic Phloem Loading Associated with the Type of Companion Cell. Planta 192, 31-39.
Vanbel, A.J.E., Gamalei, Y.V., Ammerlaan, A., and Bik, L.P.M. (1992). Dissimilar Phloem Loading in Leaves with Symplasmic or Apoplasmic Minor-Vein Configurations. Planta 186, 518-525.
Verma, D.P.S., and Hong, Z.L. (2001). Plant callose synthase complexes. Plant Mol Biol 47, 693-701.
Voitsekhovskaja, O.V. (2001). On the role of sugar compartmentation and stachyose synthesis in symplastic phloem loading. In Mathematisch-Naturwissenschaftlichen Fakultaen (Goetingen: Georg-August-Universitat zu Goetingen).
Volk, G.M., Turgeon, R., and Beebe, D.U. (1996). Secondary plasmodesmata formation in the minor-vein phloem of Cucumis melo L and Cucurbita pepo L. Planta 199, 425-432.
Volk, G.M., Haritatos, E.E., and Turgeon, R. (2003). Galactinol synthase gene expression in melon. J. Am. Soc. Hortic. Sci. 128, 8-15.
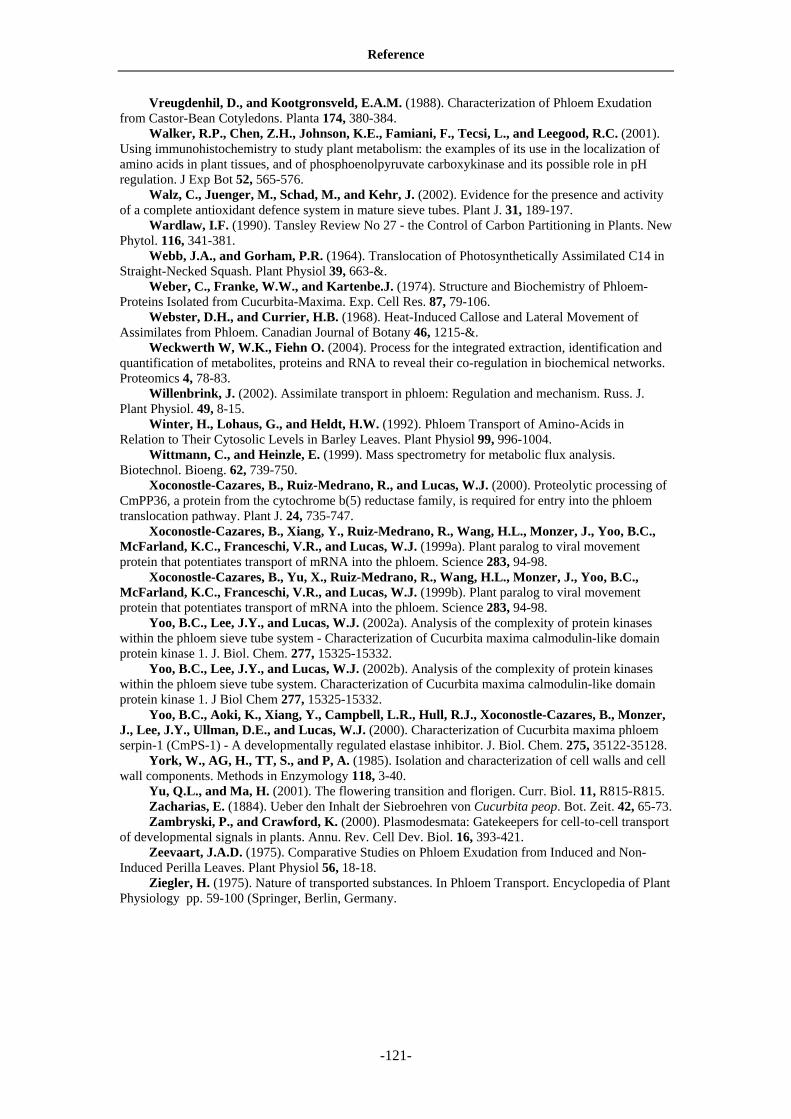
Reference
-121-
Vreugdenhil, D., and Kootgronsveld, E.A.M. (1988). Characterization of Phloem Exudation from Castor-Bean Cotyledons. Planta 174, 380-384.
Walker, R.P., Chen, Z.H., Johnson, K.E., Famiani, F., Tecsi, L., and Leegood, R.C. (2001). Using immunohistochemistry to study plant metabolism: the examples of its use in the localization of amino acids in plant tissues, and of phosphoenolpyruvate carboxykinase and its possible role in pH regulation. J Exp Bot 52, 565-576.
Walz, C., Juenger, M., Schad, M., and Kehr, J. (2002). Evidence for the presence and activity of a complete antioxidant defence system in mature sieve tubes. Plant J. 31, 189-197.
Wardlaw, I.F. (1990). Tansley Review No 27 - the Control of Carbon Partitioning in Plants. New Phytol. 116, 341-381.
Webb, J.A., and Gorham, P.R. (1964). Translocation of Photosynthetically Assimilated C14 in Straight-Necked Squash. Plant Physiol 39, 663-&.
Weber, C., Franke, W.W., and Kartenbe.J. (1974). Structure and Biochemistry of Phloem-Proteins Isolated from Cucurbita-Maxima. Exp. Cell Res. 87, 79-106.
Webster, D.H., and Currier, H.B. (1968). Heat-Induced Callose and Lateral Movement of Assimilates from Phloem. Canadian Journal of Botany 46, 1215-&.
Weckwerth W, W.K., Fiehn O. (2004). Process for the integrated extraction, identification and quantification of metabolites, proteins and RNA to reveal their co-regulation in biochemical networks. Proteomics 4, 78-83.
Willenbrink, J. (2002). Assimilate transport in phloem: Regulation and mechanism. Russ. J. Plant Physiol. 49, 8-15.
Winter, H., Lohaus, G., and Heldt, H.W. (1992). Phloem Transport of Amino-Acids in Relation to Their Cytosolic Levels in Barley Leaves. Plant Physiol 99, 996-1004.
Wittmann, C., and Heinzle, E. (1999). Mass spectrometry for metabolic flux analysis. Biotechnol. Bioeng. 62, 739-750.
Xoconostle-Cazares, B., Ruiz-Medrano, R., and Lucas, W.J. (2000). Proteolytic processing of CmPP36, a protein from the cytochrome b(5) reductase family, is required for entry into the phloem translocation pathway. Plant J. 24, 735-747.
Xoconostle-Cazares, B., Xiang, Y., Ruiz-Medrano, R., Wang, H.L., Monzer, J., Yoo, B.C., McFarland, K.C., Franceschi, V.R., and Lucas, W.J. (1999a). Plant paralog to viral movement protein that potentiates transport of mRNA into the phloem. Science 283, 94-98.
Xoconostle-Cazares, B., Yu, X., Ruiz-Medrano, R., Wang, H.L., Monzer, J., Yoo, B.C., McFarland, K.C., Franceschi, V.R., and Lucas, W.J. (1999b). Plant paralog to viral movement protein that potentiates transport of mRNA into the phloem. Science 283, 94-98.
Yoo, B.C., Lee, J.Y., and Lucas, W.J. (2002a). Analysis of the complexity of protein kinases within the phloem sieve tube system - Characterization of Cucurbita maxima calmodulin-like domain protein kinase 1. J. Biol. Chem. 277, 15325-15332.
Yoo, B.C., Lee, J.Y., and Lucas, W.J. (2002b). Analysis of the complexity of protein kinases within the phloem sieve tube system. Characterization of Cucurbita maxima calmodulin-like domain protein kinase 1. J Biol Chem 277, 15325-15332.
Yoo, B.C., Aoki, K., Xiang, Y., Campbell, L.R., Hull, R.J., Xoconostle-Cazares, B., Monzer, J., Lee, J.Y., Ullman, D.E., and Lucas, W.J. (2000). Characterization of Cucurbita maxima phloem serpin-1 (CmPS-1) - A developmentally regulated elastase inhibitor. J. Biol. Chem. 275, 35122-35128.
York, W., AG, H., TT, S., and P, A. (1985). Isolation and characterization of cell walls and cell wall components. Methods in Enzymology 118, 3-40.
Yu, Q.L., and Ma, H. (2001). The flowering transition and florigen. Curr. Biol. 11, R815-R815. Zacharias, E. (1884). Ueber den Inhalt der Siebroehren von Cucurbita peop. Bot. Zeit. 42, 65-73. Zambryski, P., and Crawford, K. (2000). Plasmodesmata: Gatekeepers for cell-to-cell transport
of developmental signals in plants. Annu. Rev. Cell Dev. Biol. 16, 393-421. Zeevaart, J.A.D. (1975). Comparative Studies on Phloem Exudation from Induced and Non-
Induced Perilla Leaves. Plant Physiol 56, 18-18. Ziegler, H. (1975). Nature of transported substances. In Phloem Transport. Encyclopedia of Plant
Physiology pp. 59-100 (Springer, Berlin, Germany.

Acknowledgement The work with this dissertation has been extensive and trying, but in the first place exciting, instructive, and fun. Without help, support, and encouragement from several persons, I would never have been able to finish this work. I would like to first thank my supervisor Dr. Oliver Fiehn and my advisor Prof. Dr. Lothar Willmitzer, for their recognizing me and providing me such a good opportunity for scientific research training. Their constant encouragement especially in the starting first few months and in the most frustrating period of PhD project research is invaluable. Their inspiring and encouraging way to guide me to a deeper understanding of my thesis research together with the invaluable discussions and comments, finally leads to the experimental success. I will also give a special thanks to Dr. Vladimir Tolstikov, Dr. Julia Kehr and Dr. Wolfram Weckwerth and Dr. Markus Pauly for a fruitful collaboration in project research, to Mohammad for his excellent interpretation of plant anatomy and to Prof. Dr. AJE Van Bel for reminding us to pay attention to anatomical work and his detailed commentary to the thesis. Thanks to all members of Fiehn’s group for help and friendship during the past three years. I am very grateful to gardener team, especially Dr. Karen Koehl and Madam Britta Hausmann for spending a lot of time and energy to provide timely sowing and taking care of huge and large number of cucurbits plants. Special thanks to Madam Rita Quade for her patient and amazingly fast to obtain papers and books for me, especially for a large amount of older literature. Special thanks to microscopic management team for their allowing me doing several months’ work for manipulating such large plants under microscope and their excellent assistance in microscopy. Thanks also to all other members in Max Planck Institute for Molecular Plant Biology in Golm, Potsdam for their help during the three-year’s period of thesis research. Special thanks to Dr. Colin GN Turnbull from Imperial College London for his proof-reading to my manual scripts of this dissertation and his comprehension to my late submission of my dissertation. I am in debt to my family members: for the support from my wife Mrs Hongbo Zhu and my son Hou Zhang, and support from my brothers in China and Germany. At last, thanks are given to Max Planck Society for their generous fellowship supporting my PhD research in the past three years.

List of Publications Papers 1. Baichen Zhang, Vladimir Tolstikov, Burkhard Costisella, and Oliver Fiehn Dissection of of
phloem transport in symplastic loader, Cucurbita maxima by metabolomic analysis Submitted to Plant Cell
2. Baichen Zhang Julia Kehr Oliver Fiehn Central phloem of Cucurbita maxima contains completely different P-proteins from that of extrafascicular phloem exudates (Paper in preparation)
Meeting Abstracts: 1. Oliver Fiehn. Baichen Zhang, Wolfram Weckwerth , Lothar Wilmitzer, Vladimir Tolstikov: Towards plant metabolomics using mass spectrometry ( meeting abstract, Society of Experimental Botany annual meeting, Caterbury, April 2001) Journal of Experimental Botany, S33, 2001 2. Baichen Zhang, Vladimir Tolstikov, Oliver Fiehn: Metabolomic analysis of 13C labeled plant extract by GC/MS and LC/MS, meeting abstract of ASMS meeting in Chicago, May, 2001 3. Vladimir Tolstikov, Baichen Zhang, Wolfram Weckwerth, Oliver Fiehn: Structural investigation of O-glycans derived from plant material by the use of the HILIC HPLC separation and ESI-Mass spectrometry, meeting abstract of ASMS meeting in Chicago, May, 2001 4. Vladimir Tolstikov; Burkhard Costisella; Wolfram Weckwerth; Baichen Zhang; Oliver Fiehn Accurate mass QTOF and MS^n Ion trap measurements require additional NMR data for plant metabolites de-novo identification. Meeting abstract of 50th ASMS annual meeting in Orlando, FL, USA 5. Baichen Zhang, Vladimir Tolstikov, Oliver Fiehn Metabolomic analysis of microdissected stem vascular tissues of the symplastic loader Cucurbita maxima Meeting abstract of 2nd international meeting of plant metabolome in Golm, Potsdam, Germany April 28, 2003.

Curriculum Vitae
Name : Baichen Zhang Date of Birth : 22/09/1971 City of Birth : Yi’an City, Heilongjiang Province (China PR) Marital State : Married Nationality : Chinese Education state : 1978-1983 Primary school in Yuejin Primary School, Yi’an city . 1983-1986 Middle School in Xiangyang Middle School, Yi’an city 1986-1989 Senior School in Yi’an Shiyan Senior School, Yi’an city 1989-1994 B.Sc.Education (biology) in Department of Biology, Qiqihar University 1994-1995 Teacher in Department of Biology, Heilongjiang Nongken
Normal College, China 1997-1999 MSc in genetics, Department of Biology, Harbin Normal
University, China 2000-2003 PhD study in Max Planck Institute for Molecular Plant
Physiology, Germany Employment: 1994-1995: Teacher in Department of Biology, Heilongjiang Nongken Normal College, China 1995-2000 Assistant Professor in Department of Biolog, Harbin Normal University, Acheng Division, China Since 2000 Lecturer in Department of Biolog, Harbin Normal University, Acheng Division, China 2004-2006 Research associate, Department of Biology, Imperial College London, England